 Yebao Wang
 Peipei Du2
 Xiaoqing Wu
- 1School of Ocean, Yantai University, Yantai, China
- 2Institute of Agricultural and Rural Modernization, Weifang University, Weifang, China
- 3School of Resources and Environmental Engineering, Ludong University, Yantai, China
- 4Yantai Institute of Coastal Zone Research, Chinese Academy of Sciences, Yantai, China
- 5Key Laboratory of Coastal Environmental Processes and Ecological Remediation, Chinese Academy of Sciences, Yantai, China
The Chinese Bohai Sea is a semi-enclosed, highly vulnerable continental sea that is exposed to the risk of oil spills due to offshore oil and gas activities. In this study, a geographic information system (GIS)-based “tanks–pipelines–platforms–ships–channels” (TPPSC) comprehensive framework, including a storage tank indicator, a pipeline indicator, a platform indicator, a ship indicator, and a channel indicator, was built to analyze the comprehensive marine oil spill risk in the Bohai Sea and to show the spatial differentiation of risk using GIS and the entropy weight method (EWM). The proposed method will overcome the shortcomings of the traditional statistical and scenario analysis theories. The results show that extremely high-risk areas are mostly located in Liaodong Bay and Bohai Bay; high-risk areas are located in the Bohai Strait and on the north side of the Shandong Peninsula; moderate-risk areas are mainly located on both sides of the Bohai Strait; low-risk areas are located on the south side of Liaodong Bay, in the middle of the Bohai Strait, and in Laizhou Bay; and extremely low-risk areas are located on the west side of Bohai Bay, the south side of Laizhou Bay, and the middle of the Bohai Sea. This framework demonstrated the applicability of the new risk assessment model, and the evaluation tests provided useful information for future research on marine oil spill risk management.
1 Introduction
Marine environmental risks can arise from a variety of natural and anthropogenic sources. One typical marine environmental risk source is oil spill catastrophes, which occur frequently around the world. Today, oil spills are among the most serious challenges in marine environmental protection (Cirer-Costa, 2015; Girard and Fisher, 2018), and have also caused numerous deep sociocultural and psychosocial impacts (Gill et al., 2016). According to statistics, globally, almost 1.9 billion metric tons of crude oil were transported via channels in 2020 (Statista, 2021). These massive shipments indirectly reflect the increased risk of oil spills. Therefore, effective oil spill pollution prevention and control have become important measures used to minimize the impact of oil spill disasters. It is therefore important to assess oil spill risk when making decisions for resource allocation, contingency planning, and response (Lee et al., 2016).
The first step in risk assessment is risk identification. Hence, positioning where the risk resources are located is critical. Man-made sources for spillage can be sorted into the following four categories: oil storage tanks on land (Ikwan et al., 2020), oil pipelines (Arzaghi et al., 2018), oil production platforms (Valentine et al., 2014), and ships at sea (Amir-Heidari et al., 2019). The above sources have caused the overwhelming majority of oil spills.
However, few studies have focused on the comprehensive oil spill risk assessment model, let alone spatialized assessment results. How to analyze the risk resources comprehensively is a problem that needs to be solved, and determining the risk spatial differentiation is also important to scientific decision making.
In this study, the geographical distributions of risk sources, including storage tanks, pipelines, platforms, ships, and channels, were obtained firstly. By considering the wide application of GIS technology in risk assessment studies (Bing et al., 2019; Akinwumiju et al., 2020; Ali et al., 2020), the potential risk for each single spill source was estimated for the Bohai Sea area, and then the comprehensive oil spill risk was estimated using the entropy weight method (EWM) to determine their weight. Through the investigation of oil spill risk sources and comprehensive GIS analysis, this study aimed to establish a suitable and comprehensive risk assessment framework to evaluate the oil spill risk by combining resources from tanks, pipelines, platforms, ships, and channels (TPPSC), and then analyzing the spatial outcomes. The proposed framework will provide a quantitative and visual assessment of oil spill risk, helping to understand risk spatial differentiation and providing support for the government to reduce the risk of regional oil spills.
2 Data and methods
2.1 Study area and data
The study area in this paper is located in northern China and covers the entire Chinese Bohai Sea area (117.5–122.5°E and 37–41°N). The sea area is covered densely by storage tanks, oil pipelines, oil platforms, and ship routes. The Bohai Sea’s oil and gas production accounts for more than half of China’s offshore oil production, and oil spills have therefore become increasingly frequent in this area. Previous oil spill disasters in the Bohai Sea include the Dalian oil pipeline explosion on July 16, 2010, hereinafter referred to as the 7.16 accident (Chen et al., 2012), and the Penglai 19-3 oil spill in 2011 (Wang et al., 2017). Due to these factors, the Bohai Sea is a high-risk and sensitive area for oil spill stress (Wang et al., 2018), and the disaster prevention and mitigation of oil spills is a severe issue that requires special attention. Because the Bohai Sea is surrounded by different provincial administrative divisions, it was split into seven response zones by the Maritime Safety Administration (MSA) in order to respond to spill accidents as quickly as possible. For the ease of description, these regions are numbered 1 through 7 in this study (Figure 1).
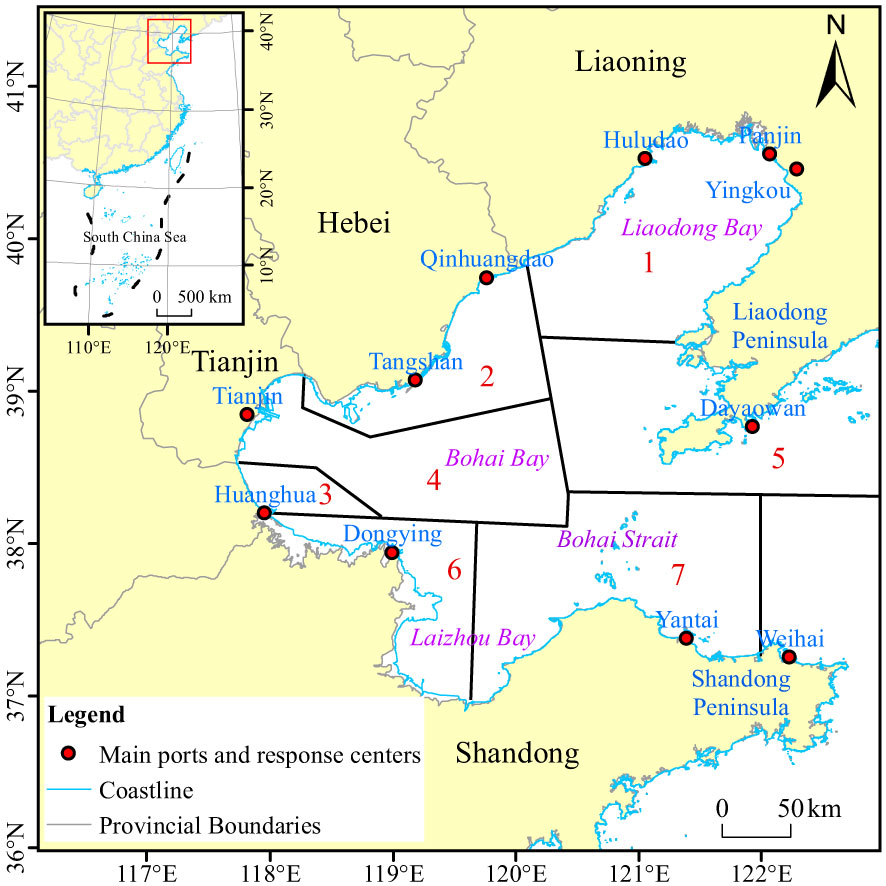
Figure 1 Location of the Chinese Bohai Sea.
Indicators that contribute to the comprehensive oil spill risk were determined by combining empirical evidence and previous references. These indicators consisted of oil storage tanks, oil pipelines, oil platforms, ships, and channels. Details are shown in Table 1 and described below.
Table 1 Overview of data obtained.
1. Numerous ports are located in the Bohai Rim area, including Dayaowan Port, Yingkou Port, Panjin Port, Huludao Port, Qinhuangdao Port, Tangshan Port, Tianjin Port, Huanghua Port, Dongying Port, Yantai Port, and Weihai Port (Figure 2A). A large number of oil storage tanks are distributed in these 11 port areas, constituting an oil spill risk. To obtain the spatial distribution of tanks in a batch, GaoFen-2 remote sensing images were analyzed using the DeepLab v3+ deep learning semantic segmentation network. ResNet50 was used as the backbone for DeepLab v3+ to extract features from the image to obtain the oil storage tank distribution. Finally, the oil tank distribution for each port was obtained.
2. Rice University’s Baker Institute for Public Policy has issued an interactive China Energy Map. Pipelines surrounding the Bohai Sea area were obtained from the issued map, which included refined product pipelines and crude product pipelines (Figure 2B).
3. There are many oil fields in the Bohai Sea (Figure 2C). To identify the locations of platforms in the investigation area, images from the Landsat5/TM and Landsat7/ETM with a resolution of 30 m were used (Liu et al., 2015).
4. Although ships are constantly in motion, the average annual ship density (represented by tonnage per unit area) can be used to determine the oil spill risk factor of ships. The 2018 AIS data (Figure 2D) were purchased from Shipxy and used to characterize vessel activities and the corresponding oil spill risk.
5. China’s MSA participates in the International Convention for the Safety of Life at Sea on behalf of China, fulfills the responsibilities and obligations stipulated by the International Maritime Organization, and provides technical support for ship navigation and the service guarantee function of the shipping economy. The MSA is the official publishing and distribution organization for China’s maritime books and materials, and it is qualified to publish various navigational books and materials along the coast of China. The channel data used in this paper were obtained and vectorized from electronic navigational charts (ENC) published by the MSA (Figure 2E).
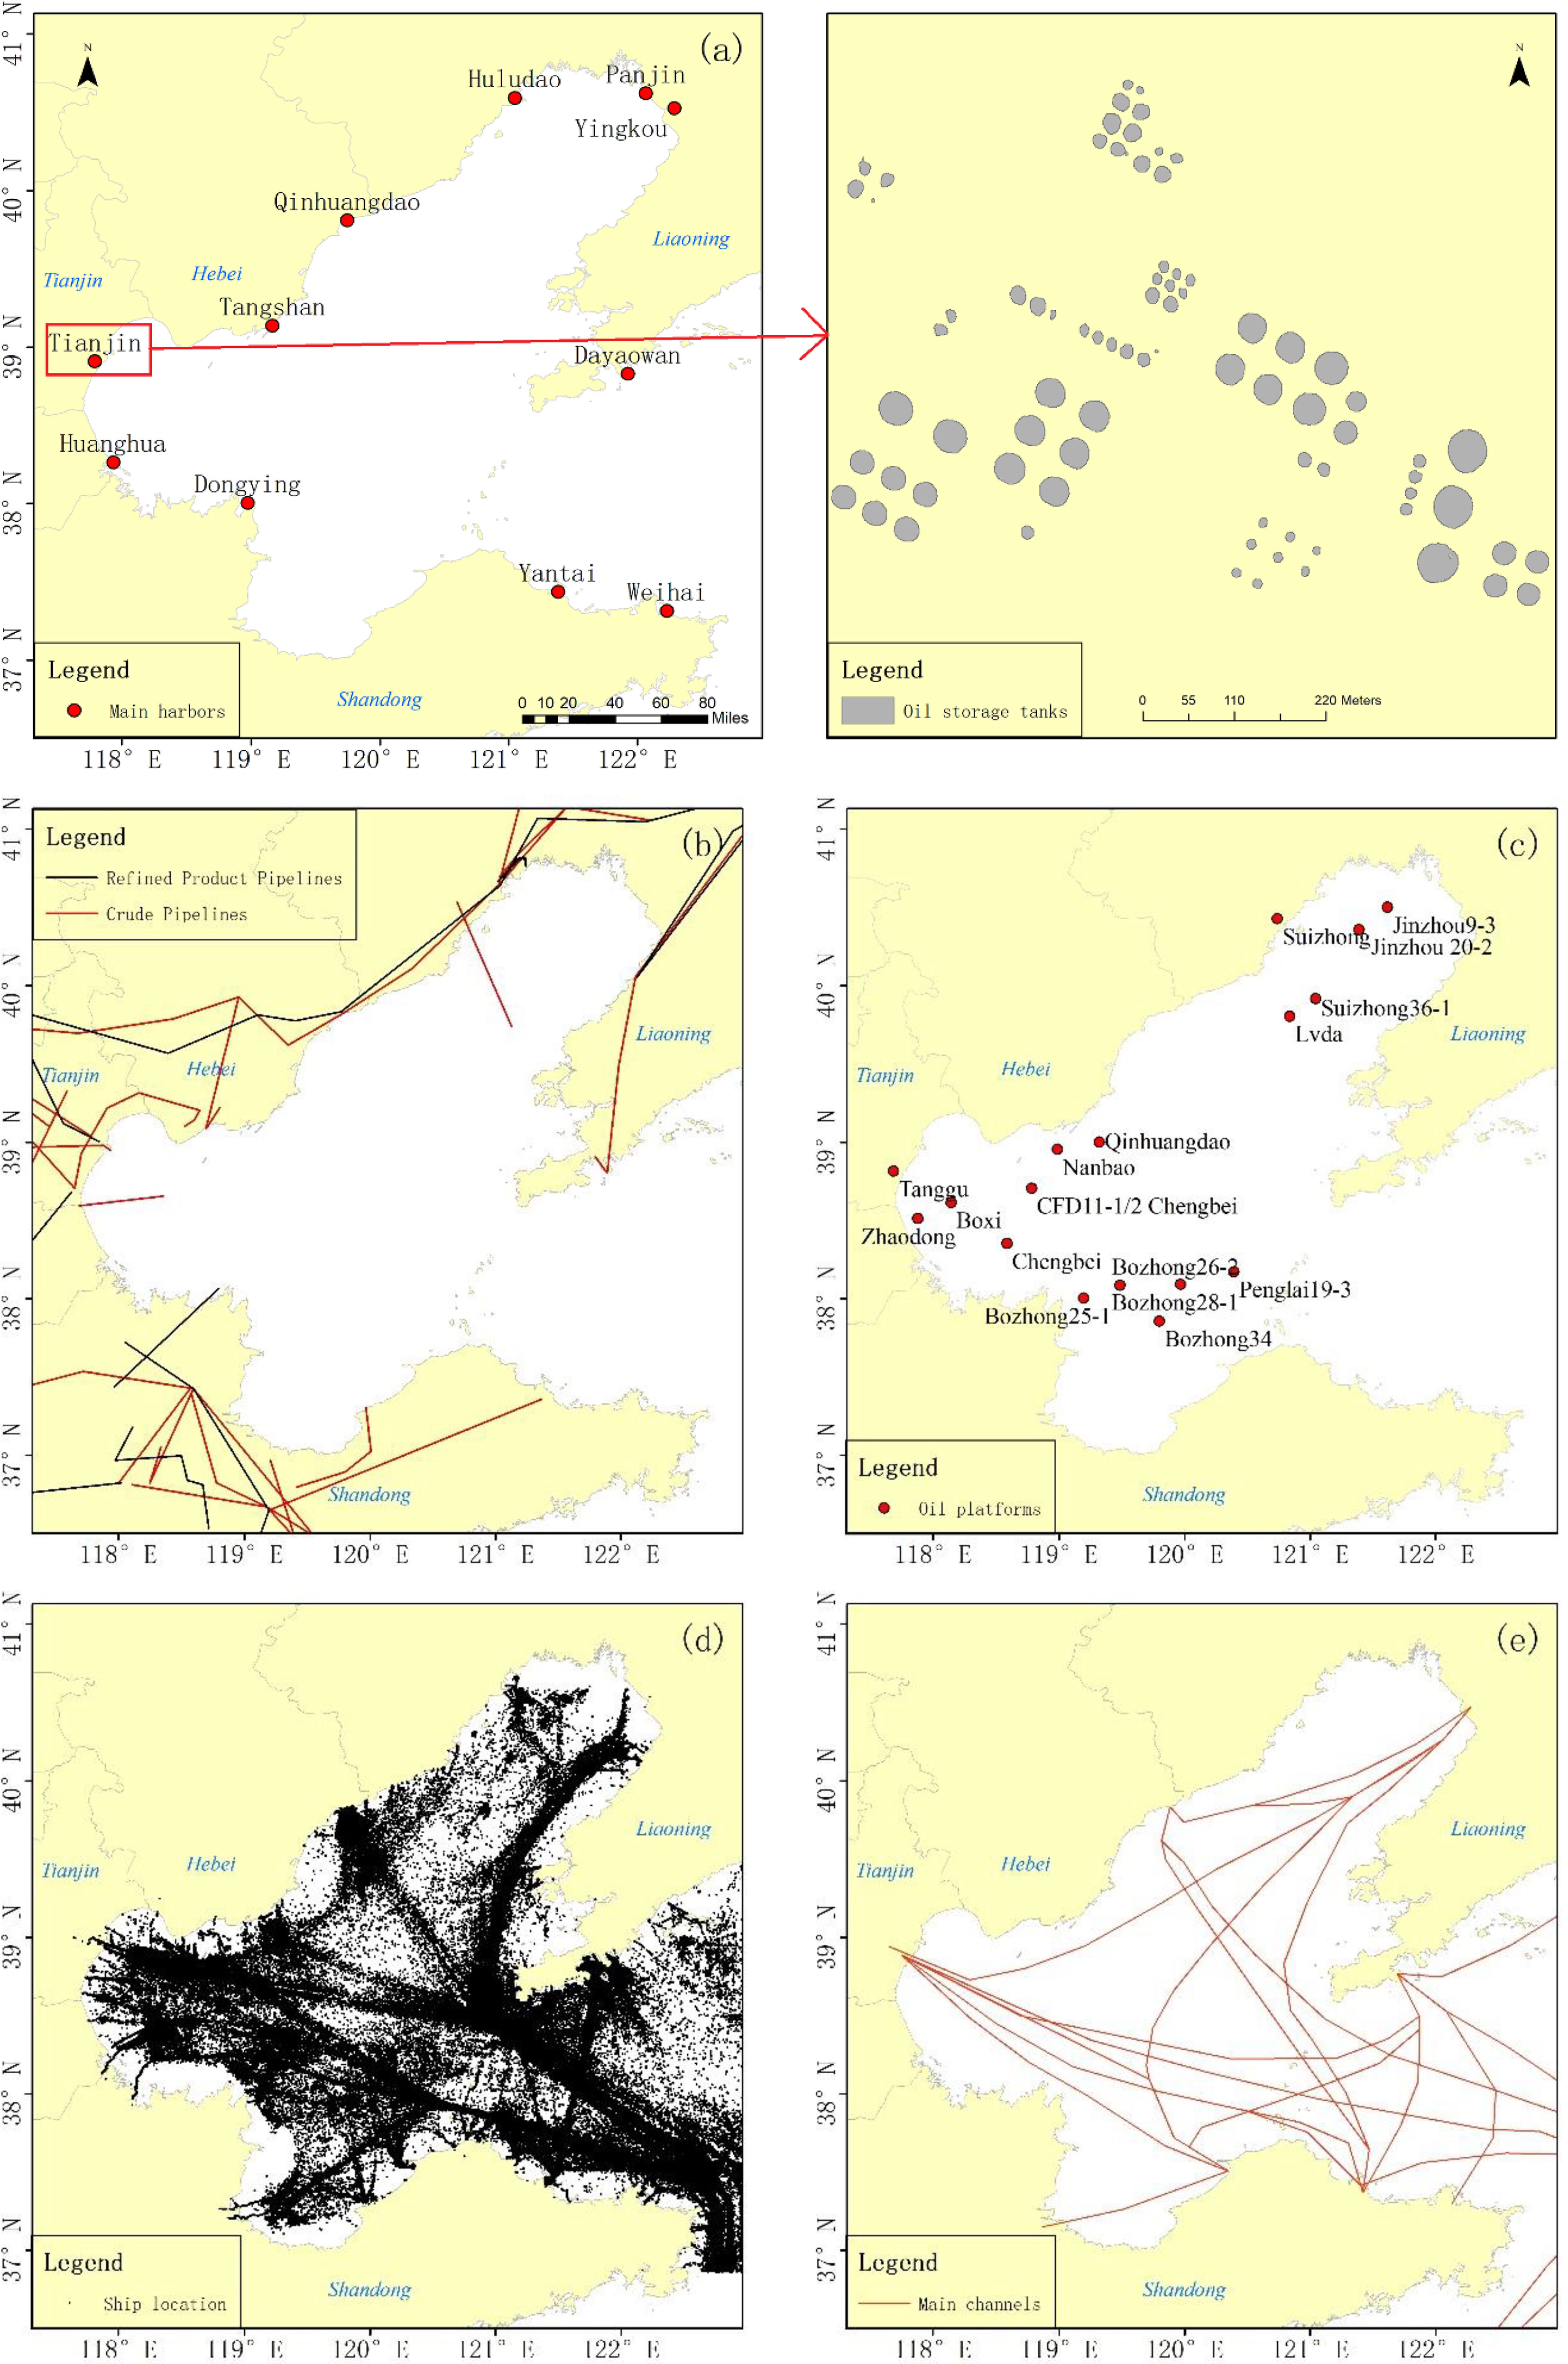
Figure 2 (A) Locations of oil storage tanks. The zoomed-in image shows a schematic of the distribution of the large number of oil tanks in Tianjin Port. (B) Locations of oil pipelines. (C) Locations of oil fields. (D) Locations of ships (January 2018). (E) Spatial distribution of ship channels.
2.2 Data processing
GIS-based spatial analysis is one of the most important methods for assessing the risk of oil spills, and it integrates the latest technologies from many disciplines to provide powerful tools for spatial analysis. Spilled oil can strongly influence the surrounding environmental resources. To analyze the influence scope of various risk sources, buffer analysis, an important spatial analysis function of a GIS, is a useful tool. In buffer analysis, buffer distance is a critical factor that must be considered. However, the determination of the buffer distance of an oil spill risk is difficult, and there is no unified standard and method. This study referred to the influence scope of the Bohai Sea’s historical oil spill accidents and regarded them as the buffer distance, which was an acceptable method. Buffer analysis was therefore performed for storage tanks, oil pipelines, platforms, and channels with reference to historical records. The analysis of each risk source is discussed below.
1. Buffer distance for pipelines and storage tanks: on July 16, 2010, a crude oil pipeline belonging to Dalian PetroChina International Warehousing & Transportation Co., Ltd. exploded and deflagrated, causing a large amount of crude oil to leak into the sea (the 7.16 accident). The accident site is located at the crude oil tank farm of Dayaowan Port, Dalian City, Liaoning Province. The accident was caused by the failure to follow proper procedures when the 300,000-ton VLCC tanker “COSMIC JEWEL” unloaded crude oil into the corresponding tank. On July 20, the combination of the southeast wind and sudden heavy rainfall caused oil pollution to reach the Jinshitan coast 35 km away. This famous beach had to be closed. On July 22, a nearly 400-acre shellfish farm in Jinshitan was affected, with some shellfish dying due to oil pollution. Since then, oil pollution has been observed in some sea areas far from the original incident. Considering the intervention of the oil spill emergency response force at this time, this study took a distance of 35 km from the oil spill site as the area affected by oil spills from oil pipelines and oil tanks.
2. Buffer distance for platforms: on June 4, 2011, floating spilled oil had been observed on the Bohai Sea surface near platform B of the Penglai 19-3 oilfield, which is the second largest oilfield in China. The spill was caused by a fault rupture due to the failure to follow proper procedures by ConocoPhillips China Inc. (COPC). As of June 17, the spread of the oil spill had reached 840 km2, and based on the statement released by COPC, there were approximately 723 barrels of oil and 2,620 barrels of crude oil spilled into the Sea. Taking the oil spill point as the center, according to its diffusion range, its diffusion radius was roughly 29 km. Hence, this study took 29 km from the oil spill site as the threshold of the area affected by oil spills from platforms.
3. Buffer distance for channels: oil spills in channels usually originate from large ships. An accident that occurred in Chinese waters in recent years was used as a reference. On January 6, 2018, the tanker “Sanchi” and the bulk carrier “CF Crystal” collided approximately 160 nautical miles east of the Shanghai City, causing the “Sanchi” to catch fire. After burning for many days, the “Sanchi” ship deflagrated and sank. On the sixth day after the shipwreck occurred, remote sensing satellites detected many oil pollution belts on the sea surface. The largest oil-stained belt ever observed (15 km × 12 km) was discovered 12 km northwest of the shipwreck site. Because oil films move constantly under the action of ocean currents and the wind, 27 km was regarded as a rough buffer threshold for channel oil spills.
4. Data processing for ships: the difference between ship data and channel data is that there are usually many working ships (such as fishing vessels) that are not on the channel at any given time. When ships spill oil, the spillage amounts are often related to the amount of fuel they carry. Therefore, tonnage is an important indicator to determine the scope of an oil spill from a given ship. The processing of ship data is different from the processing of data for tanks, pipelines, platforms, and channels. The data were sampled daily from January 1 to January 3, and the data for the first minute of each hour of each day were selected for analysis. Data with abnormal deadweight were eliminated. Finally, the deadweight data were imported into the GIS according to the latitude and longitude information of ships. The research area was divided into 1 km × 1 km grids to analyze the oil spill risk based on ships’ tonnage. Previous studies have demonstrated that using this method can produce reliable results, and more detailed information can be found in these studies (Liu et al., 2021a; Liu et al., 2021b).
2.3 Spatial normalization of risk value
As shown in Table 1, the oil storage tanks, oil pipelines, oil platforms, ships, and channels used in this study had different dimensions and orders of magnitude. To facilitate a comprehensive analysis of these parameters and ensure accurate comparison between them, after buffer analysis of the five risk resources, we normalized these parameters. The specific method by which this was done is as follows.
Rectilinear mesh was generated to cover the whole domain of the Bohai Sea. Each grid cell in the mesh was 1 km × 1 km (obtained by resampling). Every cell was then normalized for the individual indicator by allocating each cell a score from 0 to 100 according to the value corresponding with the grid cell. The corresponding values were the true values of the indicator obtained from various sources, as shown in Table 1. Formula (1) can be used for the normalization of each grid cell:
where K is the normalized value, x is the true value of the cell after resampling to 1 km × 1 km, i represents the identifier of the cell, Min is the minimum value in terms of a specific index after resampling, and Max is the maximum value in terms of a specific index after resampling.
2.4 Weight determination
The weight of each indicator determines its contribution to the comprehensive oil spill risk. The EWM is a common weighting method that uses information entropy to calculate the entropy weight of each index according to its degree of variation. Compared with methods such as the analytic hierarchy process (AHP), EWM’s biggest advantage lies in the objectivity of the empowerment process and its quantitative measurement of uncertainty. In this study, we used EWM to objectively determine the weights of indicators of various oil spill sources that contain a large amount of information. Its steps are as follows (Lu et al., 2017; Bao et al., 2020):
1. Assuming that there are m sub-zones need to be evaluated in terms of n indicators, the initial decision matrix is constructed as follows:
where m is the number of sub-zones (m = 7, in this study); n is the number of indicators (n = 5, in this study); and aij represents the average value of the normalized cells for the entire sub-zone. For a specific indicator, aij can be calculated as follows:
where S is the total number of cells in a sub-zone, and Ks is the normalized value of the sth cell.
2. Data standardization for the decision matrix; the higher value, the higher the risk:
3. Calculating the standardized value of the jth indicator in the ith zone:
4. Calculating the information entropy of each indicator:
5. Based on the calculated information entropy, the weighting factors of each indicator can be calculated as follows:
2.5 Comprehensive risk assessment model
This study created a comprehensive oil spill risk indicator based on the gridding score system established above and in accordance with various index grading criteria and corresponding weights. The formula is as follows:
where RISK represents the comprehensive oil spill risk, and the value ranges from 0 to 100; wj represents the weight of the index concerned; and K represents the normalized value of the index concerned.
The advantage of the multi-source risk assessment approach is that it can effectively understand each single risk source. On this basis, it can judge the integrated risk through comprehensive analysis and propose a clear numerical standard for the quantification of the risk level. In addition, the advantages of the EWM over a simple linear summation method are as follows: (1) It can linearly compensate for the effects of each evaluation index and ensure the fairness of the comprehensive evaluation index. (2) In this method, the weight coefficient has a significant impact on the evaluation results; that is, the index value with a larger weight has a greater effect on the comprehensive index. (3) This method is simple to calculate, has strong operability, and is easy to popularize and use. Figure 3 shows the technical roadmap used in this study.
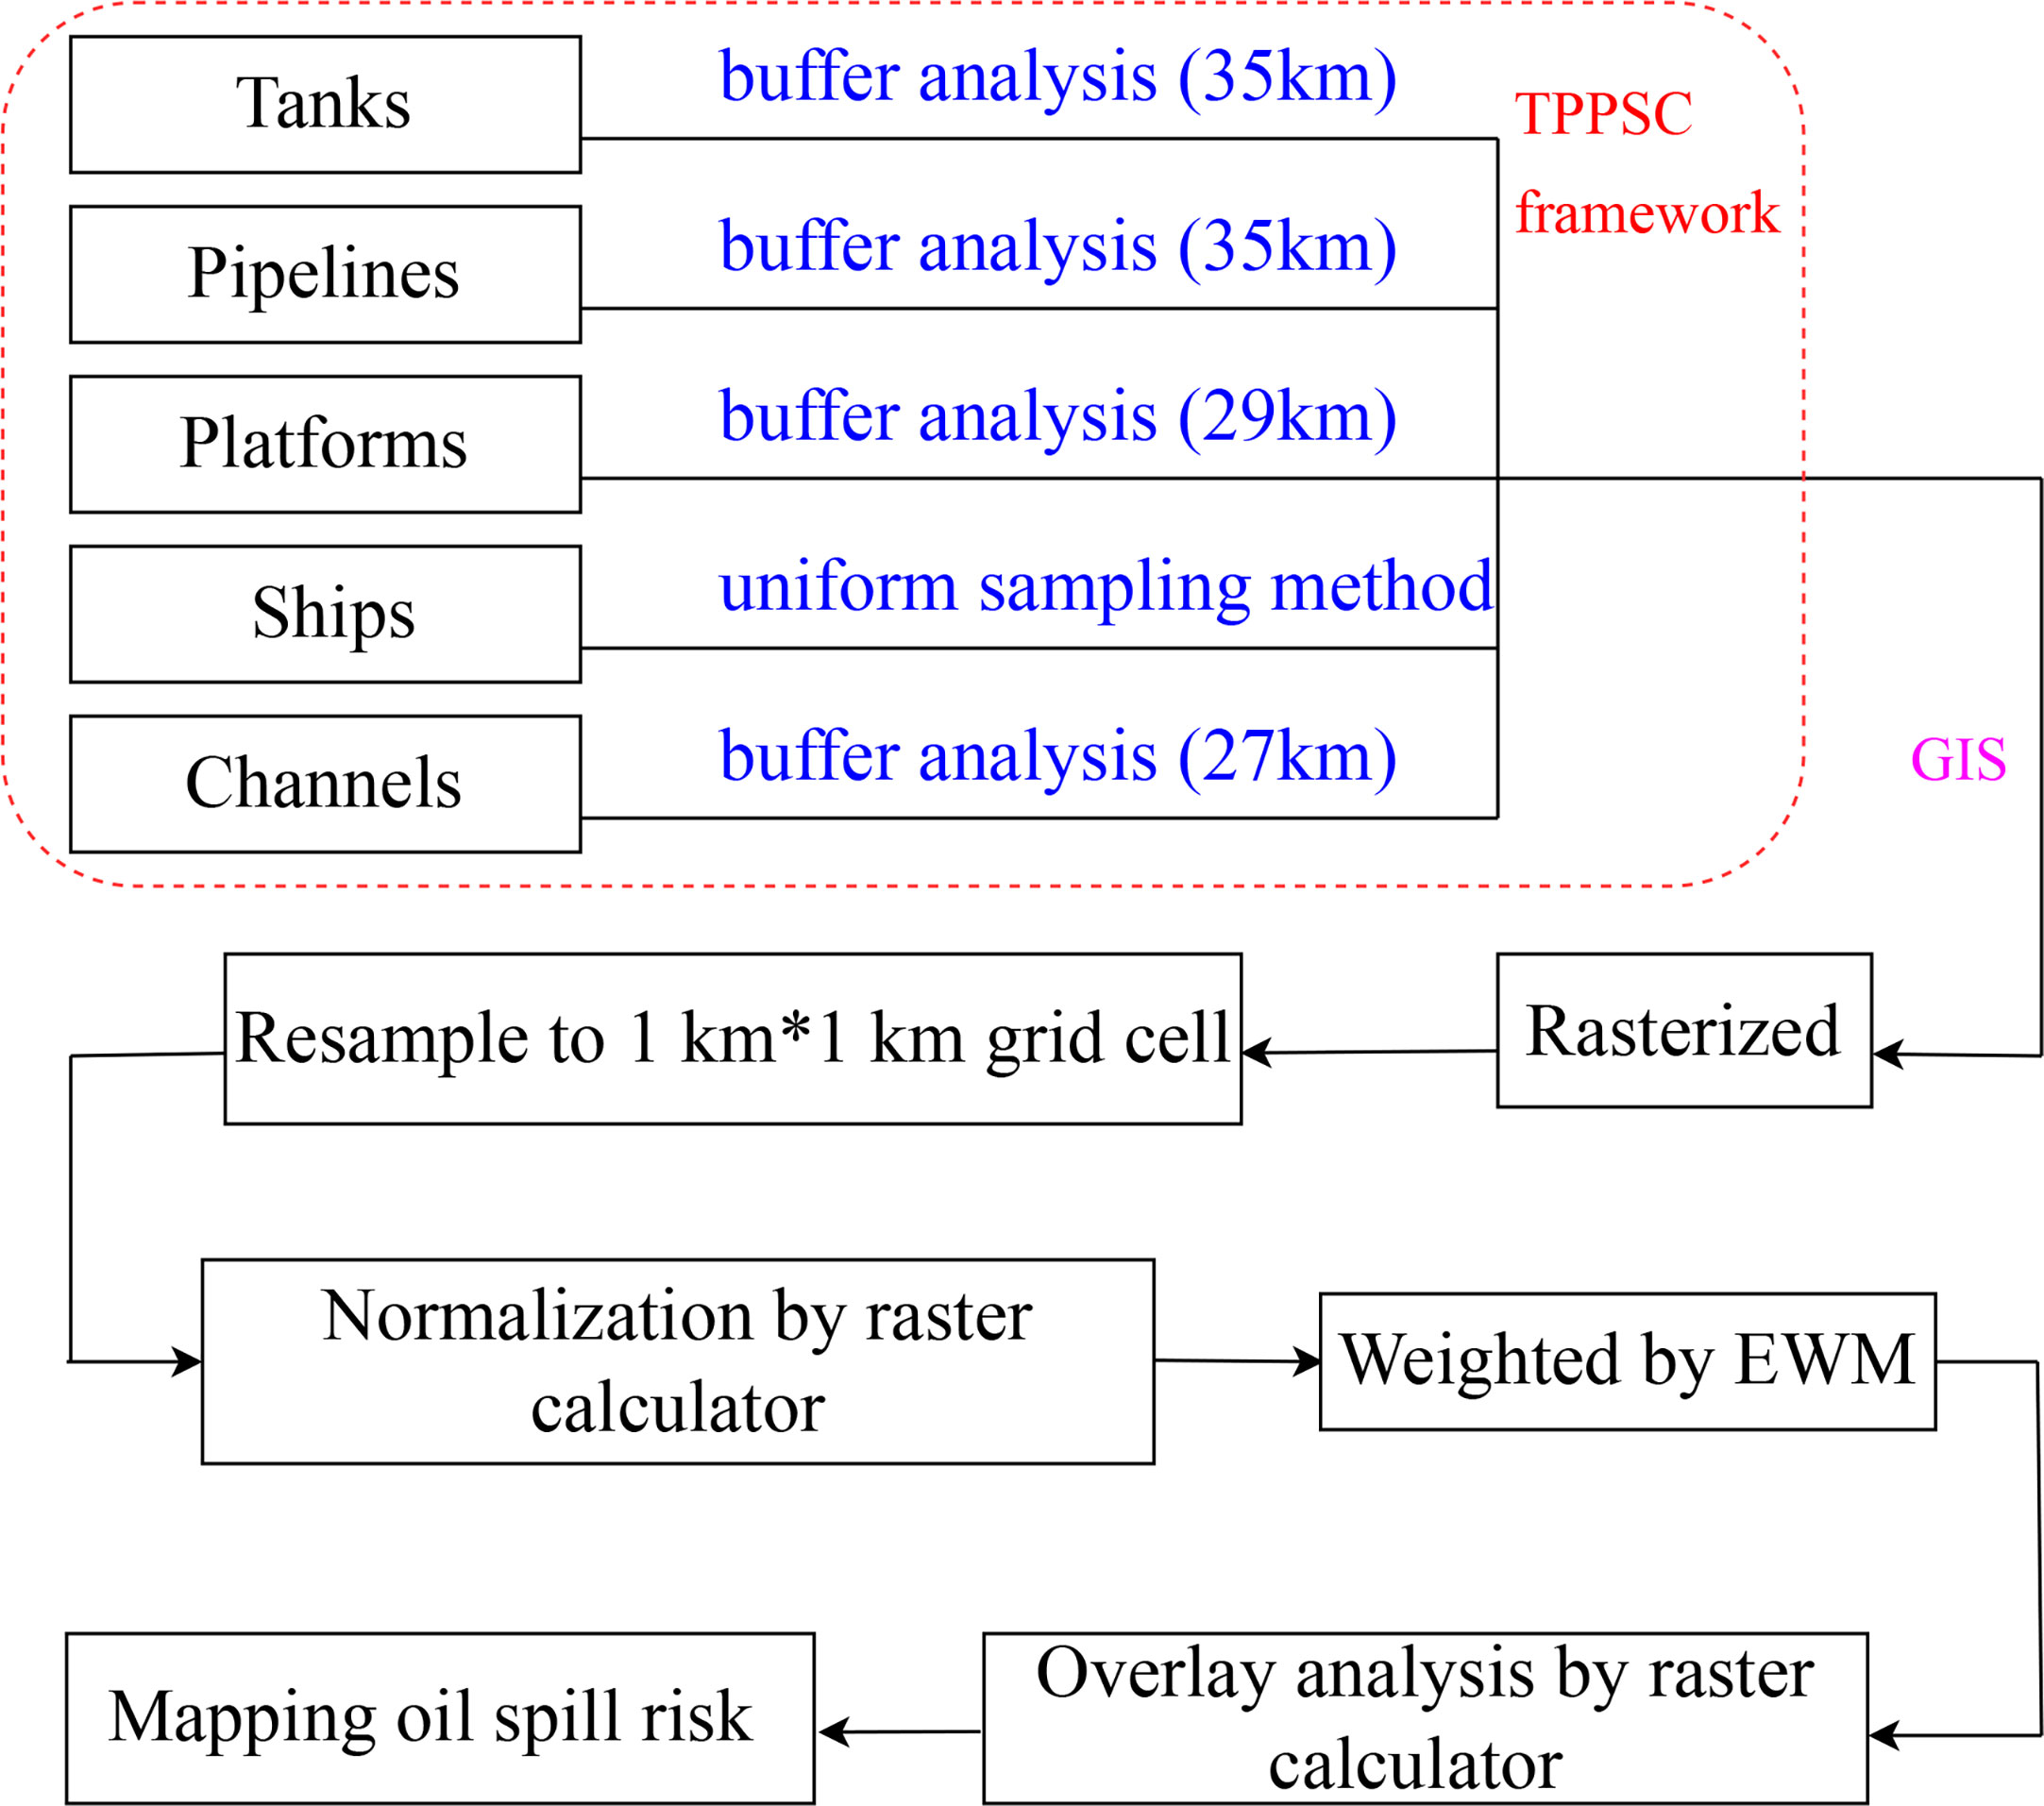
Figure 3 Technical roadmap.
3 Results
3.1 Risk caused by single-factor
Based on the GIS spatial analysis method, the spatially discrete data for each oil spill risk source were converted into spatially continuous data to analyze their spatial patterns. The five different indicators were further gridded and standardized for the entire study area (Figure 4). A GIS visualization method was used to analyze their spatial characteristics, in which blue colors indicated areas of low risk, and red colors indicated areas of high risk. The five indicators are described in what follows. (1) The potential oil spill risk due to oil storage tanks originates from nearby ports and is caused by the fact that oil storage tanks are mainly located in these sites. The port associated with the greatest risk is Dayaowan Port, followed by Tianjin Port and Dongying Port. (2) For the potential oil spill risks caused by oil pipelines, most of the high-risk areas are located near the shore. Among these areas, both sides of Liaodong Bay exhibit the highest risk levels, and northern part and western part of Bohai Bay also exhibit high-risk levels. (3) For the potential oil spill risk caused by oil production platforms, all high-risk areas are located near platforms because the spill risk is related to the distance from the oil wells. Because the Jinzhou 9-3 and Jinzhou 20-2 oil fields (shown in Figure 2C) are located in Liaodong Bay, the risk levels surrounding these two platforms are high. There are dense oil fields in eastern Bohai Bay and northern Laizhou Bay, and the risk of oil spills in these areas is high. As there are no oil fields around Laizhou Bay, the risk of oil spills in this area is low. (4) For the potential oil spill risk caused by ships, Laizhou Bay is less affected, while ships around the Bohai Strait, central Bohai Sea, and Bohai Bay are more densely distributed and more exposed to risk. (5) For the potential oil spill risk caused by the channel, the characteristics are similar to those of the potential oil spill risk caused by ships. The difference is that the risks posed by ships change dynamically in time and space, while the risks posed by channels are relatively static. Compared with the risks caused by ships, the risks caused by channels are more obvious in Bohai Bay, as shown in Figure 4.

Figure 4 Normalized value in terms of each indicator for the Bohai Sea. (A) Risk spatial distribution according to storage tanks. (B) Risk spatial distribution according to oil pipelines. (C) Risk spatial distribution according to oil platforms. (D) Risk spatial distribution according to ships. (E) Risk spatial distribution according to ship channels.
3.2 Weight results
With the use of the EWM, the index weight is determined according to formulas (2), (3), (4), (5), and (6), as presented in Table 2. From the weight results, it can be found that storage tanks contribute the most to the oil spill risk, followed by pipelines. Oil production platforms, ships, and channels are similar.

Table 2 Weight allocation results.
3.3 Comprehensive assessment results
The comprehensive risk result was obtained through the weighted calculation, and the comprehensive spatial distribution pattern of oil spill risk was visualized based on the GIS (Figure 5A). The comprehensive risk spatial distribution pattern revealed that the high-risk areas were all centered on risk sources. Generally, among Laizhou Bay, Liaodong Bay, and Bohai Bay, the oil spill risk in Laizhou Bay is relatively low because it is located far from large ports, oil wells, and dense shipping routes.
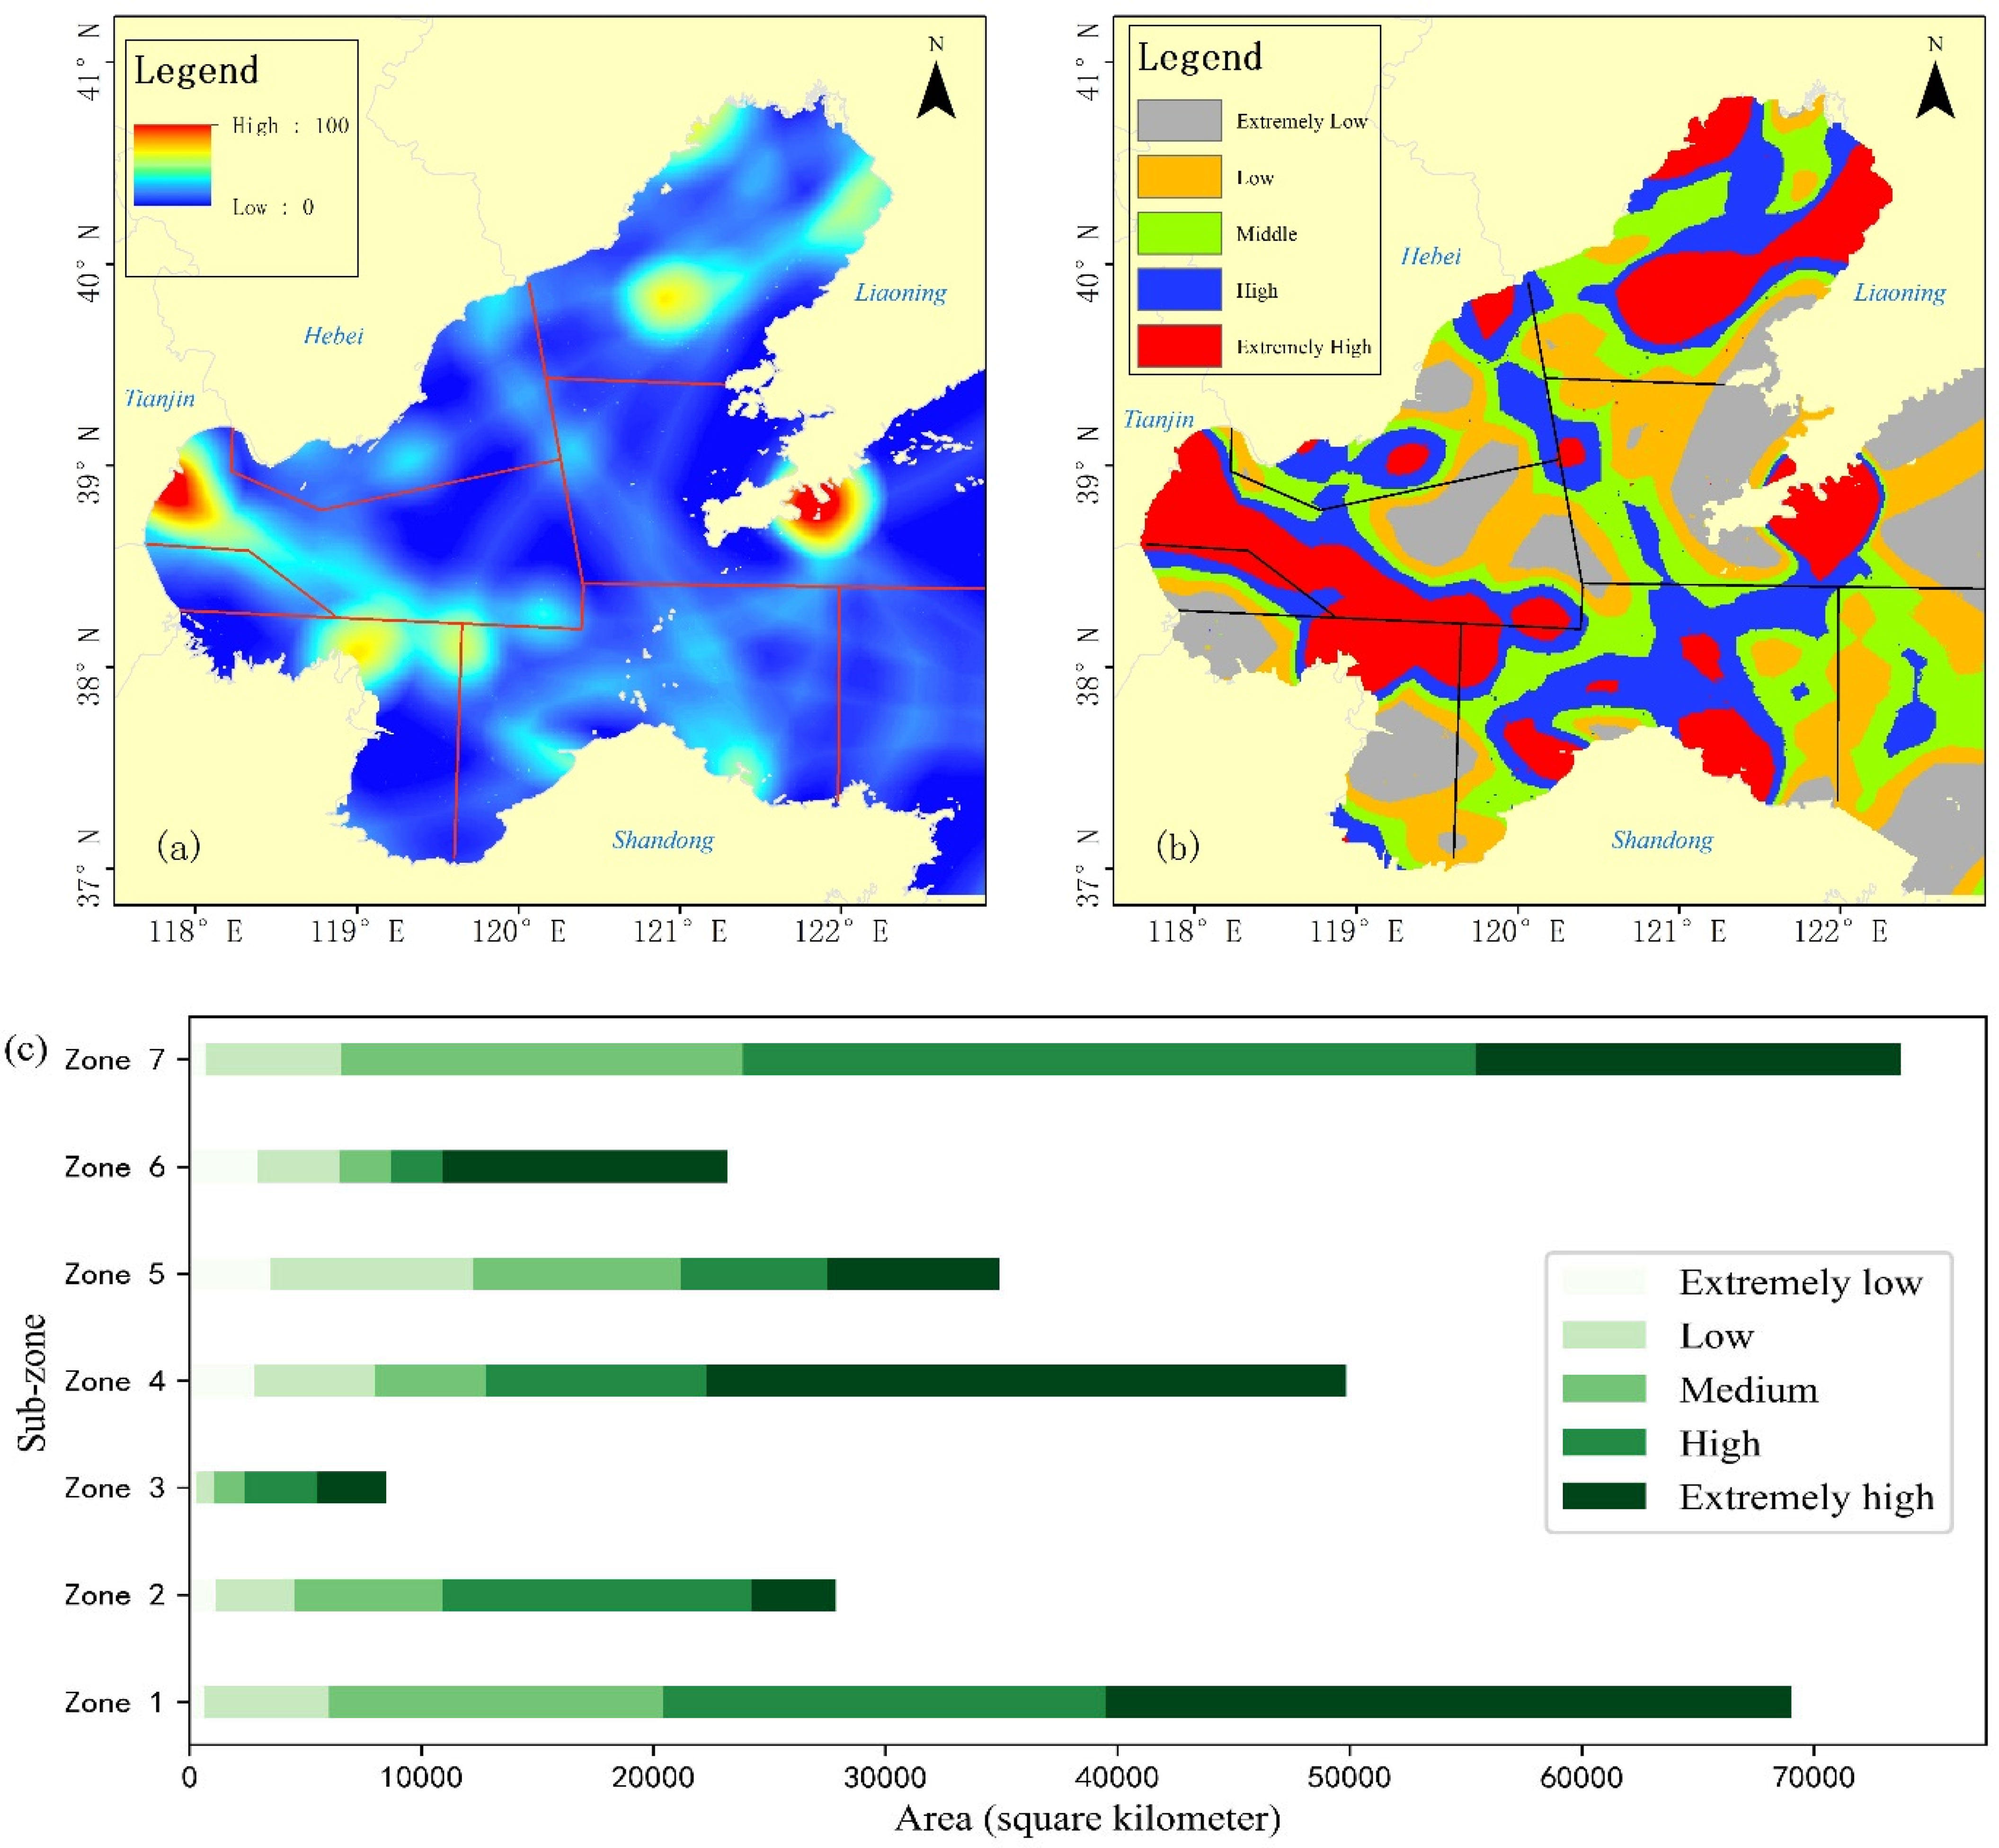
Figure 5 (A) Spatial pattern of comprehensive oil spill risk. (B) Five grades of oil spill risk status. (C) Area of different risk levels in each sub-zone.
There is no unified standard for the classification of the risk status. To show the risk distribution more clearly, this study classified the oil spill risk status into five grades using the quantile method, as shown in Table 3: extremely low-risk areas, low-risk areas, moderate-risk areas, high-risk areas, and extremely high-risk areas (Figure 5B).

Table 3 Risk values in the Bohai Sea.
Extremely high-risk areas are mostly located in Liaodong Bay and Bohai Bay; high-risk areas are located in the Bohai Strait and on the north side of the Shandong Peninsula; moderate-risk areas are mainly located on both sides of the Bohai Strait; low-risk areas are located on the south side of Liaodong Bay, in the middle of the Bohai Strait, and in Laizhou Bay; and extremely low-risk areas are located on the west side of Bohai Bay, the south side of Laizhou Bay, and the middle of the Bohai Sea. If described by sub-zones, extremely high-risk areas exist in each sub-zone, but their areas vary greatly. The sub-zone with the largest extremely high-risk areas is zone 1; its area spans 29,510 km2. In contrast, the sub-zone with the smallest extremely high-risk areas is zone 3, with an area of 2,955 km2. The sub-zone with the largest extremely low-risk areas is zone 5, while the sub-zone with the smallest extremely low-risk areas is zone 3. More precise statistics are presented in Figure 5C.
4 Discussions
4.1 Methodology of oil spill risk assessment
In the current research, oil spill risk assessment is usually based on the following theories: (1) Probability and statistics theory: The probability of an oil spill scenario is usually estimated based on historical data and/or expert judgment, and the consequences of oil spills can be quantified by simulation (Etkin et al., 2017). However, both spill probability and spill consequence have some degree of uncertainty, which leads to uncertainty in the final risk value of the oil spill (Amir-Heidari et al., 2019). (2) Disaster system theory: this process can be summarized as the establishment of an evaluation index system that combines hazard, exposure, and vulnerability, after which fuzzy mathematics is used to calculate the degree of disaster risk to achieve risk level evaluation (Yang et al., 2021). However, this method can only roughly reflect the risk level of the study area and does not provide a quantitative analysis in the sense of uncertainty. (3) Scenario analysis theory: this method describes a series of possible future scenarios using a computer simulation model, obtains a forecast set of future states under a series of scenarios, and formulates an overall comprehensive oil spill risk evaluation (Yu et al., 2018; Guo et al., 2019). The disadvantage of this method is that the assessment process is based on what-if scenarios, which can only approximate the true risk profile, and the modeling process is highly demanding (Spaulding, 2017).
Therefore, if the oil spill risk can be analyzed based on the existing risk sources, it will help to overcome the shortcomings of the above methods and help achieve a better understanding of the risk of regional oil spills. This is the solution proposed in this study: through the investigation of the existing risk sources, the location of the oil spill risk sources is clearly shown, and all risk resources are analyzed by referring to the evaluation index system in disaster system theory. The difference from disaster system theory is that the spatial analysis of various risk sources is carried out by the means of GIS in this study. Finally, EWM is used to make a comprehensive decision on the oil spill risk caused by the five types of risk sources, and the spatial characteristics of the oil spill risk are analyzed based on the GIS.
The advantage of this research is that the analysis of oil spill risk is based on the actual risk source, and combined with the spatial analysis function of GIS, it can effectively reflect the objective oil spill risk and show its spatial differentiation.
4.2 Assessment results
As mentioned previously, the research method adopted in this study is a simple linear summation method based on GIS and EWM. The combination of GIS and EWM is widely used in various fields for spatial analysis and index weight determination (Hu et al., 2019; Vagiona et al., 2022). Furthermore, in this study, the results obtained through this method were reasonable.
From the integrated assessment results, it can be found that the high-risk areas of oil spills are mainly located near large ports and oil production platforms, and the spatial analysis of GIS effectively reveals the spatial differentiation of risks, which is consistent with common sense knowledge. The results of this study were characterized by spatial differentiation. It can be seen from the final display that the spatial differentiation of risks is obvious, and the oil spill risks faced by each sub-zone are quite different.
4.3 Potential issues and future prospects
Although the results of this study were reasonable, some potential issues remain in this study, especially in the details of technical methods.
First, it is difficult to determine the scope of influence of various risk sources, because for a specific oil spill accident, the amount of spilled oil is random, and the external environment (such as ocean currents and wind directions) is constantly changing. Therefore, the historical accident information in the Bohai Sea is used as a reference to determine the buffer distances of different risk sources for space analysis. As a result, the determination of the buffer distance is subjective. Hence, how to objectively determine the buffer distance is one of the issues to be discussed in the next step.
Second, the five indices were selected according to the existing distribution of oil spill risk sources in the Bohai Sea area. However, this may not apply to other seas. This is because some sea areas may have other spill risk sources, such as natural seepage points. If this method is to be transferred to other areas, the selected indices need to be considered according to local conditions.
Third, in order to solve the problem of unstable weight determination, the weight determination method used in this study is the EWM, which is different from objective methods such as the analytic hierarchy process (AHP). By comparing the results from the EWM with those reported in a previous publication (Wang et al., 2023), the weight results for oil spill resources produced by different methods have obvious differences. For AHP, the published results show that ships and oil production platforms are the two indicators that are most likely to cause oil spill risks. This is because when experts make decisions, they might be influenced by historical accidents, and most accidents in the Bohai Sea have been caused by ships and oil production platforms. However, as an objective weight determination method, the EWM bases its analysis on the provided data alone, so it will produce different results. In future research, the subjective method and the objective method should be combined to make full use of their advantages and compensate for their disadvantages so that the weighting results are both subjective and objective.
4.4 Theoretical significance of the results
The Chinese government has done extensive work in the prevention and control of oil spill incidents. Currently, the measures taken by the Chinese government include the following: drafting relevant laws and regulations, formulating oil spill response plans, innovating oil spill response technologies, and improving oil spill response capabilities. All this work will underpin efforts to minimize damage from oil spill incidents.
To improve oil spill response capabilities, the Chinese government has made significant investments in oil spill emergency equipment. Furthermore, China’s equipment warehouses are divided into the following categories: central government equipment warehouses, state-owned enterprise equipment warehouses, local government equipment warehouses, and private equipment warehouses. The scientific deployment of emergency facilities in different locations is a problem that decision-makers need to consider. At this point, risk maps have a reference value.
Specifically, from the above risk distribution map, it can be seen that the Bohai Sea faces obvious oil spill risks and requires special attention from the government. Hence, it is necessary to comprehensively analyze the oil spill risk in combination with the actual situation in each sea area and improve the oil spill emergency response capability in a targeted manner. The results of the spatial differentiation of oil spill risk caused by each single risk source and the spatial differentiation of comprehensive risk will provide information about high-risk areas that require oil spill responses, such as deploying more oil spill emergency facilities. For small oil spills, the preparation should at least ensure that the local oil spill emergency equipment is sufficient. For medium- or large-scale oil spills, it is necessary to plan the deployment optimization and transportation capacity of oil spill emergency equipment to ensure that oil spills of any level can be effectively dealt with.
5 Conclusions
Conducting comprehensive risk assessments is a major challenge for oil spill disaster prevention and mitigation around the world. This study evaluated the comprehensive oil spill risk in the Bohai Sea by building a TPPSC framework. The main conclusions are as follows:
1. Oil spills caused by ships may be the main factor contributing to the comprehensive oil spill risk in the Bohai Sea. Oil spills caused by platforms aggravate the oil spill risk markedly. Liaodong Bay and Bohai Bay are beset with extremely high oil spill risks and high oil spill risks, while Laizhou Bay is subject to low and extremely low risks due to the sparse distribution of risk resources.
2. It is feasible to spatialize oil spill risk assessment results using GIS. All five indicators used in this paper were obtained from investigation data, but the risk caused by ships was dynamic in space and time, which cannot be ignored. In a future study, how to more accurately reflect dynamic risks will be investigated.
3. The Chinese government has carried out extensive work in improving the oil spill emergency laws and regulations, oil spill emergency plans, oil spill emergency response technical level, and oil spill emergency response capabilities, and risk maps could be a useful reference for policy making.
Data availability statement
The original contributions presented in the study are included in the article/supplementary material. Further inquiries can be directed to the corresponding author.
Author contributions
YW designed and performed the research, analyzed the data, and wrote the paper. PD, BL and XW collected the data. All authors contributed to the article and approved the submitted version.
Funding
This work was supported financially by the Natural Science Foundation of Shandong Province (Youth Program) (grant number: ZR2022QD020).
Conflict of interest
The authors declare that the research was conducted in the absence of any commercial or financial relationships that could be construed as a potential conflict of interest.
Publisher’s note
All claims expressed in this article are solely those of the authors and do not necessarily represent those of their affiliated organizations, or those of the publisher, the editors and the reviewers. Any product that may be evaluated in this article, or claim that may be made by its manufacturer, is not guaranteed or endorsed by the publisher.
References
Akinwumiju A. S., Adelodun A. A., Ogundeji S. E. (2020). Geospatial assessment of oil spill pollution in the Niger delta of Nigeria: An evidence-based evaluation of causes and potential remedies. Environ. Pollut. 267, 115545. doi: 10.1016/j.envpol.2020.115545
Ali A., Shah H., F. and Iqbal M. (2020). A review on hazard risk assessment using remote sensing and GIS. Cent. Asian J. Environ. Sci. Technol. Innov. 1 (5), 252–261. doi: 10.22034/CAJESTI.2020.05.02
Amir-Heidari P., Arneborg L., Lindgren J. F., Lindhe A., Rosén L., Raie M., et al. (2019). A state-of-the-art model for spatial and stochastic oil spill risk assessment: A case study of oil spill from a shipwreck. Environ. Int. 126, 309–320. doi: 10.1016/j.envint.2019.02.037
Arzaghi E., Abbassi R., Garaniya V., Binns J., Khan F. (2018). An ecological risk assessment model for Arctic oil spills from a subsea pipeline. Mar. Pollut. Bull. 135, 1117–1127. doi: 10.1016/j.marpolbul.2018.08.030
Bao Q., Yuxin Z., Yuxiao W., Feng Y. (2020). Can entropy weight method correctly reflect the distinction of water quality indices? Water Resour. Manage. 34 (11), 3667–3674. doi: 10.1007/s11269-020-02641-1
Bing L., Xing Q. G., Liu X., Zou N. N. (2019). Spatial distribution characteristics of oil spills in the bohai Sea based on satellite remote sensing and GIS. J. Coast. Res. 90 (SI), 164–170. doi: 10.2112/SI90-020.1
Chen P., Li Y., Lan G., Liu B., Zhou H. (2012). “Oil spills detection and monitoring using airborn thermal infrared remote sensing in dalian xingang oil pipeline explosion,” in 2012 2nd International Conference on Remote Sensing, Environment and Transportation Engineering. (Nanjing, China: IEEE), 1–4. doi: 10.1109/RSETE.2012.6260647
Cirer-Costa J. C. (2015). Tourism and its hypersensitivity to oil spills. Mar. Pollut. Bull. 91 (1), 65–72. doi: 10.1016/j.marpolbul.2014.12.027
Etkin D. S., French McCay D., Horn M., Hassellöv I.-M., Wolford A. J., et al. (2017). Quantification of oil spill risk. Oil Spill Sci. Technol. 2, 71–183. doi: 10.1016/B978-0-12-809413-6.00002-3
Gill D. A., Ritchie L. A., Picou J. S. (2016). Sociocultural and psychosocial impacts of the Exxon Valdez oil spill: Twenty-four years of research in Cordova, Alaska. Extr. Ind. Soc. 3 (4), 1105–1116. doi: 10.1016/j.exis.2016.09.004
Girard F., Fisher C. R. (2018). Long-term impact of the deepwater horizon oil spill on deep-sea corals detected after seven years of monitoring. Biol. Conserv. 225, 117–127. doi: 10.1016/j.biocon.2018.06.028
Guo W., Zhang S., Wu G. (2019). Quantitative oil spill risk from offshore fields in the bohai Sea, China. Sci. Total Environ. 688, 494–504. doi: 10.1016/j.scitotenv.2019.06.226
Hu Y., Li W., Wang Q., Liu S., Wang Z. (2019). Evaluation of water inrush risk from coal seam floors with an AHP–EWM algorithm and GIS. Environ. Earth Sci. 78, 1–15. doi: 10.1007/s12665-019-8301-5
Ikwan F., Sanders D., Haddad M. (2020). A combined AHP-PROMETHEE approach for intelligent risk prediction of leak in a storage tank. Int. J. Reliability Risk Safety: Theory Appl. 3 (2), 55–61. doi: 10.30699/IJRRS.3.2.7
Lee K., Chen B., Boufadel M., Swanson S. M., Hodson P. V., Foght J., et al. (2016). Behaviour and environmental impacts of crude oil released into aqueous environments (Ottawa: The Royal Society of Canada Expert Panel).
Liu B., Gong M., Wu X., Liu X. (2021b). A comprehensive model of vessel anchoring pressure based on machine learning to support the sustainable management of the marine environments of coastal cities. Sustain. Cities Soc. 72, 103011. doi: 10.1016/j.scs.2021.103011
Liu X., Meng R., Xing Q., Lou M., Chao H., Bing L. (2015). Assessing oil spill risk in the Chinese bohai Sea: A case study for both ship and platform related oil spills. Ocean Coast. Manage. 108, 140–146. doi: 10.1016/j.ocecoaman.2014.08.016
Liu B., Wu X., Liu X., Gong M. (2021a). Assessment of ecological stress caused by maritime vessels based on a comprehensive model using AIS data: Case study of the bohai Sea, China. Ecol. Indic. 126, 107592. doi: 10.1016/j.ecolind.2021.107592
Lu J., Wang W., Zhang Y., Cheng S. (2017). Multi-objective optimal design of stand-alone hybrid energy system using entropy weight method based on HOMER. Energies 10 (10), 1664. doi: 10.3390/en10101664
Spaulding M. L. (2017). State of the art review and future directions in oil spill modeling. Mar. Pollut. Bull. 115 (1-2), 7–19. doi: 10.1016/j.marpolbul.2017.01.001
Statista (2021). Available at: https://www.statista.com/statistics/264013/transport-volume-of-crude-oil-in-seaborne-trade/#statisticContainer.
Vagiona D. G., Tzekakis G., Loukogeorgaki E., Karanikolas N. (2022). Site selection of offshore solar farm deployment in the Aegean Sea, Greece. J. Mar. Sci. Eng. 10 (2), 224. doi: 10.3390/jmse10020224
Valentine D. L., Fisher G. B., Bagby S. C., Nelson R. K., Reddy C. M., Sylva S. P., et al. (2014). Fallout plume of submerged oil from deepwater horizon. Proc. Natl. Acad. Sci. 111 (45), 15906–15911. doi: 10.1073/pnas.141487311
Wang Y., Du P., Liu J., Chen C. (2023). Spatial variation of coastal wetland vulnerability to oil spill stress in the bohai Sea. Front. Mar. Sci. 9. doi: 10.3389/fmars.2022.1073906
Wang Y., Liu X., Yu X., Zheng X. (2018). Assessing response capabilities for responding to ship-related oil spills in the Chinese bohai Sea. Int. J. Disaster Risk Reduct. 28, 251–257. doi: 10.1016/j.ijdrr.2018.02.040
Wang Y., Zheng X., Yu X., Liu X. (2017). Temperature and salinity effects in modeling the trajectory of the 2011 penglai 19-3 oil spill. Mar. Georesources Geotechnol. 35 (7), 946–953. doi: 10.1080/1064119X.2016.1261971
Yang P., Huang X., Peng L., Zheng Z., Wu X., Xing C. (2021). Safety evaluation of major hazard installations based on regional disaster system theory. J. Loss Prev. Process Ind. 69, 104346. doi: 10.1016/j.jlp.2020.104346
Keywords: marine oil spill, comprehensive risk assessment, geographic information system (GIS), entropy weight method (EWM), the Bohai Sea
Citation: Wang Y, Du P, Liu B and Wu X (2023) Geographic information system-based comprehensive oil spill risk assessment in China’s Bohai Sea. Front. Mar. Sci. 10:1141962. doi: 10.3389/fmars.2023.1141962
Received: 11 January 2023; Accepted: 24 February 2023;
Published: 09 March 2023.
Edited by:
Xiaolong Geng, New Jersey Institute of Technology, United StatesReviewed by:
Xudong Ye, Memorial University of Newfoundland, CanadaBo Liu, Memorial University of Newfoundland, Canada
Copyright © 2023 Wang, Du, Liu and Wu. This is an open-access article distributed under the terms of the Creative Commons Attribution License (CC BY). The use, distribution or reproduction in other forums is permitted, provided the original author(s) and the copyright owner(s) are credited and that the original publication in this journal is cited, in accordance with accepted academic practice. No use, distribution or reproduction is permitted which does not comply with these terms.
*Correspondence: Yebao Wang, eWViYW93YW5nX3l0dUAxNjMuY29t