 Zhiwei Zhu
 Yuncheng Cao
 Zihan Zheng
 Nengyou Wu
 Duofu Chen
94% of researchers rate our articles as excellent or good
Learn more about the work of our research integrity team to safeguard the quality of each article we publish.
Find out more
ORIGINAL RESEARCH article
Front. Mar. Sci., 30 June 2023
Sec. Marine Biogeochemistry
Volume 10 - 2023 | https://doi.org/10.3389/fmars.2023.1140549
This article is part of the Research TopicChemical and Biogeochemical Processes at Methane and Other Cold SeepsView all 15 articles
Abiotic methane (CH4) and hydrogen (H2), which are produced during marine serpentinization, provide abundant gas source for hydrate formation on ocean floor. However, previous models of CH4–H2 hydrate formation have generally focused on pure water environments and have not considered the effects of salinity. In this study, the van der Waals–Platteeuw model, which considered the effects of salinity on the chemical potentials of CH4, H2, and H2O, was applied in a marine serpentinization environment. The model uses an empirical formula and the Peng–Robinson equation of state to calculate the Langmuir constants and fugacity values, respectively, of CH4 and H2, and it uses the Pitzer model to calculate the activity coefficients of H2O in the CH4–H2–seawater system. The three-phase equilibrium temperature and pressure predicted by the model for CH4–H2 hydrates in pure water demonstrated good agreement with experimental data. The model was then used to predict the three-phase equilibrium temperature and pressure for CH4–H2 hydrates in a NaCl solutions, for which relevant experimental data are lacking. Thus, this study provides a theoretical basis for gas hydrate research and investigation in areas with marine serpentinization.
Natural gas hydrates are crystalline solids formed from a mixture of water and gases. Natural gas hydrates are not only a new clean energy resource, but also have an important role in environmental effects and marine hazard assessment (Wan et al., 2022). The microstructure comprises cavities (hosts) formed by water molecules through hydrogen bonding and gas molecules (guests) trapped inside (Dendy Sloan and Koh, 2007). Typical gas molecules include methane (CH4), ethane, propane, and carbon dioxide, which can be biotic or abiotic in origin. Serpentinization, which primarily occurs at mid-ocean ridges and fore-arc systems, plays an important role in producing abiotic gases (Holm et al., 2015). Serpentinization is the hydration of olivine and orthopyroxene minerals, the main constituents of ultramafic rocks, creating a reducing chemical environment characterized by high H2 concentrations. The general reaction equation is: . Excess H2 reduces CO2 dissolved in water to CH4 and low-molecular-weight hydrocarbons through Fischer-Tropsch type (FTT) reactions, The general reaction equation is: (Proskurowski et al., 2008). The ultraslow-spreading ridges in the Fram Strait between the North Atlantic Ocean and Arctic Ocean are a typical serpentinization area with bottom simulating reflectors (BSRs) in their seismic profiles, which is characteristic of CH4 hydrate development (Rajan et al., 2012; Johnson et al., 2015). In addition to CH4, serpentinization produces substantial amounts of H2 (Coveney et al., 1987; McCollom and Bach, 2009). The formation of hydrates from H2 has been a well-explored research topic in recent years. Experimental studies have shown that the pressure required to form stable H2 hydrates is hundreds of times higher than that of CH4 hydrates under the same low-temperature conditions (Dyadin et al., 1999; Mao et al., 2002). However, the pressure required to form H2 hydrates can be effectively reduced by mixing in a small amount of a second guest molecule such as tetrahydrofuran (THF) (Hashimoto et al., 2006). Similar to THF, CH4 can be used as a thermodynamic promoter to stabilize H2 hydrate formation, and it is small enough to afford H2 a higher occupancy in hydrate cages compared to THF (Matsumoto et al., 2014). This effect of the second guest molecule may allow CH4–H2 hydrates to form from the abundance of abiotic CH4 and H2 produced by serpentinization. To confirm this possibility, the three-phase (hydrate, liquid, and vapor) equilibrium conditions require to be determined for the formation of CH4–H2 hydrates in a serpentinization environment.
Researchers have experimentally measured the phase equilibrium conditions for forming CH4–H2 hydrates at various molar fraction ratios. Holder et al. (1983) measured the phase equilibrium conditions for the formation of H2-rich gas hydrates at temperatures of<282.3 K and concluded that hydrate formation is strongly dependent upon the gas composition. Zhang et al. (2000) used the pressure search method to measure the phase equilibrium conditions for hydrate formation from H2 and hydrocarbon gas mixtures in pure water. They considered temperature and pressure ranges of 274.3–278.2 K and 3.72–6.63 MPa, respectively, and H2 molar fractions of 22.13 and 36.18 mol%. Their results suggested that increasing H2 molar fractions was not conducive to the formation of CH4–H2 hydrates. Measurements by Chen et al. (2002) demonstrated that the pressure range for CH4–H2 hydrate formation at H2 molar fractions of 22–70 mol% and a temperature of 274.15 K was 3.72–9.67 MPa. Skiba et al. (2007) used differential thermal analysis to investigate the phase equilibrium of CH4–H2 hydrates at H2 molar fractions of 0–70 mol% and a pressure of up to 250 MPa. Their results suggested that the decomposition temperature of the formed hydrate decreased as the H2 concentration in the initial gas mixture increased. Pang et al. (2012) injected gas or gas mixtures into an equilibrium cell containing an appropriate amount of water and at a constant pressure. They nucleated and decomposed hydrates by adjusting the temperature, where the equilibrium temperature was defined as the point at which hydrates appeared to melt for the second time. The phase equilibrium conditions for CH4–H2 hydrates were measured for H2 molar fractions of 5–66 mol%. Li et al. (2022) used the isochoric pressure-search method to measure the phase equilibrium conditions for CH4–H2 hydrates in the temperature range of 274.24–287.43 K at H2 molar fractions of 22 and 80 mol%. Additionally, Researchers have established several models to obtain a wider range of phase equilibrium data. Skiba et al. (2007) obtained the coefficients of the equation by fitting the experimental data using the method of least squares. The equation demonstrated good agreement with the experimental results of pure CH4 hydrates and initial gas mixtures with H2 molar fractions of<40 mol%. However, the difference between the predicted values and experimental results considerably widened when the H2 molar fractions was >40 mol%. Pang et al. (2012) used the Ng–Robinson model (Ng and Robinson, 1976) to establish a model that can predict the three-phase equilibrium conditions for the formation of CH4–H2 hydrates at different gas molar fractions. Li et al. (2022) used the Chen–Guo model (Chen and Guo, 1998) to establish a model that can predict the three-phase equilibrium conditions for the formation of multi-component mixtures from different molar fractions of H2 with one or more hydrocarbons.
The abovementioned models can accurately predict the three-phase equilibrium conditions for the formation of multi-component gas hydrates from H2 in a pure water system. However, salinity can inhibit hydrate formation, and currently available models cannot accurately predict the three-phase equilibrium conditions for CH4–H2 hydrates in a marine serpentinization environment. Although various abiotic and microbially mediated reactions affect the chemical compositions of pore waters in serpentinization surface sediments, resulting in some differences in major and trace elements, the pore water ions are still dominated by NaCl and are generally similar in species to those found in the upper layers of ocean water (Hulme et al., 2010). For example, The Ocean Drilling Program Site 1200, located on the South Chamorro Seamount, has highly permeable and strongly alkaline (pH 12.5) in the deep pore water compared to other serpentinization areas. The contents of chloride, magnesium, and calcium ions are lower while the alkalinity and contents of sodium, potassium, sulfate, and light hydrocarbon ions are significantly higher compared with the upper layers of ocean water. The content of sodium and chloride ions in this region are above 500mmol/kg, potassium and sulfate ions are 10-20mmol/kg, while magnesium and calcium ions are less than 5mmol/kg. Therefore, sodium and chloride ions are still the leading components, and Na/Cl can reach a maximum of 1.2 (Salisbury et al., 2002). The effects of alkalinity and other ions on hydrate formation are essentially negligible compared with the effects of sodium and chloride ions. Thus, a thermodynamic model that can predict the three-phase equilibrium conditions for the formation of CH4–H2 hydrates in both pure water and a sodium chloride (NaCl) solution is required. In this study, the van der Waals–Platteeuw thermodynamic model of classical adsorption theory was used to establish a thermodynamic model that can accurately predict the temperature and pressure conditions for the three-phase equilibrium of CH4–H2 hydrates in a marine serpentinization environment. The model incorporates the molecular potential energy model to consider the effects of temperature, pressure, and salinity. The performance of the model was evaluated by comparison with experimental data in the literature.
At phase equilibrium, the chemical potential or fugacity of each component in the system is identical in various phases. Water has low volatility and is not compatible with hydrocarbons, and therefore it generally accounts for a low proportion of the vapor and liquid phases of hydrocarbons. Therefore, the chemical potentials of water in the hydrate and liquid phases can be selected as the constraints. If water is selected as the reference component, the phase equilibrium constraint is given by
where is the chemical potential of water in the hydrate phase (J/mol) and is the chemical potential of water in the liquid phase (J/mol).
If the chemical potential of water in the hypothetical empty hydrate lattice is selected as the intermediate state, the constraints are given by
where is the chemical potential of water in the hypothetical empty hydrate lattice (J/mol). is the difference between the chemical potentials of water in the empty hydrate and hydrate phases (J/mol). is the difference between the chemical potentials of water in the empty hydrate and liquid phases (J/mol).
Determining the structural type for CH4–H2 hydrates is crucial in this approach, but the thermodynamic properties of CH4–H2 hydrates are currently not well understood. From the available studies, pure H2 hydrates tend to naturally form Structure II (Mao et al., 2002). However, as the initial molar fractions of CH4 increases, there is a higher likelihood that Structure I will become more favorable (Grim et al., 2012). Based on the dependence of hydrate structure on thermodynamic and kinetic conditions, the hydrate structure of the CH4 + H2 mixed system is dependent on several factors: structure induction, driving force of hydrate independent nucleation, composition of gas mixture, pressure, and formation period (Matsumoto et al., 2014; Gao et al., 2022). Considering the pressure and gas composition in the serpentinization area, Structure I was finally chosen as the calculation standard. can be calculated as per the statistical mechanics model proposed by van der Waals and Platteeuw (2007):
where R is the universal gas constant (8.314 J/mol/K), T is the temperature (K), is the number of type i cages in each water molecule (Table 1), is the temperature-dependent Langmuir constant of the gas component j in type i cavities, and is the fugacity of the gas component j in the hydrate phase (MPa).
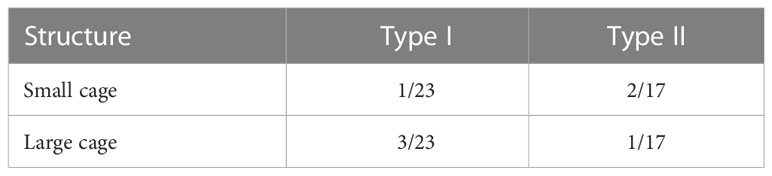
Table 1 Values of vi in two types of hydrate cages.
The Langmuir constant is a critical parameter of the van der Waals–Platteeuw model and depends on the chemical potential for the interaction between guest and water molecules. For Structure I hydrates, the Langmuir constants of CH4 and H2 are calculated from the empirical equations fitted by Sun and Duan (2007) and Klauda and Sandler (2003), respectively.
where the values of A, B, and D are given in Table 2.
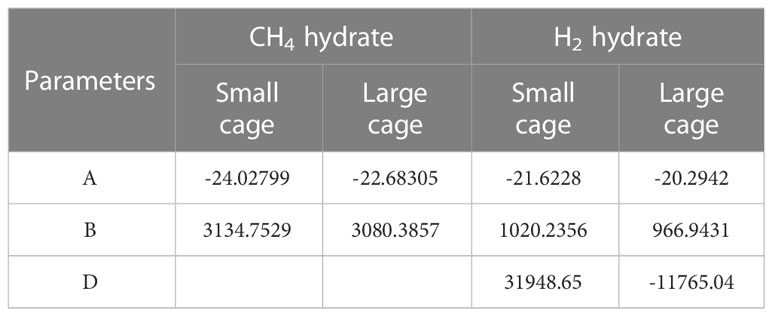
Table 2 Calculated parameters of Langmuir constant.
Another important aspect of an accurate thermodynamic model is calculating the fugacity of the gas component. When three phases coexist in equilibrium, the fugacity values of gas j in the hydrate, liquid water, and vapor phases are identical:
where the superscripts H, L, and V indicate the hydrate, liquid, and vapor phases, respectively. In this study, the fugacity values of CH4 and H2 in the vapor phase were calculated using the equation of state for gas mixtures proposed by Peng and Robinson (1970). can be calculated by using the equations proposed by Holder et al. (1980):
where is the difference between the reference chemical potentials of water in the empty hydrate and ice phases at the reference temperature (generally 273.15 K) and zero pressure (J/mol). is the difference between the molar enthalpies of the empty hydrate lattice and liquid or ice phase of pure water (J/mol). is the difference between the molar volumes of the empty hydrate lattice and the liquid or ice phase of pure water (m3/mol). is the water activity. is the difference between the molar heat capacities of the empty hydrate lattice and liquid or ice phase of pure water (J/mol/K). Table 3 presents the above parameters.
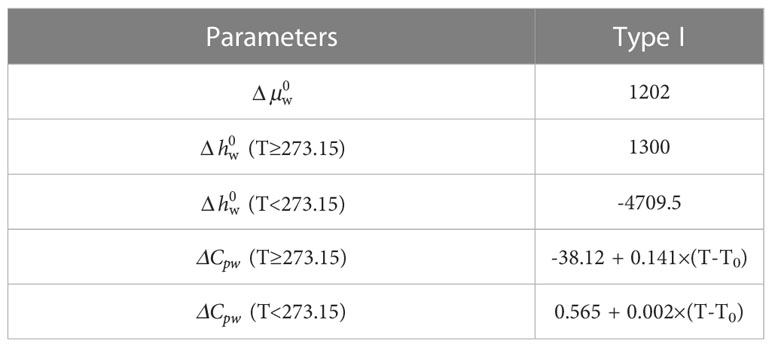
Table 3 Thermodynamically relevant parameters of Structure I hydrate at T0 =273.15 K.
To calculate the three-phase equilibrium pressure at a given temperature T, the molar fractions of H2 (mol%), and salinity (mol/kg), the initial pressure P1 is estimated first. Then, and are calculated and compared at P1. If the absolute difference between and is sufficiently small, then the pressure can be considered the equilibrium pressure P under the above conditions. Otherwise, the pressure is modified, then and are calculated at the modified pressure. The abovementioned processes are repeated by using Newton’s method or dichotomy until the equilibrium pressure is determined. If the absolute difference between and is less than 1 × 10⁻², then the iteration is terminated, and an equilibrium pressure is obtained with a deviation of<0.1%.
As described above, the fugacity values of CH4 and H2 can be calculated by using the equation of state for gas mixtures proposed by Peng and Robinson (1970):
Equation 11 presents rules by which Equation 10 can be rearranged in the form of Equation 12:
where R is the universal gas constant (8.314 J/mol/K), is the gas molar volume, a is a measure of the intermolecular attraction, and b is a constant related to the gas molecule size. The values of a and b at the critical point can be obtained as per the critical properties of gases:
where is a constant characteristic of each substance. where the critical temperature Tc of H2 is 33.2 K, the critical pressure Pc is 1.3 MPa, and the acentric factor is −0.216. The critical temperature Tc of CH4 is 190.4 K, the critical pressure Pc is 4.6 MPa, and the acentric factor is 0.012. The above method is followed when calculating pure gases, but certain rules should be followed when calculating gas mixtures. The mixing rule is as follows:
In eq 17, is the initial molar fractions of component i and component j in the gas mixture. is an empirically determined binary interaction coefficient characterizing the binary formed by component i and component j. The value is 0.9035 between component H2 and component CH4 (Matsumoto et al., 2014). As per the state parameters and mixing rule of CH4 and H2, the critical values of a and b can be calculated by Equation 17. Then, the fugacity coefficients of H2 and CH4 can be calculated from the following equation:
The water activity aw in Equation 7 is calculated using the Pitzer model (Pitzer, 1975). The relationship between aw and the permeability coefficient is denoted by the following equation:
where is the molecular weight of water. is the molality of solute i, which can be cations, anions, or neutral substances. is the permeability coefficient, which was first proposed by Pitzer and Silvester (Pitzer and Silvester, 1976) and was eventually rearranged by Harvie et al. (1984) and Felmy and Weare (1986) to obtain:
where I is the ionic strength. The subscripts c, a, and n are cations, anions, and neutral substances, respectively. The summation index, c, denotes the sum over all cations in the system. The double summation index, c< c’, denotes the sum over all distinguishable pairs of dissimilar cations. Analogous definitions apply to the summation indices for anions. is one-third of the Debye–Hückel limiting slope. , , and are measurable combinations of the second virial coefficient. , , and are measurable combinations of the third virial coefficient.
The second virial coefficients and are functions of the ionic strength, and the third virial coefficients and are assumed independent of the ionic strength. Duan and Sun (2006) described the equations for calculating the above parameters in detail. Because gas hydrates in an aqueous solution of electrolytes exist in equilibrium at low temperatures of -25 to 25°C, the relevant parameters determined by Spencer et al. (1990) were selected. The temperature-dependent ion interaction parameters in the Pitzer model are expressed as follows (The values of c1-c6 can be found in the paper of Spencer et al. (1990)):
The effect of pressure on activity coefficients at a specific temperature should be included in the theoretical calculation. However, Monnin (1990) reported that the effect of pressure on the activity of water is small and can be ignored. Duan and Sun (2006) also confirmed this result from temperature- and pressure-dependent parameters for aqueous NaCl solutions. Thus, this model will neglect the effect of pressure on water activity.
The second virial coefficient and third virial coefficient are the interactions between ions and neutral substances (Duan and Sun (2006)). and have been determined by the CH4 solubility model established by Duan and Mao (2006), and and have been determined by the H2 solubility model established by Zhu et al. (2022). Duan and Sun (2006) set to zero and fitted and based on the solubility of CH4 in an aqueous NaCl solutions. All interaction parameters between CH4 and monovalent and divalent cations can be approximated as and , respectively. , , and are treated by the same method, where all interaction parameters between H2 and monovalent and divalent cations approximated as and , respectively.
In summary, Equation 19 and 20 form the fundamental equations of the model for predicting the stability of gas hydrates in an aqueous solution of electrolytes. All parameters in these equations have been assessed by researchers. The phase equilibrium data for gas hydrate formation in an aqueous solution of electrolytes should not be adjusted before use.
At present, only experimental data of CH4–H2 hydrates in pure water are available. In this study, 60 data points were collected for H2 molar fractions of 4.55%–80.00%. The model was used to predict the pressure necessary to form CH4–H2 hydrates at a specific temperature. The model predictions in pure water were confirmed against experimental data from the literature, and deviations of the predicted results from the experimental data were tabulated (Table 4). The minimum and maximum mean absolute percentage errors (MAPEs) between the predicted results and experimental data were 0.86% and 18.03%, respectively. MAPE was >10.00% only at H2 molar fractions of 36.18% and 65.90%.
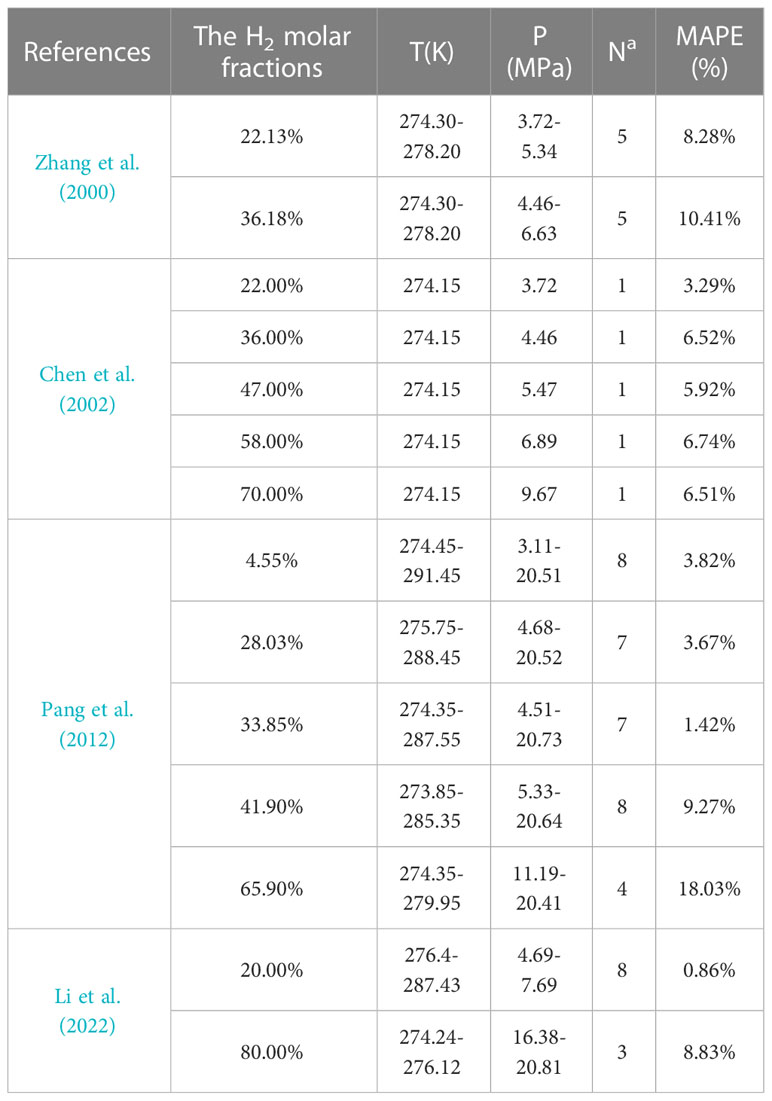
Table 4 Errors occurring when model predicts conditions for hydrate formation in pure water.
To confirm the prediction accuracy of the model, the pressures for forming CH4–H2 hydrates at temperatures of 274.15–293.15 K were calculated at different H2 molar fractions (Figure 1). The three-phase equilibrium pressure increased with the temperature regardless of the initial H2 molar fractions. For example, when the H2 molar fractions was 33.85%, the three-phase equilibrium pressures were 4.59, 7.71, 13.56, 25.40, and 43.37 MPa at temperatures of 274.15, 279.15, 284.15, 289.15, and 293.15 K, respectively. The calculated pressure increments were 3.13, 5.85, 11.84, and 17.97 MPa, respectively. These results suggest that the pressure does not increase linearly with temperature. The experimental data obtained by Zhang et al. (2000) corresponded to H2 molar fractions of 22.13% and 36.18%; these were lower than those obtained by Li et al. (2022) and Pang et al. (2012) of 20.00% and 33.85%, respectively. The model predictions were greater than the above experimental data when the H2 molar fractions were 22.13% and 36.18%. Notably, the error increased with the H2 molar fractions, which is consistent with the results of other researchers (Pang et al., 2012; Ma et al., 2013; Wang et al., 2015). In general, the conventional equation of state cannot accurately calculate the phase equilibrium properties because of the quantum properties of H2 molecules, and the parameters of the equation of state of H2 molecules may be specifically regressed (Deiters, 2013; Privat and Jaubert, 2013).
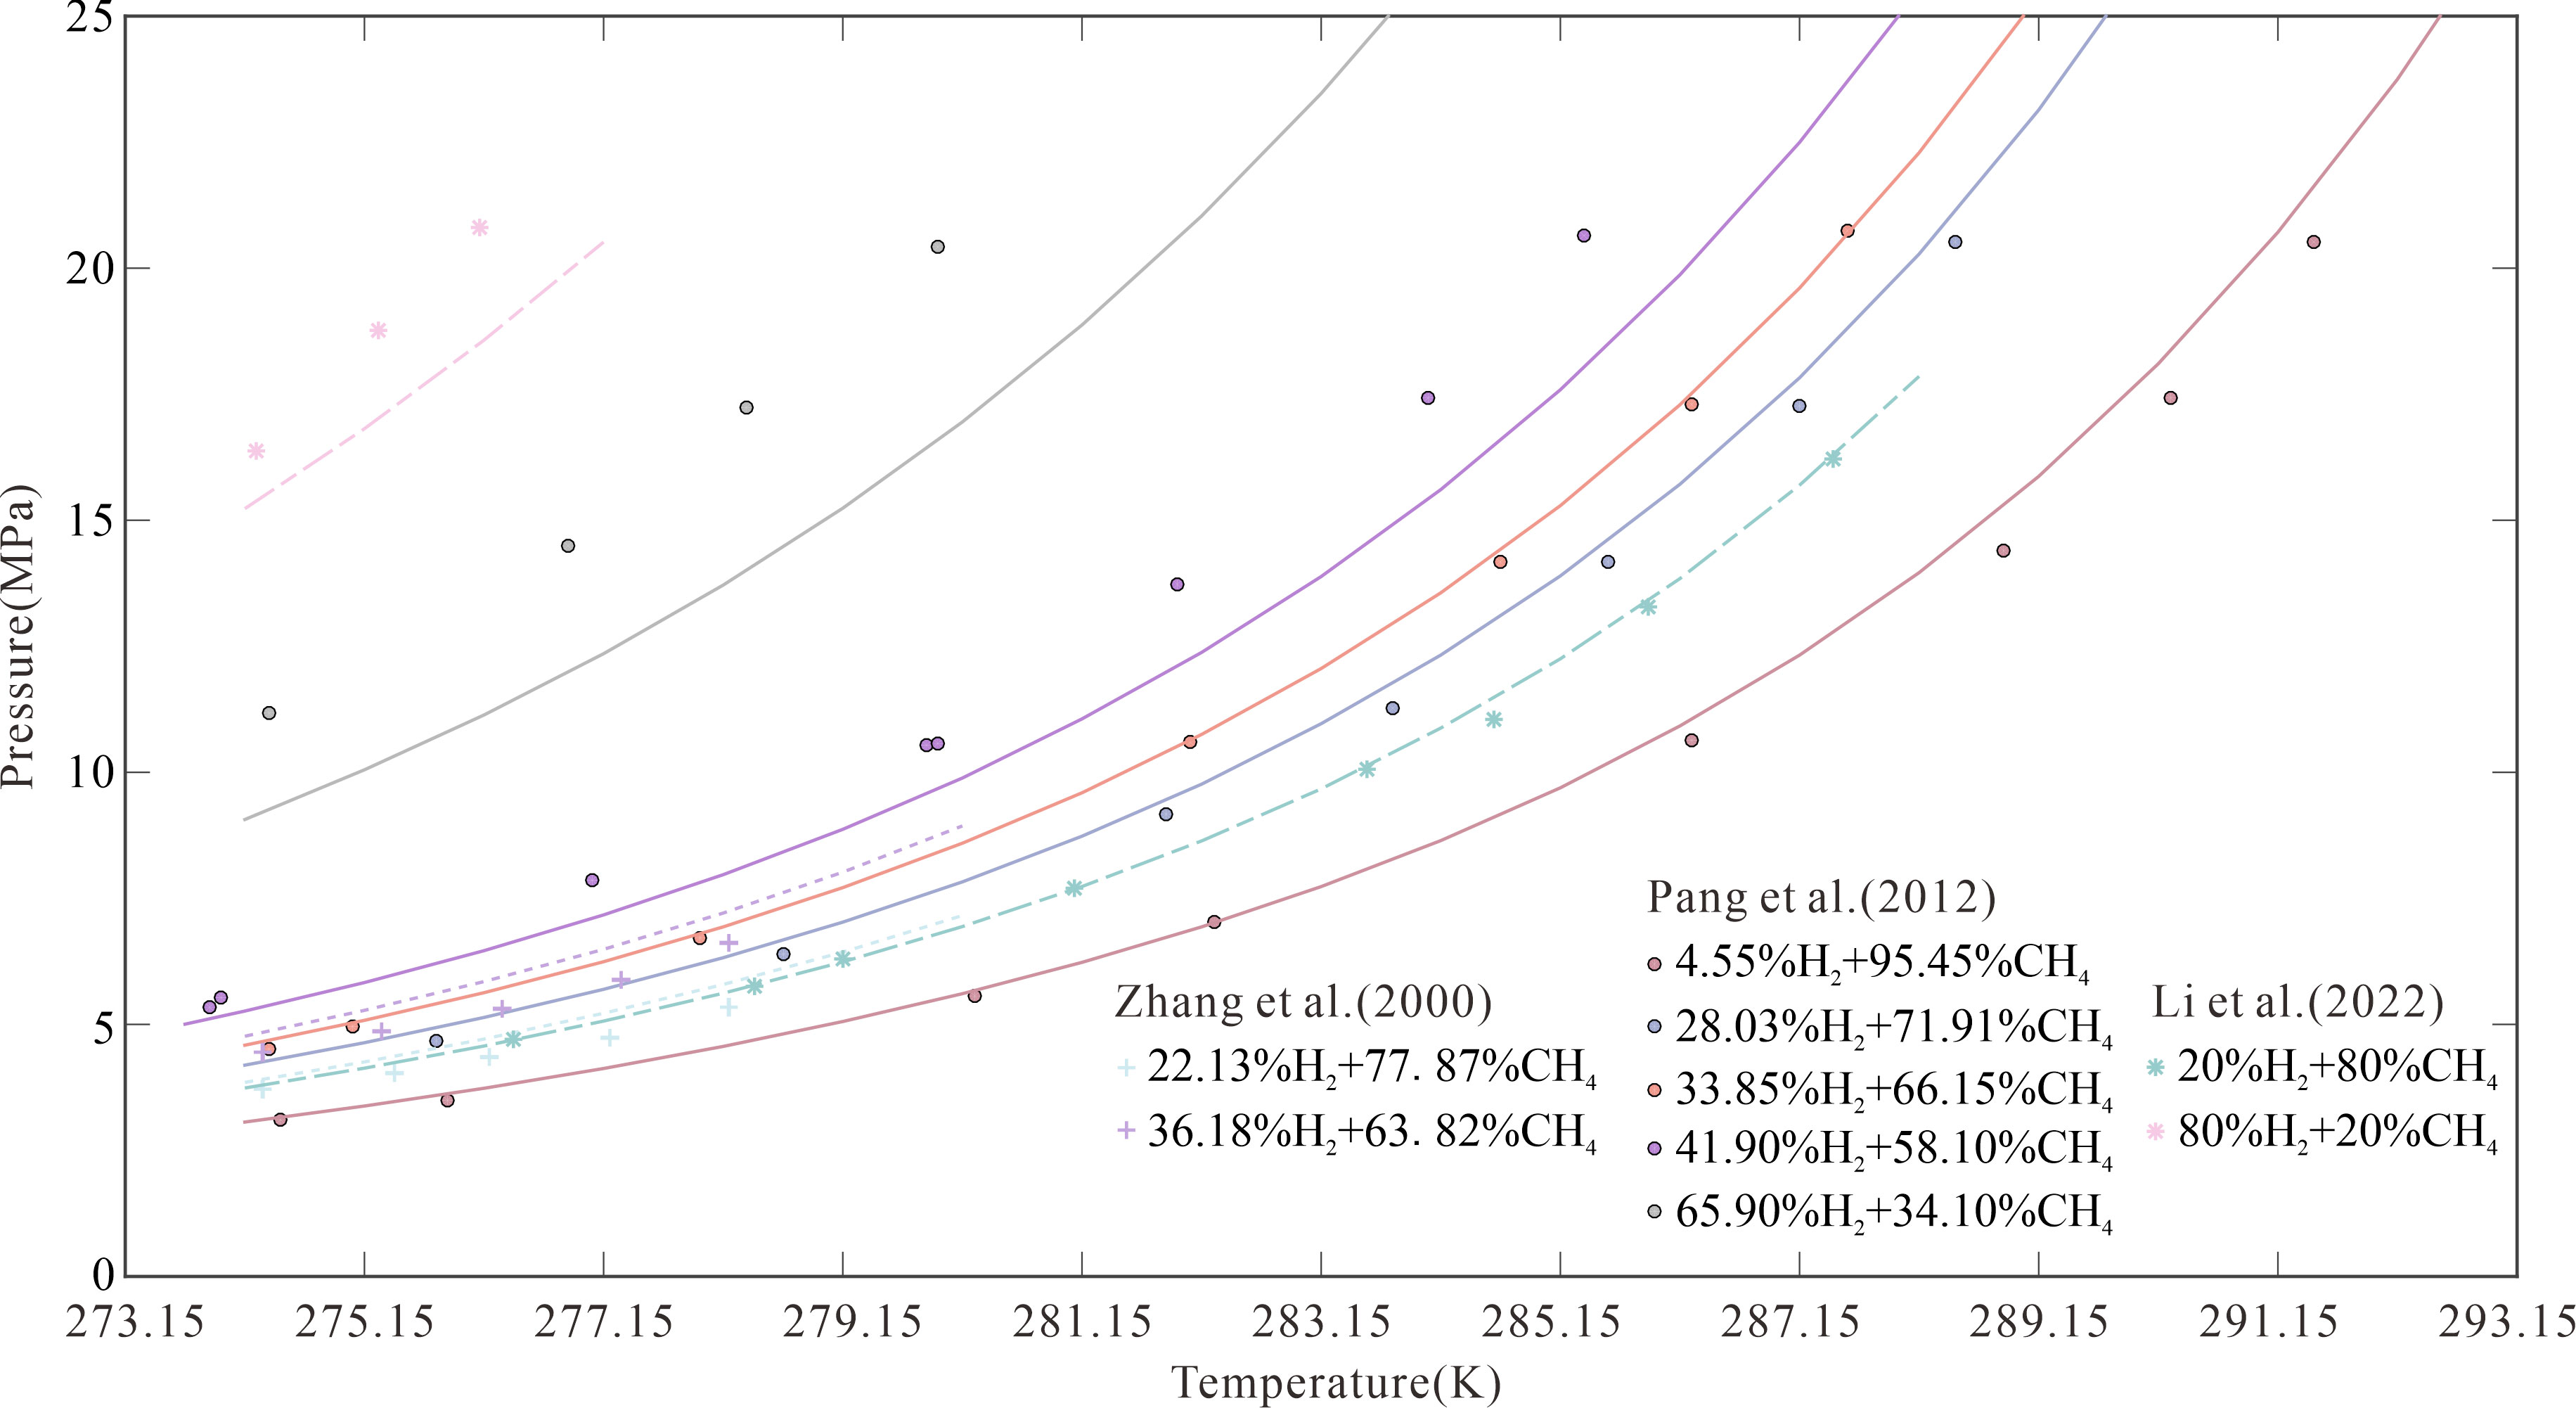
Figure 1 Comparison between model-predicted results and experimental data in pure water.
The model can predict the three-phase equilibrium conditions for CH4–H2 hydrates in NaCl solutions of different concentrations, for which relevant experimental data are lacking. To consider the effects of solution ions on the three-phase equilibrium of CH4–H2 hydrates, four initial H2 molar fractions were selected: 4.55%, 20.00%, 28.03%, and 33.85%. Then, the three-phase equilibrium conditions were calculated for the formation of CH4–H2 hydrates from H2 in pure water and in 0.1, 0.55, and 1 mol/kg NaCl solutions at temperatures of 274.15–293.15 K. Figure 2 plots the results with experimental data. Figure 2A shows that the three-phase equilibrium pressures for the formation of CH4–H2 hydrates at temperatures of 274.15, 283.15, and 293.15 K were 3.06, 7.73, and 27.3 MPa, respectively, in pure water; 3.15, 7.98, and 28.45 MPa, respectively, in the 0.1 mol/kg NaCl solutions; 3.49, 9.04, and 33.62 MPa, respectively, in the 0.55 mol/kg NaCl solutions; and 3.88, 10.33, and 39.94 MPa, respectively, in the 1 mol/kg NaCl solutions. Compared with pure water, the 1 mol/kg NaCl solutions increased the three-phase equilibrium pressures at 274.15, 283.15, and 293.15 K by 0.82, 2.60, and 12.67 MPa, respectively. This suggests that the three-phase equilibrium pressure increases with the temperature as well as the NaCl concentration. Note that experimental data are still required to verify the accuracy of the model in NaCl solutions, but the trend of the effect of NaCl solutions on the phase equilibrium of CH4-H2 hydrates is the same as that of pure methane hydrate.
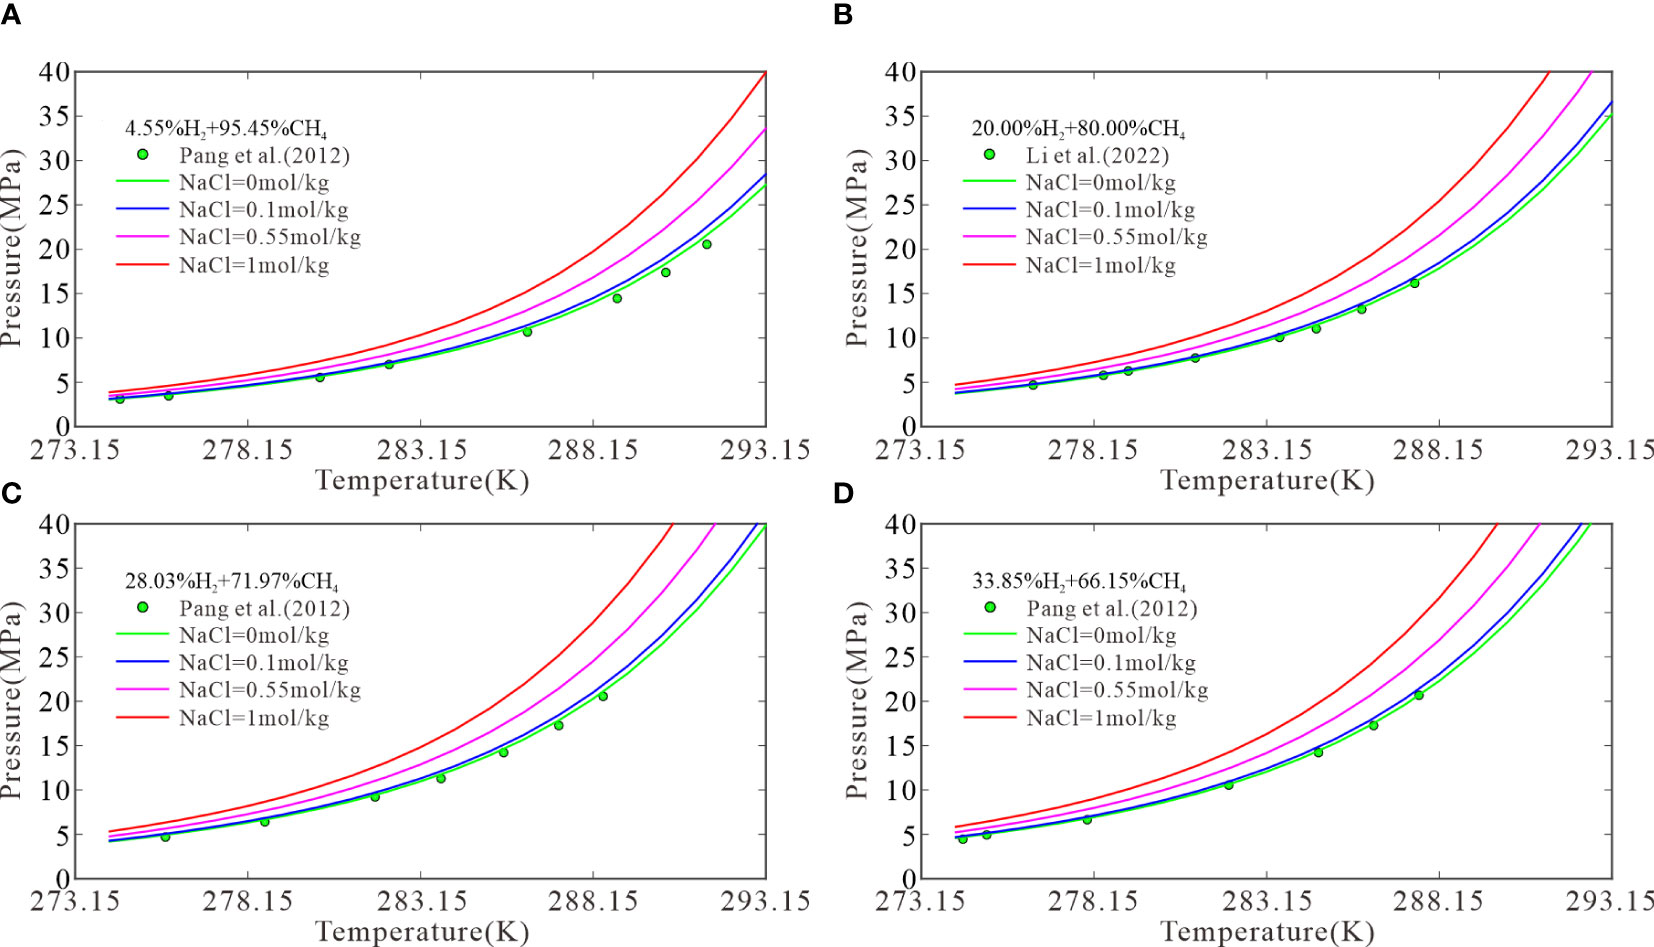
Figure 2 The model predictions at H2 molar fractions of 4.55 (A), 20.00 (B), 28.03 (C), and 33.85 mol% (D).
At the same temperature, the equilibrium pressure of CH4–H2 hydrates is associated with the initial molar fractions of CH4 and H2. Four temperatures were selected to calculate the three-phase equilibrium pressures for hydrate formation with initial H2 molar fractions of 10–80mol%: 274.15, 280.15, 286.15, and 293.15 K. Figure 3 plots the results with experimental data obtained by Chen et al. (2002). Figure 3A shows that the three-phase equilibrium pressures at initial H2 molar fractions of 10%, 35%, 60%, and 80% were 3.28, 4.67, 7.72, and 15.23 MPa, respectively. Based on these results, the model was used to calculate the three-phase equilibrium pressures of CH4–H2 hydrates in 0.1, 0.55, and 1 mol/kg NaCl solutions. At the above H2 molar fractions, the three-phase equilibrium pressures were 3.36, 4.79, 7.92, and 15.60 MPa, respectively, in the 0.1 mol/kg NaCl solutions; 3.73, 5.33, 8.83, and 17.34 MPa, respectively, in the 0.55 mol/kg NaCl solutions; and 4.15, 5.96, 9.87, and 19.32 MPa, respectively, in the 1 mol/kg NaCl solutions. Figure 3A shows that the model predictions were consistent with experimental data in pure water. The three-phase equilibrium pressure for the formation of CH4–H2 hydrates was low when the initial molar fractions of CH4 was high and increased with the H2 content until H2 was dominant. Then, the pressure increased to a value that cannot be reached under natural conditions. Figures 3B–D show similar trends. A higher H2 content resulted in more demanding conditions for hydrate formation in submarine sediments, particularly in serpentinization areas.
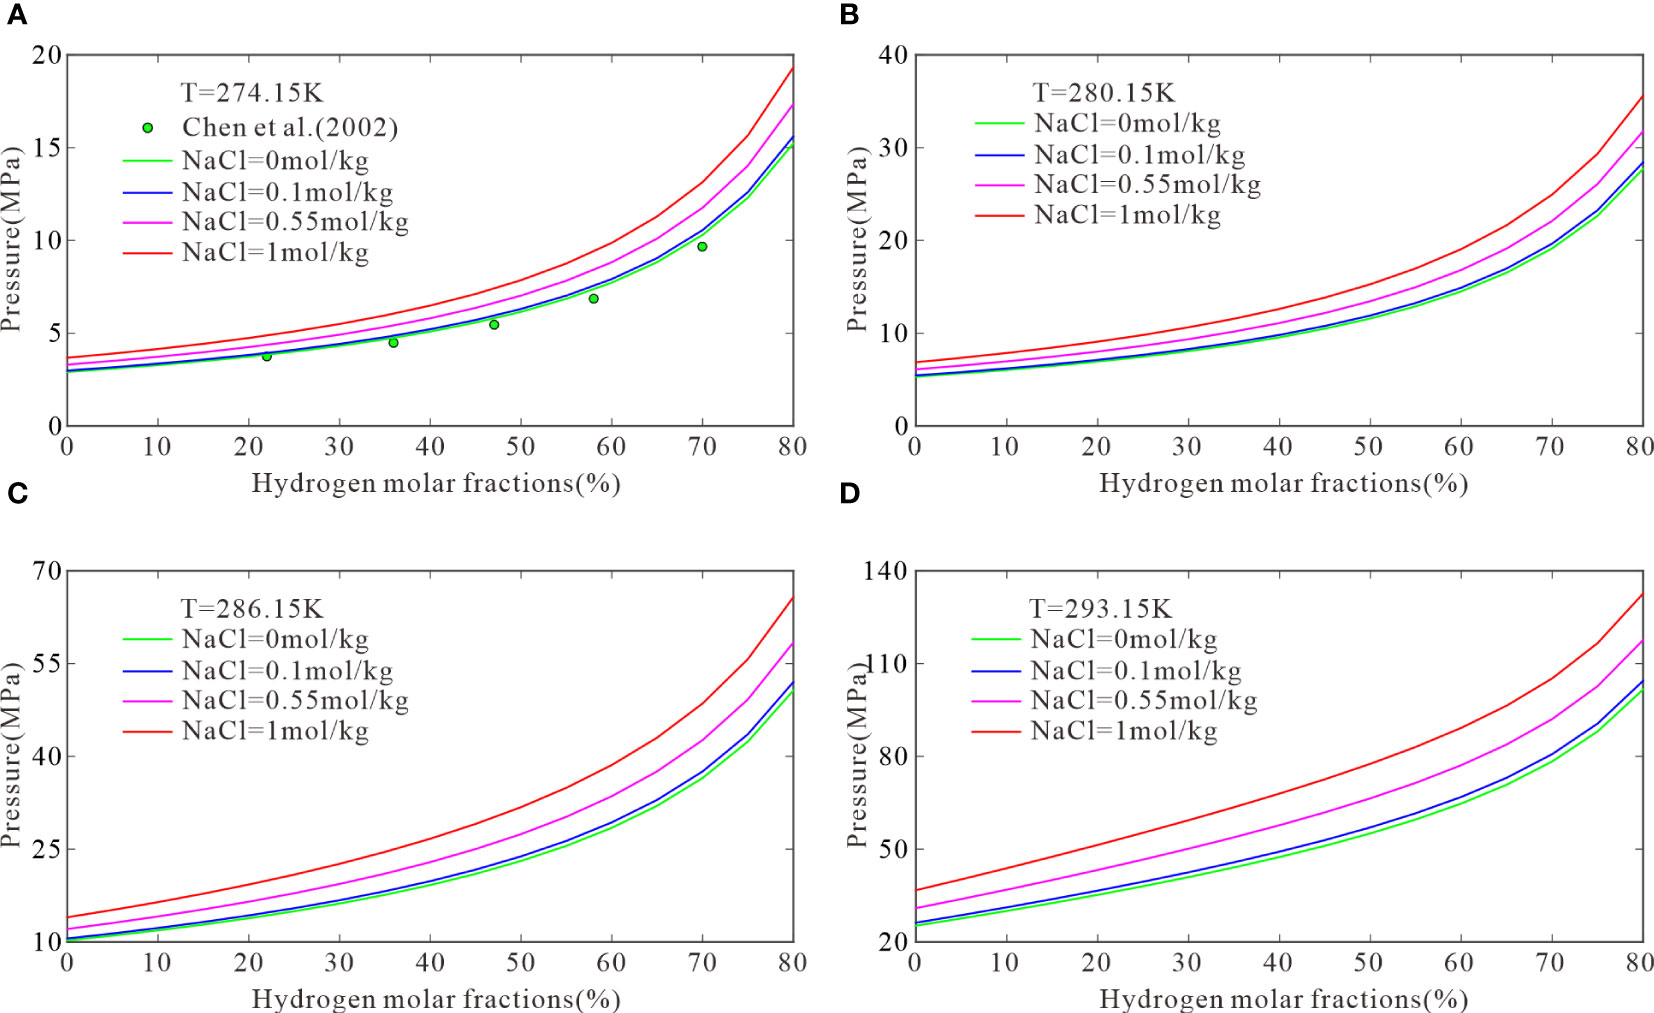
Figure 3 The model predictions when temperatures are 274.15 (A), 280.15 (B), 286.15 (C), and 293.15 K (D).
A thermodynamic model was established based on classical adsorption theory, the van der Waals theory, and the molecular potential model to predict the three-phase (hydrate, liquid, and vapor) equilibrium temperature and pressure for the formation of CH4–H2 hydrates at different molar fractions of CH4 and H2. The model predictions were consistent with recent experimental data of CH4–H2 hydrates, and the proposed model demonstrated its superiority to previously established models in terms of temperature and pressure ranges as well as prediction accuracy. Moreover, the model can consider the effects of salinity on the hydrate stability. The model predictions indicated that the pressure necessary for the formation of CH4–H2 hydrates in saltwater increases with the temperature, NaCl concentration, and H2 molar fractions when other conditions remain unchanged. In the sedimentary layers of serpentinization areas, the combined effects of the temperature, NaCl concentration, and H2 molar fractions on the formation of CH4–H2 hydrates should be comprehensively considered. This study thus provides a theoretical basis for identifying CH4–H2 hydrates on ocean floor in marine areas.
Publicly available datasets were analyzed in this study. This data can be found here: https://gashydrates.nist.gov/.
ZWZ: Conceptualization, investigation, methodology, software and writing—original draft. YC: Conceptualization, software, funding acquisition, writing-review and editing. ZHZ: methodology, software. NW: writing-review. DC: writing-review and funding acquisition. All authors contributed to the article and approved the submitted version.
This study is financially supported by the National Natural Science Foundation of China (No. 41776050, No. 41776080, and No. 91858208).
The authors declare that the research was conducted in the absence of any commercial or financial relationships that could be construed as a potential conflict of interest.
All claims expressed in this article are solely those of the authors and do not necessarily represent those of their affiliated organizations, or those of the publisher, the editors and the reviewers. Any product that may be evaluated in this article, or claim that may be made by its manufacturer, is not guaranteed or endorsed by the publisher.
Chen G.-J., Guo T.-M. (1998). A new approach to gas hydrate modelling. Chem. Eng. J. 71 (2), 145–151. doi: 10.1016/S1385-8947(98)00126-0
Chen G. J., Sun C.-Y., Guo T. M. (2002). A new technique for separating (hydrogen + methane) gas mixtures using hydrate technology. In: Proceedings of the 4th International Conference on Gas Hydrates. (Yokohama, Japan), pp. 1016–1020.
Coveney R. M. Jr., Goebel E. D., Zeller E. J., Dreschhoff G. A. M., Angino E. E. (1987). Serpentinization and the origin of hydrogen gas in Kansas1. AAPG. Bull. 71 (1), 39–48. doi: 10.1306/94886D3F-1704-11D7-8645000102C1865D
Deiters U. K. (2013). Comments on the modeling of hydrogen and hydrogen-containing mixtures with cubic equations of state. Fluid. Phase. Equilibria. 352, 93–96. doi: 10.1016/j.fluid.2013.05.032
Dendy Sloan E., Koh C. (2007). Clathrate hydrates of natural gases, third edition. (CRC Press). 20074156.
Duan Z., Mao S. (2006). A thermodynamic model for calculating methane solubility, density and gas phase composition of methane-bearing aqueous fluids from 273 to 523 K and from 1 to 2000 bar. Geochim. Cosmochim. Acta 70 (13), 3369–3386. doi: 10.1016/j.gca.2006.03.018
Duan Z., Sun R. (2006). A model to predict phase equilibrium of CH4 and CO2 clathrate hydrate in aqueous electrolyte solutions. Am. Mineralog. 91 (8-9), 1346–1354. doi: 10.2138/am.2006.2017
Dyadin Y. A., Larionov E. G., Manakov A. Y., Zhurko F. V., Aladko E. Y., Mikina T. V, et al. (1999). Clathrate hydrates of hydrogen and neon. Mendeleev. Commun. 9 (5), 209–210. doi: 10.1070/MC1999v009n05ABEH001104
Felmy A. R., Weare J H J G E C A. (1986). The prediction of borate mineral equilibria in natural waters: application to searles lake, California. Geochimica et Cosmochimica Acta50, 12, 2771–2783. doi: 10.1016/0016-7037(86)90226-7
Gao J., Sun Q., Xu Z., Zhang Y., Wang Y., Guo X., et al. (2022). Modelling the hydrate formation condition in consideration of hydrates structure transformation. Chem. Eng. Sci. 251, 117487. doi: 10.1016/j.ces.2022.117487
Grim R. G., Kerkar P. B., Shebowich M., Arias M., Sloan E. D., Koh C. A., et al. (2012). Synthesis and characterization of sI clathrate hydrates containing hydrogen. J. Phys. Chem. C. 116 (34), 18557–18563. doi: 10.1021/jp307409s
Harvie C. E., Møller N., Weare J. H. (1984). The prediction of mineral solubilities in natural waters: the Na-K-Mg-Ca-H-Cl-SO4-OH-HCO3-CO3-CO2-H2O system to high ionic strengths at 25°C. Geochimica et Cosmochimica Acta 48, 4, 723–751. doi: 10.1016/0016-7037(84)90098-X
Hashimoto S., Murayama S., Sugahara T., Sato H., Ohgaki K. (2006). Thermodynamic and raman spectroscopic studies on H2 + tetrahydrofuran +water and H2+ tetra-n-butyl ammonium bromide +water mixtures containing gas hydrates. Chem. Eng. Scie. 61 (24), 7884–7888. doi: 10.1016/j.ces.2006.09.039
Holder G. D., Corbin G., Papadopoulos K. D. (1980). Thermodynamic and molecular properties of gas hydrates from mixtures containing methane, argon, and krypton. Ind. Eng. Chem. Fundamentals. 19 (3), 282–286. doi: 10.1021/i160075a008
Holder G. D., Stephenson J. L., Joyce J. J., John V. T., Kamath V. A., Malekar S. (1983). Formation of clathrate hydrates in hydrogen-rich gases. Ind. Eng. Chem. Process. Design. Dev. 22 (1), 170–171. doi: 10.1021/i200020a029
Holm N. G., Oze C., Mousis O., Waite J. H., Guilbert-Lepoutre A. (2015). Serpentinization and the formation of H2 and CH4 on celestial bodies (Planets, moons, comets). Astrobiology 15 (7), 587–600. doi: 10.1089/ast.2014.1188
Hulme S., Wheat C., Fryer P., Mottl M. (2010). Pore water chemistry of the Mariana serpentinite mud volcanoes: a window to the seismogenic zone. Geochem. Geophys. Geosyst. - GEOCHEM. GEOPHYS. GEOSYST. 11, Q01X09. doi: 10.1029/2009GC002674
Klauda J., Sandler S. (2003). Phase behavior of clathrate hydrates: a model for single and multiple gas component hydrates and multiple gas component hydrates Chem. Engin. Sci. 58(1), 27–41. doi: 10.1016/S0009-2509(02)00435-9
Johnson J. E., Mienert J., Plaza-Faverola A., Vadakkepuliyambatta S., Knies J., Bünz S., et al. (2015). Abiotic methane from ultraslow-spreading ridges can charge Arctic gas hydrates. Geology 43 (5), 371–374. doi: 10.1130/G36440.1
Li X., Fan S., Wang Y., Li G., Wang S., Lang X., et al. (2022). Hydrate phase equilibrium of hydrogen-natural gas blends: experimental study and thermodynamic modeling. Fluid. Phase. Equilibria. 556. doi: 10.1016/j.fluid.2022.113417
Ma Q.-L., Chen G.-J., Sun C.-Y., Yang L. -Y., Liu B. (2013). Predictions of hydrate formation for systems containing hydrogen. Fluid. Phase. Equilibria. 358, 290–295. doi: 10.1016/j.fluid.2013.08.019
Mao W. L., Mao H.-k., Goncharov A. F., Struzhkin V. V., Guo Q., Hu J., et al. (2002). Hydrogen clusters in clathrate hydrate. Science 297 (5590), 2247–2249. doi: 10.1126/science.1075394
Matsumoto Y., Grim R. G., Khan N. M., Sugahara T., Ohgaki K., Sloan E. D., et al. (2014). Investigating the thermodynamic stabilities of hydrogen and methane binary gas hydrates. J. Phys. Chem. C. 118 (7), 3783–3788. doi: 10.1021/jp411140z
McCollom T. M., Bach W. (2009). Thermodynamic constraints on hydrogen generation during serpentinization of ultramafic rocks. Geochim. Et. Cosmochim. Acta 73 (3), 856–875. doi: 10.1016/j.gca.2008.10.032
Monnin C. (1990). The influence of pressure on the activity coefficients of the solutes and on the solubility of minerals in the system Na-Ca-Cl-So4-H2o to 200°C and 1 kbar and to high nacl concentration. Geochim. Cosmochim. Acta 54, 3265–3282. doi: 10.1016/0016-7037(90)90284-R
Ng H. J., Robinson D. B. (1976). The measurement and prediction of hydrate formation in liquid hydrocarbon-water systems. Ind.eng.chem.fundam 15 (4), 293–298. doi: 10.1021/i160060a012
Pang J., Ng H.-J., Zuo J., Zhang D., Ma Q., Chen G. (2012). Hydrogen gas hydrate–measurements and predictions. Fluid. Phase. Equilibria. 316, 6–10. doi: 10.1016/j.fluid.2011.12.006
Peng D. Y., Robinson D. B. (1970). A new two-constant equation of state. Ind. Eng. Chem. Fundamentals. 15 (1), 3069–3078. doi: 10.1021/i160057a011
Pitzer K. S. (1975). Thermodynamics of electrolytes. v. effects of higher-order electrostatic terms. J. Solution. Chem. 4 (3), 249–265. doi: 10.1007/BF00646562
Pitzer K. S., Silvester L. F. (1976). Thermodynamics of electrolytes. VI. weak electrolytes including H3PO4. J. Solution. Chem. 5 (4), 269–278. doi: 10.1007/BF00645465
Privat R., Jaubert J.-N. (2013). Classification of global fluid-phase equilibrium behaviors in binary systems. Chem. Eng. Res. Design. 91 (10), 1807–1839. doi: 10.1016/j.cherd.2013.06.026
Proskurowski G., Lilley M. D., Seewald J. S., Fruh-Green G. L., Olson E. J., Lupton J. E., et al. (2008). Abiogenic hydrocarbon production at lost city hydrothermal field. Science 319 (5863), 604–607. doi: 10.1126/science.1151194
Rajan A., Mienert J., Bünz S., Chand S. (2012). Potential serpentinization, degassing, and gas hydrate formation at a young (<20 ma) sedimented ocean crust of the Arctic ocean ridge system. J. Geophys. Res.: Solid. Earth 117 (B3). doi: 10.1029/2011JB008537
Salisbury M. H., Shinohara M., Richter C., Araki E., Barr S. R., D'Antonio M., et al. (2002). Proceedings of the ocean drilling program, initial reports, Vol. 195.
Skiba S. S., Larionov E. G., Manakov A. Y., et al. (2007). Investigation of hydrate formation in the system H2–CH4–H2O at a pressure up to 250 MPa. J. Phys. Chem. B. 111 (38), 11214–11220. doi: 10.1021/jp072821x
Spencer R. J., Møller N., Weare J. H. (1990). The prediction of mineral solubilities in natural waters: a chemical equilibrium model for the Na-k-. doi: 10.1016/0016-7037(90)90354-N
Sun R., Duan Z. (2007). An accurate model to predict the thermodynamic stability of methane hydrate and methane solubility in marine environments. Chem. Geol. 244 (1-2), 248–262. doi: 10.1016/j.chemgeo.2007.06.021
Waals J. H. V. D., Platteeuw J. C. (2007). “Clathrate solutions,” in Advances in chemical physics. Prigogine (Ed.). 1–57. doi: 10.1002/9780470143483.ch1
Wan Z.-F., Zhang W., Ma C., Liang J.-Q., Li A., Meng D.-J., et al. (2022). Dissociation of gas hydrates by hydrocarbon migration and accumulation-derived slope failures: an example from the south China Sea. Geosci. Front. 13 (2), 101345. doi: 10.1016/j.gsf.2021.101345
Wang X.-H., Qin H.-B., Dandekar A., et al. (2015). Hydrate phase equilibrium of H2/CH4/CO2 ternary gas mixtures and cage occupancy percentage of hydrogen molecules. Fluid. Phase. Equilibria. 403, 160–166. doi: 10.1016/j.fluid.2015.06.020
Zhang S. -X., Chen G. -J., Ma C. -F., Yang L., Guo T. -M. (2000). Hydrate formation of hydrogen + hydrocarbon gas mixtures. J. Chem. Eng. Data. 45 (5), 908–911. doi: 10.1021/je000076a
Keywords: serpentinization, hydrogen gas, methane gas, gas hydrate, phase equilibrium
Citation: Zhu Z, Cao Y, Zheng Z, Wu N and Chen D (2023) A model to predict the thermodynamic stability of abiotic methane-hydrogen binary hydrates in a marine serpentinization environment. Front. Mar. Sci. 10:1140549. doi: 10.3389/fmars.2023.1140549
Received: 09 January 2023; Accepted: 13 June 2023;
Published: 30 June 2023.
Edited by:
Davide Oppo, University of Louisiana at Lafayette, United StatesReviewed by:
Renbiao Tao, Center for High Pressure Science and Technology Advanced Research, ChinaCopyright © 2023 Zhu, Cao, Zheng, Wu and Chen. This is an open-access article distributed under the terms of the Creative Commons Attribution License (CC BY). The use, distribution or reproduction in other forums is permitted, provided the original author(s) and the copyright owner(s) are credited and that the original publication in this journal is cited, in accordance with accepted academic practice. No use, distribution or reproduction is permitted which does not comply with these terms.
*Correspondence: Yuncheng Cao, eWNjYW9Ac2hvdS5lZHUuY24=
Disclaimer: All claims expressed in this article are solely those of the authors and do not necessarily represent those of their affiliated organizations, or those of the publisher, the editors and the reviewers. Any product that may be evaluated in this article or claim that may be made by its manufacturer is not guaranteed or endorsed by the publisher.
Research integrity at Frontiers
Learn more about the work of our research integrity team to safeguard the quality of each article we publish.