 Wenhan Niu1
 Hongliang Li
 Jianfang Chen
 Yong Zhu
- 1Key Laboratory of Marine Ecosystem Dynamics, Second Institute of Oceanography, Ministry of Natural Resources, Hangzhou, China
- 2Southern Marine Science and Engineering Guangdong Laboratory (Zhuhai), Zhuhai, China
Nitrate is the main form of dissolved inorganic nitrogen, playing an important role in both marine biogeochemical research and water environment management. In this work, the most commonly used coppered cadmium column was modified and a novel on-line Cu/Cd column with a spiral structure coupled with a de-bubbling device and syringe-type filter was developed. With the advantages of convenience, portability, stability, and high reduction efficiency, the interference of air bubbles in the column could easily be avoided. Based on the classic Griess reaction, a simple reverse flow injection system coupled with a novel Cu/Cd column and custom-made flow cell was established for the field spectrophotometric determination of nitrate in seawater. The effects of certain reaction parameters—including the reagent concentration, flow rate, length of the Cu/Cd column, and salinity—were investigated, optimized, and compared with pure water, with an approximate 9% increase in the sensitivity of seawater samples. This method exhibited a detection limit of 0.03 μmol/L, with a relative standard deviation of 0.6%, and the working range was 20 μmol/L before dilution. Compared to the referred vanadium reduction method based on the same flow system, the proposed method showed significant advantages including sensitivity and reproducibility. No significant difference was observed between the analytical seawater sample results obtained by the proposed and reference methods. Furthermore, the proposed method was validated by the first class of National Certified Reference Materials and successfully applied to the nitrate determination of Wenling coastal seawater (Zhejiang, China).
1 Introduction
Nitrogen, as one of the essential elements in marine biogeochemical research, is present in various forms (Paerl, 2018; Seceh et al., 2021); nitrate, nitrite, and ammonium are the most common inorganic forms of dissolved inorganic nitrogen in marine ecosystems (Bristow et al., 2017). Compared to other nitrogen species in seawater, nitrate is the principal form of fixed dissolved inorganic nitrogen assimilated by organisms (Patey et al., 2008), controlling primary productivity to a certain degree (Canfield et al., 2010). Therefore, the measurement of nitrate is essential for improving the scientific understanding of biogeochemical nutrient processes. However, accelerated eutrophication occurs in fresh water and marine ecosystems due to a large amount of nitrate discharged into coastal water as a result of anthropogenic activity, resulting in various environmental problems including eutrophication, hypoxia, and enhanced acidification (Howarth, 2008; Paerl, 2018; Fang et al., 2021). In addition, nitrate can be readily reduced to nitrite in-vivo, interfering with the body’s oxygen transport mechanism via the irreversible conversion of hemoglobin to methemoglobin (Singh et al., 2019). Higher concentrations of nitrate are toxic and can lead to methemoglobinemia in aquatic animals (Yu et al., 2021) and blue syndrome in human infants with the excessive intake of nitrate via drinking water (Jiang et al., 2020). Thus, monitoring nitrate concentration in seawater is meaningful for both scientific research and water environment management.
The accurate measurement of nitrate is still a major challenge, although various nitrate determination methods have been proposed including spectrophotometric, chemiluminescent, electrochemical, chromatographic, capillary electrophoretic, and spectrofluorimetric methods, which have been summarized in several comprehensive reviews (Wang et al., 2017; Alahi et al., 2018; Singh et al., 2019; Jiang et al., 2020). Among all methods, the spectrophotometric method is by far the most widely used for nitrate determination due to its simplicity and inexpensive analytical feasibility (Wang et al., 2017). The most popular spectrophotometric method for nitrite determination is based on the classic Griess reaction, which was first reported in 1879 (Griess, 1879). The reaction was modified several times and subsequently became the commonly used Griess reaction, which has been specifically used for nitrite determination. The main reaction principle occurs under acidic conditions, where nitrite is diazotized with sulfanilamide (SAM) and coupled with N-(1-naphthyl) ethylenediamine dihydrochloride (NED) to form a pink azo dye, measured at an absorbance of 520–540 nm (Becker et al., 2020). Meanwhile, the modified Griess reaction has also been widely used for nitrate determination by reducing nitrate to nitrite before the diazotization reaction. Since the modified Griess reaction was developed into a very mature, reliable, and widely accepted method, the reduction efficiency and stability of nitrate to nitrite have become crucial step in accurate nitrate measurements (García-Robledo et al., 2014). A reduction efficiency value above 95% has typically been required to achieve almost all nitrate reduction. Various types of reductants such as coppered cadmium column (Feng et al., 2013), zinc column (Ellis et al., 2011), hydrazine sulfate (Pons et al., 2008), titanium trichloride (Foreman et al., 2016), UV radiation (Machado et al., 2017), and vanadium (III) chloride (VCl3) (Schnetger and Lehners, 2014) have been reported for nitrate analysis in environmental samples. However, no reduction method is perfect and without disadvantages. Almost every reduction method has its own shortcomings, such as being time-consuming, variations in the efficiency of the column, potential metal toxicity, variations in reduction efficiency with different matrices, easy accumulation of air bubbles, violet and absorbing light in the same range as pink azo dye, interference from ions and organic matter, and a long irradiation time (García-Robledo et al., 2014; Wang et al., 2017). Although the VCl3 reduction method has been frequently reported in recent years, with the advantage of decreased toxicity (Lin et al., 2019; 2020; 2022), the coppered cadmium (Cu/Cd) reduction method is still the most commonly used reduction technique for nitrate determination (Singh et al., 2019). Since the cadmium column was first used in seawater for nitrate determination in 1967 (Wood et al., 1967), the application of the Cu/Cd column has been widely promoted not only in commercial instruments but also in new development methods or instruments (Nugraha and Ridwan, 2019; Khongpet et al., 2020). In the cadmium granule coppered process, cadmium is oxidized to the Cd2+ cation, and Cu2+ is reduced to metallic copper, which precipitates on the cadmium surface as a porous coating layer (Pons et al., 2008). This Cu/Cd reduction method results in a galvanic cell, with copper as the cathode and cadmium as the anode. The nitrate reduction process follows:
With the development of the flow analysis technique, flow-based methodologies for automated nitrate measurement have been widely used for seawater analysis. Flow-based methodologies have the advantage of not only permitting automated analysis but can also improve sensitivity and reproducibility while providing the possibility of miniaturization and portability (Zhu et al., 2019). Therefore, higher requirements have been put forward for the on-line application of the Cu/Cd column. To apply flow analysis, the Cu/Cd column is usually custom-made using a straight or U-shaped quartz tube (Feng et al., 2013). The diameter of the column should be small enough to minimize the effect of solution diffusion, and the length of the column should be sufficiently long to ensure reduction efficiency. To improve the reduction efficiency and facilitate the rapid removal of incoming air bubbles from the column, the Cu/Cd column should be placed vertically to allow the incoming solution to flow from the lower end to the upper end. However, Cu/Cd columns made using quartz with a long length can be easily broken during long-distance transport or poor investigation conditions. Furthermore, unstable reduction efficiency and the easy accumulation of air bubbles severely limit the application of traditional Cu/Cd columns. To overcome these limitations, great efforts have been made to improve and modify the reductant (Zhang et al., 2000). However, most studies have focused on changing the reductant, and fewer studies have investigated modifying the classical Cu/Cd column.
The aim of this study was to develop a novel on-line Cu/Cd column with a spiral structure for field applications, which had the advantages of stable reduction efficiency, portability, a shortened length of the entire reduction device, and elimination of the influence of air bubbles. The consumption of Griess reagents was minimized by using a reverse flow injection analysis (rFIA) system. Based on the modified classic Griess reaction, we described a simple reverse flow injection analysis method that utilized a novel on-line Cu/Cd reduction column for the field determination of nitrate in seawater. Subsequently, a stable reduction efficiency higher than 95% was obtained. The proposed method was also compared with the frequently reported VCl3 reduction method, and the modified method was used for the field determination of nitrate in coastal seawater.
2 Experimental
2.1 Reagents and solutions
All chemicals were analytical grade and purchased from Sinopharm Chemical Reagent Co., China unless stated otherwise. All solutions were prepared with pure water (18.20 MΩ·cm) collected from a Millipore water purification system (Millipore, MA, USA). All containers and bottles used in the experiment were pre-cleaned by soaking in 2 mol/L HCl solution for at least 24 h, followed by thorough rinsing with pure water. The nitrate and nitrite stock solutions (both at 100 mmol/L) were prepared by dissolving oven-dried (105°C for 2 h) solid potassium nitrate and sodium nitrite in pure water, which was stored at 4°C in a refrigerator. The working standards were prepared through daily appropriate dilution of the stock solutions. The SAM solution was prepared by dissolving 1.5 g of SAM in 1000 mL of 0.5% mol/L HCl solution, and 0.15 g/L of NED solution was prepared by dissolving 0.15 g of NED in 1000 mL of pure water. The NH4Cl buffer solution was prepared by adding 10 g of NH4Cl into 1000 mL of pure water and the pH of the solution was adjusted to 8.1 with 50% (v/v) NH3·OH solution. All reagents for the VCl3 reduction method were prepared according to a previously reported method (Lin et al., 2022). Aged surface oligotrophic seawater was collected from the Indian Ocean, and the first class of National Certified Reference Materials (GBW08634-GBW08637) was used to validate the proposed method.
2.2 Preparation of the novel spiral type Cu/Cd column
The novel spiral type Cu/Cd column was custom-made, consisting of a spiral quartz tube 17 cm in length and an inner diameter of 3.0 mm, which was filled with coppered cadmium granules (Shanghai Xinhu experimental equipment Co., China) between 0.3–0.8 mm in diameter. The two ends of the spiral type Cu/Cd column were plugged with glass wool to prevent the outflow of cadmium particles. In addition, a retraction design was added at the outlet of the quartz tube to prevent the glass wool from being washed away during the long running process. However, even with the block of glass wool and the retraction design, it was inevitable that some small cadmium particles would be washed into the detection flow cell and ultimately affect the measurement results. Thus, an on-line syringe-type filter with a 0.45 μm pore-size related to the outlet of the column was used. Small air bubbles could be easily generated in the flow analysis system, and the convergence of these air bubbles into the Cu/Cd column would seriously reduce the reduction efficiency and affect the stability of the reduction rate. Therefore, to minimize the effect of small air bubbles in the Cu/Cd column, a de-bubbling device (Pengzan Biotechnology Co., Shanghai, China) was added to the inlet of the column. The entire Cu/Cd column was then filled with the NH4Cl buffer solution before and after use.
2.3 Instruments and procedures
A schematic diagram of the manifold design for nitrate determination in seawater is shown in Figure 1. The flow system consisted of two peristaltic pumps (Baoding Longer Precision Pump Co., Hebei, China), with an 8-position selector valve and a 6-port injection valve (Valco Instruments Co., Louisiana, USA), a miniature STS-VIS spectrophotometer (Ocean Optics Inc., Florida, USA), and a custom-made flow cell with a 3 cm path length (Jiangsu Yixing Spectral Analytical Optical Element Factory, China). All manifold tubing consisted of 1.58 mm o.d. and 0.75 mm i.d. transparent polytetrafluoroethylene (PTFE) tubing, except for the peristaltic pump tubing, for which we used Tygon tubing. Standard flangeless PEEK fittings (1/4-28, IDEX Health & Science LLC, Wallingford, CT, USA) were used throughout the fluidic manifold construction. The detection signal was recorded by laboratory-programmed software written in LabVIEW (National Instruments, Austin, TX, USA).
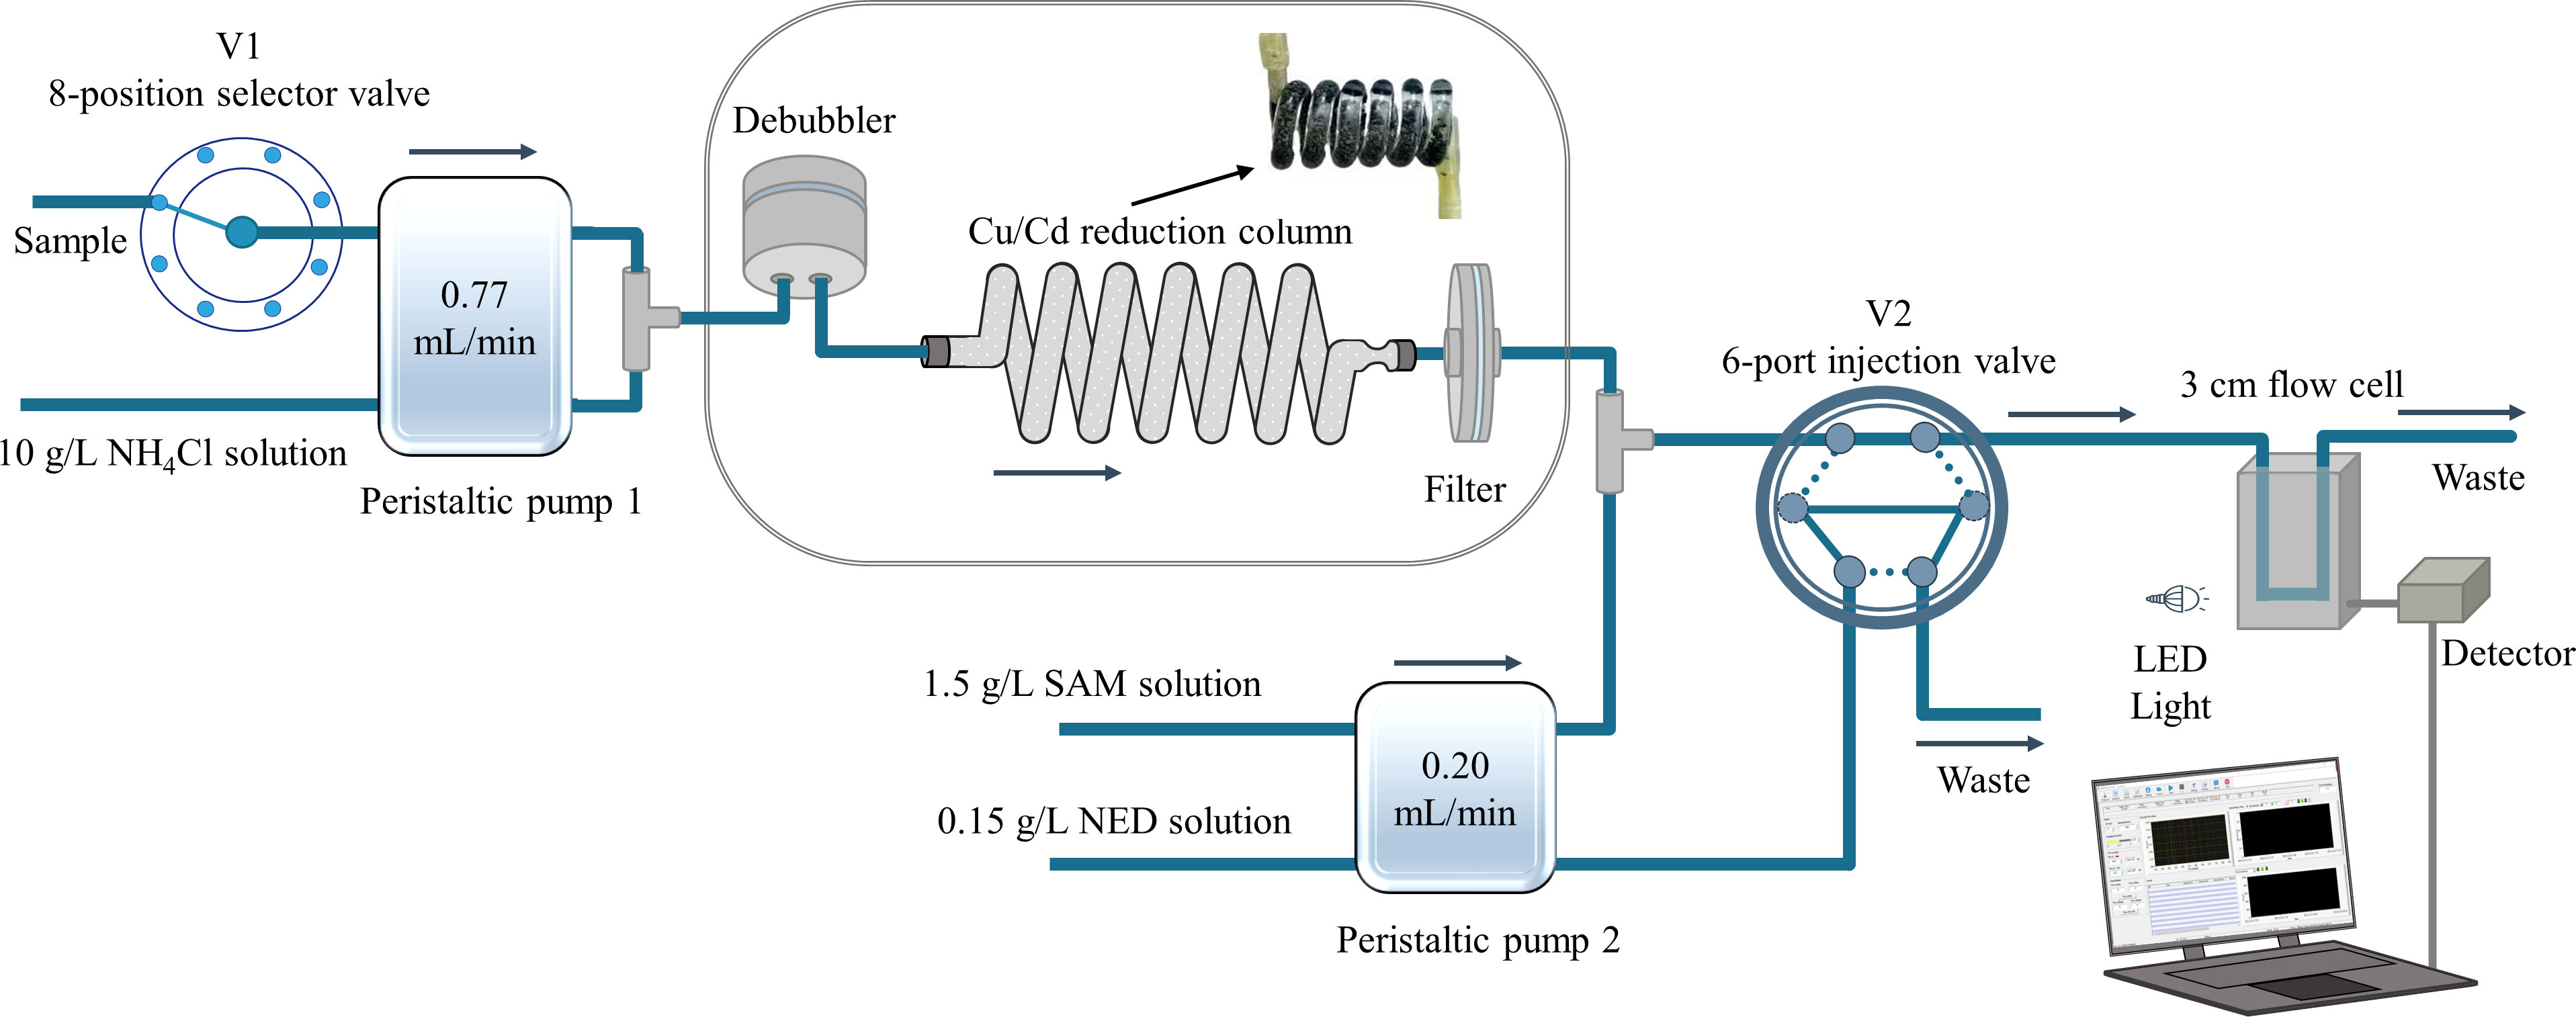
Figure 1 Schematic diagram of the reverse flow injection analysis system coupled with the novel spiral type Cu/Cd column for nitrate determination in seawater.
The flow analysis program is shown in Supplementary Table 1. In step 1, the sample was mixed with NH4Cl buffer solution by pump 1 and transferred to the novel spiral type Cu/Cd column to reduce nitrate to nitrite. Then, the on-line stream was mixed with the SAM solution and delivered into the flow cell as a carrier stream. Meanwhile, the 6-port injection valve (V2) was switched to position A, and the color reagent NED was delivered and filled into the injection loop of V2 by pump 2. In step 2, by switching V2 to position B, a constant volume of NED solution was injected into the carrier stream and reacted in the mixing coil, forming the pink azo dye, which was delivered to the flow cell and detected at 540 nm with a reference wavelength of 700 nm.
2.4 Sample collection
Seawater samples, collected from the Wenling coastal area, Zhejiang Province, China in January 2021, were used for validation experiments. The collected samples from the surface seawater were filtered through a 0.45 μm membrane filter and then stored in acid-washed high-density polyethylene bottles. The samples were stored at -20°C and analyzed in lab. Temperature and salinity were recorded with a CTD (RBR Ltd., Canada). The concentration of phosphate in the surface seawater was measured with a AutoAnalyzer 3 HR (SEAL Analytical Ltd., UK).
3 Results and discussion
3.1 Parameter optimization
To establish the best conditions for the field determination of nitrate in seawater, the main factors affecting the flow system, including the reagent concentrations and flow rates of the two different peristaltic pumps, were investigated, based on a univariate experimental design. A standard solution of 10 μmol/L of nitrate was used as the testing sample for the parameter optimization experiment. Each sample was quantified three times, and the results are shown in Figure S1.
The effect of SAM concentration in the range of 0.5–2.5 g/L on the peak height was investigated. As shown in Figure S1(a), the absorbance signal increased with increasing SAM concentration from 0.5 to 1.5 g/L. Because the signal reached a plateau when the SAM concentration was between 1.5 g/L and 2.5 g/L, a concentration of 1.5 g/L for SAM was chosen in this study. The concentration of NED varied in the range of 0.05 g/L to 0.25 g/L and the results are shown in Figure S1(b). The peak height increased throughout the entire NED concentration range and slowly increased up to 0.15 g/L. Taking the balance of peak height and blank into consideration, a NED concentration of 0.15 g/L was selected.
The influence of the sample flow rate and NH4Cl solution ranging from 0.28 mL/min to 0.98 mL/min on the signal intensity was determined, as illustrated in Figure S1(c). The peak height increased between 0.28 mL/min and 0.35 mL/min but decreased with a further increase in the flow rate. Considering the sample throughput and sensitivity, the sample and NH4Cl solution flow rate were selected as 0.77 mL/min. The flow rate of the reagents (SAM and NED) between 0.05 mL/min and 0.35 mL/min was evaluated for optimization (Figure S1(d)). We observed that there was no significant change with increased flow rate. Thus, to achieve a high sample throughput, a reagent flow rate of 0.20 mL/min was selected as the optimal condition.
3.2 Effect of the Cu/Cd column length
The reduction efficiency of the Cu/Cd column was the key point of the entire proposed method and the nitrate determination result was easily influenced (Garside, 1993). Because the inner diameter of the reduction column was set to 3.0 mm, to minimize the diffusion effects in flow analysis, the length of the column was important for the reaction efficiency. However, only a few studies have reported on the length effect of the reduction column (Lapa et al., 2000; Ellis et al., 2011). The influence of the length of the Cu/Cd column was evaluated in the range of 5 to 17 cm. The reduction efficiencies of the Cu/Cd column with different lengths were investigated using a standard nitrate solution and standard nitrite solution (both at 10 μmol/L). As shown in the inset of Figure 2, the reduction efficiency of the Cu/Cd column increased with increasing column length, reaching a plateau between 13 and 17 cm with a reduction efficiency of 98% to 102%. Therefore, in the proposed method, the length of the column should be longer than 13 cm, to ensure a reduction efficiency greater than 95%. In addition, a series of standard nitrate solutions in the range of 0–12 μmol/L was prepared and tested by using various lengths of the reduction column, and the results are illustrated in Figure 2. We observed that as the length of the column was increased from 5–15 cm, the slope of the calibration curve increased. However, the slope slowly decreased at a length of 17 cm, possibly due to increased back pressure (Ellis et al., 2011).
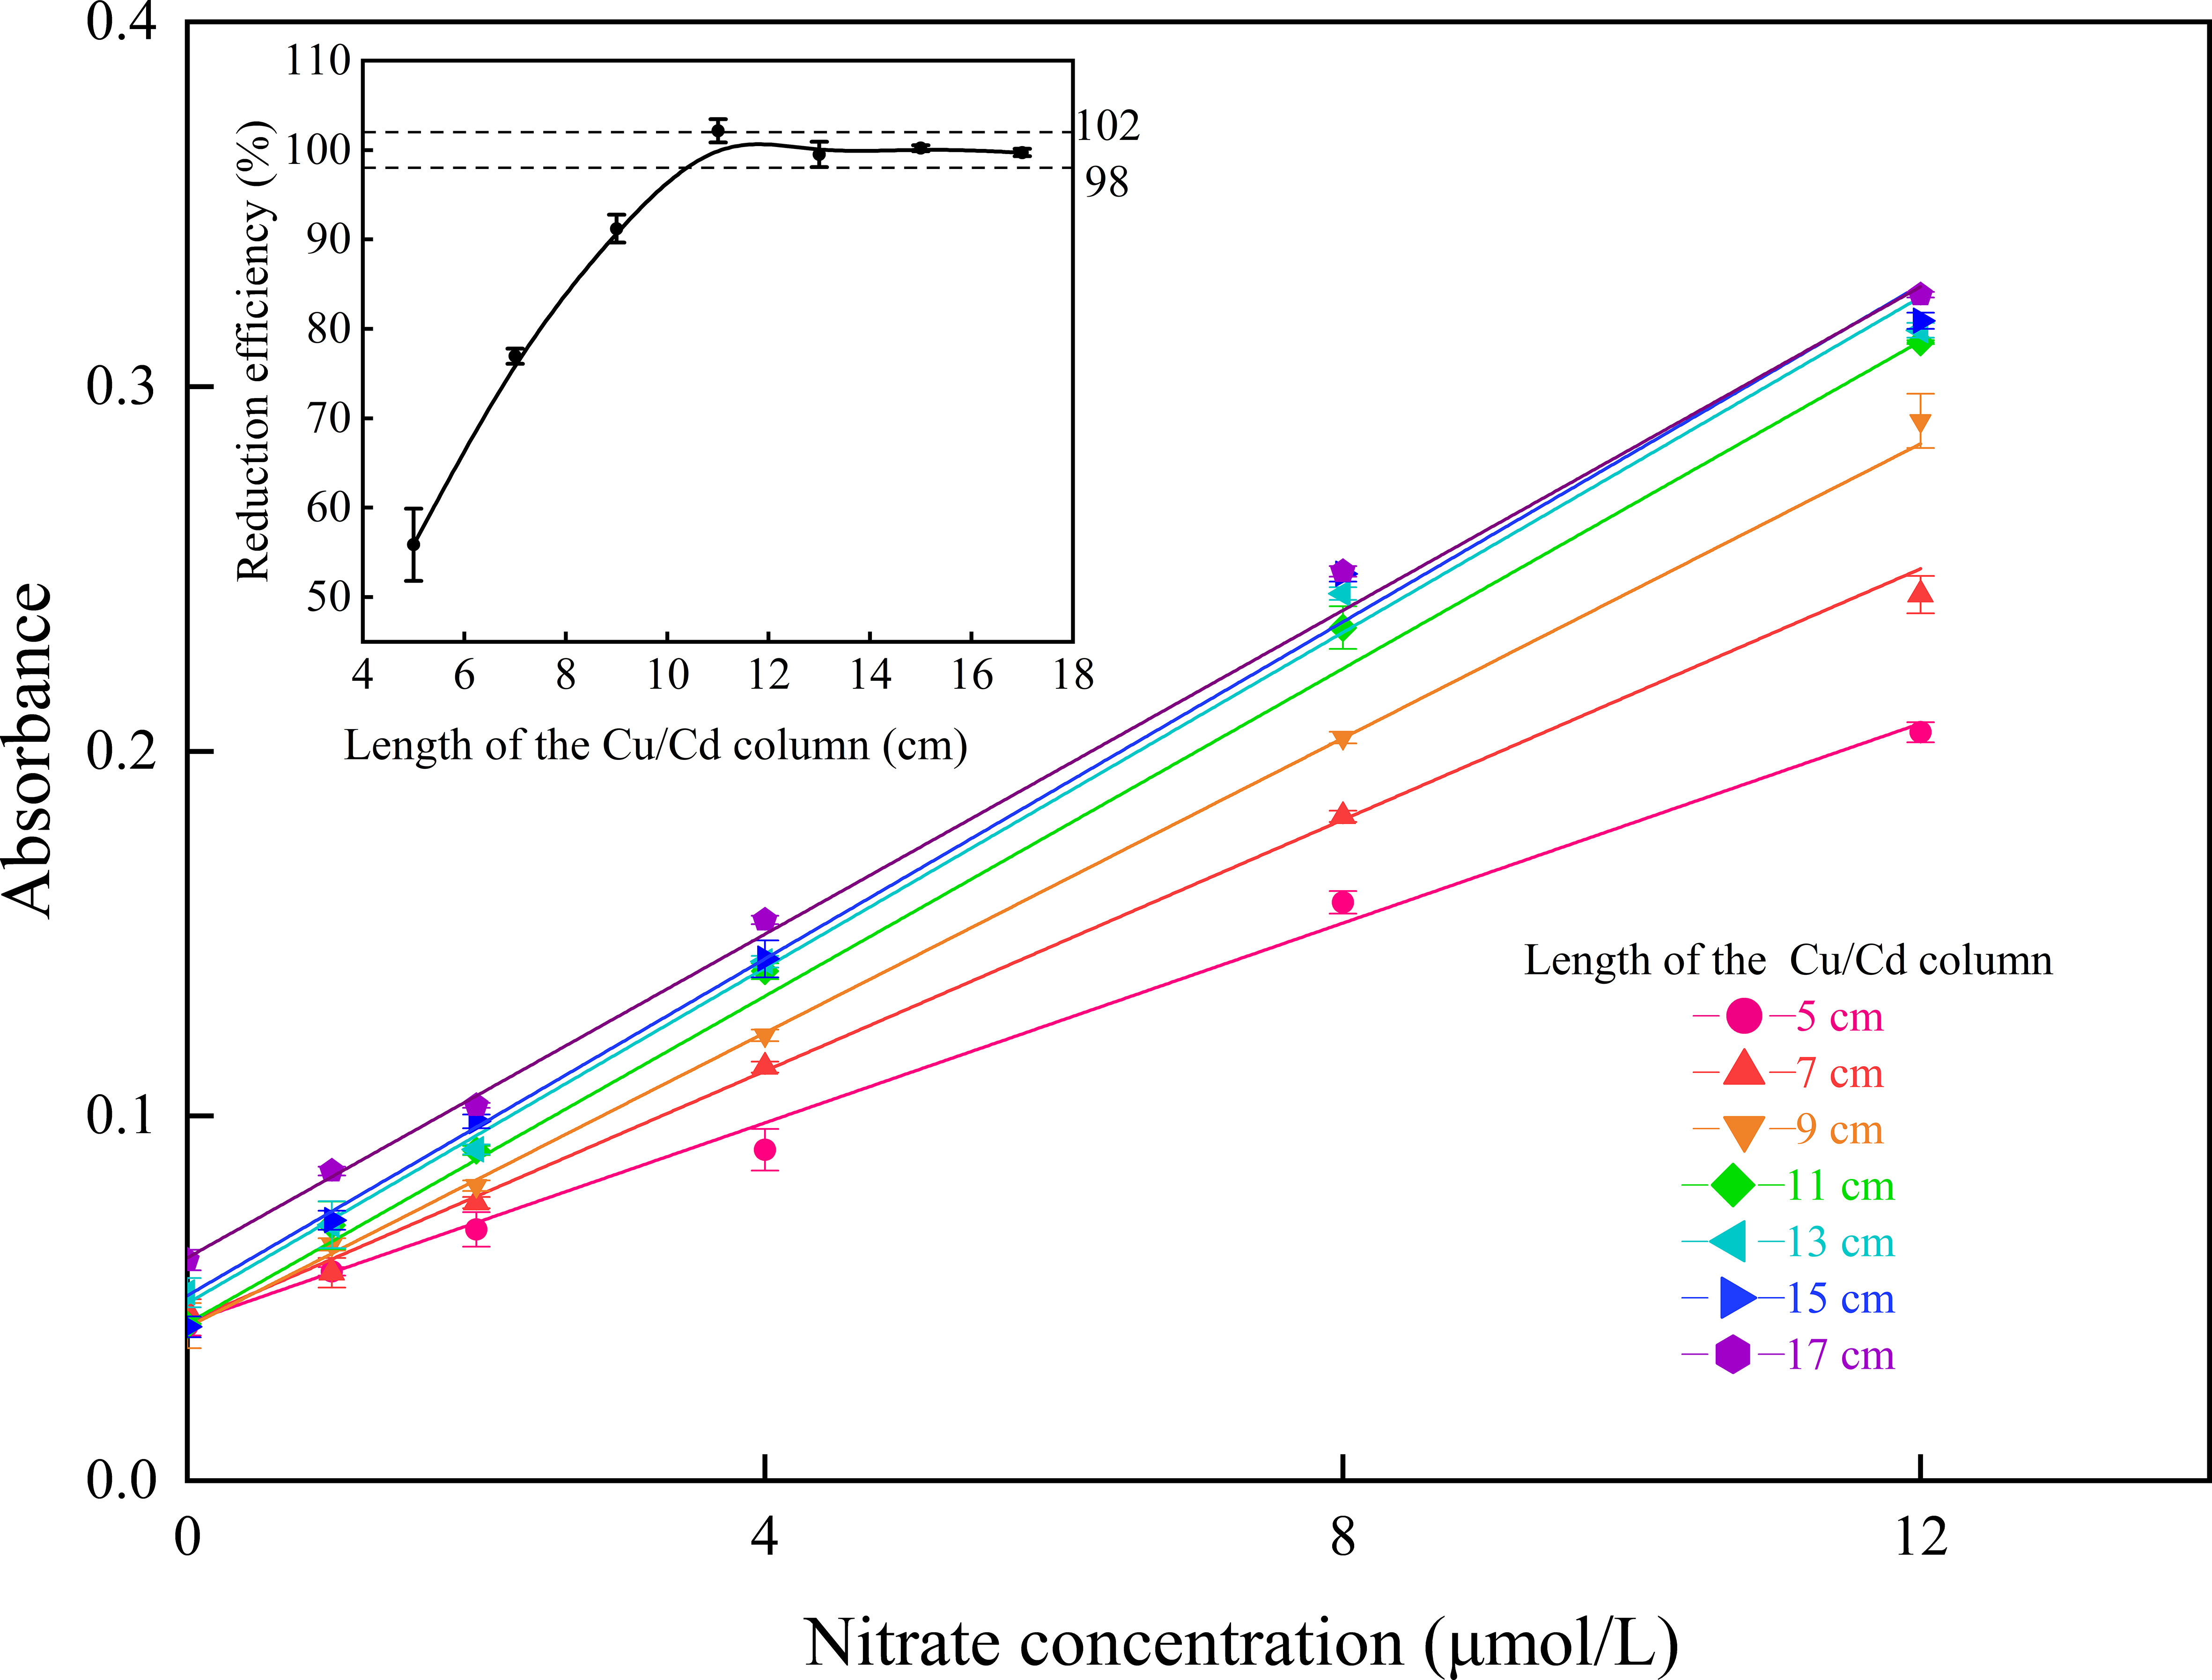
Figure 2 Calibration curves ranging from 0 to 12 μmol/L with different lengths of the Cu/Cd column (n=3), where the inset shows the variations in reduction efficiency with different column lengths.
3.3 Effect of sample salinity
Higher salinity corresponded to a larger ionic strength in the sample solution, which could affect the rate of the chemical reaction. Otherwise, the salinity differences between the seawater sample and carrier possibly resulted in the Schlieren effect due to the different refractive indices (Zhu et al., 2013). To investigate the salinity effect, several different seawater samples with various salinities of 0, 3.5, 7, 10.5, 14, 17.5, 21, 24.5, 28, 31.5, and 35 were prepared by diluting aged seawater collected from the surface of the Indian Ocean (salinity of open ocean seawater was almost constant at 35), with pure water as the matrix. Then, the calibration curves (ranging from 0 to 20 μmol/L) were obtained by spiking the nitrate standard solution into seawater solutions with different salinities. The relationship between the slope of the calibration curves and salinity is shown in Figure 3, indicating that the slope of the calibration curve increased with increasing sample salinity. In addition, compared to pure water, an approximately 9% increase in the sensitivity of the seawater sample was observed, which was possibly caused by the change in ion strength and the influence of the Cu/Cd column reduction process.
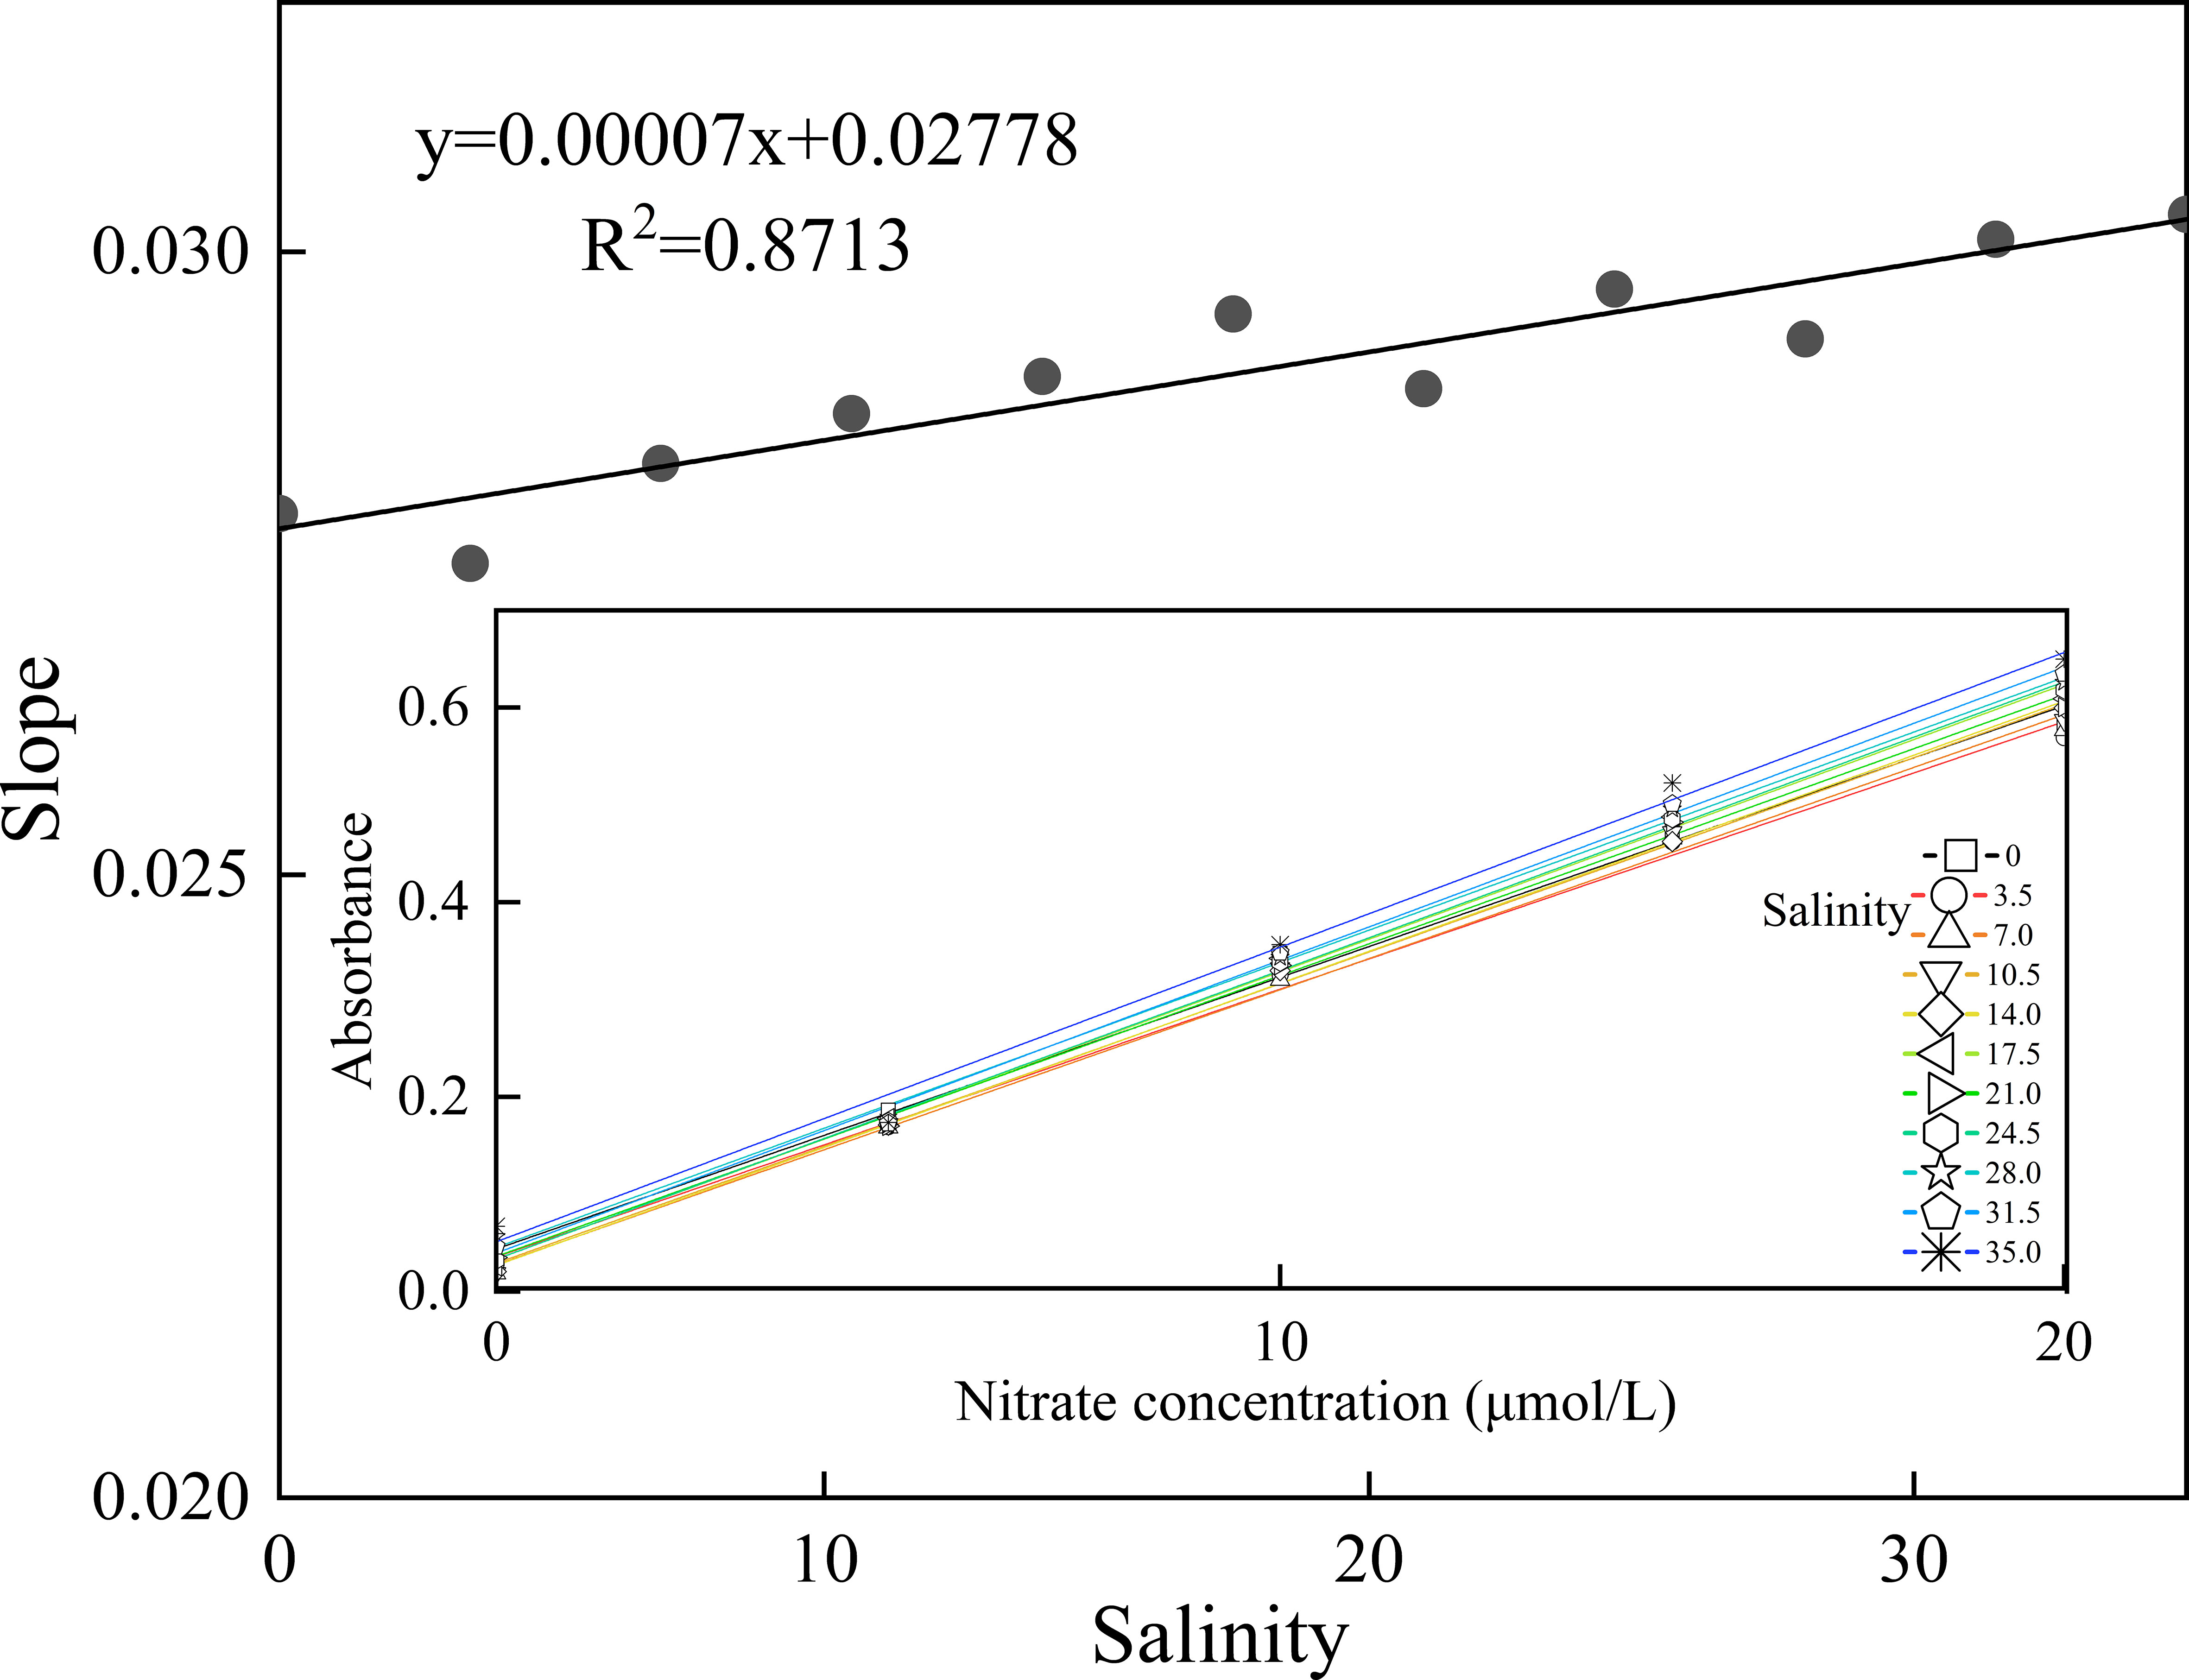
Figure 3 Relationship between the slope of the calibration curves and salinity, where the inset shows the calibration curves for nitrate in the samples with various salinities of 0, 3.5, 7, 10.5, 14, 17.5, 21, 24.5, 28, 31.5, and 35.
3.4 Analytical figures of merit and method validation
Under the chosen optimal conditions, the method detection limit, estimated as three times the standard deviation of the repeated blank measurements (n = 9), was 0.03 μmol/L. The reproducibility of the method was evaluated by repetitive determinations of a sample at a concentration of 15 μmol/L of nitrate. The results are shown in Figure S2, where the relative standard deviation was 0.6% (n = 9), indicating good precision. Sample throughput of 15 per hour was obtained with the proposed method, and typical output signals of the calibration curve ranging from 0 to 20 μmol/L were obtained, as shown in Figure 4. Regression equation was given by y=0.0267x (μmol/L) + 0.0012, with R2 = 0.9981 (n=5), where x is the concentration of nitrate plus nitrite and y denotes the absorbance. The accuracy was also verified by testing the primary first class of the National Certified Reference Materials (GBW08634-GBW08637), and the values measured by the proposed method were in good agreement with the certified material values.
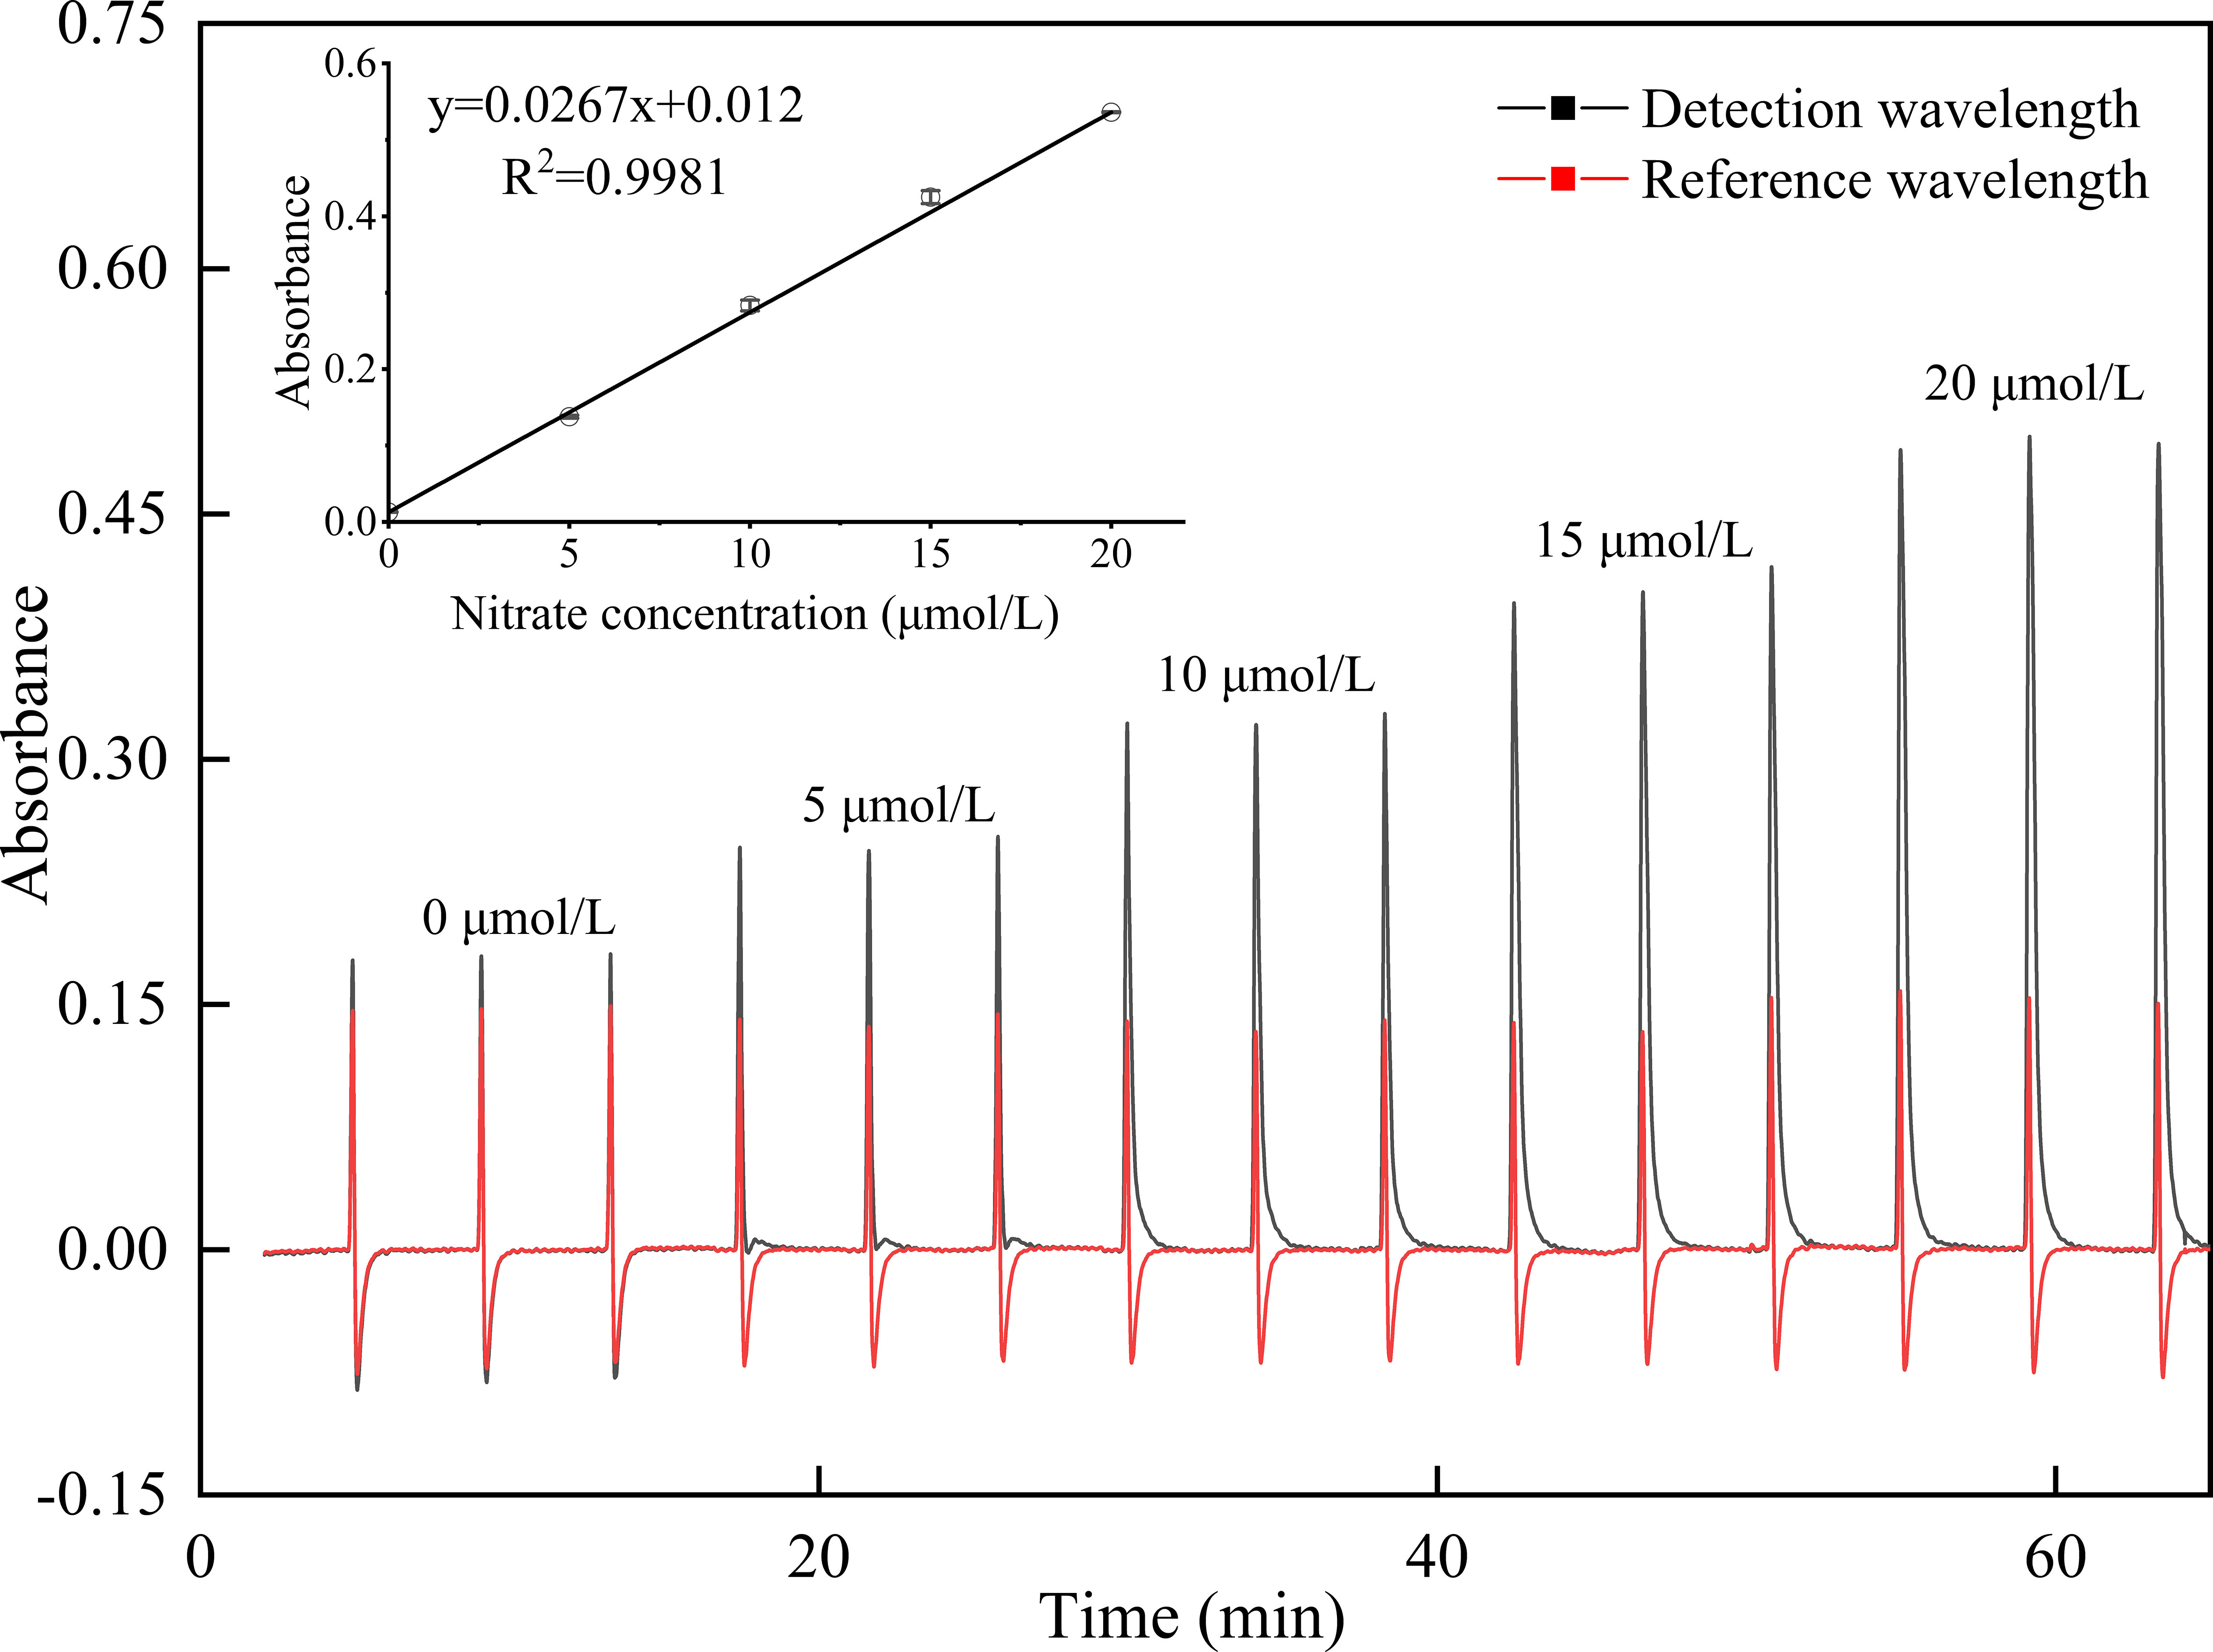
Figure 4 Typical output signals of the calibration curve ranging from 0 to 20 μmol/L for nitrate determination (n = 3), where the inset shows the calibration curve.
3.5 Comparison with the VCl3 reduction method
Several studies have previously reported on the determination of nitrate in estuarine and coastal waters (Lin et al., 2019; Singh et al., 2019; 2020). Therefore, a reverse flow injection analysis method coupled with VCl3 reduction for nitrate determination was established according to a previously reported study (Lin et al., 2022). An overall comparison of the analytical figures of merit between the proposed method and the VCl3 reduction method is summarized in Table 1. The MDL of the proposed method was lower than the VCl3 reduction method, where the slope of the calibration curve of the proposed method was higher than the VCl3 reduction method, indicating that the proposed method had more sensitivity. Furthermore, the intercept of the calibration curve with the proposed method was lower for the reagent used in the VCl3 reduction method, with a background color. To further investigate the viability of the proposed method with the novel spiral type Cu/Cd column, 17 seawater samples were analyzed with this method and the VCl3 reduction method. As shown in Figure 5, the results indicated no significant difference between the proposed method and the established reference method.
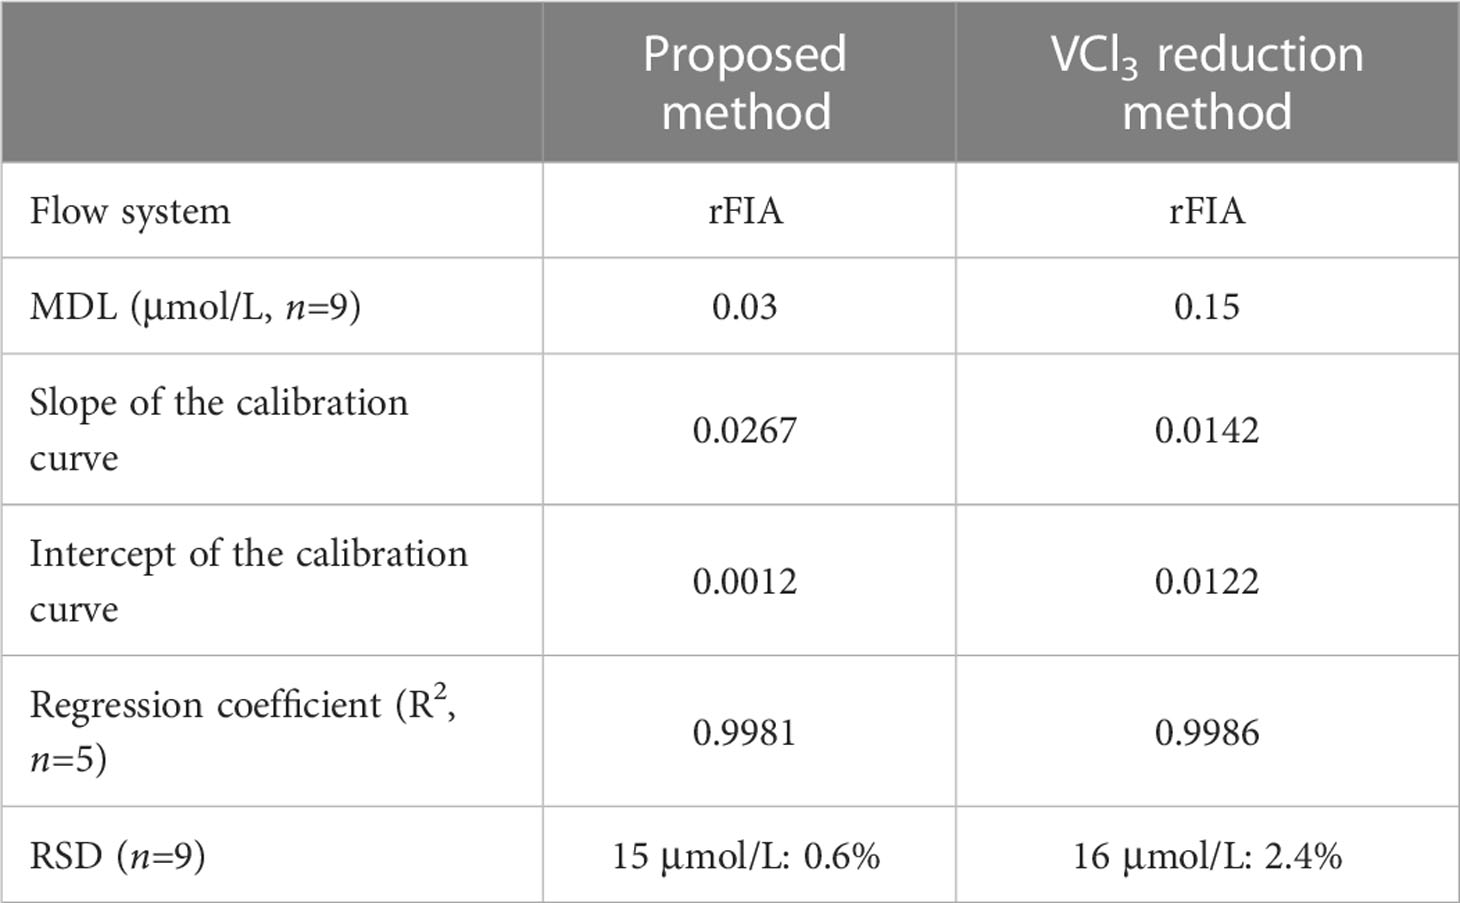
Table 1 Comparison of the analytical performance characteristics of the proposed method and the VCl3 reduction method.
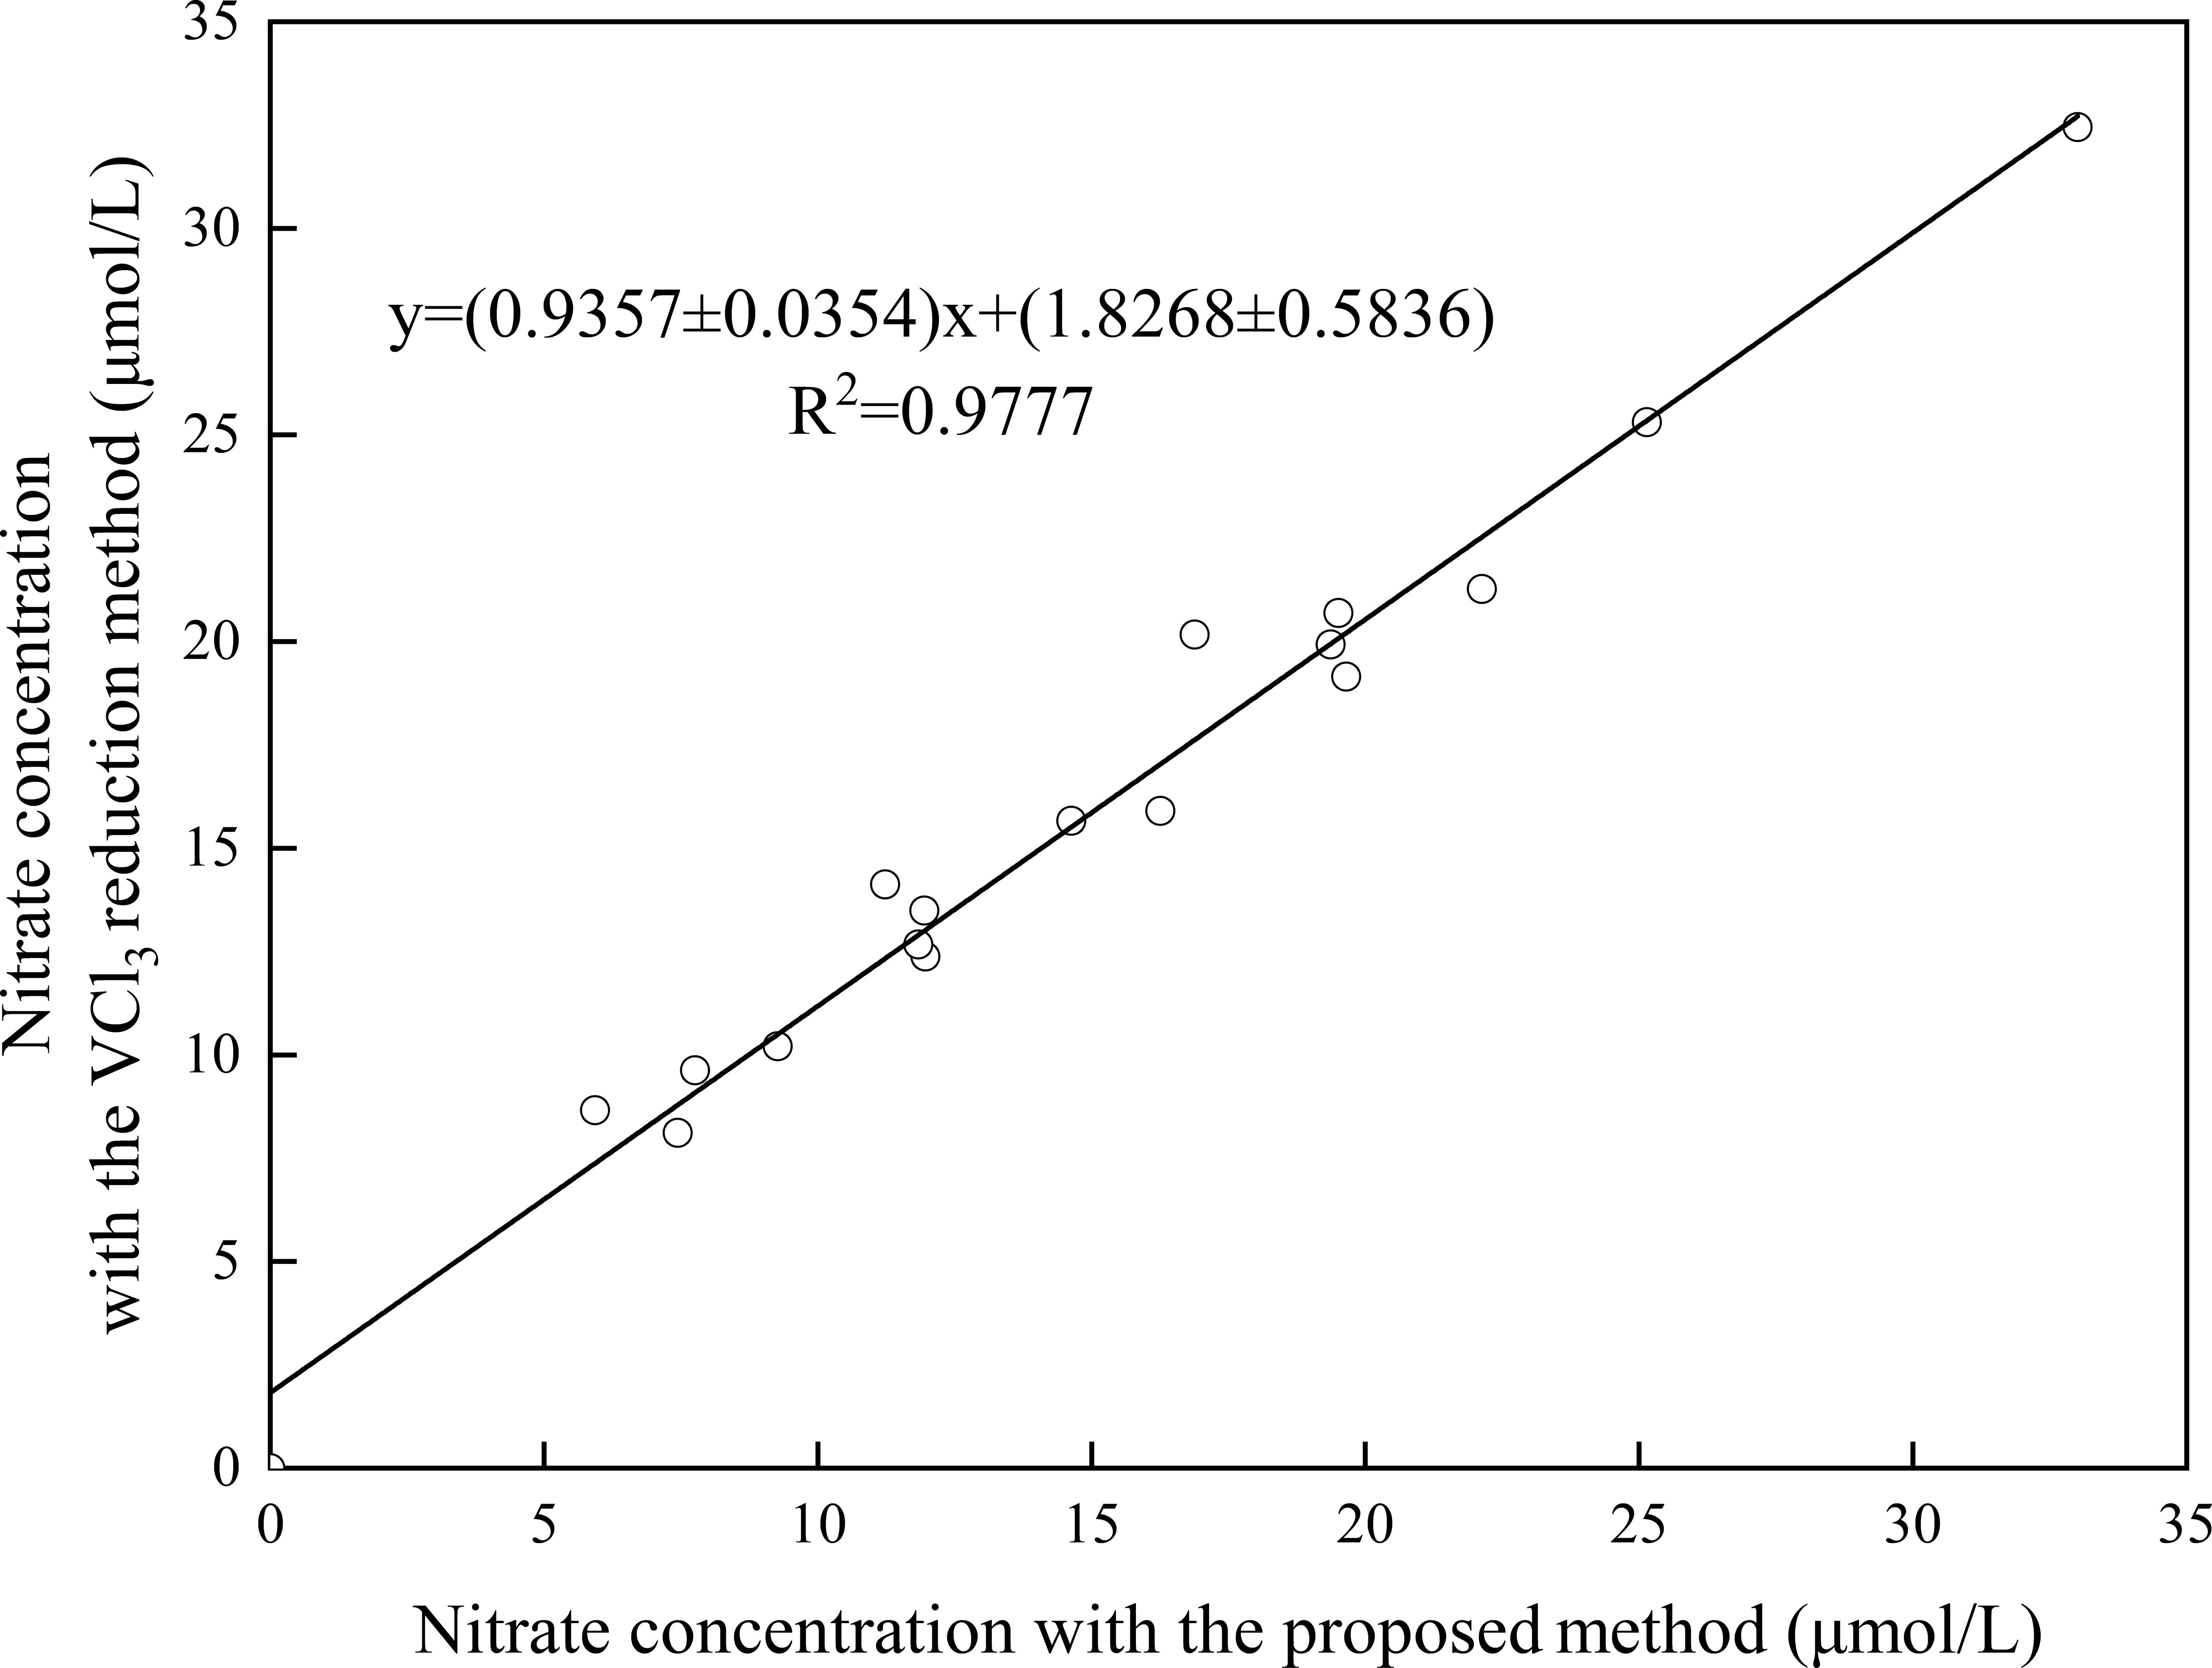
Figure 5 Comparison of the results obtained by the proposed method and the referred VCl3 reduction method.
3.6 Application
The proposed method was applied for the determination of nitrite in seawater samples, which were collected from the coastal seawater of Wenling, Zhejiang Province. The collected samples from the surface seawater were filtered through a filter (0.45 μm) and analyzed. Of note, some sample concentrations exceeded the linear range of the calibration curve, and dilution of the sample was necessary to ensure measurement. Thus, the distributions of surface nitrate concentrations from 45 investigation stations are presented in Figure 6. In addition, the temperature, salinity, and phosphate concentration in the surface seawater were measured and recorded. As shown in Figure 6, the nitrate concentration showed a strong spatial variation, ranging from 2.25 μmol/L to 57.47 μmol/L. The data indicated a good correlation between the nitrate concentration, salinity, and temperature, where the variation trend of nitrate concentration was consistent with the phosphate concentration.
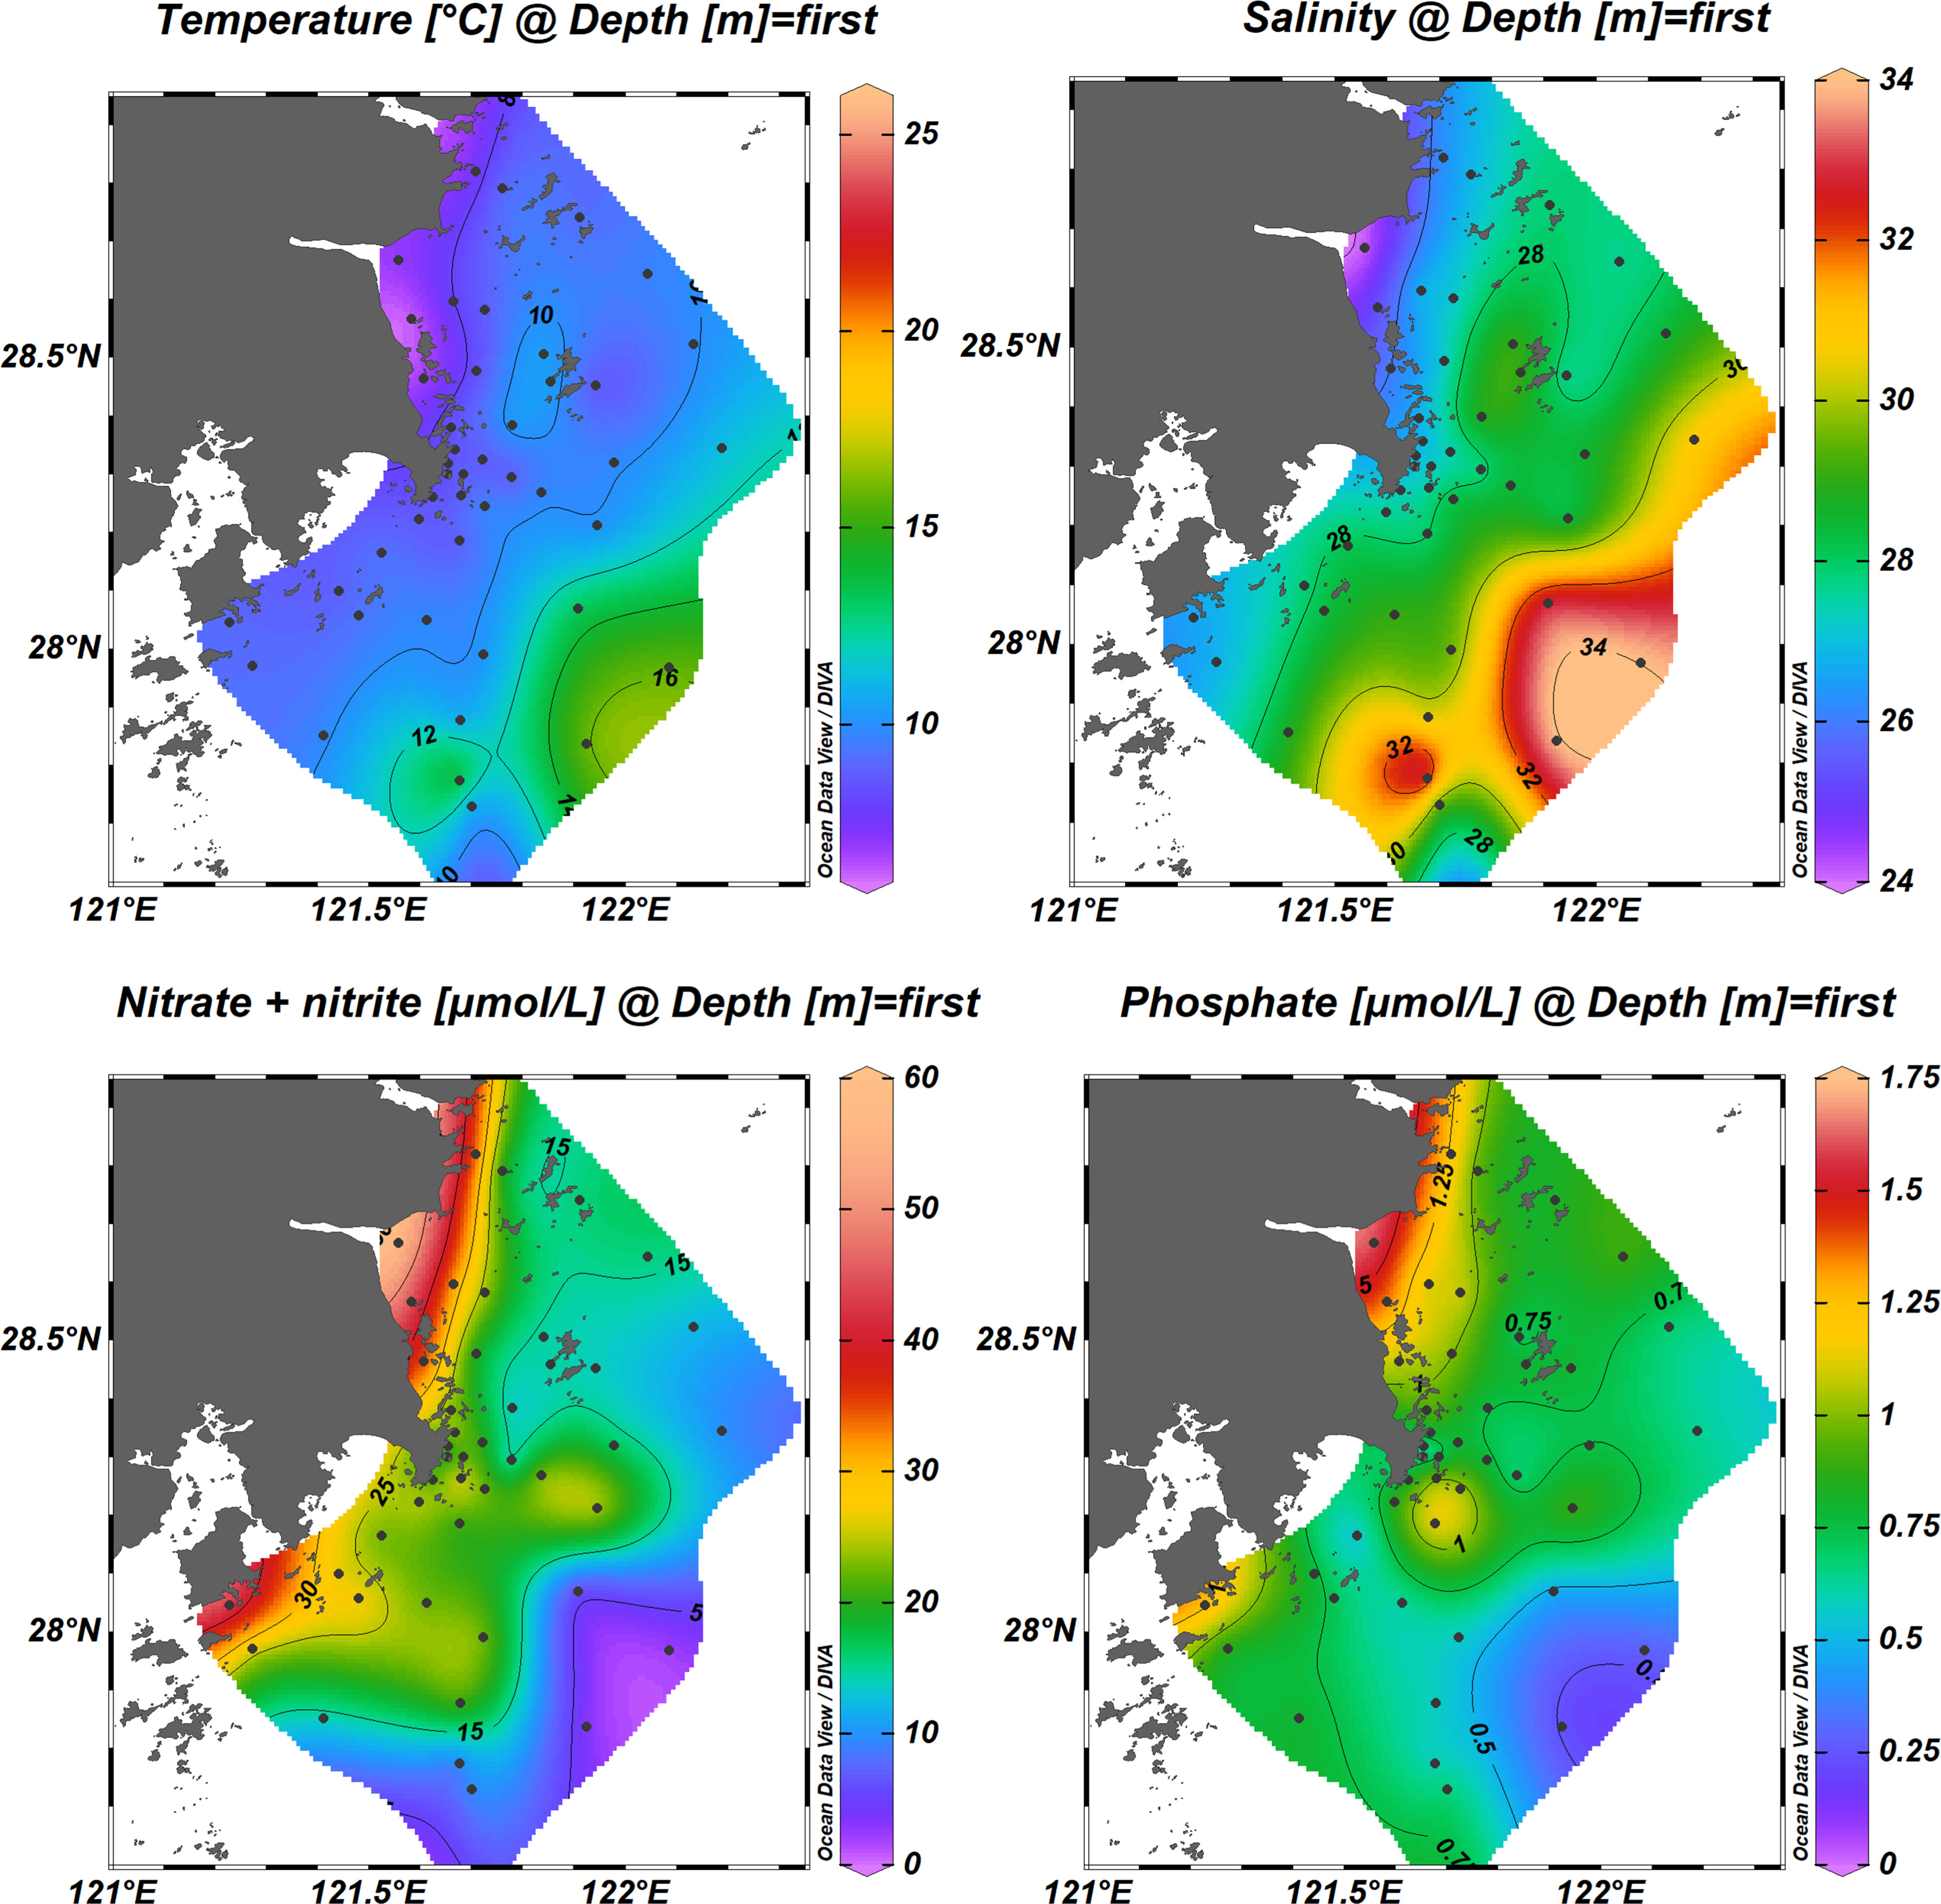
Figure 6 Distribution of temperature, salinity, phosphate, and nitrate + nitrite in the surface seawater from Wenling, Zhejiang Province. The figure was created with Ocean Date View software (Schlitzer, 2021).
4 Conclusions
A novel on-line Cu/Cd column with a spiral structure coupled with a de-bubbling device and a syringe-type filter for field application was developed to overcome the limitations of the commonly used Cu/Cd column. Coupled with the reverse flow injection analysis technique, a novel spectrophotometric method for the field determination of nitrate in seawater was established. The proposed method was easy to operate and had the advantages of high sensitivity, stable reduction efficiency, a suitable calibration range, and a minimized effect of air bubbles. In addition, the proposed method was validated by the National Certified Reference Materials, with good agreement between the results of the proposed method and the reference VCl3 reduction method. The results demonstrated that the proposed method with excellent portability and flexibility could be applied to the field determination of nitrate in seawater.
Data availability statement
The original contributions presented in the study are included in the article/Supplementary Material. Further inquiries can be directed to the corresponding author.
Author contributions
WN: writing-original manuscript, methodology, investigation, and data analysis. HL: methodology and formal analysis. XG: validation and formal analysis. JC: funding acquisition, and data curation. XS: investigation. YZ: writing-review and editing, project administration, and formal analysis. All authors contributed to the article and approved the submitted version.
Funding
This work was financed by the Scientific Research Fund of the Second Institute of Oceanography, MNR, China (Grand No. QNYC2103).
Acknowledgments
We thank Mr. Zhanghan Deng, Pro. Xiaoya Liu, Dr. Qiang Liu, and Dr. Bin Wu for their help with data analysis and sample collection. We thank LetPub (www.letpub.com) for its linguistic assistance during the preparation of this manuscript.
Conflict of interest
The authors declare that the research was conducted in the absence of any commercial or financial relationships that could be construed as a potential conflict of interest.
Publisher’s note
All claims expressed in this article are solely those of the authors and do not necessarily represent those of their affiliated organizations, or those of the publisher, the editors and the reviewers. Any product that may be evaluated in this article, or claim that may be made by its manufacturer, is not guaranteed or endorsed by the publisher.
Supplementary material
The Supplementary Material for this article can be found online at: https://www.frontiersin.org/articles/10.3389/fmars.2023.1138734/full#supplementary-material
References
Alahi M. E. E., Mukhopadhyay S. C. (2018). Detection methods of nitrate in water: A review. Sensor Actuat A-Phys 280, 210–221. doi: 10.1016/j.sna.2018.07.026
Becker S., Aoyama M., Woodward E. M. S., Bakker K., Coverly S., Mahaffey C., et al. (2020). GO-SHIP repeat hydrography nutrient manual: The precise and accurate determination of dissolved inorganic nutrients in seawater, using continuous flow analysis methods. Front. Mar. Sci. 7. doi: 10.3389/fmars.2020.581790
Bristow L. A., Mohr W., Ahmerkamp S., Kuypers M. M. (2017). Nutrients that limit growth in the ocean. Curr. Biol. 27 (11), R474–R478. doi: 10.1016/j.cub.2017.03.030
Canfield D. E., Glazer A. N., Falkowski P. G. (2010). The evolution and future of earth’s nitrogen cycle. Science 330 (6001), 192–196. doi: 10.1126/science.1186120
Ellis P. S., Shabani A. M. H., Gentle B. S., McKelvie I. D. (2011). Field measurement of nitrate in marine and estuarine waters with a flow analysis system utilizing on-line zinc reduction. Talanta 84 (1), 98–103. doi: 10.1016/j.talanta.2010.12.028
Fang T., Li H., Bo G., Lin K., Yuan D., Ma J. (2021). On-site detection of nitrate plus nitrite in natural water samples using smartphone-based detection. Microchem. J. 165, 106117. doi: 10.1016/j.microc.2021.106117
Feng S., Zhang M., Huang Y., Yuan D., Zhu Y. (2013). Simultaneous determination of nanomolar nitrite and nitrate in seawater using reverse flow injection analysis coupled with a long path length liquid waveguide capillary cell. Talanta 117, 456–462. doi: 10.1016/j.talanta.2013.09.042
Foreman R. K., Segura-Noguera M., Karl D. M. (2016). Validation of Ti (III) as a reducing agent in the chemiluminescent determination of nitrate and nitrite in seawater. Mar. Chem. 186, 83–89. doi: 10.1016/j.marchem.2016.08.003
García-Robledo E., Corzo A., Papaspyrou S. (2014). A fast and direct spectrophotometric method for the sequential determination of nitrate and nitrite at low concentrations in small volumes. Mar. Chem. 162, 30–36. doi: 10.1016/j.marchem.2014.03.002
Garside C. (1993). Nitrate reductor efficiency as an error source in seawater analysis. Mar. Chem. 44 (1), 25–30. doi: 10.1016/0304-4203(93)90003-7
Griess P. (1879). Bemerkungen zu der abhandlung der HH. weselky und benedikt ueber einege azoverbindungen. Berichte der deutschen chemischen Gesellschaft 12, 426–428. doi: 10.1002/cber.187901201117
Howarth R. W. (2008). Coastal nitrogen pollution: A review of sources and trends globally and regionally. Harmful Algae 8 (1), 14–20. doi: 10.1016/j.hal.2008.08.015
Jiang C., He Y., Liu Y. (2020). Recent advances in sensors for electrochemical analysis of nitrate in food and environmental matrices. Analyst 145 (16), 5400–5413. doi: 10.1039/d0an00823k
Khongpet W., Yanu P., Pencharee S., Puangpila C., Hartwell S. K., Lapanantnoppakhun S., et al. (2020). A compact multi-parameter detection system based on hydrodynamic sequential injection for sensitive determination of phosphate, nitrite, and nitrate in water samples. Anal. Methods 12 (6), 855–864. doi: 10.1039/c9ay02327e
Lapa R. A., Lima J. L., Pinto I. V. (2000). Sequential injection analysis-based system for on-line monitoring of nitrite and nitrate in wastewaters. Anal. Sci. 16 (11), 1157–1160. doi: 10.2116/analsci.16.1157
Lin K., Li P., Ma J., Yuan D. (2019). An automatic reserve flow injection method using vanadium (III) reduction for simultaneous determination of nitrite and nitrate in estuarine and coastal waters. Talanta 195, 613–618. doi: 10.1016/j.talanta.2018.11.077
Lin K., Wang L., Xu J., Huang S., Guo H., Huo Y., et al. (2022). Reverse flow injection method for field determination of nitrate in estuarine and coastal waters using a custom-made linear light path flow cell and the vanadium reduction method. Microchem. J. 172, 106901. doi: 10.1016/j.microc.2021.106901
Lin K., Xu J., Dong X., Huo Y., Yuan D., Lin H., et al. (2020). An automated spectrophotometric method for the direct determination of nitrite and nitrate in seawater: Nitrite removal with sulfamic acid before nitrate reduction using the vanadium reduction method. Microchem. J. 158, 105272. doi: 10.1016/j.microc.2020.105272
Machado A., Marshall G., Bordalo A. A., Mesquita R. B. (2017). A greener alternative for inline nitrate reduction in the sequential injection determination of NOx in natural waters: Replacement of cadmium reduction by UV radiation. Anal. Methods 9 (12), 1876–1884. doi: 10.1039/c7ay00261k
Nugraha W. C., Ridwan Y. S. (2019). Method validation for nitrate analysis in water using spectrophotometer visible with cadmium reduction. J. Phys. Conf. Ser. 1402 (5), 55061. doi: 10.1088/1742-6596/1402/5/055061
Paerl H. W. (2018). Why does n-limitation persist in the world's marine waters? Mar. Chem. 206, 1–6. doi: 10.1016/j.marchem.2018.09.001
Patey M. D., Rijkenberg M. J., Statham P. J., Stinchcombe M. C., Achterberg E. P., Mowlem M. (2008). Determination of nitrate and phosphate in seawater at nanomolar concentrations. Trends Anal. Chem. 27 (2), 169–182. doi: 10.1016/j.trac.2007.12.006
Pons C., Santos J. L., Lima J. L., Forteza R., Cerdà V. (2008). Multi-pumping flow system for the determination of nitrite and nitrate in water samples. Microchim Acta 161 (1), 73–79. doi: 10.1007/s00604-007-0822-z
Schlitzer R. (2021)Ocean data view. Available at: http://odv.awi.de.
Schnetger B., Lehners C. (2014). Determination of nitrate plus nitrite in small volume marine water samples using vanadium (III) chloride as a reduction agent. Mar. Chem. 160, 91–98. doi: 10.1016/j.marchem.2014.01.010
Seceh C., Pinazo C., Rodier M., Lajaunie-Salla K., Mazoyer C., Grenz C., et al. (2021). Biogeochemical model of nitrogen cycling in ahe (French Polynesia), a south pacific coral atoll with pearl farming. Mar. Pollut. Bull. 169, 112526. doi: 10.1016/j.marpolbul.2021.112526
Singh P., Singh M. K., Beg Y. R., Nishad G. R. (2019). A review on spectroscopic methods for determination of nitrite and nitrate in environmental samples. Talanta 191, 364–381. doi: 10.1016/j.talanta.2018.08.028
Wang Q. H., Yu L. J., Liu Y., Lin L., Lu R. G., Zhu J. P., et al. (2017). Methods for the detection and determination of nitrite and nitrate: A review. Talanta 165, 709–720. doi: 10.1016/j.talanta.2016.12.044
Wood E. D., Armstrong F. A. J., Richards F. A. (1967). Determination of nitrate in sea water by cadmium-copper reduction to nitrite. J. Mar. Biol. Assoc. UK 47 (1), 23–31. doi: 10.1017/S002531540003352X
Yu J., Xiao Y., Wang Y., Xu S., Zhou L., Li J., et al. (2021). Chronic nitrate exposure cause alteration of blood physiological parameters, redox status and apoptosis of juvenile turbot (Scophthalmus maximus). Environ. Pollut. 283, 117103. doi: 10.1016/j.envpol.2021.117103
Zhang J. Z., Fischer C. J., Ortner P. B. (2000). Comparison of open tubular cadmium reactor and packed cadmium column in automated gas-segmented continuous flow nitrate analysis. Int. J. Environ. An. Ch. 76 (2), 99–113. doi: 10.1080/03067310008034123
Zhu Y., Chen J., Yuan D., Yang Z., Shi X., Li H., et al. (2019). Development of analytical methods for ammonium determination in seawater over the last two decades. Trends Anal. Chem. 119, 115627. doi: 10.1016/j.trac.2019.115627
Keywords: nitrate, reverse flow injection analysis, field determination, novel coppered cadmium column, vanadium reduction
Citation: Niu W, Li H, Guo X, Chen J, Shi X and Zhu Y (2023) Field determination of nitrate in seawater using a novel on-line coppered cadmium column: A comparison study with the vanadium reduction method. Front. Mar. Sci. 10:1138734. doi: 10.3389/fmars.2023.1138734
Received: 06 January 2023; Accepted: 03 February 2023;
Published: 15 February 2023.
Edited by:
Meilin Wu, South China Sea Institute of Oceanology (CAS), ChinaReviewed by:
Guangzhe Jin, Guangdong Ocean University, ChinaYing Liang, Guilin University of Electronic Technology, China
Copyright © 2023 Niu, Li, Guo, Chen, Shi and Zhu. This is an open-access article distributed under the terms of the Creative Commons Attribution License (CC BY). The use, distribution or reproduction in other forums is permitted, provided the original author(s) and the copyright owner(s) are credited and that the original publication in this journal is cited, in accordance with accepted academic practice. No use, distribution or reproduction is permitted which does not comply with these terms.
*Correspondence: Yong Zhu, emh1eW9uZ0BzaW8ub3JnLmNu