 Xiangyu Zhu1,2†
 Mingru Chen
 Xiaomei Xu
94% of researchers rate our articles as excellent or good
Learn more about the work of our research integrity team to safeguard the quality of each article we publish.
Find out more
ORIGINAL RESEARCH article
Front. Mar. Sci., 13 March 2023
Sec. Marine Biology
Volume 10 - 2023 | https://doi.org/10.3389/fmars.2023.1135310
This article is part of the Research TopicBiological Rhythms of Aquatic Organisms in a Changing ClimateView all 9 articles
Auditory brainstem response (ABR) technology is used to set up a fish auditory threshold detection system, and the auditory threshold of wild yellow grouper Epinephelus awoara caught in the Taiwan Strait is studied. The ABRs of 10 wild yellow groupers (TL150-200 mm) to 12 different frequencies of sound stimulation from 100 to 2000 Hz are recorded and analyzed. The results show that the auditory threshold of wild yellow grouper fish increases with the increase of frequency in the frequency of 200-2000Hz. The fish is sensitive to low frequency sound signal of 100-300Hz with the most sensitive frequency of 200Hz, and the auditory threshold is 90 dB re 1μPa. The ABR waveform shows three periods: response period, real hearing period and extension period. In the range of 100-2000Hz, the response time decreases with the increase of frequency at the same sound pressure level. At the same frequency, the response time increases with the decrease of sound pressure level. The first amplitude sound pressure of real hearing period is between 50-150nv, and the real hearing period contains the greatest amplitude. When the greatest amplitude is about 50nv and the next sound pressure level is below 50nv, the sound pressure level is the auditory threshold. The extension period is proportional to the response period.
The rapid development of marine engineering and aquaculture industry has produced a lot of noise, which has a great impact on marine animals. In 1998, Kenyon first applied Auditory Brainstem Response (ABR) technology to fish auditory threshold detection. Compared with the traditional auditory test method, the ABR technique is a repeatable technical means with no long-term behavior, no fish harm (Kenyon et al., 1998). It is a widely recognized research method now. But as an important economic fish, there is little research on yellow grouper’s auditory thresholds so far, and the impact of noise on grouper is lack of scientific data (Fay, 2009; Hildebrand, 2009; Popper and Hastings, 2009). In this study, the wild yellow grouper caught in the Taiwan Strait is used as a research object, and the ABR technique is used to set up an auditory threshold detection system. These results may provide the scientific basis for coastal construction operations and for farmers to adjust the sound intensity of production operations (Kight and Swaddle, 2011; Liu et al., 2019).
The wild yellow groupers are caught from a custom-made net around the Gulangyu Island (24°26′48″N,118°03′47″E) in Xiamen, Fujian Province, with a total length of 150-200mm and a body mass of 200-300g (Table 1). The fishes are placed in a 60cm*50cm*50cm oxygen tank, transported to the laboratory within 1h. And then are temporarily kept in a 150cm*60cm*60cm, 22°C circulating seawater glass tank covered with black cotton cloth around, with an ultra-quiet oxygen generator, under normal light. Feed fishes with shrimp, crab larvae and custom feed during the period of temporary cultivation.
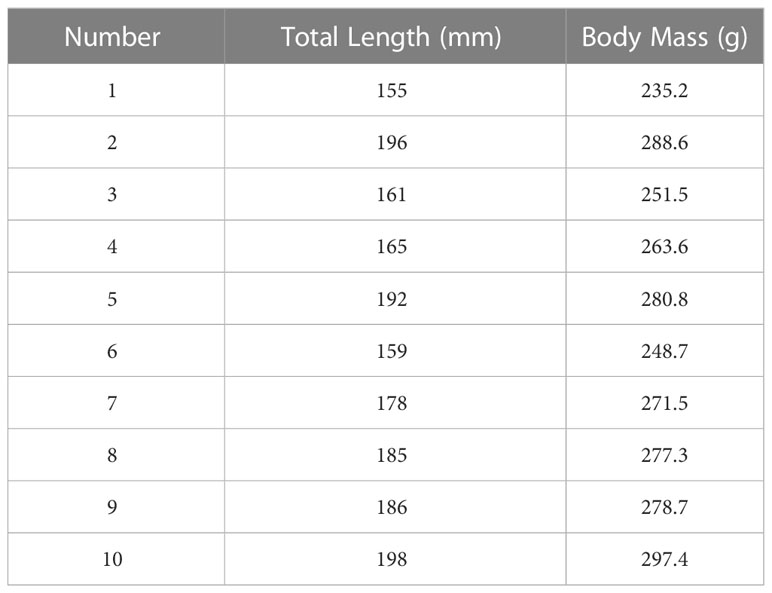
Table 1 Data of total length and body mass of wild yellow groupers in the experiment.
Refer to Kenyon’s research method (Kenyon et al., 1998), using the Tucker-Davis Technologies (TDT) system (TDT) to complete (1) audiometry system; (2) underwater sound measurement system; (3) anesthesia system (Table 2).
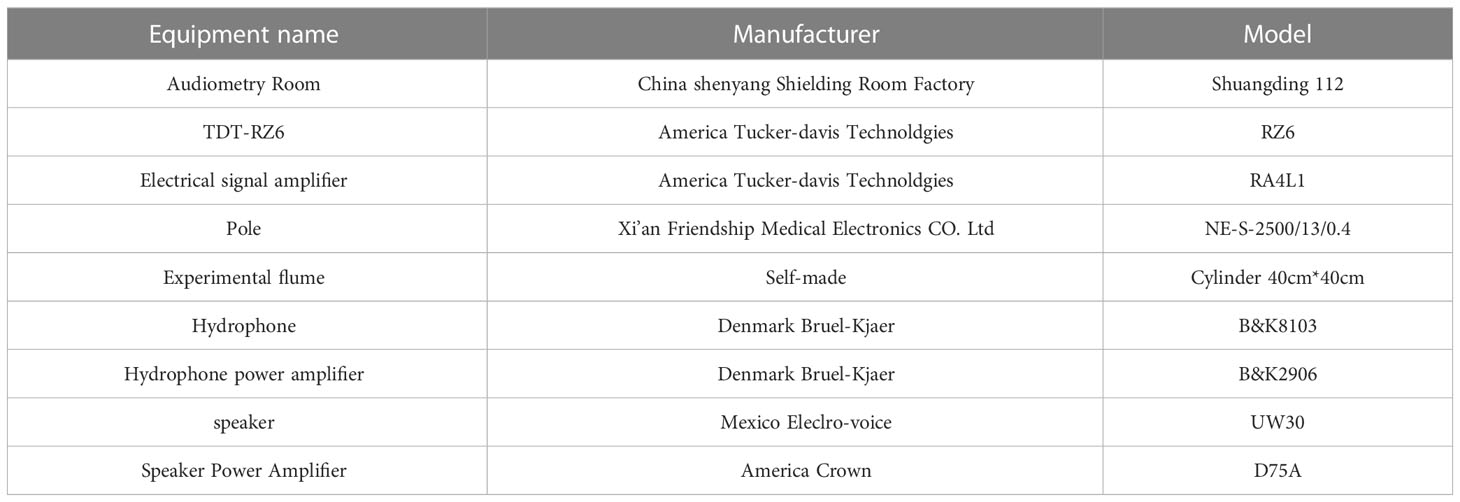
Table 2 Main experimental instruments.
Prepare 20L seawater solution by adding 3-Aminobenzoic acid ethyl ester methanesulfonate (MS-2-2-2) to sea water according to 20g/L (Zhang et al., 2018); Preparation of five concentration of muscle relaxant solutions by using Gallamine triethiodide and distilled water: 0.25mg/ml, 0.5mg/ml, 0.75mg/ml, 1mg/ml, 1.25mg/ml each 10ml; Install the acrylic cylindrical experimental tank with a diameter of 30cm and a height of 40cm and a micromanipulator, place two layers of sound insulation pads under the experimental tank, hold one-third of quartz sand inside, and bury all the speakers in sand. Filled the tank with prepared seawater solution, all metal equipment needs to be grounded (Figure 1).
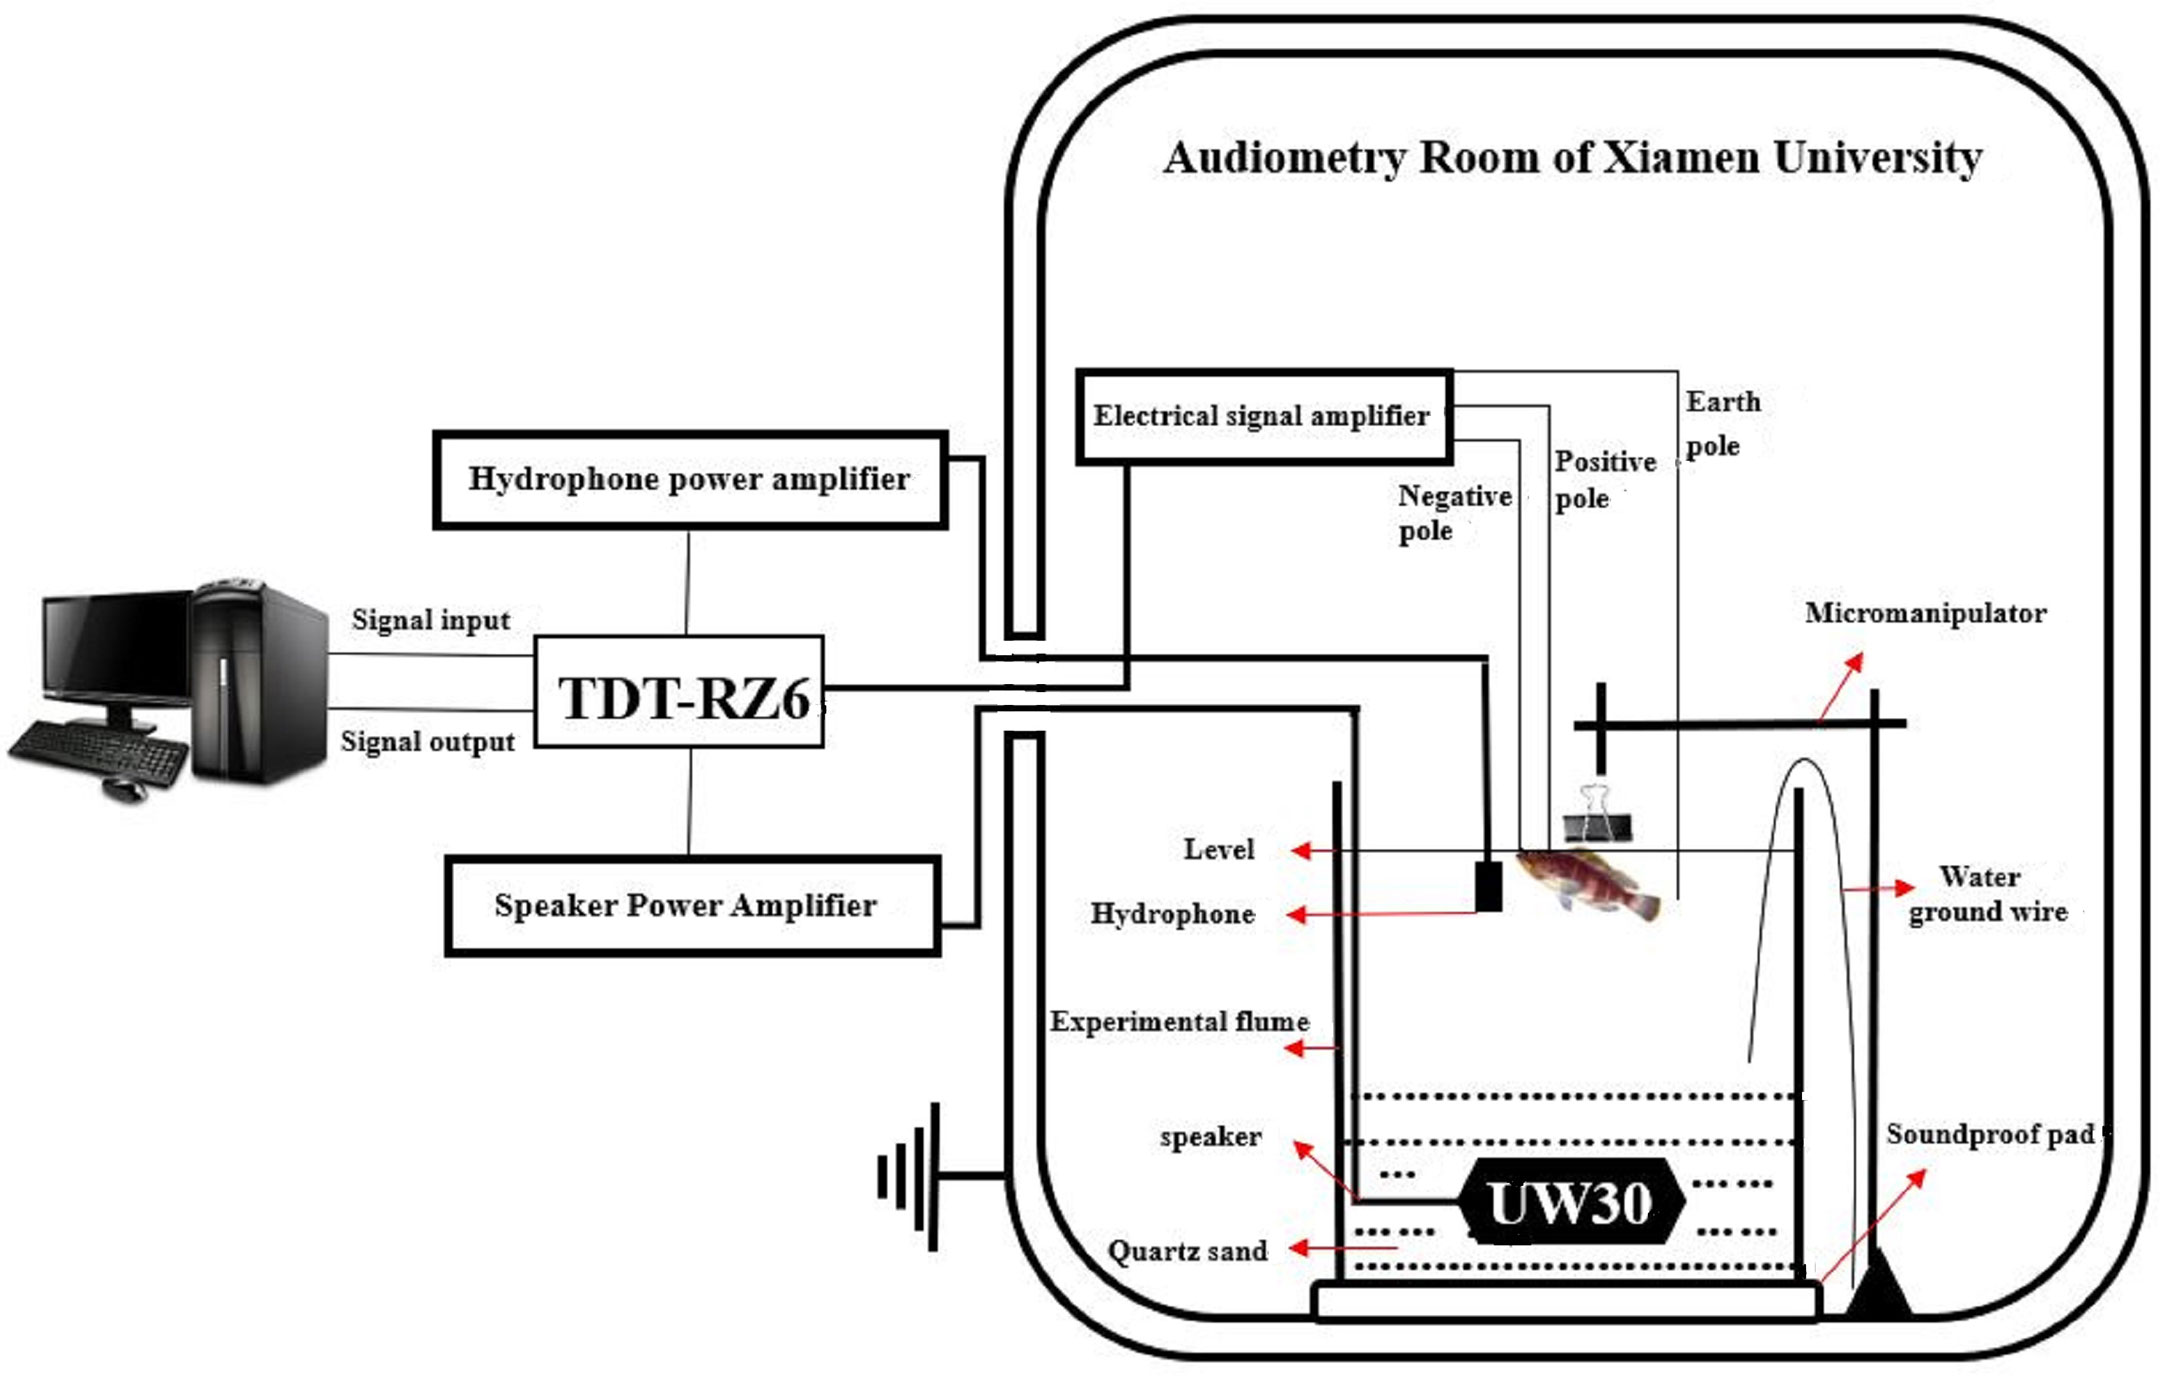
Figure 1 Auditory threshold detection system.
Under the premise of ensuring fish’s respiration, first anesthetize with 3-Aminobenzoic acid ethyl ester methanesulfonate to reduce the respiratory rate, and then inject a certain concentration of gal iodide solution to avoid the noise potential produced by large-area contraction of fish muscles, but not block the ganglion and releasing histamine (Zhang et al., 2015; Zhang et al., 2016).
Prepare 5 bottles of 1L seawater solution with anesthetic; prepare 1 bottle of 1L ordinary, and place 5 experimental fish in 5 bottles containing anesthetic seawater solution (1 fish each bottle) and let stand for 10 minutes, until the fish body cannot maintain a normal balanced posture. Five concentrations of Gallamine triethiodide solution (0.25mg/ml, 0.5mg/ml, 0.75mg/ml, 1mg/ml, 1.25mg/ml) are prepared, and distilled water is set as a blank control group. Distilled water and 0.1ml of different concentrations of Gallamine triethiodide are injected into the base end of the first dorsal fin of each experimental fish, and the fish are placed in ordinary 1L seawater for 5 minutes; Observe and record the state of the fish, when the fish just can’t maintain the swimming posture, the optimum concentration of Gallamine triethiodide is determined (Pan et al., 2017). The experimental results are shown in Table 3.
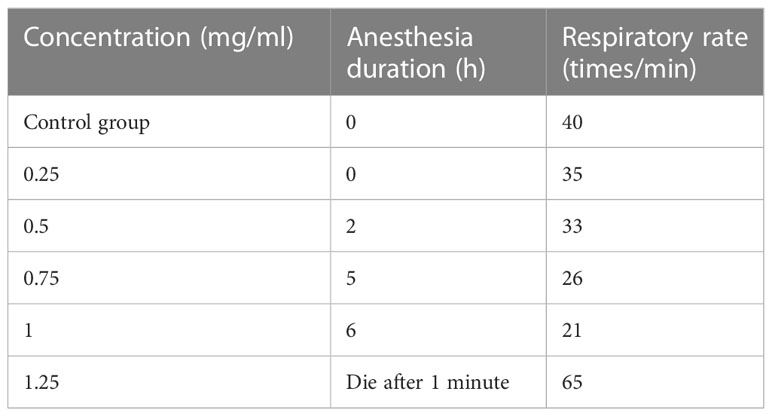
Table 3 Gallamine triethiodide injection physiological response data.
Use MS-2-2-2 to prepare 20L and 1L seawater at a concentration of 20mg/L, place the experimental fish into the prepared 1L seawater and let stand for 10 minutes, wait until the fish cannot maintain a normal balanced posture. Inject 0.1ml of the prepared Gallamine triethiodide solution at a concentration of 1mg/ml, and put it back into the prepared 20L seawater and let stand for 5 minutes. Wrap the fish body with gauze and clamped with a clip of the micromanipulator, leak out the gill cover, the electrode is inserted vertically, and the skull of the inserted electrode portion is exposed to the water surface. Ensure that the experimental fish can breathe normally. Nail polish is applied to the exposed part of the metal electrode to insulate it from water.
Electrode position: the positive pole is inserted vertically in the midline of the skull, the depth is about 5mm; the negative pole is inserted vertically in the middle of the nostril, the depth is about 2mm; the ground electrode is placed in seawater close to the fish body (Figure 1). After each frequency measurement, stop the experiment for 5 minutes to rest the fish. During the rest time, replace the seawater in the tank with a peristaltic pump, so that the oxygen concentration can ensure the normal breathing of the experimental fish. A hydrophone (bk8103, Denmark) is placed close to the outside of the inner ear of the experimental fish to record the sound pressure level at which the fish hear the sound. The speaker (UW30, frequency response range 19-5000 Hz) is buried in quartz sand, 20cm directly below the experimental fish, and connected to the power amplifier (D-75A, CROWN).
In the experiment, tone burst is used as the stimulus acoustic signal which consists of two sine waves of equal strengths with the same frequency but 180˚ out of phase with each other (Figure 2). The signal frequencies start from 100 Hz and ranges from 100 Hz to 2 kHz. The duration of each signal is 10 ms and is repeated 1000 times. A track of 2000 stimulus signals can be obtained to eliminate measurement errors, the sound pressure level of the stimulus signal starts from 140 dB, decrementing by 2dB each time, and the ABR waveform is plotted (Figure 3). When it approaches the threshold, it is decreased by 1 dB each time. The auditory threshold of a certain frequency, the maximum amplitude range is generally 50-80nv, and the maximum amplitude of the next sound pressure level will generally below 50nv (the ambient noise signal frequency sound pressure below 50nv can be ignored, Figure 4).
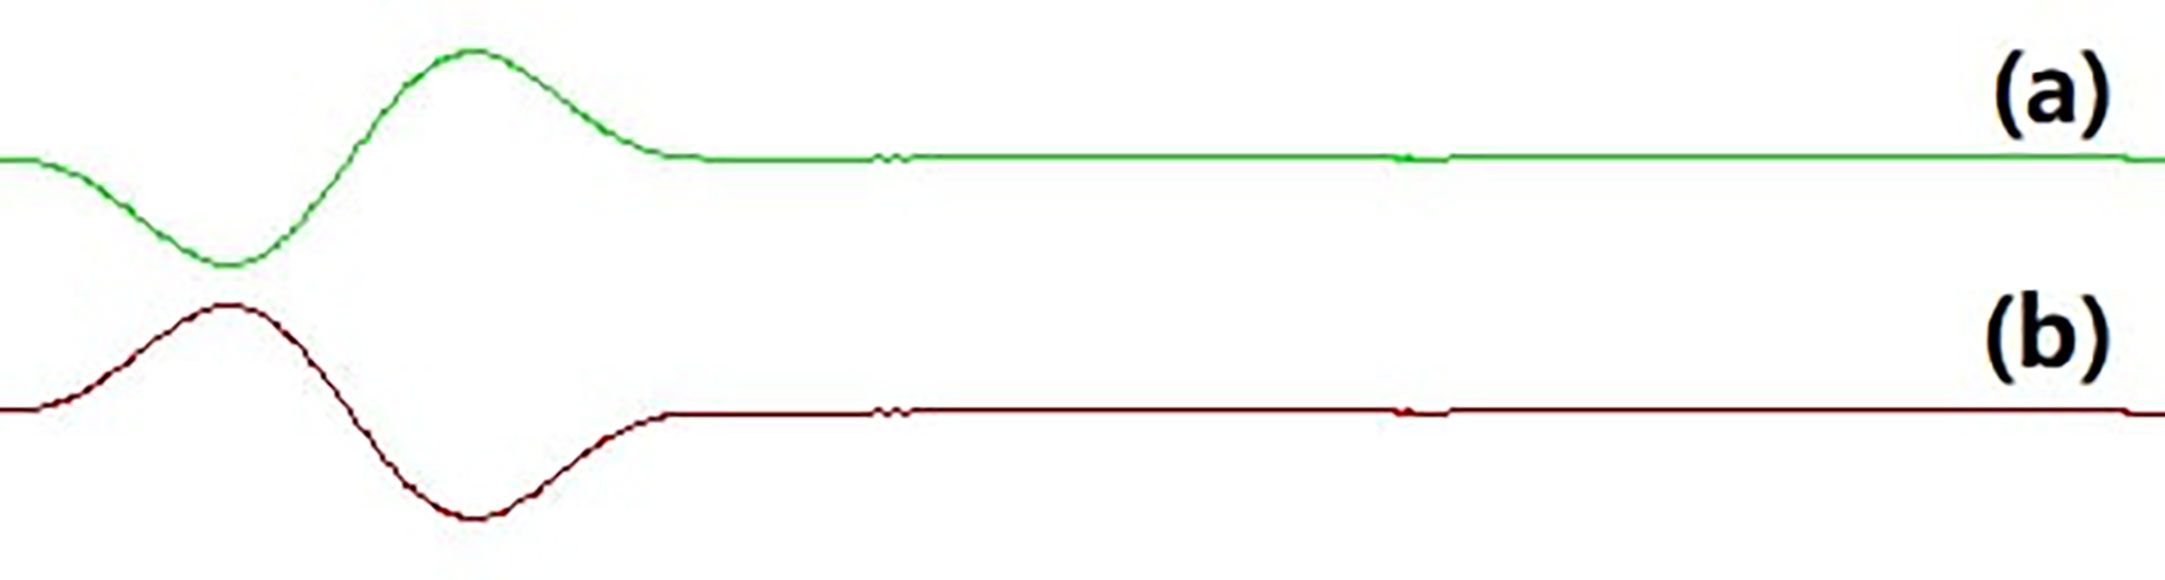
Figure 2 Opposite phase sound waveform. (A) the phase 90° sound waveform; (B) the phase 270° sound waveform.
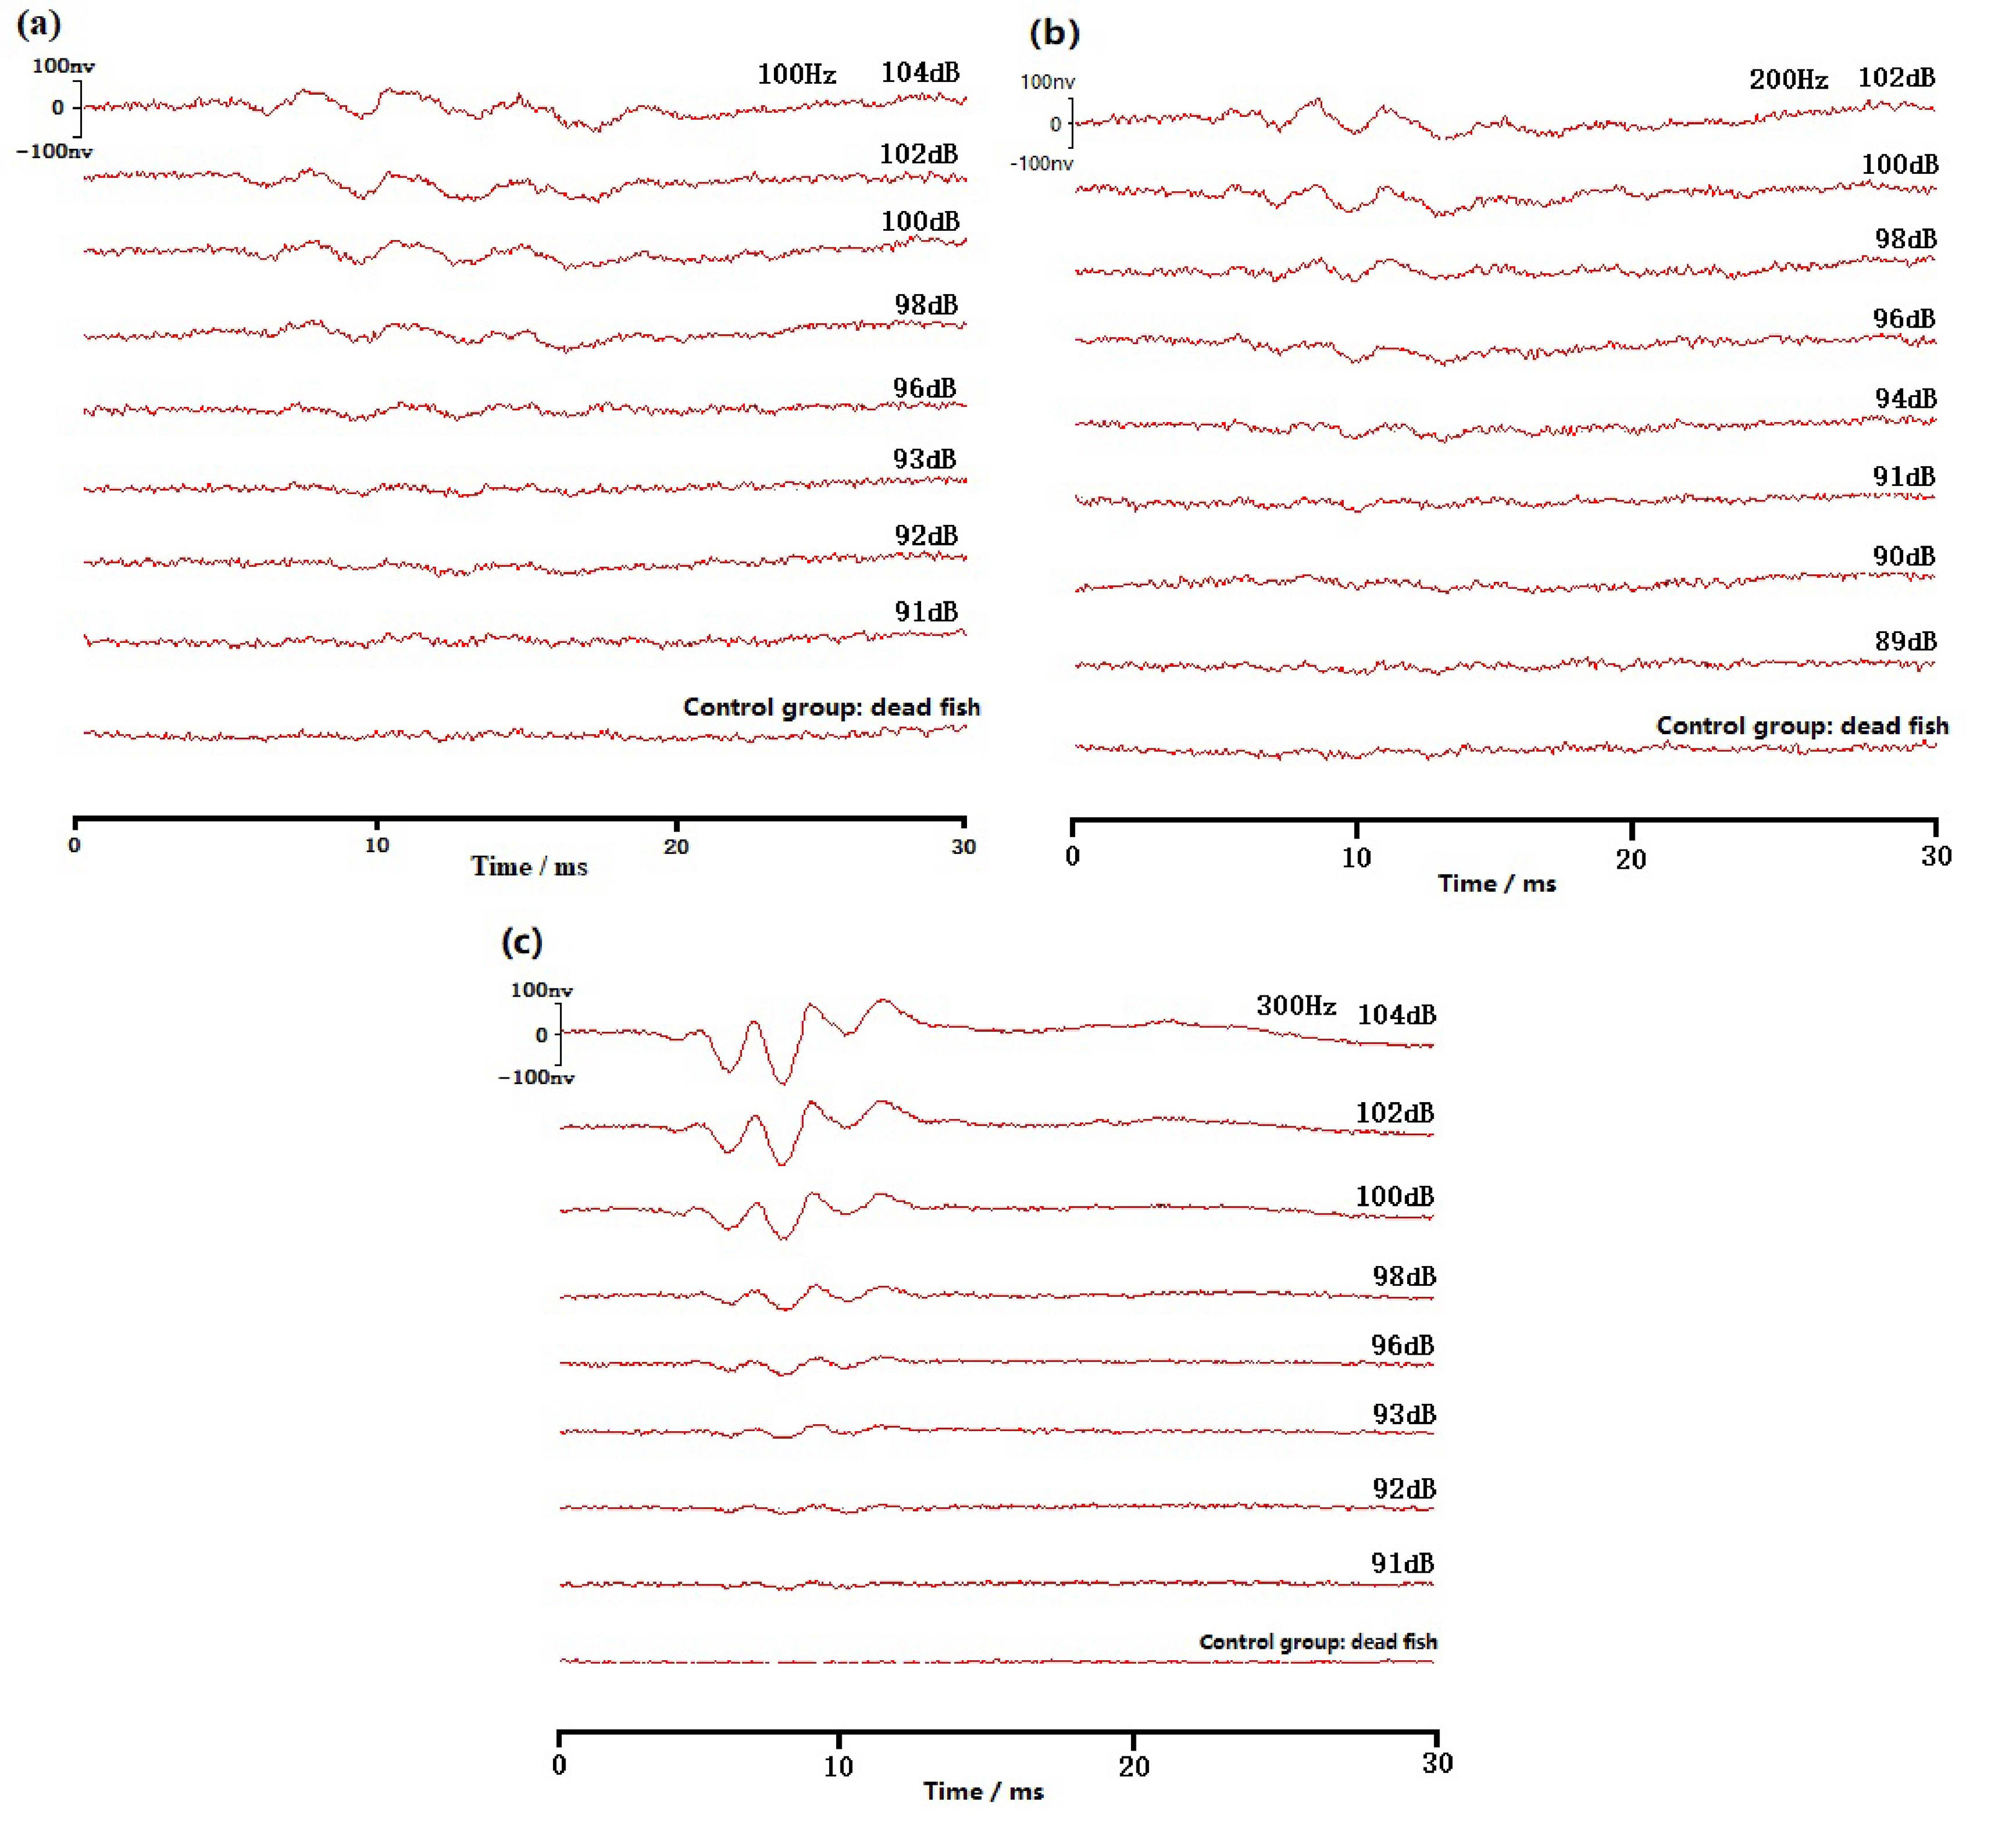
Figure 3 Schematic diagram of the wild yellow grouper ABR waveform. (A) Schematic diagram of 100Hz; (B) Schematic diagram of 200Hz; (C) Schematic diagram of 300Hz.
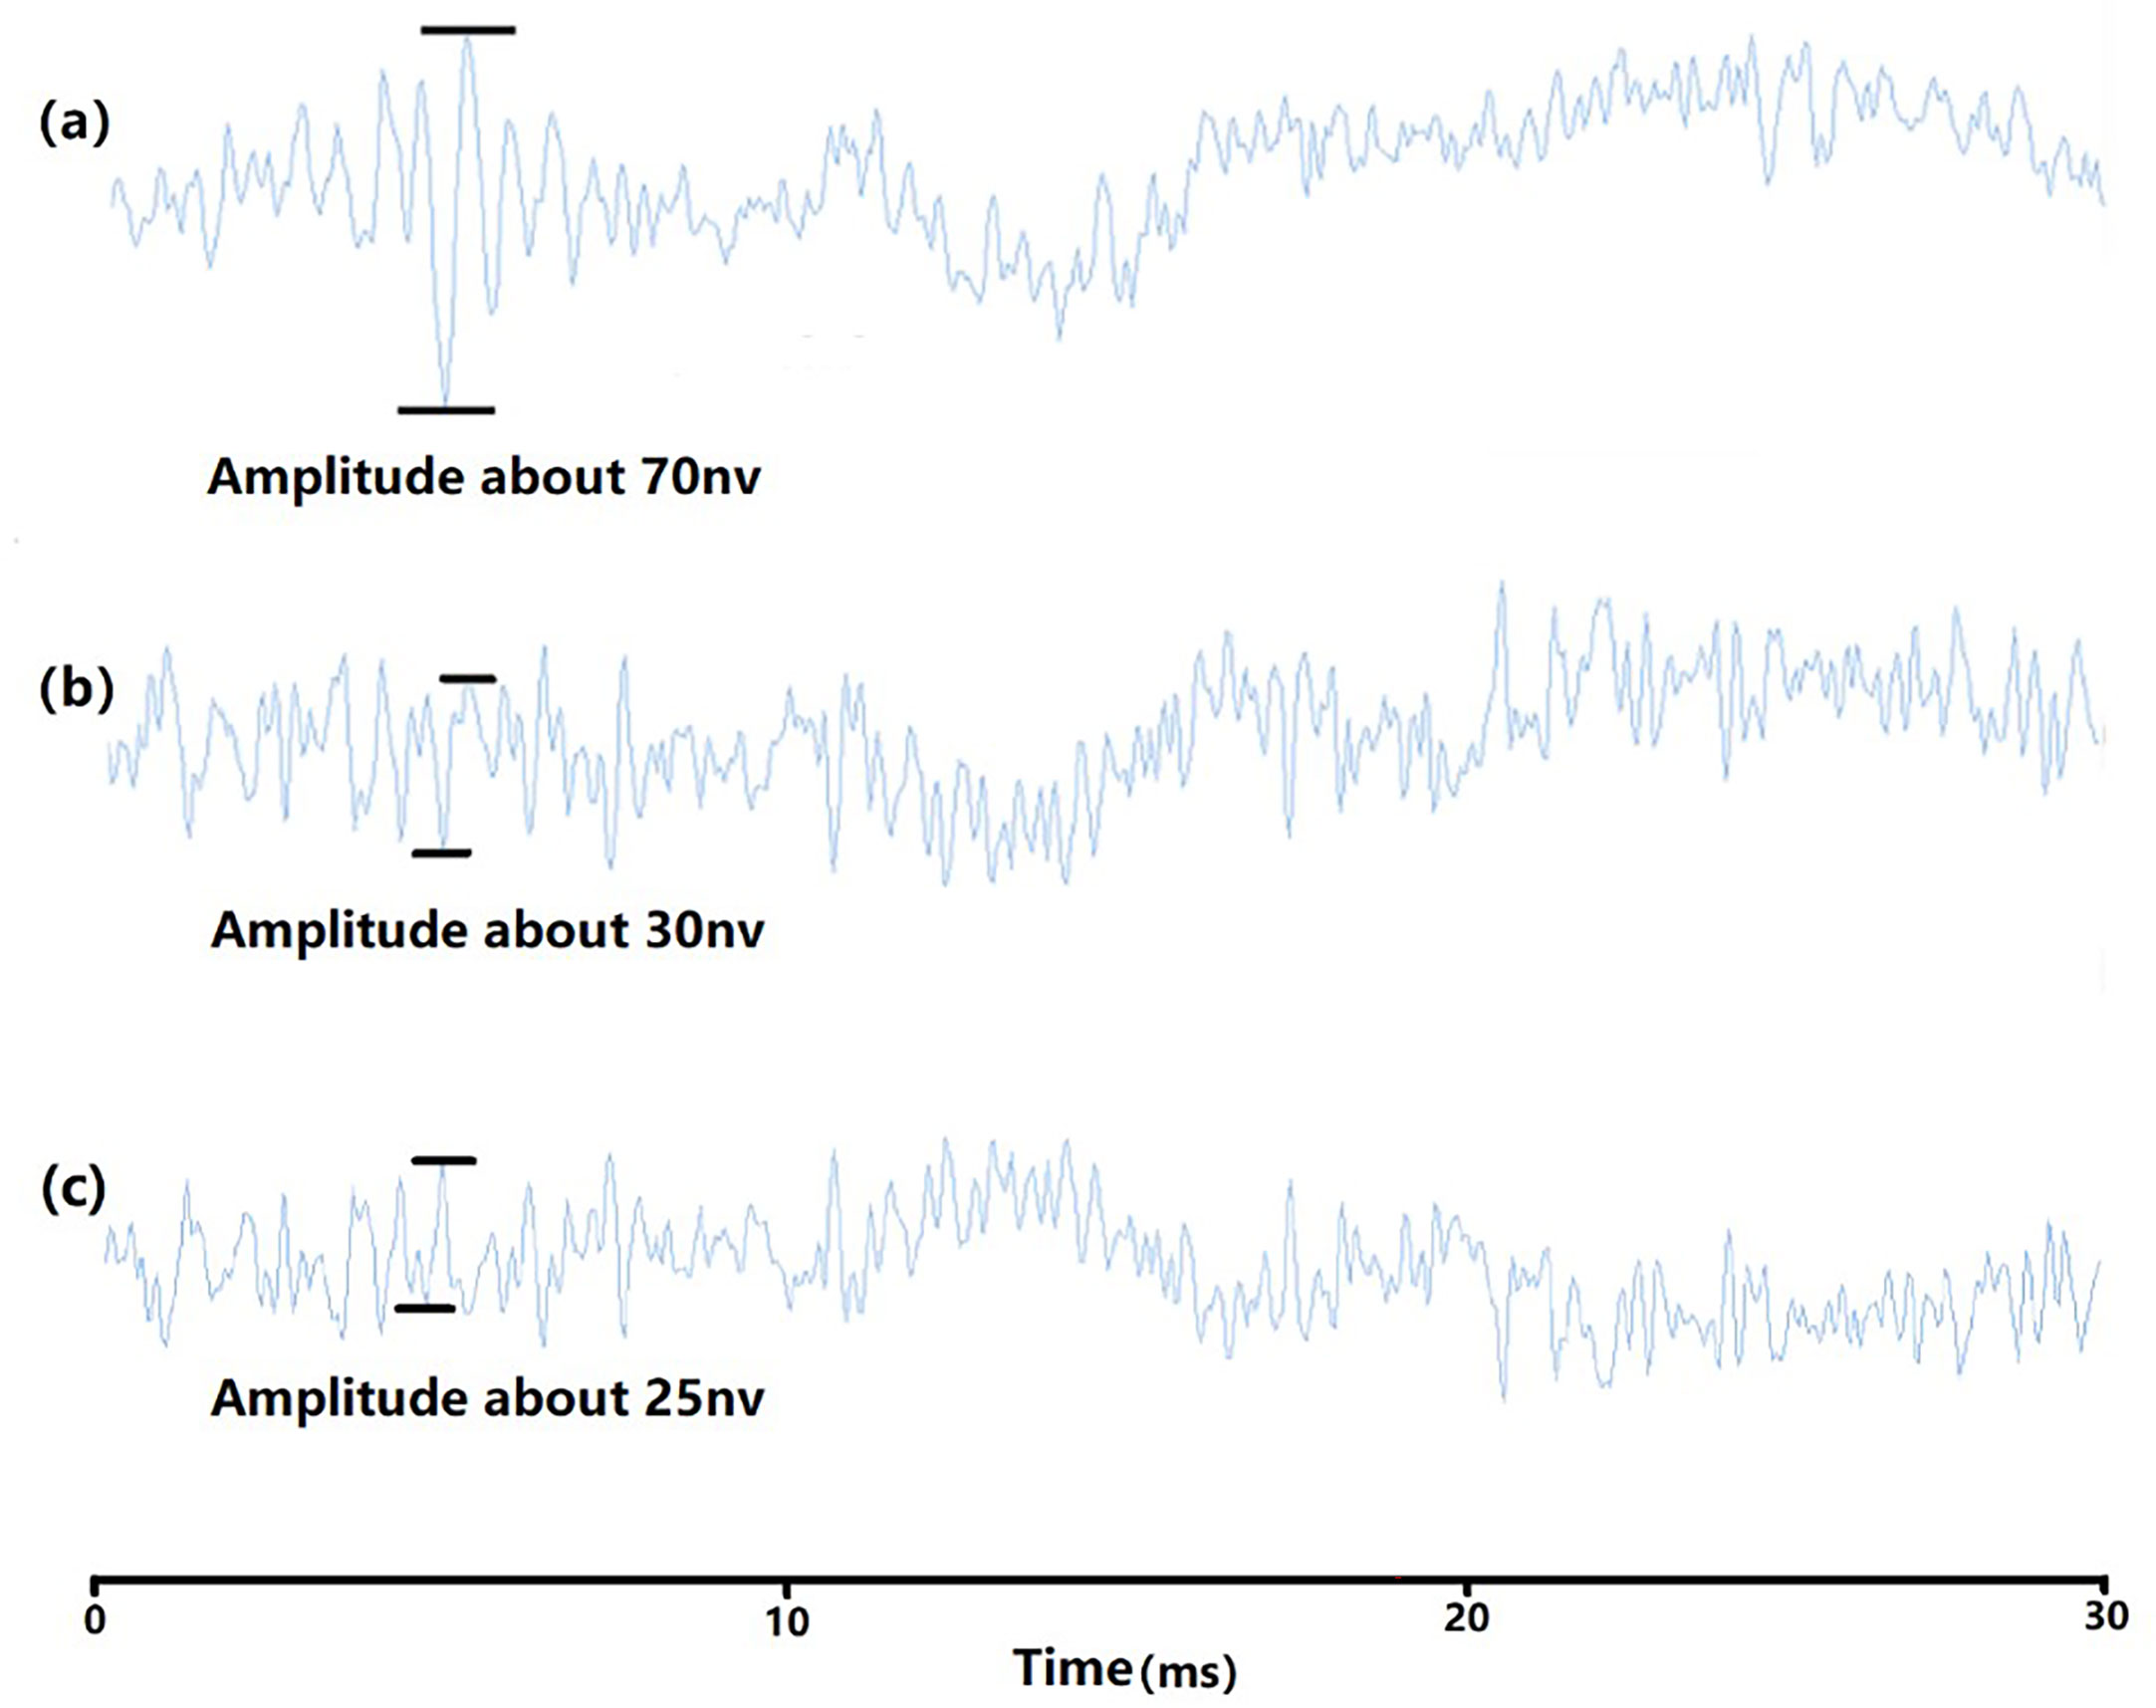
Figure 4 ABR waveform (100Hz). (A) the waveform of auditory threshold 92dB; (B) the waveform of 91dB; (C) the waveform of dead fish 1.
ABR waveforms are obtained in all ten experiments on yellow grouper. The yellow grouper is more sensitive to low frequency sound signals. The most sensitive frequency range is 100-300 Hz, where hearing threshold is 92dB at 100Hz, 90dB at 200Hz, and 94dB at 300Hz. With the increase of sound frequency, yellow grouper’s hearing sensitivity decreases, the sensitivity to sound above 300Hz is poor, and the hearing threshold reaches to more than 100dB. The hearing thresholds of 10 yellow groupers are averaged to obtain the ABR curve of this fish (Figure 5). The ABR curve first decreases and then increases within the measured frequency range of 100~2000 Hz. The hearing threshold increases with the increase of sound frequency above 200Hz, of which the threshold difference between 300-400Hz is the largest, which is 13dB; the rise of the threshold value in 700-2000Hz frequency band slows down.
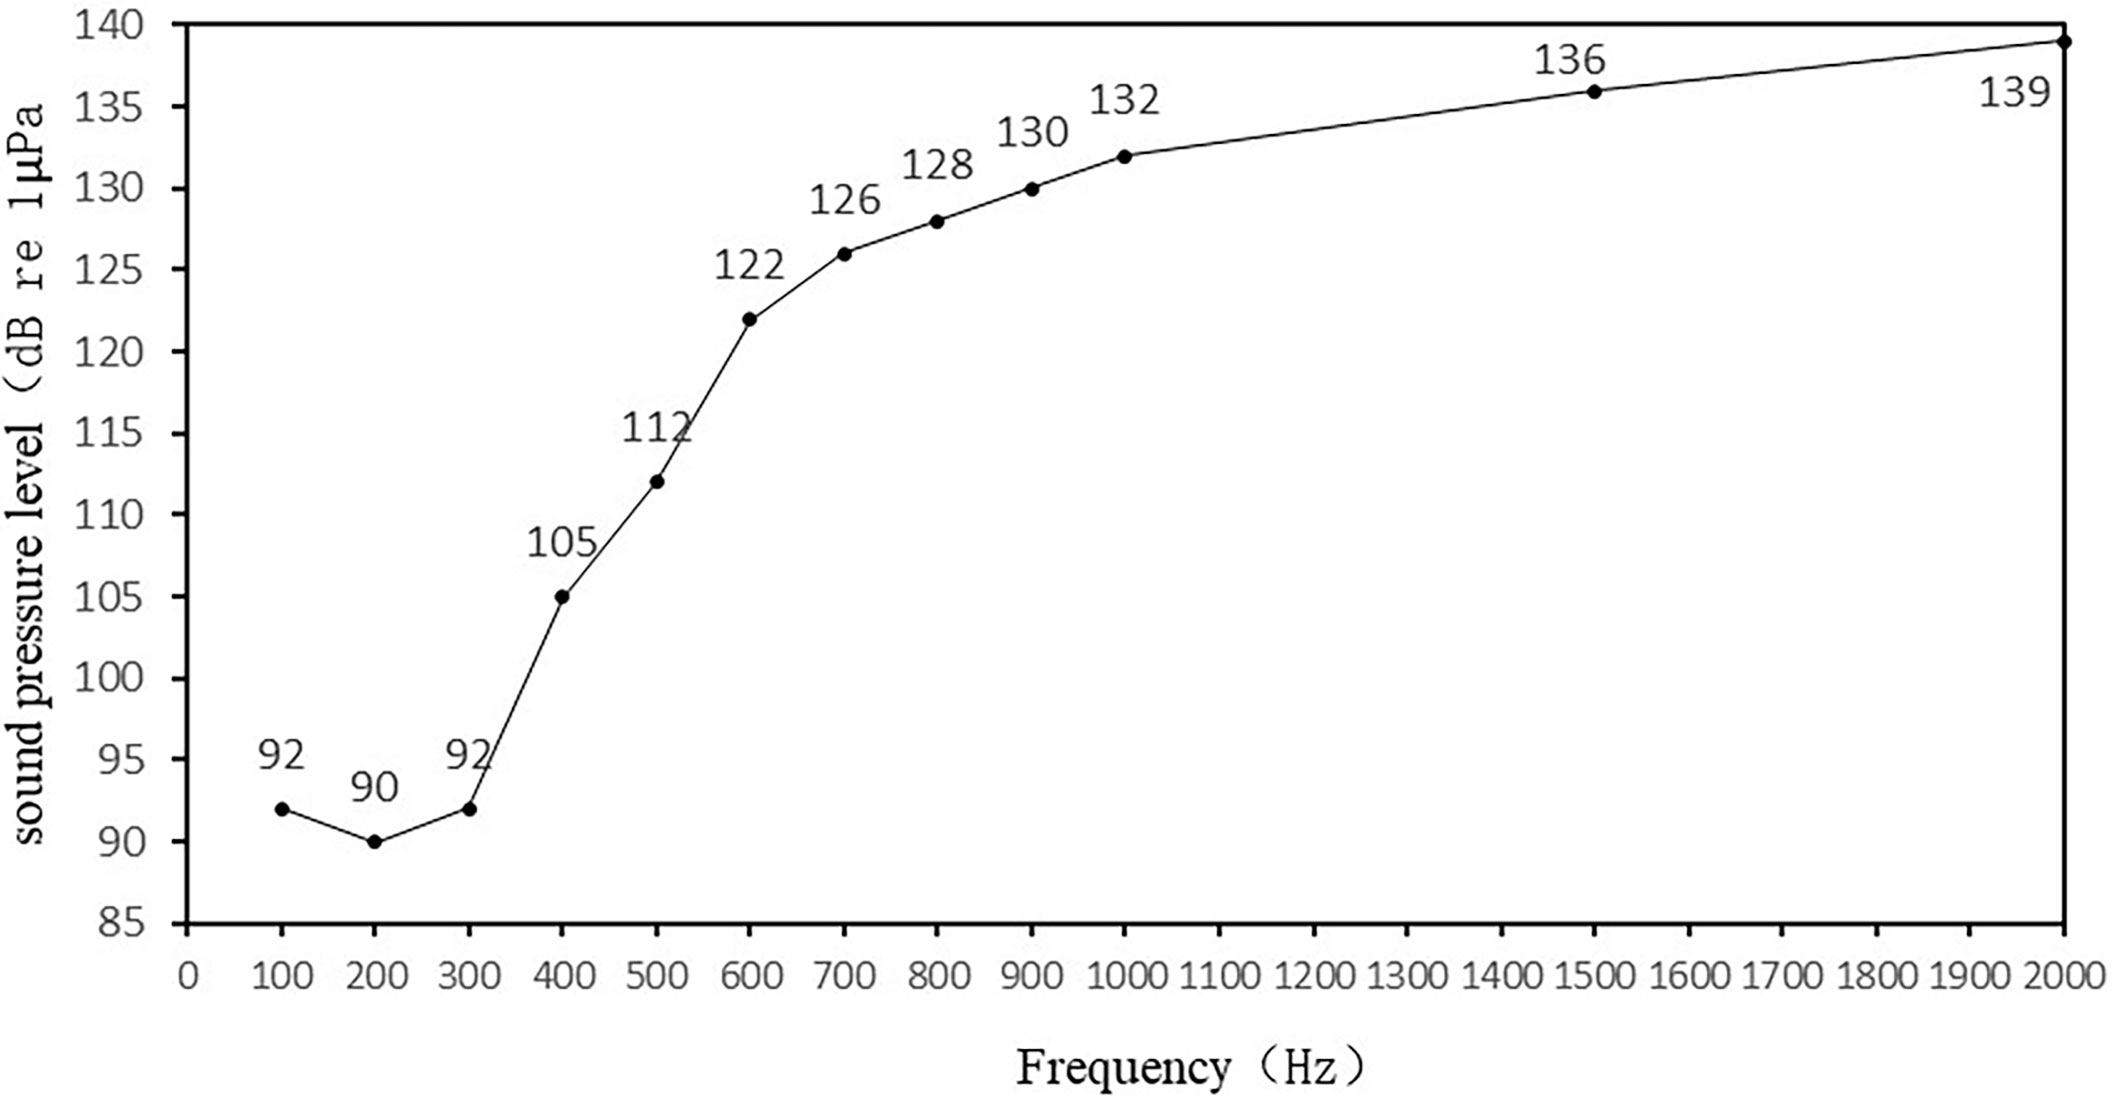
Figure 5 Auditory threshold curve of wild yellow grouper.
The ABR waveforms of groupers can be divided into three types: One is the ABR waveform of low-frequency signal at 100-300Hz, which fluctuates relatively gently from baseline. The second type is the ABR waveform at 300-500Hz. Firstly, it produces a negative peak relative to the baseline. On this negative peak, several small negative peaks may appear, followed by a positive peak relative to the baseline. The third type is the ABR waveform at 500-2000Hz, first with a positive fluctuation relative to the baseline, followed by a slow negative peak.
The yellow grouper ABR waveform appears in three periods: response period, real hearing period, and extension period (Figure 6).
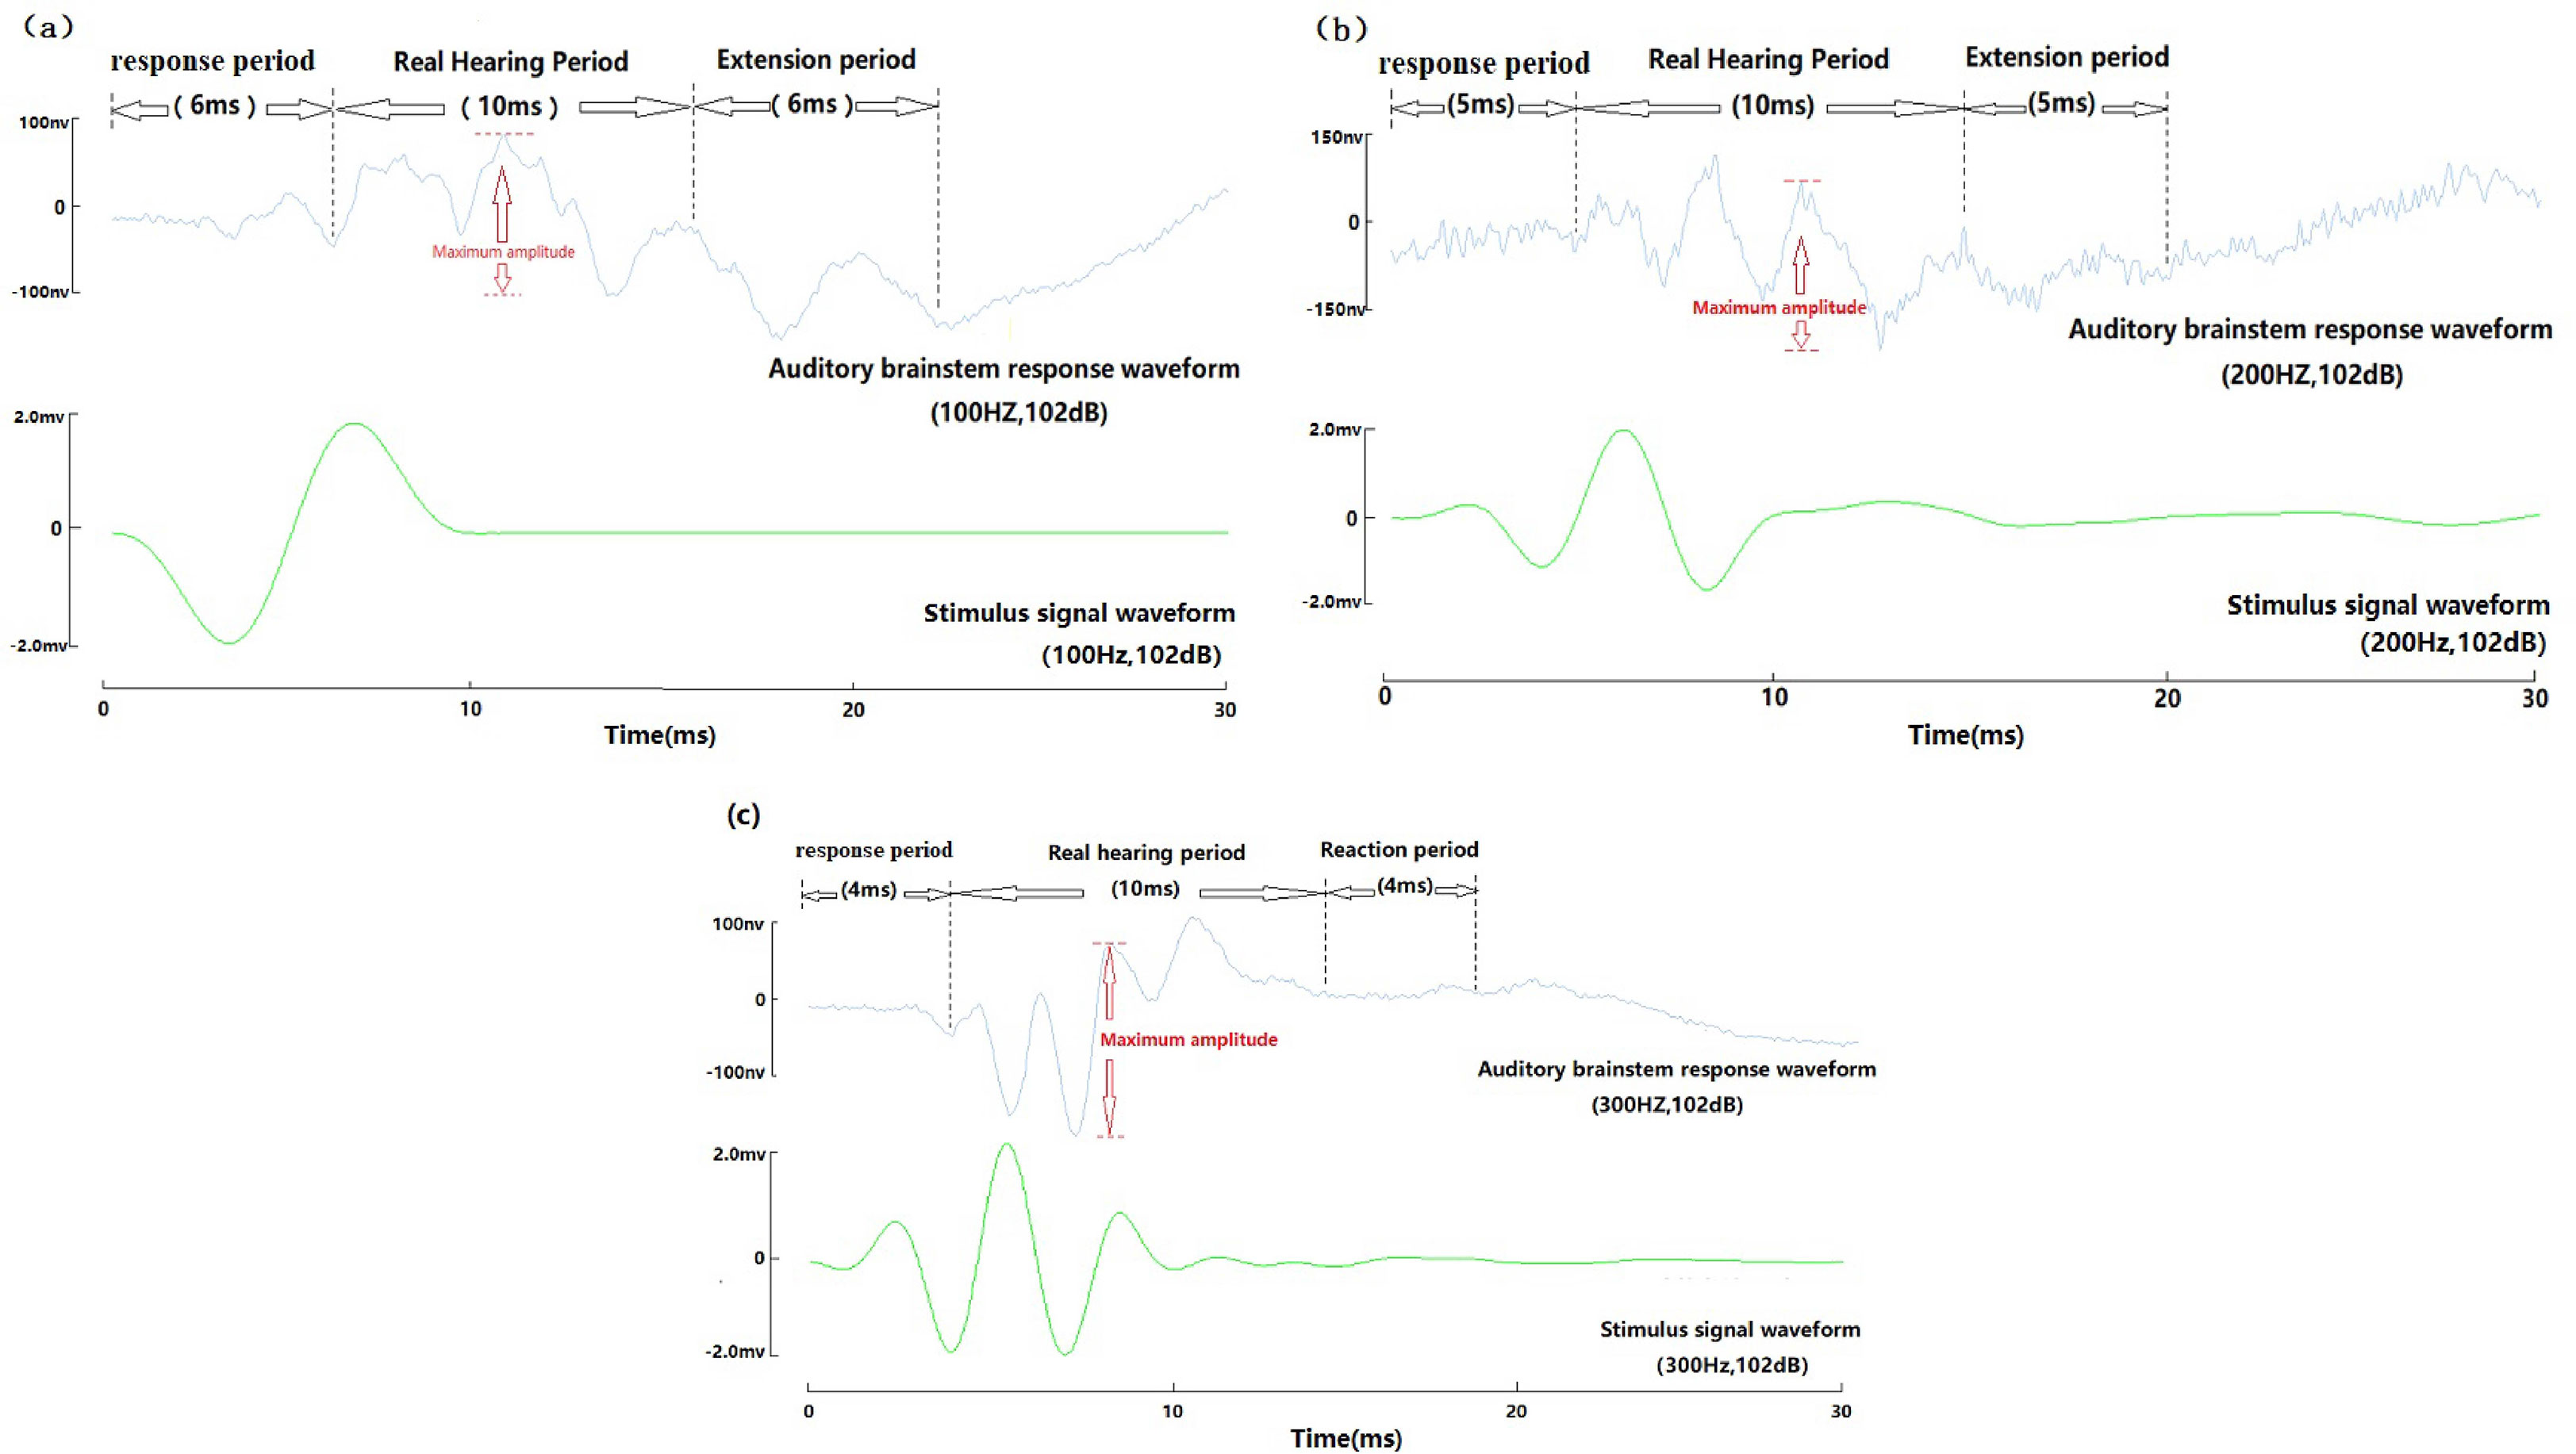
Figure 6 Auditory brainstem response three periodic diagrammatic sketch of wild yellow grouper. (A) 100Hz, 102dB three periodic diagrammatic sketch; (B) 200Hz, 102dB three periodic diagrammatic sketch; (C) 300Hz, 102dB three periodic diagrammatic sketch.
Control group and Experimental group are set in the experiment. Control group: The auditory brainstem response waveform of dead fish and fish in quiet state both showed amplitude below 50nv.
Response period: The time from the recording to the stimulus signal waveform to the presentation of an obvious waveform (trough or peak), the maximum value of the waveform before the end of the response period is less than 50nv, and the amplitude of the first waveform after the end of the response period is between 50nv-150nv;
Real hearing period: After the end of the response period, the time from the beginning of the formation to the end of the stimulus waveform. The first waveform amplitude in the real hearing period was between 50nv and 150nv;
Extension period: From the end of the real hearing period until the maximum amplitude of all waveforms is below 50nv;
In the range of 100-2000Hz, at the same sound pressure level, the ABR response time of yellow grouper decreased with the increase of frequency. The response period is 2-10ms. At the same frequency, the response time increases with the decrease of the sound pressure level, about 0.8-1ms increase with 10dB sound pressure decrease. At the end of the response period, the waveform presents a trough, and then enters the real hearing period. The real hearing period includes the maximum amplitude. When the maximum amplitude sound pressure value of a certain amplitude is between 50-60nv, and the maximum sound pressure level of the next sound pressure level is less than 50nv, the sound pressure level at this time is determined as threshold for the experimental fish’s hearing. Generally, the ABR curve is clearer when the sound pressure level is above 10dB more than the hearing threshold. During the real hearing period, the number of clear peaks of the ABR = frequency/100+1; the extension period is consistent with the response period time. It increases as the response period time increases.
To determine the animal’s neuropotential change, 2 kinds of stimulation signals with opposite phases and same amplitude can be used. If the evoked waveform shows a waveform independent of the phase of the stimulus sound and the amplitude is below 1000nv, it indicates that the potential change is correct ABR waveform. In theory, the sound signals of opposite phases superimposing each other can eliminate the interference of the ambient noises in the ABR waveform (Zhang et al., 2016). However, due to experimental conditions, such as the resonance of the experimental tank and the reflection of the sound, etc., some noises cannot be completely eliminated after superposition, and there are still some residuals of the noises, but the characteristics of the sound artifacts are that the wave fluctuations are parallel to the baseline. The ABR waveform, after superimposed, shows a positive or negative peak relative to the baseline fluctuation, which is similar to the results of Kenyon’s auditory threshold study in the goldfish (Carassius auratus) (Kenyon et al., 1998; Yan and Curtsinger, 2000).
The experiment requires extremely strict environmental condition. The first thing to be solved is the interference of power frequency noise. Manufacturing a metal shielding room can greatly reduce this interference. At the same time, all metal equipment must be completely grounded, so a part of power frequency interference can be filtered out. The sound produced by the speaker mainly depends on the sound pressure vibration, while the fish’s perception of the sound or mechanical wave mainly involves the sound pressure perception or particle movement displacement perception (Yang et al., 1999; Takahito et al., 2005). For hearing-sensitive fish, the connection (or relatively close) between inner ear and swim bladder, improves the sensitivity of sound pressure perception (Fine et al., 2009), also increases the upper limit of hearing threshold. Therefore, the hearing ceiling of hearing-sensitive fish can reach several thousand hertz. Fishes, lacking connection between inner ear and swim bladder are more sensitive to low-frequency particle movements, such as groupers, while fishes without swim bladder are only sensitive to particle displacement (Yan, 2003). ABR is more suitable for the auditory threshold study of sound pressure sensing fish, while the low frequency sound signal involves more particle displacement signals in addition to the sound pressure signal (Lu, 2004; Radford et al., 2012; Wang et al., 2018).
At present, the hearing research data of the grouper is very scarce. In 1999, Yang et al. used electrocardiogram (ECG) technology to study the auditory threshold of the seven-band grouper (Epinephelus septemfasciatus); In 2019, Liu Bin et al. used the ABR technique to study the auditory threshold of the pearl gentian grouper (Epinephelus fuscoguttatus ♀ × Epinephelus lanceolatus ♂) (Liu et al., 2019). The results showed that in the frequency range of 100-1000Hz, the auditory curve of these two groupers are “U-shaped”. In this study, the hearing curve of the yellow grouper is very similar to that of the above reported two groupers. But the optimal hearing frequency and threshold are different, which may be related to the size and source of the test fish. It is also related to the differences in fish hearing detection techniques used in the two studies. According to the results of Takahito’s et al. (Takahito et al., 2005). Using ABR and ECG technique to determine the auditory threshold of the carp (Cyprinus carpio), the most sensitive frequency measured by ABR is 505Hz, while the most sensitive frequency measured by ECG is 1000Hz. Although the shape of the auditory curve obtained using ABR technology and ECG technology is similar, the threshold level is different.
We also carried out the auditory threshold detection of marbled rockfish (Sebastiscus marmoratus), and the results obtained were consistent with Zhang’s research results (Zhang et al., 2018). In Zhang’s research, the interference sound signal reflected from the water environment is relatively large. In this study, the method of embedding the speaker with quartz sand reduces the agitation of the speaker to water and sound signal radiation. And ABR curve of marbled rockfish is clearer. The ABR waveform characteristics of marbled rockfish are basically consistent with the ABR waveform characteristics of yellow grouper. ABR waveform also showed three periods: response period, real hearing period and extension period (Figure 7). Generally, the amplitude of this point is less than 50nv relative to the baseline; the extension period begins at the end of the real hearing period, and the end is generally after the maximum waveform amplitude value does not exceed 50nv.
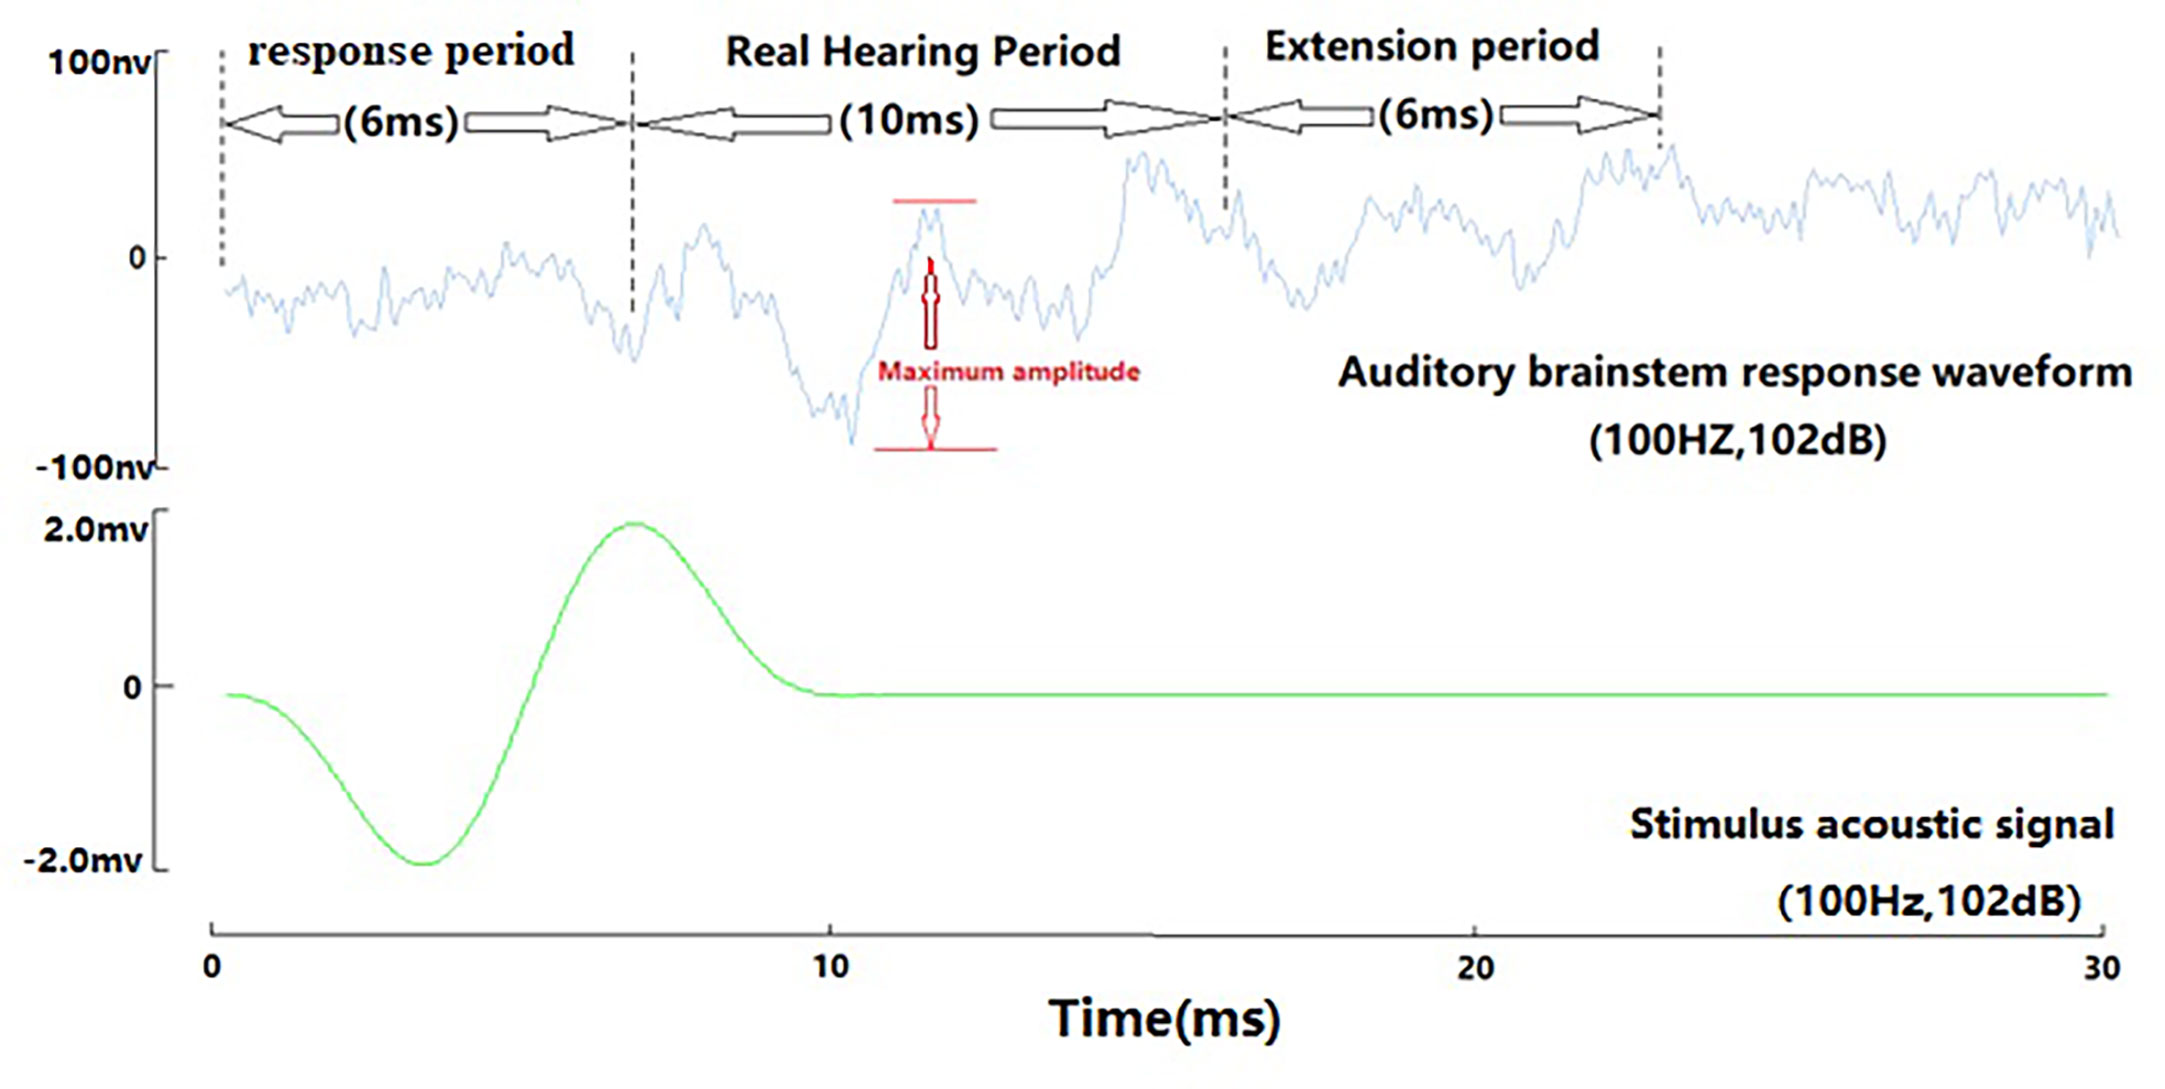
Figure 7 ABR three-cycle waveform of marbled rockfish (100Hz, 102dB).
The raw data supporting the conclusions of this article will be made available by the authors, without undue reservation.
The animal study was reviewed and approved by Laboratory Animal Center, Xiamen University.
MC, XX, and XYZ designed the experiment. XYZ and XHZ set up the experiment system, collected data and analyzed data. XYZ drafted this original manuscript. MC and XX edited the manuscript. All authors contributed to the article and approved the submitted version.
The study was partly funded by the National Key R&D Program of China (No. 2018YFC1406301) and the Natural Science Foundation of Fujian Province, China (No. 2018J01066).
The authors thank all reviewers for their constructive comments, which greatly improved this paper. We also gratefully acknowledge Professor Qi Zhi of Xiamen University and Professor Zhang Xuguang of Shanghai Ocean University for their suggestions and help in the establishment of auditory threshold detection system. Truly appreciate engineer Xiao Jiamei of Xiamen University, Postdoc Jv Peilong of Ocean University of China and Mr. Zhao Yu for their help in the experiment. The authors also thank Prof. Robin Robertson for editing the manuscript.
The authors declare that the research was conducted in the absence of any commercial or financial relationships that could be construed as a potential conflict of interest.
All claims expressed in this article are solely those of the authors and do not necessarily represent those of their affiliated organizations, or those of the publisher, the editors and the reviewers. Any product that may be evaluated in this article, or claim that may be made by its manufacturer, is not guaranteed or endorsed by the publisher.
Fay R. (2009). Soundscapes and the sense of hearing of fishes. Integr. Zool. 4 (1), 26–32. doi: 10.1111/j.1749-4877.2008.00132.x
Fine M. L., King C. B., Cameron T. M. (2009). Acoustical properties of the swimbladder in the oyster toadfish Opsanus tau. J. Exp. Biol. 212 (21), 3542–3552. doi: 10.1242/jeb.033423
Hildebrand J. A. (2009). Anthropogenic and natural sources of ambient noise in the ocean. Mar. Ecol. Prog. Ser. 395 (5), 5–20. doi: 10.3354/meps08353
Kenyon T. N., Ladich F., Yan H. Y. (1998). A comparative study of hearing ability in fishes: The auditory brainstem response approach. J. Comp. Physiol. A 182 (3), 307–318. doi: 10.1007/s003590050181
Kight C. R., Swaddle J. P. (2011). How and why environmental noise impacts animals: An integrative, mechanistic review. Ecol. Lett. 14 (10), 1052–1061. doi: 10.1111/j.1461-0248.2011.01664.x
Liu B., Liu X. F., Zhang Y. F., Liu H., Huang B., Gao Y. Y. (2019). Study on auditory thresholds of pearl gentian grouper. Fishery Modernization 46 (01), 6–12. doi: 10.3969/j.issn.1007-9580.2019.01.002
Lu Z. (2004). “Neural mechanisms of hearing in fishes,” in The senses of fish: Adaptations for the reception of natural stimuli. Eds. Von Der Emde G., Mogdans G. J., Kapoor B. G. (Boston: Kluwer Academic Publishers), 147–172.
Pan H. L., Wang J. P., Yu D. Z., Yang G., Shi H. B., Wang J., et al. (2017). Establishment and application of zebrafish auditory evoked potential (AEP) detection system. J. Audiol. Speech Pathol. 25 (03), 269–274. doi: 10.3969/j.issn.1006-7299.2017.03.013
Popper A., Hastings M. (2009). The effects of anthropogenic sources of sound on fishes. J. Fish Biol. 75 (3), 455–489. doi: 10.1111/j.1095-8649.2009.02319.x
Radford C. A., Montgomery J. C., Caiger P., Higgs D. M. (2012). Pressure and particle motion detection thresholds in fish: a re-examination of salient auditory cues in teleosts. J. Exp. Biol. 215 (19), 3429–3435. doi: 10.1242/jeb.073320
Takahito K., Hirosuke I., Tomoyoki K., Toru T., Tomanari A. (2005). Measurements of auditory sensitivity in common carp Cyprinus carpio by the auditory brainstem response technique and cardiac conditioning method. Fisheries Sci. 71 (1), 95–100.
Wang Y. N., Yu J. N., Zhuang X., Li H. Q., Liu H. C., Yu X. M., et al. (2018). Auditory sensitivity in crucian carp Carassius auratus Linnaeus. J. Dalian Ocean Univ. 33 (06), 775–781. doi: 10.16535/j.cnki.dlhyxb.2018.06.015
Yan H. Y. (2003). “The role of gas-holding structures in fish hearing: An acoustically evoked potentials approach,” in The senses of fish. Eds. von der Emede G., Mogdans J. (New Delhi: Narosa Publishing House), 189–209.
Yan H., Curtsinger W. (2000). The otic gasbladder as an ancillary auditory structure in a mormyrid fish. J. Comp. Physiol. A Sensory Neural & Behav. Physiol. 186 (6), 595–602. doi: 10.1007/s003590000114
Yang Y. S., Seo D. O., Lee C. H. (1999). A basic study for the behavior control of sevenband grouper,Epinephelus septemfasciatus,to underwater low frequency sound i. the auditory thresholds of sevenband grouper. J. Korea Inf. & Commun. Soc. 35 (4), 391–396.
Zhang X. G., Guo H. Y., Song J. K. (2018). Thresholds for the hearing of marbled rockfish Sebasticus marmoratus. Acta Hydrobiol. Sin. 42 (03), 593–598. doi: 10.7541/2018.074
Zhang X., Guo H., Wang Z., Pan Y., Song J. (2015). Sound production in marbled rockfish (Sebastiscus marmoratus) and implications for fisheries. Integr. Zool. 10 (1), 152–158. doi: 10.1111/1749-4877.12105
Keywords: auditory brainstem response, auditory threshold detection, Epinephelus awoara, wild type, Xiamen city
Citation: Zhu X, Zhang X, Chen M and Xu X (2023) Characteristics of auditory brainstem response in wild yellow grouper Epinephelus awoara. Front. Mar. Sci. 10:1135310. doi: 10.3389/fmars.2023.1135310
Received: 31 December 2022; Accepted: 27 February 2023;
Published: 13 March 2023.
Edited by:
Xian Li, Ocean University of China, ChinaReviewed by:
Jie Gong, Nantong University, ChinaCopyright © 2023 Zhu, Zhang, Chen and Xu. This is an open-access article distributed under the terms of the Creative Commons Attribution License (CC BY). The use, distribution or reproduction in other forums is permitted, provided the original author(s) and the copyright owner(s) are credited and that the original publication in this journal is cited, in accordance with accepted academic practice. No use, distribution or reproduction is permitted which does not comply with these terms.
*Correspondence: Mingru Chen, bXJjaGVuQHhtdS5lZHUuY24=; Xiaomei Xu, eG14dUB4bXUuZWR1LmNu
†These authors share first authorship
Disclaimer: All claims expressed in this article are solely those of the authors and do not necessarily represent those of their affiliated organizations, or those of the publisher, the editors and the reviewers. Any product that may be evaluated in this article or claim that may be made by its manufacturer is not guaranteed or endorsed by the publisher.
Research integrity at Frontiers
Learn more about the work of our research integrity team to safeguard the quality of each article we publish.