 Yaxi Peng
 Antonio Jarquin Laguna
 Apostolos Tsouvalas
- 1Department of Structural Engineering, Delft University of Technology, Delft, Netherlands
- 2Department of Maritime & Transport Technology, Delft University of Technology, Delft, Netherlands
Underwater noise from offshore pile driving has raised significant concerns over its ecological impact on marine life. To protect the marine environment and maintain the sustainable development of wind energy, strict governmental regulations are imposed. Assessment and mitigation of underwater noise are usually required to ensure that sound levels stay within the noise thresholds. The air-bubble curtain system is one of the most widely applied noise mitigation techniques. This paper presents a multi-physics approach for modeling an air-bubble curtain system in application to offshore pile driving. The complete model consists of four modules: (i) a compressible flow model to account for the transport of compressed air from the offshore vessel to the perforated hose located in the seabed; (ii) a hydrodynamic model for capturing the characteristics of bubble clouds in varying development phases through depth; (iii) an acoustic model for predicting the sound insertion loss of the air-bubble curtain; and (iv) a vibroacoustic model for the prediction of underwater noise from pile driving which is coupled to the acoustic model in (iii) through a boundary integral formulation. The waterborne and soilborne noise transmission paths are examined separately, allowing us to explore the amount of energy channeled through the seabed and through the bubble curtain in the water column. A parametric study is performed to examine the optimal configuration of the double bubble curtain system for various soil conditions and pile configurations. Model predictions are compared with measured data. The model allows for a large number of simulations to examine different configurations of a single bubble curtain and a double big bubble curtain.
1 Introduction
Offshore wind energy has been the main contributor to a sustainable and carbon-free energy supply. The monopiles are the main foundation of offshore wind turbines. The installation of the piles generates a significant amount of underwater noise, which causes serious concerns for the marine environment (Bailey et al., 2010; Hastie et al., 2019). To minimize the impact of noise emission on the marine ecosystem system and to protect the fish, invertebrates, crustaceans and marine mammals (Tidau and Briffa, 2016; Chahouri et al., 2022), strict regulations on the noise threshold have been imposed by the government in many countries (International Maritime Organization, 2014; Williams et al., 2014; National Oceanic and Atmospheric Administration, 2016; Merchant et al., 2022). To reduce noise levels at the source, vibratory installation of monopiles are utilized either by replacing or in combination with impact hammers. The change in the installation method can significantly alter the characteristics of the radiated wave field (Dahl et al., 2015; Tsouvalas and Metrikine, 2016b; Tsouvalas, 2020). Furthermore, the non-linear conditions at the pile-soil interface can have a substantial impact on the dynamic response of the pile and the wave field in the surrounding medium (Molenkamp et al., 2023; Tsetas et al., 2023).Various noise mitigation systems have been employed to block noise transmission in seawater, e.g., the air-bubble curtain system, the hydro-sound damper system, the noise mitigation screen and resonator-based noise mitigation systems (Lee et al., 2014; Verfuß, 2014; Nehls et al., 2016). The efficiency Hydro-Sound-Damper system (HSD) has been examined through measurements and offshore tests as shown in Elmer et al. (2012); Bruns et al. (2014), which indicates the significant influence of the soil conditions on the sound emsission and the effectiveness of the system. However, the HSD system is deployed in the pile vicinity and therefore any energy that is radiated into elastic waves in the soil cannot be blocked and can eventually leak back into the seawater column outside the HSD net. Moreover, the HSD net is based on linear principles of noise attenuation (resonances of the air-filled balloons and acoustic wave scattering) and as such the size of the elements attached to the net needs to be very large when it comes to dominant frequency ranges associated with large monopiles. Therefore, the efficiency of HSD nets still needs further investigation when it comes to noise radiation from large size monopiles (D>7-8m) that are installed nowadays. The innovative open-ended resonators were developed by AdBm Technologies and the University of Texas at Austin Lee et al. (2014). The acoustic behaviour of both the open-ended resonators and the encapsulated air bubbles was investigated through laboratory tests and open-water tests. Among these noise abatement technologies, the air-bubble curtain system is the most widely applied in the offshore industry. Before installing monopiles, perforated hoses are positioned at the seabed in a circle or an ellipse layout and air is injected from the air-compressor vessels through risers in connection with the hoses. The freely rising air bubbles are released from nozzles and create a layer of bubbly mixture. Significant noise reductions can be achieved by a large impedance mismatch between the seawater and the bubble-fluid mixture and the resonance of bubbles. Compared to the other sound abatement systems, the air-bubble curtain system is the only far-field noise mitigation technique deployed so far in full scale. The system can be positioned up to 200m away from the pile and can largely capture the energy channeled from the soil back into the water column. In contrast, the near-field noise mitigation systems, such as the hydro-sound damper system (Elmer et al., 2012; Bruns et al., 2014; Nehls et al., 2016) or noise mitigation screen can only mitigate the sound radiated directly from the pile surface into the seawater. The use of a double big bubble curtain system (DBBC) configuration is usually adopted for foundation piles with large dimensions, and can be used in combination with other mitigation techniques in the vicinity of the pile to achieve acceptable noise levels. The configuration of the bubble curtain is usually standard and is based on common engineering experiences.
Many noise prediction models for impact pile driving have been developed over the last decade (Reinhall and Dahl, 2011; Tsouvalas and Metrikine, 2013; Zampolli et al., 2013; Tsouvalas and Metrikine, 2014; Fricke and Rolfes, 2015; Lippert et al., 2016; Wilkes et al., 2016; Dahl and Dall’Osto, 2017; Lippert et al., 2018; Tsouvalas, 2020; Peng et al., 2021a). The sound levels are expected to exceed the limits of Sound Exposure and Peak pressure levels without the application of the noise abatement system. To examine the performance of an air-bubble curtain system, a semi-analytical model was developed in (Tsouvalas and Metrikine, 2016a). The dynamic interaction between the pile, water, soil, and air-bubble curtain is captured through a mode-matching technique. The acoustic properties of the bubble curtain are determined by an effective wavenumber theory (Commander and Prosperetti, 1989), assuming the bubbly layer is a homogeneous medium with mono-sized bubble distribution. The finite element (FE) model developed in (Lippert et al., 2017) uses a simplified approach by modeling the air bubble curtain with a fully absorbing layer. A model based on the hydrodynamic behavior of bubble breakup and coalescence is developed by Bohne et al. (Bohne et al., 2019). The various bubble generation and development phases are captured and the acoustic characteristics are determined with a depth- and frequency-dependent transfer function. The FE module, including the pile, water, soil and bubble layer described by the bubble dynamic model is used for the noise source generation and propagation. Subsequently, the bubble size distribution is optimized by the two fractions of bubbles, namely large and small bubbles in (Bohne et al., 2020). The results showed a reasonable agreement with the measurement data. A semi-analytical model (Peng et al., 2021b) is developed where the hydrodynamic module for describing the bubble formation process is coupled to the vibroacoustic model for noise prediction from pile driving through a boundary integral formulation. The results indicate that an accurate description of the acoustic characteristics of the bubbly layer is critical for modeling noise mitigation using the air-bubble curtain system. The performance of the air-bubble curtains can vary significantly in azimuth direction due to the inherent variations in the airflow circulation through the perforated pipes positioned on the seabed surface. As the air flow rate through the nozzle can have a significant impact on bubble generation and development, there is a need to determine the flow velocity of the air as generation and the development of the bubble curtain are sensitive to the initial conditions at the nozzle (Bohne et al., 2020).
In this paper, the authors developed a multi-physics model for modeling noise mitigation using the air-bubble curtain system. The complete model consists of four modules: (i) a compressible flow model to account for the transport of compressed air in the hose; (ii) a hydrodynamic model for capturing the characteristics of bubble clouds in varying development phases through depth and range; (iii) an acoustic model for predicting the sound insertion loss of the air-bubble curtain; and (iv) a vibroacoustic model for the prediction of underwater noise from pile driving which is coupled to the acoustic model in (iii) through a boundary integral formulation. The flow of the modeling activity is shown in Figure 1. The structure of the paper is as follows. In Section 2, the description of the compressible flow model is given together with the governing equations. The description of the hydrodynamic and acoustic models is given in Section 3. In Section 4, the vibroacoustic model for predicting the noise in the mitigated field are introduced. In Section 5, a sensitivity study is performed to examine the acoustic characteristics of the bubble curtain. In Section 6, the validation study based on an offshore installation campaign is presented. Finally, Section 7 gives an overview of the main conclusions of the paper.
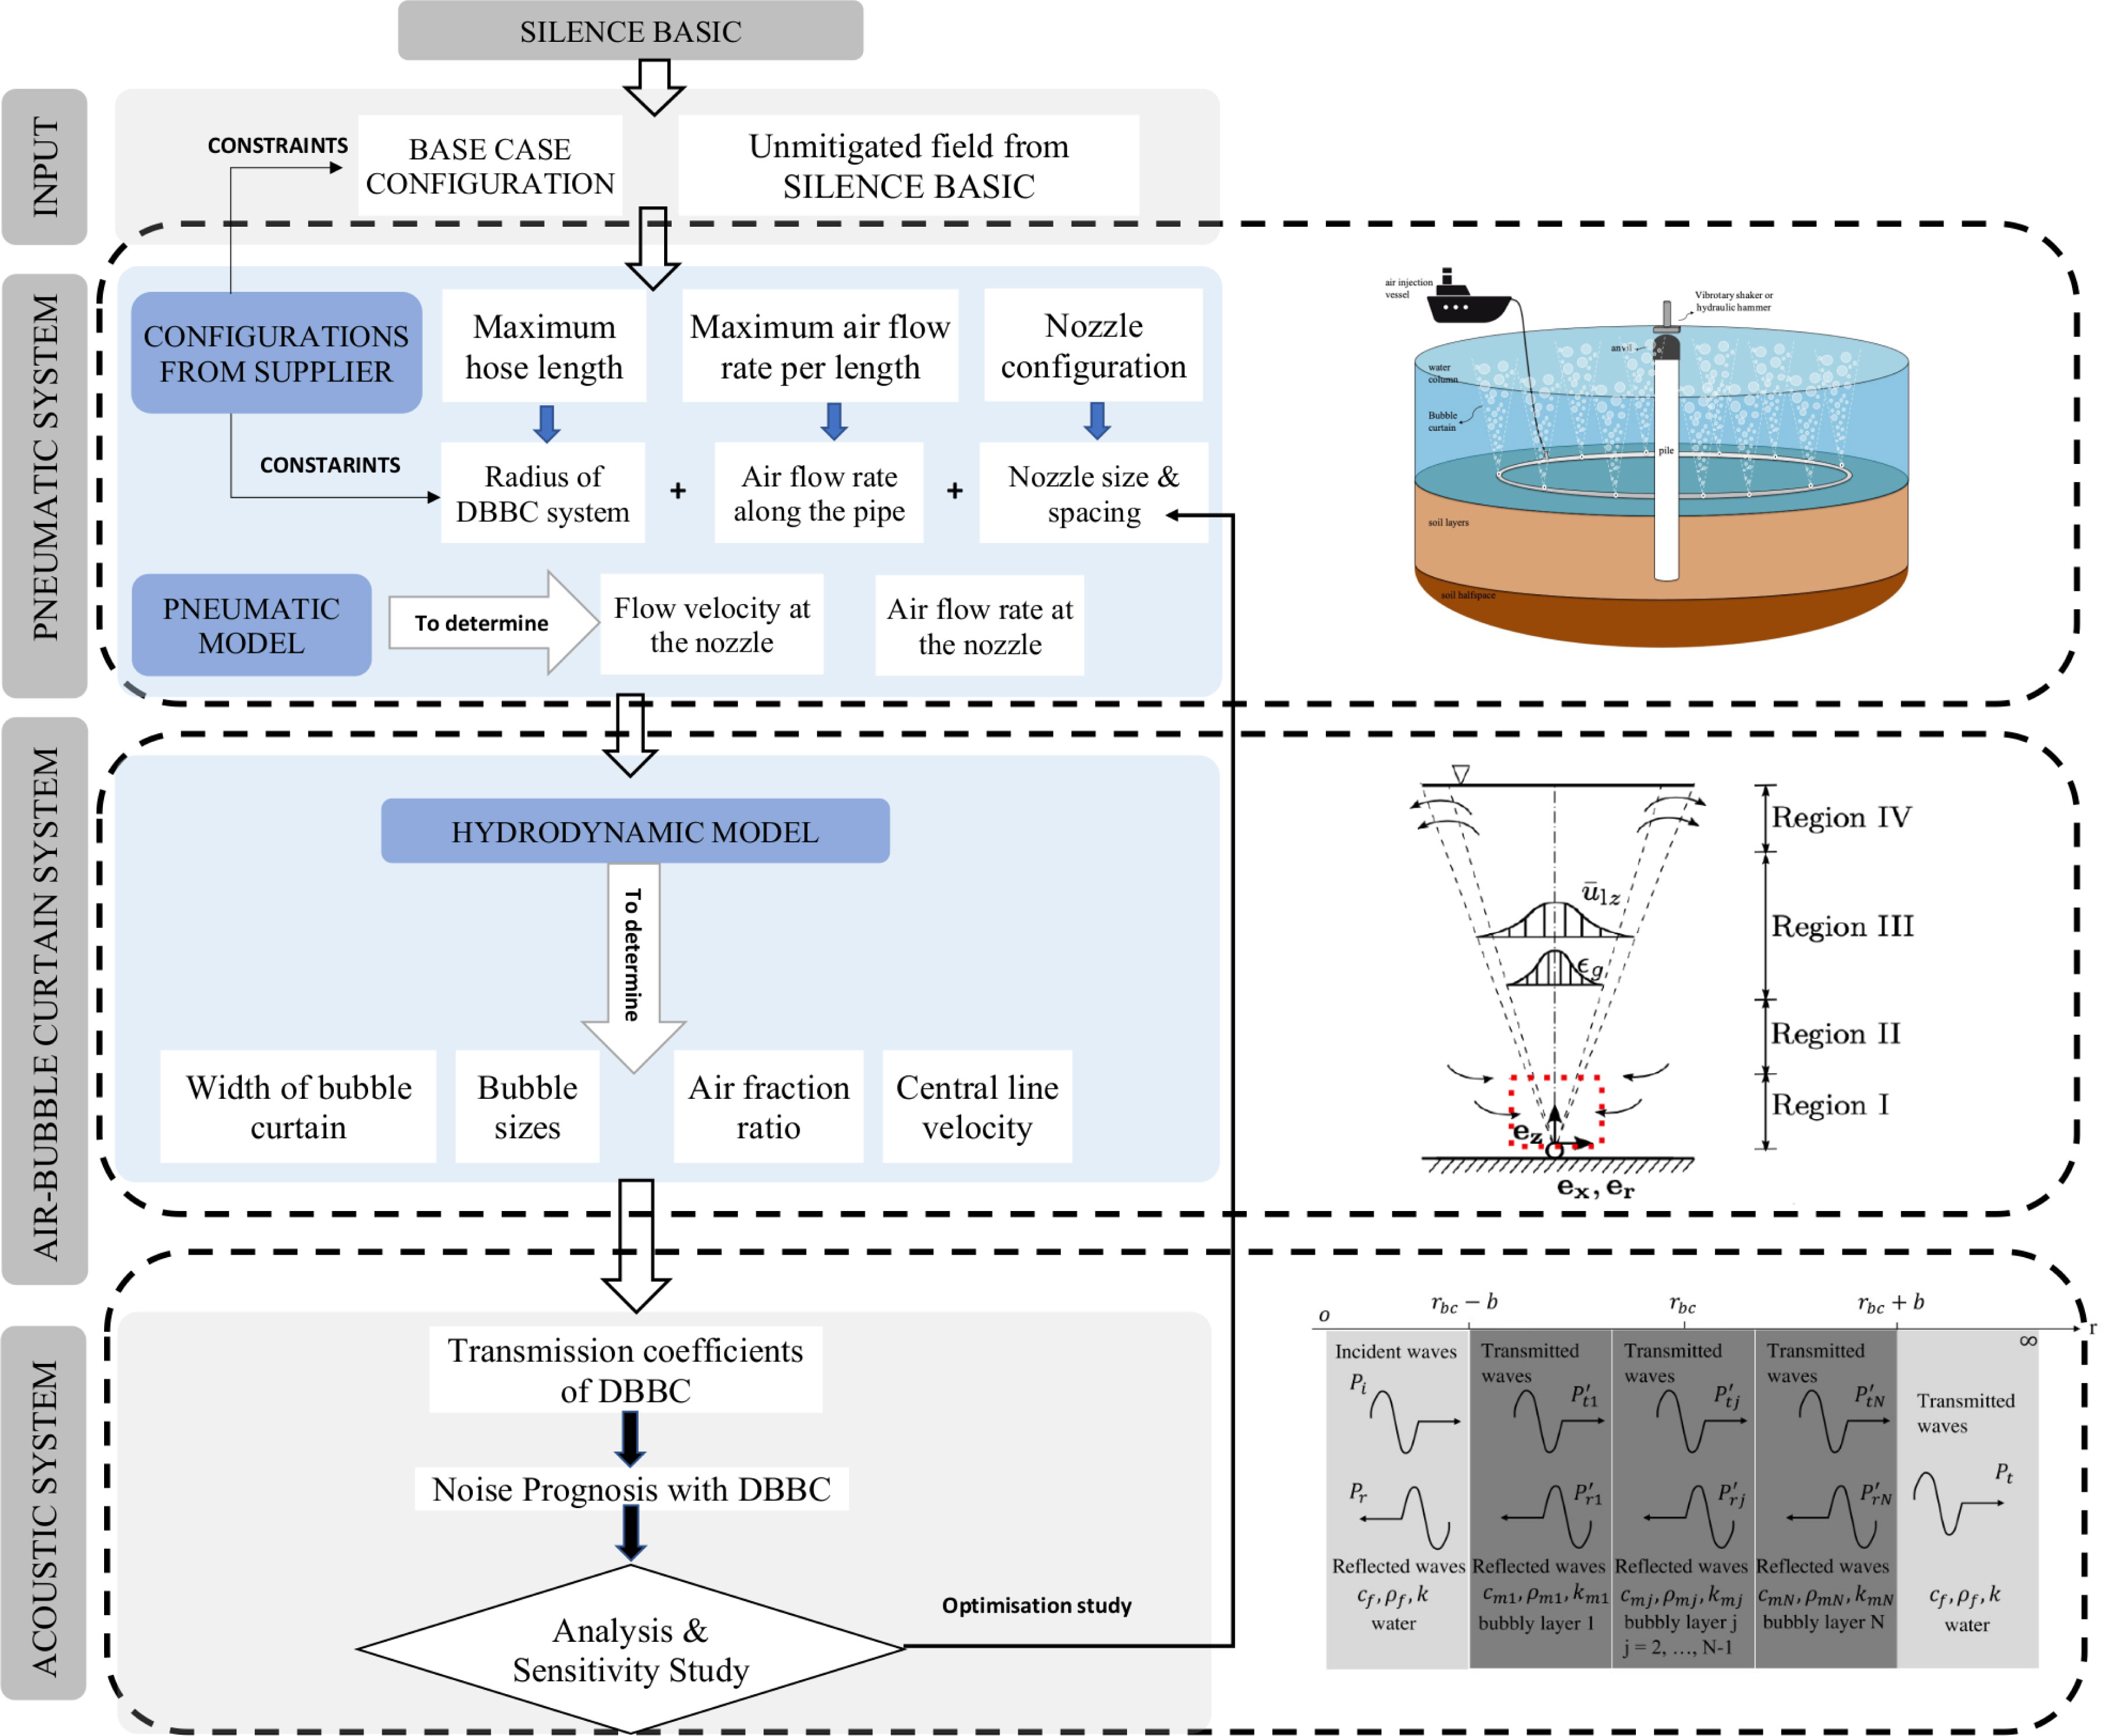
Figure 1 Activity flow of the complete model: 1) define the input of the model; 2) modelling of the pneumatic system; 3) modelling of the air-bubble curtain system; 4) modelling of the mitigated sound field with the use of DBBC.
2 Compressible flow model
In this Section, the pneumatic model is presented for modeling the transport of compressed air from the air-injection vessel to the perforated hose on the seabed. The governing equations are given and the field test is presented for examining the pressure variation along the hoses for various airflow rates.
2.1 Description of the model
An engineering model is being developed using compressible flow theory to predict the operational parameters of a given hose-nozzle configuration used for bubble curtain generation. The total amount of air that is being delivered by the series of compressors is used as the main input and given as a volumetric flow rate at free air delivery conditions (FAD1). The other input parameters consist of the density of seawater and air, water depth, and the geometrical characteristics of the feeding and perforated hose configuration. The results of the numerical model give the pressure distribution along the hose together with the average axial flow velocities and mass flow rates at each nozzle location. The total required upstream pressure considering the feeding hose can also be assessed.
The model considers a straight, horizontal hose with a constant diameter and uniform spacing of identical nozzles. The air is injected from from two sides of the hose. Hence, the model assumes symmetry and only half of the total length is required to characterize the flow and pressure distribution; this is represented through a zero flow boundary condition to make sure that all the air is depleted at 180° from the injected position. The hose is discretized into a fixed number of segments according to the total length L and the nozzle spacing S as shown in the schematic of Figure 2. As long as the number of segments is beyond 100, a regular polygonal approximation will closely resemble a circle and is visually indistinguishable for most practical purposes.
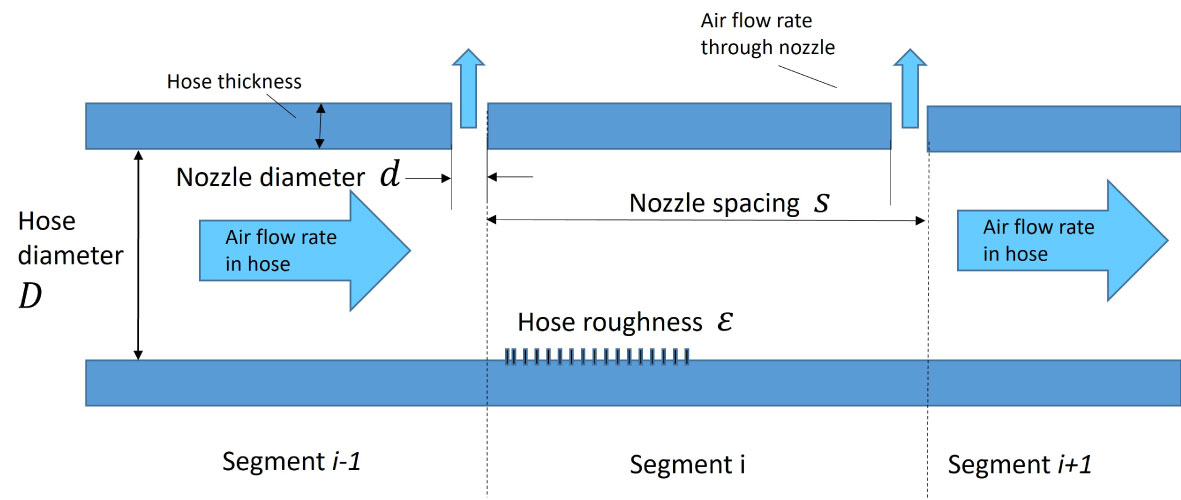
Figure 2 Schematic of the discretized model of the hose with nozzles for air transportation.
2.2 Governing equations
For each segment i, isentropic compressible flow theory in combination with the state equation of the ideal gas law is used to obtain the mass flow rate nz,i, across the nozzle with diameter d according to the following equations (Shapiro, 1953):
Where the discharge coefficient Cd = 0.55 is used for each nozzle (Nehls and Bellmann, 2016), γ = 1.402 is the air adiabatic constant, R = 287J/kg/K is the specific air gas constant, T = 291K (18°C) is the air temperature, Phst is the hydrostatic pressure outside the hose, Pi is the pressure inside the hose at each nozzle location, Mi and Ui are the Mach numbers and air velocities across the nozzles respectively. Conservation of mass is applied to the control volume of each segment to obtain the upstream mass flow rates i as a function of the flow rates through the nozzle and from the downstream segment.
Assuming that the velocity and fluid properties are constant across sections normal to the flow (i.e. no radial gradients), one-dimensional, isothermal compressible flow in pipes with a constant area is used to calculate the upstream pressure of each hose segment including friction. The pressure losses in each segment of length l include the friction factor f which is obtained by the Colebrook–White equation (Menon, 2015) according to the Reynolds number Re and hose roughness ϵ as described in the following equations:
2.3 Field test
A series of medium-scale tests were performed in Sliedrecht, the Netherlands in July 2022. The main objective of the tests was to provide measurements of the pneumatic system used to generate the bubble curtain in order to gain insights into the pressure distribution along the length of the hoses for different volumetric flow rates of injected air. The tests comprise several configurations with different hose sizes, hose lengths, spacing between nozzles, and nozzle diameters. In this Section, the test results for one configuration with varying air flow rates are presented to show the effect on the pressure distribution.
The measurements of the flow rate, pressure, and temperature sensors are continuously recorded during the entire measurement campaign. For each time trace of both flow and pressure measurements, several intervals under steady conditions were identified. The statistical values for each interval were calculated and reported for each pressure sensor located at certain distance from the feeding air as seen in Figure 3.
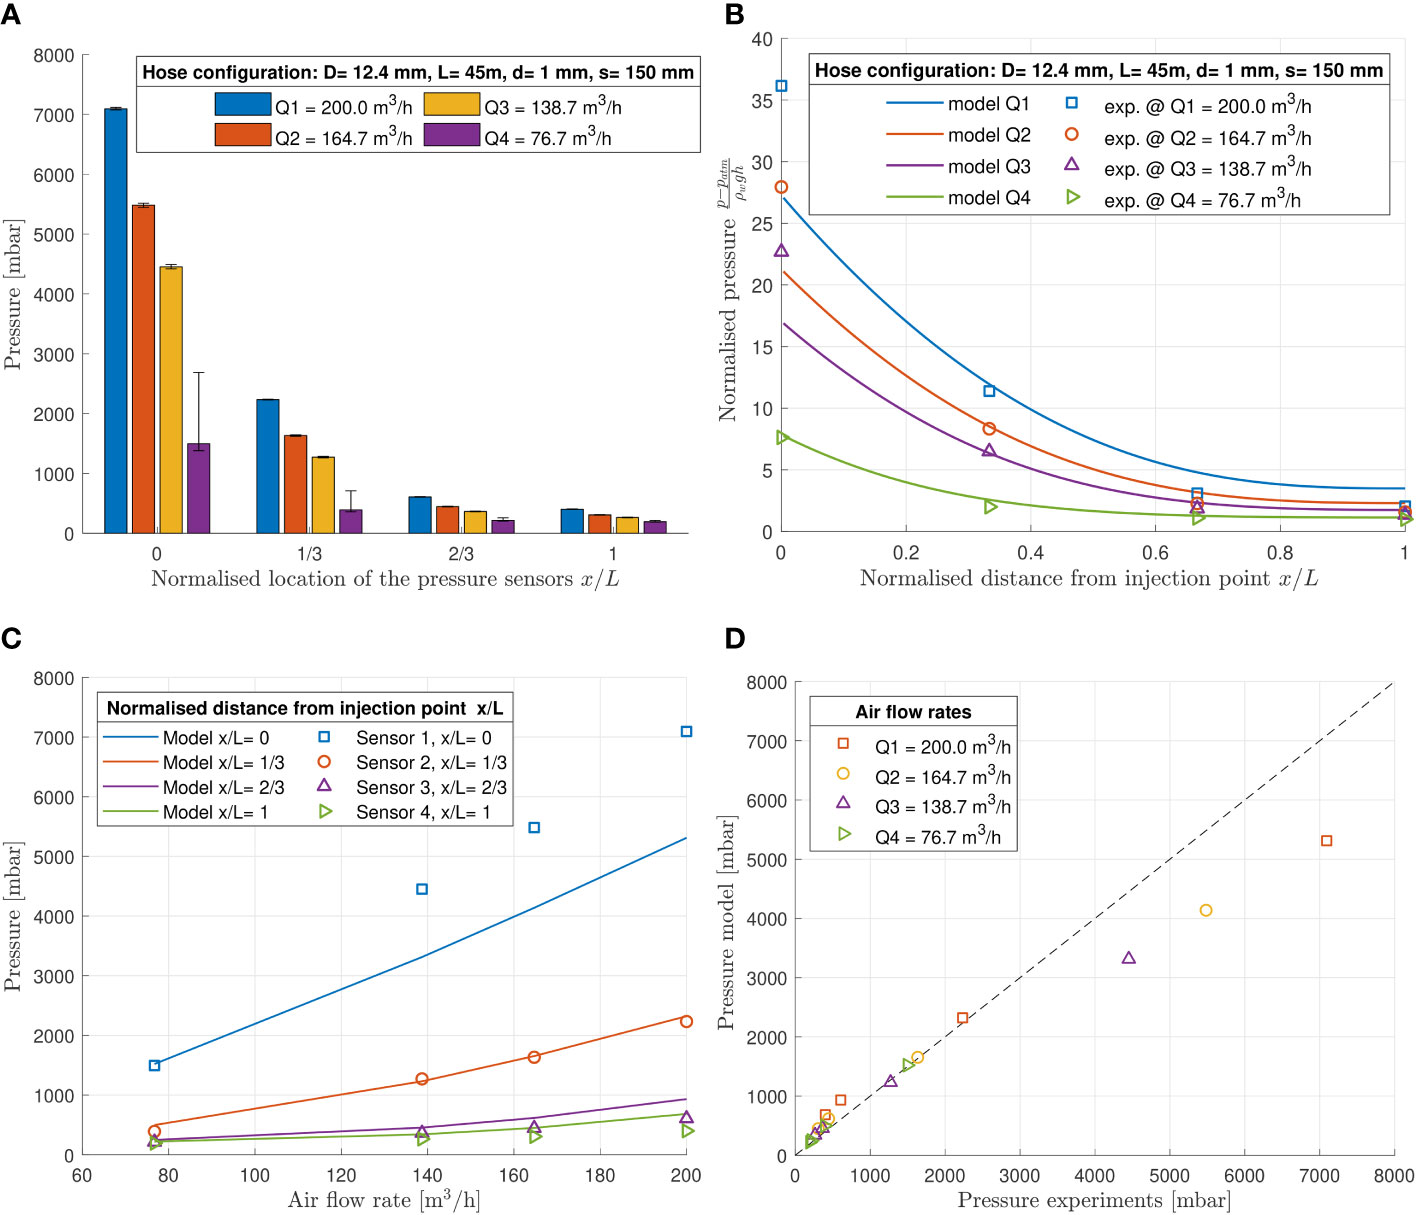
Figure 3 Comparison between simulation and experimental results for configuration tested at a water depth of 2.0m. L=45m, D=12.4mm, d=1.0mm, s=15cm. (A) Experimental results. (B) Pressure distribution along hose length. (C) Pressure vs airflow rate. (D) Comparison Model vs experiments.
The test configuration for one of the field tests is presented in Table 1 with varying flow rates from 76.7m3/hr to 200m3/hr. This particular configuration has the closest similarity to the current practice setup from the scaled parameters. As shown in Figures 3A, B, for each flow rate, the pressure decreases nonlinearly with the distance between the pressure sensor and the air injection point. The pressure amplitude against the volume of air per unit time is also presented in Figure 3C for sensors at different horizontal distance from the air injection point. The numerical results are compard to the model as shown in Figures 3B–D, which indicates the results from the model and the field test agree reasonably well for pressure measurements below 3 bar. However, when it comes to higher pressures above 4 bar, the simulation shows lower pressure at the feeding point at all flow rates cases as the pressure is significantly underestimated. The discrepancy can be attributed to the impact of the non-linear decrease of pressure closer to the air feeding point. The error bar on the top of each bar of the histogram in Figure 3 indicates the deviation from the mean value in the pressure during the recording at a constant flow rate. The nonlinear pressure drop indicates that the airflow circulation leads to the variation of the pressure and air flow through the nozzles in the azimuth, which has a significant impact on the performance of the air bubble curtain system along the circumference. By comparing the various airflow rates in the given hose-nozzle configuration, pressure at each location of the sensor increases nonlinearly with the airflow rate. The field test verifies the influence of the volumetric flow rate of the injected air on pressure distribution along the hose, which indicates that the performance of the air-bubble curtain varies along the circumference.
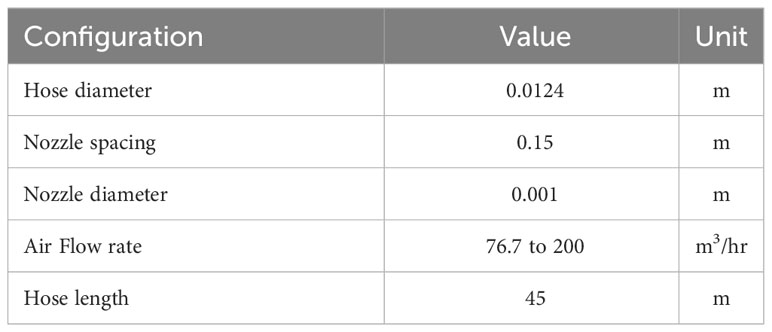
Table 1 Test configuration for the experiment.
3 Hydrodynamic and acoustic model for air-bubble curtain
The hydrodynamic model aims to capture the characteristics of bubble generation and development. The model describes a turbulent two-phase bubble flow, in which the bubble plume is developed from a nozzle and followed by the breakup and coalescence of bubbles. The modeling of the bubble formation is based on an existing model developed by (Bohne et al., 2019, 2020). Based on the airflow velocity through each nozzle derived from the pneumatic model, the input for the hydrodynamic model can be determined for a single bubble curtain configuration. The resulting set of equations reads,
In Eq. (7), u = [ulzm,b,ϵgm1,ϵgm2,v1,v2]. The results after solving the set of equations include the half-width of bubble curtain b, gas fraction ϵgm1 and ϵgm2, flow velocity ulzm, and mean bubble volume v1 and v2, which vary with the depth z. The expressions for the vector of the integral fluxes m(u,z) and the integral source term q(u,z) are presented in detail in (Bohne et al., 2020; Peng et al., 2021b) and are omitted here for the sake of simplicity.
The acoustic model includes the depth- and frequency-dependent transmission coefficients of each bubble curtain configuration. The model is based on a simplified one-dimensional acoustic wave propagation approach developed in (Commander and Prosperetti, 1989). Given the bubble characteristics obtained from the hydrodynamic model, the distribution of the local effective wavenumbers km(ω,z,r) is determined over the entire water depth as described in (Peng et al., 2021b). The transmission coefficients (z,ω) are then determined per z-coordinate and are constant within the vertical step size Δz of the integration. The transfer coefficient function is coupled to the noise prediction model through boundary integral equation. The local transmission loss (dB/m) is obtained as (Bohne et al., 2019; Peng et al., 2021b):
in which T is the height of the bubble curtain, the Δz is the integration step in the water column and M are the total number of vertical steps.
4 Vibroacoustic model for noise prognosis
The noise prediction model for offshore pile driving is depicted in Figure 4. The noise prediction module comprises a pile modeled as a linear elastic thin shell and surrounding media modeled as horizontally stratified acousto-elastic half-space. The hammer and anvil are not modeled explicitly, but replaced by a forcing function F(t). The direct boundary element method (BEM) is deployed to couple the noise prediction model for non-mitigated field and the acoustic model for the air-bubble curtain as discussed in Section 3. The solution of the acousto-elastic wavefield employs Somigliana’s identity in elastodynamics and Green’s third identity in potential theory (Achenbach, 1973; Beskos, 1987; Jensen et al., 2011). The response functions from the noise prediction model are coupled to the sound propagation module through a boundary integral formulation on the cylindrical boundary surface r = rbc. By utilizing Betti’s reciprocal theorem in elastodynamics (Beskos, 1987) and Green’s theorem for acoustic problem (Jensen et al., 2011), the complete solution for the acousto-elastic domain reads (Peng et al., 2021a):
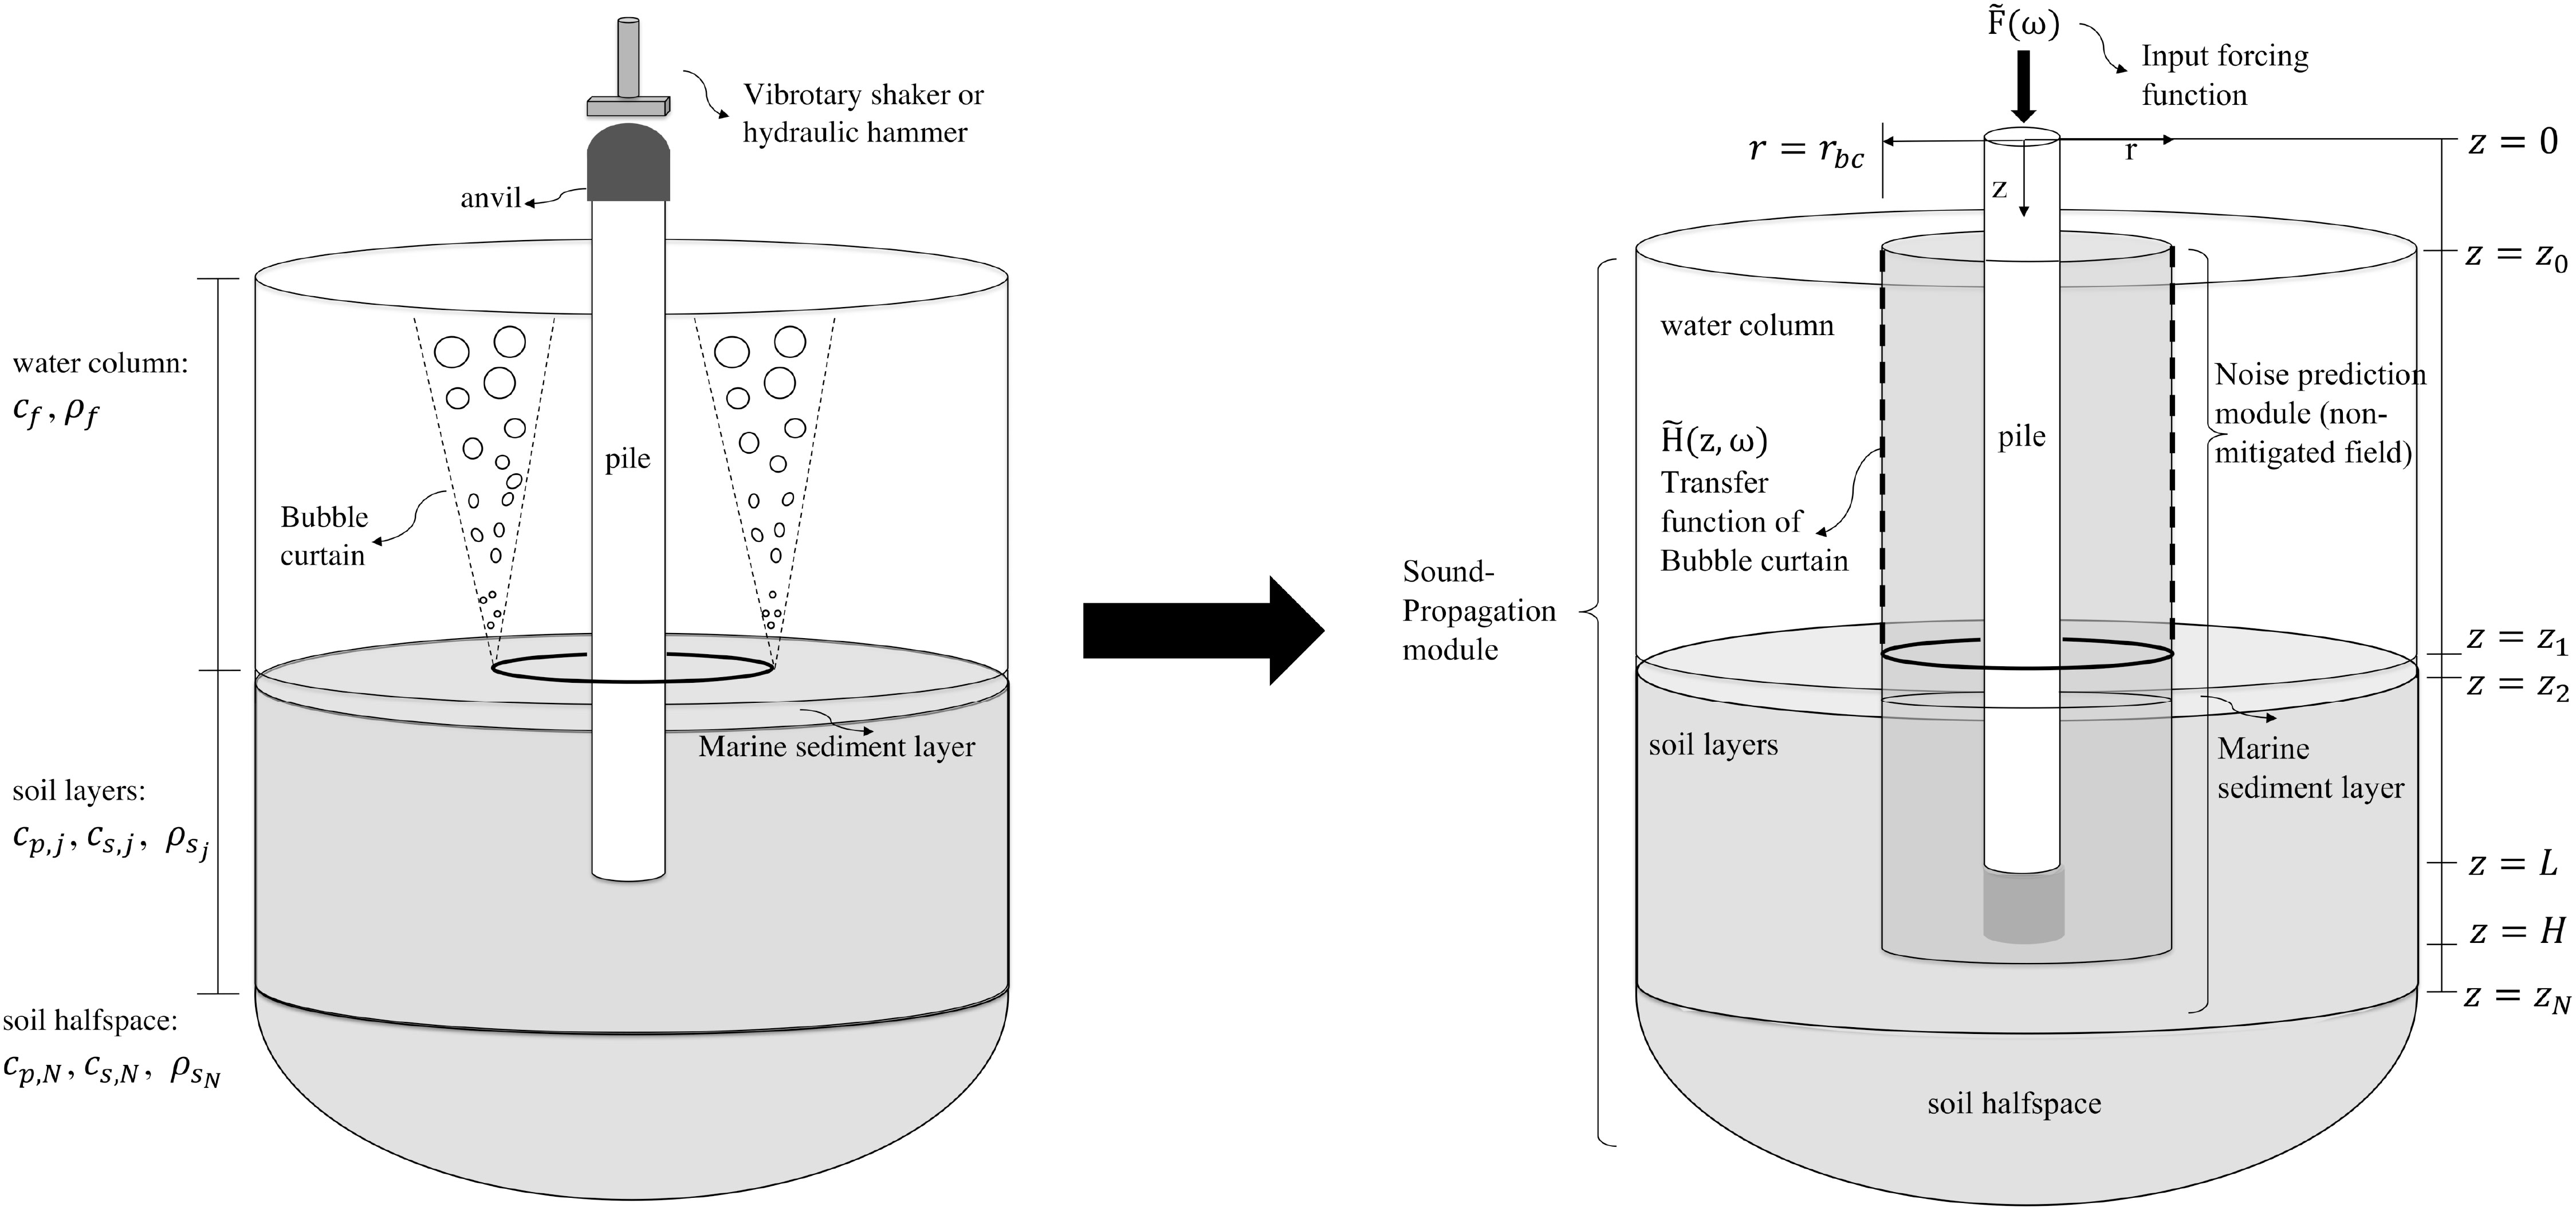
Figure 4 Geometry depiction of the complete system (left) and the coupled model (right) (Peng et al., 2021b).
in which the fundamental solutions of Green’s displacement tensors are derived from the potential functions (Achenbach, 1973) given the receiver point at r = (r,z) (in medium Ξ) in α-direction due to a unit impulse at source, rs = (rbc, zs) (in medium ξ) in β-direction n is the outward normal to the cylindrical boundary, (z,ω) is the transmission coefficient function of the air-bubble curtain with depthand frequency-dependence as discussed in Section 3.
5 Sensitivity analysis
In this Section, a parametric study is presented to examining the sensitivity of the acoustic characteristics of the air-bubble curtain system on the air volume injection rate, size of the bubble curtain, nozzle size of the hose, and DBBC configurations. As shown in Table 2, 13 scenarios are considered by varying the nozzle spacing and size, and flow velocity due to different air injection ratio and size of the bubble curtain. The base case nozzle configuration consists of a nozzle spacing of 0.3m, a nozzle diameter of 2mm, and a flow velocity of 100m/s, which is typically applied in offshore projects related to installation of foundation piles in offshore wind. To examine configurations for DBBC, three sets of analyses are performed for the varying radii of the outer BBC keeping the inner one at a fixed position, i.e., at 50m, 75m and 100m. For each configuration, three predictions are performed for the lower, upper and median values of the air flow rate.
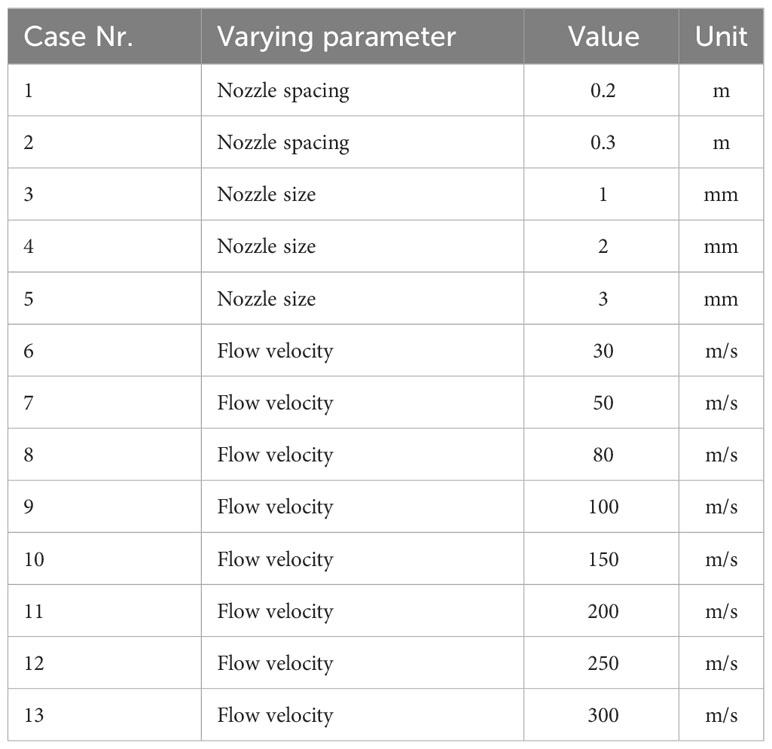
Table 2 Varying input parameters of the bubble curtain system.
5.1 Air volume injection rate
The air is injected into the perforated hose through two risers connecting to the air compressors and is distributed equally into the two semi-circles. Based on this deployment approach, the model adopts equal volumetric flow rates as input for two semi-circles of the hoses. As shown in Figure 5, the increase in the air volume injection rate can lead to an increase in the flow velocity at each nozzle along half of the hose length, while the other half has the same performance.
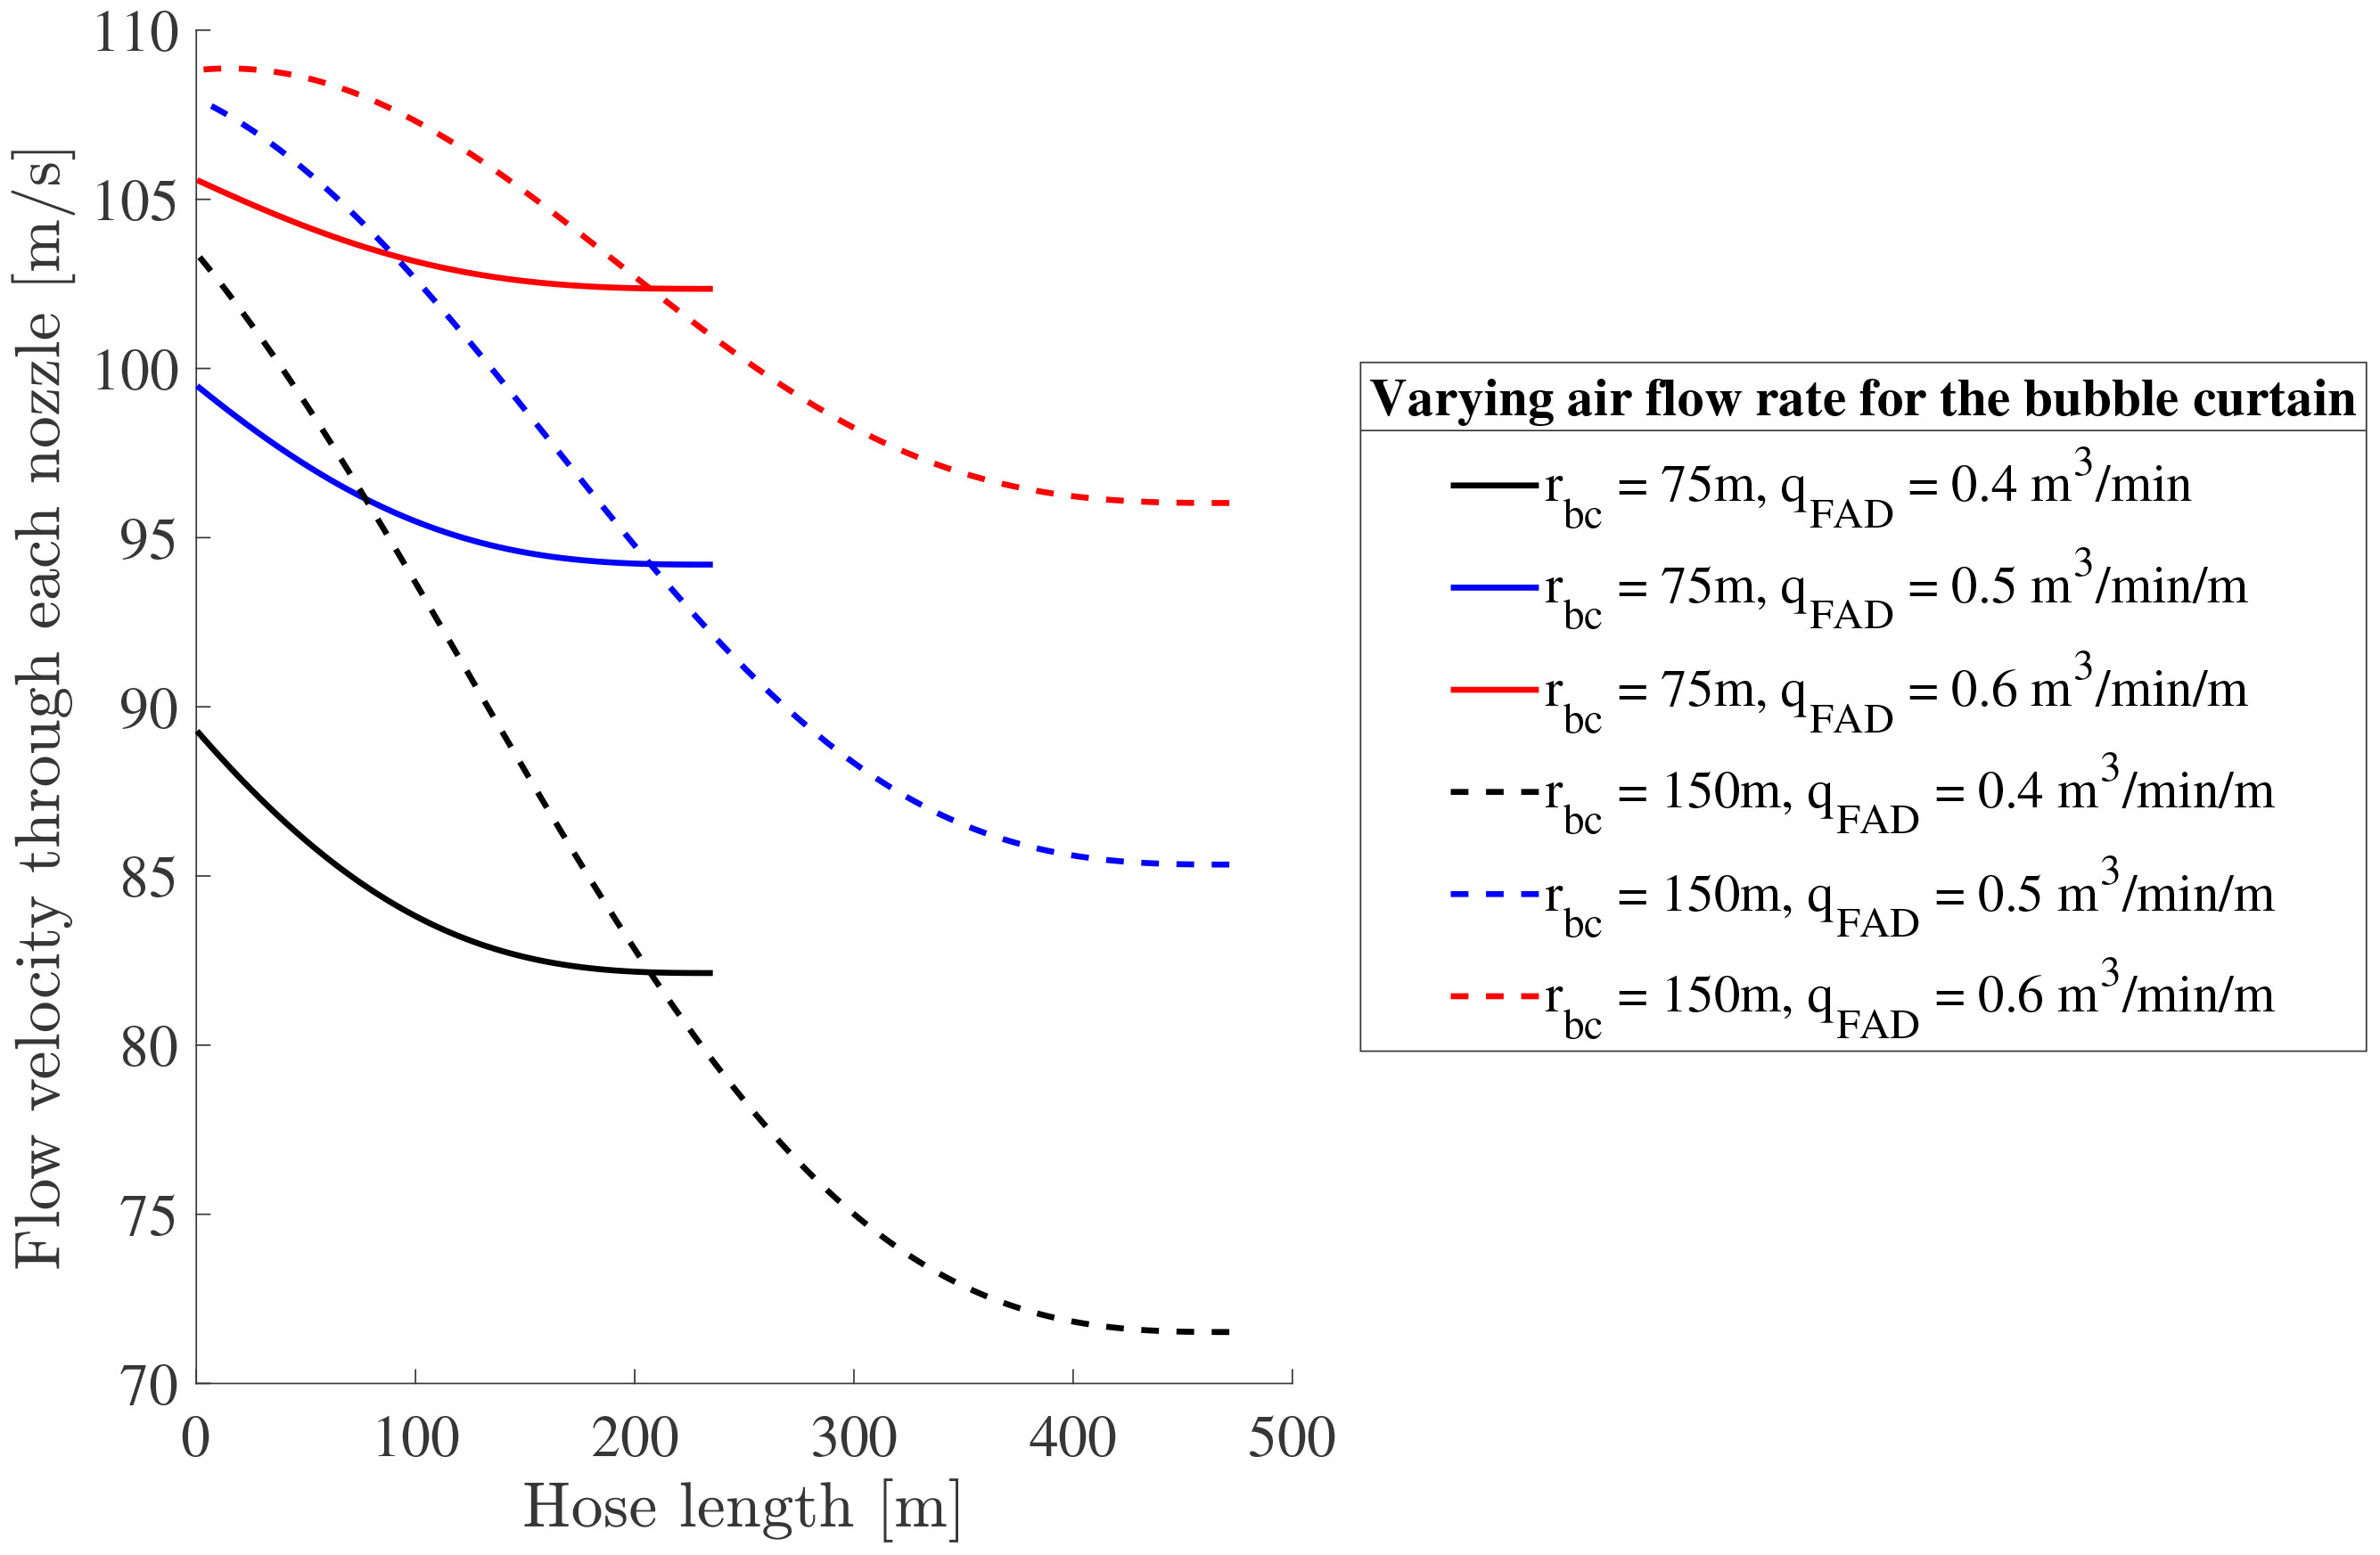
Figure 5 Computed flow velocities at the nozzles along the hose length for varying air volume injection rate for two different cases of bubble curtain radii, i.e. 75m and 150m.
The air volume injection can significantly impact the bubble curtain formation process above the main hose. By examining Figure 5, we observe that for the bubble curtain with a radius of 75m, the variation in the flow velocity along the hose length, for a given volume injection rate, is relatively small. However, when the air volume injection is varied, differences up to ~20m/s (Δu) in the computed flow velocities at the nozzles are obtained. Subsequently, this can significantly change the initial turbulent kinetic energy at the nozzle and, thus, influence the air-bubble cloud formation process. The same naturally holds for bubble curtains of larger radii but those suffer additionally from a significant drop in the flow velocity at positions away from the air feeder lines as depicted in Figure 6.
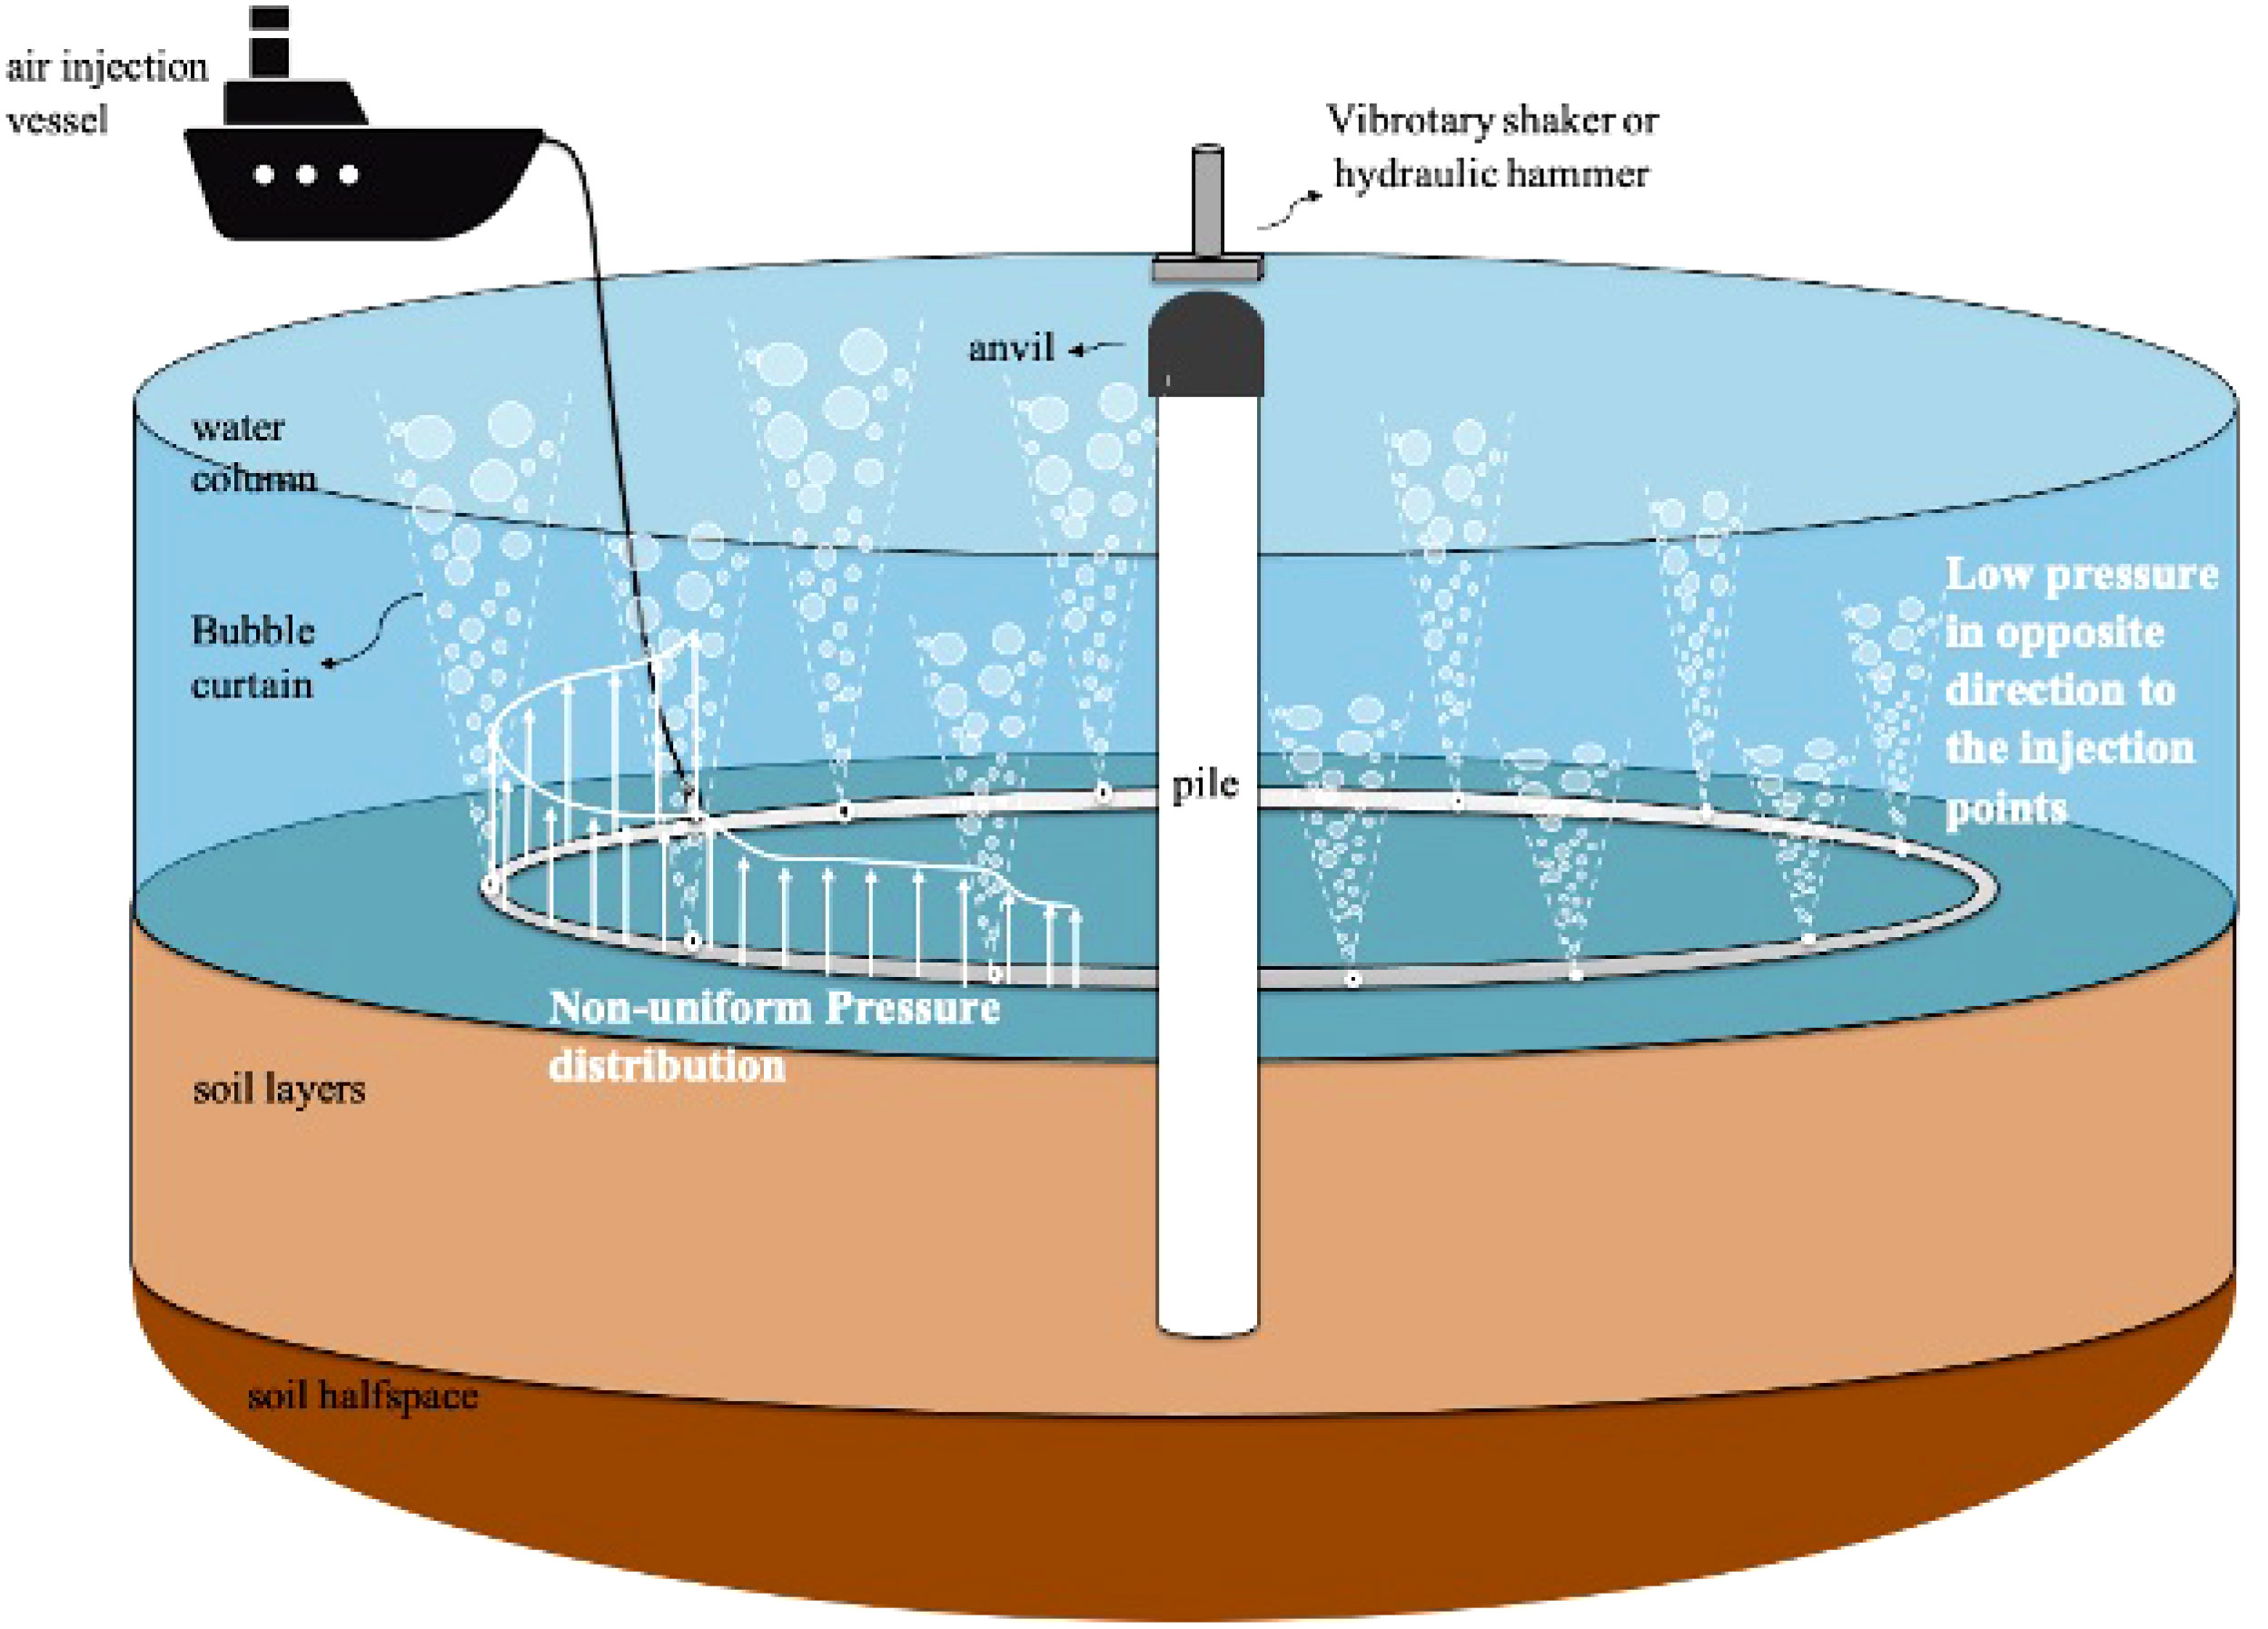
Figure 6 Schematic depiction of the non-uniform pressure distribution in the hose.
5.2 Size of the bubble curtain
As shown in Figure 7, with the increase of the size of the BBC, the mean and lower bound of the flow velocity decrease, while the maximum of the velocity, which appears in the vicinity of the air injection inlet, remains within a small range. As the air is released from a nozzle, the pressure within the hose drops instantly, which leads to a decrease in the kinetic energy in the airflow. Considering the variation of the flow velocity due to both various air injection rates and the radius of the bubble curtain, the various flow velocities from 30m/s to 300m/s at the nozzle are considered in the analysis as shown in Table 2.
Figure 7 Computed flow velocities at the nozzles along the hose length for the varying radius of the bubble curtain.
With the hydrodynamic model, the bubble formation process at the nozzle is predicted. To investigate the transmission of the bubble curtain over depth, the local distribution of the sound speed at 300Hz is depicted in Figure 8. The effective wave speed reduces up to 200m/s in the vicinity of the centerline. The darker zones indicate a large impedance mismatch between the seawater and air-seawater bubbly mixture, which widens as the flow velocity increases from left to right in Figure 8. Accordingly, this results in an increase in the transmission loss of the bubble curtain system as shown in Figure 9 from cases 6 to 13. Based on the deployed set of hoses, higher air injection rates can increase the acoustic performance of the bubble curtain. With an increase in the size of the bubble curtain, the efficiency of the bubble curtain can drop at positions away from the air-feeding lines due to the significant expected drop in the flow velocity.
Figure 8 Comparison of the effective wave speed for various flow velocities of (A) 30m/s, (B) 300m/s for the frequency 300Hz.
Figure 9 Transmission loss (TL) computed as a function of frequency for the cases examined in Table 2. (A) various nozzle configuration: spacing and diameter. (B) flow velocity at the nozzle.
5.3 Nozzle configuration
Typical nozzle sizes and spacing usually stay within a limited range in practice. In this analysis, a series of theoretical cases are considered. In cases 1 to 5, the nozzle configuration is investigated with the nozzle spacing being 0.2m and 0.3m and the nozzle size being 1mm to 3mm. Together with the variation in the flow velocities, the input for the varying parameters is shown in Table 2. To examine the impact of the aforementioned parameters on the acoustic insertion loss of the air-bubble curtain, the acoustic model is used to determine the transmission loss for each scenario. Figure 9A indicates that, within the typical nozzle configuration range, the acoustic insertion loss of the bubble curtain is more sensitive to nozzle size when flow velocity is constant, especially in the critical frequency range of ∼60Hz to 200Hz.
5.4 Configuration of the DBBC
The sensitivity analysis is performed to examine the configuration of the DBBC, in which the scope of the operational constraints are considered. Three sets of the radius of the outer BBC are used, i.e., at 50m, 75m and 100m, while the inner one is at a fixed position. For each configuration, three predictions are performed for the median values of the air flow rates at the nozzle. The base case is set as the radius of the inner and outer BBC being 75m and 150m, respectively. The volumetric airflow rate in the hose is set as 0.5m3/min/m.
As can be seen in Figure 10, the noise reduction levels in both SEL and Lp,pk increase with the radius of the inner bubble curtain shown by the blue, red and black lines. It is also clear that given a fixed position of the inner bubble curtain, there is an optimum distance in which the outer one should be placed. This may seem as counterintuitive in the first place as one would expect that a larger distance is always favorable. However, a longer pipe can result in larger pressure and air flow velocity drops away from the air-feeding lines which result in a suboptimal performance of the system on average.
Figure 10 OWF foundation: comparison of the sound pressure levels for varying diameter of the outer bubble curtain with the radius of the inner bubble curtain being 50m (black solid line), 75m (black dashed line) and 100m (grey line). (A) SEL. (B) Lp,pk.
The red and blue markers indicate the configuration of the base case with the volumetric air flow rate being 0.4 and 0.6m3/min/m, respectively. The bars and the marker indicate the predictions are performed for the same configuration and at the lower, higher and median values of the air flow rates at the nozzle. The comparison indicates that the increase in the mass flow rate by 0.1m3/min/m in the hose can lead to up to ∼1dB for both SEL and Lp,pk. However, the increase in the noise level cannot be obtained linearly from the volumetric airflow rate being 0.4m3/min/m to 0.5m3/min/m or 0.5 m3/min/m to 0.6m3/min/m. As discussed in Section 2.3, the pressure increases with the mass airflow rate, which leads to the nonlinear acoustic characteristics of the bubble curtain with increasing air flow rates. By comparing the noise levels for the lower, median and higher values of the air flow rates at the nozzle, a deviation of 1 dB can be expected as can be read from Figure 10. As observed from the field test, the pressure decreases nonlinearly with the distance between the sensor and the air feeding point, which leads to the variation in the airflow at the nozzle. The performance of the air-bubble curtain system relies strongly on both the volumetric airflow rates and the configuration of the DBBC.
5.5 Summary of the analysis
Due to the uneven distribution of the air flow velocity along the main hose, the acoustic insertion loss of the air-bubble curtain depends strongly on the air injection rate and the size of the bubble curtain. Within the critical frequency spectrum of interest in this project, the nozzle size and spacing seem to have less impact on the acoustic performance of the bubble curtain. However, the flow velocity through each nozzle can drop significantly away from the air-feeding points especially for longer pipes. This, in turn, can result in a strong azimuth-dependent acoustic field, i.e., the noise reduction achieved at different azimuthal positions may vary significantly due to the inhomogeneous air-bubble cloud formed.
6 Comparison with measured data
This section discusses a case based on an offshore wind farm foundation installation campaign in 2018 (Peng et al., 2021a, 2021b). The material properties and the geometry of the model are summarised in Table 3. The forcing function is defined as the smoothed exponential impulse as shown in Figure 11A, which results in approximately 2000kJ input energy into the pile. The seabed at this foundation consists of a thin marine sediment layer overlaying a stiff bottom soil half-space. The configuration of the DBBC system is presented in Table 4. The inner bubble curtain is positioned at 105m from the pile and the outer bubble curtain is positioned at 145m from the pile.
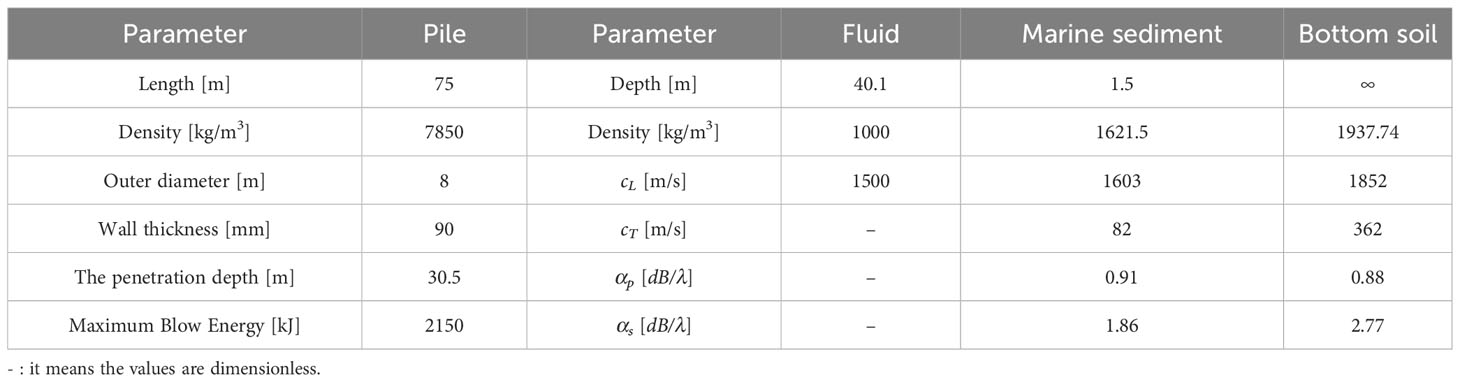
Table 3 Basic input parameters for the validation case.
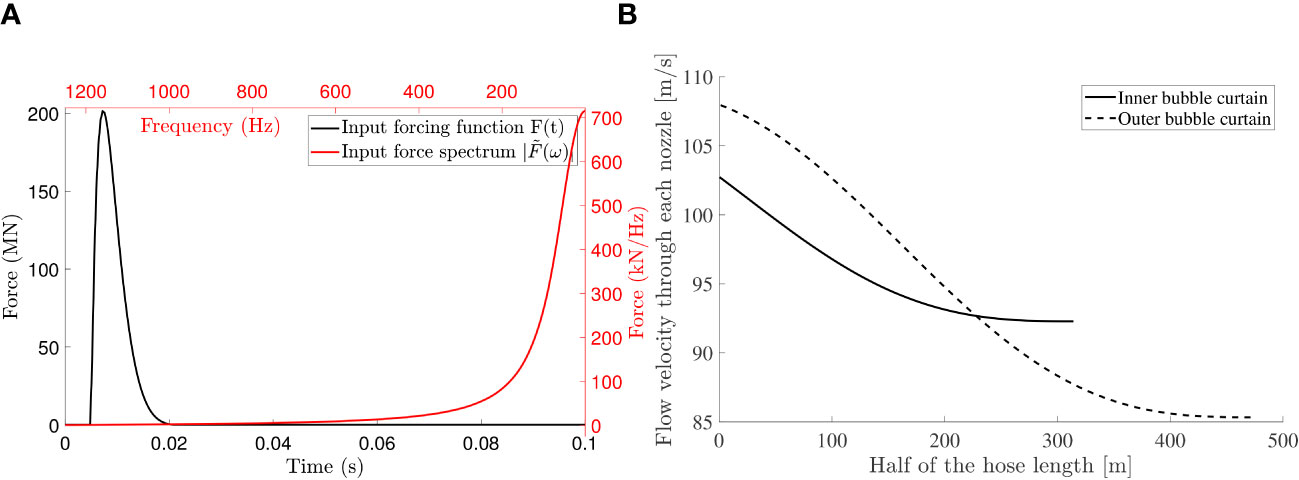
Figure 11 OWF foundation: (A) input forcing function in time and frequency domain; (B) flow velocity through each nozzle along the hose with the solid line indicating the air flow at the inner BBC and the dash line being the outer one.
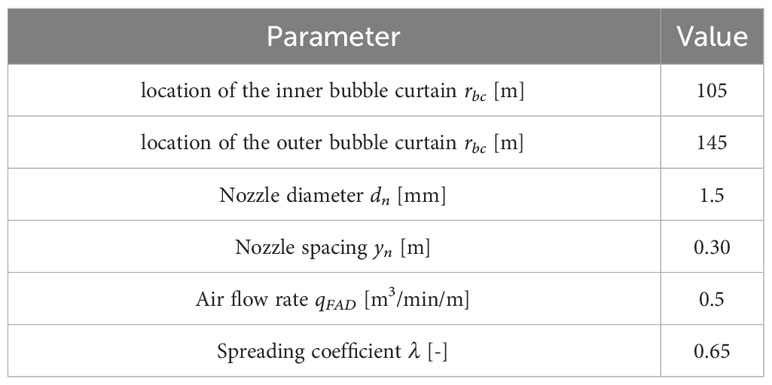
Table 4 Basic input parameters of the air-bubble curtain system.
The variation in the flow velocity through the nozzles is shown in Figure 11B, which is due to the drop of the pressure during the transportation of the air. In Figure 12A, the evolution of the pressure field in time is shown for the point positioned 2m above the seabed at 750m radial distances from the pile.
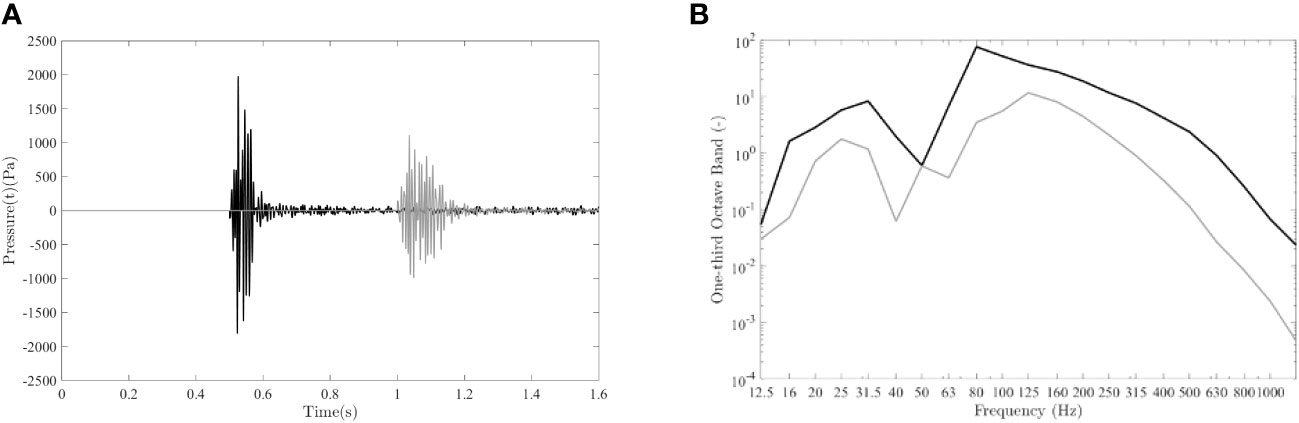
Figure 12 OWF foundation: (A) evolution of the pressure field for the mitigated field with the use of DBBC system at 750m (black line) and 1500m (grey line) from the pile; (B) one-third octave band of the pressure field at 750m for both unmitigated field (black line) and mitigated field (grey line).
The arrival of the pressure cones is at around 0.5s after the impact of the pile, which is in line with the expectations regarding the arrival time of the direct sound waves traveling with the speed of sound in the water at the distance of 750m from the pile. As can be seen, in the one-third octave band for both the unmitigated (the black line) and mitigated field (the grey line) in Figure 12B, the performance of the bubble curtain is more efficient at higher frequency bands approximately above 500Hz. The overall SEL and Lp,pk for both unmitigated and mitigated fields are sumarised in Table 5. The zero-to-peak pressure level (Lp,pk) in dB re 1 µPa and the sound exposure level SEL in units of dB re 1 µPa2s are defined as:
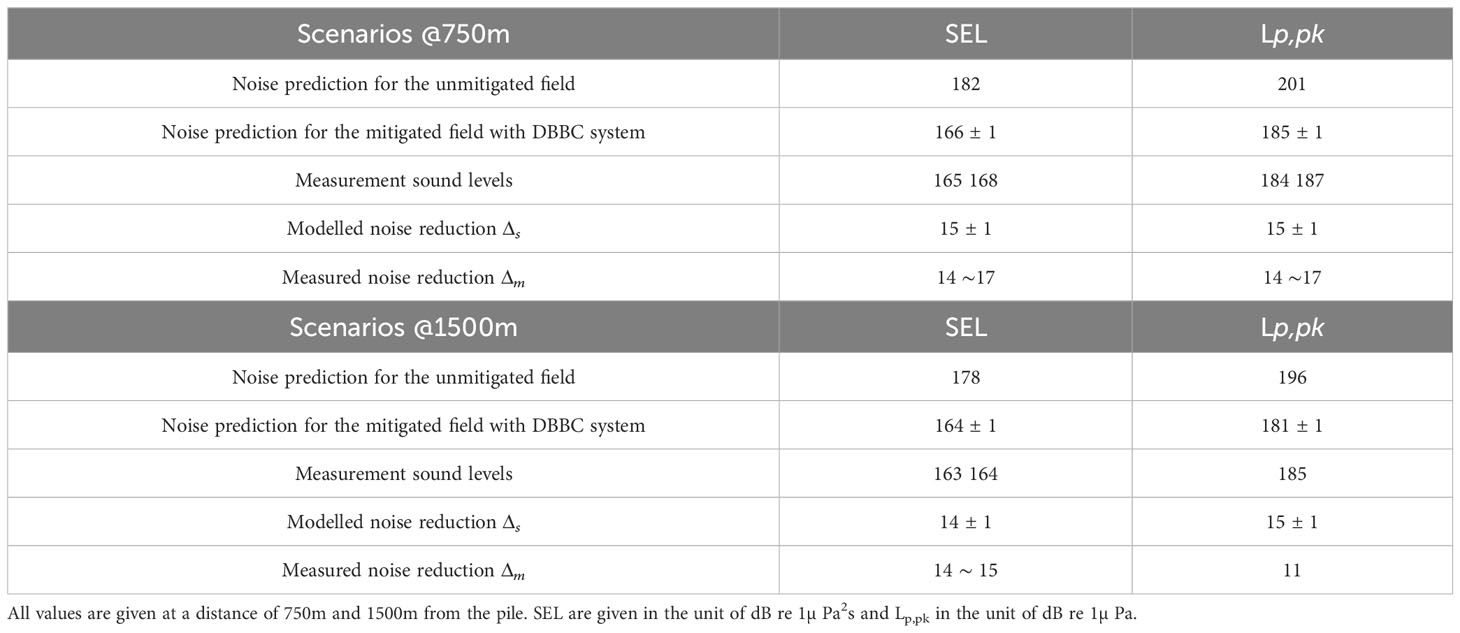
Table 5 Noise mitigation assessment at the foundation.
in which T1 and T2 are the starting and ending of the predicted time signature with the sound event in between and pulse duration T0 = T2 − T1 being 1 second and p0 = 10−6Pa is the reference underwater sound pressure.
The sound field without noise mitigation systems is predicted by the model developed in (Peng et al., 2021a). The prediction lies within the accuracy of the measurement equipment of the deviation within 1 or 2dB from the measured sound levels. The measured sound levels indicate a range of 14 to 17dB noise reduction at 750m achieved by the DBBC system for both SEL and Lp,pk. This reduction is calculated based on the difference between the modelled unmitigated sound field and the measured sound field collected while utilizing the DBBC system. The model used for the unmitigated sound field has been previously validated against the offshore measurement campaign conducted in 2018 (Peng et al., 2021a). At a further distance, the 1500m away from the pile, the noise reduction of 14 to 15dB can be achieved for SEL and 11 dB for Lp,pk. The modeling of the DBBC system showed an average noise reduction of 15dB for both SEL and Lp,pk at 750m, and 14dB for SEL and 15dB for Lp,pk at 1500m. Due to variations in flow velocity through the nozzle at different azimuthal directions, a deviation of ±1dB in the noise reduction levels can be expected. The upper and lower bounds of the sound levels show that the range of prediction is within the measured data range, which indicates a great agreement between the noise prediction and the measured data at various horizontal distances from the pile.
7 Conclusion
The paper presents a multi-physics approach for modeling the noise emission for offshore pile driving with the use of a DBBC system. The mathematical statement of the complete problem is given and the adopted method of solution is described for each module. The compressible flow model is developed to predict the operational parameters for bubble curtain generation from the hose and the nozzle. Nonlinear characteristics of the pressure distribution are observed both in the model results and in the field test. The pressure amplitude increases with volumetric airflow rates and decreases with the distance from the air injection point. The field test reveals the inherent variation in the airflow circulation, which leads to the varying performance of air-bubble curtain in azimuth direction. The hydrodynamic model aims to capture the fluid and bubble dynamic properties during the development of bubble curtains. The transmission coefficients derived from the acoustic module are coupled to the existing noise prediction model for the unmitigated field from pile driving. The sensitivity study has been performed to examine the critical parameters for the performance of the air-bubble curtain system. Both volumetric airflow rates and the configuration of the DBBC play significant roles in the efficiency of the air bubble curtain system. Results are presented for an offshore pile installation campaign in the German North Sea. The comparison between the measured data and model predictions provides the validation of the model. The modeling approach couples four sub-modules and facilitate more accurate representation of the noise mitigation system. The multi-physics model allows for the examination of the optimal hose-nozzle and DBBC configurations under the operational constraints.
Data availability statement
The original contributions presented in the study are included in the article/supplementary material. Further inquiries can be directed to the corresponding author.
Author contributions
YP performed the data analysis, numerical modeling and produced the original draft of this manuscript. AJL conducted the original field test, data analysis, delivered the air transport model as well as the calibrated pressure and flow velocity data used by YP. AT contributed to the concept of the study, feedback on the results, and the discussion on the manuscript’s content. YP, AJL and AT contributed to the review and revision of the original draft. All authors contributed to the article and approved the submitted version.
Funding
The author(s) declare that no financial support was received for the research, authorship, and/or publication of this article.
Acknowledgments
The authors wish to express their thanks to the BubbleJIP project for supporting this research, IHC IQIP for facilitating and supporting the experimental campaign on the bubble generation, and Van Oord for providing data from a recent offshore installation campaign.
Conflict of interest
The authors declare that the research was conducted in the absence of any commercial or financial relationships that could be construed as a potential conflict of interest.
Publisher’s note
All claims expressed in this article are solely those of the authors and do not necessarily represent those of their affiliated organizations, or those of the publisher, the editors and the reviewers. Any product that may be evaluated in this article, or claim that may be made by its manufacturer, is not guaranteed or endorsed by the publisher.
Footnotes
- ^ FAD conditions are defined at p = 101325Pa, T = 293.15K
References
Achenbach J. D. (1973). “Wave propagation in elastic solids,” in North-Holland series in applied mathematics and mechanics, v. 16 (Amsterdam New York: North-Holland Pub. Co.; American Elsevier Pub. Co).
Bailey H., Senior B., Simmons D., Rusin J., Picken G., Thompson P. M. (2010). Assessing underwater noise levels during pile-driving at an offshore windfarm and its potential effects on marine mammals. Mar. Pollut. Bull. 60, 888–897. doi: 10.1016/j.marpolbul.2010.01.003
Beskos D. E. (1987). Boundary element methods in dynamic analysis. Appl. Mechanics Rev. 40, 1–23. doi: 10.1115/1.3149529
Bohne T., Grießmann T., Rolfes R. (2019). Modeling the noise mitigation of a bubble curtain. J. Acoust. Soc. Am. 146, 2212. doi: 10.1121/1.5126698
Bohne T., Grießmann T., Rolfes R. (2020). Development of an efficient buoyant jet integral model of a bubble plume coupled with a population dynamics model for bubble breakup and coalescence to predict the transmission loss of a bubble curtain. Int. J. Multiphase Flow 132, 103436. doi: 10.1016/j.ijmultiphaseflow.2020.103436
Bruns B., Stein P., Kuhn C., Sychla H., Gattermann J. (2014). Hydro sound measurements during the installation of large diameter offshore piles using combinations of independent noise mitigation systems. In Proceedings of the Inter-noise 2014 Conference, Melbourne, Australia.
Chahouri A., Elouahmani N., Ouchene H. (2022). Recent progress in marine noise pollution: A thorough review. Chemosphere 291, 132983. doi: 10.1016/j.chemosphere.2021.132983
Commander K. W., Prosperetti A. (1989). Linear pressure waves in bubbly liquids: Comparison between theory and experiments. J. Acoust. Soc. America 85, 732–746. doi: 10.1121/1.397599
Dahl P. H., Dall’Osto D. R. (2017). On the underwater sound field from impact pile driving: Arrival structure, precursor arrivals, and energy streamlines. J. Acoust. Soc Am. 142, 1141. doi: 10.1121/1.4999060
Dahl P. H., Dall’Osto D. R., Farrell D. M. (2015). The underwater sound field from vibratory pile driving. J. Acoust. Soc. Am. 137, 3544–3554. doi: 10.1121/1.4921288
Elmer K.-H., Gattermann J., Kuhn C., Bruns B. (2012). Mitigation of underwater piling noise by air filled balloons and PE-foam elements as hydro sound dampers. J. Acoust. Soc. Am. 132, 2056–2056. doi: 10.1121/1.4755571
Fricke M. B., Rolfes R. (2015). Towards a complete physically based forecast model for underwater noise related to impact pile driving. J. Acoust. Soc. Am. 137(3), 1564–1575. doi: 10.1121/1.4908241
Hastie G., Merchant N. D., Gotz T., Russell D. J. F., Thompson P., Janik V. M. (2019). Effects of impulsive noise on marine mammals: investigating range-dependent risk. Ecol. Appl. 29(5), e01906. doi: 10.1002/eap.1906
International Maritime Organization (2014). Guidelines for the reduction of underwater noise from commercial shipping to address adverse impacts on marine life. Tech. Rep. Available at: https://cetsound.noaa.gov/Assets/cetsound/documents/MEPC.1-Circ%20883%20Noise%20Guidelines%20April%202014.pdf.
Jensen F. B., Kuperman W. A., Porter M. B., Schmidt H. (2011). Computational Ocean Acoustics (New York: Springer).
Lee K. M., McNeese A. R., Wilson P. S., Wochner M. S. (2014). Using arrays of air-filled resonators to attenuate low frequency underwater sound. Proc. Meetings Acoustics 22, 045004. doi: 10.1121/2.0000145
Lippert T., Ainslie M. A., von Estorff O. (2018). Pile driving acoustics made simple: Damped cylindrical spreading model. J. Acoust. Soc Am. 143, 310. doi: 10.1121/1.5011158
Lippert S., Huisman M., Ruhnau M., Estorff O., van Zandwijk K. (2017). “Prognosis of underwater pile driving noise for submerged skirt piles of jacket structures,” in Proceedings of the UACE 2017 4th Underwater Acoustics Conference and Exhibition.
Lippert S., Nijhof M., Lippert T., Wilkes D., Gavrilov A., Heitmann K., et al. (2016). COMPILE—A generic benchmark case for predictions of marine pile-driving noise. IEEE J. Oceanic Eng. 41, 1061–1071. doi: 10.1109/JOE.2016.2524738
Menon E. S. (2015). Transmission Pipeline Calculations and Simulations Manual (Waltham, MA: Gulf Professional).
Merchant N. D., Putland R. L., Andre M., Baudin E., Felli M., Slabbekoorn H., et al. (2022). A decade of underwater noise research in support of the european marine strategy framework directive. Ocean &. Coast. Manage. 228, 106299. doi: 10.1016/j.ocecoaman.2022.106299
Molenkamp T., Tsouvalas A., Metrikine A. V. (2023). The influence of contact relaxation on underwater noise emission and seabed vibrations due to offshore vibratory pile installation. Front. Mar. Sci. 10. doi: 10.3389/fmars.2023.1118286
National Oceanic and Atmospheric Administration (2016). Technical guidance for assessing the effects of anthropogenic sound on marine mammal hearing: underwater acoustic thresholds for onset of permanent and temporary threshold shifts. Tech. Rep. NOAA Technical Memorandum NMFS-OPR-55. Available at: https://www.fisheries.noaa.gov/resource/document/technical-guidance-assessing-effects-anthropogenic-sound-marine-mammal-hearing.
Nehls G., Bellmann M. (2016). Weiterentwicklung und erprobung des “großenblasenschleiers” zur minderung der hydroschallemissionen bei offshore-rammarbeiten: Schlussbericht. Tech. Rep. Bio-Consult SH GmbH & Company KG; itap GmbH Oldenburg; Hydrotechnik Lubeck. doi: 10.2314/GBV:868671320
Nehls G., Rose A., Diederichs A., Bellmann M., Pehlke H. (2016). “Noise mitigation during pile driving efficiently reduces disturbance of marine mammals,” in Advances in Experimental Medicine and Biology 2214-8019 (New York, NY: Springer New York). doi: 10.1007/978-1-4939-2981-8_92
Peng Y., Tsouvalas A., Stampoultzoglou T., Metrikine A. (2021a). A fast computational model for near- and far-field noise prediction due to offshore pile driving. J. Acoust. Soc. Am. 149, 1772–1790. doi: 10.1121/10.0003752
Peng Y., Tsouvalas A., Stampoultzoglou T., Metrikine A. (2021b). Study of the sound escape with the use of an air bubble curtain in offshore pile driving. J. Mar. Sci. Eng. 9 (2), 232. doi: 10.3390/jmse9020232
Reinhall P. G., Dahl P. H. (2011). Underwater mach wave radiation from impact pile driving: theory and observation. J. Acoust. Soc Am. 130, 1209–1216. doi: 10.1121/1.3614540
Shapiro A. H. (1953). The dynamics and thermodynamics of compressible fluid flow (New York: Ronald Press).
Tidau S., Briffa M. (2016). Review on behavioral impacts of aquatic noise on crustaceans. Proc. Mtgs. Acoust. 27, 010028. doi: 10.1121/2.0000302
Tsetas A., Tsouvalas A., Metrikine A. V. (2023). A non-linear three-dimensional pile–soil model for vibratory pile installation in layered media. Int. J. Solids Structures 269, 112202. doi: 10.1016/j.ijsolstr.2023.112202
Tsouvalas A. (2020). Underwater noise emission due to offshore pile installation: A review. Energies 13(12), 3037. doi: 10.3390/en13123037
Tsouvalas A., Metrikine A. V. (2013). A semi-analytical model for the prediction of underwater noise from offshore pile driving. J. Sound Vib. 332, 3232–3257. doi: 10.1016/j.jsv.2013.01.026
Tsouvalas A., Metrikine A. V. (2014). A three-dimensional vibroacoustic model for the prediction of underwater noise from offshore pile driving. J. Sound Vib. 333, 2283–2311. doi: 10.1016/j.jsv.2013.11.045
Tsouvalas A., Metrikine A. V. (2016a). Noise reduction by the application of an air-bubble curtain in offshore pile driving. J. Sound Vibration 371, 150–170. doi: 10.1016/j.jsv.2016.02.025
Tsouvalas A., Metrikine A. V. (2016b). Structure-borne wave radiation by impact and vibratory piling in offshore installations: from sound prediction to auditory damage. J. Mar. Sci. Eng. 4, 44. doi: 10.3390/jmse4030044
Verfuß T. (2014). Noise mitigation systems and low-noise installation technologies (Wiesbaden: Springer Fachmedien Wiesbaden : Springer Spektrum). doi: 10.1007/978-3-658-02462-8_16
Wilkes D. R., Gourlay T. P., Gavrilov A. N. (2016). Numerical modeling of radiated sound for impact pile driving in offshore environments. IEEE J. Oceanic Eng. 41, 1072–1078. doi: 10.1109/JOE.2015.2510860
Williams R., Ashe E., Blight L., Jasny M., Nowlan L. (2014). Marine mammals and ocean noise: Future directions and information needs with respect to science, policy and law in Canada. Mar. Pollut. Bull. 86, 29–38. doi: 10.1016/j.marpolbul.2014.05.056
Keywords: underwater noise, offshore pile driving, soil conditions, vibroacoustics, noise mitigation, air-bubble curtains
Citation: Peng Y, Jarquin Laguna A and Tsouvalas A (2023) A multi-physics approach for modelling noise mitigation using an air-bubble curtain in impact pile driving. Front. Mar. Sci. 10:1134776. doi: 10.3389/fmars.2023.1134776
Received: 30 December 2022; Accepted: 24 August 2023;
Published: 16 October 2023.
Edited by:
Per Reinhall, University of Washington, United StatesReviewed by:
Vanesa Magar, Center for Scientific Research and Higher Education in Ensenada (CICESE), MexicoZhongchang Song, Xiamen University, China
Copyright © 2023 Peng, Jarquin Laguna and Tsouvalas. This is an open-access article distributed under the terms of the Creative Commons Attribution License (CC BY). The use, distribution or reproduction in other forums is permitted, provided the original author(s) and the copyright owner(s) are credited and that the original publication in this journal is cited, in accordance with accepted academic practice. No use, distribution or reproduction is permitted which does not comply with these terms.
*Correspondence: Yaxi Peng, eS5wZW5nQHR1ZGVsZnQubmw=