 Chengyan Yao
 Mengge Sun
 Lin Liu4*
95% of researchers rate our articles as excellent or good
Learn more about the work of our research integrity team to safeguard the quality of each article we publish.
Find out more
ORIGINAL RESEARCH article
Front. Mar. Sci. , 28 February 2023
Sec. Marine Affairs and Policy
Volume 10 - 2023 | https://doi.org/10.3389/fmars.2023.1131590
This article is part of the Research Topic Global Vessel-Source Maritime Pollution Governance—Technical Innovation and Policy Orientation View all 14 articles
In recent years, the Chinese central government and coastal provincial governments have promulgated a series of Coastal Ocean Pollution Prevention and Control Programs (COPPCP). Whether the government’s COPPCP can achieve policy synergy will affect the level of marine pollution governance. This study constructs a two-dimensional assessment framework of policy “subject department”–”content theme” and conducts a comprehensive evolution of policy synergy from objective, process, and state perspectives. From the subject department dimension, the study used social network analysis to find that interdepartmental collaboration was not done well overall. The policy synergy process is difficult to be guaranteed. Meanwhile, the structure of departmental synergy networks in different provinces shows differences and can be divided into three types of governments with single-core, multi-core, and vertical synergy. In the content synergy dimension, it was found by the Chinese Bidirectional Encoder Representations from Transformers-Whole Word Masking (BERT-WWM) model that the policy content is mainly focused on four themes of marine ecological protection (MEP), marine pollution control (MPC), land-based pollution reduction (LPR), and safeguard measures (SAM). The three types of governments show different performances on the four theme synergies. The governments perform well in the objective synergy; however, it is difficult for them to agree on the policy tool synergy, and the status of policy synergy is difficult to maintain. This paper adopts the BERT-WWM model instead of the manual coding method in the previous policy content analysis, enhancing the evaluation’s objectivity. The study results will provide a reference for further improving marine pollution governance systems in developing countries.
Coastal ocean pollution is an essential theme in marine pollution management. The coastal ocean consists of several distinct but closely linked ecosystems, including rivers, estuaries, tidal wetlands, and continental shelves (Bauer et al., 2013). The coastal ocean is of great interest because it is biologically very productive and most vulnerable to human activities. About 80% of marine litter is widely believed to come from land-based sources and flows mainly to coastal and nearshore areas (Morales-Caselles et al., 2021). The problems of eutrophication, accumulation of toxic substances, pollution from ships (Xiao et al., 2022a), and plastic waste pollution in the coastal ocean are becoming more and more serious. In recent years, the effluent from the Fukushima nuclear power plant has also posed a threat to the environment in coastal oceans around the world (Lu et al., 2021; Men, 2021; Liu et al., 2022). The possibility of ecological species reduction (Kumar and Prasannamedha, 2021) and geological disaster occurrence is increasing (Zhou et al., 2022). Focusing on environmental protection in the coastal ocean is essential to combat marine pollution.
China is one of the largest developing countries in the world. Since the reform and development, the high-speed economic growth and urbanization of coastal areas have caused severe pollution and damage to the coastal ocean environment (Xu and Zhang, 2022). China’s central government gradually realized the seriousness of this problem, and in March 2017, it specifically formulated the Coastal Ocean Pollution Prevention and Control Program (COPPCP). COPPCP specifies the objectives of pollution prevention and control in China’s coastal ocean and lists essential matters as well. However, the “Bulletin on the State of China’s Marine Ecological Environment in 2021” points out that the ecological environment quality of China’s coastal ocean still needs to be improved. 21,350 square kilometers of the worst class IV waters are still covered in 2021. One cannot help but doubt the validity of the policies issued by the central government. However, the facts may be more complex. The transboundary nature of marine pollution makes it necessary to achieve policy synergy among coastal governments (Graham, 2022). Policy synergy is significant in China, where government departments face difficulties achieving integration (Li and Ye, 2021; Liu and Wang, 2022). The degree of policy synergy is one factor that influences the pollution control level (Li and Ye, 2021). Following the central government’s program, all 11 coastal provincial administrative regions in mainland China have issued local pollution prevention and control programs for the coastal ocean. This leads people to wonder whether there can be synergy between these policies. Measuring the degree of policy synergy will support analyzing the policy effectiveness of COPPCP.
Policy synergy is reflected in the consistency of policy objectives and the non-redundancy of interdepartmental collaboration. Therefore, this paper expects to build a two-dimensional policy synergy evolution framework to measure the synergy between the policy contents and subject departments of COPPCPs issued by various Chinese governments. The study is expected to provide a methodological reference for evaluating the effectiveness of coastal ocean pollution prevention and control policies in other countries. More importantly, it will help to improve the contribution of COPPCP to marine pollution governance.
The marine environment is mainly threatened by marine litter and chemical pollution from human activities. Most of the current marine pollution research themes are focused on plastic litter. The research questions primarily investigate the sources, chemical and physical characteristics of pollutants, and their economic, social, and environmental impacts. Treatment programs for marine environmental pollution have also emerged in recent years. This trend is reflected in the review of studies in developing countries such as India (Sivadas et al., 2022) and Southeast Asia (Omeyer et al., 2022). Regarding the governance of marine pollution, researchers generally make their recommendations in terms of technology, economics, society, and policy. Wu et al. (2023) pointed out that developing countries should learn from the experience of developed countries and actively promote cleaner production technologies to reduce pollution at source. Fadeeva and van Berkel (2021) proposed that promoting the transition to a circular economy is expected to reduce the flow of plastic waste to the ocean. Hartley et al. (2018); Sivadas et al. (2022), and Garcia et al. (2019) unanimously proposed that promoting green environmental awareness through publicity and education is the fundamental way to reduce pollution. Developed countries have developed a body of experience in technology, circular economy, and lifestyle habit development, yet developing countries need help in achieving these governance objectives in a short period. Boom Cárcamo and Peñabaena-Niebles (2022) points out that developing countries are hardly hindered by the huge costs in the early stages of the transition to a circular economy. These difficulties are further compounded by the shortage of infrastructure (Sivadas et al., 2022). The long cycle and high cost of technological innovation make it difficult for developing countries to achieve in the short term. As for the difficulties in awareness and education, they lie in the fact that people cling to their cultural habits, which are difficult to change in the short term. Currently, environmental regulation is gaining importance in marine pollution governance. After Sivadas et al. (2022) overviewed the challenges of plastic pollution in India, it was noted that an important step to meet the challenge is to review the existing regulatory approaches. The transboundary nature of marine pollution makes it a regional and global problem. Regional collaboration is necessary to address the issue of marine litter and its transboundary nature through planning and management. Similarly, in the field of nuclear wastewater pollution control research, several researchers have proposed the necessity and feasibility of transboundary collaboration from the perspective of international law (Chang et al., 2022; Chen and Xu, 2022; Wang and Li, 2022). Holistic management policies with shared objectives are an important first step towards a unified and cooperative approach to marine waste at all levels(Graham, 2022).
The transboundary nature of pollution has interested researchers in the theme of policy synergy among different levels of government. Policy synergy can be defined from three perspectives: objective, process, and state. The objective of policy synergy is to make inter-policy collaboration produce effects that are higher than the sum of each policy performance and reduce interdepartmental conflicts (Bai et al., 2018). From the perspective of process, Bai et al. (2018) argued that policy synergy is the process by which two or more policies coordinate to achieve a common objective. Dinges et al. (2018) considered policy synergy as the collaboration among different organizational departments. Both definitions specify the meaning of policy synergy from the perspective of the process. In terms of the status in which the policies are located, policy synergy refers to the existence of consistency in content between two or more procedures (Bolleyer, 2011).
Research on policy synergy has transitioned from simple descriptive answers to the “what” question to the more complex “evaluation of policy synergy” question. In recent years, policy synergy was evaluated mainly by observing the effects produced by policy synergy. Most researchers have collected real-world data to demonstrate the effects of implementing policy synergy (Lu et al., 2022; Ouyang et al., 2022). However, the confounding nature of other factors and the reliability of the data call into question the scientific validity of these empirical studies. Starting from the policy text itself, examining whether the state of policy synergy exists has become a study that has been gradually promoted in recent years. Liu and Wang (2022) used a combination of content analysis and social network approaches to analyzing the degree of synergy in coal de-capacity policies at all levels of government in China. The degree of close interdepartmental collaboration, the consistency of policy themes across all levels of government, and the degree of thematic change over time was considered. Ye and Wu (2022) also used a content analysis approach to analyze the synergy between demand-side and supply-side policy instruments at different stages of the green value chain. Similar studies using content analysis methods to explore policy synergy from the perspectives of objectives, processes, and states are emerging (Hills et al., 2021). However, most of these studies use policy codes, policy concept word lists, or mapping relationships between policies and semantics for automatic identification and automatic processing of policy concepts in their content analysis methods. An intuitive parsing framework from policy text to policy semantics is constructed, on the basis of which the analysis of policy text and its connotation is carried out (Grimmer and Stewart, 2013; Bunea and Ibenskas, 2017). This type of method is still a semi-computational and subjective analysis tool, although computer software is introduced for conceptual extraction and quantitative statistics of policy texts and has automatic statistical and relationship identification methods for text data. This is because the concept extraction method still uses traditional content analysis methods and processes, but relies heavily on manual extraction by the researcher in the data processing aspect.
From the above, it can be seen that the current research in the field of marine pollution governance, and the study of evaluation of policy synergy has more practical applications, especially for developing countries. In terms of policy synergy research, the assessment of policy synergy from the perspective of the definition of policy synergy itself has gained the attention of scholars. Evaluating policy synergy effects utilizing content analysis has become a well-established method. However, the issue of policy synergy in pollution prevention and control policies for coastal ocean waters has not been discussed. Moreover, the methods often used in policy synergy evaluation studies are mostly biased toward subjectivity analysis. Therefore, this study establishes a policy synergy evaluation framework of policy subject department - policy content theme based on the previous work. The COPPC’s policy synergy is evaluated using social network analysis and Bidirectional Encoder Representation from the Transformers (BERT) model. Among them, the BERT model can accurately enumerate the semantic information of words, making the words computable with each other (Mikolov et al., 2013), thus greatly reducing the errors caused by manual coding. Therefore, this study is expected to provide a reference for the evaluation ideas of marine pollution governance policies in developing countries, and it is also hoped further to improve the scientific quality of policy synergy evaluation.
In this study, an x-y two-dimensional theoretical analysis coordinate system was first established, as shown in Figure 1. The degree of collaboration between the policy subject departments and the consistency of policy content themes are used as evaluation indicators of policy synergy. The x-coordinate represents the subject departments of the policy, and the y-coordinate represents the types of themes that the policy focuses on. In the second step, we will observe the performance of each government in the department synergy dimension by each government that implements the policy. At the same time, the degree of synergy among governments in the content dimension is calculated by observing the focus of each government on different themes. Policy synergy can be divided into intra-organizational synergy and inter-organizational synergy (Meijers and Stead, 2004). When we take the government as the organization, the departmental synergy dimension is then an evaluation of intra-organizational synergy and the content synergy is an evaluation of inter-organizational synergy.
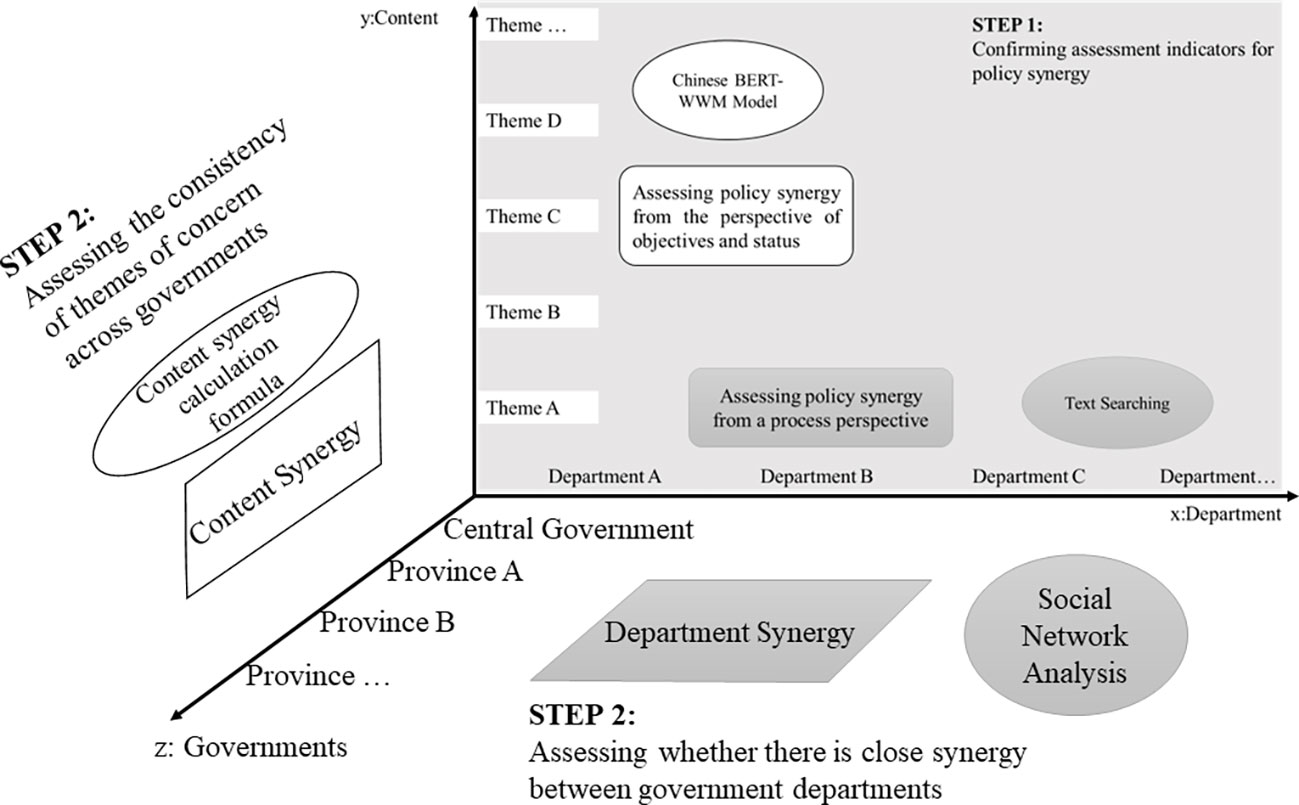
Figure 1 Research Framework.
The subject departments are the policymakers and implementers. The closeness of collaboration between policy subject departments will be related to whether the policy synergistic process can be carried out smoothly. In this study, the social network approach is used to observe the closeness of interdepartmental collaboration. This paper draws on the research idea of Liu and Wang (2022) to reflect the degree of synergy among policy subject departments using the network density indicator in social networks.
The degree of policy theme consistency captures whether all governments are working toward the same objective. At the same time, the redundancy status of policy content is also assessed. The policy theme is a high-level summary of the core content, basic thrust, and achievement of the policy text. It can reflect the allocation of attention to the policy (Xiao et al., 2022b). Pollution externalities allow governments to be consistent in their policy themes. This study first generates policy themes using the BERT model, and then draws on the synergy calculation method of (Liu and Wang, 2022) to derive the degree of policy theme content synergy among governments.
This study uses the social network analysis method to analyze the degree of policy department synergy. Social network analysis is a commonly used research method for the construction and analysis of interdepartmental collaboration networks (Liu and Wang, 2022; Ye and Wu, 2022). First, we extract the policy promulgator from the policy text by constructing regular expressions, count the frequency of pairwise collaboration among policymakers and implementers, and construct the co-occurrence matrix of the subject department. Second, we use Gephi to analyze the co-occurrence matrix and illustrate the policy structure of the subject departments. Gephi is a software for social network analysis. Due to its excellent visualization capabilities (Deng, 2014), Gephi is widely used to analyze the relationships between network nodes (Shen et al., 2021; Yao et al., 2023).
In the indicator of policy structure, network density represents the ratio of the number of relationships to the total number of possible relationships between nodes in the network. The greater the network density, the more likely it is to be considered a cohesive community (Wise, 2014), and the higher the department synergy. So, we use the network density (ED) index to measure the degree of department synergy, and the calculation formula is shown in Equation (1).
Where n represents network size and f represents network link frequency.
At the same time, we use node degree centrality and eigenvector centrality to measure the importance or influence of a single department in the network. The former assumes that the importance of a single department depends on the number of departments that it works with (Zhang and Luo, 2017), and the latter assumes that the importance of a single department depends not only on the number of departments it cooperates with, but also depends on the importance of departments it cooperates with (Ruhnau, 2000). The node degree centrality di is as Equation (2), and the node eigenvector centrality EC(i) or xi is as Equation (3).
Where aij indicates node i is connected to node j , c is a constant.
Third, we explore the content synergy between local government and central government. Generally, a person’s cognitive tendency is mainly reflected in the words they often use. The change in the frequency of word use reflects the change in a person’s attention to specific things (Liu and Wang, 2022). Similarly, the direction of focus on policy content is always reflected in the vocabulary used by the publisher. Furthermore, in computational linguistics, the semantics of words are usually embedded into word vectors according to their co-occurrence relationship (Hamilton et al., 2016) and the encoding process is called word embedding. Therefore, in this paper, we use the word embedding model combined with the clustering method to calculate the words contained in different themes and then calculate the synergy of the same theme between different provinces and the central government.
The starting point of the content synergy evolution is to establish the mapping relationship between policy themes and words with the help of natural language processing methods. In the past, most researchers used the Latent Dirichlet Allocation (LDA) topic clustering method (Blei et al., 2003; Hills et al., 2021) to analyze the policy content, and obtained the corresponding words contained in each topic by assuming that each policy text was represented by a multinomial distribution of themes. The disadvantage of this method is that it uses bag-of-words to represent policy text, ignores the order of words and deep semantics, and has limited semantic representation ability (Le and Mikolov, 2014). To optimize this drawback, this paper uses the word embedding model to characterize the semantic information of the text. The core idea of the word embedding model is the distributional hypothesis proposed by (Rumelhart and McClelland, 1987), which means the semantics of a word are characterized by its context. As a result, the vector representation corresponding to each word is obtained with the help of the word embedding model. Semantically close words are also more intimate in the vector space. In other words, words with similar semantics have smaller vector distances. Furthermore, the vector distance between two words can be calculated, following the computational principle of “the distance between words within a cluster is as close as possible, and the distance between clusters is as far as possible” to obtain semantically similar word clusters, i.e., text themes. The above is the computational idea of clustering (Sinaga and Yang, 2020). Therefore, the paper uses the method of “word embedding + word clustering” to calculate theme clusters on words. The whole process of numerical calculation is led by the semantics of words, thus greatly reducing manual errors.
For the Natural Language Processing (NLP) task of Chinese word embedding, the current commonly used language representation learning models, such as Word2Vec (Church, 2017), Glove (Pennington et al., 2014), ELMO (Peters et al., 2018), cannot sufficiently represent the word polysemy in the Chinese language. With the emergence of pre-trained language models, the representation of word embeddings has been improved to be more accurate. Among them, the most representative is the BERT (Bidirectional Encoder Representation from Transformers) model (Devlin et al., 2019), which can learn general language representation from a massive corpus without manual labeling, and capture the potential grammatical and semantic information in the text. However, the BERT model is more prominent in the word embeddings of English than in Chinese. The semantic understanding in the Chinese field is different from that in English. Therefore, we choose the BERT-WWM (Bidirectional Encoder Representations from Transformers-Whole Word Masking) pre-trained language model (Cui et al., 2021) that is more suitable for Chinese to obtain Chinese word embeddings.
Next, through the method of “word embedding” combined with “K-means clustering” to obtain the “theme-vocabulary” correspondence. Each cluster contains different words and represents a policy theme. Then, draw all the groups into a word cloud map conducive to manual screening, summarize each theme into several major themes, and discard themes with poor clustering effect. The overall process is shown in Figure 2. In particular, the “sub-topic” in the graph is obtained by the following “theme cluster” method, and the higher-level topics are obtained by manual summarization.
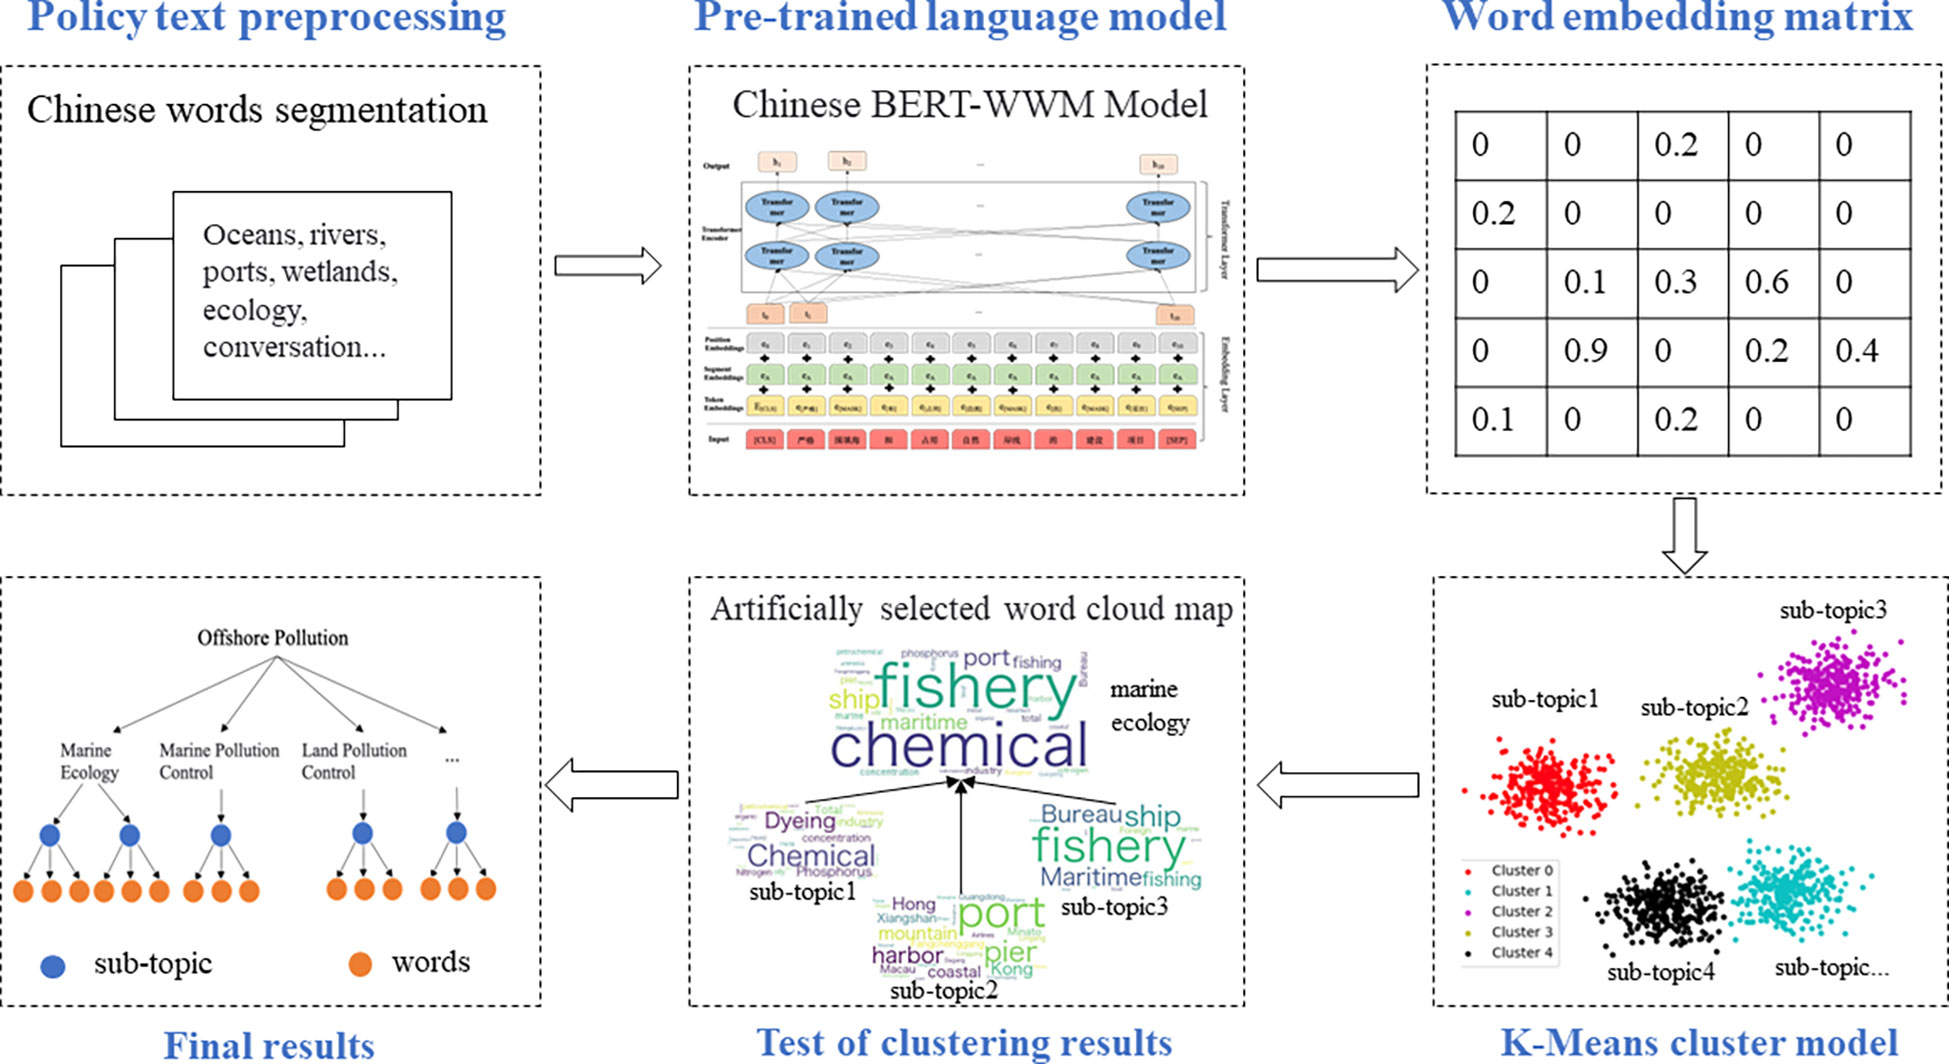
Figure 2 The process of generating different themest.
To get word embeddings more suitable for the Chinese language style, the Chinese BERT-WWM model performs [MASK] action on the phrase during the training process. The model consists of the Embedding layer and the Transformer layer. The training process mainly includes the following steps:
Firstly, define the input sentence of the model as e=(e1,e2,…,en) , where ei represents the i_th word of the sentence, and n represents the length of the sentence.
Second, calculate the Token Embeddings, Segment Embeddings, and Position Embeddings of the sentence e in the Embedding layer, and then sum the above three to get the input sequence T=(t1,t,…,tn) .
Finally, input the sequence T=(t1,t,…,tn) into the Transformer layer to extract features, and obtain the output sequence h=(h1,h2,…,hn) with rich context semantics as the subsequent word embeddings for theme clustering. The Chinses BERT-WWM model framework is shown in Figure 3.
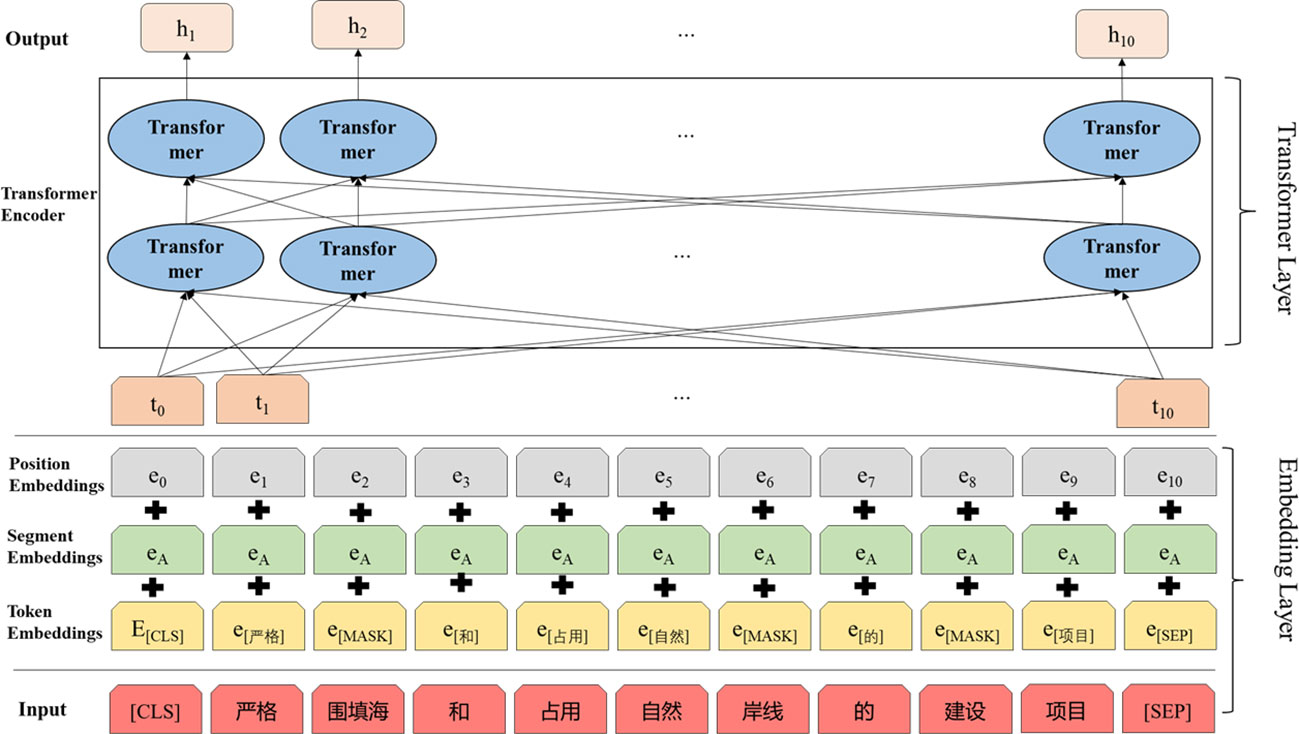
Figure 3 The Chinese BERT-WWM model framework.
The research used the Chinese RoBERTa-wwm-ext-large pre-trained language model to further improve the effect of word embedding. Based on the Chinese BERT-WWM model, the model has further increased the amount of training data, and finally trained the model on a 5.4B vocabulary including Chinese Wikipedia. At present, it is in SOTA in many Chinese NLP tasks (Cui et al., 2021) and can obtain word vectors with richer semantic information.
Then, we use the K-means algorithm to perform cluster analysis on the word vector results generated by the Chinese BERT-WWM model. Suppose the input sample set of the K-means algorithm is K={K1,K2,…,Km} , the number of clusters is k , and the algorithm stops after N iterations. The specific operation steps are as follows:
Step 1: k samples are randomly selected from the data set K as the initial k centroid vectors {v1,v2,…,vk} ;
Step 2: For each iteration n=1,2,…,N , perform the following operations:
(i) Initialize the entire cluster C to subcluster Ct={ct}(t=1,2,…,k) .
(ii) For i=1,2,.,m , calculate the distance di,j=Ki−vj between the sample Ki and each centroid vector vj(j=1,2,…,k) respectively, and mark the smallest distance di, j as Ki belong to category j, then update Vj=Vj∪{Ki} .
(iii) For j=1,2,…,k , recalculate the new centroid for all samples in Vj .
(iv) If the positions of the k centroids have not changed, then end the algorithm and go to Step 3.
Step 3: The output cluster is divided into V={V1,V2,…,Vk} .
Step 4: According to the silhouette coefficient metric, we choose the number of clusters with the best clustering effect.
Thus, the subtheme corresponding to each word is obtained. Then it needs to be manually organized into major categories of themes.
We classify government policy texts by government to form a database for the content synergy evaluation. The content synergy degree is calculated based on the proportion of keywords in the total word frequency(Liu and Wang, 2022), as follows in Equation (4), Equation (5):
where w represents the keywords of the policy, y represents a policy theme dimension (i.e., safeguard measures). m represents the number of policy theme dimensions, p represents the government. nwyp represents the total frequency of the policy keywords of dimension y of the government p , Swyp represents the intensity of policy of dimension y of government p , Swy represents the intensity of the policy for dimension y in all governments. Swyp/Swy characterizes the content synergy of that government p on dimension y , reflecting how much that government’s focus on that dimension is consistent with the nation as a whole. Zwyp represents the total content synergy degree of government ps.
This paper focuses on the policy synergy of COPPCP in China. The COPPCPs of the central government and 11 coastal provinces were collected. China’s mainland coastline is over 18,000 km (Figure 4). The coastal provinces have issued similar policies in their respective provinces after the COPPCP of the central government was promulgated. The governmental structure of each Chinese province varies, and each has a different list of tasks. The problem of scattered department structures is representative of developing countries and at the same time brings to light the need to evaluate the degree of policy synergy. Most of these policies were enacted under the guidance of the COPPCP issued by the Chinese central government in 2017. The standardized structure of the texts makes it feasible to evaluate the degree of policy synergy in these 12 texts.
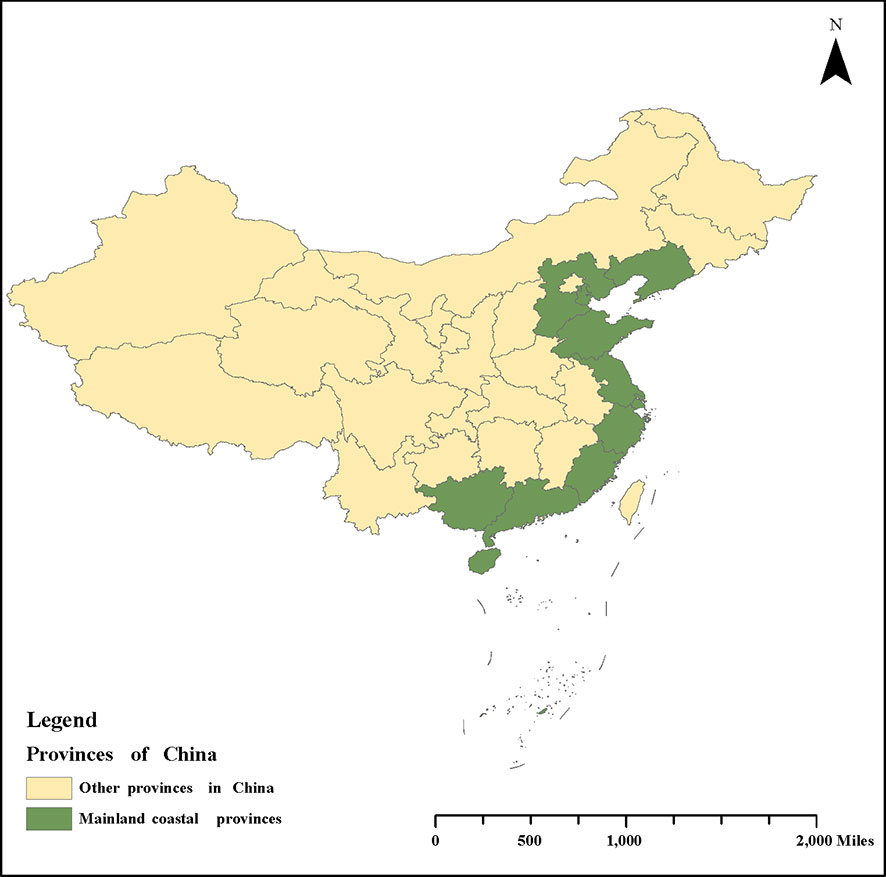
Figure 4 Coastal provinces in mainland China.
After constructing the synergistic network of policy subject departments in the 12 COPPCPs, three types of synergistic networks with different structural characteristics were observed, as shown in Figure 5. The node size in the figure represents the value of the eigenvector centrality. A darker color means that the node is connected to more other nodes and the node has a greater degree. The three synergistic networks are represented by the department synergy networks of Shandong, the central government, and Shanghai. Shandong’s synergy network has only the Environmental Protection Bureau (EPB) as the core, and the others are in a position to be led. The central government’s synergy network is polycentric in nature, with the EPB, the Agricultural Commission & Bureau (ACB), and the Marine Bureau (MAB) occupying the network’s central position. On the other hand, the synergistic network in Shanghai emphasizes the centrality of the lower-level government (LLG), and vertical synergy between the upper and lower levels features prominently.
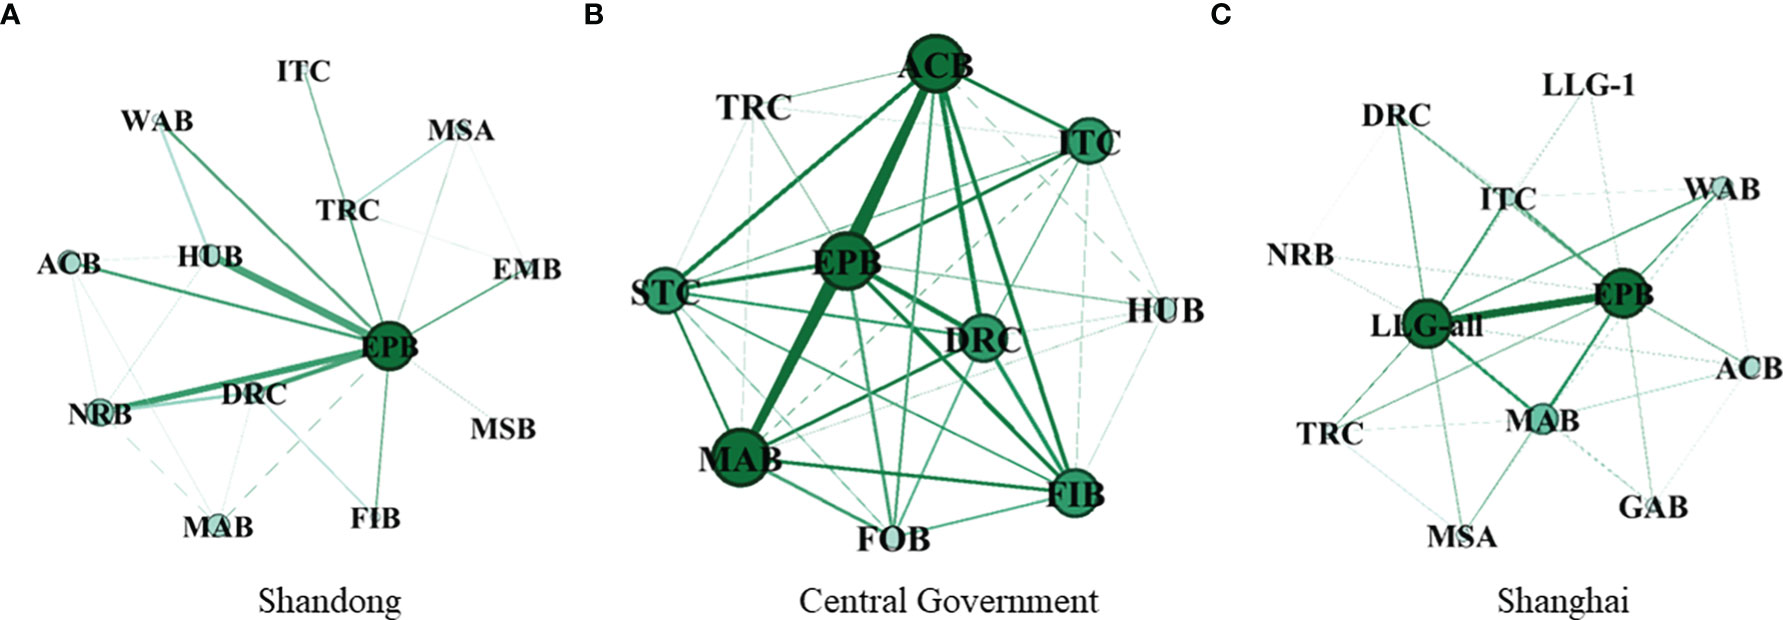
Figure 5 Three types of synergy networks: (A) Single-core government, (B) Multi-core government, (C) Vertical synergistic government.
According to the characteristics of the network structure, we can call the governments similar to the synergistic networks in Shandong, the central government, and Shanghai as single-core government, multi-core government, and vertical synergistic government, respectively. The synergistic networks of other provinces all belong to these three types respectively, and due to the limited space of the article, the synergistic networks of other provinces are presented in the Supplementary Image.
The types of collaborative networks can also be distinguished under network density, as shown in Table 1. The central government shows the highest density of department synergy networks. On the one hand, it reflects more cores in the network, and on the other hand, it reflects the close collaboration relationship between departments. It can be seen that the central government of China attaches importance to the COPPCP synergistic process, emphasizing the joint action of multiple departments. Hebei and Shandong fall into the same category. The network is centered on the environmental protection department, resulting in a single core government with low density. There needs to be stronger interdepartmental synergy among policy subject departments. The single core government is mostly in the northern provinces of China. Most of the northern provinces are manufacturing concentrated provinces, and pollution is more serious. Environmental protection has always been an important government work that the northern provinces are concerned about. This is the real reason why the EPB is getting attention. The network density of vertical synergistic government lies between that of the central government and that of Shandong province. The extent to which responsibilities are assigned to the next level of government affects the density of the synergistic network. For example, in Shanghai, most of the tasks of marine pollution prevention and control are assigned to the next level of government as well as the Environmental Protection Bureau, which is only a dual-core structure with a low network density. However, in Guangxi, each task is assigned to the next level of government as the responsible unit, with provincial departments assisting. This has resulted in a higher network density in Guangxi.
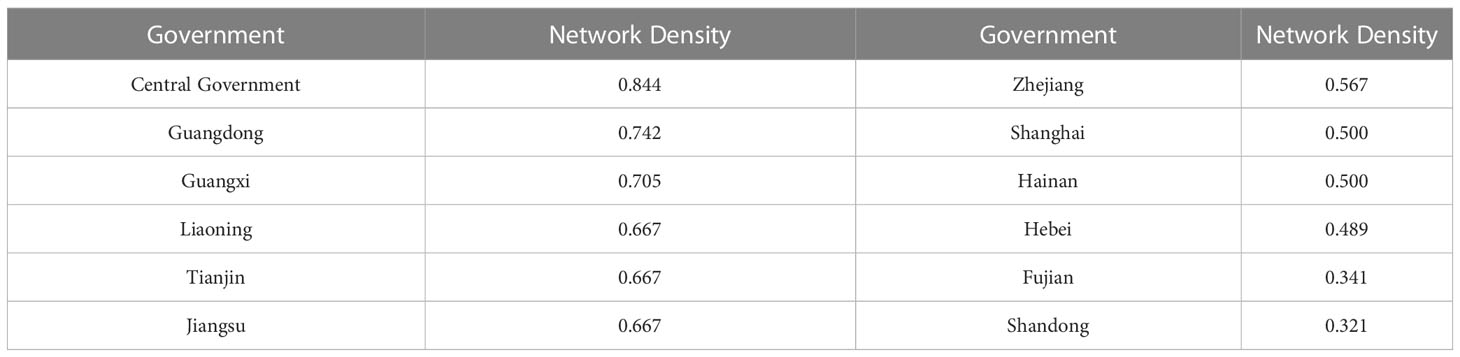
Table 1 Departmental synergy network density.
We build a database of policy texts to be analyzed based on 12 policies. First, tokenize the policy text with Jieba Chinese word segmentation tool to obtain a list of all the words it contains. Then, input the sentence into the Chinese RoBERTa-wwm-ext-large pre-trained language model to get the word vector corresponding to the vocabulary list.
After obtaining the word vectors corresponding to each word, input it into the K-Means algorithm to obtain the category corresponding to each word. Subsequently, we conduct experiments in the range of the number of clusters [20-100] and select the cluster with the highest silhouette coefficient as the final number of themes. According to the performance in Figure 6, the clustering effect after the number of categories is 75 has little improvement, so we select the category 75 corresponding to the maximum silhouette coefficient as the final number of themes.
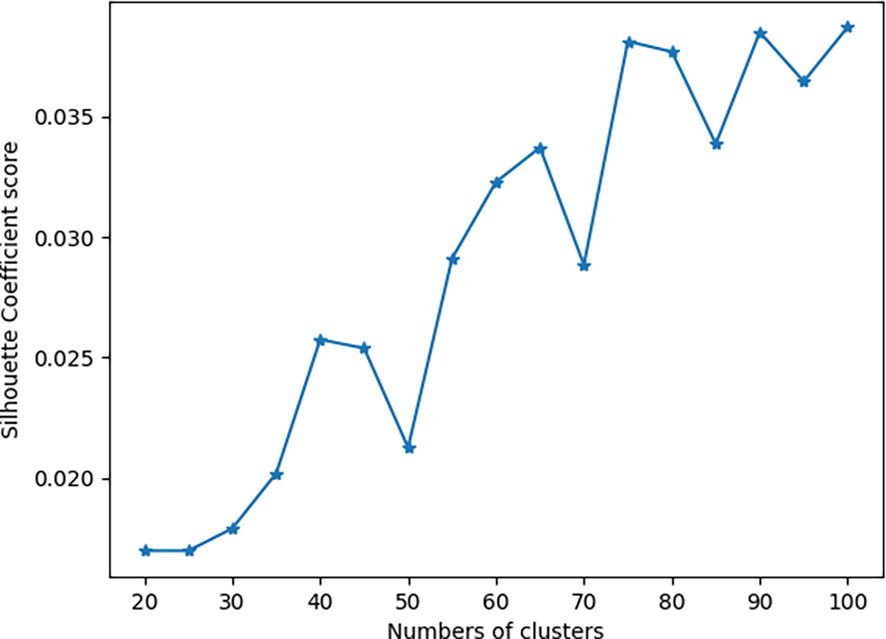
Figure 6 K-means clustering experiment process.
After filtering out clustering topics that do not cluster well or are too semantically broad or have no clear semantics, the above 75 categories were manually filtered to finally get 24 categories of keywords and summarized to get four major categories of themes. The four categories of themes are Marine Ecological Protection (MEP), Marine Pollution Control (MPC), Land-based Pollution Reduction (LPR), and Safeguard Measures (SAM). The characteristic words in each of the four categories of themes are shown in Figure 7. The four categories correspond exactly to the standardized framework of priority task safeguards in COPPCP. This illustrates the accuracy of the automatic theme clustering method. The keywords of MEP, MPC, and MPR are primarily words that characterize the problem objects and policy objectives. Observing these keywords can give us a glimpse of each government’s objectives, expectations, and requirements in policy formulation. For example, MEP contains keywords such as oil well, wetland, and other marine ecological focus, MPC contains chemicals and other common pollutants in the ocean, and LPR includes target words such as environmental quality. SAM is a collection of keywords that can characterize policy tools and policy measures, such as monitor, register, network platform, etc. The four themes are identified so that the content of China COPPCP can be abstractly and precisely expressed.
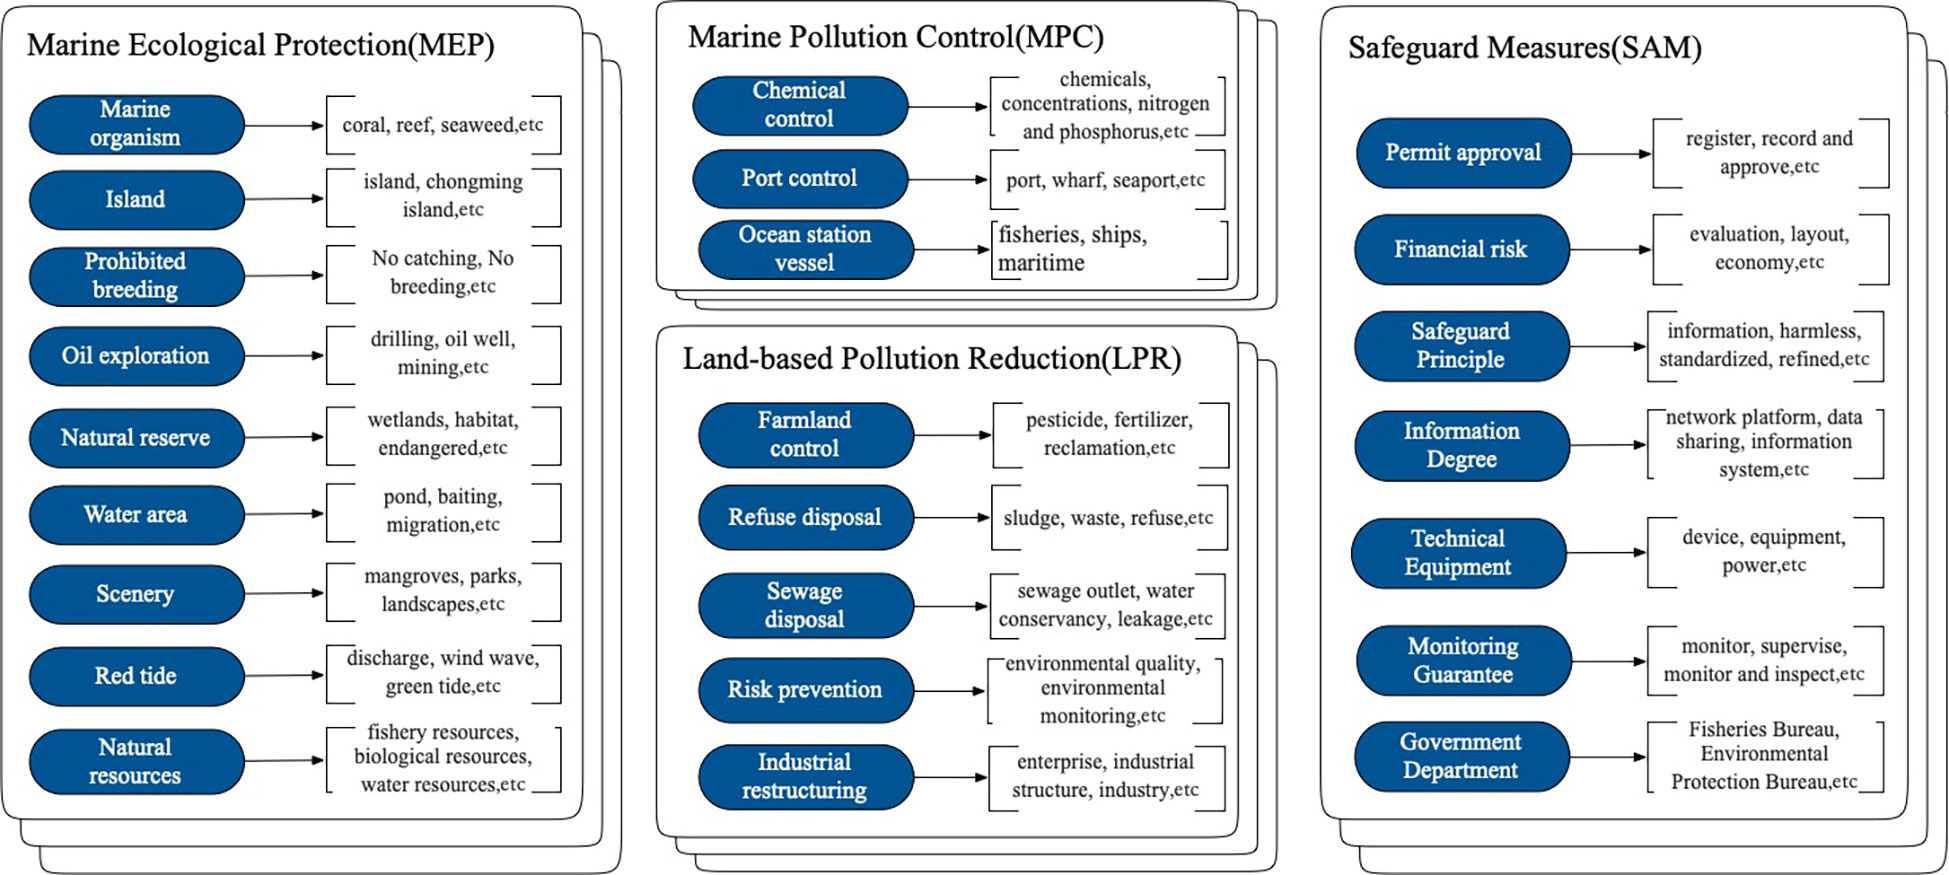
Figure 7 Theme Clustering.
Since each major category contains different subthemes, the frequency of the words contained in different subthemes varies. When selecting theme words based on frequency or ranking alone, it would result in the overall lower frequency subthemes being ignored. Therefore, we took the top 10 keywords of each subtheme as the nationally focused policy content. The main keywords for each theme are presented in the word cloud image, as shown in Figure 8. The size of the words in the cloud image is determined by word frequency. On the theme of MEP, there is a general national focus on resources, wetlands, and other words that characterize ecology. For MPC, there is a general national focus on ships, ports, and chemicals. For the LCR theme, the nation is generally concerned with land-based pollution from industries and companies. For SAM, most of the government’s attention is focused on the terms of monitoring, license, and other command-and-control policy tools.
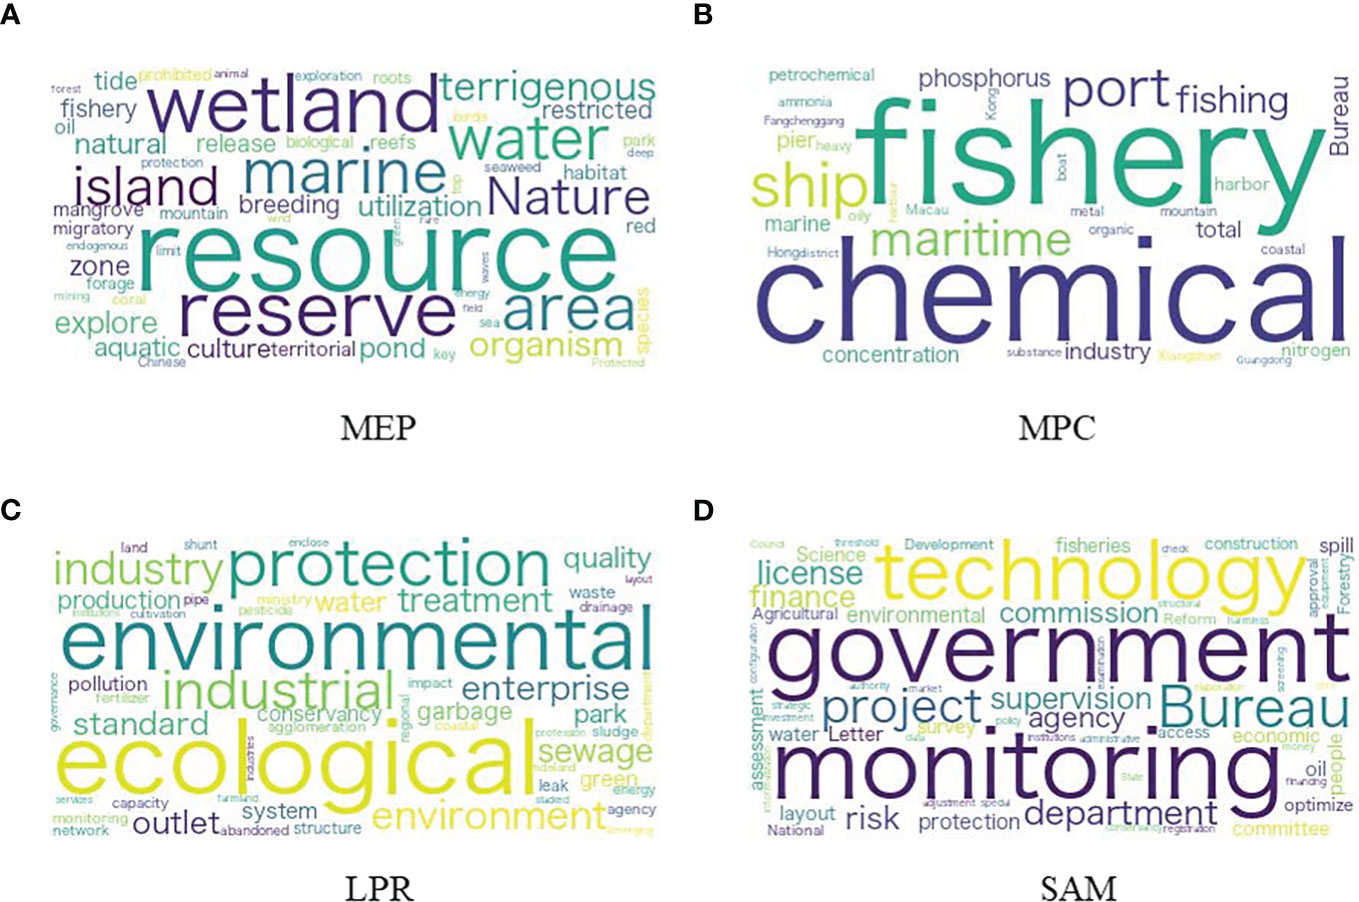
Figure 8 Cloud map of high-frequency words in the policy texts of governments: (A) High-frequency words in the MEP theme, (B) High-frequency words in the MPC theme, (C) High-frequency words in the LPR theme, (D) High-frequency words in the SAM theme.
To fully demonstrate the content synergy, this study uses the change in the proportion of high-frequency words to reflect changes in policy concerns. Equation (1) and Equation (2) are used to quantify the degree of content policy coordination, and the results are listed in Figure 9. In this figure, the synergy among governments on the four content themes and the overall content synergy make up the five dimensions of content synergy evaluation. The value represents the degree of synergy in that dimension, and a value of 1 means that the policy content can be consistent with the overall national situation. On the whole, the policy contents of all governments can be consistent in the three themes of marine ecological protection, marine pollution control, and land-based pollution reduction. However, on the theme of SAM, the individual governments reflect different degrees of synergy. This, on the one hand, indicates the different degrees of importance attached to the safeguards of COPPCP among governments. On the other hand, it may also indicate the different policy tools used among governments. These two scenarios are the reasons for the variability in the degree of synergy.
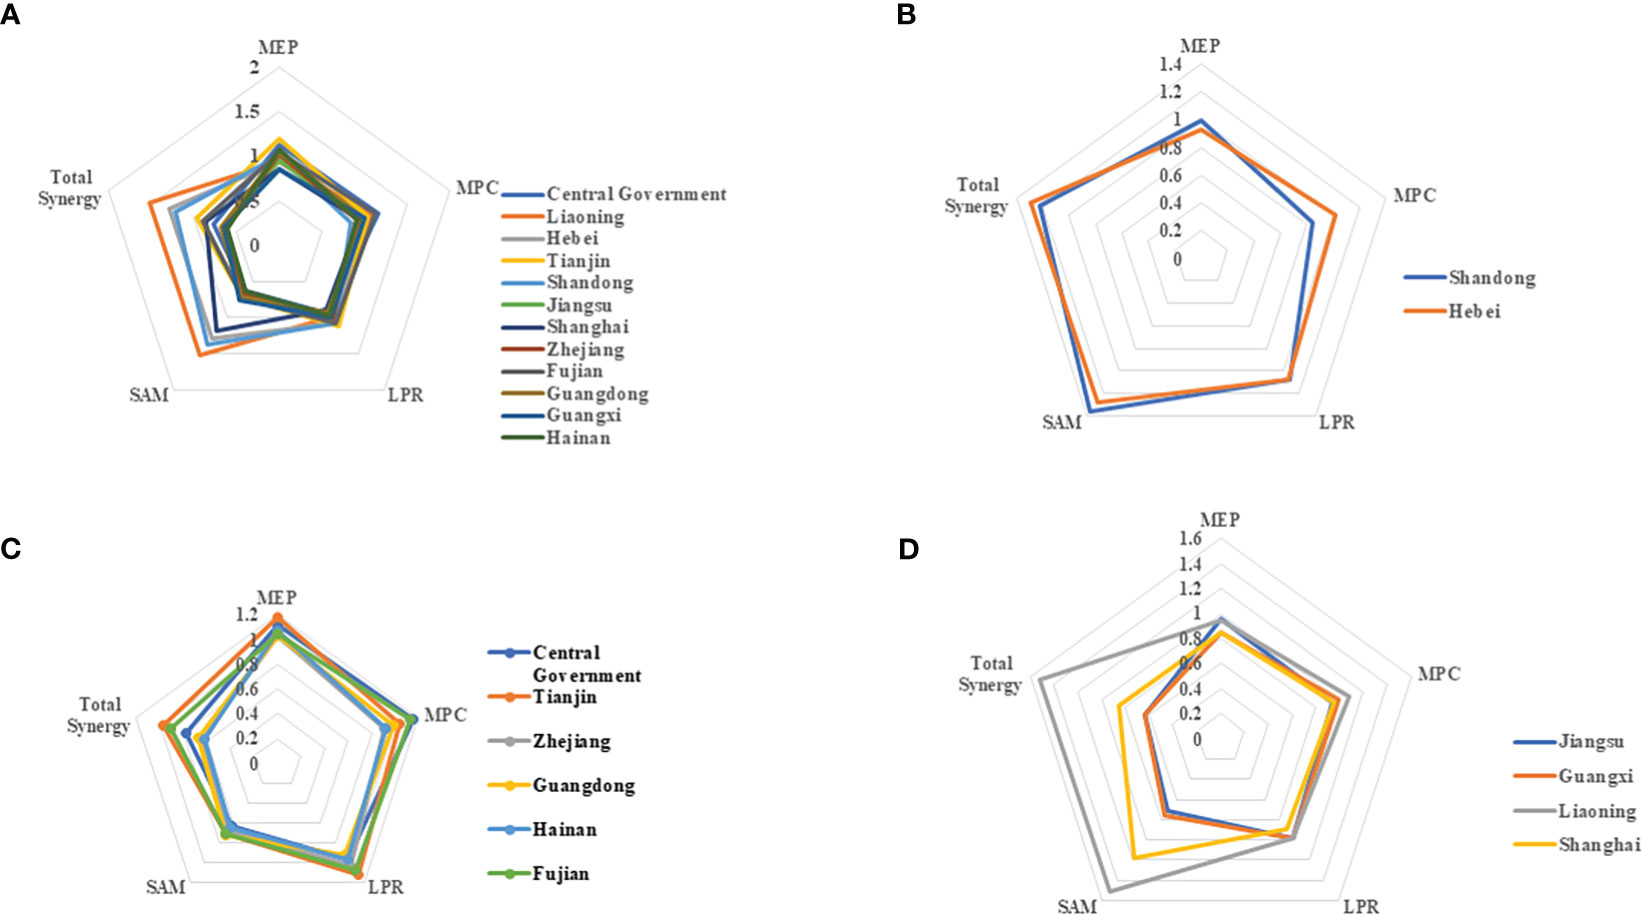
Figure 9 Content Synergy Distribution: (A) the degree of all governments, (B) the degree of single-core governments, (C) the degree of multi-core governments, (D) the degree of vertical synergistic governments.
In connection with the three government categories divided by the synergy network’s characteristics in section 4.2, we conduct a comparative analysis of the content theme synergy situation. The three categories of governments show different distributions of theme synergy. The single-core government can keep in line with the overall national situation in MEP, MPC, and LPR, and the synergy degree is close to 1. However, the attention to the theme of SAM is much greater than the overall national situation, and the synergy degree is higher than 1. The multi-core government is completely opposite to the single-core government. Regarding the SAM theme, the multi-core government was not able to align with the national picture as a whole. On the MEP, MPC, and LPR themes, the multi-core governments are able to align with the nation and even have an enhanced level of concern. The vertical synergistic governments show differentiation among themselves. Although these governments are able to align with the overall national picture on the MEP, MPC, and LPR themes, they show differences in the degree of synergy on the SAM theme. This differentiation draws our attention to the fact that provinces with different geographic locations have different concerns about policy themes. Liaoning is more similar to the governments around Bohai Bay, such as Hebei and Shandong, in terms of policy content, and focuses more on SAM. The SAM theme is mostly reflected in the command-and-control policy tools, which are in line with the reality of northern China that focuses more on the enforcement role of policies. Shanghai delegates responsibility for coastal ocean pollution prevention and control to lower levels of government, and the excessive focus on SAM provides a guarantee for this. Guangxi and Jiangsu pay less attention to SAM than the country as a whole. This makes us aware that the two provincial governments may need more follow-up on the implementation of policy objectives, handing over both tasks and difficulties to lower levels of government.
The policy synergy of COPPCP is an important component of marine pollution governance. In this paper, we use methods such as social network analysis and the Chinese BERT-WWM model to evaluate policy synergy in two dimensions: subject department and content theme.
Through the construction of the department synergy network, we evaluated the policy synergy from a process perspective. This study finds that the overall degree of department synergy of COPPCP in China is low. The results are similar to previous studies on the synergistic measurement of haze pollution management policies (Li and Ye, 2021), which indicates that the environmental governance structure in China still needs to be improved. The current policy synergy process of China’s COPPCP still needs to be improved. The characteristics of the inter-governmental department synergy network structure vary widely, and the consistency of actions is weak. According to the synergy network structure, governments can be divided into three types: single-core governments, multi-core governments, and vertical synergy governments. The coexistence of multiple government types reflects the current reform of China’s governmental governance system toward polycentric governance (Yu and Cui, 2021). The policy synergy process of polycentric governance will cross the administrative limits of the domain and is consistent with integration from an ecosystem perspective (Soma et al., 2015). At the same time, by drawing on the studies of ship transportation optimization problems that have fully taken into account regional synergy factors, it is foreseen that the process of future policy synergy will also need to take into account the economic demands of enterprises in different regions, the coast, and port conditions (Xu et al., 2021a; Xu et al., 2022a; Xu et al., 2022b). Meanwhile, the popularity of COVID-19 also intensifies the complexity of the policy synergy process (Xu et al., 2022c). In addition, the structure of the synergy network can reflect the COPPCP focus of each location. Northern governments are mostly synergy networks with EPB as a single core, which is a result consistent with the current reality of more serious pollution in Bohai Bay.
Through the clustering of content themes and the calculation of content synergy, we evaluated the policy synergy from the objective and status perspectives. Through objective quantitative calculations of the BERT model, we derived four major themes. The four major themes fit with the COPPCP standardized framework, which can prove the reliability of the method. In the synergy calculation, Chinese coastal provinces were able to maintain synergy in the MEP, MPC, and LPR themes. These themes mostly contain keywords that reflect the policy objectives. It can be seen that the objectives of the Chinese government regarding COPPCP are able to achieve synergy. However, regarding the SAM theme, it is difficult to reach an agreement among the various governments. The keywords in SAM reflect more the type of policy tools. Therefore, it is difficult for governments to agree in policy tool synergy and the status of policy synergy is difficult to maintain. In addition, single-core governments, multi-core governments, and vertical synergy governments show different characteristics in terms of policy content synergy. Single-core governments have higher synergy in SAM compared to the other two types of governments. This partly indicates that the concentration of power can better leverage the power to solve problems rather than just setting objectives (Luo et al., 2019). It can be seen that each government is choosing different policy tools according to its own situation. Drawing on research in other fields (Xu et al., 2021b), we believe that the establishment of information platforms or specialized integrated governance departments for pollution prevention and control in the coastal ocean will be necessary to maintain the state of policy synergy.
The contribution of this paper is to highlight the study of policy synergy in the coastal ocean for pollution prevention and control, which is not available in previous marine pollution governance studies. This study evaluates policy synergy from the objective, process, and status perspectives, which is more credible than previous empirical studies under the outcome perspective. In addition, the BERT-WWM model is used to replace the manually coded content analysis method in previous policy synergy studies, and the advantage of methodological objectivity is obvious.
The issue of policy synergy evolution is highlighted as a necessity in current research on marine pollution governance in developing countries. This study uses a two-dimensional evolution framework of policy subject department and policy content theme to analyze the policy synergy degree for COPPCP in China. The objectives, status, and process of policy synergy are observed. This study finds that the current degree of synergy among Chinese coastal provinces and central government departments is poor overall, and the policy synergy process lacks vitality. Consistent policy objectives can be established among governments in marine ecological protection, marine pollution control, and land-based sources of pollution reduction. However, it is difficult to achieve synergy in the policy tools reflected in the safeguard measure theme. The content themes are not fully consistent across governments making the state of policy synergy poor. Both inside and outside the organization faces obstacles to policy synergy. This may be an impediment for the current COPPCP to play a greater role.
The synergy network of subject departments and the degree of content theme synergy obtained from the evaluation of this study can help the Chinese government to further improve COPPCP.
(1) The degree of interdepartmental linkages within the single-core government is weak and should be strengthened. Environmental protection departments in Shandong and Hebei have been effective in leading the fight against pollution but should take into account both economic and environmental benefits. If the transition to a circular economy is promoted, the economic department should take more responsibility for the prevention and control of pollution in the coastal ocean in the future.
(2) The degree of policy tool synergy among governments is weak. The traditional governance concept of relying only on the control-command tool should be abandoned. With the concept of service-oriented government being advocated today, coastal provinces should try more fundamental solutions to marine pollution. Policy tools such as technology, awareness, and education should be promoted.
(3) The objectives are consistent, but there is a need for a sound mechanism to ensure that these objectives are achieved. Chinese provinces are able to achieve objective synergy in marine ecological protection, marine pollution control, and land-based sources of pollution reduction. And some provinces already have a department synergy network with polycentric governance. This is a good starting point. Next, a joint marine governance department can be considered between different regions, which will help further the integration of resources and guarantee the smooth achievement of objectives.
This study still has limitations. This study provides an evolution method of policy synergy. In the field of coastal ocean pollution prevention and control, issues such as policy synergy mechanisms and influencing factors of policy synergy still need to be explored by subsequent researchers.
Publicly available datasets were analyzed in this study. This data can be found here: Official websites of China’s coastal provinces and the central government, such as “The notice on the issuance of ' Coastal Ocean Pollution Prevention and Control Program' (2017) Official website of the Ministry of Ecology and Environment of the People's Republic of China. Ministry of Ecology and Environment of the People's Republic of China. Available at: https://www.mee.gov.cn/gkml/hbb/bgth/201704/t20170419_411769.htm (Accessed: October 12, 2022).
CY: Conceptualization, Data Curation, Formal analysis, Visualization, Writing - original draft. MS: Methodology, Writing - original draft, Writing - Review & Editing. LL: Conceptualization, Supervision, Validation. All authors contributed to the article and approved the submitted version.
The authors declare that the research was conducted in the absence of any commercial or financial relationships that could be construed as a potential conflict of interest.
All claims expressed in this article are solely those of the authors and do not necessarily represent those of their affiliated organizations, or those of the publisher, the editors and the reviewers. Any product that may be evaluated in this article, or claim that may be made by its manufacturer, is not guaranteed or endorsed by the publisher.
The Supplementary Material for this article can be found online at: https://www.frontiersin.org/articles/10.3389/fmars.2023.1131590/full#supplementary-material
COPPCP, Coastal Ocean Pollution Prevention and Control Program; LLG-x, Lower Level Government; MEP, marine ecological protection; MAB, Marine Bureau; MPC, marine pollution control; MSA, Maritime Safety Agency; LPR, land-based pollution reduction; MSB, Market Supervision Bureau; SAM, safeguard measures; NRB, Natural Resources Bureau; ACB, Agriculture Committee or Bureau of Agriculture; STC, Science and Technology Committee; COO, Coastal Office; TRC, Transportation Committee; DRC, Development and Reform Commission; WAB, Water Bureau; EMB, Emergency Management Bureau; BUB, Business Bureau; EPB, Environmental Protection Bureau; TOB, Tourism Bureau; FIB, Finance Bureau; HEC, Health Committee; FOB, Forestry Bureau; MPB, Marine Police Bureau; HUB, Housing and Urban-Rural Development Bureau; GAB; Greening and Amenities Bureau; ITC, Industrialization and Information Technology Committee; AHB, Animal Husbandry Bureau; BERT-WWM, Bidirectional Encoder Representations from Transformers-Whole Word Masking.
Bai L., Chen H., Gao Q., Luo W. (2018). Project portfolio selection based on synergy degree of composite system. Soft Comput. 22, 5535–5545. doi: 10.1007/s00500-018-3277-8
Bauer J. E., Cai W.-J., Raymond P. A., Bianchi T. S., Hopkinson C. S., Regnier P. A. G. (2013). The changing carbon cycle of the coastal ocean. Nature 504, 61–70. doi: 10.1038/nature12857
Blei D. M., Ng A. Y., Jordan M. I. (2003). Latent dirichlet allocation. J. Mach. Learn Res. 3, 993–1022. doi: 10.1016/b978-0-12-411519-4.00006-9
Bolleyer N. (2011). The influence of political parties on policy coordination. Governance 24, 469–494. doi: 10.1111/j.1468-0491.2011.01531.x
Boom Cárcamo E. A., Peñabaena-Niebles R. (2022). Opportunities and challenges for the waste management in emerging and frontier countries through industrial symbiosis. J. Clean Prod 363, 132607. doi: 10.1016/j.jclepro.2022.132607
Bunea A., Ibenskas R. (2017). Estimating interest groups’ policy positions through content analysis: A discussion of automated and human-coding text analysis techniques applied to studies of EU lobbying. Eur. Polit Sci. 16, 337–353. doi: 10.1057/eps.2016.15
Chang Y. C., Zhao X., Han Y. (2022). Responsibility under international law to prevent marine pollution from radioactive waste. Ocean Coast. Manag 227, 106294. doi: 10.1016/J.OCECOAMAN.2022.106294
Chen X., Xu Q. (2022). Reflections on international dispute settlement mechanisms for the fukushima contaminated water discharge. Ocean Coast. Manag 226, 106278. doi: 10.1016/J.OCECOAMAN.2022.106278
Cui Y., Che W., Liu T., Qin B., Yang Z. (2021). Pre-training with whole word masking for Chinese BERT. IEEE/ACM Trans. Audio Speech Lang Process 29, 3504–3514. doi: 10.1109/TASLP.2021.3124365
Deng J. M. X. B. Q. (2014). Comparative study of the social network analysis tools: Ucinet and gephi. Inf. Studies:Theory Appl. 37, 133–138. doi: 10.16353/j.cnki.1000-7490.2014.08.001
Devlin J., Chang M. W., Lee K., Toutanova K. (2019). “BERT: Pre-training of Deep Bidirectional Transformers for Language Understanding,” in NAACL HLT 2019 - 2019 Conference of the North American Chapter of the Association for Computational Linguistics: Human Language Technologies - Proceedings of the Conference 1, 4171–4186. Available at: http://arxiv.org/abs/1810.04805.
Dinges M., Biegelbauer P., Wilhelmer D. (2018). The tower of Babylon in the governance of research, technology and innovation: Participatory foresight as a method of policy coordination. Futures 100, 34–44. doi: 10.1016/j.futures.2018.03.018
Fadeeva Z., van Berkel R. (2021). ‘Unlocking circular economy for prevention of marine plastic pollution: An exploration of G20 policy and initiatives. J. Environ. Manage 277, 111457. doi: 10.1016/J.JENVMAN.2020.111457
Garcia B., Fang M. M., Lin J. (2019). Marine plastic pollution in Asia: All hands on deck! Chin. J. Environ. Law 3, 11–46. doi: 10.1163/24686042-12340034
Graham R. E. D. (2022). Achieving greater policy coherence and harmonisation for marine litter management in the north-East Atlantic and wider Caribbean region. Mar. Pollut. Bull. 180, 113818. doi: 10.1016/j.marpolbul.2022.113818
Grimmer J., Stewart B. M. (2013). Text as data: The promise and pitfalls of automatic content analysis methods for political texts. Polit. Anal. 21, 267–297. doi: 10.1093/pan/mps028
Hamilton W. L., Leskovec J., Jurafsky D. (2016). “Diachronie word embeddings reveal statistical laws of semantic change,” in Proceedings of the 54th Annual Meeting of the Association for Computational Linguistics. (Volume 1: Long Papers) (Stroudsburg, PA, USA: Association for Computational Linguistics), 489–1501. doi: 10.18653/v1/p16-1141
Hartley B. L., Pahl S., Veiga J., Vlachogianni T., Vasconcelos L., Maes T., et al. (2018). Exploring public views on marine litter in Europe: Perceived causes, consequences and pathways to change. Mar. Pollut. Bull. 133, 945–955. doi: 10.1016/J.MARPOLBUL.2018.05.061
Hills J. M., Lajaunie C., Maharaj P. N., Mazzega P. (2021). Orchestrating the ocean using a national ocean policy: The case of the Solomon islands. Front. Mar. Sci. 8. doi: 10.3389/fmars.2021.676944
Kumar P. S., Prasannamedha G. (2021). “Biological and chemical impacts on marine biology,” in Modern treatment strategies for marine pollution (Elsevier), 11–27. doi: 10.1016/B978-0-12-822279-9.00006-3
Le Q., Mikolov T. (2014). “Distributed representations of sentences and documents,” in 31st International Conference on Machine Learning, ICML 2014 4, 1188–1196. doi: 10.5555/3044805.3045025
Li J., Ye S. (2021). Regional policy synergy and haze governance–empirical evidence from 281 prefecture-level cities in China. Environ. Sci. Pollut. R 28, 10763–10779. doi: 10.1007/s11356-020-11251-8
Liu Y., Guo X.-Q., Li S.-W., Zhang J.-M., Hu Z.-Z. (2022). Discharge of treated fukushima nuclear accident contaminated water: Macroscopic and microscopic simulations. Natl. Sci. Rev. 9. doi: 10.1093/nsr/nwab209
Liu D., Wang D. (2022). Evaluation of the synergy degree of industrial de-capacity policies based on text mining: A case study of china’s coal industry. Resour. Policy 76, 102547. doi: 10.1016/j.resourpol.2021.102547
Lu W., Wu H., Yang S., Tu Y. (2022). Effect of environmental regulation policy synergy on carbon emissions in China under consideration of the mediating role of industrial structure. J. Environ. Manage 322, 116053. doi: 10.1016/J.JENVMAN.2022.116053
Lu Y., Yuan J., Du D., Sun B., Yi X. (2021). Monitoring long-term ecological impacts from release of fukushima radiation water into ocean. Geogr. Sustain 2, 95–98. doi: 10.1016/J.GEOSUS.2021.04.002
Luo Z., Hu X., Li M., Yang J., Wen C. (2019). Centralization or decentralization of environmental governance-evidence from China. Sustainability (Switzerland) 11, 6938. doi: 10.3390/SU11246938
Meijers E., Stead D. (2004). “Policy integration ;: what does it mean and how can it be achieved ;? a multi-disciplinary review,” in 2004 Berlin confrerence on the human dimensions of global environment change (Berlin: Greening of Policies - Interlinkages and Policy Integration).
Men W. (2021). Discharge of contaminated water from the fukushima daiichi nuclear power plant accident into the Northwest pacific: What is known and what needs to be known. Mar. Pollut. Bull. 173, 112984. doi: 10.1016/J.MARPOLBUL.2021.112984
Mikolov T., Chen K., Corrado G., Dean J. (2013). “Efficient estimation of word representations in vector space,” in 1st International Conference on Learning Representations, ICLR 2013 - Workshop Track Proceedings. Available at: http://arxiv.org/abs/1301.3781.
Morales-Caselles C., Viejo J., Martí E., González-Fernández D., Pragnell-Raasch H., Ignacio González-Gordillo J., et al. (2021). An inshore-offshore sorting system revealed from global classification of ocean litter. Nat. Sustain 4, 484–493. doi: 10.1038/s41893-021-00720-8
Omeyer L. C. M., Duncan E. M., Aiemsomboon K., Beaumont N., Bureekul S., Cao B., et al. (2022). Priorities to inform research on marine plastic pollution in southeast Asia. Sci. Total Environ. 841, 156704. doi: 10.1016/j.scitotenv.2022.156704
Ouyang Y., Ye F., Tan K. (2022). The effect of strategic synergy between local and neighborhood environmental regulations on green innovation efficiency: The perspective of industrial transfer. J. Clean Prod 380, 134933. doi: 10.1016/J.JCLEPRO.2022.134933
Pennington J., Socher R., Manning C. D. (2014). “GloVe: Global vectors for word representation,” in Proceedings of the 2014 Conference on Empirical Methods in Natural Language Processing (EMNLP). (Stroudsburg, PA, USA: Association for Computational Linguistics) 1532–1543. doi: 10.3115/v1/d14-1162
Peters M. E., Neumann M., Iyyer M., Gardner M., Clark C., Lee K., et al. (2018). “Deep contextualized word representations,” in NAACL HLT 2018 - 2018 Conference of the North American Chapter of the Association for Computational Linguistics: Human Language Technologies - Proceedings of the Conference (Association for Computational Linguistics (ACL)) 2227–37. doi: 10.18653/v1/n18-1202
Ruhnau B. (2000). Eigenvector-centrality - a node-centrality. Soc. Networks 22, 357–365. doi: 10.1016/S0378-8733(00)00031-9
Rumelhart D. E., McClelland J. L. (1987). Distributed Representations. In Parallel Distributed Processing: Explorations in the Microstructure of Cognition: Foundations (MIT Press), 77–109.
Shen W., Liang H., Dong L., Ren J., Wang G. (2021). Synergistic CO2 reduction effects in Chinese urban agglomerations: Perspectives from social network analysis. Sci. Total Environ. 798, 149352. doi: 10.1016/j.scitotenv.2021.149352
Sinaga K. P., Yang M. S. (2020). Unsupervised K-means clustering algorithm. IEEE Access 8, 80716–80727. doi: 10.1109/ACCESS.2020.2988796
Sivadas S. K., Mishra P., Kaviarasan T., Sambandam M., Dhineka K., Murthy M. V. R., et al. (2022). Litter and plastic monitoring in the Indian marine environment: A review of current research, policies, waste management, and a roadmap for multidisciplinary action. Mar. Pollut. Bull. 176, 113424. doi: 10.1016/j.marpolbul.2022.113424
Soma K., van Tatenhove J., van Leeuwen J. (2015). Marine governance in a European context: Regionalization, integration and cooperation for ecosystem-based management. Ocean Coast. Manag 117, 4–13. doi: 10.1016/j.ocecoaman.2015.03.010
Wang L., Li F. (2022). State duty to cooperate on the fukushima nuclear contaminated water release. Mar. Policy 136, 104878. doi: 10.1016/J.MARPOL.2021.104878
Wise S. (2014). Can a team have too much cohesion? the dark side to network density. Eur. Manag J. 32, 703–711. doi: 10.1016/j.emj.2013.12.005
Wu H., Xie L., Wu Y., Chen L., Jiang B., Chen X., et al. (2023). Improving cleaner production of human activities to mitigate total petroleum hydrocarbons accumulation in coastal environment. Mar. Pollut. Bull. 186, 114473. doi: 10.1016/J.MARPOLBUL.2022.114473
Xiao G., Wang T., Chen X., Zhou L. (2022a). Evaluation of ship pollutant emissions in the ports of Los Angeles and long beach. J. Mar. Sci. Eng. 10, 1206. doi: 10.3390/jmse10091206
Xiao L., Zhang Y., Xiao L., Zhang Y. (2022b). An analysis on the policy evolution of cross-border ecommerce industry in China from the perspective of sustainability. Electron. Commer. Res. 22, 875–899. doi: 10.1007/s10660-020-09427-y
Xu L., Di Z., Chen J. (2021a). Evolutionary game of inland shipping pollution control under government co-supervision. Mar. Pollut. Bull. 171, 112730. doi: 10.1016/j.marpolbul.2021.112730
Xu L., Shi J., Chen J. (2021b). Platform encroachment with price matching: Introducing a self-constructing online platform into the sea-cargo market. Comput. Ind. Eng. 156, 107266. doi: 10.1016/j.cie.2021.107266
Xu L., Shi J., Chen J. (2022a). Agency encroachment and information sharing: Cooperation and competition in freight forwarding market. Marit. Policy Manag. 1–14. doi: 10.1080/03088839.2021.1990428
Xu L., Xie F., Wang C. (2022b). Passive or proactive capacity sharing? a perspective of cooperation and competition between two regional ports. Marit. Policy Manag 49, 492–509. doi: 10.1080/03088839.2021.1876938
Xu W., Zhang Z. (2022). Impact of coastal urbanization on marine pollution: Evidence from China. Int. J. Environ. Res. Public Health 19, 10718. doi: 10.3390/ijerph191710718
Xu L., Zou Z., Zhou S. (2022c). The influence of COVID-19 epidemic on BDI volatility: An evidence from GARCH-MIDAS model. Ocean Coast. Manag. 229, 106330. doi: 10.1016/J.OCECOAMAN.2022.106330
Yao C., Liu G., Hao X., Liu Y. (2023). Symbiotic integration of waste disposal capability within a city cluster: The case of the Yangtze river delta. J. Environ. Manage 330, 117166. doi: 10.1016/J.JENVMAN.2022.117166
Ye C., Wu L. (2022). Research on the policy synergy of supply-side and demand-side environmental policies: An analysis based on green value chain of manufacturing enterprises. Environ. Sci. Pollut. R 29, 46929–46952. doi: 10.1007/s11356-022-19225-8
Yu J., Cui W. (2021). Evolution of marine litter governance policies in China: Review, performance and prospects. Mar. Pollut. Bull. 167, 112325. doi: 10.1016/J.MARPOLBUL.2021.112325
Zhang J., Luo Y. (2017). “Degree centrality, betweenness centrality, and closeness centrality in social network,” in Proceedings of the 2017 2nd international conference on modelling, simulation and applied mathematics (MSAM2017) (Paris, France: Atlantis Press). doi: 10.2991/msam-17.2017.68
Keywords: coastal ocean pollution, marine pollution governance, coastal ocean pollution prevention and control program, policy synergy evaluation, content analysis
Citation: Yao C, Sun M and Liu L (2023) Evaluation of policy synergy in coastal ocean pollution prevention and control: The case from China. Front. Mar. Sci. 10:1131590. doi: 10.3389/fmars.2023.1131590
Received: 25 December 2022; Accepted: 13 February 2023;
Published: 28 February 2023.
Edited by:
Zhen-Zhong Hu, Tsinghua University, ChinaReviewed by:
Guangnian Xiao, Shanghai Maritime University, ChinaCopyright © 2023 Yao, Sun and Liu. This is an open-access article distributed under the terms of the Creative Commons Attribution License (CC BY). The use, distribution or reproduction in other forums is permitted, provided the original author(s) and the copyright owner(s) are credited and that the original publication in this journal is cited, in accordance with accepted academic practice. No use, distribution or reproduction is permitted which does not comply with these terms.
*Correspondence: Lin Liu, ZWFybmVzdGxpdUAxMjYuY29t
Disclaimer: All claims expressed in this article are solely those of the authors and do not necessarily represent those of their affiliated organizations, or those of the publisher, the editors and the reviewers. Any product that may be evaluated in this article or claim that may be made by its manufacturer is not guaranteed or endorsed by the publisher.
Research integrity at Frontiers
Learn more about the work of our research integrity team to safeguard the quality of each article we publish.