 Jakub M. Kwiatkowski1,2
 Jacek Zaucha1,2*
- 1Department of International Economics and Economic Development, Faculty of Economics, University of Gdansk, Sopot, Poland
- 2Sopot Institute for Development, Sopot, Poland
It is generally agreed that the blue economy and blue growth play important roles in the global economy; over the last few years, they have been widely discussed at both national and international levels. Nevertheless, there is a lack of consensus on how to measure them, as the accounting methodologies differ between studies, implying divergent results. This article summarizes previous studies by comparing blue economy accounting methodologies and highlighting their strengths and weaknesses. Based on the comparison, a new methodology is proposed, based primarily on micro- and country-specific local data; this new methodology has been applied to measure the size of the blue economy in Poland. The results show that previous analyses have slightly underestimated the size of the blue economy in Poland, despite similarities concerning general dynamics and sectoral structure over time. The study concludes that a trade-off exists between using existing one-size-fits-all methods and country-specific methods, with a more precise, tailored approach being achieved at the expense of the accuracy of cross-country comparisons. Finally, the study highlights that, as there is no unambiguous solution to the problem of the above trade-off, different methods should be used with regard to the choice of method depends on the specific research task to be carried out or policy question to be addressed.
1 Introduction
Blue growth is a policy topic vigorously discussed and researched for at least 10 years, at both the global (OECD, 2011; UNEP et al., 2012) and EU levels (European Commission, 2012). A special issue of Marine Policy in 2018 (in Vol. 87) was exclusively devoted to this theme. The annual EU Blue Economy Reports examine and present the scope and size of the European blue economy and also related opportunities and development trends. According to the most recent report (European Commission, 2021a), the added value of the EU blue economy amounted to €176 billion in 2018 [1.5% of total EU gross domestic product (GDP)] and created employment for 4.5 million people (2.3% of total EU employment). However, the aforesaid relative indicators have remained stable for the past 10 years, with a notable exception—a gradual increase in the rate of employment after the 2008 economic crisis contraction. Having in mind the advantages and strengths of the blue economy identified in the literature (e.g., World Bank, 2016) the aforesaid stagnation can be interpreted as evidence for a still untapped potential of the sector in Europe. For that reason, the exact measurement of the blue economy seems to be of the utmost importance. Despite 10 years of research and monitoring of the development of the blue economy by international organizations, the measurement is still unsatisfactory. It is based on rough attributions and assumptions about what belongs to the blue economy and what remains in a terrestrial realm; according to the most recent EU report “the Blue Economy Indicators strive for more and better data” (European Commission, 2021a, p. 2). Under the research grant of the Polish National Science Centre, an attempt has been made to propose more accurate and reliable measurement methods of the blue human-originated economy. This paper presents the approach applied in Poland and examines its strong and weak points.
First, we present the research method and the aim of the paper followed by five sections presenting the research results: (i) the essence of the blue economy, (ii) challenges related to the delineation of the blue economy and its measurement, (iii) measurement methods applied in Poland and (vi) outcomes obtained, and (v) a discussion of the usability of the Polish measurement effort. The final part contains conclusions on the broader applicability of the Polish experience and further research directions. This paper is a result of the knowledge and experience collected from across the broader community of researchers and practitioners dealing with the blue economy in Poland and Europe.
2 Aim and method
The main aim was to facilitate the production of more accurate data and estimates on the blue economy that would provide more precise information for public and business decision-making and better inform related research. The paper utilizes several research methods, such as literature screening, data mining, processing of quantitative data, and critical comparison. The logic of the research is presented in Figure 1.
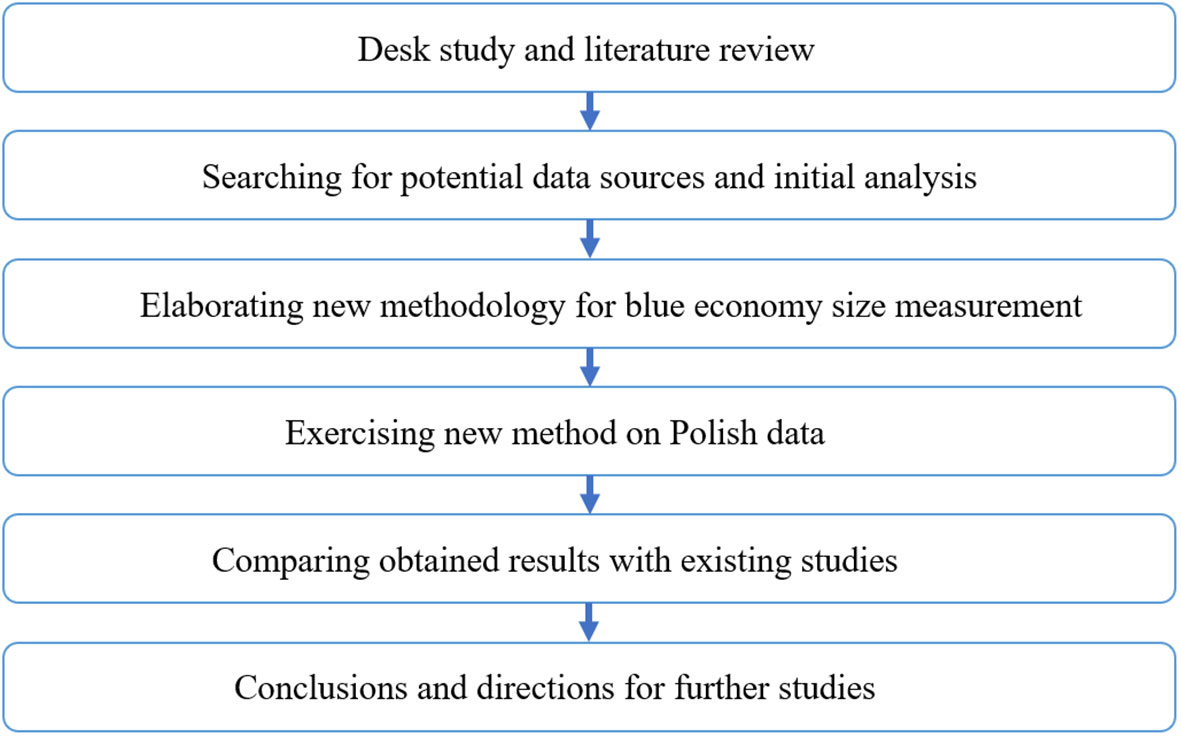
Figure 1 Stages of conducted research. Source: own elaboration.
3 Meaning of blue in the economic realm1
There are two fundamental concepts that require more indepth understanding for the purpose of this paper: blue economy and blue growth. In this paper, the terms blue economy, maritime economy, and ocean economy will be used interchangeably, as is the case in many scientific papers and reports on this topic. According to the initial EU report (Ecorys, 2012, 26) that started European discussions on the blue economy, this category consists “of all the sectoral and cross-sectoral economic activities related to the oceans, seas, and coasts”. The blue economy was to encompass “closest direct and indirect supporting activities necessary for the functioning of the maritime economic sectors” (Ecorys, 2012, 26). Park and Kildow, who first examined various definitions of the blue economy (Park and Kildow, 2014, 6), proposed functional relationships to the ocean and coast as the factor differentiating the blue economy from its terrestrial counterpart: “Thus, the ocean economy is related to economic activity as an industrial aspect, and directly or indirectly related to the ocean (including the coast) as a geographical aspect” (Park and Kildow, 2014,7). This was echoed in the early EU definition of the blue economy, which stated that “The EU’s blue economy covers market activity taking place on European territory that is intrinsically linked to the sea” (European Commission, 2015, 1). The Organization for Economic Co-operation and Development [OECD (2016)] went further and underlined the importance of both human-induced investments and proper functioning of marine ecosystems providing “free” important ecosystem goods and services. Thus, according to the OECD (2016), “the ocean economy can be defined as the sum of the economic activities of ocean-based industries, and the assets, goods, and services of marine ecosystems”. Both categories take the form of a flow of goods and services produced either by man or by the marine ecosystem and contribute to the formation of economic or natural capital. The essence of the OECD classification is presented in Figure 2.
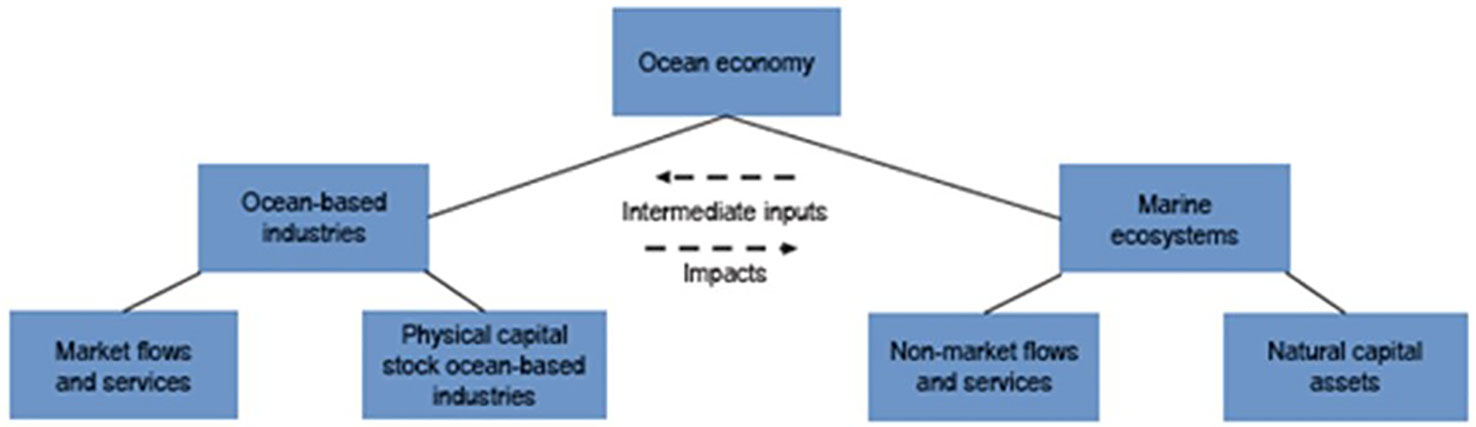
Figure 2 Ocean economy according to the OECD. Source: OECD (2016).
As shown in Figure 2, the two components of the maritime economy are interrelated. For example, fish are products of ecosystems, but fishing and the processing industry are needed to offer them for human consumption. Beautiful landscapes attract tourists, but equally important for them is the existence of tourist facilities. In turn, the tourism industry may cause deterioration of the natural environment, which therefore may in turn have a negative impact on, for example, the abundance and the health of industrial fish.
The discourse on the essence of the blue economy continues today. According to Wenhai et al. (2019), the blue economy covers not only the marine economy but also economic activities alleviating the global water crisis. Wenhai et al. also underline the importance of the development of innovative elements of the blue economy. They provide an overview of the definitions of the blue economy that have been used in various research and policy efforts. Their screening reveals the lack of consensus over what the blue economy means in practice. One can find various approaches that sharply differ, starting from the traditional definition, that preferred by the authors of this paper, of the economy as a system of producing goods and services for the enhancement of human well-being, up to more social- or governance-oriented concepts defining the blue economy as a policy tool to enhance economic growth and job creation, or as a development mindset related to sustainability (Wenhai et al., 2019, 2–3).
While clearly referring to the blue economy as the production of goods and services, the term blue growth should be reserved for the development policies that enhance the maritime economy. This is how the blue economy is distinguished from blue growth in documents from the EU Commission. It seems that one can take a much simpler approach by defining blue growth simply as an increase in the blue economy, but the practical experience show that the development of the blue economy requires policy support, in particular in the aspects related to marine ecosystems (as identified in the OECD classification). The EU’s “Blue Growth Strategy”, launched 10 years ago, remains a flagship policy of the EU (European Commission, 2017). Although its development is still very active (Schultz-Zehden et al., 2019), one can note a gradual shift in emphasis, from job creation and toward a greater focus on environmental issues, i.e., green growth as part of the Green Deal (European Commission, 2019) and contributions of the EU to Sustainable Development Goal 14 (on the protection and sustainable use of the marine areas). In the EU, Member States support blue growth through Structural and Investment Funds and Horizon Europe (in particular in the fields of climate, energy, food, bioeconomy, natural resources, and the environment). In addition, in Bulgaria, Croatia, Estonia, Greece, Latvia, Lithuania, Poland, Portugal, Romania, and Slovakia, the blue growth grant scheme exists under the European Economic Area (EEA) and Norway Grants. For instance, in Poland, more than €9 million was available in 2022 under Norway Grants for supporting small and medium-sized enterprises in innovating and manufacturing blue products and services (related to or located in the sea and inland waters and in coastal areas). The focus is on supporting new technologies and processes that are reducing marine pollution, including in the waters of ports, marinas, etc. The Blue Growth Interreg MED Horizontal Project (2019–2022) has managed to create a real blue growth stakeholders’ community in the Mediterranean region. Policies supporting the development of the blue economy have been conducted in many other countries, such as Australia (the Blue Well-being Initiative), China (enhancement of blue clusters), and Indonesia (blue economy demonstration zones testing synergies between various marine industries) (Wenhai et al., 2019).
4 Challenges in delineation and measurement of the blue economy
The above-presented definition shows a clear trend from a very general but human-centric to a more detailed but more environmentally sensitive delineation of the maritime economy. However, such a holistic definition of the blue economy encounters two important problems. The first is that the measurement of the size of the maritime economy is in many cases is limited to ocean-based industries, that is, anthropogenic components of this category, and does not include marine benefits that are not traded on the market. Second, there are considerable discrepancies in the economic activities that are considered as elements of the maritime economy.
4.1 Benefits and costs of blue economy
The understanding of the blue economy and blue growth by the key policymakers focuses primarily on the classical economic dimension, thus failing to address issues, such as social and environmental implications or economic impact of other industries indirectly, contributing to the blue economy.
Despite substantive attempts undertaken by several scholars, the issue is still far from being successfully resolved. A lot has been already done. As noted by Zaucha (2018), many researchers have operationalized the valuation of the broader benefits derived from the sea (Costanza et al., 1997; Ahmad and Hanley, 2009; Costanza et al., 2014; Jin et al., 2013; Scholz et al., 2011; Ruiz-Frau et al., 2013; White et al., 2013; and Conrad and Smith, 2012) and from relevant policies (Ostberg et al., 2013). There have also been numerous papers dealing with the valuation of wider (social and environmental) benefits and negative externalities (wider costs) imposed by, for example, offshore energy projects (e.g., Larsen and Guillemette, 2007; Boehlert and Gill, 2010; Draget, 2014; Hagos, 2017; Roddis et al., 2018) or mariculture (e.g., Lindahl et al., 2005; Hasselström et al., 2020). Moreover, there is a prevailing consensus among marine planners that when allocating sea space public authorities should take these wider costs and benefits into account, i.e., by considering not only private but also public rent (Zaucha et al., 2020). However, a key problem is related to the valuation methods and the fragmented knowledge of the complexity of the social and environmental impacts created by the blue economy. Valuation suffers from subjectivity bias, and the results obtained might vary among countries even at the same sea basin.
There are also some other important blind spots of such measurements identified in the literature (e.g., Sagebiel et al., 2016). Worth emphasizing is, for example, the difficulty of taking into consideration interactions between ecosystem services when valuing them. Even more important caveats are related to the insufficient knowledge of the impacts of the blue economy. The dominant discourse on blue economy is green, as illustrated by the wording of the EU’s Green Deal (European Commission, 2019) or the frequently repeated assertion that Rio+20 boosted the blue economy (Silver et al., 2015). However, many authors point out the inaccuracy or shallowness of such rhetoric. Both Silver et al. (2015) and Barbesgaard (2017) warn that blue growth ideology might privilege some well-organized stakeholders. The reasons are numerous: easier access to funds, scientific and managerial leadership, and political influence, as well as high economic stakes at the table and a dominant neoclassical paradigm in economics. Therefore, blue rhetoric might accelerate spatial conflicts, increase pressure on the marine environment, and also lead to “de facto” privatization of the marine space. Thus, an important issue is social justice in relation to blue growth and marine spatial planning (Saunders et al., 2020). For instance, Bennett et al. (2021) identified 10 social injustices that might be produced by blue growth. The above-described problems make full-scale measurements of the blue economy difficult. Thus, even in recent reports (European Commission, 2021a), the value of the blue economy is reduced to the value of goods and services produced by ocean-based industries and sold at the market. For the sake of comparability, the measurements presented in this paper will follow this approach.
4.2 Delineation of the scope of the blue economy
The table provided in the supplementary materials presents a list of sectors/industries included in the maritime economy in selected countries (groups of countries) and analytical studies in the period of conceptualization of this category (compiled in Zaucha, 2018).
Examination of this table reveals a diversity of approaches to the content and scope of the blue economy in the initial phase of its conceptualization. A core group of industries can be clearly identified, principally those that have been associated with the sea for years, e.g., maritime transport, coastal tourism, fishing and mariculture, shipyards, and the extraction of minerals, as well as the creation of marine structures. However, there are also sharp differences in the conceptualization attempts, some of which result from differences in the classification criteria. For example, in the EU, coastal protection is a separate industry, whereas in China it is classified as engineering and maritime construction. The OECD typology separates ports and shipping, whereas in China and the USA they are included in maritime transport. The same concerns services supporting maritime transport. However, some differences seem to result from local or regional specificities, or the level of development achieved. Renewable offshore energy is prominent in many countries, but not in the USA. In some classifications, there is a maritime chemical, pharmaceutical, and desalination industry, and the industrial use of seawater is a separate sector. The EU and the OECD attach great importance to innovation, biotechnology, and surveillance, as well as to industries ensuring safety at sea. In the EU proposal, this section is particularly extensive. Blue innovation also plays an important role in China (Wenhai et al., 2019).
The change in the scope of the analysis in the EU as a function of time is also symptomatic. The Maritime Cluster Report (PRC, 2008) offered a much more traditional set of maritime industries (e.g., renewable energy was part of the offshore supply offshore construction industry) than the later documents (Ecorys, 2012; European Commission, 2012).
In order to illustrate the challenges and problems related to the estimation of the value of the blue economy, two EU measurement attempts will be compared: the first one, in 2013 (EUNETMAR, 2013), and the most recent one, in 2021 (European Commission, 2021b). This comparison will create the context in which the Polish attempt will be analyzed in the next section. The two reports have in common an extensive use of EU-level statistics [Eurostat Structural Business Statistics (SBS) data using a statistical classification of economic activities in the European Community-NACE Rev. 2]. Therefore, a key role is played by the standardized data compiled by Eurostat. In the recent report, these data are complemented by data for the primary sectors (i.e., capture fisheries and aquaculture) obtained from the EU Data Collection Framework (DCF). In both cases, a key challenge is to identify the extent to which maritime industries contribute to some NACE (Statistical Classification of Economic Activities in the European Community) classes that cannot be entirely attributed to the marine economy. In the early attempt, more tacit knowledge and national statistics were used to that end. In the recent report, attribution is based more on some objective indicators but at the expense of the exclusion of some sectors owing to data problems. The aforesaid objective indicators were derived from SBS and the PRODCOM data, that is, statistics on the production of manufactured goods together with related external trade data. In Table 1, these two attempts are compared, starting with attributing the NACE codes to sectors and subsectors. It is worth noting that in the EUNETMAR (2013) approach the same NACE codes have been attributed to several subsectors and even sectors, whereas in the Blue Economy Report (European Commission, 2021b) this pattern has not been followed so extensively. White in the table means total attribution to the marine economy, green means the use of PRODCOM or SBS data, yellow indicates the use of national statistics or expert knowledge, orange the lack of a split between maritime and non-maritime activities, and blue a lack of sufficient data. Only white and green indicate that sufficient measurement clarity has been obtained.
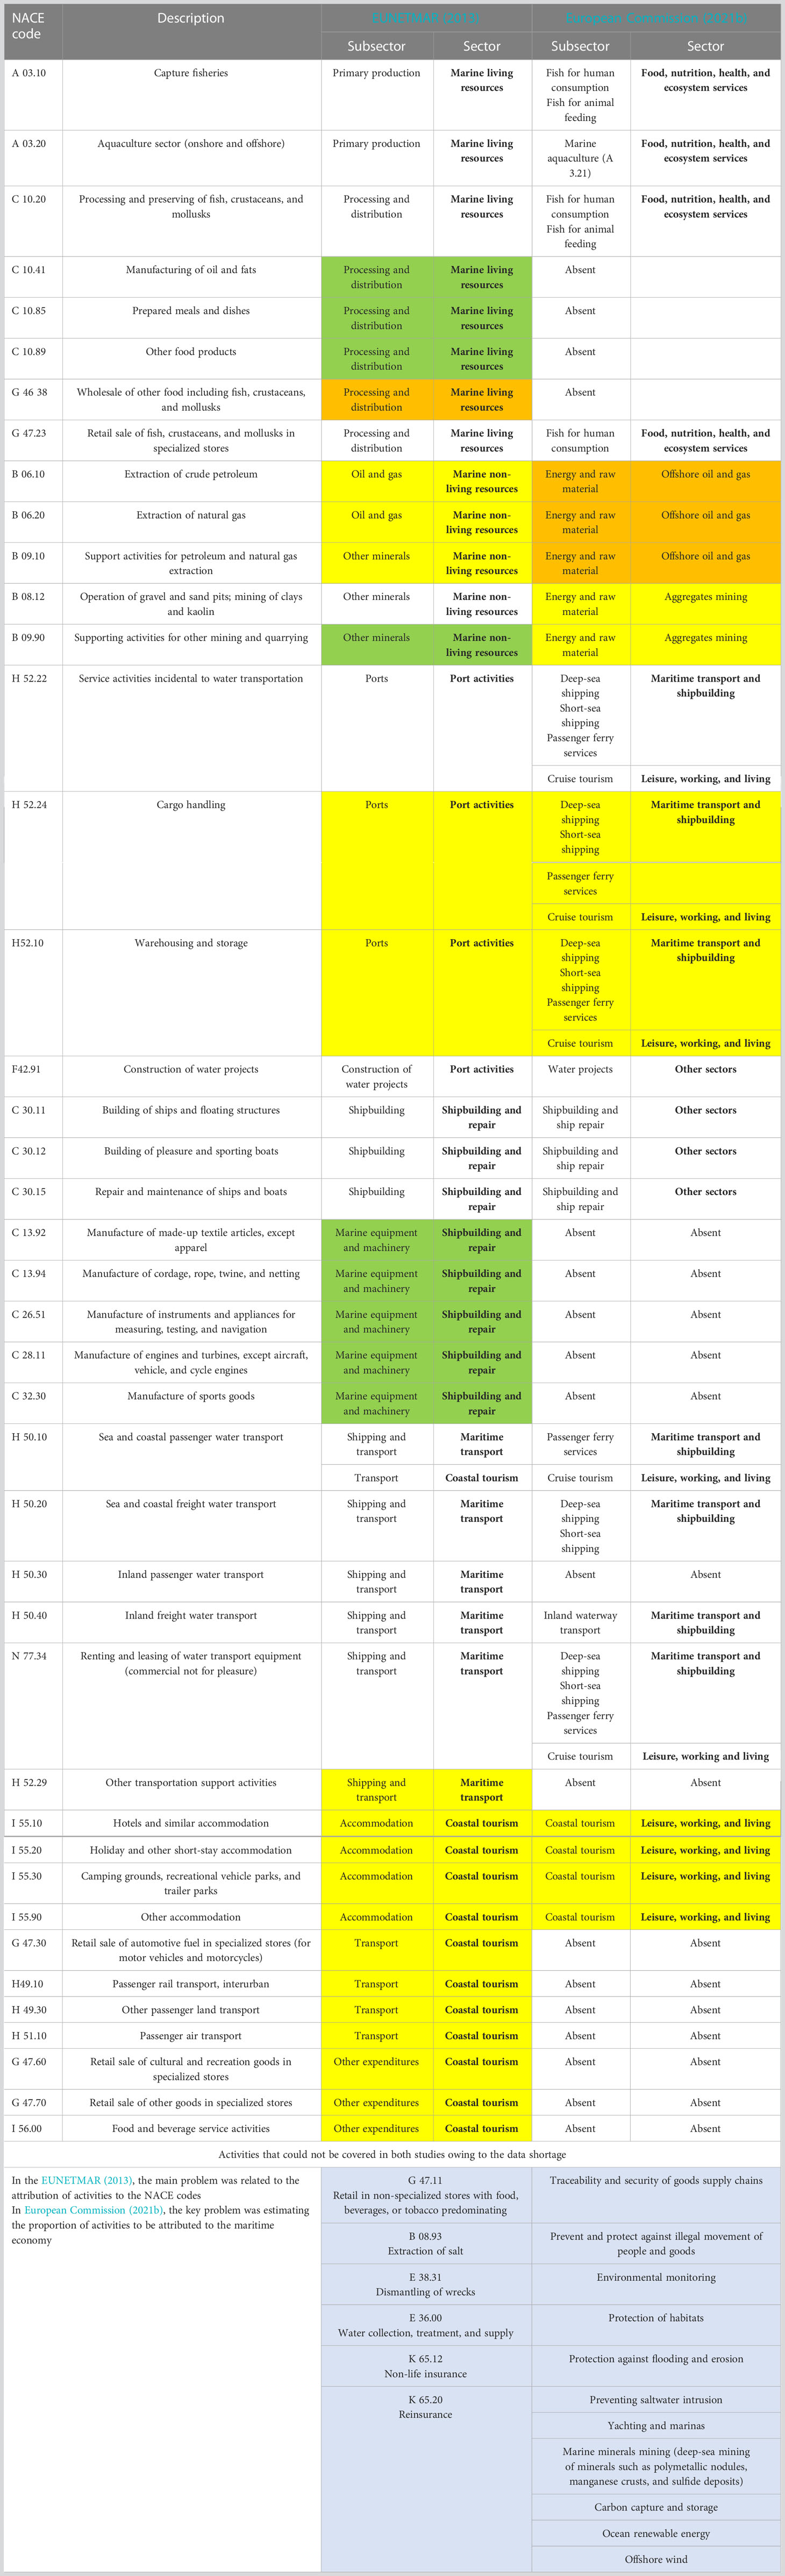
Table 1 Sectors covered in the measurement of the blue economy by EUNETMAR (2013) and European Commission (2021b).
Careful inspection of Table 1 reveals that, although huge progress has been achieved in the past years in the measurement of the blue economy, and new ideas and concepts have been applied, adding new important activities to the blue realm, key problems still have not been solved. For instance, the processing and preserving of fish, crustaceans, and mollusks (C 1020) covers not only marine organisms but also fish from freshwater aquaculture that have nothing to do with marine industries but have been entirely attributed to the blue economy. There are similar concerns over the construction of water projects, as this classification also covers terrestrial dams and dikes. However, the most notable is the fact that the renewable energy sector was not covered in either management attempt. This sector is described in the recent EU report European Commission (2021a) but mainly in terms of installed capacity, jobs created, and energy produced. Thus, it has not been merged into the entire continuum of the blue economy. The tourism industry is a leading blue sector in the EU (European Commission, 2021a), but it still cannot be properly measured, mainly because of the problems related to a lack of reliable data from micro-enterprises and physical persons renting rooms and other tourist facilities. The same is true of yachting and marinas and the cruise industry, which are too complex in terms of their economic interactions to be covered by the Eurostat economic data. And, finally, Table 1 reveals that in the EU there is no uniform approach to the conceptualization of the blue economy in terms of grouping NACE classes into sectors and subsectors. Moreover, the existing measurement patterns do not allow for the territorialization of the blue economy. Key data series and information used for compiling the size of the maritime economy, such as the production value of the maritime manufacturing sector by the main NACE Rev. 2 activities or value added, can be desegregated down to NUTS 1 level.
5 Measurement method applied in Poland
Taking into account the complexity of the estimation of the blue economy, several data sources have been utilized. First, data on gross value added (GVA), number of employees, and number of entities in a given industry were obtained from Eurostat’s SBS database for the period 2005–2018. The extracted data consist of four-digit NACE Rev. 2 codes for 35 industries that have been considered maritime industries in the literature. Five of them, namely building of ships and floating structures (C 3011), building of pleasure and sporting boats (C 3012), repair and maintenance of ships and boats (C 3315), sea and coastal passenger water transport (H 5010), and sea and coastal freight water transport (H 5020), were assumed contribute to fully to the maritime economy. The remaining 30 industries were considered as contributing to the maritime economy only partially, as at this level of disaggregation there is no clear division between land and maritime activity.
Thus, the next step of the analysis was to estimate the size of the contribution of the remaining 30 sectors to the Polish maritime economy. In other words, we tried to identify what part of a given industry was related to maritime activity as a share of a whole sector in a panel data framework. For 12 subclasses—operation of gravel and sand pits; mining of clays and kaolin (B 0812); manufacture of instruments and appliances for measuring, testing, and navigation (C 2651); construction of water projects (F 4291); construction of other civil engineering projects n.e.c. (not elsewhere classified) (F 4299); agents involved in the sale of machinery, industrial equipment, ships, and aircraft (G 4614); warehousing and storage (H 5210); service activities incidental to water transportation (H 5222); cargo handling (H 5224); other transportation support activities (H 5229); other research and experimental development on natural sciences and engineering (M 7219); renting and leasing of recreational and sports goods (N 7721); and renting and leasing of water transport equipment (N 7734)—employment criteria have been utilized. More specifically, we aggregated firm-level data on employment at the regional level (provided in the Orbis2 database) and calculated the coastal regions’ share of the total for the country. The computed factor was adopted as a proxy for the share of maritime-related activity in a given NACE rev. 2 industry.
For the robustness check of this approach, another measure was calculated: the GVA. We followed the standard procedure of calculating GVA at a firm level as a sum of gross profit + depreciation + remuneration of employees. As in the previous method, the aggregate GVA of firms located in coastal regions as a share of the total GVA of a given industry in Poland was calculated as an approximation of the maritime-related part of the industry. Company financial data used to compute the GVA were obtained from the Orbis database. The results of the employment approach and the GVA approach were positively correlated in 95% of cases; thus, we decided to use the former approach in subsequent analysis.
For all selected industries related to different parts of the fishing and aquaculture value chain—marine fishing (A 0311); marine aquaculture (A 0321); processing and preserving of fish, crustaceans, and mollusks (C 1020); and manufacture of prepared feeds for farm animals (C 1091)—the data were obtained from the Scientific, Technical and Economic Committee for Fisheries (STECF) and Eurostat.
Finally, for industries related to tourism and gastronomy, both approaches—employment and GVA—resulted in unreliable estimates, which can be attributed to the fact that firms in those industries are often registered in places other than where they operate. In the case of tourism—hotels and similar accommodation (I 5510); holiday and other short-stay accommodation (I 5520); camping grounds, recreational vehicle parks, and trailer parks (I 5530); and other accommodation (I 5590)—share of the maritime economy was calculated on the basis of bed places occupied by tourists in a given year in coastal regions as a share of the country total. The data on tourism were obtained from the local data bank [pol. Bank Danych Lokalnych (BDL)], published by the Polish Statistical Office.
Similarly, in the case of gastronomy industries—restaurants and mobile food service activities (I 5610); event catering activities (I 5621); other food service activities (I 5629); and beverage serving activities (I 5630)—we assumed that the true size of an industry in a given region should be approximated by the number of tourists weighted by the income of citizens of the region. As in the previous cases, the contribution to the maritime economy was calculated for coastal regions as a proportion of country total.
Finally, for the remaining four industries, the lack of publicly available data motivated us to take an industry-tailored approach. First, for three industries—agents involved in the sale of machinery, industrial equipment, ships, and aircraft (G 4614); wholesale of other food, including fish, crustaceans, and mollusks (G 4638); and retail sale of fish, crustaceans, and mollusks in specialized stores (G 4723)—the estimation was based on the National Official Business Register (REGON). The REGON database has, since 2015, published, for each subclass, the numbers of enterprises of each size (as determined by the number of employee)s. The shares of enterprises from subclasses G 4614, G 4638, and G 4723 in these two-digit PKD divisions (the Polish equivalent of NACE) divisions (G46 and G47) were determined: they were weighted by the size of employment. Then, using these shares, it was calculated what part of the GVA in two-digit PKD was produced in four-digit sectors.
In the case of the subclasses extraction of crude petroleum (B 0610), extraction of natural gas (B 0620), and support activities for petroleum and natural gas extraction (B 0910), the maritime GVA was estimated as crude petroleum and natural gas extraction from the sea as a share of total Polish extraction. The data were obtained from the Polish Geological Institute3 and the official reports of the monopoly Polish maritime natural resources extractor (LOTOS Petrobaltic S.A.).4 The estimated share for B 0910 was computed as a simple average of shares for subclasses B 0610 and B 0620.
Lastly, the most challenging estimation was associated with the subclass of pipeline transport (H 4950). In the case of Poland, the only fuel transported by pipelines is natural gas. In the Polish part of the Baltic Sea, two pipelines exist, both belonging to LOTOS Petrobaltic S.A. The pipelines transport natural gas associated with crude oil extracted from the seabed of the Baltic Sea, namely the offshore oil mine “Baltic Beta”, from two oil deposits marked as B3 and B8. The lengths of the pipelines are 81.5 and 73.8 km, respectively. Natural gas in the state of hydrocarbon suspension in dry gas is delivered to the combined heat and power plant in Władysławowo and utilized for local communal needs.
In line with the information presented on the Statistics Poland website, which has been confirmed by its representatives, public data concerning pipeline transport include only data relating to the transport of crude petroleum, and exclude the transport of natural gas. As a result, GVA related to subclass H 4950 does not include value added created by natural gas transport, which in Poland can be primarily attributed to the activity of the company Gaz-System S.A. Taking this into account, previous methods of GVA estimations based on subclass H 4950 could be misleading.
Thus, the utilized method took into account the mass–distance measure, calculated as the product of transported crude petroleum (in metric tons) and the length of a particular pipeline (in kilometers). Similarly, the mass–distance measure of natural gas is the product of the amount of transported gas (in m3) and the length of the pipelines. Taking into account the value added in crude petroleum transport and transport performance, the value added per unit of petroleum performance has been computed (in euros per ton·km) in individual years.
To estimate value added per mass–distance unit of natural gas, we took into account the mean market prices of natural gas and crude petroleum, namely weighted average prices in the industrial sector for heavy fuel oil (HFO, PLN/ton) and high-methane gas (PLN/1,000 m3).
The estimated GVA per unit of transport performance of natural gas was multiplied by the amount of natural gas extracted from B3 and B8 deposits and the length of both pipelines, which in consequence allowed for the computation of value added associated with considered subclass H 4950.
6 Polish blue economy 2010–2017
Following the above procedure, the size of the Polish blue economy was estimated in the panel data framework for 2010–2017. Over the analyzed period, the GVA generated by the Polish blue economy increased from €2.6 billion in 2010 to €3.6 billion in 2017, depicting a non-monotonic, slightly increasing trend (Figure 3).
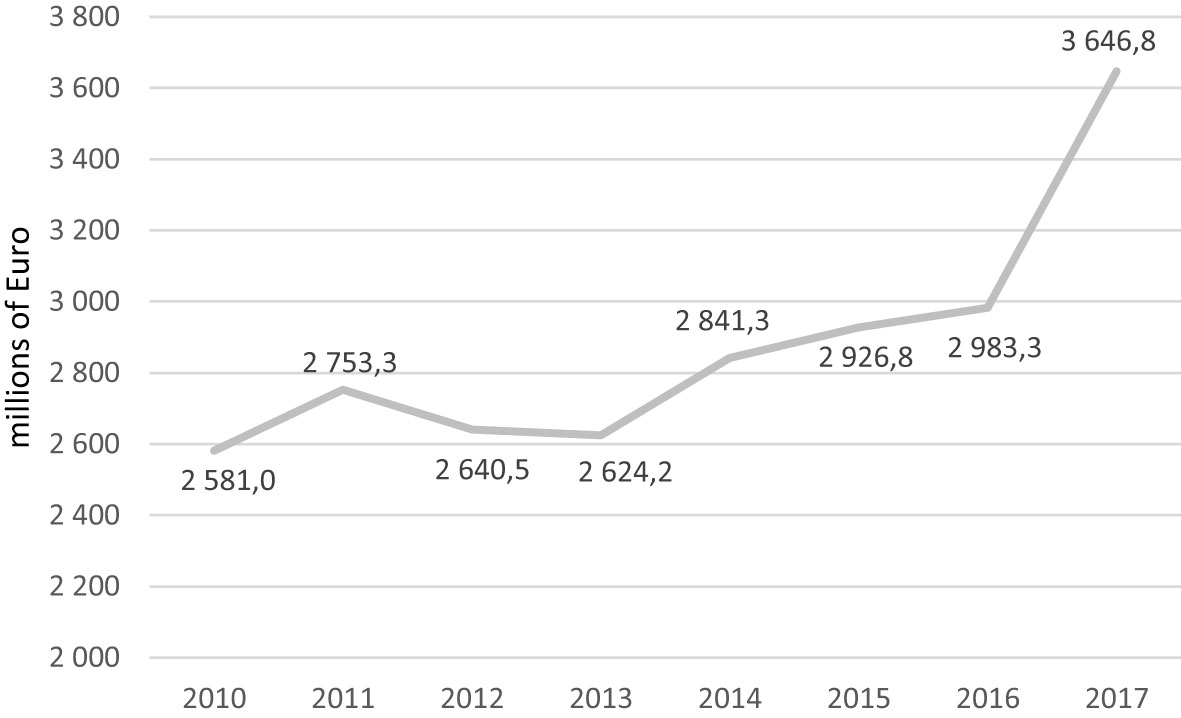
Figure 3 The size of the Polish blue economy in 2010–2017. Source: own elaboration.
In comparison with the total GVA in the Polish economy for the analyzed period, the share of the blue economy was stable, oscillating around 0.80%, and reaching a maximum of 0.97% in 2017. At the same time, the compound annual growth rate (CAGR) for the blue economy over the period 2010–2017 amounted to 5.06%, compared with 2.44% for the whole economy (Figure 4).
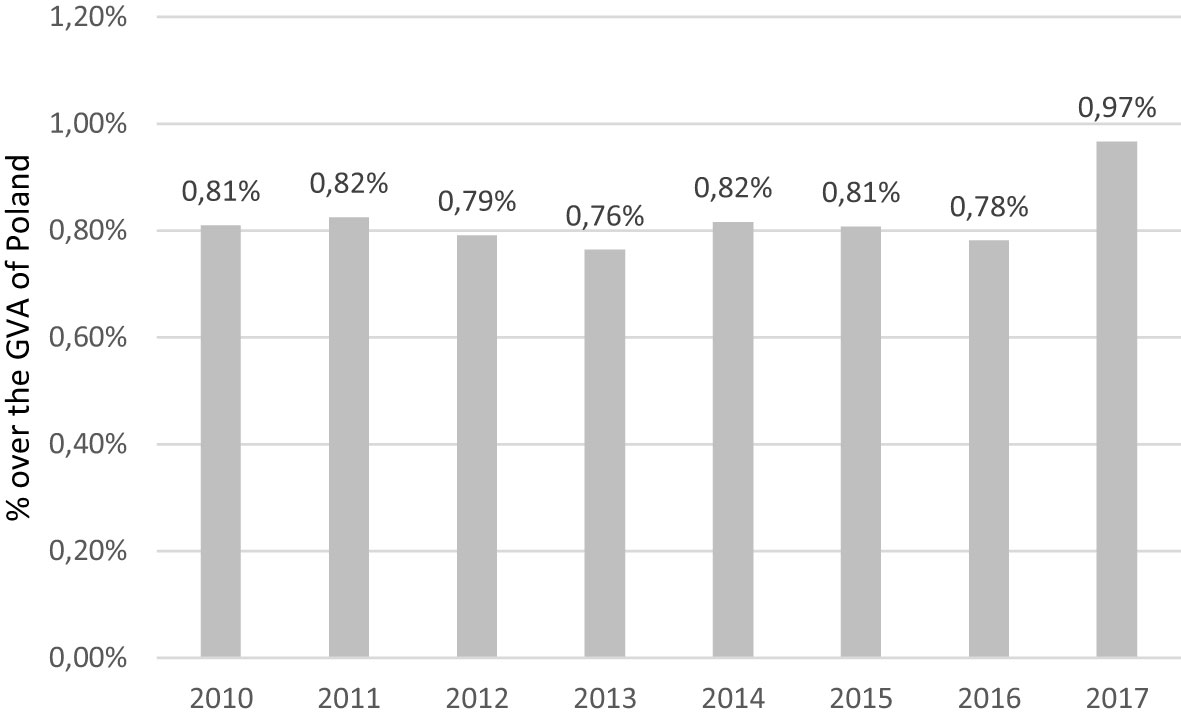
Figure 4 The blue economy as a share of the total Polish economy. Source: own elaboration.
From the sectoral perspective, over the analyzed period seven industries dominated the blue economy in terms of size. All of them were related to fish processing and wholesale (C 1020 and G 4638), building, repairing, and sale of ships (C 3011, C 3315, and G 4614), or coastal tourism and gastronomy (I 5510 and I5610). The above industries exceeded €100 million in 2010 and, apart from C3011 (building of ships and floating structures), increased in terms of value between 2010–2017 (Figure 5).
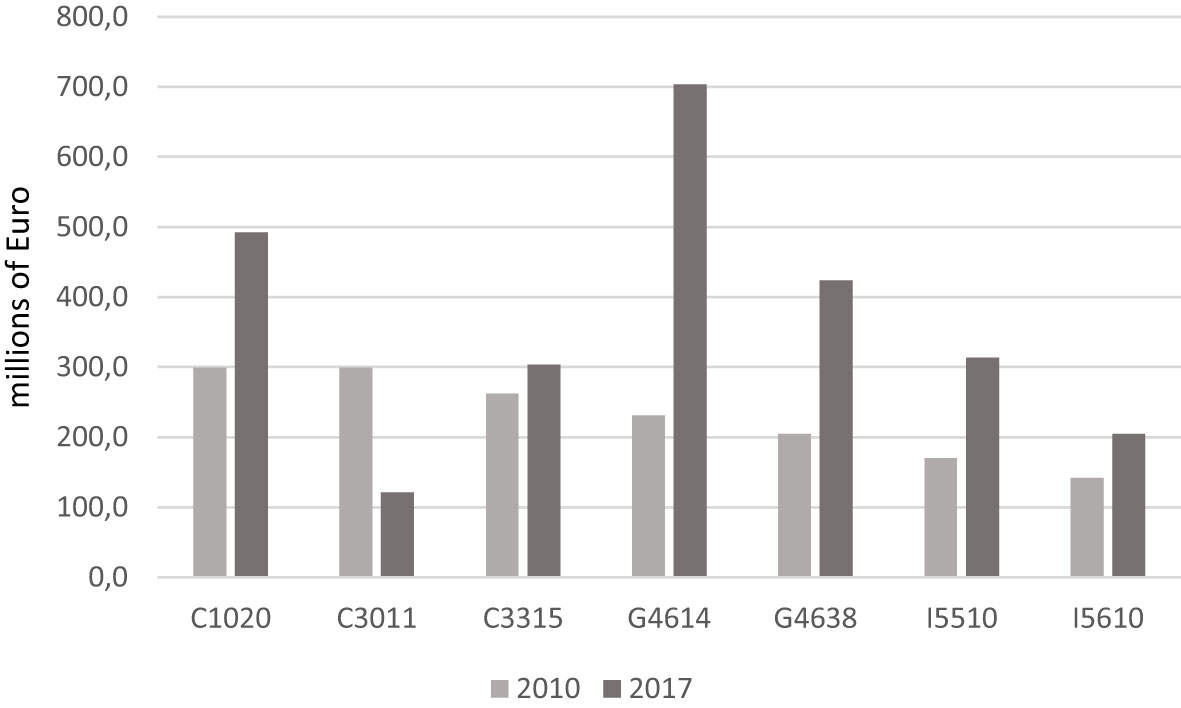
Figure 5 The largest subclasses of the Polish blue economy in 2010 compared with 2017. Source: own elaboration.
In comparison with previous calculations of the size of the Polish blue economy (Zaucha and Brodzicki, 2016, computed cross-sectionally as of 2010), our estimates took into account significantly more industries (subclasses)—35 rather than 26. This was made possible by combining various data sources and utilizing the methodology of estimation. Comparing the results of the studies, the value added of the blue economy in 2010 amounted to €2.581 billion according to our estimations and to €2.186 billion according to Zaucha and Brodzicki (2016), figures that intuitively are economically feasible.
7 Discussion
The method of estimating the blue economy presented above is, in principle, similar to the one utilized by the European Commission (2021b). Both methodologies are based primarily on Eurostat data at the four-digit level of disaggregation, classifying them as wholly contributing to the blue economy or further estimating its parts. In the final computations, the European Commission covers 49 industries that fully or contribute to the blue economy. In our study, 35 industries are considered. Taken together, a total of 55 industries are considered in one or both studies. The difference—26 industries in total5—is attributable to sectors that in the context of Poland are non-existent on the commercial scale (i.e., extraction of salt, aquaculture) or play a negligible role in the Polish blue economy (i.e., production of electricity; passenger rail transport, interurban; passenger air transport; and manufacture of made-up textile articles, except apparel). The selection of industries is presented in Table 2.
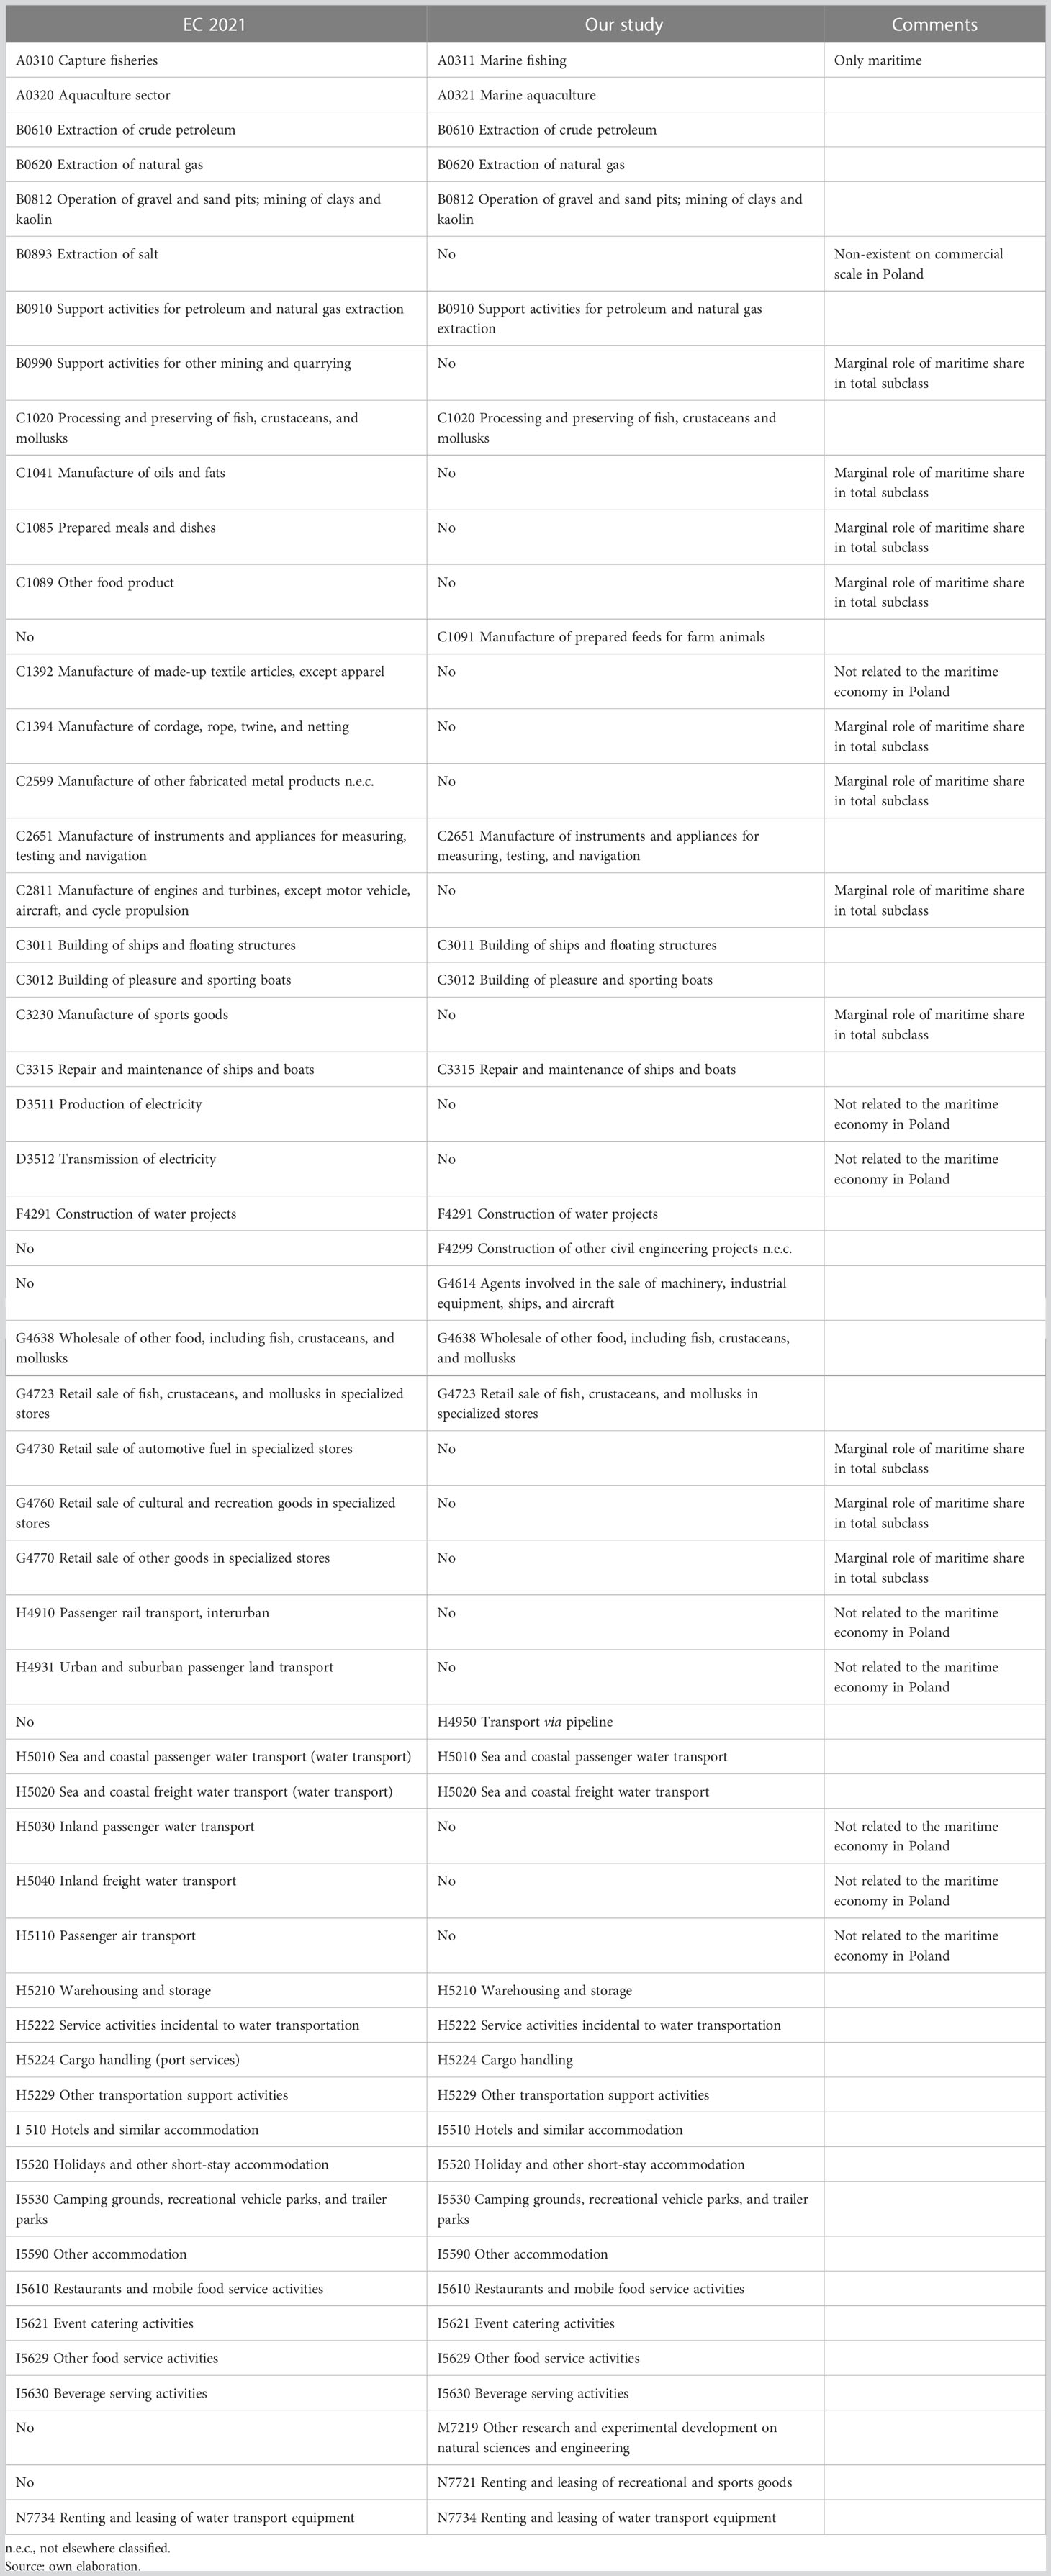
Table 2 Comparison of industries included in both studies.
Both methods coherently consider several industries as wholly maritime, whereas others are considered partially maritime. The most significant difference between studies lies in the method of estimation. The EU (2021) study estimates the share of an industry contributing to the blue economy primarily based on EU sources, such as PRODCOM (survey-based database providing data on production sold, total production, and subcontracted production in B and C sections) or SBS databases (a database providing data on GVA, number of enterprises, or employment at the four-digit NACE rev. 2 level), and, to a lesser extent, on national statistics—especially for services, which are not covered by PRODCOM and SBS data. In contrast, our approach utilizes mostly national sources (Statistics Poland) or micro-level data (Orbis database), as described in the previous section. This allows for use of country- as well as industry-specific sources, which should result in more precise estimations.
At the sectoral level, the studies generally find the industries playing a crucial role in the Polish blue economy to be the same. The most important (top five) industries according to the studies are presented in Figure 5. In the European Commission (2021) study, the most important are coastal tourism, living resources, and port activities, which is in general in line with our findings.
At the more disaggregated level, the European Commission (2021) provides the data separately only for 2009 and 2018. Thus, for 2018, the most important subclasses are the processing and preserving of fish, crustaceans, and mollusks; all forms of accommodation, warehousing, and storage; the repair and maintenance of ships and boats; and transport activities related to coastal tourism, which is also generally coherent with our results.
Unsurprisingly, as a result of the above differences in methodologies, the studies obtain slightly different aggregated results (presented in Figure 6). Our method, for all years, except 2013, finds a larger value for the size of the blue economy relative to the whole Polish economy than the European Commission method. On average, the European Commission study (2021) underestimates the size of the blue economy by ca. 11% over the analyzed period. In absolute terms, this difference is the largest in 2017 and equals €472 million.
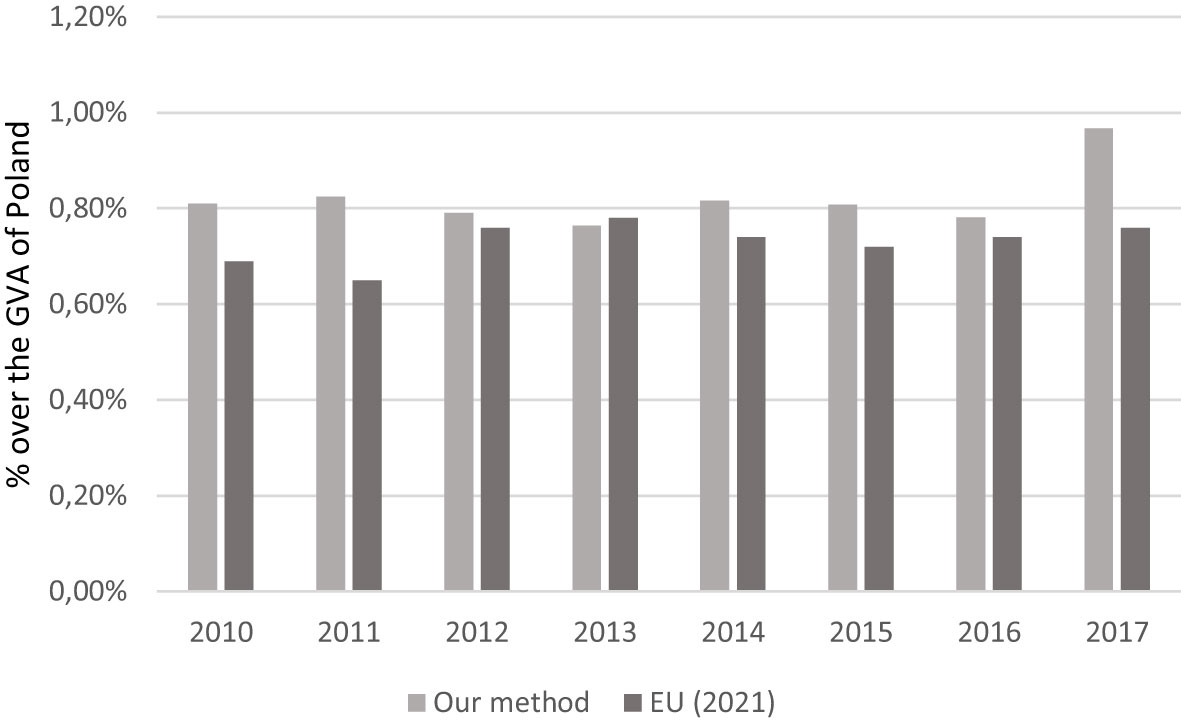
Figure 6 Comparison of results obtained by both studies. Source: own elaboration.
At the same time, if one translates an average difference between the methods into the employment estimated by the EU, the 11% underestimation equates to the omission from the results of approximately 16,000 jobs. It should be highlighted that these differences are even more significant when taking into account the broader sectoral coverage of the EU’s analysis.
Evaluating the above methods, it should be repeated that both are coherent in their primary purpose—estimation of the size of the blue economy—but the approach utilized is slightly different. The EU’s framework guarantees universality and comparability of the results between Member States by a clear indication of industries and data utilized. Our study presents the tailor-made country approach using the example of Poland. It clearly requires significantly more work and expertise to find data sources and to understand the idiosyncratic factors that determine differences in the share of industries in specific countries. It should be underlined that the resignation from a unified EU methodology in favor of a country-specific approach does not prevent international comparability of results, as the lack of unification of methods utilized does not imply a change in the subject of analysis.
8 Conclusion
This paper provides an alternative method of computing the blue economy, focusing on a more intensive use of the national micro-data. We can conclude that our attempt shows a trade-off between the use of standardized methods of computing the size of the blue economy (a one-size-fits-all approach) and the use of country-specific methods that allow for a more precise, tailored approach, but which, on the other hand, makes cross-country comparisons slightly less transparent. It is shown that the use of different methods produces different results, which in turn can lead to different conclusions and advice. Bearing in mind the aforesaid trade-off, it seems that the choice of method should take into account the specific needs of different policy and research tasks.
A review of the literature shows that information on the size of the blue economy is useful in many research and policy-driven tasks, for example:
a) to attribute blue growth to external determinants versus country-specific competitive advantage, i.e., shift-share analysis (e.g., Mogila et al., 2021);
b) to analyze the impact of policy governance (e.g., maritime spatial planning) on blue growth (e.g., Surís-Regueiro et al., 2021);
c) to measure maritime spatial rent in various blue sectors (e.g., Psuty et al., 2021);
d) to analyze marine multi-use (e.g., Stancheva et al., 2022) in economic terms; and
e) to identify indirect and induced effects of the blue economy (e.g., Morrissey and O’Donoghue, 2013; Ashyrov et al., 2018).
The method tested in Poland might be seen as a better or alternative solution for researching indirect and induced effects of the blue economy at the national level, analyzing the impact of national policies, and measuring spatial rent at a national level. However, the method ensuring international comparability should be applied for shift-share sea basin analysis or advising on multi-use alternatives in countries.
Our second conclusion regards the direction of continuing the improvements and accuracy of measurement of the blue economy at the national level. One of the most “troublesome” sectors in the Polish case is coastal/marine tourism. Here we think that better estimations can be achieved by using information from national tourism surveys and concrete research micro-data, e.g., on spending by cruise tourists or ferry passengers (Douglas and Douglas, 2004). In addition, big data on tourism intensity can be helpful in estimating expenditure by maritime tourists as a proportion of total tourist spending (Li et al., 2018). However, it is likely that the method that ensures international comparability will have some problems in exploiting such advantages. We also believe that, in some cases, the tacit knowledge of experts might be useful, as proved by our gas transmission example. But what is necessary and can help the most is the initiation of a permanent dialogue between national experts and representatives of marine industries on the accuracy of measurements and possible improvements in measurement methods. The estimates obtained by us should serve as a boundary-spanning object in order to engage various types of researchers and practitioners in future attempts to measure the blue economy (Goodrich et al., 2020).
However, having said that, we believe that similar improvements to existing standardized methods are necessary to ensure the comparability of the blue economies of various countries. This can be achieved by adding a new marine attribute to, for example, Eurostat or OECD data on relevant sectors. This is difficult but possible, as proved by the addition of regional attributes to the standardized Eurostat regional data (i.e., EU regional typology6). This type of work takes time, resources, and the right ideas. The final effects might come after many years of intensive work. But it is important to start this work now. Moreover, EU efforts surely will influence national data-gathering processes and will help to further develop methods such as those tested in Poland (a positive feedback loop).
The third conclusion is related to the need for further development of measurement methods. We believe that measurements should attempt to account for all impacts of the blue economy. For this reason, there is a need to continue research efforts related to the measurement of the value of ecosystem services and social and environmental impacts of the ocean-based industries, as well as techniques allowing cross-country comparisons of the results obtained. There is a need to accumulate a critical body of knowledge in this field. We believe that the best way to achieve this is “learning by doing”, that is, promoting measurement attempts, comparing their outcomes, discussing reasons for the difference in the values obtained, and, on that basis, improving measurement methods. Robust results could convince decision-makers to officially include externalities in national and global blue economy accounts.
Data availability statement
The data analyzed in this study are subject to the following licenses/restrictions: Orbis database is restricted for users only. Requests to access these datasets should be directed to amFrdWIua3dpYXRrb3dza2lAdWcuZWR1LnBs.
Author contributions
JK contributed in 80% and JZ in 20%. All authors contributed to the article and approved the submitted version.
Funding
This work has been supported by the National Science Centre grant 2018/31/B/HS4/03890 “Multiplier effects of maritime space”.
Conflict of interest
The authors declare that the research was conducted in the absence of any commercial or financial relationships that could be construed as a potential conflict of interest.
Publisher’s note
All claims expressed in this article are solely those of the authors and do not necessarily represent those of their affiliated organizations, or those of the publisher, the editors and the reviewers. Any product that may be evaluated in this article, or claim that may be made by its manufacturer, is not guaranteed or endorsed by the publisher.
Supplementary material
The Supplementary Material for this article can be found online at: https://www.frontiersin.org/articles/10.3389/fmars.2023.1129075/full#supplementary-material
Footnotes
- ^ Dwelling on Zaucha (2018).
- ^ The Orbis database consists of detailed micro-level financial data on nearly 41 million companies domiciled in the majority of countries around the globe (http://orbis.bvdinfo.com).
- ^ https://www.pgi.gov.pl/en/
- ^ https://www.lotos.pl/344/poznaj_lotos/nasze_spolki/lotos_petrobaltic/
- ^ The difference results from the fact that both studies included a number of industries not considered in the other analysis.
- ^ Available at https://ec.europa.eu/eurostat/statistics-explained/index.php?title=Regional_typologies_overview&oldid=264981 (accessed 6 December 2022).
References
Ahmad S., Hanley N. (2009). Willingness-to-pay for reducing crowding effect damages in marine parks in Malaysia. Singapore Economic Rev. 54 (1), 21–39. doi: 10.1142/S0217590809003124
Ashyrov G., Paas T., Tverdostup M. (2018). The input-output analysis of blue industries: Comparative study of Estonia and Finland (University of Tartu Working Paper). Available at: https://ssrn.com/abstract=3176955.
Barbesgaard M. (2017). Blue growth: Savior or ocean grabbing? J. Peasant Stud. doi: 10.1080/03066150.2017.1377186
Boehlert G. W., Gill A. B. (2010). Environmental and ecological effects of ocean renewable energy development. Oceanography 23, 68–81. doi: 10.5670/oceanog.2010.46
Conrad J. M., Smith M. D. (2012). Nonspatial and spatial models in bioeconomics. Natural Resource Modeling 25 (1), 52–92. doi: 10.1111/j.1939-7445.2011.00102.x
Costanza R., d`Arge R., de Groot R., Farber S., Grasso M., Hannon B., et al. (1997). The value of the world`s ecosystem services and natural capital. Nature 387, 253–260. doi: 10.1038/387253a0
Costanza R., de Groot R., Sutton P., van der Ploeg S., Anderson S. J., Kubiszewski I., et al. (2014). Changes in the global value of ecosystem services. Global Environ. Change 26, 152–158. doi: 10.1016/j.gloenvcha.2014.04.002
Douglas N., Douglas N. (2004). Cruise ship passenger spending patterns in pacific island ports. Int. J. Tourism Res. 6 (4), 251–261. doi: 10.1002/jtr.486
Draget E. (2014) Environmental impacts of offshore wind power production in the north Sea (Oslo: WWF). Available at: https://tethys.pnnl.gov/sites/default/files/publications/WWF-OSW-Environmental-Impacts.pdf (Accessed 1 February 2023).
Ecorys (2012). Blue Growth Scenarios and drivers for Sustainable Growth from the Oceans, Seas and Coasts. Final Report. Rotterdam/Brussels: European Commission, DG MARE. Available at: https://webgate.ec.europa.eu/maritimeforum/system/files/Blue%20Growth%20Final%20Report%2013092012.pdf (Accessed 6th Feb. 2023)
EUNETMAR (2013) Study to support the development of sea-basin cooperation in the Mediterranean, Adriatic and Ionian, and black Sea. Available at: https://webgate.ec.europa.eu/maritimeforum/system/files/Methodology%20CF%20MEA.pdf (Accessed 17th June 2022).
European Commission (2012). Communication from the commission to the European parliament, the council, the European economic and social committee and the committee of the regions, blue growth opportunities for marine and maritime sustainable growth COM 494.
European Commission. (2015). Measuring the blue economy ad-hoc Member States' Expert Group 29 September 2015. Available at: https://slideplayer.com/slide/8002625/ (acessed 6th Feb. 2023)
European Commission (2017). Report on the blue growth strategy towards more sustainable growth and jobs in the blue economy SWD 128.
European Commission (2019). Communication from the commission to the European parliament, the council, the European economic and social committee and the committee of the regions, the European green deal. COM 640.
European Commission (2021a). The EU blue economy report (Luxembourg: Publications Office of the European Union).
European Commission (2021b) Annex II: Methodological framework for the established sectors. Available at: https://blueindicators.ec.europa.eu/sites/default/files/annex_ii_methodological_framework.pdf (Accessed 17th June 2022).
Goodrich K. A., Sjostrom K. D., Vaughan C., Nichols L., Bednarek A., Lemos M. C. (2020). Who are boundary spanners and how can we support them in making knowledge more actionable in sustainability fields? Curr. Opin. Environ. Sustainability 42, 45–51. doi: 10.1016/j.cosust.2020.01.001
Hagos K. W. (2017) Impact of offshore wind energy on marine fisheries in Rhode island (Narragansett: University of Rhode Island Coastal Institute IGERT Project). Available at: https://www.researchgate.net/publication/255606863_Impact_of_Offshore_Wind_Energy_on_Marine_Fisheries_in_Rhode_Island (Accessed 1 February 2023). White Paper in Integrated Coastal Science.
Hasselström L., Thomas J. B., Nordström J., Cervin G., Nylund G. M., Pavia H., et al. (2020). Socioeconomic prospects of a seaweed bioeconomy in Sweden. Sci. Rep. 10 (1), 1610. doi: 10.1038/s41598-020-58389-6
Jin D., Hoagland P., Wikgren B. (2013). An empirical analysis of the economic value of ocean space associated with commercial fishing. Mar. Policy 42, 74–84. doi: 10.1016/j.marpol.2013.01.014
Larsen J. K., Guillemette M. (2007). Effects of wind turbines on flight behaviour of wintering common eiders: Implications for habitat use and collision risk. J. Appl. Ecol. 44, 516–522. doi: 10.1111/j.1365-2664.2007.01303.x
Li J., Xu L., Tang L., Wang S., Li L. (2018). Big data in tourism research: A literature review. Tourism Manage. 68, 301–323. doi: 10.1016/j.tourman.2018.03.009
Lindahl O., Hart R., Hernroth B., Kollberg S., Loo L.-O., Olrog L., et al. (2005). Improving marine water quality by mussel farming: A profitable solution for Swedish society. Ambio 34 (2), 131–138. doi: 10.1579/0044-7447-34.2.131PMID:15865310
Morrissey K., O’Donoghue C. (2013). The role of the marine sector in the Irish national economy: An input–output analysis. Mar. Policy 37, 230–238. doi: 10.1016/j.marpol.2012.05.004
OECD (2016). The ocean economy in 2030 Vol. 2016 (Paris: OECD Publishing). doi: 10.1787/9789264251724-en
Ostberg K., Hakansson C., Hasselstrom L., Bostedt G. (2013). Benefit transfer for environmental improvements in coastal areas: General versus best-fitting models. Can. J. Agric. Economics-Revue Can. D Agroeconomie 61 (2), 239–258. doi: 10.1111/cjag.12010
Park K. S., Kildow J. T. (2014). Rebuilding the classification system of the ocean economy. J. Ocean Coast. 2014 (1). doi: 10.15351/2373-8456.1001
PRC (2008). The role of Maritime Clusters to enhance the strength and development of European maritime sectors. Brussels/Antwerp/Rotterdam: Policy Research Corporation, 38 s. Available at: https://www.europeansources.info/record/the-role-of-maritime-clusters-to-enhance-the-strength-and-development-of-maritime-sectors/ (Accessed 6 February 2023).
Psuty I., Zaucha J., Mytlewski A., Suska M., Szymanek L. (2021). The use of the contribution margin on the valorisation of polish fisheries for maritime spatial planning. Ocean Coast. Manage. 211, 105751. doi: 10.1016/j.ocecoaman.2021.105751
Roddis P., Carver S., Dallimer M., Norman P., Ziv G. (2018). The role of community acceptance in planning outcomes for onshore wind and solar farms: An energy justice analysis. Appl. Energy. 226, 353–364. doi: 10.1016/j.apenergy.2018.05.087
Ruiz-Frau A., Hinz H., Edwards-Jones G., Kaiser M. J. (2013). Spatially explicit economic assessment of cultural ecosystem services: Non-extractive recreational uses of the coastal environment related to marine biodiversity. Mar. Policy 38, 90–98. doi: 10.1016/j.marpol.2012.05.023
Sagebiel J., Schwartz C., Rhozyel M., Rajmis S., Hirschfeld J. (2016). Economic valuation of Baltic marine ecosystem services: blind spots and limited consistency. ICES J. Mar. Sci. 73 (4), 991–1003. doi: 10.1093/icesjms/fsv264
Saunders F., Gilek M., Ikauniece A., Voma Tafon R., Gee K., Zaucha J. (2020). Theorizing social sustainability and justice in marine spatial planning: Democracy, diversity, and equity. Sustainability 12 (6), 2560. doi: 10.3390/su12062560
Scholz A. J., Steinback C., Kruse S. A., Mertens M., Silverman H. (2011). Incorporation of spatial and economic analyses of human-use data in the design of marine protected areas. Conserv. Biol. 25 (3), 485–492. doi: 10.1111/j.1523-1739.2010.01626.x
Schultz-Zehden A., Weig B., Lukic I. (2019). “Maritime spatial planning and the EU’s blue growth policy: Past, present and future perspectives,” in Maritime spatial planning. Eds. Zaucha J., Gee K. (Cham: Palgrave Macmillan). doi: 10.1007/978-3-319-98696-8_6
Silver J. J., Gray N. J., Campbell L. M., Fairbanks L. W., Gruby R. L. (2015). Blue Economy and Competing Discourses in International Oceans Governance. J. Environ. Dev. 24 (2), 135–160. doi: 10.1177/1070496515580797
Stancheva M., Stanchev H., Zaucha J., Ramieri E., Roberts T. (2022). Supporting multi-use of the sea with maritime spatial planning. the case of a multi-use opportunity development - Bulgaria, black Sea. Mar. Policy 136, 104927. doi: 10.1016/j.marpol.2021.104927
Surís-Regueiro J. C., Santiago J. L., Gonz´alez-Martínez X. M., Garza-Gil M. D. (2021). An applied framework to estimate the direct economic impact of marine spatial planning. Mar. Policy 127, 104443. doi: 10.1016/j.marpol.2021.104443
UNEP, FAO, IMO, UNDP, IUCN, World Fish Center, et al. (2012) Green economy in a blue world (Arendal: UNEP/GRID). Available at: https://sustainabledevelopment.un.org/index.php?page=view&type=400&nr=656&menu=35 (Accessed 7th June 2022).
Wenhai L., Cusack C., Baker M., Tao W., Mingbao C. H., Paige K., et al. (2019). Successful blue economy examples with an emphasis on international perspectives. Front. Mar. Sci. 6 (6). doi: 10.3389/fmars.2019.00261
White J. W., Scholz A. J., Rassweiler A., Steinback C., Botsford L. W., Kruse S., et al. (2013). A comparison of approaches used for economic analysis in marine protected area network planning in California. Ocean Coast. Manage. 74, 77–89. doi: 10.1016/j.ocecoaman.2012.06.006
World Bank (2016) Blue economy development framework growing the blue economy to combat poverty and accelerate prosperity (Washington DC: World Bank). Available at: https://thedocs.worldbank.org/en/doc/446441473349079068-0010022016/original/AMCOECCBlueEconomyDevelopmentFramework.pdf (Accessed 10th June 2022).
Zaucha J., Matczak M., Witkowska J., Szczęch A., Mytlewski A., Pardus J., et al. (2020). Maritime Spatial Rent for Modelling Maritime Spatial Development. Studia Regionalne i Loklane 1, pp. 5–29.
Keywords: blue economy, blue growth, measurement of maritime economy, Baltic Sea region, Poland
Citation: Kwiatkowski JM and Zaucha J (2023) Measuring the blue economy in the EU: The Polish experience. Front. Mar. Sci. 10:1129075. doi: 10.3389/fmars.2023.1129075
Received: 21 December 2022; Accepted: 20 February 2023;
Published: 27 March 2023.
Edited by:
Sebastian Villasante, University of Santiago de Compostela, SpainReviewed by:
Maria Hadjimichael, University of Cyprus, CyprusJuan C. Surís-Regueiro, University of Vigo, Spain
Copyright © 2023 Kwiatkowski and Zaucha. This is an open-access article distributed under the terms of the Creative Commons Attribution License (CC BY). The use, distribution or reproduction in other forums is permitted, provided the original author(s) and the copyright owner(s) are credited and that the original publication in this journal is cited, in accordance with accepted academic practice. No use, distribution or reproduction is permitted which does not comply with these terms.
*Correspondence: Jacek Zaucha, amFjZWsuemF1Y2hhQHVnLmVkdS5wbA==