- Ocean College, Zhejiang University, Zhoushan, China
In nature, plumes usually enter the coastal ocean after they leave the estuary, and most of them interact with the continental shelf slope. To understand plume dynamics, laboratory experiments were carried out on a rotating table to simulate the evolution of plumes over a sloping bottom. We modified reduced gravity g’, Coriolis parameter f, and shelf slope α to study their impacts on plume characteristics and freshwater fate, and used the optical thickness method to obtain the depth field. We found that with the increasing g’ or decreasing f, plume maximum depth hmax decreases and plume maximum width Wmax increases. We proposed a method to determine plume types based on their attachment to the shelf slope: when PCN (plume classification number) > 1.6, the plume is bottom-attached; when PCN< 1.6, the plume is surface-advected. In addition, we found the bulge will become unstable when BIN (bulge instability number)< 0.8. Our analysis shows that the sloping bottom is the most significant factor determining the ratio of freshwater accumulated in the bulge over transported with coastal currents. Generally, bottom-attached plume trapped near the coast inhibits offshore freshwater transport and promotes coastal current transport, while baroclinic instability tends to produce a large cyclonic vortex over a gentle slope which strongly enhances the offshore transport.
1 Introduction
Rivers issue into the coastal ocean as tidally modulated pulses of fresh water, which carry more than one-third of land-based precipitation to the ocean (Nash and Moum, 2005). They transport and transform the buoyant freshwater in the region around the river mouth as it merges with deeper, salty ocean waters, which makes terrigenous material carried by rivers affect coastal waters (Fasullo et al., 2007). The river plume is a low salinity water formed in the coastal area after the freshwater flows out of the estuary, generating recirculating bulge near the estuary, and then continuously propagating along the continental shelf as a buoyant coastal current (Dzwonkowski and Yan, 2005). In this process, the transport and mixing of plumes play an essential role in the vertical mixing of water, sediment, temperature, and salinity (Lohan and Bruland, 2006). For example, the Yangtze River exports massive loadings of freshwater, sediments, and nutrients that significantly alter the hydrodynamics, turbidity, and nutrient composition in its area of influence (Chang and Isobe, 2003; Zhang et al., 2013). The massive nutrient brought from upstream of the Yangtze River causes severe eutrophication in the plume area, which seriously endangers the coastal ocean environment (Wang, 2006). Therefore, studying river plumes on their structure and freshwater transport has great ecological and social significance.
Under ideal conditions, a plume can be separated into two dynamically distinct regions: a bulge region near the river mouth and an alongshore coastal current propagating in the downstream direction (in the Kelvin wave sense) (O’Donnell, 1990; Chen, 2014). The plume expands in the direction of propagation of the coastally trapped waves after the freshwater release. The intrusion speed inside the estuary is consistently higher than that along the shelf. Energy is therefore accumulated near the estuary mouth, forming a bulge (Chao and Boicourt, 1986). In the bulge region, the plume forms an anticyclonic vortex (Northern Hemisphere) under the low wind and low ambient current condition, which has been confirmed in the observation of Columbia River (Horner-Devine et al., 2009) or Hudson River (Dzwonkowski and Yan, 2005). Many studies have been carried out on the geometric characteristic (Fong and Geyer, 2002), freshwater retention (Horner-Devine et al., 2006; Yuan et al., 2018), and stability (Avicola and Huq, 2003) of the bulge under different inflow conditions and environmental factors. They found that the bulge shape was related to the inflow condition, Coriolis force and ambient flow. And the bulge accumulated 60 – 70% of the freshwater discharge, and the baroclinic instability can increase freshwater accumulation (Avicola and Huq, 2003). In coastal currents, buoyant water forming a coastal current continues to propagate far from the mouth, such as Chesapeake Bay (Rennie et al., 1999) and Delaware Bay (Sanders and Garvine, 1996). Previous theoretical studies have found that coastal current transport is also related to inflow conditions, Coriolis force, and external forcing agents (Nof and Pichevin, 2001; Fong and Geyer, 2002). Some studies mentioned the spread of freshwater transport in coastal currents, which accounts for 27 – 77% of the river discharge (Nof and Pichevin, 2001; Chen, 2014). There are many previous studies on buoyancy flow transport on the sloping bottom, but these are less about both bulge and coastal current transport.
In nature, plumes usually enter the continental shelf after the estuary outflow and interact with the bottom shelf. According to the contact between the bottom and the front shown in the density field, Chapman and Lentz (1994) divided the plume into surface-advected (Figure 1A) and bottom-attached (Figure 1B). Surface-advected plume is characterized by shallow plume thickness and retention on the surface, generally associated with a strong vertical stratification (Garvine, 1974). Typically, surface-advected plumes are strongly affected by ambient flows, winds, and tides, while they are not appreciably influenced by the bottom topography. One classic example of surface-advected plume is the Mississippi River plume, where a vital stratification region leads to an anoxic lower layer, forming a famous “Dead Zone” (Rabalais et al., 2002). On the other hand, the bottom-attached plume creates a strong horizontal density gradient with a surface-to-bottom density front separating the freshwater from the shelf water (Blanton, 1981; Münchow and Garvine, 1993). These plumes generate the offshore flow of freshwater in the frictional bottom boundary layer, thereby altering the density and velocity fields. Terrestrial materials, including sediments, nutrients, and organic matter, are transported in both along-shelf and cross-shelf directions (Wu and Wu, 2018). One classic example of bottom-attached plume is the Niagara River plume, which is Lake Ontario’s principal source of suspended and dissolved material (Mudroch, 1983). Examination of bottom sediments in Lake Ontario has pinpointed the river as a major source of contaminants (Thomas, 1983). Bottom-attached plumes profoundly influence shelf circulation and coastal ecosystem health, so studying them is of great practical significance. According to field observations, plume types can change according to environmental factors. The Niagara plume changes into a surface-advected plume when the density difference between the plume and ambient water increases to 0.9 kg m-3 (Masse and Murthy, 1992). The Hudson River is a bottom-attached plume during spring tides but is surface-advected during neap tides (Hunter et al., 2010). The Delaware plume is bottom-attached and controlled by the continental slope during most of the year, while it becomes surfaced-advected during the spring freshet (Münchow and Garvine, 1993).
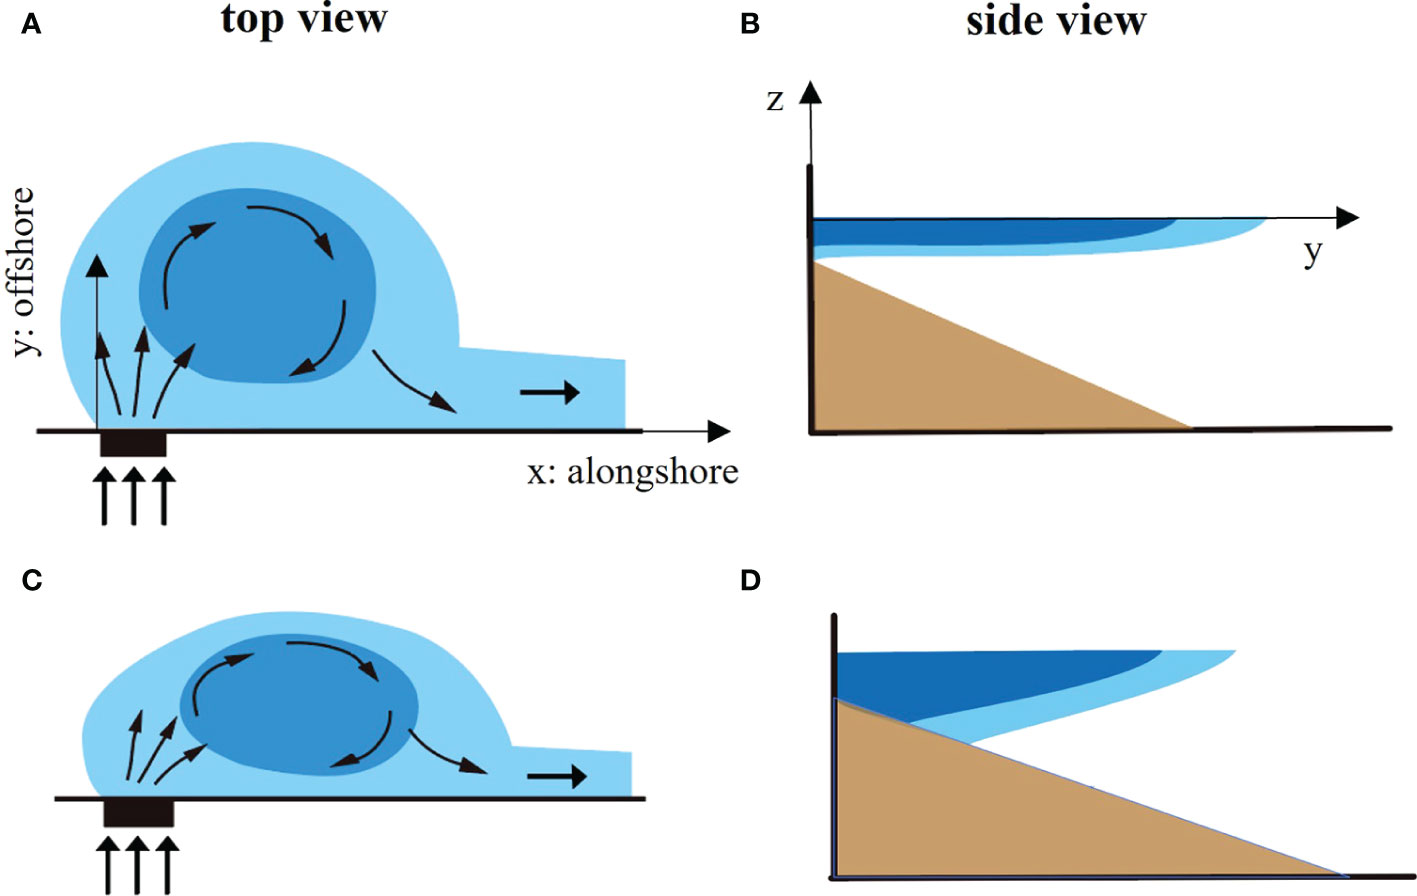
Figure 1 Schematic of a surface-advected plume (A: top view and B: side view) and a bottom-attached plume (C: top view and D: side view).
Extensive studies have proposed different non-dimensional parameters to distinguish among plume types. Yankovsky and Chapman (1997) classified the plume type by comparing the ratio of the buoyant inflow depth H0 and the equilibrium depth hg, and the ratio of the maximum seaward expansion of the surface-advected plume yS and the offshore location of the bottom-attached plume yb. The surface-advected plume forms when hg< H0, while the bottom-attached plume appears when hg > H0 and yb > yS. The intermediate plume is produced when hg > H0 and 0< yb< yS, which has features with both surface-advected and bottom-attached plumes. Yankovsky and Chapman (1997) defined whether a discharge is surface-advected or bottom-attached simply by the comparison between hg and H0. Lentz and Helfrich (2002) proposed a non-dimensional parameter cw/cα representing the response of buoyant flow to categorize plume type, where cw is the propagation speed in limit of a steep bottom slope and cα is the propagation speed in limit of a small bottom slope. The surface-advected plume forms when cw/cα<< 1, while the bottom-attached plume occurs when cw/cα >> 1. Avicola and Huq (2001) suggested two non-dimensional parameters: the ambient depth parameter, hg/H, where the ambient ocean depth H is defined as the depth of the fluid column at one Rossby radius Lb offshore, and the bottom slope parameter, Lb/yb to distinguish the characteristics of coastal current (Avicola and Huq, 2001). Because of the different inflow conditions, Yankovsky and Chapman (1997) and Avicola and Huq (2001) mainly focused on the bulge region, and the method proposed by Lentz and Helfrich (2002) is mainly used to distinguish types of coastal currents. Based on their judgment criteria, we made modifications and proposed new criteria suitable for plume classification in our experiments, which will be discussed in detail in section 3.1.
Previous studies on surface-advected and bottom-attached plumes are mostly separated. For the surface-advected plume, previous researchers paid more attention to the bulge, studied the geometric characteristics, and proved that the bulge shape was related to the Rossby number Ro and Froude number Fr. Fong and Geyer (2002) suggested that the larger Ro and the offshore dimension relative to the alongshore scale cause the smaller quantity of fluid intercepted by the coastal current. Horner-Devine et al. (2006) concluded that coastal current transport will decrease for larger Fr and Ro. When they are large, the bulge forms a more complete circle and discharges less fluid into the coastal current. Yuan et al. (2018) observed high and low discharge plumes as circular and compressed plume structures by simulating the effects of periodically varying discharge on buoyant coastal plumes. For the bottom-attached plume, the continental shelf is usually simplified as a continuous sloping bottom in laboratory experiments under ideal conditions. Chapman and Lentz (1994) numerically studied the bottom-attached buoyancy flow. They found that due to the influence of bottom friction, the along-slope flow of the front drives an offshore transport in the bottom Ekman layer that widens the buoyancy flow until the vertically sheared, geostrophic flow at the density front separating the buoyant and ambient fluid is zero at the bottom. Based on the theory, buoyancy flow reaches a geostrophic equilibrium and stops spreading offshore, suppressing the circular bulge. Some experiments showed the effect of the sloping bottom on plume characteristics and offshore transport. Lentz and Helfrich (2002) found that there is no prominent bulge near the estuary for bottom-attached plumes. The buoyancy flow is weaker near the coast than the surface-advected plume and increases with distance offshore. Avicola and Huq (2001) found that coastal currents of the bottom-attached plume experience lateral compression because of the bottom friction and tend to be faster and narrower than the surface-advected plume. Some studies focus on the effect of slope on alongshore transport. Garvine (1999) found that the downshelf penetration decreases for increased slope due to the freshwater transport offshore through the numerical model. Garvine (1999) and Brasseale and MacCready (2021) both found that gentle slope promotes alongshore transport. In Brasseale and MacCready (2021), the shelf slope were set as 2 × 10⁻³ for steep slope case and 5 × 10⁻⁴ for gentle slope case. Due to the limitations of laboratory experiments, we cannot make such a gentle slope to simulate the real continental shelf. We also set two variations on the shelf slope [steep slope (α = 0.2) and gentle slope (α = 0.1)] to study the effect of changing the slope on the plume and provide a reference for future research.
In summary, the previous studies focused on the surface-advected plume and the bottom-attached plume respectively, but the formation mechanism, critical conditions and coastal current transport under different classifications of two plume types need to be systematically investigated, especially the influence of sloping bottom on freshwater transport needs further study. In this study, we aim to investigate the effect of sloping bottom on plumes and analyze the impact of the reduced gravity g’, Coriolis parameter f, and shelf slope α on plume types and freshwater transport, and laboratory experiments on a rotating platform were carried out. We set up cameras on the top and side of the platform to obtain images and used the optical thickness method to estimate the depth field, which was used to calculate the width and depth of bulge, bulge volume and coastal current transport. The remainder of this paper is organized as follows. In section 2, we describe the experimental device, detailed conditions and data processing methods. The results and a discussion are given in section 3 and section 4, and concluding remarks are presented in section 5.
2 Method
2.1 Experimental setup
The experiments were carried out on a rotating table with a size of 3m × 3m × 0.5m in the Geophysical Fluid Dynamics Laboratory of Zhejiang University (Figure 2A). The experimental tank forms a circular experimental area, and a wall across one side forms the coastal wall. The bottom with a triangular section is used to simulate a continental shelf, and its top is attached to the estuary gate (Figure 2B).
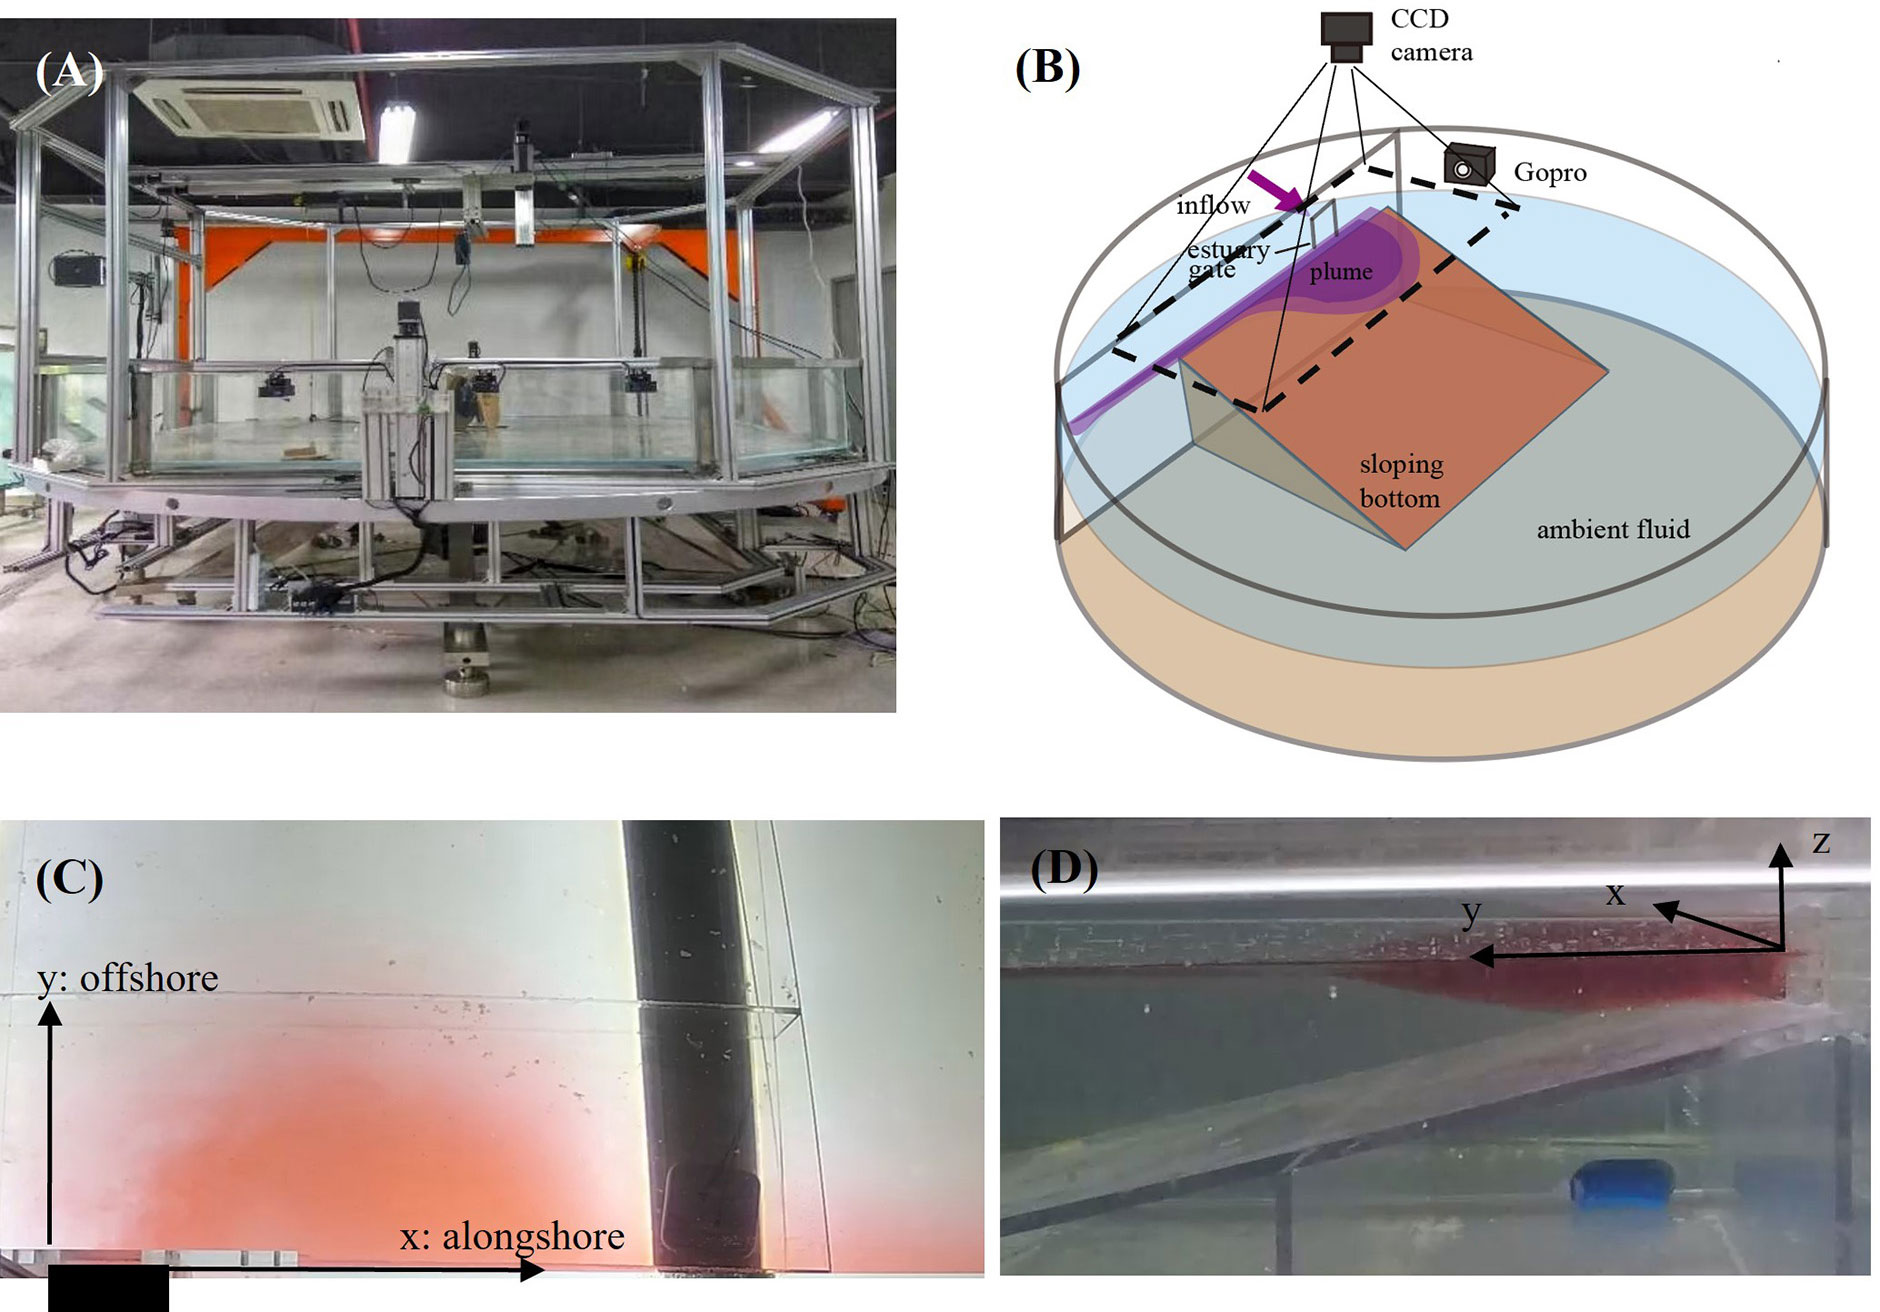
Figure 2 Schematic of the experimental setup. (A) Photo of the rotating table. (B) The setup of the cameras and bottom slope over the circular flume, (C) and (D) show the field of view captured by the top-mounted CCD camera and the side-mounted Gopro, respectively.
The freshwater of density ρ0 is used to simulate river injection in the estuary, which is marked using small concentrations of dye to facilitate flow visualization. At the preparation stage, the tank filled with salt water of density ρa to simulate seawater was rotated for at least 4 hours to achieve solid body rotation. During the experiments, the freshwater was pumped into the estuary with discharge Q, and the gate was opened simultaneously to produce the plume. During the whole process, the CCD camera installed atop was used to capture the top-view image (Figure 2C), and the Gopro was set up on the side to acquire side-view images (Figure 2D).
2.2 Experiment procedure
Before the experiments, the empty calibration tank was fixed on the coastal wall and filled with dyed freshwater (Figures 3A, B). Then the top-view camera took an image for calibration. Finally, we obtained the relationship between normalized image intensity and depth (Figure 3C), so that the depth field can be calculated using the exponential relationship: I/I0=Ae–hB+C, where constants A, B and C will be determined in the calibration program (Yuan et al., 2010). The background intensity I0 is the reference image captured just before the dyed freshwater is injected into the tank. Image intensity is the gray value of the image at each pixel obtained by MATLAB program.
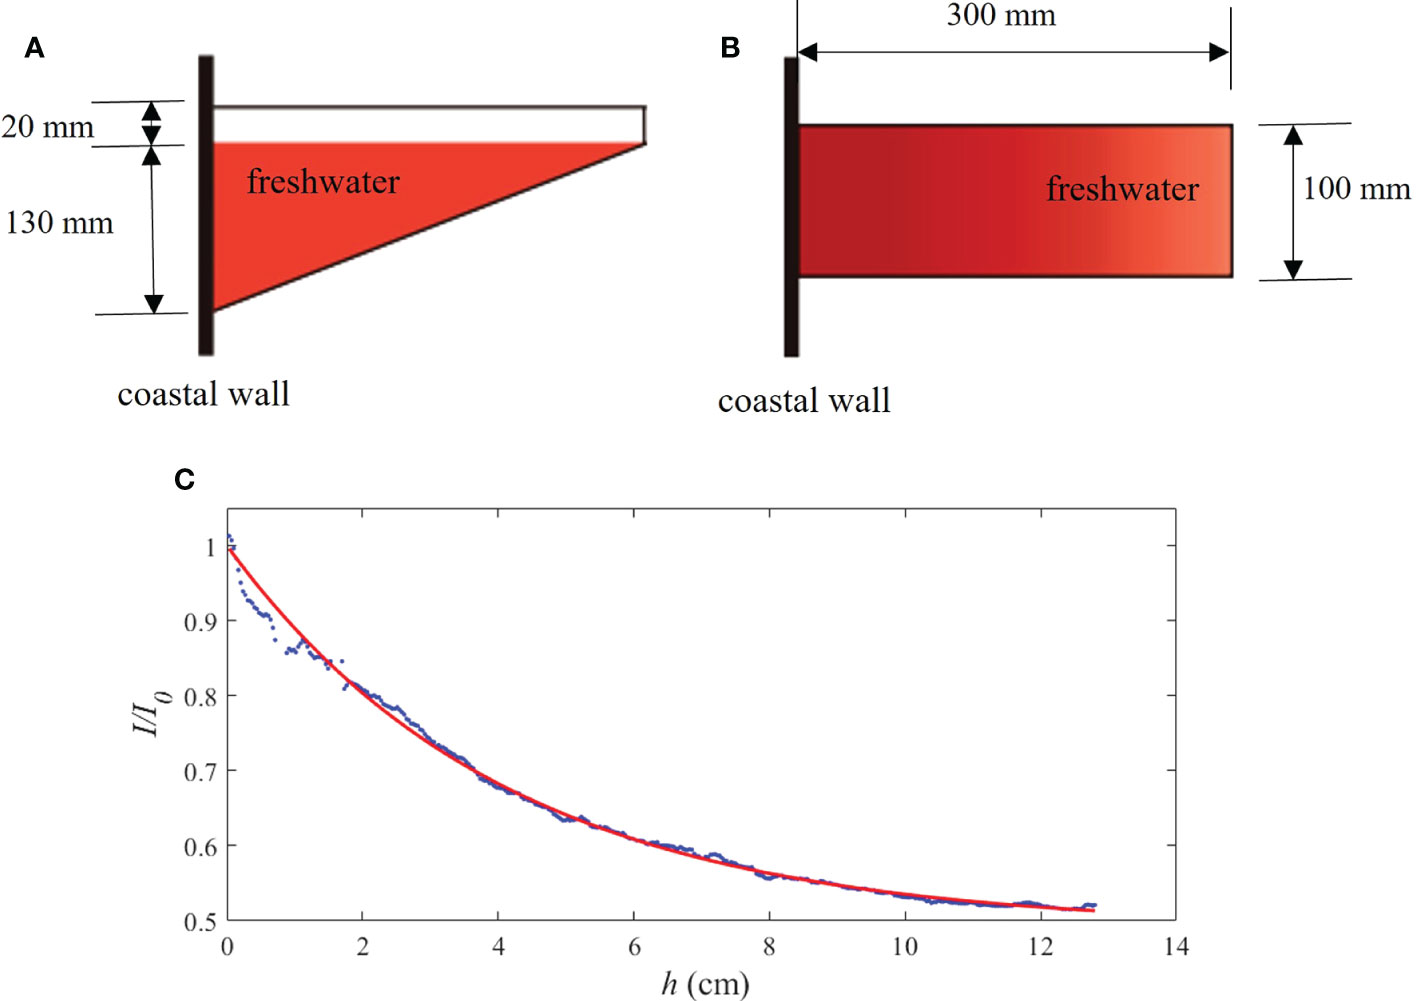
Figure 3 The calibration tank and normalized intensity-depth relationship. (A) Schematic of the calibration tank viewed from the side. (B) Schematic of the calibration tank viewed from above. (C) Relationship curve between normalized image intensity I/I0 and depth h. Blue circles indicate data points; the solid red line is the fitted curve.
The video recorded by CCD camera (Figure 2C) was converted into sequence pictures, and the color pictures were transformed into gray images. The side-view images taken by the Gopro were used to determine if the plume contacts the bottom in real-time, which can be compared with the depth field taken by the overhead camera for verification (Figure 2D).
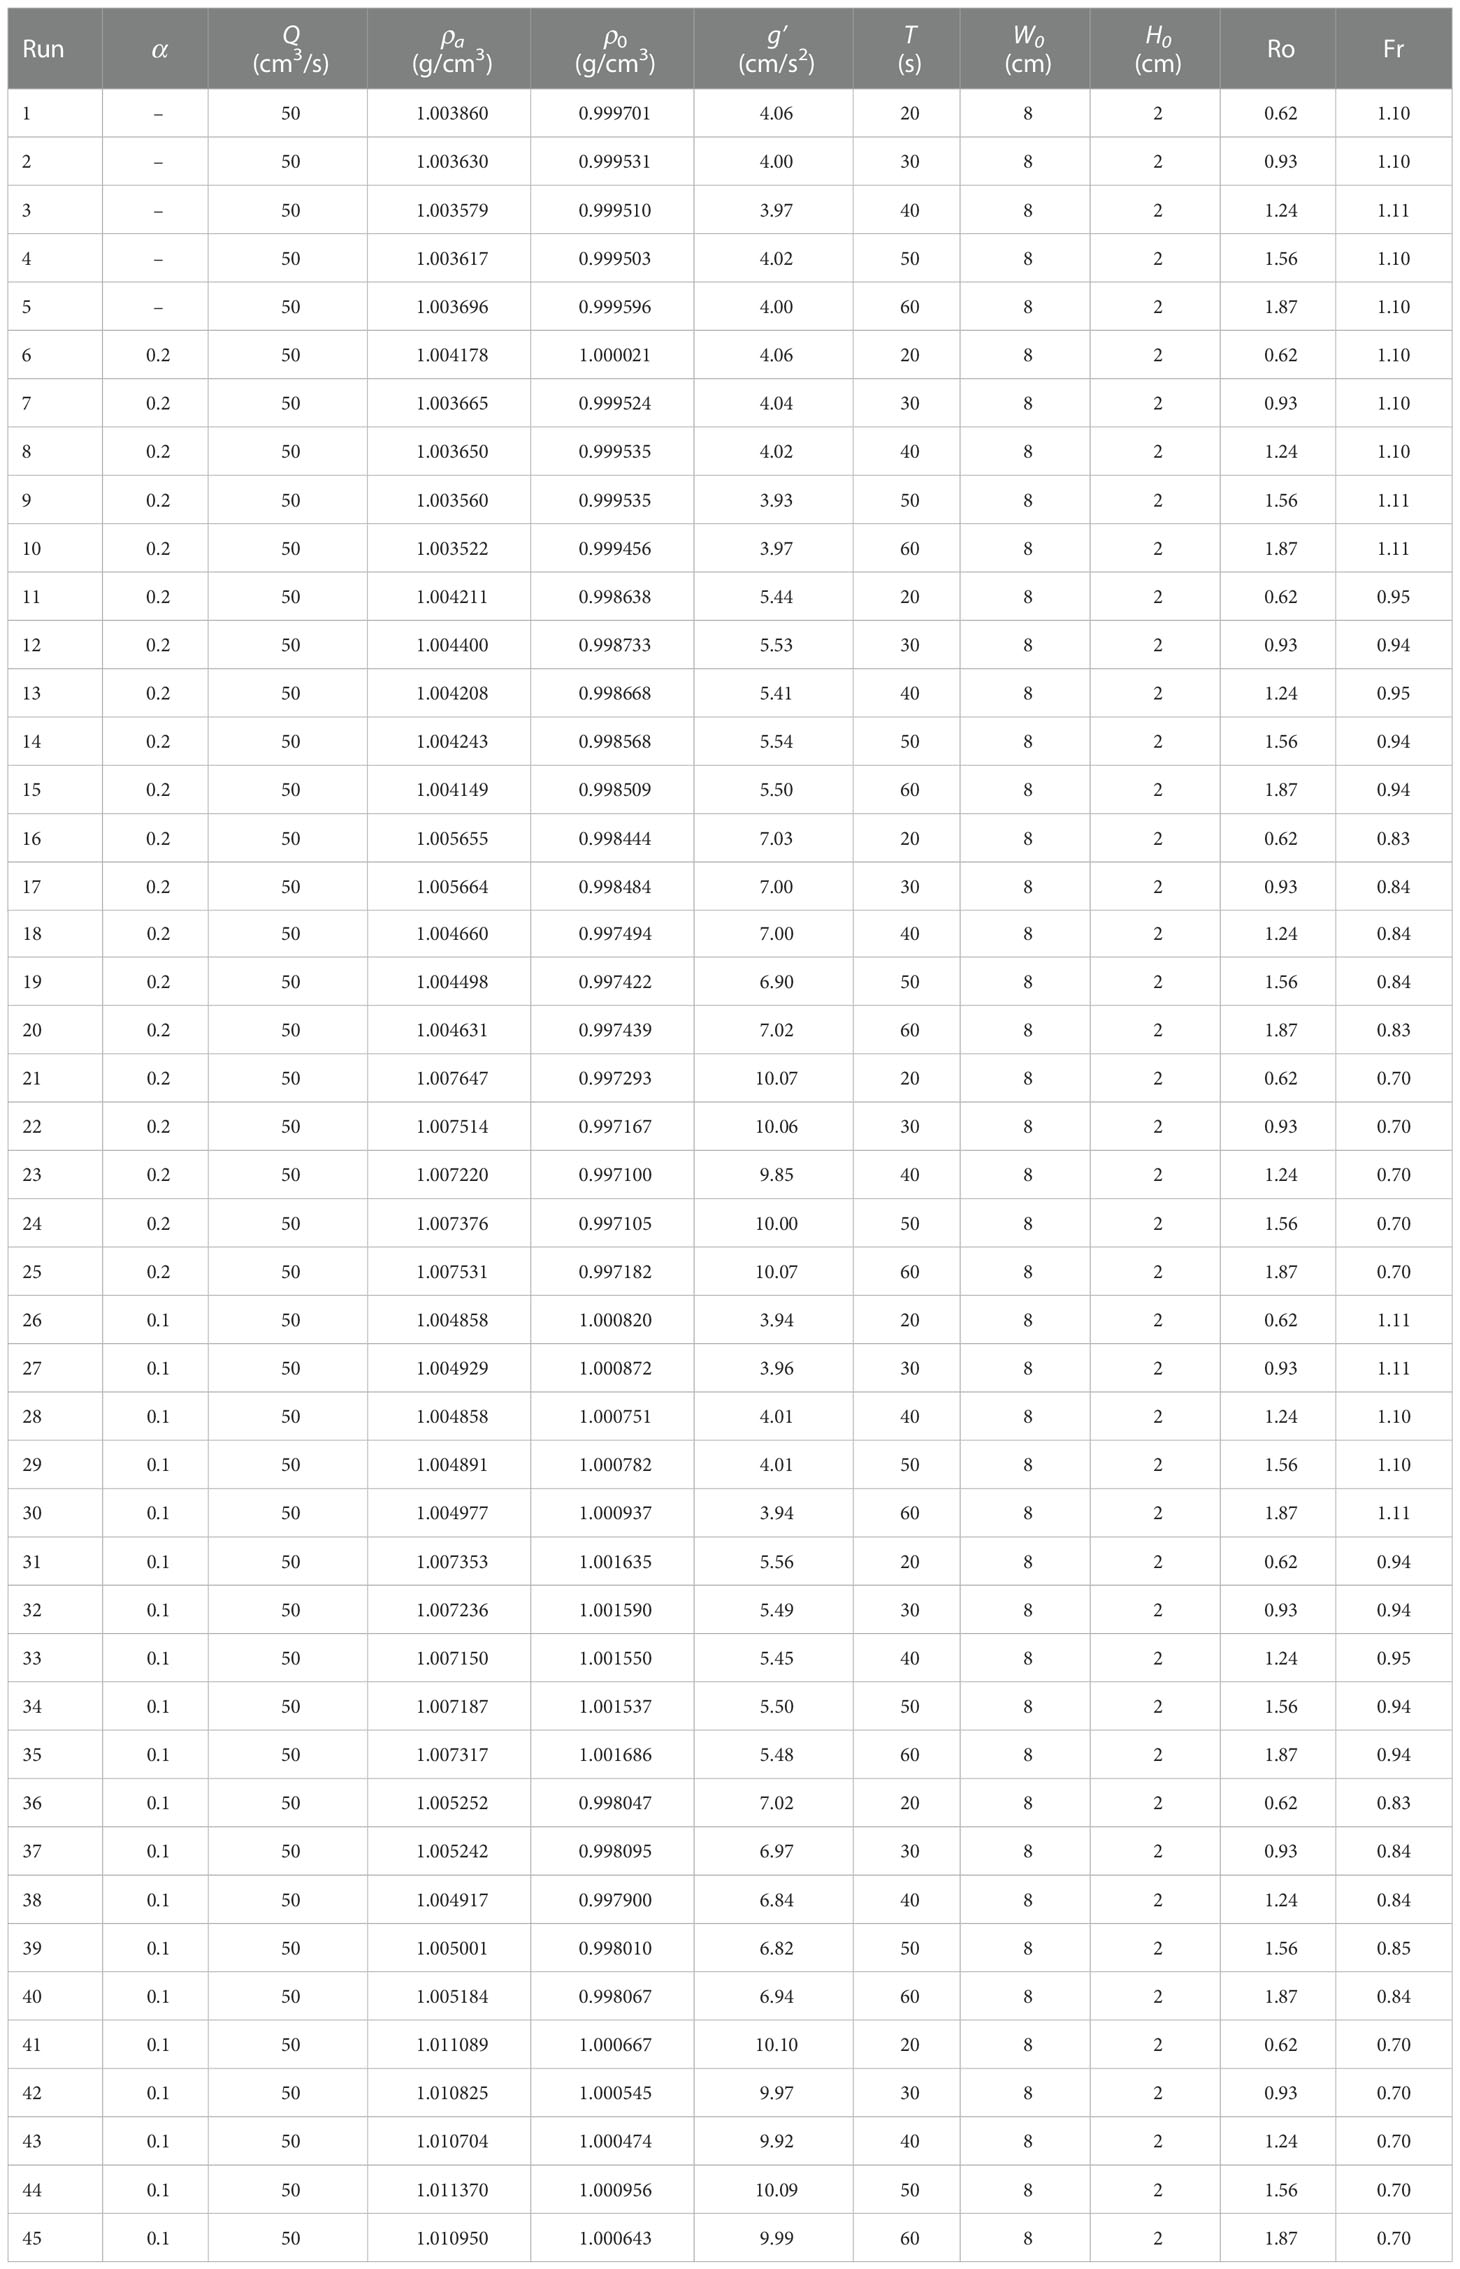
The bulge structure and coastal current transport of the plume are mainly controlled by two parameters: Rossby number Ro and Froude number Fr (Horner-Devine et al., 2006). We maintained the width (W0 = 8 cm) and height (H0 = 2 cm) of the estuary constant and changed the rotation period T, reduced gravity g’ and shelf slope α (Table 1). We use non-dimensional parameters:
where U is the inflow velocity, H0 is the initial inflow depth, W0 is the estuary width, g’=g(ρa–ρ0)/ρ0 is the reduced gravity, ρa is the ambient fluid density, ρ0 is the inflow freshwater density.
3 Results
3.1 Plume classification
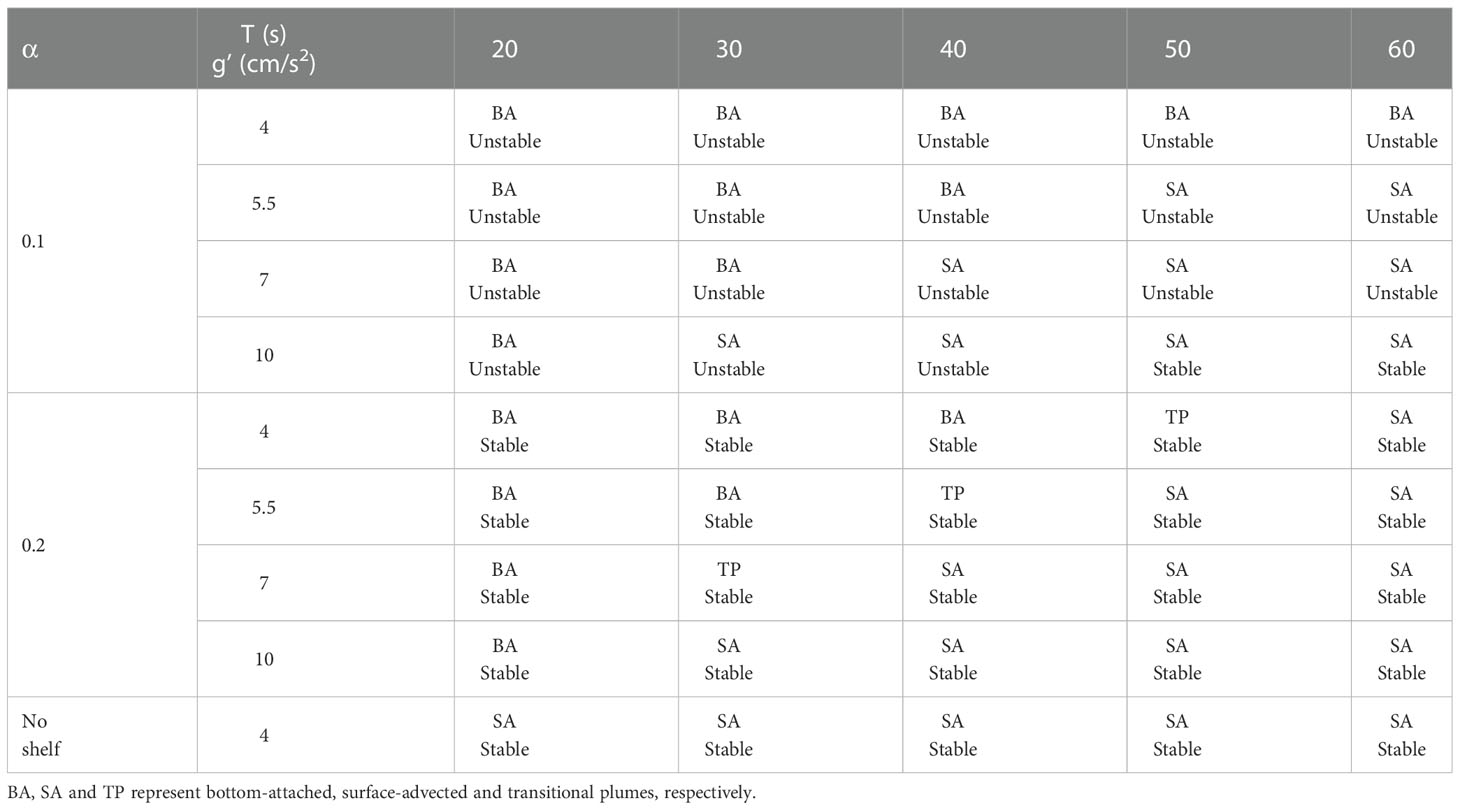
In our experiments, we focused on the influence of the sloping bottom. According to the contact between the bottom and the plume, we divided plumes into three types: surface-advected plumes, bottom-attached plumes, and transitional plumes. Figures 4A–F show the section at the maximum depth of the bulge, from which we can see the obvious boundary between freshwater and ambient water, similar to the plume front observed in the field (O’Donnell et al., 1998). We determined the plume type depending on whether the plume is in contact with the bottom.
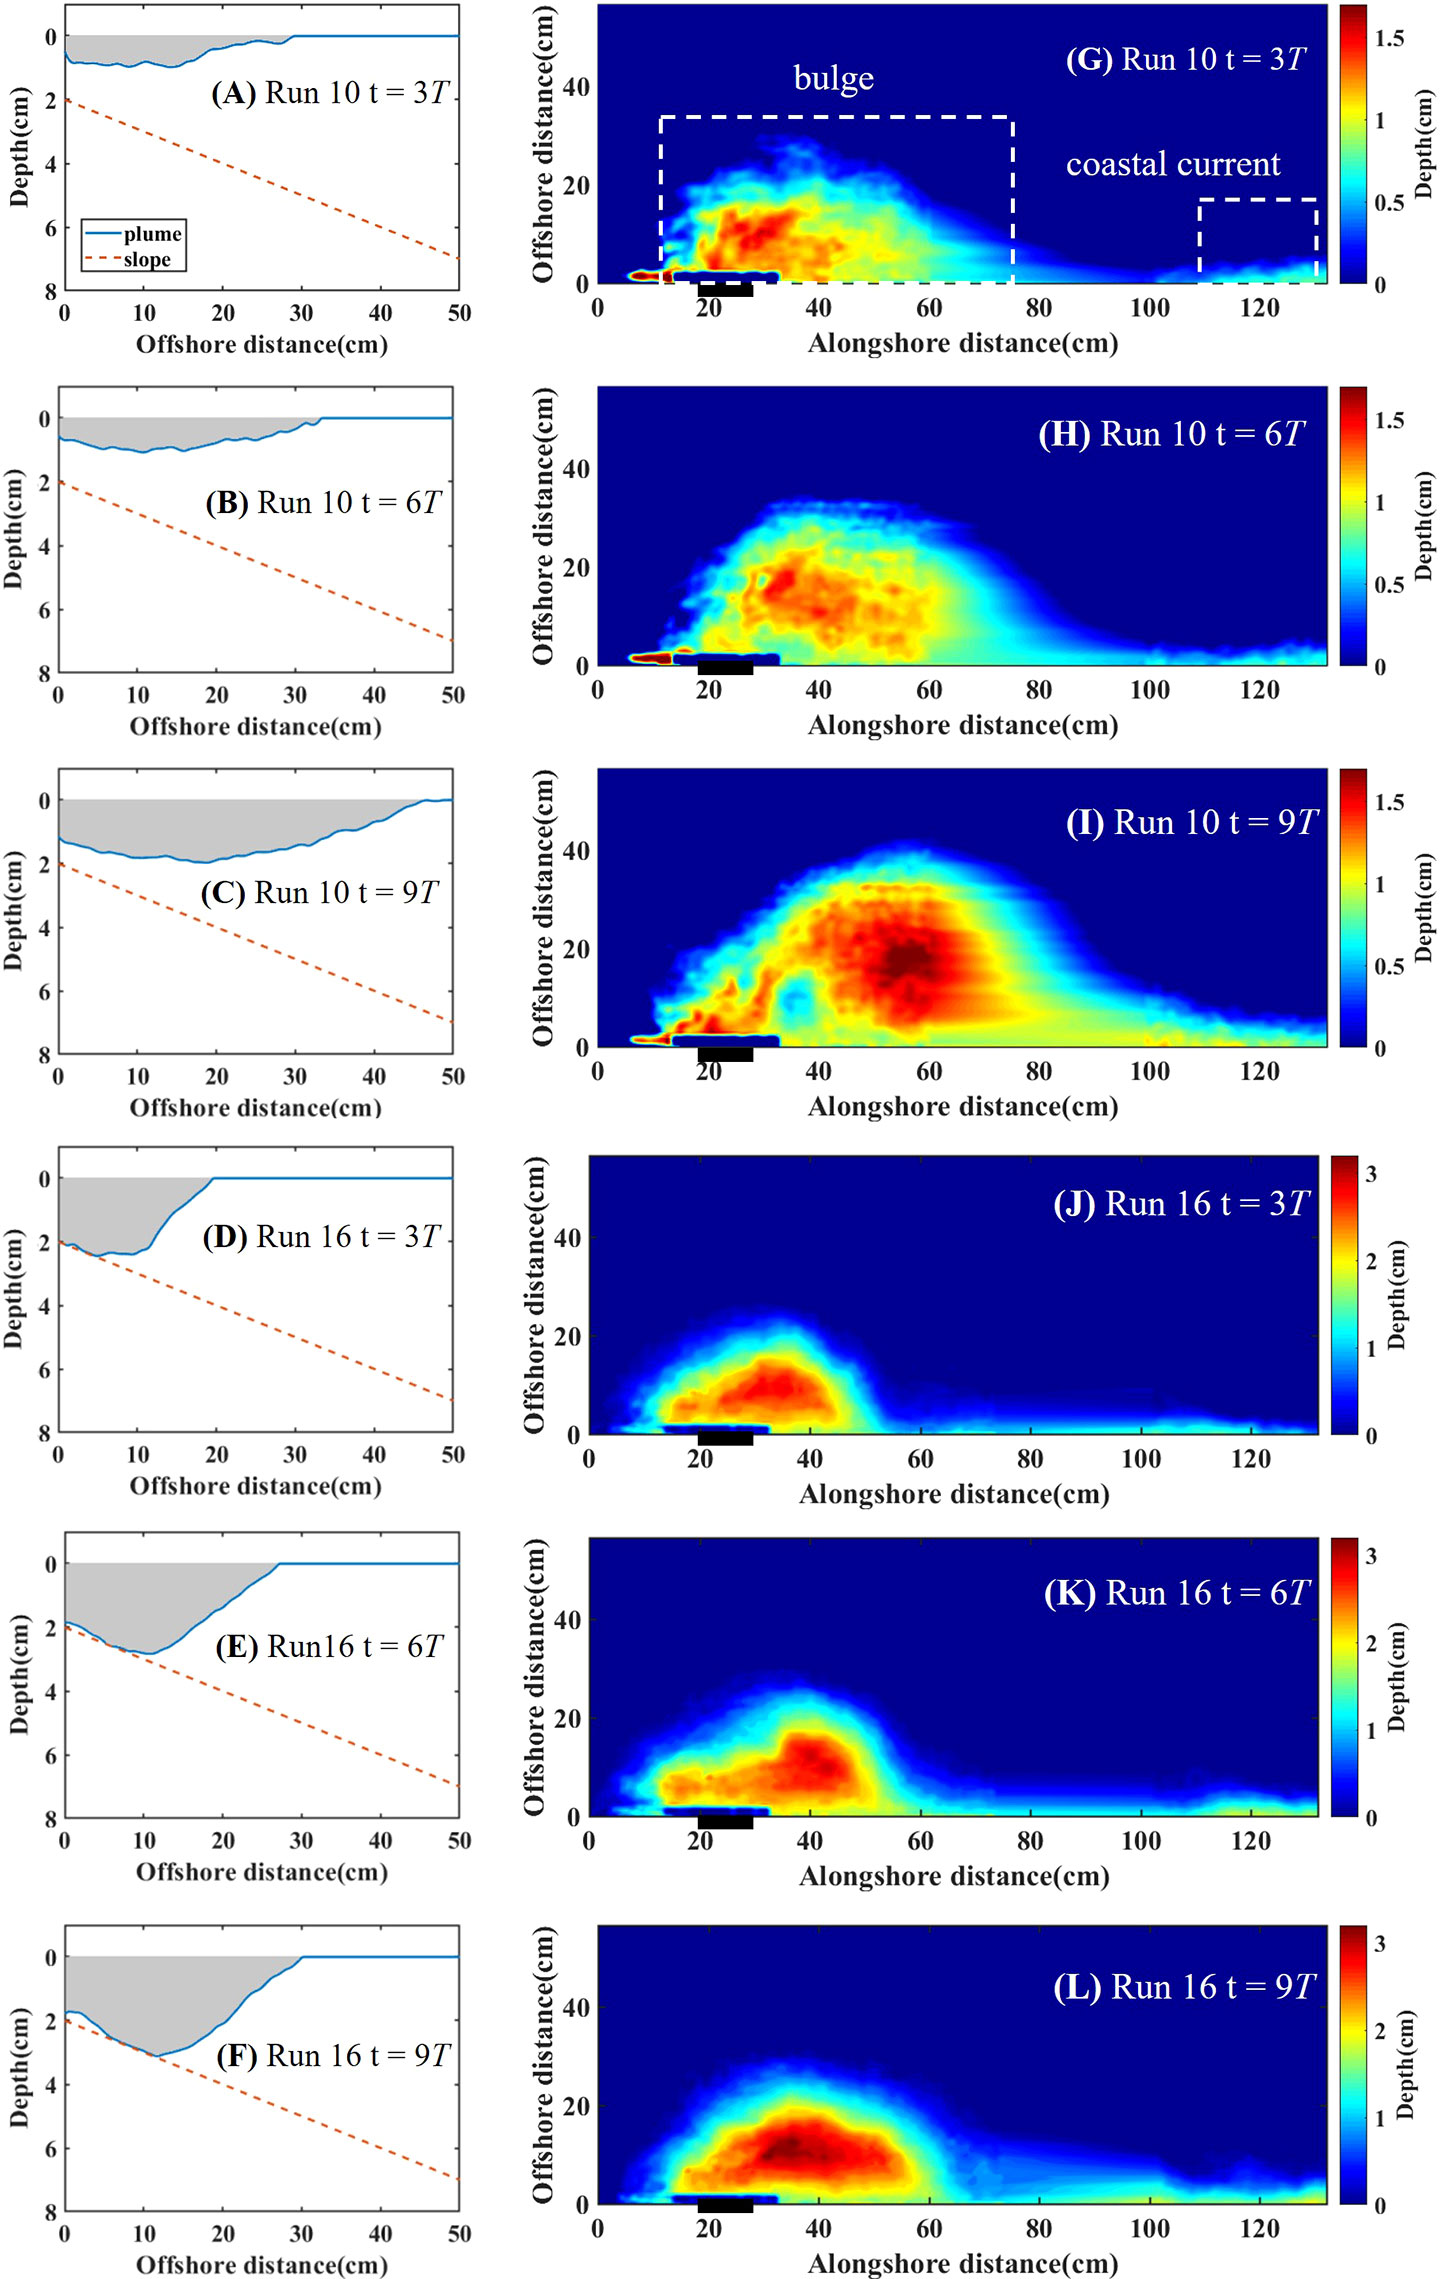
Figure 4 (A–F) Side-view of the interaction of plume and the bottom slope. The blue line and red dash line indicate plume contour and the sloping bottom. (G–L) Plume thickness field. The white dash boxes indicate bulge region and coastal current region. The top six panels are the example of surface-advected plume (run 10) with t = 3T (A, G), 6T (B, H), and 9T (C, I), while the bottom six panels are the example of bottom-attached plume (run 16) with t = 3T (D, J), 6T (E, K), and 9T (F, L).
Surface-advected plumes spread far offshore and have no contact with the bottom. In this case, a buoyant inflow primarily remains on top of the shelf water forming a thin layer with the ambient denser water beneath (Figures 4A–C). On the other hand, bottom-attached plumes have been in contact with the bottom during the whole process. In this case, the plume occupies the entire water column into depths much greater than the depth of the inflow (Figures 4D–F). Transitional plumes contact with the bottom at the beginning but eventually do not touch the bottom over time. Thus, the plume has properties like the bottom-attached plume at the beginning but eventually behaves more like a surface-advected plume. This plume is different from the intermediate plume proposed by Yankovsky and Chapman (1997), which is in contact with the bottom during the whole process. Transitional plumes are not the focus of our study.
As shown in Figures 4G–L, we can clearly distinguish the two main components of a typical plume from the depth field: the bulge region and the coastal current region (Horner-Devine et al., 2006; Yuan et al., 2018). The central vortex structure is established at t = 3T, and the coastal current begins to form along the wall by the end of the third period (Figures 4G, J). From 3T to 6T, the coastal current proceeds further along the shore, and both the bulge and the coastal current grow in the offshore direction (Figures 4H, K). From 7T to 9T, the bulge continues to grow offshore, and more freshwater accumulates in the bulge region, causing an increase in the bulge surface width and area. Compared with the earlier period, the width of the coastal current increases significantly because of more downstream freshwater transport (Figures 4I, L).
In most no-slope runs, the bulge grows unstable after 10T so that we limited our analysis to the first 10 rotation periods (Chapman and Lentz, 1994). In our experiments, we also observed the unstable plume within 10T in α = 0.1 cases. As shown in Figure 5, the unstable plume shows that a new cyclonic vortex develops in the bulge, which makes its shape quite different from the stable plume. The phenomenon of instability we found is manifested by the continuous separation of the cyclonic vortex from the bulge, making the bulge shape fluctuate periodically. Specifically, the bulge is no longer a circle or semicircle, and the bulge offshore distance is larger. According to whether the bulge generates the cyclonic vortex, we divided plumes into two types: stable plumes and unstable plumes.
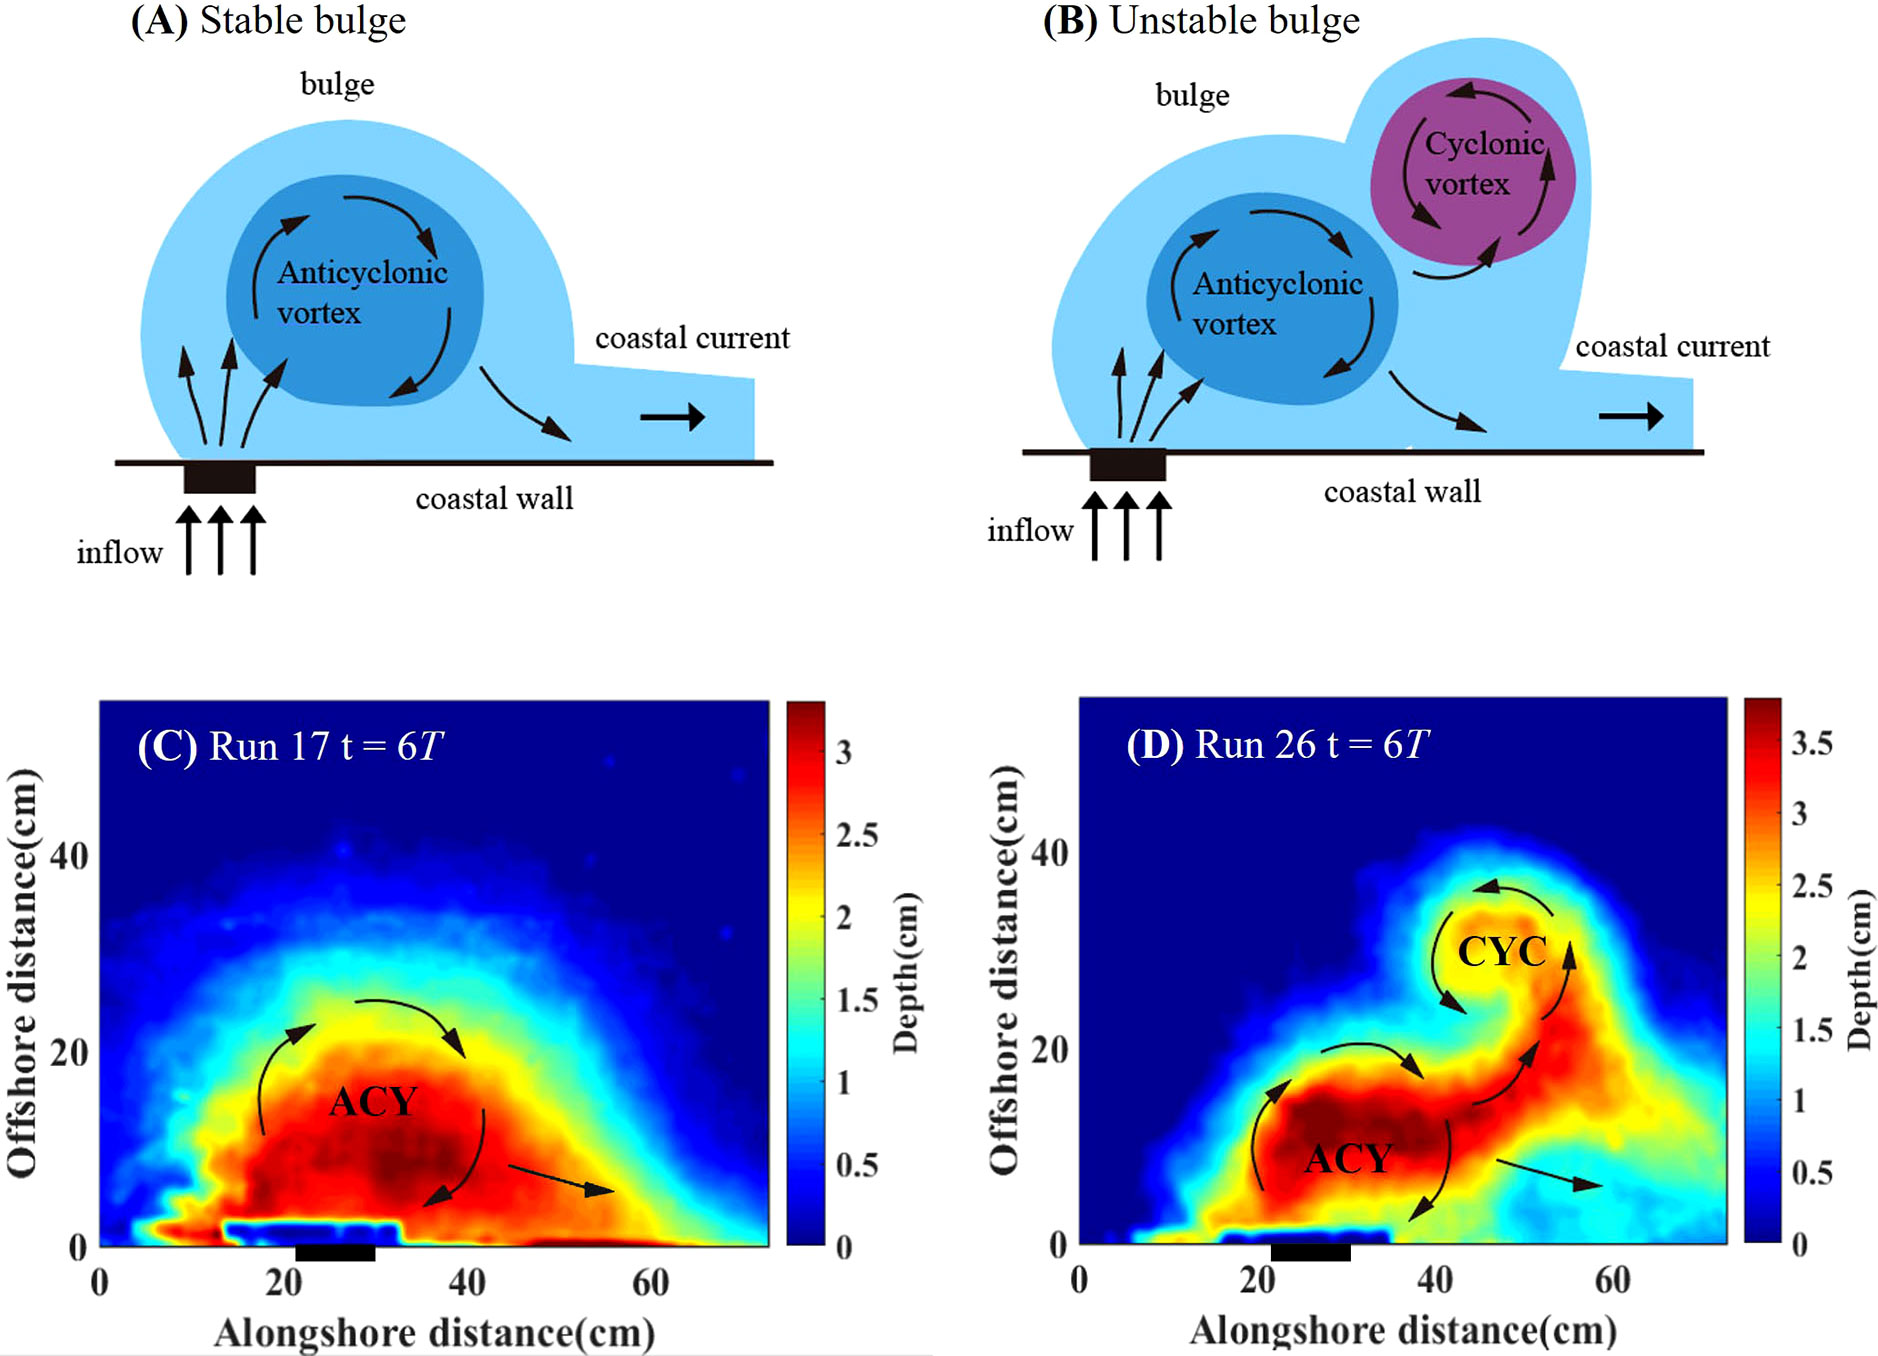
Figure 5 Schematics (top) and typical depth field (bottom) of stable plumes (left) and unstable plumes (right). (A, B) are schematic representations of the bulge. (C, D) are depth fields of the bulge at t = 6T. Black arrows in each panel indicate flow direction, while ACY and CYC represent anticyclonic vortex and cyclonic vortex, respectively.
Table 2 shows the plume types for all experimental conditions. Surface-advected plumes will generate with larger α, T and g’. Unstable plumes only occur in α = 0.1 case, so we conclude that shelf slope is the main parameter to control the bulge stability. We then try to quantify the plume type using non-dimensional parameters hg/H0 (depth), αLb/hg (shelf slope), and θ (instability).
3.1.1 Bottom-attached versus surface-advected plumes
Assuming that the plume front is in geostrophic balance (Avicola and Huq, 2001), Eqs. (3), (4) and (5) are used to normalize the depth, width, and velocity, respectively, which can be used to characterize the evolution of the bulge.
Chapman and Lentz (1994) assumed that the offshore buoyancy flux of a buoyant coastal current interacting with the bottom occurs in a thin bottom Ekman layer. They obtained the offshore extent yb of this bottom-trapped layer:
We scaled y and umax in Eq. (6) by Lb and c given in Eqs. (4) and (5), respectively. We will have:
Finally, based on the theory of Avicola and Huq (2001), we calculate the bottom-slope parameter suitable for our experiments, using the ratio between the bulge Rossby radius Lb and the bottom-trapped width yb:
For hg<H0 case, the bottom boundary layer does not influence plume dynamics (Yankovsky and Chapman, 1997). Therefore, the depth parameter (hg/H0) can be used to predict the offshore spreading and types of buoyant inflow. We combined the above two non-dimensional parameters and the non-dimensional parameter space (hg/H0, αLb<hg) that comprises the depth and bottom-slope parameters as shown graphically in Figure 6A.
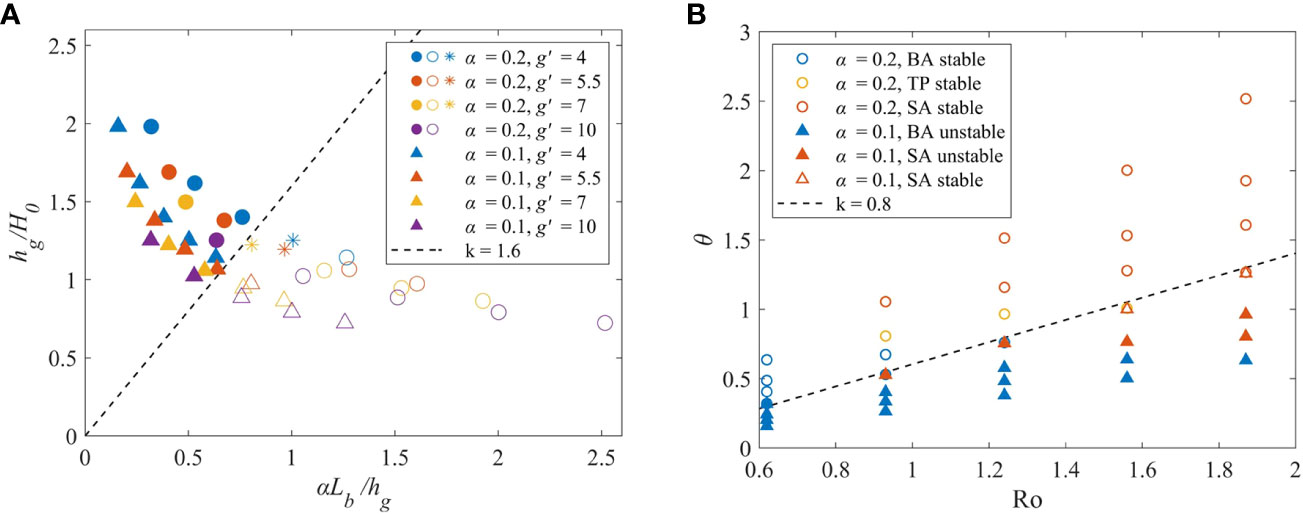
Figure 6 Plume types according to the bottom attachment (A) or bulge stability (B). In panel (A), the solid, asterisk and hollow symbols represent bottom-attached plumes, transitional plumes, and surface-advected plumes, respectively. The dash line denotes the boundary of surface-advected and bottom-attached plume, which is PCN = 1.6. In panel (B), the solid and the hollow symbols represent unstable and stable plumes, respectively. The dash line stands for the boundary of stable and unstable plume, which is BIN = 0.8.
The small values of hg<H0 indicate that the plume is isolated from the bottom (surface-advected plume), while the large values of hg<H0 mean that the plume is interacting with the bottom (bottom-attached plume). Values on the left edge of Figure 6A characterize coastal currents that are forced to grow wider than the buoyant scale, but values on the right edge of Figure 6A show that the current is compressed in width. αLb<hg > 1 implies that the scale width is larger than the trapped width so that the bulge experiences horizontal “compression” at its base. On the other hand, if αLb<hg< 1, the bulge undergoes lateral expansion at its base beyond its scale width (Avicola and Huq, 2003). We defined the threshold of surface-advected and bottom-attached plumes as plume classification number (PCN), , using least-square method to calculate the criterion between two plumes. As shown in Figure 6A (dash line), when PCN > 1.6, the plume is bottom-attached; when PCN< 1.6, the plume is surface-advected.
Yankovsky and Chapman (1997) proposed that a surface-advected plume forms when the predicted equilibrium depth for the bottom-attached plume is shallower than the depth of the buoyant inflow (hg<H0). They distinguished whether the plume contacts with the bottom only by comparing hg and H0. However, in our experiment, there are also surface-advected plumes when hg>H0. Avicola and Huq (2001) proposed the bottom-slope parameter Lb<yb, the ratio of the internal Rossby radius to the bottom-trapped width, which describes the effect of the slope on the dynamics of the coastal current. We used the above methods to verify the plume type in our experiment and found that it is not completely consistent with them, possibly due to laboratory experiments or different working conditions. Therefore, we proposed non-dimensional parameters suitable for plume classification in laboratory experiments according to specific conditions.
3.1.2 Stable versus unstable plumes
Saunders (1973) studied the baroclinic instability of vortex, which is controlled by the normalized instability parameter θ (the ratio of buoyancy force to the Coriolis force):
where r is the offshore radius and H is the environmental ocean depth, which is defined by Avicola and Huq (2003) as the depth at a Rossby radius. Therefore, in our experiments:
Plugging Eq. (10) into Eq. (9) and using the Rossby radius Lb to represent the offshore radius, we obtain the instability parameter θ as:
The instability parameter θ is a ratio of the available potential energy in a baroclinic vortex to the rotational kinetic energy (Avicola and Huq, 2003). When θ is small, the plume is prone to baroclinic instability. The bulge stability is closely related in θ and Ro (Figure 6B), where θ/Ro is the ratio of buoyancy to inertial force. The two types are roughly separated by a straight line with a gradient of 0.8 (k = 0.8). We defined the threshold of stable and unstable plumes as bulge instability number (BIN), BIN = θ/Ro. When BIN > 0.8, buoyancy is the dominant factor, the transport is strong, and the plume is less affected by the slope, so it is relatively stable. And surface-advected plumes appear more often when BIN > 0.8, which verifies the conclusion that buoyancy dominates in this case. When BIN< 0.8, there are all unstable plumes. The rotational kinetic energy is dominant, and the plume develops a cyclonic vortex. And bottom-attached plumes appear more often when BIN< 0.8, which verifies that the buoyancy effect is relatively small in this case.
3.2 Fate of freshwater
3.2.1 Bulge characteristics
In this section, we will calculate the maximum depth hmax (Figure 7A) and maximum width Wmax (Figure 7B) of the bulge region. Based on the depth field, the top 5% depth value was selected as the maximum depth (hmax) of the plume. Based on hmax, we choose 20% hmax as the threshold to determine plume boundary, so that the maximum width (Wmax) can be determined. Then, the bulge volume (Vb) is calculated by summing the depth of each point in the plume profile according to the depth field (Figure 7C).

Figure 7 Time series of plume featured parameters normalized maximum plume depth (A), maximum plume width (B) and bulge volume (C) for different rotation rates in runs 36 – 40 (α = 0.1, g’ = 7 case).
In the exponential phase (0 – 3T), hmax and Wmax increase dramatically. Due to the effect of bottom friction, the plume flows offshore until the vertical shear geostrophic flow at the density front separating the buoyancy fluid from the ambient fluid is zero at the bottom (Chapman and Lentz, 1994). And then hmax and Wmax gradually become stable during 3 – 10T. In our experiments, we found that when α = 0.1, unstable plumes cause fluctuations of hmax and Wmaxvalues (Figures 7A, B), showing that the cyclonic vortex continuously separates from the bulge and transports downstream as time proceeds, which lead to the periodic changes of the bulge width and depth. The fluctuations of depth and width correspond to each other, but their phases are opposite, so Vb does not fluctuate (Figure 7).
We plotted the mean value of non-dimensional plume depth and width during the stationary phase (8 – 9T) versus the bottom-slope parameter (αLb/hg) in Figure 8. αLb/hg larger than 1 indicates most plumes are surface-advected, while it smaller than 1 indicates most plumes are bottom-attached. Obviously, hmax of the bottom-attached plume is greater than that of the surface-advected plume (Figure 8A). Wmax of the bottom-attached plume is smaller than that of the surface-advected plume (Figure 8B). Because of the conservation of freshwater, the depth and width are corresponding, that is, when the plume depth is small, it will develop farther offshore.
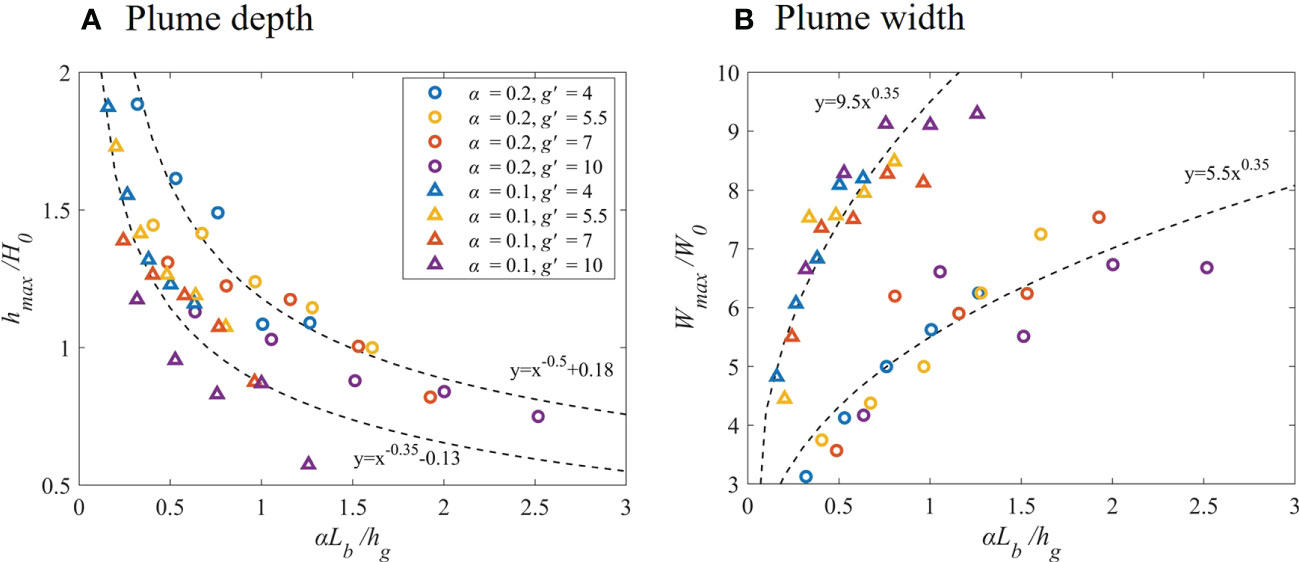
Figure 8 Normalized mean maximum plume depth (A), maximum plume width (B). Black dash lines are the best fitting curves of two different slope cases.
We found that hmax decreases and Wmax increases with the increase of g’, which is consistent with the laboratory study of Thomas and Linden (2007). This is because the density difference between buoyant water and ambient fluid increases, and the effect of buoyancy increases, easily producing the surface-advected plumes. As g’ is larger, buoyancy drives the offshore transport further. Shelf slope has little effect on the depth, that is, hmax is approximately same in different α and the same f and g’ cases (Figure 8A), indicating hmax is mainly related to f and g’. Shelf slope has a great impact on Wmax (Figure 8B). According to the fitting curves, hmax decreases and Wmax increases rapidly with αLb/hg in gentle slope case (α = 0.1), which mean that depth and width are more sensitive to the change of plume attachment type in gentle slope case. And in this case, Wmax is larger than steep slope case. Avicola and Huq (2003) revealed that baroclinic instability in the bulge might account for its relatively large radial growth but weak vertical growth. The cyclonic vortex caused by the instability increases the offshore distance in the bulge region, which can explain why Wmax is much larger in gentle slope case.
3.2.2 Freshwater accumulated in the bulge
Here, we calculated time series of bulge volume (Vb) to characterize the freshwater accumulated in the bulge and to study the shelf slope impact (Figure 9). Vb increases with time during the exponential stage (0 – 3T), and then the growth rate gradually slows down. After 3T, the Vb difference of each case increases. We found that for the larger f, the rotation effect is greater; hence, the growth rate of Vb increases, representing more freshwater accsssssumulates in the bulge. In gentle slope case (α = 0.1), the growth rate is greater than steep slope case (α = 0.2) after 3T, which means that freshwater keeps accumulating in the bulge region, possibly caused by the baroclinic instability. The instability forms the cyclonic vortex to recirculate freshwater to the bulge region, and thus freshwater is continuously accumulated.
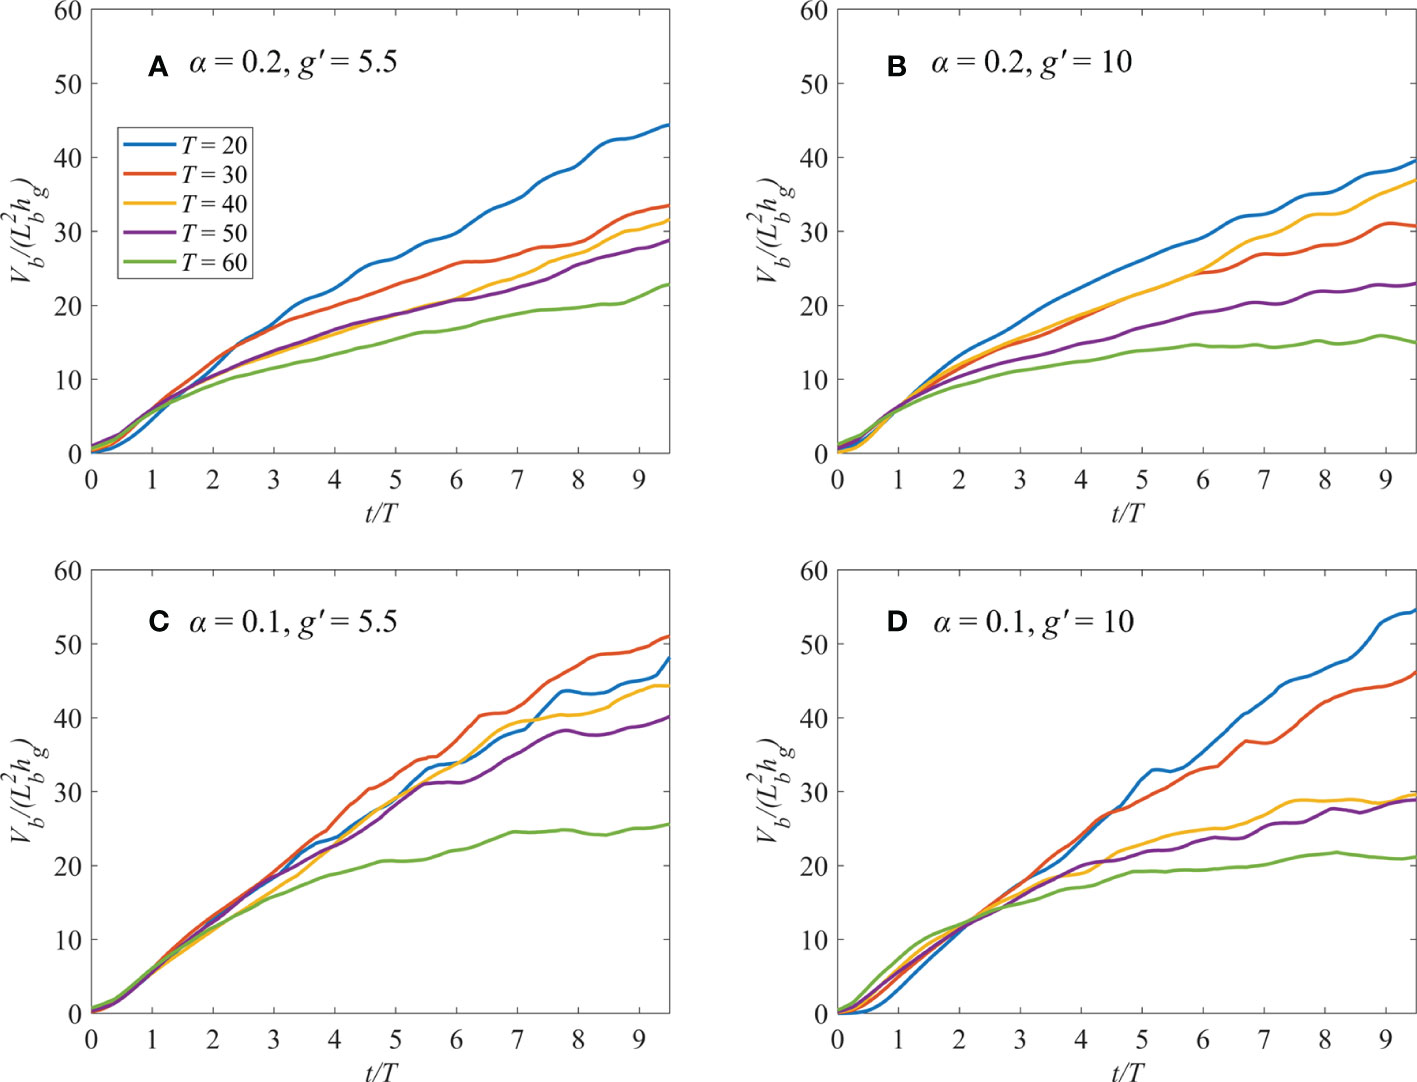
Figure 9 Time series of normalized bulge volume for different rotation rates. (A) Runs 11 – 15 (α = 0.2, g’ = 5.5 case). (B) Runs 21 – 25 (α = 0.2, g’ = 10 case). (C) Runs 31 – 35 (α = 0.1, g’ = 5.5 case). (D) Runs 41 – 45 (α = 0.1, g’ = 10 case).
We plotted stationary phase mean against Rossby number Ro (Figure 10). For a smaller g’, the buoyancy effect is small, which inhibits the diffusion of freshwater to the downstream, causing more freshwater accumulates in the bulge. In steep slope case (α = 0.2), Vb is relatively consistent compared with no-slope case (Figure 10A). In gentle slope case (α = 0.1), Vb is larger than no-slope case (Figure 10B). Baroclinic instability was observed in α = 0.1 cases, which is reported in previous experiments. Avicola and Huq (2003) found that the instability leads to the increase of bulge volume, and about 60% of source volume and density anomaly flux are stored in the bulge area. There are multiple rotating cores within the larger anticyclonic vortex, causing freshwater to accumulate in the bulge and inhibiting the transport to the downstream.
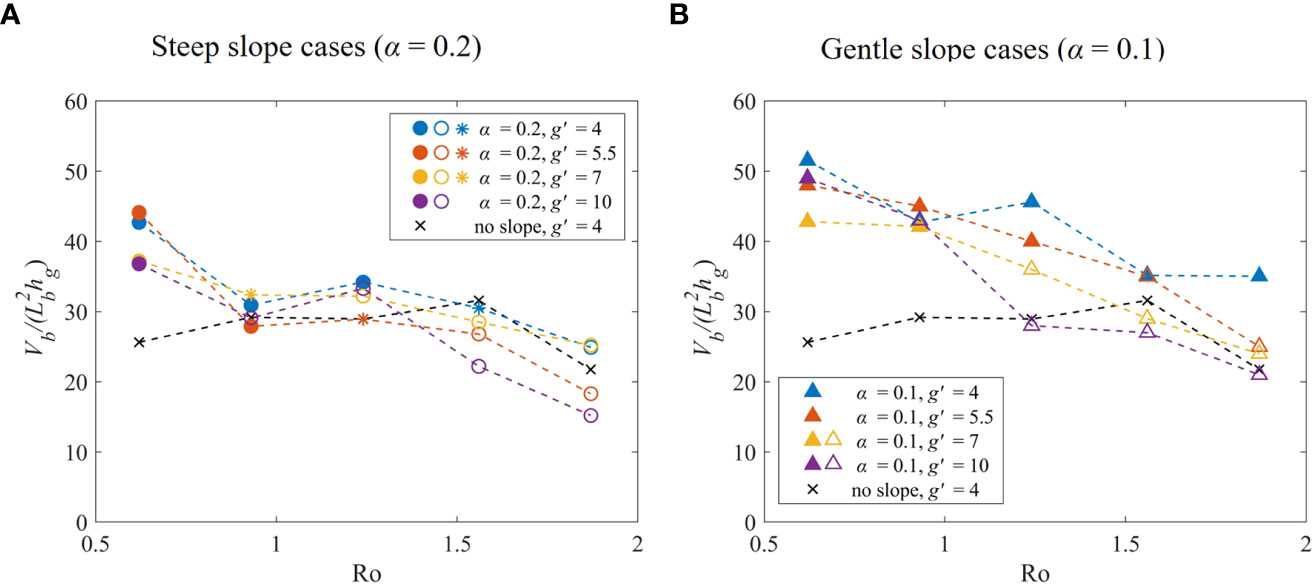
Figure 10 Normalized mean bulge volume in stationary phase (8 – 9T). Circle and triangle symbols represent steep (α = 0.2) and gentle slope (α = 0.1) cases, respectively. The solid, asterisk and hollow symbols represent bottom-attached, transitional and surface-advected plumes, respectively. Black dash lines with cross symbols are the no-slope case for comparison. The dash line represents the trend of V_b/(L_b^2h_g) changing with Ro.
3.2.3 Freshwater transported alongshore with coastal currents
Most alongshore transport occurs in the coastal current region, which is typically in geostrophic balance (Avicola and Huq, 2001). In the absence of significant external forcing, the transport is driven primarily by the plume’s buoyancy and strongly mediated by Earth’s rotation (Horner-Devine et al., 2015). In addition, shelf slope will influence the structure and transport in the coastal current (Chapman and Lentz, 1994; Yankovsky and Chapman, 1997; Avicola and Huq, 2001).
In this section, we calculated the normalized coastal current transport Qcc/Qin to study the influence of various factors (f, g’ and α) on the freshwater transport in coastal current. Freshwater transport Qcc is equal to inflow discharge rate Qin minus bulge charge rate Qb as shown below:
where .
Figure 11 shows that the coastal current is generally monitored after 1T, and it grows rapidly in exponential phase and then reaches a stationary phase with a slow growth rate. We plotted stationary phase mean Qcc/Qin against Rossby number Ro (Figure 12). The trend of Qcc/Qin with increasing Ro corresponds to Figure 10, i.e., the larger g’ and smaller f cause more freshwater transport to the downstream.
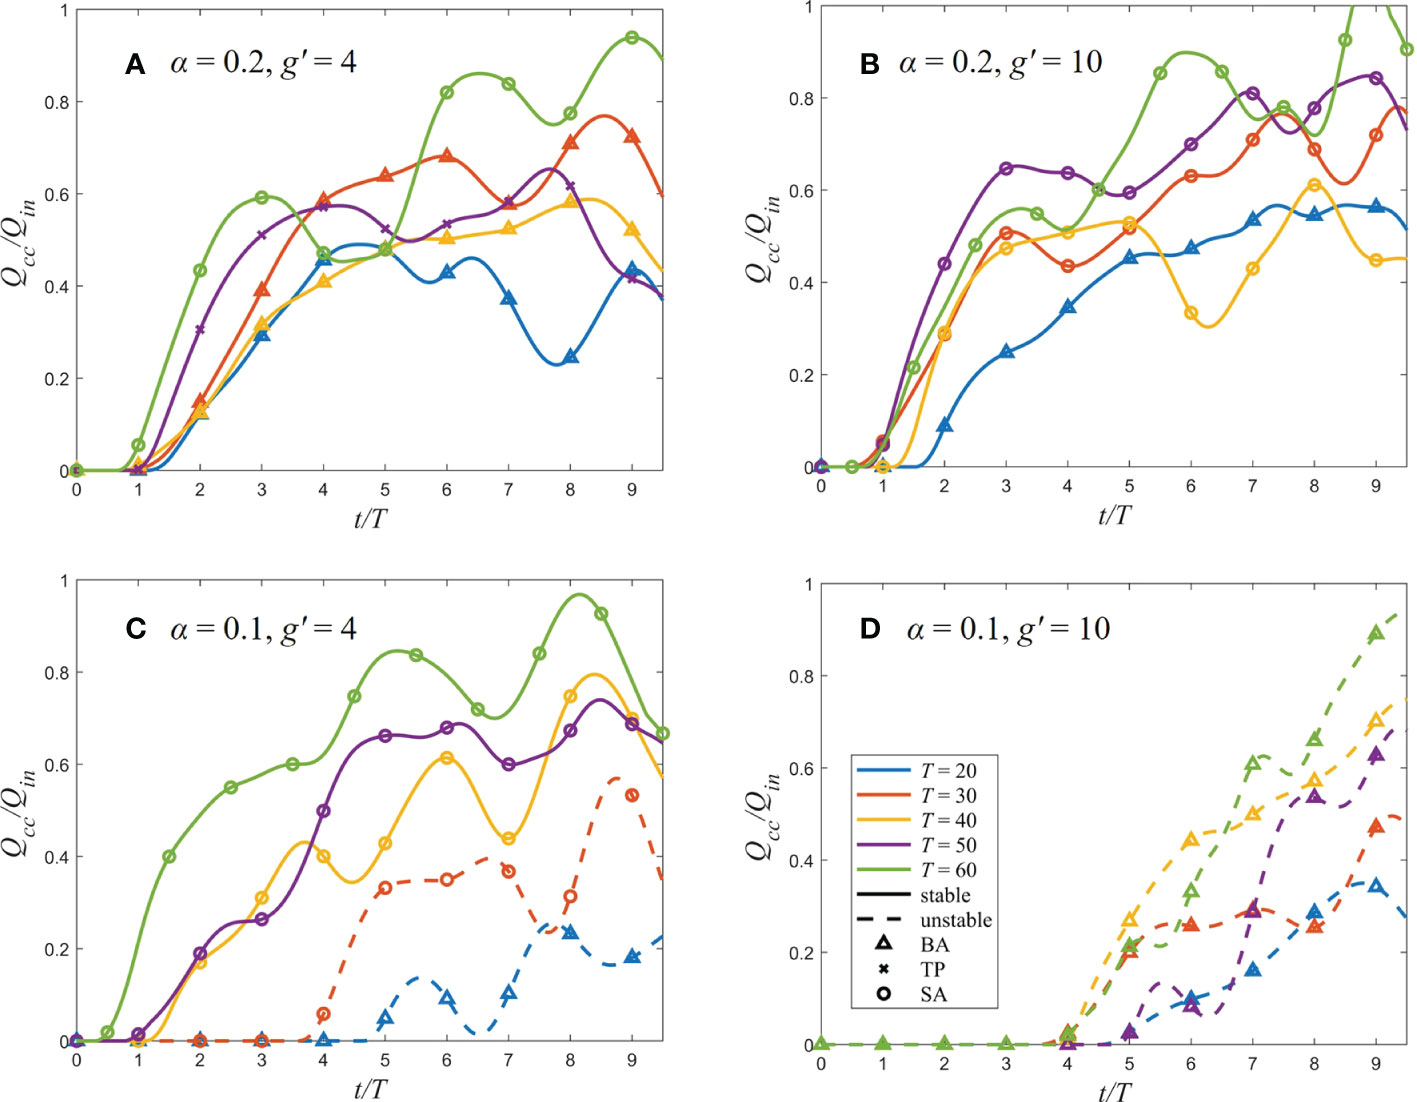
Figure 11 Time series of normalized coastal current transport of different rotation rates. (A, B) are steep slope cases, while (C, D) are gentle slope cases. For each line, solid and dash line represent the bulge as stable and unstable, respectively. The triangle, cross and circle symbols mean the plume is bottom-attached, transitional and surface-advected, respectively.
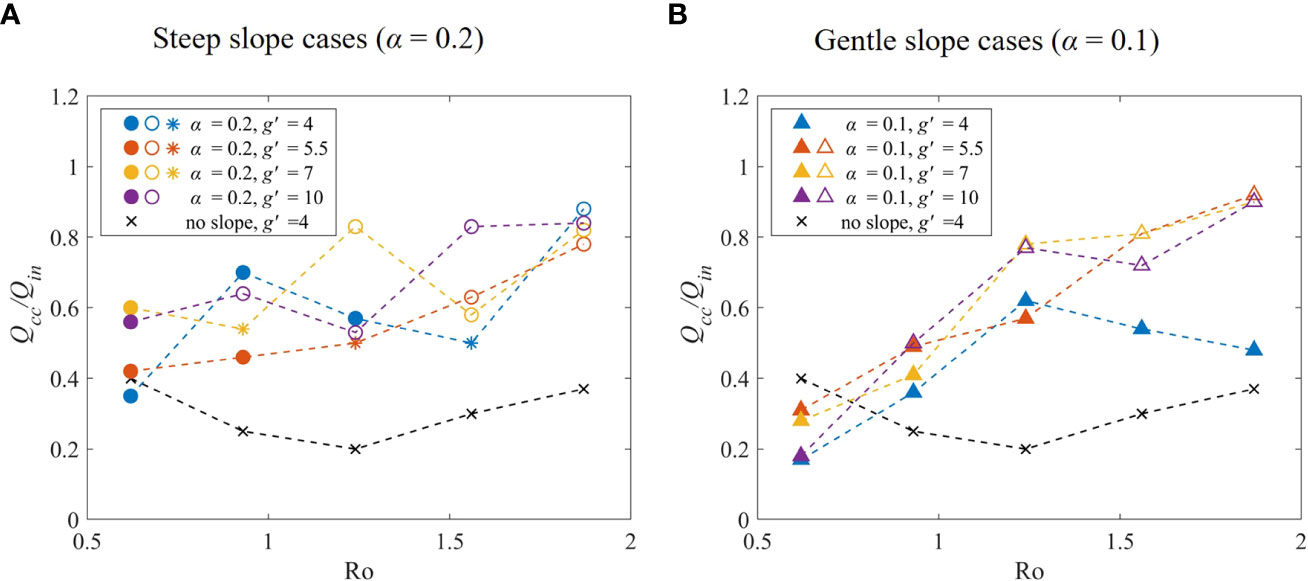
Figure 12 Normalized mean coastal current transport in stationary phase (8 – 9T). Circle and triangle symbols represent steep (α = 0.2) and gentle slope (α = 0.1) cases, respectively. The solid, asterisk and hollow symbols represent bottom-attached, transitional and surface-advected plumes, respectively. Black dash lines with cross symbols are the no-slope case for comparison. The dash line represents the trend of Q_cc/Q_in changing with Ro.
We found that Qcc/Qin is most significantly affected by shelf slope. On the one hand, it affects the growth trend of Qcc/Qin. In steep slope case (α = 0.2), Qcc/Qin reaches stability after 3 – 4 T (Figures 11A, B). In gentle slope case (α = 0.1), Qcc/Qin increases significantly after 3 – 4 T, and then there is still a slight increase trend and strong fluctuation (Figures 11C, D). And Qcc/Qin increases with the increasing Ro (Figure 12). The result is different from previous no-slope experiments of Fong and Geyer (2002), which showed that Qcc/Qin drops from 0.65 to 0.4 as Ro increases from 0.1 to 1.
On the other hand, the gentle slope promotes baroclinic instability. As shown in Figure 11, the most notable cases are unstable plumes. For example, the occurrence of coastal current is delayed to 4 – 5T with periodic oscillation (Figure 11C). Compared stable BA (Figure 11C, T = 20, 30) with unstable BA (Figure 11D, T = 20, 30), Qcc/Qin decreases by about 50%. When α is reduced from 0.2 (Figure 12A) to 0.1 (Figure 12B), Qcc/Qin changes from 40% – 80% to 20% – 80%. The lower limit is greatly reduced, and the freshwater transport is significantly reduced, especially under baroclinic instability conditions. In previous no-slope experiments, Avicola and Huq (2003) found that only approximately 1/3 of the outflow incorporates to the coastal current, with the rest going into bulge formation in the laboratory. According to Figure 12, Qcc/Qin is larger than the no-slope case except for T = 20 case, in which baroclinic instability and strong Coriolis force produce a large cyclonic vortex, which inhibits freshwater transport. We can conclude that the sloping bottom promotes freshwater transport.
4 Discussion
In nature, the plume is a very complex marine physical phenomenon because it is affected by the estuary and coastal areas, and the mixing between freshwater and saltwater is continuously changing. Therefore, in addition to the bottom topography, plumes are also affected by many factors, such as inflow conditions, Coriolis force, wind, ambient flow field, and so on (Nash and Moum, 2005). Horner-Devine et al. (2006) found that Ro reflects inflow rate and estuary size. When Ro is large, the bulge is nearly circular in shape, and most of the freshwater is trapped in the bulge region. When Ro is small, more freshwater forms coastal currents. Garvine (1999) found that as the Coriolis force decreases, more and more freshwater accumulates in the bulge region, inhibiting the formation of coastal currents in downstream. In addition, Narayanan and Garvine (2002) discovered that when other conditions remain unchanged, the inflow increase will intensify the offshore plume diffusion. External forcing agents, such as wind and ambient flows, may also influence plume behavior. Walker (1996) showed that river flow and wind are the main factors affecting the Mississippi River plume using NOAA satellite data. Fong and Geyer (2002) found that ambient flows can significantly change plume structure and freshwater transport characteristics.
In the present study, we classify plume types according to bottom attachment and bulge stability. Plume types are determined by g’, f and α, which represent the buoyancy, Coriolis force, and topography factors, respectively. Freshwater accumulation in the bulge is a way to recycle the outflow from the estuary as the inflow, which requires a large Fr (Chant et al., 2008). As g’ increases, buoyancy increases, driving plume transport and thereby promoting coastal current formation. Fong and Geyer (2002) found that the larger Ro reduces the coastal current transport in no-slope experiments. The Coriolis deflection strengthens the anticyclonic eddy, which enhances the near-field anticyclonic bulge and weakens the development of the far-field coastal jet (Chao, 1990). As f increases Coriolis force is strong, promoting freshwater accumulation in the bulge. Compared with the no-slope experiment, bottom attachment and bulge instability are two new features in our experiments. We find that sloping bottom is the most critical factor affecting plume shape and freshwater transport. Therefore, in this section, we will first discuss how the bottom attachment affects freshwater transport and their relationship with other factors.
In section 3.1, we use the bottom-slope parameter αLb/hg to classify plume types: when PCN > 1.6, the plume is bottom-attached; when PCN< 1.6, the plume is surface-advected. The transitional plume is located at the boundary, which is not the main content of this paper. For the bottom-attached plume, the freshwater, thick in bulge is trapped near the coastal wall (Figure 4), which inhibits offshore transport, resulting in a smaller bulge (Figure 1). Due to the conservation of total freshwater discharge, the alongshore coastal current transport increases. As shown in Hudson’s outflow (Chant et al., 2008), bulge formation tends to limit freshwater transport in coastal currents and enhance offshore transport. Even during a period of downwelling favorable winds, the freshwater transport in the coastal current is less than 1/2 of the estuarine freshwater outflow. Brasseale and MacCready (2021) found that the gentle slope promoted the downstream transport, while the upstream transport on the steep slope disappeared, which is consistent with our results. Therefore, we can conclude that bottom attachment promotes alongshore transport. However, in Figure 12A (stable plumes), the transport is stronger under larger Ro (T = 50) conditions of surface-advected plumes. This is because the Coriolis force is weak, possibly, and the bulge spreads very far and is close to the calculation position of the coastal current. Therefore, we may calculate some eddies as the coastal current.
It is noteworthy that the slope is far less than 0.1 in reality, but it is difficult to make a such gentle slope in our experiment. Therefore, we use the bottom-slope parameter αLb/hg instead of just α to compare with the real field work, which includes inflow discharge, slope, Coriolis force, reduced gravity, estuarine conditions and other factors. In addition, when slope is gentle, while αLb/hg becomes smaller. The data will be on the left side of the boundary shown as a bottom-attached plume. In future research, we will further discuss the application of the parameters to the real field work.
We use the instability parameter θ to classify plume types: when BIN > 0.8, the plume is stable; when BIN< 0.8, the plume is unstable. The plume instability in our experiments only occurs in α = 0.1 case, and it will occur regardless of whether the plume is in contact with the bottom. This is consistent with the study of Mississippi–Atchafalaya River plume by Hetland (2017), where they found that shelf slope determines the evolution of baroclinic instability. As shown in Figure 5, the phenomenon of baroclinic instability is that freshwater separates from the bulge and returns in the form of a cyclonic vortex, which leads to the fluctuation of Qcc/Qin (Figure 11) and Qcc/Qin decreases greatly in unstable cases (Figure 12). We can conclude that the instability inhibits freshwater transport in coastal currents. Figure 12B shows that Qcc/Qin increases with the increasing Ro in unstable plumes, which is different from the conclusion of Fong and Geyer (2002). This is because the inhibition effect of freshwater transport caused by the instability is stronger than the promotion effect caused by Coriolis force reduction and the promotion effect caused by bottom attachment in small T (large f) case. And when Ro increases, the instability is weaker, and the role of the bottom, g’ and f is gradually enhanced.
To sum up, we divide the four quadrants according to attachment and bulge instability to classify the four plume types (Figure 13). According to our experiment results, the stable surface-advected plume has the maximum alongshore freshwater transport, which occurs in the larger T (smaller f) and g’ cases, while stable bottom-attached plume has smaller alongshore freshwater transport, found in the smaller T (larger f) and g’ cases. For stable bottom-attached plumes, the bulge is elongated because it is trapped by the bottom, leading to the minimum offshore freshwater transport. In the limit of small vertical mixing and vanishing bottom drag, the difference in intrusion speeds in and out of the estuary is reduced. The seaward expansion of the bulge decreases, and the undercurrent leaks out of the bulge and propagates as the coastal current (Chao and Boicourt, 1986). The bulge area is small in steep slope case (Garvine, 1999; Avicola and Huq, 2003). A typical stable surface-advected example is the Columbia River plume, which consists of a well-pronounced anticyclonic bulge and a narrower coastal current (Jia and Yankovsky, 2012). A typical stable bottom-attached example is the Delaware plume, forming a narrow but unstable coastal jet instead of a wide and diffuse plume region (Münchow and Garvine, 1993). Shelf slope contributes to the effective diffusivity over different shelf regions, which also proves that the bottom promotes coastal current transport (Masse, 1990). For unstable plumes, the bulge shape becomes irregular. The bottom-attached cyclonic vortex generated at the bulge boundary is even larger than the anticyclonic vortex. In this case, because the plume is trapped near the coast by the bottom, it has the maximum offshore freshwater transport and minimum alongshore freshwater transport, consistent with previous observations (Yankovsky, 2004; Karageorgis et al., 2009). They found that the Danube River plume comprises several mesoscale eddies but without a coherent structure of the river plume similar to the Columbia River. The rapid growth of the cyclonic vortex contains a large amount of freshwater, which substantially (up to 35%) reduces the alongshore freshwater flux farther downstream (Jia and Yankovsky, 2012).
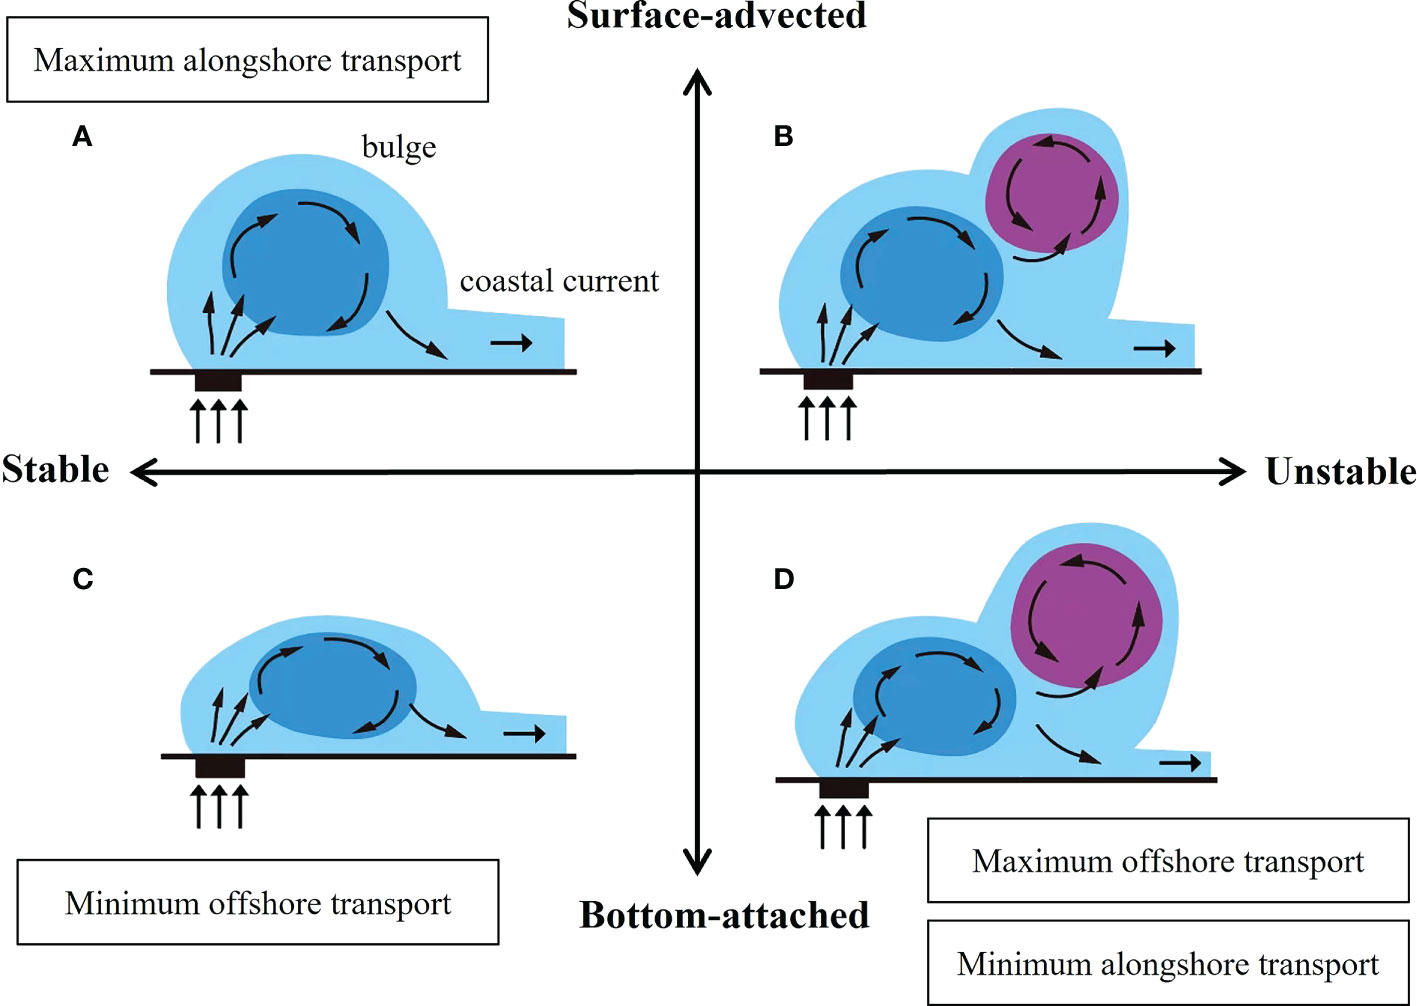
Figure 13 Schematic diagram to show the effects of bottom attachment and bulge instability on freshwater transport in the alongshore and offshore direction. (A–D) show stable surface-advected, unstable surface-advected, stable bottom-attached, and unstable bottom-attached plumes, respectively.
5 Conclusion
A series of laboratory experiments were carried out on a rotating table to simulate the evolution of plumes over the sloping bottom. During the experiment, we changed the reduced gravity g’, Coriolis parameter f, and shelf slope α to study their effects on plume characteristics, focusing on the analysis of plume types and corresponding freshwater transport.
We classify plumes according to observed phenomena and quantified parameters. According to bottom attachment of the bulge, we divide plumes into three types: bottom-attached plumes, surface-advected plumes, and transitional plumes. On the other hand, according to the bulge stability, we divide plumes into two types: stable plumes and unstable plumes. Based on our analysis, parameters PCN and BIN can be used to predict the plume types. When PCN > 1.6, the plume tends to be bottom-attached; when PCN< 1.6, the plume tends to be surface-advected. When BIN > 0.8, the plume is stable, while the plume is unstable when BIN< 0.8. These thresholds are calculated by the least-square method.
To further quantitatively study the plume characteristics, we estimated the maximum depth (hmax) and maximum width (Wmax) through the depth field. The study shows that shelf slope has little effect on the depth but a great influence on the width. hmax decreases and Wmax increases with the increasing g’ and decreasing f. For unstable cases, the width and depth fluctuate, and the width increases significantly.
We calculated the bulge volume (Vb) and the coastal current transport (Qcc/Qin) to understand freshwater transport. Due to the conservation of total freshwater discharge, the conclusions of bulge and coastal current are consistent. Bottom attachment and bulge instability are the main differences on the plume evolution over a sloping bottom. Compared with the no-slope case, the bottom traps the freshwater near the coastal wall, inhibiting offshore transport and promoting the coastal current transport. The cyclonic vortex caused by baroclinic instability strongly restricts the coastal current transport.
In summary, the plume type and freshwater transport are results of the coupling effect of g’, f and α. For stable plumes, bottom attachment promotes freshwater transport, but when the Coriolis force is very weak (small f’), the surface-advected plumes will further promote transport. For unstable plumes, when f is large, the cyclonic vortex plays a dominant role in the suppression of the transport. When f is small, bottom attachment and buoyancy play a dominant role in promoting the transport. Baroclinic instability is a critical factor restraining freshwater transport, mainly caused by the gentle slope (small α) and enhanced by strong Coriolis force (large f).
There are still some limitations in our experiments. On the one hand, the sloping bottom in laboratory experiments cannot be made at a similar slope as the actual continental shelf. It is impossible to make the slope as gentle as 0.01 (or even 0.001) in the numerical models (Yankovsky and Chapman, 1997; Brasseale and MacCready, 2021), so the bottom-attached plume we observed still has a noticeable bulge. Although we cannot simulate the phenomenon in reality, our conclusion is still applicable when the slope is very gentle. For example, inserting smaller slope values into Figures 6 and 8 still yields a similar conclusion. Moreover, if we consider the slope Burger number S = Nf–1α discussed in Hetland (2017), the ratio of bottom slope over Coriolis force is on the same range between our experiments and realistic model simulations. Based on the observation of Delaware coastal current, the bottom slope parameter αLb/hg is 0.51 (Münchow and Garvine, 1993), which is the same order of magnitude as the bottom slope parameter calculated in our experiment. Therefore, our experiments can deepen our understanding on plume evolution and be used to verify numerical models and field observations. In future research, we will change α and H0 to be closer to the real situation by numerical model. In addition, we will further discuss the application of the parameters to the real field work. On the other hand, baroclinic instability only occurs in a few conditions with α = 0.1 and small Ro. However, baroclinic instabilities may be generated or enhanced by external forces in nature, such as wind (Hetland, 2017), ambient stratification (Jia and Yankovsky, 2012), etc., which will be the direction of our further research.
Data availability statement
The raw data supporting the conclusions of this article will be made available by the authors, without undue reservation.
Author contributions
YY and Y-TL conceived the work. XT performed the experiment. YY and XT conducted analyses and drafted the manuscript. All authors contributed to the article and approved the submitted version.
Funding
This research was funded by the National Natural Science Foundation of China (Grant no. 41876089); the Science Foundation of Donghai Laboratory (Grant No. DH-2022KF01016); Zhejiang Provincial Natural Science Foundation of China (Grant no. LY20A020009).
Acknowledgments
The authors thank Professor Xu Chen, Yujun Yu and Guofeng Fu from Ocean University of China for their help to build the rotating table, and thank Haocheng Song and Ling Liu for their assistance during the experiments.
Conflict of interest
The authors declare that the research was conducted in the absence of any commercial or financial relationships that could be construed as a potential conflict of interest.
Publisher’s note
All claims expressed in this article are solely those of the authors and do not necessarily represent those of their affiliated organizations, or those of the publisher, the editors and the reviewers. Any product that may be evaluated in this article, or claim that may be made by its manufacturer, is not guaranteed or endorsed by the publisher.
References
Avicola G., Huq P. (2001). Scaling analysis for the interaction between a buoyant coastal current and the continental shelf: experiments and observations. J. Phys. Oceanogr. 32 (11), 3233–3248. doi: 10.1175/1520-0485(2002)0322.0.CO;2
Avicola G., Huq P. (2003). The characteristics of the recirculating bulge region in coastal buoyant outflows. J. Mar. Res. 61 (4), 435–463. doi: 10.1357/002224003322384889
Blanton J. O. (1981). Ocean currents along a nearshore frontal zone on the continental shelf of the southeastern united states. J. Phys. Oceanogr. 11 (12), 1627–1637. doi: 10.1175/1520-0485(1981)011<1627:OCAANF>2.0.CO;2
Brasseale E., MacCready P. (2021). The shelf sources of estuarine inflow. J. Phys. Oceanogr. 51 (7), 2407–2421. doi: 10.1175/jpo-d-20-0080.1
Chang P. H., Isobe A. (2003). A numerical study on the changjiang diluted water in the yellow and East China seas. J. Geophys. Res. Oceans 108 (C9), 1–17. doi: 10.1029/2002jc001749
Chant R. J., Glenn S. M., Hunter E., Kohut J., Chen R. F., Houghton R. W., et al. (2008). Bulge formation of a buoyant river outflow. J. Geophys. Res. 113 (C1), C01017. doi: 10.1029/2007jc004100
Chao S. Y. (1990). Tidal modulation of estuarine plumes. J. Phys. Oceanogr. 20 (7), 1115–1123. doi: 10.1175/1520-0485(1990)0202.0.CO;2
Chao S. Y., Boicourt W. C. (1986). Onset of estuarine plumes. J. Phys. Oceanogr. 16 (12), 2137–2149. doi: 10.1175/1520-0485(1986)016<2137:OOEP>2.0.CO;2
Chapman D. C., Lentz S. J. (1994). Trapping of a coastal density front by the bottom boundary layer. J. Phys. Oceanogr. 24 (7), 1464–1479. doi: 10.1175/1520-0485(1994)0242.0.CO;2
Chen S.-N. (2014). Enhancement of alongshore freshwater transport in surface-advected river plumes by tides. J. Phys. Oceanogr. 44 (11), 2951–2971. doi: 10.1175/jpo-d-14-0008.1
Dzwonkowski B., Yan X. H. (2005). Tracking of a Chesapeake bay estuarine outflow plume with satellite-based ocean color data. Cont. Shelf Res. 25 (16), 1942–1958. doi: 10.1016/j.csr.2005.06.011
Fasullo J., Dai A., Qian T., Smith L., Trenberth K. E. (2007). Estimates of the global water budget and its annual cycle using observational and model data. J. Hydrometeorol. 8 (4), 758–769. doi: 10.1175/jhm600.1
Fong D. A., Geyer W. R. (2002). The alongshore transport of freshwater in a surface-trapped river plume*. J. Phys. Oceanogr. 32 (3), 957–972. doi: 10.1175/1520-0485(2002)0322.0.CO;2
Garvine R. W. (1974). Physical features of the Connecticut river outflow during high discharge. J. Geophys. Res. 79 (6), 831–846. doi: 10.1029/JC079i006p00831
Garvine R. W. (1999). Penetration of buoyant coastal discharge onto the continental shelf: A numerical model experiment. J. Phys. Oceanogr. 29 (8), 1892–1909. doi: 10.1175/1520-0485(1999)029<1892:Pobcdo>2.0.Co;2
Hetland R. D. (2017). Suppression of baroclinic instabilities in buoyancy-driven flow over sloping bathymetry. J. Phys. Oceanogr. 47 (1), 49–68. doi: 10.1175/jpo-d-15-0240.1
Horner-Devine A. R., Fong D. A., Monismith S. G., Maxworthy T. (2006). Laboratory experiments simulating a coastal river inflow. J. Fluid Mech. 555, 203–232. doi: 10.1017/s0022112006008937
Horner-Devine A. R., Hetland R. D., MacDonald D. G. (2015). Mixing and transport in coastal river plumes. Annu. Rev. Fluid Mech. 47 (1), 569–594. doi: 10.1146/annurev-fluid-010313-141408
Horner-Devine A. R., Jay D. A., Orton P. M., Spahn E. Y. (2009). A conceptual model of the strongly tidal Columbia river plume. J. Mar. Syst. 78 (3), 460–475. doi: 10.1016/j.jmarsys.2008.11.025
Hunter E. J., Chant R. J., Wilkin J. L., Kohut J. (2010). High-frequency forcing and subtidal response of the Hudson river plume. J. Geophys. Res. Oceans 115, C07012. doi: 10.1029/2009JC005620
Jia Y., Yankovsky A. (2012). The impact of ambient stratification on freshwater transport in a river plume. J. Mar. Res. 70 (1), 69–92. doi: 10.1357/002224012800502408
Karageorgis A. P., Kourafalou V. H., Anagnostou C., Tsiaras K. P., Raitsos D. E., Papadopoulos V., et al. (2009). River-induced particle distribution in the northwestern black Sea (September 2002 and 2004). J. Geophys. Res. Oceans 114. doi: 10.1029/2009jc005460
Lentz S. J., Helfrich K. R. (2002). Buoyant gravity currents along a sloping bottom in a rotating fluid. J. Fluid Mech. 464, 251–278. doi: 10.1017/S0022112002008868
Lohan M. C., Bruland K. W. (2006). Importance of vertical mixing for additional sources of nitrate and iron to surface waters of the Columbia river plume: Implications for biology. Mar. Chem. 98 (2-4), 260–273. doi: 10.1016/j.marchem.2005.10.003
Masse A. K. (1990). Withdrawal of shelf water into an estuary: A barotropic model. J. Geophys. Res. Oceans 95 (C9), 16085–16096. doi: 10.1029/JC095iC09p16085
Masse A. K., Murthy C. R. (1992). Analysis of the Niagara river plume dynamics. J. Geophys. Res. Oceans 97 (C2), 2403–2420. doi: 10.1029/91JC02726
Mudroch A. (1983). Distribution of major elements and metals in sediment cores from the western basin of lake Ontario. J. Gt. Lakes Res. 9 (2), 125–133. doi: 10.1016/S0380-1330(83)71883-6
Münchow A., Garvine R. W. (1993). Dynamical properties of a buoyancy-driven coastal current. J. Geophys. Res. 98 (C11), 20063–20077. doi: 10.1029/93jc02112
Narayanan C., Garvine R. W. (2002). Large Scale buoyancy driven circulation on the continental shelf. Dyn. Atmos. Oceans 36 (1-3), 125–152. doi: 10.1016/S0377-0265(02)00028-3
Nash J. D., Moum J. N. (2005). River plumes as a source of large-amplitude internal waves in the coastal ocean. Nature 437 (7057), 400–403. doi: 10.1038/nature03936
Nof D., Pichevin T. (2001). The ballooning of outflows. J. Phys. Oceanogr. 31 (10), 3045–3058. doi: 10.1175/1520-0485(2001)031<3045:Tboo>2.0.Co;2
O’Donnell J. (1990). The formation and fate of a river plume: A numerical model. J. Phys. Oceanogr. 20 (4), 551–569. doi: 10.1175/1520-0485(1990)020<0551:TFAFOA>2.0.CO;2
O’Donnell J., Marmorino G. O., Trump C. L. (1998). Convergence and downwelling at a river plume front. J. Phys. Oceanogr. 28 (7), 1481–1495. doi: 10.1175/1520-0485(1998)028<1481:CADAAR>2.0.CO;2
Rabalais N. N., Turner R. E., Wiseman W. J. (2002). Gulf of Mexico hypoxia, A.K.A. “The dead zone”. Annu. Rev. Ecol. Syst. 33, 235–263. doi: 10.1146/annurev.ecolsys.33.010802.150513
Rennie S. E., Largier J. L., Lentz S. J. (1999). Observations of a pulsed buoyancy current downstream of Chesapeake bay. J. Geophys. Res. Oceans 104 (C8), 18227–18240. doi: 10.1029/1999jc900153
Sanders T. M., Garvine R. W. (1996). Frontal observations of the Delaware coastal current source region. Cont. Shelf Res. 16 (8), 1009–1021. doi: 10.1016/0278-4343(95)00043-7
Saunders P. M. (1973). The instability of a baroclinic vortex. J. Phys. Oceanogr. 3, 61–65. doi: 10.1175/1520-0485(1973)003<0061:TIOABV>2.0.CO;2
Thomas R. L. (1983). Lake-Ontario sediments as indicators of the Niagara river as a primary source of contaminants. J. Gt. Lakes Res. 9 (2), 118–124. doi: 10.1016/s0380-1330(83)71882-4
Thomas P. J., Linden P. F. (2007). Rotating gravity currents: small-scale and large-scale laboratory experiments and a geostrophic model. J. Fluid Mech. 578, 35–65. doi: 10.1017/S0022112007004739
Walker N. D. (1996). Satellite assessment of Mississippi river plume variability: Causes and predictability. Remote Sens. Environ. 58 (1), 21–35. doi: 10.1016/0034-4257(95)00259-6
Wang B. (2006). Cultural eutrophication in the changjiang (Yangtze river) plume: History and perspective. Estuar. Coast. Shelf Sci. 69 (3-4), 471–477. doi: 10.1016/j.ecss.2006.05.010
Wu T., Wu H. (2018). Tidal mixing sustains a bottom-trapped river plume and buoyant coastal current on an energetic continental shelf. J. Geophys. Res. Oceans 123 (11), 8026–8051. doi: 10.1029/2018JC014105
Yankovsky A. E. (2004). Interaction of transient shelf currents with a buoyancy-driven coastal current. J. Mar. Res. 62 (4), 545–563. doi: 10.1357/0022240041850066
Yankovsky A. E., Chapman D. C. (1997). A simple theory for the fate of buoyant coastal discharges*. J. Phys. Oceanogr. 27 (7), 1386–1401. doi: 10.1175/1520-0485(1997)027<1386:Astftf>2.0.Co;2
Yuan Y., Avener M. E., Horner-Devine A. R. (2010). A two-color optical method for determining layer thickness in two interacting buoyant plumes. Exp. Fluids 50 (5), 1235–1245. doi: 10.1007/s00348-010-0969-y
Yuan Y., Horner-Devine A. R., Avener M., Bevan S. (2018). The role of periodically varying discharge on river plume structure and transport. Cont. Shelf Res. 158, 15–25. doi: 10.1016/j.csr.2018.02.009
Keywords: river plume, bottom attachment, bulge instability, plume classification, freshwater transport, laboratory experiments, rotating table
Citation: Yuan Y, Tan X and Lin Y-T (2023) Effect of sloping bottom on river plume dynamics on a laboratory-scale rotating table. Front. Mar. Sci. 10:1126088. doi: 10.3389/fmars.2023.1126088
Received: 17 December 2022; Accepted: 21 February 2023;
Published: 03 March 2023.
Edited by:
Zhiyu Liu, Xiamen University, ChinaReviewed by:
Chunyan Li, Louisiana State University, United StatesShuang-Xi Guo, South China Sea Institute of Oceanology (CAS), China
Copyright © 2023 Yuan, Tan and Lin. This is an open-access article distributed under the terms of the Creative Commons Attribution License (CC BY). The use, distribution or reproduction in other forums is permitted, provided the original author(s) and the copyright owner(s) are credited and that the original publication in this journal is cited, in accordance with accepted academic practice. No use, distribution or reproduction is permitted which does not comply with these terms.
*Correspondence: Ying-Tien Lin, a2V2aW5saW5Aemp1LmVkdS5jbg==
 Yeping Yuan
 Xinyu Tan
 Ying-Tien Lin