 Heng Chen
 Kaixuan Huang1,2†
 Wanchun Guan
 Songhui Lu
95% of researchers rate our articles as excellent or good
Learn more about the work of our research integrity team to safeguard the quality of each article we publish.
Find out more
ORIGINAL RESEARCH article
Front. Mar. Sci. , 08 February 2023
Sec. Marine Biology
Volume 10 - 2023 | https://doi.org/10.3389/fmars.2023.1119370
This article is part of the Research Topic Interactions between the Adaptability of Marine Organisms and Environmental Factors View all 5 articles
Introduction: Diarrhetic shellfish toxins (DST) harm shellfish aquaculture and endanger human health, and include well-known marine dinoflagellate-produced toxins such as okadaic acid (OA) and analogues, such as dinophysistoxin-1 (DTX-1). Toxin-producing species have different toxin profiles and contents, with unclear interactions, with the toxins hypothesized to be produced under stress conditions.
Methods: Five morphotypes of Prorocentrum lima complex, a well-studied DST-producing species with remarkable phylogenetic variability, were chosen and exposed to three distinct light conditions (photosynthetic active radiation, PAR; PAR+UVA; PAR+UVA and UVB) for 18 or 24 days.
Results and discussion: The studied morphotypes were classified as either light-sensitive (LS) or light-tolerant (LT) types based on their light responses and varying abilities to produce DTX-1 across three orders of magnitude (0.001-1 pg cell-1 d-1, abbreviated as LL, ML, and HL in order of rank). All toxin production rates (Rtox) initially increased and then decreased, with the first peaks varying between days 3 to 12. The results of earlier peaks in LL and ML and a linear correlation between Rtox values for OA and DTX-1 in HL indicated that the two compounds may be competitive. When light conditions initially altered, Rtox was either stagnant or negative under all light treatments in the LS cohort, and with UV addition in LT, which subsequently delayed the early peaks. The Rtox data for DTX-1 all demonstrated earlier and higher peaks with UVA addition in LL and ML. Likewise, their growth was facilitated following the addition of UVA light. Therefore, Rtox of pre-peaks is relevant to photosynthetic status and photoprotection ability. As decreasing Rtox data points corresponded closely with phosphate depletion, the phosphate consumption rate was calculated and shown to be linearly or exponentially associated with all downward Rtox. This study proposes a supply-demand link between photosynthetic products and phosphate with DST biosynthesis, inferring a likely competitive interaction between OA and DTX-1 production.
Diarrhetic shellfish poisoning (DSP) is a gastrointestinal disease with syndromes of diarrhoea, vomiting, and abdominal cramps, described by Yasumoto et al. (1978) and caused by the ingestion of contaminated shellfish. The primary toxins include okadaic acid (OA), dinophysisitoxin-1 (DTX-1), and analogues, which are referred to as diarrhetic shellfish toxins (DST). These toxins were isolated from the dinoflagellate genus Dinophysis and some benthic Prorocentrum species in previous studies (Yasumoto et al., 1980; Murakami et al., 1982; Pleasance et al., 1990; Hu et al., 1992; Hu et al., 2010; Luo et al., 2017). Worldwide DSP outbreaks are mainly attributed to plankton of the Dinophysis genus, which easily accumulates in filter-feeding bivalves such as mussels or oysters (Reguera et al., 2012; Mackenzie, 2019; Young et al., 2019; Martino et al., 2020), and less frequently to P. lima (Koike et al., 1998; Nascimento et al., 2005; Mafra et al., 2019). DST are potent inhibitors of protein phosphatases, modulating neurotransmitters to cause DSP syndromes (Cohen et al., 1990; Valdiglesias et al., 2013; Louzao et al., 2015). Moreover, OA can induce cytotoxicity and cancer promotion during chronic exposure experiments despite no human fatalities recorded from DSP (Vilariño et al., 2018; Fu et al., 2019), raising concerns about DST for public health and decreasing socio-economic outcomes. So far, approximately 11,000 DSP events have been reported, and emerging databases indicate a clear increasing trend of global records regarding the DSP-causing organism Dinophysis and harmful DST events (Hallegraeff et al., 2021). To manage the risk of DST on food safety, the European Food Safety Authority (EFSA, 2009) have defined the maximum permitted limit of 160 μg OA per kg of shellfish meat.
In the past two decades, numerous outcomes of variations in critical factors (e.g., light and macronutrient levels) on DST production have been investigated, mainly concerning benthic Prorocentrum species (reviewed by Lee et al., 2016), following the successful establishment of a mixotrophic culture of Dinophysis (Park et al., 2008). However, some contradictory results require further investigation and re-examination.
Limitation of the nitrate and phosphate macronutrients, along with other stress conditions, hinder the growth and increased DST quota per cell in Prorocentrum species (Vanucci et al., 2010; Varkitzi et al., 2010; reviewed by Lee et al., 2016 and Camacho-Muñoz et al., 2021). The carbon nutrient balance hypothesis (CNBH) assumes that the synthesis of phycotoxins increases survival under these unfavorable conditions (Ransom Hardison et al., 2012; Hardison et al., 2014). Elements of nitrate and phosphate are necessary for the cell growth of the Dinophysis and Prorocentrum species. Dinophysis cannot utilize dissolved nitrate and phosphate, obtaining energy for maintenance and growth through a combination of autotrophy and heterotrophy (Tong et al., 2015). The toxin production significantly increased with the addition of dissolved organic substances that originated from the ciliate prey Myrionecta rubra (Nagai et al., 2011), which did not support the observed outcomes of CNBH on DST production. This hypothesis should be re-examined in DST-producing Prorocentrum.
As toxin-producing Dinophysis and Prorocentrum species are all photosynthetic organisms, photosynthesis should be pivotal for toxin production, providing carbon skeleton and reduction forces (García-Portela et al., 2018). Indeed, DST of both genera could not be synthesized under dark conditions (Pan et al., 1999; Tong et al., 2011). Immuno-labeling experiments confirmed OA cellular location on chloroplasts and the peripheral cytoplasm, suggesting OA is likely to be a product of photosynthesis (Zhou and Fritz, 1994; Barbier et al., 1999). However, OA quotas decreased under high light conditions, even though light levels did not reach saturation for growth. For example, the lowest OA content under 5000 lx (~100 μmol photons m-2 s-1) in P. hoffmannianum (Morton et al., 1994), the maximum OA content at 20 μmol photons m-2 s-1 in P. belizeanum (López-Rosales et al., 2014), and a significant decrease of OA content starting at 50 μmol photons m-2 s-1 in P. lima (Praptiwi, 2014). Though the cellular OA and DTX-1 contents varied insignificantly between 65 and 300 μmol photons m-2 s-1 in D. acuminata, the toxin production rate decreased from 65 to 145 μmol photons m-2 s-1 (Tong et al., 2011). However, DST levels in D. acuta and D. acuminata significantly increased between 10 to 370 μmol photons m-2 s-1 (García-Portela et al., 2018). These results suggest a complex response of DST production to irradiation.
Field populations of these toxic Prorocentrum species displayed broad variations in depth distribution, variant habits and multiple substrates for attachment (Richlen and Lobel, 2011; Cohu et al., 2012; Lee et al., 2020; Nishimura et al., 2020). Such board niches should be correlated with enhanced light adaption to endure extreme light conditions like dim or excessive light or the ultraviolet radiation of solar irradiance. Previously, UVA (315-400 nm) and UVB (280- 315 nm) were reported to have different effects on growth in P. lima under solar irradiation. When light was limited, UVA could enhance growth, whereas UVB waveband was the primary signal for synthesizing ultraviolet absorption compounds for self-protection (Chen et al., 2021). In addition, some phylotypes/subclades of P. lima were only found in shallow or deep waters (Nishimura et al., 2020). David et al. (2018) examined non-significant differences in photoacclimation traits among the strains of P. lima isolated from different environments but with the same ribotype.
Toxin profiles are not only correlated with photosynthetic traits but also with phylogenetic information. P. lima and P. faustiae can produce OA and DTX-1, while P. hoffmannnianum and P. rhathymum only synthesize OA. Some members even have undetected DST levels (Luo et al., 2017; Lee et al., 2020). P. lima, referred to as P. lima complex due to the high variation in morphology (Aligizaki et al., 2009), has been intensively studied. All strains contain OA and also DTX-1 as a minor toxin. Zhang et al. (2015) identified five morphotypes of the P. lima complex, which was also supported by molecular analysis. Subsequently, one of the morphotypes was identified as a novel species, P. caipirignum, that produces the fast-acting toxin prorocentrolide (Nascimento et al., 2017). Two hundred forty-three clonal strains of P. lima complex and P. caipirignum showed phylotype-based toxin profiles with highly divergent DTX-1 levels (Nishimura et al., 2020). The strains from P. lima complex subclades 1e and 1f produced DTX-1 more efficiently than from other subclades (Nishimura et al., 2020; Hashimoto et al., 2021).
Given such high intra-species physiological and genetic variations of the P. lima complex, such variations may reduce or complicate the significant effects of essential factors on DST production. In this study, five representative morphotypes of the P. lima complex and P. caipirignum were selected, as identified by Zhang et al. (2015) (Figure S.1), to minimize the possible bias due to a specific strain. Here, three different light conditions: photosynthetic active radiation (PAR, 400-700 nm), PAR plus UVA (PA, 315-700 nm), and PAR plus UVA and UVB (PAB, 280-700 nm), were applied to expose morphotypes for 18 or 24 days. Sampling occurred every three days, resulting in 699 data points of DST. Short-term exposure to the addition of ultraviolet radiation (UVR) examined different photo-physiological traits of these morphotypes (see Figure S.2, aside from the strain WZD145 of morphotype 2 obtained after the light exposure experiment). The net toxin production rate (Rtox) was calculated, a new indicator in Prorocentrum studies that eliminates the impact of cell division on DST production, thereby enabling the actual DST production to be assessed. The effects of different responses to UVA and UVB and the extreme variations in the DTX-1 production capacity of studied morphotypes on Rtox were analyzed. Finally, the relationships between Rtox with macronutrient levels and growth rates during the culture are explored. The regulation patterns of light exposure and macronutrient availability on DST production and the interaction between OA and DTX-1 are presented.
Four P. lima complex strains, BS4F5 (morphotype 1), WZD145 (morphotype 2), SD4 (morphotype 3), and DS4G4 (morphotype 5), and one P. caipirignum strain, SE10 (morphotype 4), were cultured in natural seawater (salinity 30) enriched with f/2 medium and stored at 25°C in a thermostatic room under 100 μmol photons m-2 s-1 light intensity (light: dark=12h: 12h). After short-term UVR exposure, strains BS4F5 and DS4G4 were found to be sensitive to UVR, strain SE10 had moderate sensitivity, and strain SD4 was light tolerant (Figure S.2). Strain WZD145 was obtained after the light exposure experiment. The results of these four morphotypes were significant and sufficient for proving diversity in their photo-physiological traits. Hence, the short-term UVR exposure was not repeated on the strain WZD145.
The five P. lima complex/P. caipirignum strains were treated under three different light conditions (PAR, PA, and PAB) for 18 days or 24 days. Cell division, photosynthetic status, and nutrient availability, were all dynamic during the batch culture. Together with strain-specific traits, these factors may have had impacts on the production of toxin. As a result, samples of cell density, nutrient concentration, photosynthetic response parameters, and toxin contents were taken every three days. This allowed for a more thorough description of the strain-specific traits and helped uncover the factors that drive toxin production with such adequate comparisons.
Chlorophyll a (Chl a) fluorescence, pigment and mycosporine-like amino acids (MAAs) content, which are types of UV-absorption compounds, were used to detect the photosynthetic responses. Maximum quantum efficiency (Fv/Fm), rapid fluorescence transient (OJIP) curve, and non-photochemical quench (NPQ) were the parameters of Chl a fluorescence that, respectively, representing photosynthesis activity, electron transport between two photosystems, and photoprotection by energy dissipation. Additionally, measurements of the Chl a fluorescence’s excitation and emission spectra were made to reflect photosynthetic spectra. These chosen strains were then categorized according to their various photoacclimation characteristics.
With the exception of DST concentration per mL and per cell, the analysis of DST production focused more on the net toxin production rate (Rtox, pg cell-1 d-1), which eliminated the impact of cell division. To assess the effects of nutrients and growth on the production of DST, the nitrite and phosphate consumption rates (CDIN and CDIP, pmol cell-1 d-1) and growth rate (μ, d-1) were calculated and correlated with Rtox. Finally, based on these variations in strain-specific traits, light treatments, growth rate, and nutrient consumption, the driving forces on Rtox were inferred.
Cells at the exponential growth phase were diluted 1:4 with an f/2 culture medium to a volume of 1.5 L in quartz tubes (Ø=10 cm, height 30 cm) in triplicate. The tubes were covered with different long-pass filters, including 395 nm filters (Ultraphan Digefra, Munich, Germany), 320 nm filters (Montagefolie, Folex, Dreieich, Germany) and 295 nm filters (Ultraphan, Digefra, Munich, Germany) and were exposed to artificial light sources (light: dark=12h: 12h), resulting in the PAR, PA (PAR+UVA), and PAB (PAR+UVA+UVB) treatment groups.
The PAR, UVA and UVB light sources were supplied by a light-emitting diode (Opple, China), UVA lamp (Philips, TL-D, German) and UVB lamp (Sankyo Denki, G15TBE, Japan), respectively. The light spectra were measured using a spectrometer (Hopoocolor, China) as previously described (Chen et al., 2021). The light intensities were measured using QSI2100 (Biospherical Instruments Inc, USA) and PMA2100 (Solar Light, USA) devices, which recorded the intensities of PAR, UVA and UVB as 300 μmol photons m-2 s-1, 4.8 W/m2, and 0.05 W/m2, respectively. The exposure to PAR, extra UVA and/or UVB produce different levels of photoinhibition in these strains. The light intensity settings for UVA and UVB permitted the survival of these strains. All strains were acclimated under each treatment for 24 days, except strain SD4, which was acclimated for 18 days. All strains were sampled every three days. Before sampling was conducted, cells at the bottom of each tube were resuspended using a magnetic stirrer controlled by a Teflon rotor.
Cell suspensions were fixed in final 1% Lugol’s solution, and cell counts (Ct) were determined under a microscope. The specific growth rates (μ) of dinoflagellates were calculated using the following equation:
In Eq. 1, C1 and C2 represent the concentrations of cells at time 1 (t1) and time 2 (t2), respectively.
UVR-induced inhibition of growth was calculated using
In Eq. 2, CP and CX are the cell densities under the PAR and PAB treatments, respectively.
Rapid fluorescence transient (OJIP) curves were obtained for 15-min dark-adapted samples using a portable PAM fluorometer (Photon Systems Instruments, AP100, Czech Republic). The whole protocol lasted 2 s. The intensities of chlorophyll fluorescence at minimum (50 μs), J-step (2 ms), I-step (30 ms), and maximum were denoted as F0, FJ, FI, and FM, respectively, and used for further calculations. VJ, the electron transport efficiency to plastoquinone A (QA), was calculated as (FJ-F0)/(FM-F0). VI, the electron transport efficiency from QA to plastoquinone B (QB), was calculated as (FI-F0)/(FM-F0) (Strasser et al., 2000). The OJIP curves were double-normalized as (Ft-F0)/(FM-F0). Ft represented instantaneous chlorophyll fluorescence.
The Fluorescence profiles of the cell suspensions were captured with a fluorescence spectrophotometer (Hitachi, F-4600, Japan) at a scan rate of 120 nm min-1. To determine the chlorophyll fluorescence when excited by the UVR waveband, excitation spectra were collected for samples at an emission Λ of 685 nm (excitation Λ range = 280-400 nm). A Λ650 nm long-pass filter was employed to prevent the entry of any excitation wavelengths shorter than Λ650 nm. The excitation spectra were calibrated using a Rhodamine B solution. Fluorescence emission spectra were collected from samples using an excitation Λ of 360 nm (emission Λ range = 400-700 nm).
Samples of 15 mL cell suspensions were frozen with liquid nitrogen and stored at -80°C before analysis. Thawed samples were concentrated on 25 mm GF/F filters (Whatman, UK) and extracted in 1.0 mL 90% acetone (HPLC grade, Sigma, USA) at 4°C for 12 h in the dark. The extracts were then filtered through 25 mm 0.2 μm Nylon filters to remove cell and filter debris. 100 μL of each sample was injected into an HPLC system (Agilent 1200, USA) with a ZORBAX SB-C18 column (5 μm, 4.6×150 mm, Agilent, USA). Pigment separation was performed according to Barlow et al., 1993. Chlorophylls and carotenoids were detected using diode-array spectroscopy at 440 nm. Pigment peaks were identified and quantified by comparing retention times and contents with those of pure standards: chlorophyll a, peridinin, diadinoxanthin, diatoxanthin, chlorophyll c2, and β-carotene (ChromaDex, USA).
Samples of 15 mL cell suspensions for the analyses of MAAs were concentrated onto 25 mm GF/F filters (Whatman, UK) and extracted in 2.0 mL of 20% methanol (HPLC grade, Sigma-Aldrich, USA) for 24 h at 37°C in the dark. The methanol extracts were frozen to dryness and reconstituted in 1 mL of 100% methanol. The extracts were evaporated to dryness at 45°C. The residues were re-dissolved in 200 μL of Milli-Q water and filtered through 0.2 μm pore syringe filters for HPLC analyses. 100 μL of each sample was injected into an HPLC system (Agilent 1200, USA) with a ZORBAX SB-C18 column (5 μm, 4.6×150 mm, Agilent, USA). MAAs were separated using a solvent gradient system, as described by Taira et al. (2004). MAAs were determined using absorbances at 310 nm and 334 nm and scanned absorption between 280 to 400 nm. The MAA extracts were identified per the retention time and maximum absorption wavelength, being further verified using liquid chromatography coupled to tandem mass spectrometry using LC-ESI-Q-TOF-MS (LC-MS, TripleTOF 5600+, AB SCIEX, USA) (Lalegerie et al., 2019). Due to the lack of commercial standards for MAAs, the extinction coefficients ϵ (mol L-1 cm-1) at the wavelengths of maximum absorption of the identified MAAs as referred by Taira et al. (2004) were used, for shinorine (λmax = 334 nm, 44,700), porphyra-334 (λmax = 334 nm, 43,200), palythine (λmax = 320 nm, 36,200), mycosporine-glycine (λmax = 310 nm, 28,100), and palythene (λmax = 360 nm, 50,000). The MAAs concentrations (C, mol mL-1) were calculated using the method by Torsi et al. (1990).
In Eq. 3, F represents the flow rate (mL min-1), S is the area of peak (AU×min), ρ (cm) is the cell thickness, and V (mL) is the injection volume.
The culture solutions after GF/F filtering were submitted to flow injection analysis (HACH, QC8500 S2, USA) to analyze the concentrations of nitrate and phosphate, which were measured using cadmium column reduction and phosphomolybdenum blue colorimetry. The nitrate and phosphate contents were calibrated with standard materials purchased from the National Marine Environmental Monitoring Centre (NMEMC, China). The nutrient consumption rates (Cnutrient) were calculated using Eq. (4):
Nt represents the nutrient concentration at the time point. Nitrogen and phosphate consumption rates were represented as CDIN and CDIP, respectively.
Samples of 30 mL cell suspensions for the analysis of DST were harvested using centrifugation at 1250 g for 10 min and reconstituted in 500 μL methanol. The methanol extracts were sonicated in an ice bath for 20 min and filtered through pore syringe filters (0.22 μm). DSP toxins were analyzed using liquid chromatography coupled to tandem mass spectrometry (LC-MS/MS, QTRAP 4500, AB SCIEX, USA) as described in Krock et al. (2008). OA and DTX-1 were quantified by external calibration using seven gradients of mixed standard solutions purchased from the National Research Council (NRC, Canada).
The cellular toxin content resulted from the concentration of toxin, Tt (amount of toxin mL-1), divided by Ct (cells mL-1). To eliminate the effect of cell division on toxin production, the net toxin production rate Rtox (toxin cell-1 d-1) was determined using Eq. 5 (Anderson et al., 1990):
where is the average cell density, as per Eq. 6:
All statistical analyses were performed using SPSS, version 25.0 (IBM, USA), and triplicate measurements’ data are expressed as the average ± standard deviation (SD). Analysis of variance (two-way ANOVA) followed by Tukey’s post hoc HSD test was used to examine differences between treatments. The relationship between Rtox and CDIP was analyzed using linear or exponential regression in the OriginPro 2021 software. Linear relationships were examined using Linear Fit with X Error, and Least-squares Linear regression was performed using the computation method of York. Non-linear curves were fitted using the Non-Linear Curve Fit tool, and exponential regression was performed with Orthogonal Distance Regression (Pro), which supports both x and y weights. The x and y errors were weighted by 1/σi2, where σi is the error value. The data for cell density, toxin content and nutrient concentrations from previous studies were obtained using the Digitize Image function of OriginPro 2021. The Rtox values were calculated according to Eq. 5. The relationships between OA and DTX-1 among the strains from the current and previous studies were examined independently using the Linear Fit tool of OriginPro 2021.
The cell density steadily increased from day 0 to 18 for all cases and then either slowly increased or did not increase for all morphotypes under PAR light conditions (Figure 1). The growth rates from day 0-18 under PAR varied from 0.087 d-1 (SD4) to 0.123 d-1 (SE10, Figure S.3). UVA (PA compared to PAR) and UVR (PAB compared to PAR) comparisons showed that both had effects on growth. UVA addition significantly enhanced the final cell densities of strains BS4F4, WZD145 and strain SE10 by 26.6%, 35.1%, and 40.3%, respectively, on day 24 (one-way ANOVA, p< 0.05) but did not affect those of strains SD4 and DS4G4 (Figure 1). The final cell densities of strains BS4F5 and DS4G4, sensitive to short-term exposure of UVR (Figure S.2), were also decreased 26.5% and 76.8% by UVR, respectively, while other strains were not affected (one-way ANOVA, p > 0.05).
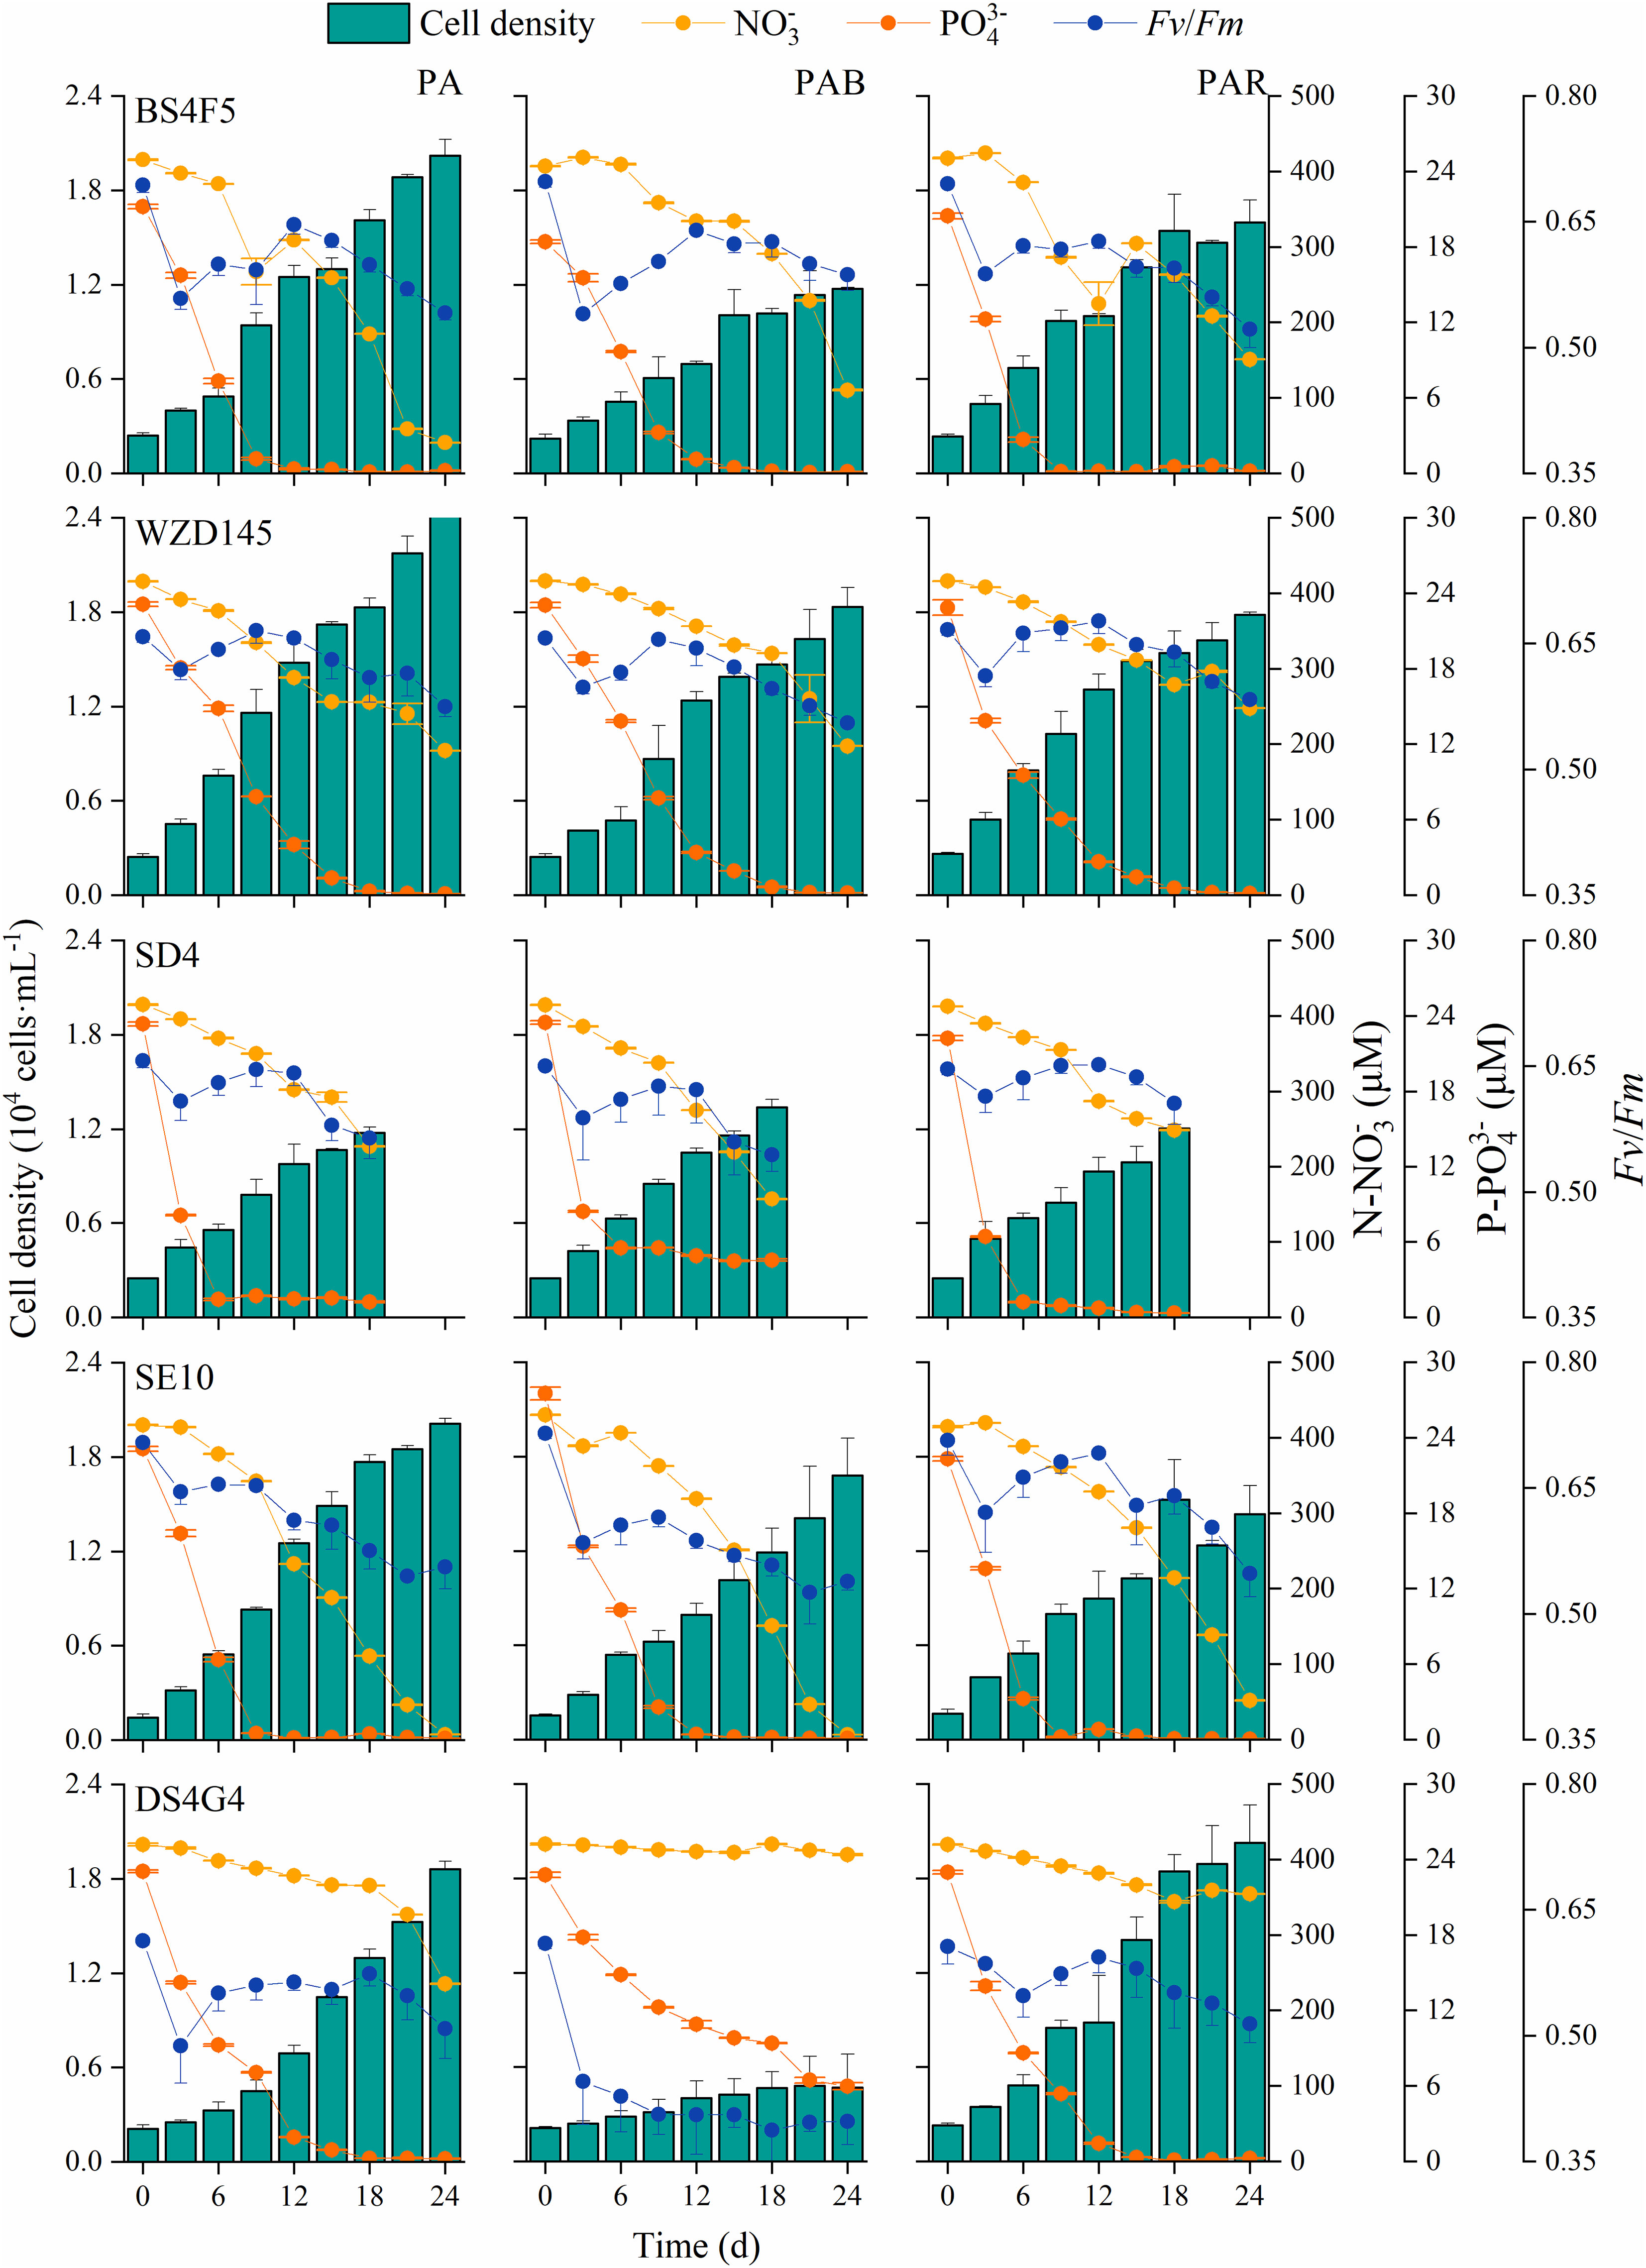
Figure 1. Cell growth, nutrient available and photosynthetic activity during the culture. Cell density, concentrations of nitrate and phosphate, and Fv/Fm of five strains of P. lima complex and P. caipirignum (strain SE10) under PA, PAB and PAR treatments for 18 or 24 days.
Regarding macronutrient levels during the culture, nitrogen was not depleted in the medium for any strains during the experiment, with the lowest concentration of 6.3 μmol mL-1 in strain SE10 under PAB on day 24 (Figure 1). Phosphate was depleted in the medium or was not consumed in strain SD4 under PA and PAB in the middle stage of culture (approximately on day 12). An exception was strain DS4G4 under PAB, which still had 5.9 μmol P mL-1 on day 24 (Figure 1). The time of phosphate depletion corresponded with the second decrease in Fv/Fm, reflecting photosynthetic activity. The first decrease of Fv/Fm occurred on day 3. Then, Fv/Fm started to recover in all cases except strain DS4G4 under PAR, which started on day 6, and it under PAB, which failed to recover (Figure 1).
The five strains had similar responses regarding Chl a fluorescence and pigment ratios, so they were pooled to analyze the effects of the varying light treatments. The excitation spectra showed that Chl a fluorescence (685 nm) was mainly excited at the UVA waveband (320-400 nm, Figure S.4). Chl a, which yields fluorescence at 685 nm, was excited by light at 360 nm. Thus, UVA could power photosynthesis in P. lima complex and P. caipirignum (Figure 2A, for specific variances among strains, see Figure S.5). After acclimation to UVA addition (PA), Chl a fluorescence at 685 nm was enhanced. In contrast, UVB addition (PAB) caused fluorescence at 685 nm to be reduced to the level of PAR condition (Figure 2A).
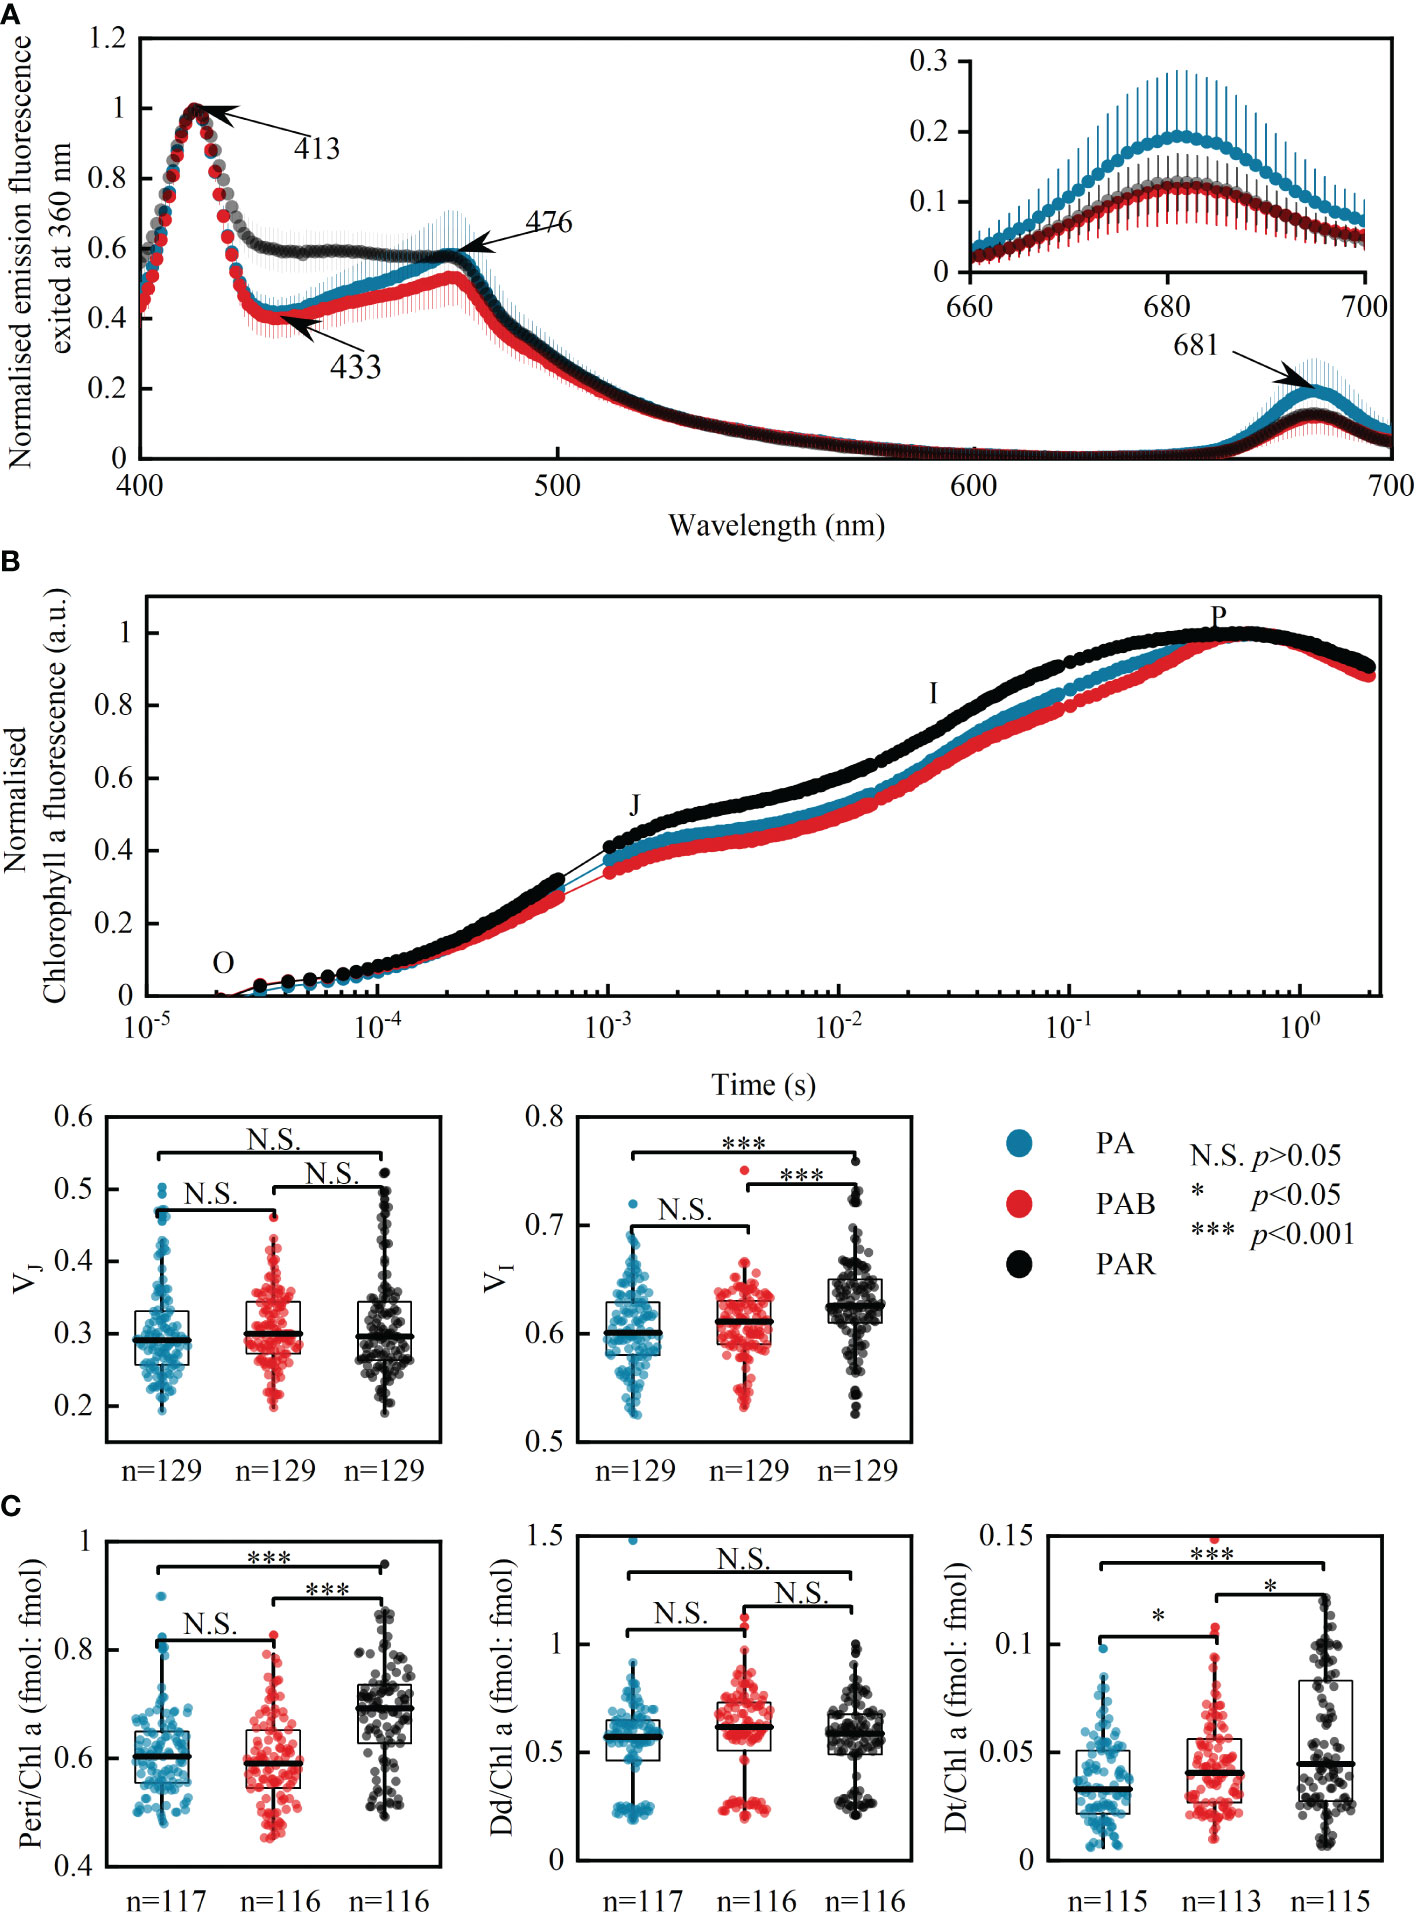
Figure 2. The effects of UVA on photosynthesis in P. lima complex and P. caipirignum. Mean fluorescence emission spectra exposed to PA, PAB, and PAR excited at 360 nm (UVA waveband), n=15 (A); OJIP curves and related parameters VJ and VI (B) obtained under different light treatments throughout the whole culture period. Ratios of peridinin (Peri), diadinoxanthin (Dd) and diatoxanthin (Dt) to chlorophyll a (Chl a) (C). Due to similar responses of Chl a fluorescence and pigment ratios to light treatments among five strains of P. lima complex and P. caipirignum (strain SE10), all five strains are pooled for light treatment analyses. N.S., non-significance, p > 0.05; *p < 0.05; ***p < 0.001.
The OJIP curve, which indicates electron transport between PSII and PSI, had decreased J-P and I-P steps when UVA was added (both PA and PAB, Figure 2B), meaning acceleration of electron transport. Throughout the culture period, the median value of VJ (O-J step) is decreased only in strains BS4F5 and SE10, whereas VI (J-I step) is decreased in each morphotype under UVA addition except in strain DS4G4 (Figure S.6). However, this decrease was only statistically significant for VI of strain SE10 (two-way ANOVA, p< 0.05). VJ is not affected by light treatment when the strains are pooled together, whereas VI is significantly decreased by UVA addition (one-way ANOVA, p< 0.001, Figure 2B).
The UVA addition significantly reduced the ratios of the photosynthetic accessory pigment peridinin (Peri) to Chl a (fmol: fmol) when pooled together (one-way ANOVA, p< 0.001, Figure 2C) and when independent (two-way ANOVA, all morphotypes except strain SD4, p< 0.05, Figure S.7). UVA also decreased the ratio of photoprotective pigments diatoxanthin (Dt) and diadinoxanthin (Dd) to Chl a. Dt/Chl a decreased significantly in strains WZD145 and SE10 (two-way ANOVA, p< 0.05, Figure S.7) and pooled together (one-way ANOVA, p< 0.001, Figure 2C). Dd/Chl a did not affect by the UVA addition in the pooled ratio (one-way ANOVA, p > 0.05, Figure 2C) or in independent strains (two-way ANOVA, p > 0.05, Figure S.7), except for strain BS4F5. β-caro/Chl a and Chl c2/Chl a were not influenced in an independent strain by light environments (two-way ANOVA, p > 0.05, Figure S.7).
Five individual MAAs, mycosporine-glycine (My-G), palythine (Pali), palythene (Pale), shinorine (Shi) and porphyra-334 (Por), were detected in the five strains, except strain DS4G4 where Pali and Pale were not detected (Table 1). Among these MAAs, porphyra-334 was the most abundant. The average total MAA content was significantly increased (2.7- to 6.6-fold) with the addition of UVA and UVB, with strain DS4G4 showing the highest increase. Strain DS4G4, however, had the lowest average MAA content within the PAB treatment (two-way ANOVA, p< 0.05), which was 3.5-fold lower than the highest MAA content (BS4F5).
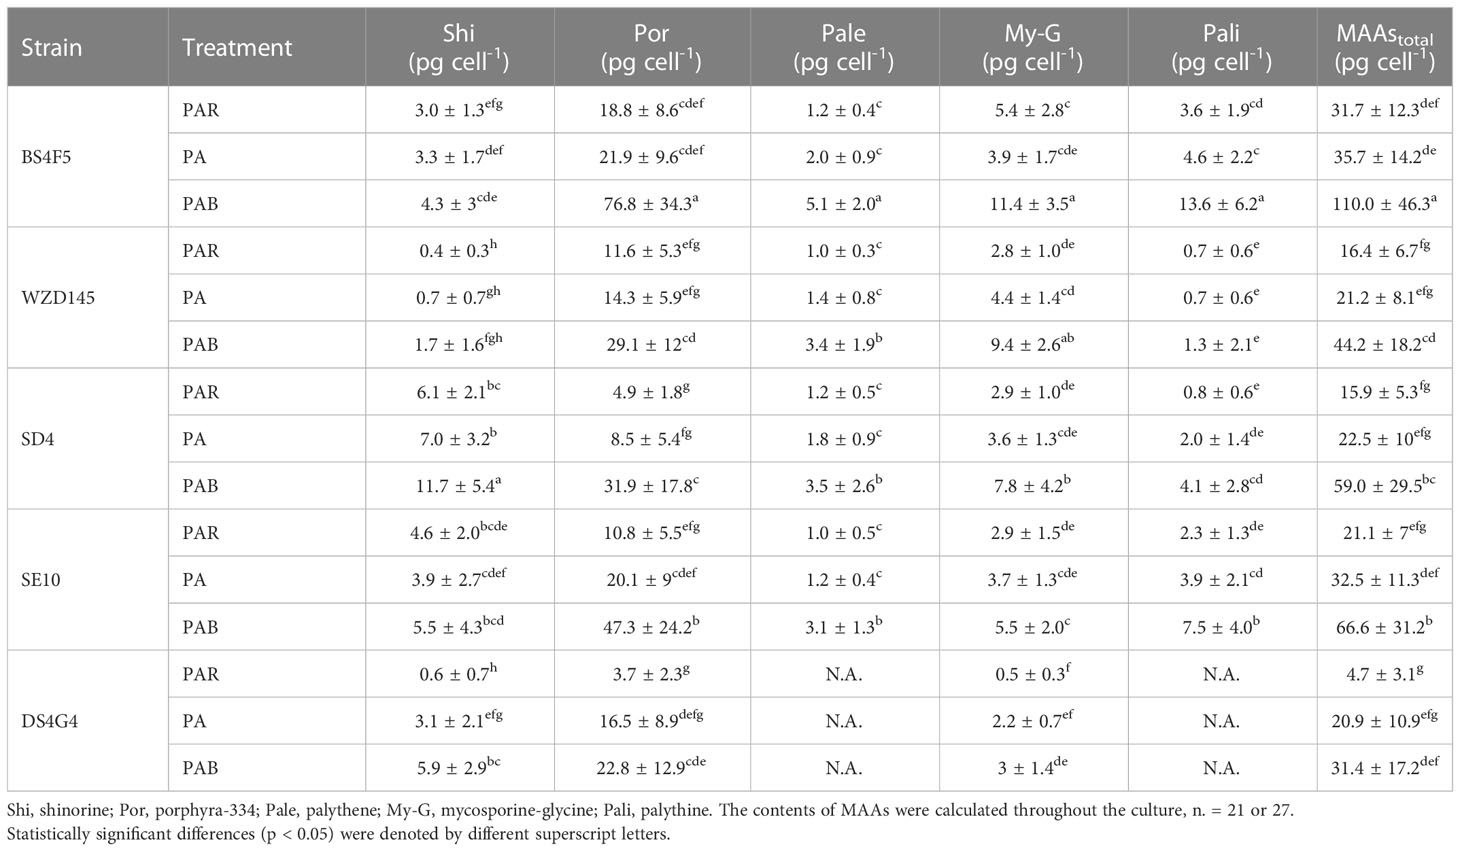
Table 1. The contents of mycosporine-like amino acids under different light conditions in the five strains of P. lima complex and P. caipirignum (strain SE10).
For strains BS4F5 and DS4G4, both the de-epoxidation rate [Dt/(Dd+Dt)] and reaction-driven NPQ are noticeably lower than the other three sample groups (two-way ANOVA, p< 0.05, Figure 3A, indicated in red), while UVR inhibition of growth mostly exceeded 20% (Figure 3B). The increases in NPQ for strain DS4G4 under the PA and PAB treatments were not supported by the Dt/(Dd+Dt) data, which did not change with the UVA or UVR addition. Thus, NPQ in PA and PAB of strain DS4G4 is possibly induced by photodamage (Figure 3A). Principal component analysis suggested that responses to UVR among these strains could be divided into three groups: (i) intermediate MAA contents and high NPQ and Dt/(Dd+Dt) with low UVR inhibition on growth (WZD145, SD4 and SE10); (ii) the highest MAA content but low NPQ and Dt/(Dd+Dt) with intermediate UVR inhibition (BS4F5); and (iii) the lowest MAA content and low Dt/(Dd+Dt) with the highest UVR inhibition (DS4G4) (Figure 3C).
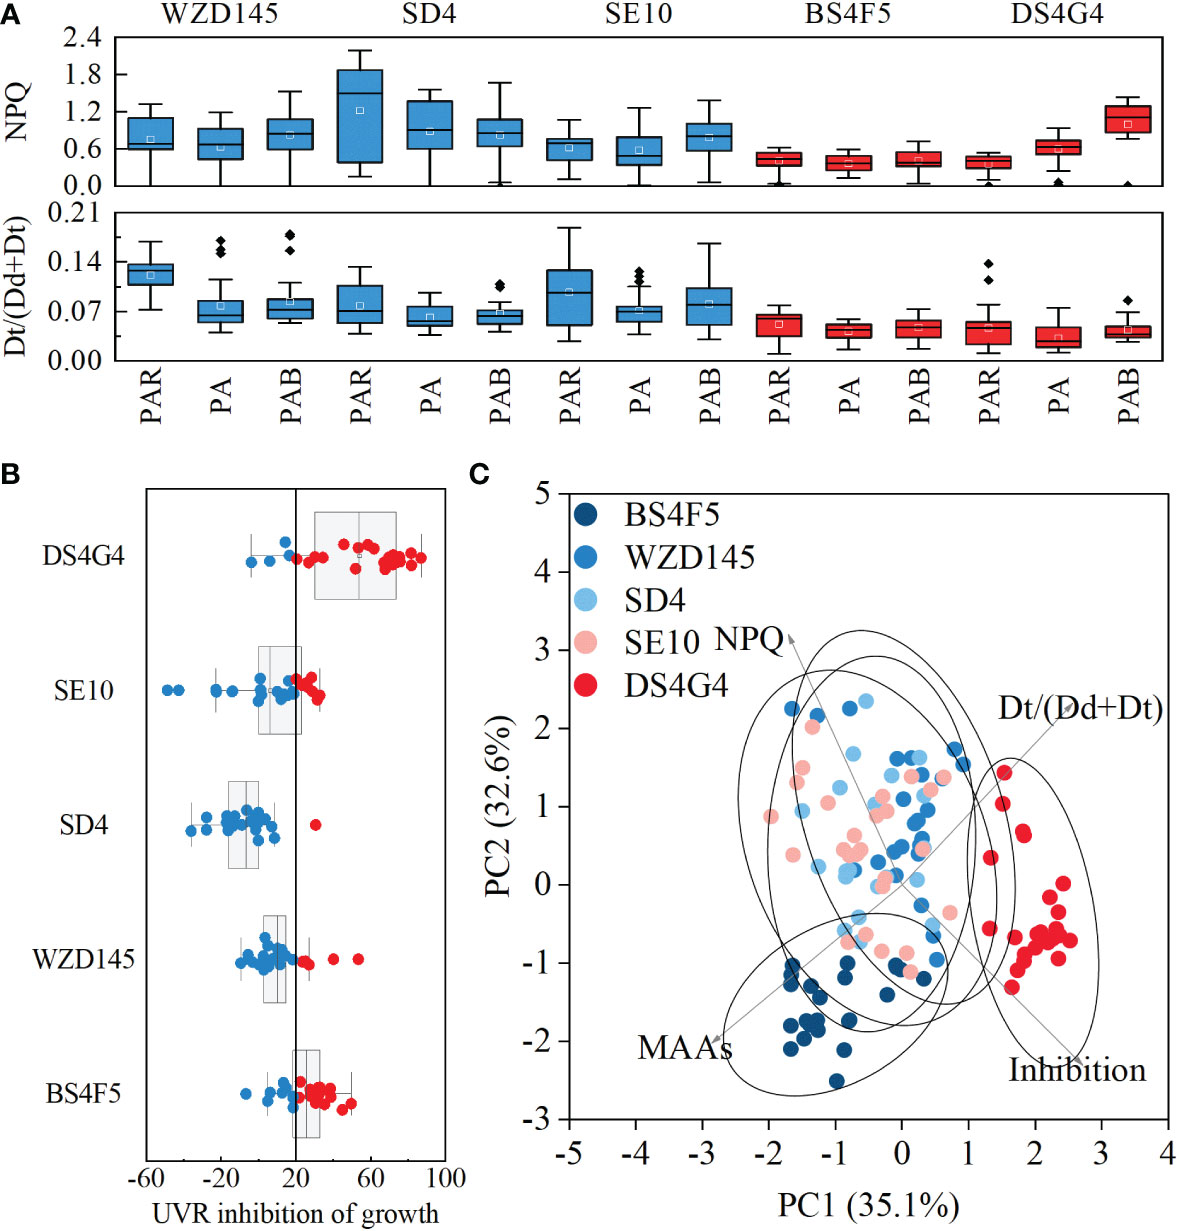
Figure 3. The relationship between photoprotection and UVR inhibition among five strains of P. lima complex and P. caipirignum (strain SE10). Non-photochemical quench (NPQ) and de-epoxidation rates [Dt/(Dd+Dt)] between diadinoxanthin (Dd) and diatoxanthin (Dt) among five strainsunder PA, PAB, and PAR, with red indicating a relatively low group and blue indicating a relatively high group, n = 21 or 27 (A); The inhibition of UVR on growth among five strains, with red points indicating values higher than 20% (B); principal component analysis suggests interspecies differences across five strains (C).
The maximum net toxin production rate (Rmax) across the cultures evaluates the capacity of toxin production among strains. The Rmax of DTX-1 ranged over three orders of magnitude, from 0.001 to 1 pg cell-1 d-1 in the five strains tested (Figure 4A). The strains are divided into three levels according to the magnitude of differentiation of the Rmax of DTX-1.
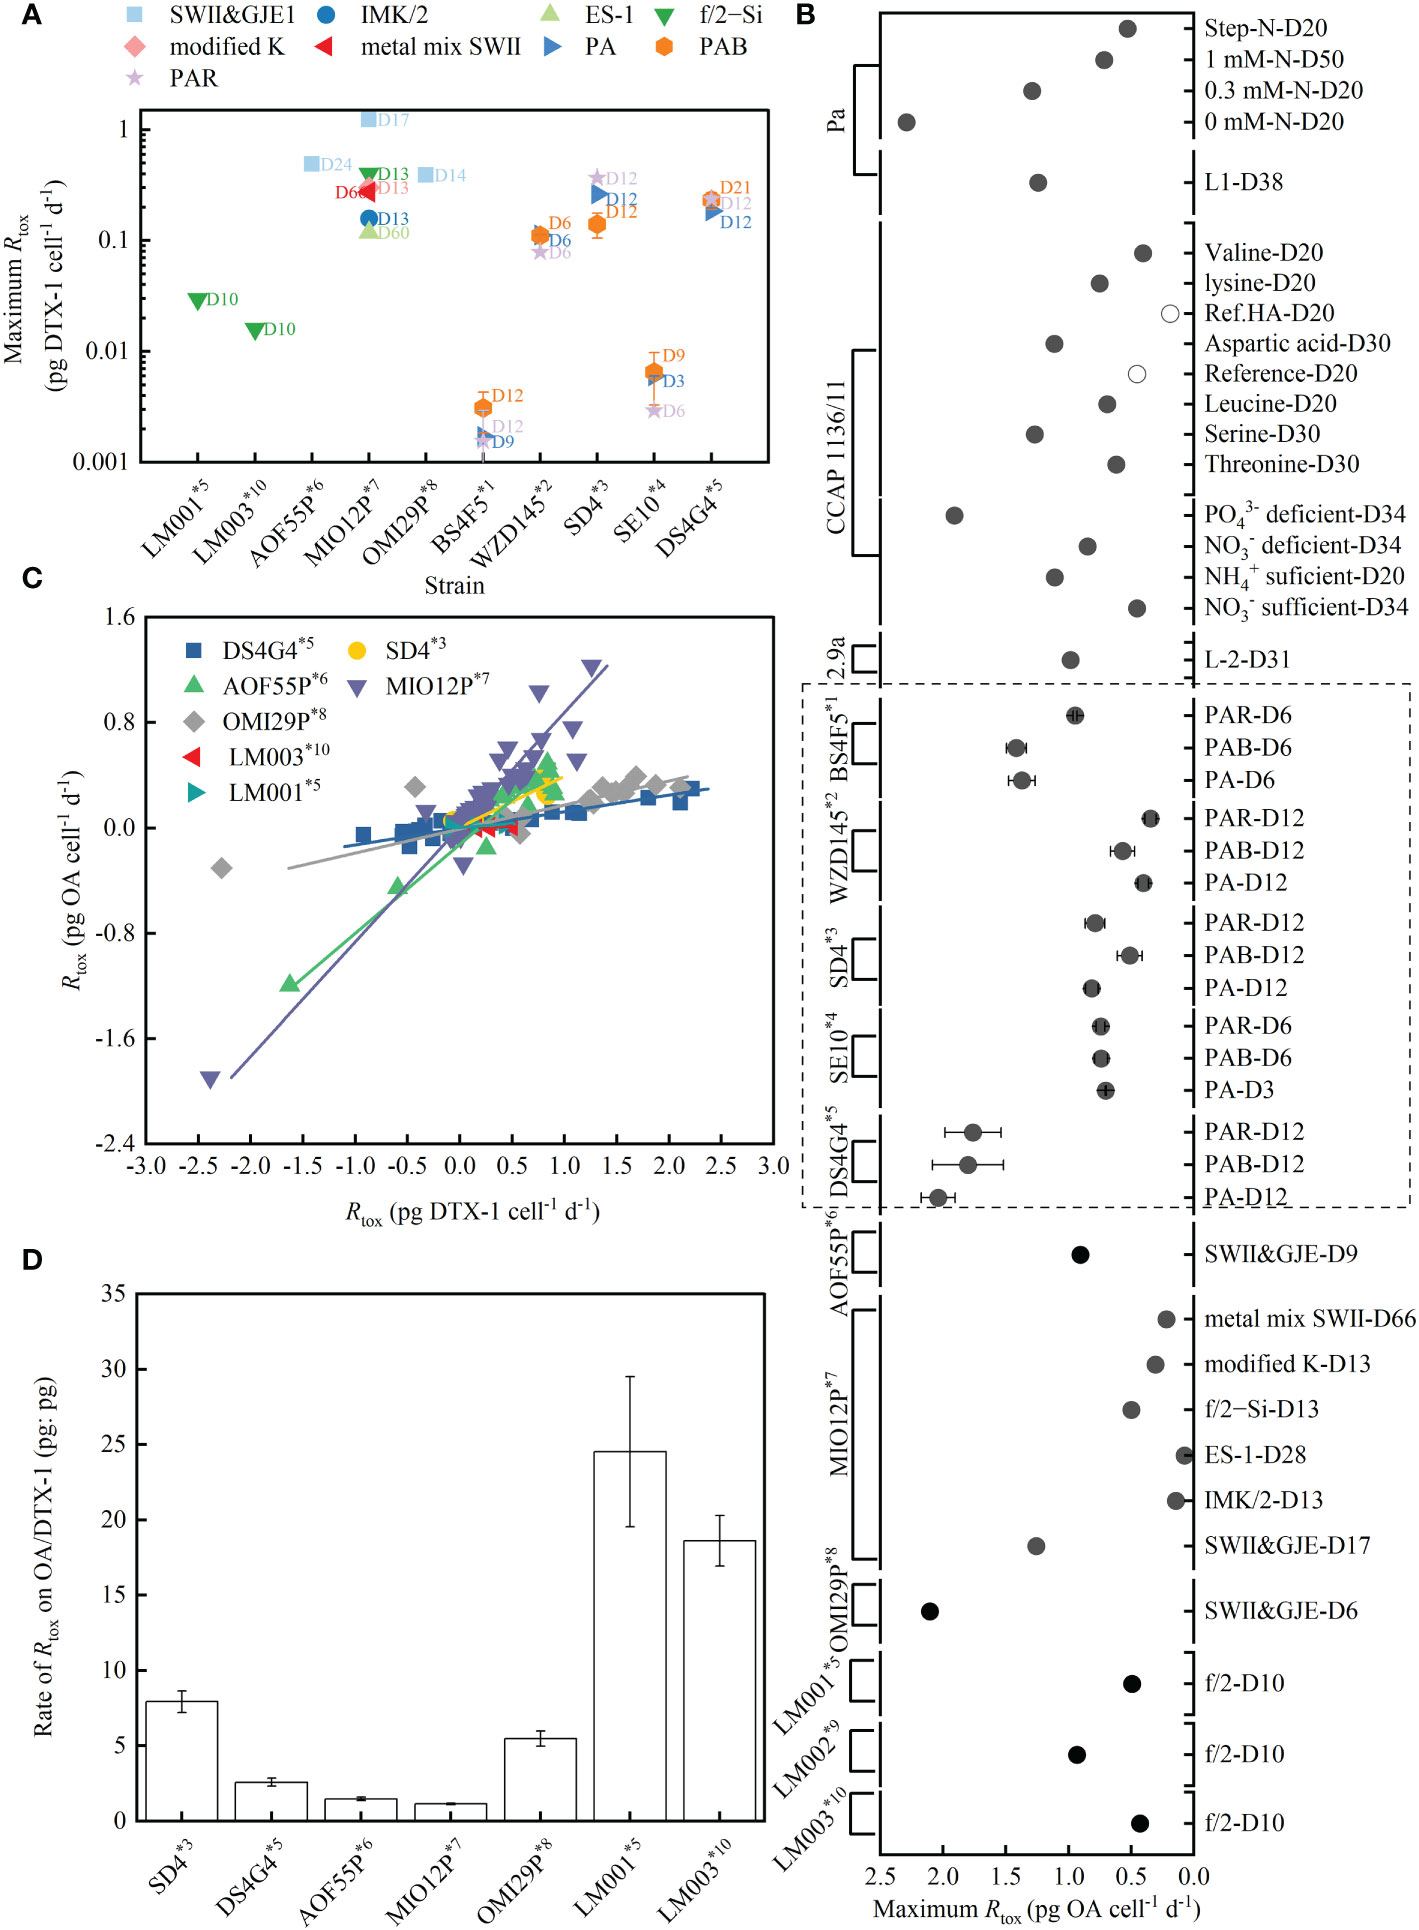
Figure 4. Maximum toxin production rate (Rtox) of DTX-1 (A) and OA (B) under different treatments (the day is denoted by D) from various strains of the P. lima complex and P. caipirignum (strain SE10). Linear relationships between the Rtox of OA and DTX-1 in specific strains with a maximum DTX-1 production rate above 0.01 pg cell-1 d-1, except for strain WZD145 (C). The ratio of Rtox of OA/DTX-1 (pg: pg) varied with strains (D). Data for strain Pa from (McLachlan et al., 1994; Pan et al., 1999), strain CCAP 1136/11 (also known as strain PL2V) from (Souto et al., 2001; Varkitzi et al., 2010), strain 2.9a from (Nascimento et al., 2005), strains AOF55P, MIO12P and OMI12P from (Hashimoto et al., 2021), and strain LM001–003 from (Moreira-González et al., 2019) were recalculated to determine Rtox. The Rtox calculated in the current study are shown by the dashed rectangle (B). Strains were sorted into morphotypes according to large subunit (LSU) rDNA sequences: *1. Strain sorted into P. lima morphotype 1 by Zhang et al., 2015, proposed as P. lima complex clade 3 by Nishimura et al., 2020. *2. Strain sorted into P. lima morphotype 2 by Zhang et al., 2015. *3. Strain sorted into P. lima morphotype 3 by Zhang et al., 2015. and into P. lima complex subclade 1b by Nishimura et al., 2020. *4. Strain sorted into P. lima morphotype 4 by Zhang et al., 2015., regarded as P. caipirignum by Nascimento et al., 2017 and into P. caipirignum clade c by Nishimura et al., 2020. *5. Strain sorted into P. lima morphotype 5 by Zhang et al., 2015. and into P. cf. lima by Nishimura et al., 2020 and Moreira-González et al., 2019. *6. Strain sorted into P. lima complex subclade 1i by Nishimura et al., 2020. 7*. Strain sorted into P. lima complex subclade 1e by Nishimura et al., 2020. 8*. Strain sorted into P. lima complex subclade 1f by Nishimura et al., 2020. 9*. Strain sorted into P. lima complex clade B by Moreira-González et al., 2019. 10*. Strain sorted into P. lima complex clade C by Moreira-González et al., 2019.
The high level (HL, beyond 0.1 pg cell-1 d-1) of Rmax of DTX-1 includes strains SD4 and DS4G4, with Rmax for DTX-1 being 0.14-0.36 pg cell-1 d-1 and 0.18-0.23 pg cell-1 d-1 under light treatments, respectively. HL also contains the previously reported OMI29P, MIO12P, and AOF55P strains (Hashimoto et al., 2021). In particular, the strain MIO12P reached a magnitude above 1 pg cell-1 d-1, with a Rmax of DTX-1 of 1.23 pg cell-1 d-1 on day 17 in the SWII&GJE1 medium.
The strain WZD145 has 0.078 ± 0.001 pg cell-1 d-1 Rmax of DTX-1 on day 6 under PAR, with varying performances of Rtox on DTX-1 over time from the HL groups (Figure 5B). Although the rate is enhanced by UVA to 0.112 ± 0.001 and 0.111 ± 0.001 pg cell-1 d-1 on day 6-PA and -PAB, respectively, the Rmax of DTX-1 in strain WZD145 could be categorized into the middle level (ML, 0.01-0.1 pg cell-1 d-1). ML also included the previously reported LM001 and LM003 strains (Moreira-González et al., 2019).
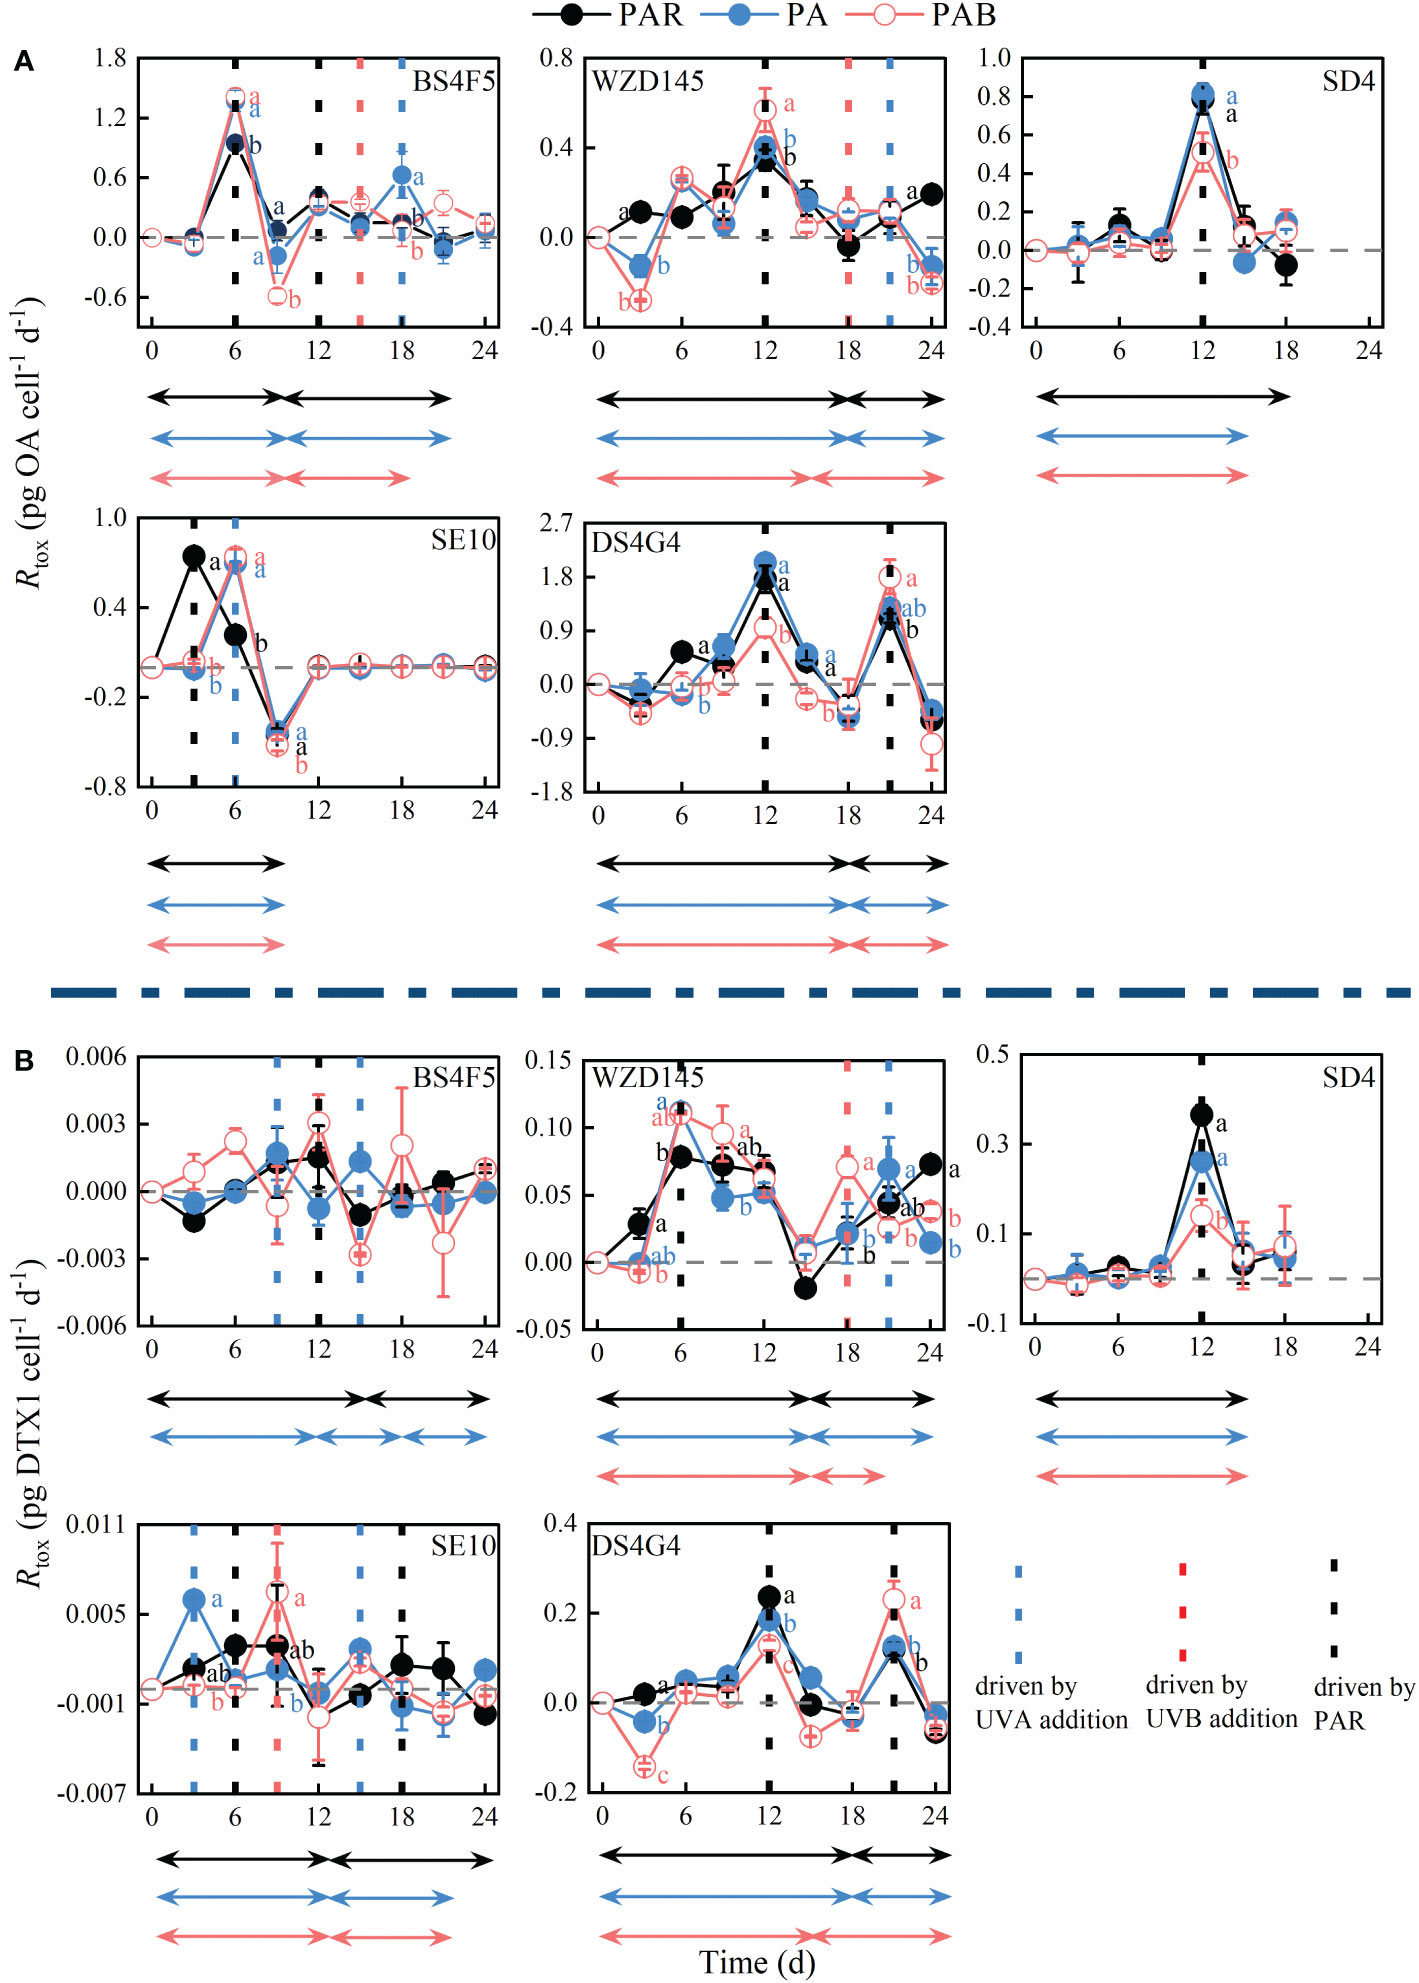
Figure 5. The trends in toxin production rate (Rtox) in (A) OA and (B) DTX-1 of the fivestrains of P. lima complex and P. caipirignum (strain SE10) over time under PAR, PA, and PAB treatments. LL, ML, and HL before the morphotypes represent their DTX-1 production capacities: 0.001-0.01, 0.01-0.1, and 0.1-1 pg cell-1 d-1, respectively. Regular peaks are shown in the time series. A complete ascent and descent process of Rtox is termed a period and highlighted using a two-way arrow. The colour of the arrows represented different light treatments. Statistically significant differences (p< 0.05) between the light treatments at the same time point are labelled using different letters, n=3.
The low level (LL, 0.001-0.01 pg cell-1 d-1) of Rmax on DTX-1 includes strains BS4F5 and SE10, with Rmax for DTX-1 ranging from 0.0029-0.0065 pg cell-1 d-1 and 0.0015-0.0031 pg cell-1 d-1 under the light treatments, respectively.
The Rmax of OA in the examined morphotypes displayed an extensive variance from 0.74 to 2.04 pg cell-1 d-1. The strain DS4G4 has the highest Rmax for OA (1.76-2.04 pg cell-1 d-1), following strain BS4F5 (0.94-1.41 pg cell-1 d-1), SE10 (0.7-0.74 pg cell-1 d-1), and SD4 (0.51-0.81 pg cell-1 d-1), with strain WZD145 being the lowest (0.34-0.56 pg cell-1 d-1). Together with all previously reported strains, although different nutrient treatments and culture mediums influenced the Rmax for OA, none of the Rmax for OA exceeded 2.5 pg cell-1 d-1.
Positive linear correlations between Rtox of OA and DTX-1 were observed in all HL strains and the two ML strains of LM001 and LM003 (Figure 4C and Table S.1, R2 varied from 0.663 to 0.992). The fitting failed for ML strain WZD145 (R2 = 0.261) and two LL strains BS4F5 and SE10 (R2< 0.2). The data (pg: pg) between Rtox of OA and DTX-1 are variant in these strains, ranging from 1.15 ± 0.04 (MIO12P) to 24.52 ± 4.98 (LM001). The examined strains SD4 and DS4G4 had 7.93 ± 0.78 and 2.59 ± 0.25 production segments between OA and DTX-1, respectively. The data for fitting came from various light treatments or culture mediums over time. The linear correlation between the Rtox of OA and DTX-1 suggested that internal factors regulate the biosynthesis of the two compounds.
The OA and DTX-1 concentrations (ng mL-1) generally increased over time in all strains (Figure S. 8). The toxin levels would, however, occasionally drop. For example, OA and DTX-1 in strain DS4G4 on days 18 and 24 decreased. The OA concentration of strain SE10 initially increased 16.6-fold above 9 ng mL-1 on day 6 and then abruptly decreased 22.6-fold below than 1 ng mL-1 on day 9, remaining below 2.1 ng mL-1. Except for DTX-1 of two LL strains BS4F5 and SE10 at some time points, light treatments did not change the trends in toxin concentration. However, the accumulation of toxic concentrations is influenced by light. For instance, the OA and DTX-1 concentrations of the most light-sensitive strain DS4G4 decreased considerably by adding UVB between days 12 to 24.
On the cellular toxin levels (pg cell-1), no apparent or comparable trends were found (Figure S. 9). After eliminating the effects of growth rate, the net toxin production rate trends (Rtox, pg cell-1 d-1) seemed to be more regular than those for cellular toxin content (Figure 5). The combined effects of light treatments, traits of strains, toxin species, dynamic photosynthetic activity and nutritional availability during the culture process are involved in Rtox, resulting in it becoming a complex relationship to characterize.
The Rtox initially increased and then decreased, sometimes repeatedly, which shaped significant peaks or troughs. These inflection points might result from shifts in factors that direct Rtox. To simplify the analysis, the overall increase and decreasing process of Rtox was referred to as a period and was represented by a two-way arrow in Figure 5. The time of the identified peak (indicated by a dotted line in Figure 5) during a period was listed in Table 2. The different features in the examined strains, such as the light response and DTX-1 production ability, were also listed in Table 2.
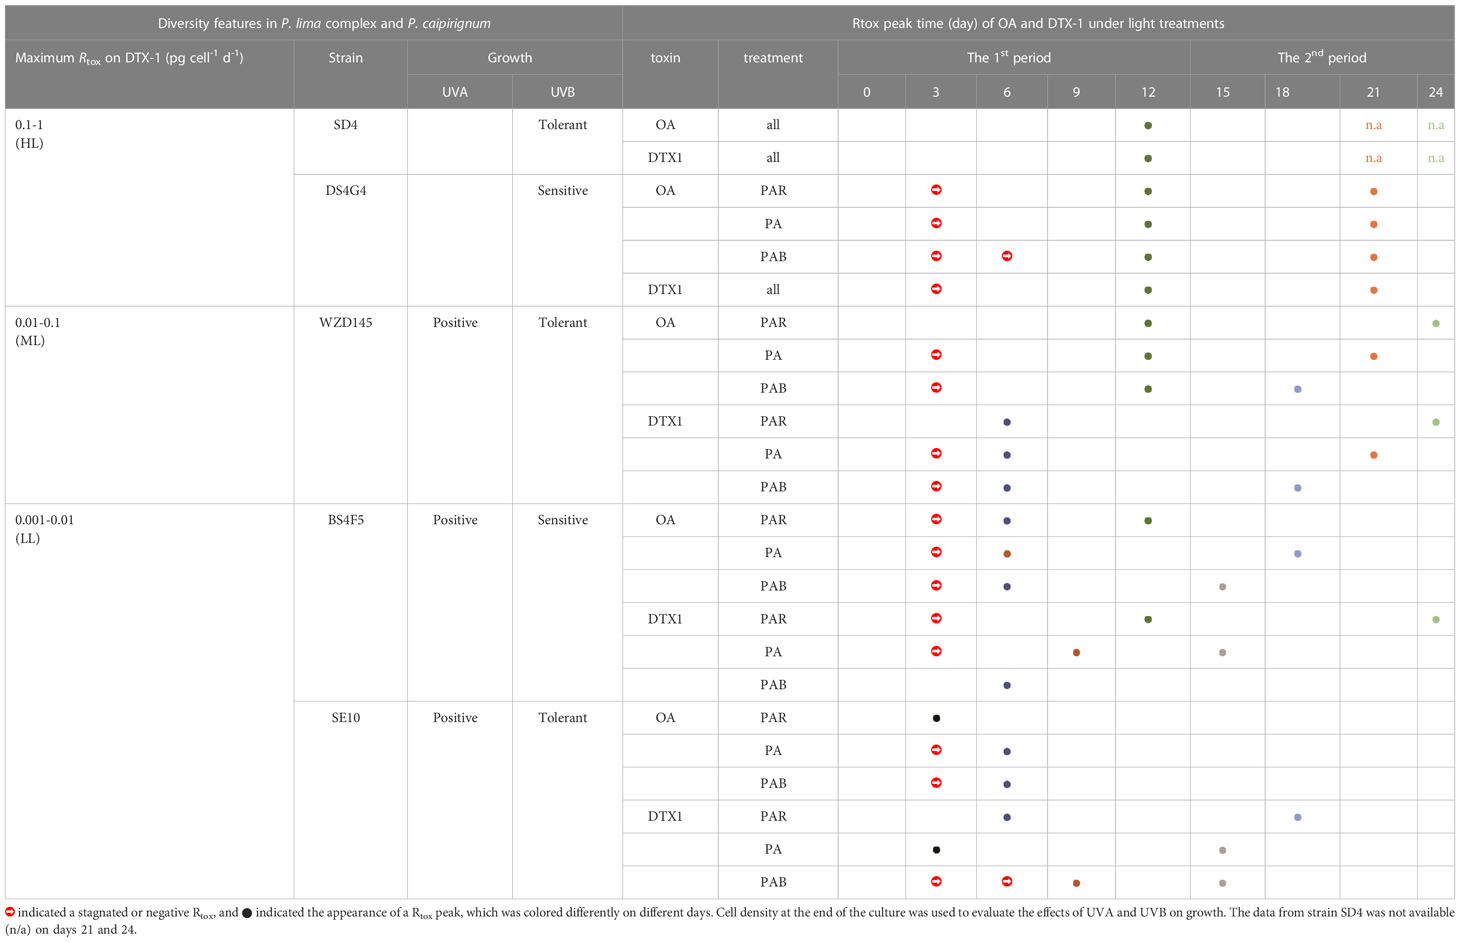
Table 2. Different DTX-1 production capacities, light responses, and toxin production (Rtox) peak times under light treatments in five strains of P. lima complex and P. caipirignum (strain SE10).
The first Rtox peaks in all sample groups varied between days 3 to 12 (Table 2). All second peaks occur after day 12, except for the BS4F5-OA-PAR, whose second Rtox peak occurs on day 12 (Table 2). Surprisingly, the first peaks of Rtox on OA in the HL (SD4 and DS4G4) and ML (WZD145) under the three light treatments occur on day 12 (Figure 5A and Table 2). In contrast, two LL strains BS4F5 and SE10 showed earlier peaks occurring on days 3 or 6, depending on the light treatments. The peak value for Rtox was not the factor affecting the peak time because the peak values in LL were either higher or lower than those in HL (Figures 4B, 5A). The considerable variances of DTX-1 production capacity may cause the different Rtox peak times on OA of the LL strains (BS4F5 and SE10) than other strains (Figure 4A). Furthermore, the first peak times for Rtox on DTX-1 in ML and LL strains were also earlier than in the HL on day 12 (Table 2). These findings show that strains with reducing DTX-1 production capability more easily reached their maximum DST production rates.
When comparing the peak times unchanged by light treatments in the HL strains (SD4 and DS4G4), the peak times of LL (BS4F5 and SE10) and ML (WZZD145) were more plastic and could be delayed or accelerated by adding either UVA or UVB, causing peak separation (Table 2 and Figure 5). Normally, the delayed peaks in the LL strains were typically observed at the beginning, such as SE10-OA-PA &PAB on day 6 and SE10-DTX1-PAB on day 9, where Rtox was stagnant prior to the peak. UVA addition and, on occasion, UVB addition shortened the sustained increases under PAR and accelerated the peak times observed for LL and ML strains.
Stagnation of Rtox at the beginning was quite common, which was also observed in the BS4F5-OA-all light treatments and WZD145-DTX1-PA & PAB (Figure 5). Additionally, at the beginning, the Rtox of some cases was negative, like WZD145-OA-PA & PAB and DS4G4-OA & DTX1-all light treatments. Whether Rtox is stagnant or negative at the beginning, which may arise for the same reason, they were represented by red right arrows in Table 2. The resulting Rtox values from the light-tolerant strains including WZD145, SD4 and SE10 are not inhibited under PAR, whereas those from the light-sensitive strains BS4F5 and DS4G4 were all inhibited to almost nil or negative under the three light treatments. These trends demonstrate that inhibition of Rtox by light was relevant to the photoprotection ability.
Meanwhile, photosynthetic activity Fv/Fm also decreased at the beginning of the experiment (Figure 1), indicating cells were experiencing a photoinhibition status. UVA or UVB addition increases the degree of photoinhibition. The strain DS4G4 was the most sensitive to UVR. On day 3, the Rtox of strain DS4G4 for DTX-1 yielded the following order: PAR, PA, and PAB (Figure 5B). The differences between the treatments were each significantly different (one-way ANOVA, p< 0.05, Figure 5B). On day 9, the Fv/Fm of strain DS4G4 under PAR stopped decreasing (Figure 1). At the same time, the Rtox on OA changed from negative to positive (Figure 5A). Therefore, the inhibition of DST production was caused by photoinhibition, and could be alleviated by photo-accumulation process.
In the LL (BS4F5 and SE10) and ML (WZD145) strains, the accelerated peaks as a result of UVR were observed in not only the first period but also the second period (Figure 5). Especially in the first period, UVA significantly increases the maximum Rtox of OA in strain BS4F5 on day 3, and of DTX-1 in strains WZD145 (under PAR-day 6 versus PA and PAB-day 6) and SE10 (under PAR-day 6 versus PA-day 3 and PAB-day 9), respectively (two-way ANOVA, p< 0.05, Figures 4A and 5B). In contrast, PAB results in two HL strains SD4 and DS4G4, having significantly lower peak levels of OA and DTX-1 on day 12 (one-way ANOVA, p< 0.05, Figure 5). But for OA and DTX-1 in strain DS4G4, the second peak on day 21 under PAB was the highest (one-way ANOVA, p< 0.05, Figure 5).
The advanced and increased peaks of Rtox induced by the addition of UVA in LL (BS4F5 and SE10) and ML (WZD145) strains resulted in their growth also being enhanced with the UVA addition (Figure 1 and Table 2). UVA could enhance the photosynthesis levels (Figure 2A). Based on the earlier peaks under the UVA addition, the increasing processes of Rtox suggested higher photosynthetic yields for DST production.
However, the decreased Rtox remained unexplained. The earliest decreasing Rtox began on day 3, and the latest was on day 12. Rtox shows two decreasing patterns: i) Rtox decreases quickly and linearly, as in all OA cases, and DTX-1 in the HL strains (SD4 and DS4G4) and strain BS4F5, and ii) Rtox decreased slowly at first and then quickly for DTX-1 in the ML and LL strains, such as strains WZD145 and SE10 under PAR.
The troughs of Rtox were observed between days 9 to 18 in the middle of the experiment. The troughs appeared close in time to the depletion of phosphate and the second decrease of Fv/Fm, indicating limited nutrients available for photosynthesis. The phosphate consumption rate (CDIP) was calculated to explore the relationship between toxin production and phosphate consumption.
Except for a notable increase in DS4G4-PAB on day 21 and drops and increases in BS4F5-PA and -PAB between days 3 to 6, CDIP consistently decreased over time (Figure S.10). Two different relationships between Rtox and CDIP were observed, the inverse and positive relationships (Figure S.11). Rtox was more strongly correlated with CDIP than with nitrogen consumption (CDIN, Figure S.12) or growth rates (μ, Figure S.13). The last two correlations seemed to be irregular. The pre-peak (increasing) Rtox, in the cases of sufficient points for fitting showing in Figure S.11, had inversely linear correlations with CDIP. In contrast, the post-peak (decreasing) Rtox in the cases of strains WZD145, SE10 and DS4G4 with sufficient points for fitting, had positively linear or exponential correlations with CDIP (specifically presented in Figure 6). The functional parameters and statistical results of the linear and exponential correlations are listed in the Tables S.2 and S.3. The coefficient of determinations, denoted by Pearson’s r and R square, the majority of which were above 0.98 (Tables S.2 and S.3), indicate a strong correlation between Rtox and CDIP.
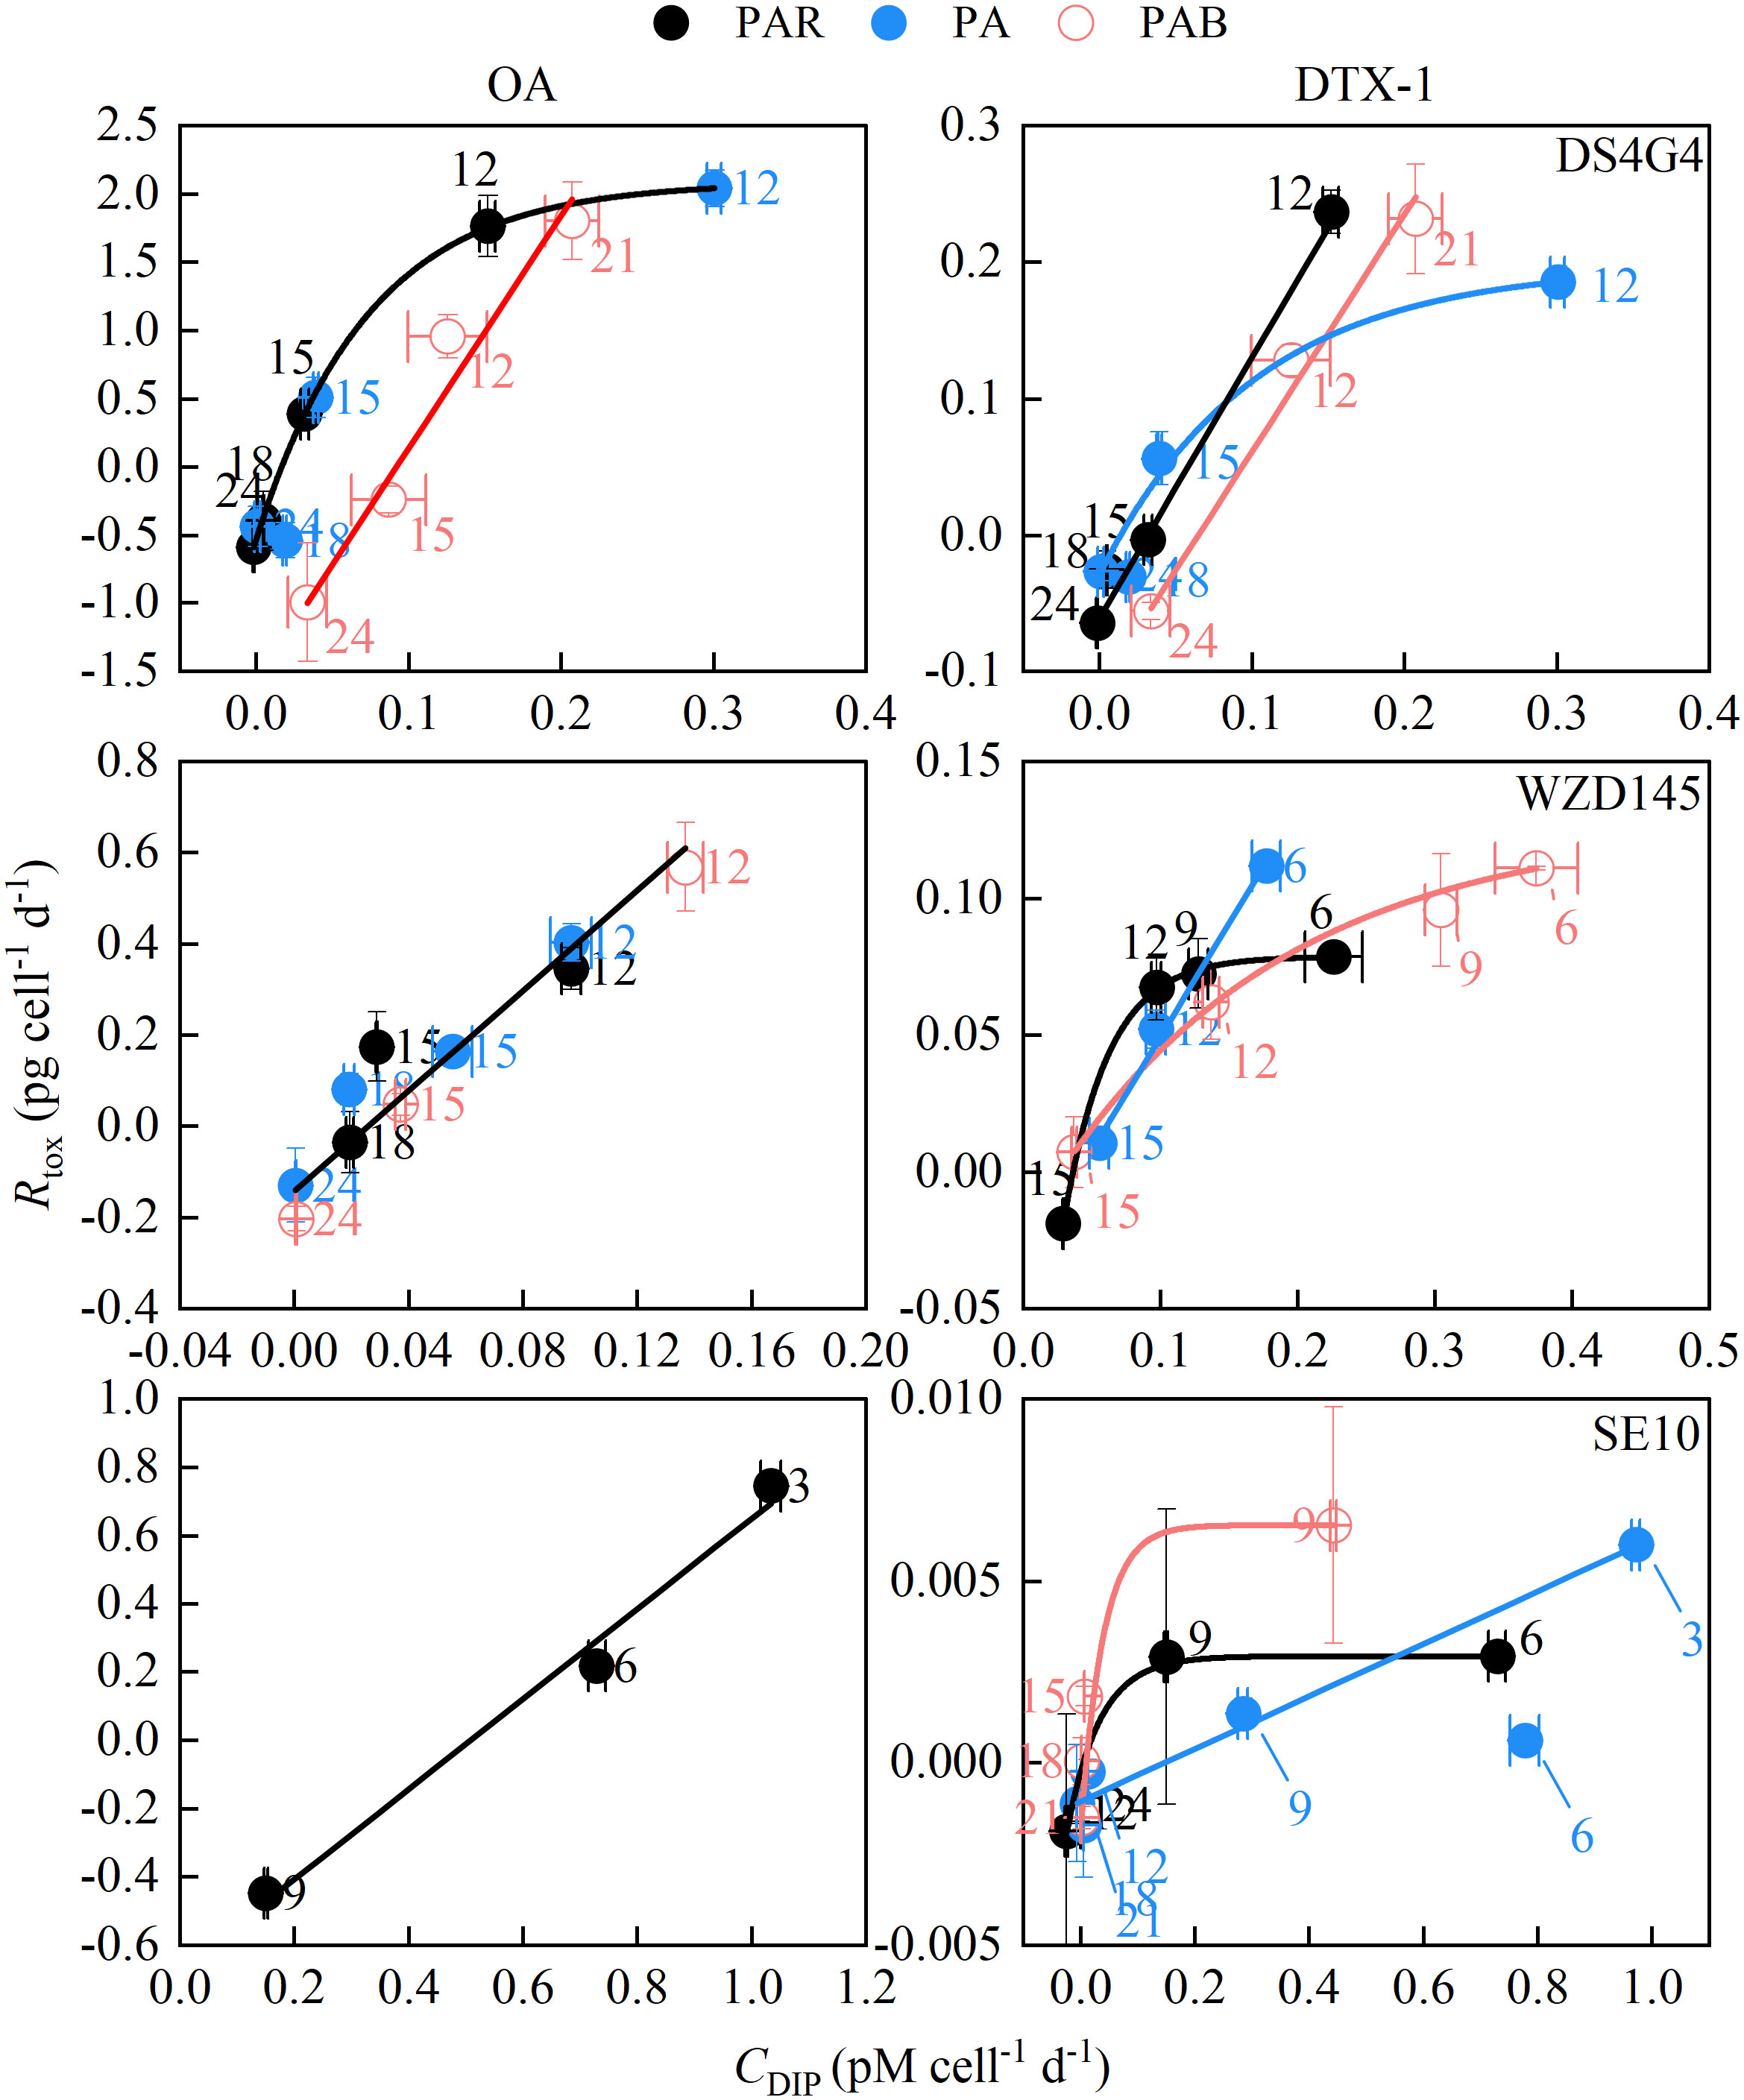
Figure 6. The relationship between downward toxin production (Rtox) and phosphate consumption rates (CDIP). The downward Rtox points on OA and DTX-1 in the strains DS4G4, WZD145 and SE10 were sufficient for fitting with CDIP and hence were selected. The whole fitting results are detailed in Figure S.11. The functional parameters and statistical results of linear and exponential correlations are given in Tables S.2 and S.3, respectively. The numbers beside the symbols indicated the days.
Regardless of when the Rtox peak starts to decrease, periods, toxin species, or morphotypes with different DTX-1 production capacities, all downward Rtox decreased with CDIP (Figure 6). In the HL strain DS4G4 and ML strain WZD145, the peak time of Rtox on OA was not affected by the light treatments. Therefore, their Rtox on OA from different light treatments could be commonly fitted except DS4G4 under PAB due to strong inhibition on Rtox by adding UVB. The Rtox on OA in strain DS4G4 (maximum Rtox: 2 pg cell-1 d-1) was more saturated than in strain WZD145 (0.56 pg cell-1 d-1), corresponding to an exponential correlation with CDIP in strain DS4G4 and a linear correlation with CDIP in strain WZD145.
With reduced DTX-1 production capacities, Rtox for DTX-1 in ML strain WZD145 and LL strain SE10 under PAR, displaying the pattern II of decreasing, had saturated curves with CDIP. The addition of UVA prompted the maximum Rtox and changed the outcome to linear lines. The linear correlations are most likely the initial part of the saturation curve. Furthermore, the uptrending Rtox of DS4G4-PAB on day 21, the only point of PAB significantly higher than the other light treatments, met the only increase in CDIP and was located on the positive line between Rtox and CDIP (Figure S.10, Figure 6). The relationship between CDIP and Rtox is likely to be one of substrate-product.
This study found that the morphotypes of the P. lima complex and P. caipirignum differed enormously in producing DTX-1 and photoprotection against ultraviolet radiation. These two internal differentiations and two external factors, including the light environments and variable nutrient consumption, influenced the net DST production rate (Rtox) trends, making it complex. Different Rtox movements, including initially stagnated Rtox, constantly increasing Rtox, steady Rtox, and decreasing Rtox, were reported in this study. Occasionally, the unfolding trends of Rtox would repeat. Here, an effort was made to properly ascribe these Rtox movements to their plausible causes and discuss the relationship between OA and DTX-1 production.
Physiological studies of whole species inevitably require extrapolating from data at the strain level. However, conclusions drawn this way are sometimes insufficient or subject to high variation if the genetic distances between chosen strains are too close or the number of strains is insufficient (Schaeffer et al., 2007; Thessen et al., 2009). In particular, high genetic variability within a species (Burkholder and Glibert, 2006) is considered a sign of a cryptic species or functional diversity.
Though the five morphotypes of P. lima complex and P. caipirignum had similar photo-physiological responses to exposure to UVA, resulting in enhanced efficiency of photosynthesis (Figure 2), they exhibited high diversity in photoprotection, especially strain DS4G4, which had extremely low NPQ and MAA content. NPQ, as well as the xanthophyll cycle indicated as Dt/(Dd+Dt), represents an efficient photoprotective mechanism that releases excess light energy as thermal energy and avoids damage to photosynthetic apparatuses. The MAAs absorb UVR with extremely high extinction coefficients and are essential to the survival of phytoplankton that experience UVR exposure. Thus, in outdoor cultures, strain DS4G4 could not survive under solar light (data not shown). Accordingly, it is reasonable to infer that strains from morphotype 5 would prefer deep water or conditions where light is obscured.
The collective environment of strain DS4G4 was not described by Zhang et al. (2015). According to the phylogenetic tree constructed using ITS and LSU rDNA sequences, strain LM001 shares the same clade as strain DS4G4 (Moreira-González et al., 2019). Strain LM001 was collected from a bloom of macroalgae Ulva lactuca in 2014. It was also found in the muddy tidal flats of the outer sector of the estuarine complex of Paranaguá Bay, Brazil, both of which exhibit obscured conditions (Moreira-González et al., 2019). While investigating vertical distributions in Japan (Nishimura et al., 2020), strains from P. lima complex subclade 1a and P. caipirignum subclades b and e, including light-tolerant strains WZD145 and SE10 in this study, were distributed only shallow (< 5m depth) water and in shallow to deep water (10-30 m depths), respectively, whereas P. lima complex subclades 3b and 3c, including light-sensitive strain BS4F5, were restricted to deep water. Overall, the performances of these morphotypes of the P. lima complex and P. caipirignum under UVR addition were all highly relevant to their adaptation to their respective field light conditions.
Benthic dinoflagellates exhibit certain benthic or epibenthic behaviours, such as relatively fixed life history modes, which exposes them to very different light environments due to physical shadowing by macroalgae (Nakahara et al., 1996; Villareal and Morton, 2002), sediments or sand (Reñé et al., 2021), tidal rhythms (Patil et al., 2017), and light attenuation in the water column. Variation in light conditions presents different selective pressures that influence photosynthetic optimization and, thus, long-term competitive adaptation. Therefore, the P. lima complex and P. caipirignum cells must continually adjust to variable intensities and wavelengths of light via photoprotection mechanisms as in light-tolerant strains or otherwise be restricted to narrowly defined light regimes as ‘ecotypes’, as in light-sensitive strains BS4F5 and DS4G4. From an ecological perspective, the divergence of multiple ecotypes with different photosynthetic physiologies allows them to better adapt to dynamic light environments and inhabit different depths of the water column and therefore enhance the competitive advantages for the population (Gallagher, 1982; Cohu et al., 2012; Suggett et al., 2015; Nishimura et al., 2020).
DTX-1’s production capacity was another factor that differed significantly between the P. lima complex and P. caipirignum strains, where the DTX-1 production capacity ranged across four orders of magnitude (Figure 4A). The Rtox of OA reached its maximum more easily when the DTX-1 production capacity was extremely low, such as in two LL strains (BS4F5 and SE10) (Table 2). Otherwise, when the DTX-1 production capacity increased by one or two orders of magnitude, the Rtox between OA and DTX-1 experienced a linear correlation (Figure 4C). However, this linear relationship was not conserved, such as in ML strain WZD145, where Rtox of DTX-1 showed saturation (steady Rtox) and then lost linear relationship with the Rtox of OA (Figures 4C and 5). This data infers that the relationship between OA and DTX-1 is competitive.
Nishimura et al. (2020) reported that three groups might be based on their OA and DTX-1 cellular content. In group I, DTX1 producers included P. lima complex subclades 1e and 1i, representing the MIO12P (HL) and AOF55P (HL) strains. In group II, low DTX-1 producers included P. lima complex subclades 1a and 1f, representing strains WZD145 (ML) and OMI29P (HL). In group III, no or very low DTX1 producers included P. lima complex subclades 1c, 1d, 1f, 1g, 1h, 1j, 3a, 3b, and 3c; Prorocentrum sp. Type 2; and P. caipirignum subclades b and e. The strains BS4F5 (LL) and SE10 (LL) were proposed as P. lima complex clade 3 and P. caipirignum subclade c by Nishimura et al. (2020), respectively. These two morphotypes could be regarded as group III based on their minimal DTX-1 content.
In groups I and II, the OA and DTX-1 content of the strains experienced linear relationships (Figure 4C). Such a relationship infers that the strains of these two groups follow a specific ratio between OA and DTX-1 to produce toxins most of the time, but not always (like WZD145). The following work, per Hashimoto et al. (2021), reported the toxin contents of three HL strains MIO12P, AOF55P, and OMI29P over time in the SWII & GJE1 culture medium. After the toxin contents were recalculated as Rtox, the strain OMI29P with the lowest Rmax of DTX-1 among these three strains had the earliest OA peak on day 6. The AOF55P strain was next on day 9 and MIO12P strain on day 17, with the middle and highest Rmax of DTX-1, respectively (Figures 4A, B and S.13). Furthermore, in a previous study, toxin concentrations reported during the cell cycle suggested that OA and DTX-1 have separative transformation pathways (Pan et al., 1999). This outcome supports the hypothesis that production between OA and DTX-1 competes against each other.
According to the investigation of Nishimura et al. (2020), many more subclades of P. lima complex or P. caipirignum reduced the DTX-1 production capacity. In contrast, all reported strains of P. lima complex and P. caipirignum could reach relatively high Rtox of OA (more than 0.4 pg cell-1 d-1, Figure 4B), indicating that OA might be more important than DTX-1 for DST producers in Prorocentrum. The fast accumulation of OA may be a selective advantage in reducing the DTX-1 production capacity. The function of DST for toxin producers is still unclear. Though OA and DTX-1 could inhibit other non-DST-producing microalgae (Windust et al., 1996), OA was not a primary growth-inhibitory compound in the medium of P. lima complex (Sugg and VanDolah, 1999).
An increase in light intensity inhibits or reduces DST content or production in both Prorocentrum and Dinophysis genera, even though the light intensity did not reach the saturation intensity for growth (Morton et al., 1992; Tong et al., 2011; López-Rosales et al., 2014; Praptiwi, 2014). A stagnant or even negative Rtox occurred from alteration of light conditions, associated with morphotype photoprotection to reduce light photodamage. Additionally, negative Rtox occurred not only during the change of light conditions but also when phosphate and nitrogen were limited (Figures 5 and S.13D), indicating that the same mechanism may cause these negative Rtox values.
According to the theory of photoinhibition, Fv/Fm occurs due to the photodamage and repair processes of photosystem II (PSII) (Takahashi & Murata, 2008). Photodamage is linearly related to light intensity, and each wavelength of light has a specific photodamage rate (Tyystjärvi & Aro, 1996). In contrast, environmental factors such as heat, osmotic stress, or nutrient limitation impair the repair process (Takahashi and Badger, 2011; Li et al., 2021). Photoinhibition occurs when Fv/Fm declines when the repair rate is lower than the PSII damage rate (Allakhverdiev & Murata, 2004). Photoinhibition is caused by UVR exposure and nutrient limitations for photodamage and repair processes. Accordingly, the inevitability of photodamage could be why the maximum Rtox decreased in D. acuminata (Tong et al., 2011) and the cellular toxin content reduced in Prorocentrum species, even when light levels were still low (Morton et al., 1992; López-Rosales et al., 2014; Praptiwi, 2014).
A follow-up experiment (Exp. F) was conducted on two morphotypes with different photosynthetic traits but similar Rtox trends (such as HL strains SD4 and DS4G4) under four light intensities varying between 12 to 400 μmol photons m-2 s-1. The initial Rtox values decreased exponentially from positive to negative with light intensities from 12 to 400 μmol photons m-2 s-1 (unpublished), demonstrating light’s inevitable inhibition effect on DST production under variable light conditions. DST production may be associated with the repair process of PSII. Thus, there is a contradiction, assuming DST production requires light (Pan et al., 1999; Tong et al., 2011) during the light phase (Pan et al., 1999; Jia et al., 2019) but is then inhibited by light.
Glycolate, as the starting unit of polyketide compounds, is only observed in dinoflagellates (Van Wagoner et al., 2014). For instance, it is seen in OA and DTX-1 (Needham et al., 1994) and the side chain of its diol esters DTX-4 and DTX-5a/b (Macpherson et al., 2003), and other polyketides such as amphidinol produced by Amphidinium carterae (Cutignano et al., 2017) and yessotoxin produced by Protoceratium reticulatum (Yamazaki et al., 2011). When oxygen concentrations increase, the ribulose-1,5-bisphosphate carboxylase/oxygenase (Rubisco) enzyme leads to the formation of both 3-phosphoglycera (PGA) and glycolate (Moroney et al., 2013). Glycolate then plays a role in the photorespiration pathway and exerts carbon and energy loss effects and photoprotection (Crawley et al., 2010). Glycolate in the P. lima complex participates in another donation pathway by converting pyruvate to hydroxypyruvate in the tricarboxylic acid (TCA) cycle (Needham et al., 1994). As it plays such a unique and essential role in the biosynthesis of DST and as a complex carbon source, whether it plays a crucial role in the regulation relationship between photoinhibition and DST production requires further study.
The increasing Rtox for OA and DTX-1 was observed in many strains of P. lima complex and P. caipirignum. This process is relevant to increasing photosynthetic yields for DST production because the increasing processes of Rtox in LL and ML strains are shorter than in HL, meaning that decreasing demand for DST production could reduce the increasing process. Accordingly, reducing the increasing process for DTX-1 in LL and ML strains under UVA addition was considered the result of increasing photosynthetic yield for the DST production. In the Exp. S (mentioned above), the increasing rate of Rtox was enhanced significantly by increasing light intensity and displayed an exponential correlation with light intensity (unpublished).
In Dinophysis species, mixotrophy helps provide additional carbon sources (Tong et al., 2015). DST production in Dinophysis species did not show a period of increase (Tong et al., 2011; Nielsen et al., 2013; Basti et al., 2018) before reaching a maximum OA Rtox of approximately 8 pg cell-1 d-1 (Nielsen et al., 2013). In contrast, the maximum OA Rtox in Prorocentrum species did not surpass 2.5 pg cell-1 d-1 (Figure 4B). Subsequently, the poor photosynthetic yield for DST production was correlated with carbon sources.
The carbon atoms for DST are sourced from intact or cleaved acetate units, except for glycolate, the starter unit. There is indirect evidence for enhancing DST production in mixotrophs in the P. lima complex. The addition of glycine, incorporated into DST production at C-37, C-38, C-45 and C-46 through conversion into acetate and glycolate, causes an increase in biomass. The increase is twice as much as the acetate addition in the P. lima complex (Needham et al., 1994). Further, the addition of amino acids that can be transformed into glycine or acetyl-CoA improved the maximum Rtox or yield of OA; in particular, lysine and serine resulted in approximately 1.5-fold and 1.6-fold improvements in the maximum Rtox and the total OA yield compared to the references (Figures 4B and S.13E, Souto et al., 2001). If identified, a mixotroph with putative extra carbon addition would eliminate the acceleration process and improve the maximum Rtox values, providing benefits for gaining DST from Prorocentrum species, which has an extended culture period and relatively low DST production rate (Camacho-Muñoz et al., 2021).
The timing of the Rtox trough coincided with the deficiency of available phosphate (Figures 1, 6). Notably, all decreasing Rtox rates positively depended on CDIP (Figure S.11). The well-fitted linear or exponential correlations in strains WZD145, SE10 and DS4G4 reflected a supply and demand link from phosphate availability to DST production (Figure 6). Furthermore, an unusually high Rtox in DS4G4-PAB on day 21 corresponded with an increased CDIP and is located on the positive line with other decreasing Rtox values (Figures 5, 6). While further confirmation is needed, an inference about the high phosphate demand of DST production seems reasonable and could explain the complex trends in Rtox values.
Previous studies have found that deficiencies in available phosphate and nitrogen increase toxin levels (McLachlan et al., 1994; Varkitzi et al., 2010; Hou et al., 2016; Gu et al., 2019). For instance, the OA cellular levels increased by 1.9-fold and 2.3-fold under 1/50-N and 1/20-P of the f/2 concentration than under f/2 conditions, respectively (Vanucci et al., 2010). However, low nutrient concentrations also slowed down the growth rate. It is unclear whether macronutrient levels directly or indirectly affect DST production.
Previous studies also indicate that cellular DST levels in the P. lima complex at the stationary growth phase are higher than at the exponential growth phase (reviewed by McLachlan et al., 1994; Quilliam et al., 1996; Nascimento et al., 2005; Varkitzi et al., 2010; Lee et al., 2016). However, this finding has only been observed in specific strains of the P. lima complex, such as the CCAP 1136/11 and CCMP2579 strains. Investigations into DST production in strains isolated from different areas and representing different phylogenies of the P. lima complex show that the highest cellular toxin levels occur before the stationary growth phase in the LM001-3 strain isolated from Cuba and Brazil (Moreira-González et al., 2019). It also occurred before the SHG101, QD502, and XS336 strains, which were isolated from China (Wu et al., 2020), and the BS4F5, SE10, and DS4G4 strains in this study (Figure S.9). Moreover, DST production in D. acuminata was found to mainly occur during the exponential growth phase (Tong et al., 2011), suggesting that limitation of growth is not required for DST production. Considering the constantly increasing process of Rtox in many strains of P. lima complex, the highest toxin content at the stationary phase might result from increasing Rtox values and decreasing growth rates.
D. acuminata does not utilize dissolved nitrate or phosphate, and its OA and DTX-1 production rates are directly associated with the availability of prey that has consumed these nutrients, which indirectly influences toxin production (Tong et al., 2015). The addition of organic substances obtained from sonicating ciliate Mesodinium rubrum (as prey) significantly enhanced the DST concentrations in D. acuminata (Nagai et al., 2011), indicating the mass nutrients required for DST production.
Nitrogen is not involved in DST production directly. Levels of recalculated Rtox were highest under the N-deficient treatment and lowest under stepwise nitrite addition (total 4.43 mM-N) and high nitrite treatment (1 mM-N) on day 20 (Figure S.15, McLachlan et al., 1994), demonstrating that DST production was prompted by nitrogen limitations and even nitrogen starvation conditions. The enhanced Rtox under restricted nitrogen levels might be due to changes in carbon flow. Under nitrogen limitations, the P. lima complex showed an increased expression of genes related to fatty acid biosynthesis and starch synthesis (Hou et al., 2018).
DST are polyketide compounds, and their biosynthesis is similar to the processes of fatty acids. Each acetate unit undergoing acetyl-CoA, ketoreduction (KR), dehydration (DH), and enoyl reduction (ER) prolongs the carbon chain (Van Wagoner et al., 2014). In contrast, some or all processes are omitted or skipped during PKS production. Though some carbons process carbon deletion, β-Alkylation, and pseudo-α-alkylation, most of the carbon atoms in OA come from the entire acetate unit. KR and ER processes need NADPH to reduce the keto group and double bond (Keatinge-Clay and Stroud, 2006). Finally, some other polyketides have been reported in the structure of ketoreductase with a cofactor NADP+ or bound with an NADPH (Korman et al., 2004; Keatinge-Clay and Stroud, 2006; Jiao et al., 2021). The regulation of NADPH in DST production could be the goal of further research based on the high correlation between Rtox and CDIP Values.
Results from the current study suggest that UVA can be utilized by P. lima complex and P. caipirignum for photosynthesis and to enhance growth. The sensitivity to UVR and inefficient photoprotection in strains BS4F5 and DS4G4 suggested the presence of ecotype in P. lima complex and P. caipirignum. Examination of the net toxin production rate (Rtox) provided insight into DST production in Prorocentrum. The relationship between OA and DTX-1 is competitive. When the capacity of DTX-1 production increased, the time for OA to reach its maximum would be delayed. The Rtox relationship between OA and DTX-1 would be linear, suggesting a competitive balance between the two compounds. Under photoinhibition, Rtox stagnated and increased when the photosynthesis activity was recovered. Then Rtox decreased linearly or exponentially with the phosphate consumption rate, suggesting the pivotal role of phosphate on DST production. Overall, the supply and demand relationship from photosynthetic yields and phosphate to the DST production could explain the complex trends of Rtox. This study may help us better understand how OA and DTX-1 interact and how pivotal factors affect the production of DST.
The original contributions presented in the study are included in the article/Supplementary Material material. Further inquiries can be directed to the corresponding author.
HC, KH, and SLu conceived the study; HC and SLiu performed the experiments; HC analyzed the data; HC, KH and SLu provided supervision and financial support; HZ supplied the examined strains; HC, KH, and WG wrote the manuscript with input from all authors. All authors contributed to the article and approved the submitted version.
This study was supported by the National Natural Science Foundation of China (42276157, 42076144, 41876173, 41706126, 42206136).
We acknowledge Lifen Huang, Huanyong Li and Aihua Hong for assisting with this study.
The authors declare that the research was conducted in the absence of any commercial or financial relationships that could be construed as a potential conflict of interest.
All claims expressed in this article are solely those of the authors and do not necessarily represent those of their affiliated organizations, or those of the publisher, the editors and the reviewers. Any product that may be evaluated in this article, or claim that may be made by its manufacturer, is not guaranteed or endorsed by the publisher.
The Supplementary Material for this article can be found online at: https://www.frontiersin.org/articles/10.3389/fmars.2023.1119370/full#supplementary-material
Aligizaki K., Nikolaidis G., Katikou P., Baxevanis A. D., Abatzopoulos T. J. (2009). Potentially toxic epiphytic Prorocentrum (Dinophyceae) species in Greek coastal waters. Harmful Algae 8, 299–311. doi: 10.1016/j.hal.2008.07.002
Allakhverdiev S. I., Murata N. (2004). Environmental stress inhibits the synthesis de novo of proteins involved in the photodamage-repair cycle of photosystem II in synechocystis sp. PCC 6803. Biochim. Biophys. Acta - Bioenerg. 1657, 23–32. doi: 10.1016/j.bbabio.2004.03.003
Anderson D. M., Kulis D. M., Sullivan J. J., Hall S., Lee C. (1990). Dynamics and physiology of saxitoxin production by the dinoflagellates alexandrium spp. Mar. Biol. 104, 511–524. doi: 10.1007/BF01314358
Barbier M., Amzil Z., Mondeguer F., Bhaud Y., Soyer-Gobillard M. O., Lassus P. (1999). Okadaic acid and PP2A cellular immunolocalization in Prorocentrum lima (Dinophyceae). Phycologia 38, 41–46. doi: 10.2216/i0031-8884-38-1-41.1
Barlow R. G., Mantoura R. F. C., Gough M. A., Fileman T. W. (1993). Pigment signatures of the phytoplankton composition in the northeastern Atlantic during the 1990 spring bloom. Deep Sea Res. Part II Top. Stud. Oceanogr. 40, 459–477. doi: 10.1016/0967-0645(93)90027-K
Basti L., Suzuki T., Uchida H., Kamiyama T., Nagai S. (2018). Thermal acclimation affects growth and lipophilic toxin production in a strain of cosmopolitan harmful alga Dinophysis acuminata. Harmful Algae 73, 119–128. doi: 10.1016/j.hal.2018.02.004
Burkholder J. M., Glibert P. M. (2006). Intraspecific variability: An important consideration in forming generalisations about toxigenic algal species. Afr. J. Mar. Sci. 28, 177–180. doi: 10.2989/18142320609504143
Camacho-Muñoz D., Praptiwi R. A., Lawton L. A., Edwards C. (2021). High value phycotoxins from the dinoflagellate Prorocentrum. Front. Mar. Sci. 8. doi: 10.3389/fmars.2021.638739
Chen H., Huang K., Liu S., Lu S. (2021). Enhancement effects of UV radiation on toxic benthic dinoflagellate Prorocentrum lima in both outdoor and indoor acclimation. J. Ocean Univ. China 20, 619–628. doi: 10.1007/s11802-021-4560-3
Cohen P., Holmes C. F. B., Tsukitani Y. (1990). Okadaic acid: a new probe for the study of cellular regulation. Trends Biochem. Sci. 15, 98–102. doi: 10.1016/0968-0004(90)90192-E
Cohu S., Lemee R., Lemée R. (2012). Vertical distribution of the toxic epibenthic dinoflagellates Ostreopsis cf. ovata, Prorocentrum lima and Coolia monotis in the NW Mediterranean Sea. Cah. Biol. Mar. 53, 373–380. doi: 10.21411/cbm.a.52bcacc4
Crawley A., Kline D. I., Dunn S., Anthony K., Dove S. (2010). The effect of ocean acidification on symbiont photorespiration and productivity in Acropora formosa. glob. Change Biol. 16, 851–863. doi: 10.1111/j.1365-2486.2009.01943.x
Cutignano A., Nuzzo G., Sardo A., Fontana A. (2017). The missing piece in biosynthesis of amphidinols: First evidence of glycolate as a starter unit in new polyketides from Amphidinium carterae. mar. Drugs 15, 1–12. doi: 10.3390/md15060157
David H., Laza-Martínez A., Kromkamp J. C., Orive E. (2018). Physiological response of Prorocentrum lima (Dinophyceae) to varying light intensities. FEMS Microbiol. Ecol. 94, 1–12. doi: 10.1093/femsec/fix166
European Food Safety Authority (EFSA) (2009). Influence of processing on the levels of lipophilic marine biotoxins in bivalve molluscs. EFSA J. 1016,1-10. doi: 10.2903/j.efsa.2009.1016
Fu L., Zhao X., dan L., Xu J. (2019). Okadaic acid (OA): Toxicity, detection and detoxification. Toxicon 160, 1-7. doi: 10.1016/j.toxicon.2018.12.007
Gallagher J. C. (1982). Physiological variation and electrophoretic banding patterns of genetically different seasonal populations of Skeletonema costatum (BACILLARIOPHYCEAE). J. Phycol. 18, 148–162. doi: 10.1111/j.1529-8817.1982.tb03169.x
García-Portela M., Riobó P., Reguera B., Garrido J. L., Blanco J., Rodríguez F. (2018). Comparative ecophysiology of Dinophysis acuminata and d. acuta (Dinophyceae, dinophysiales): effect of light intensity and quality on growth, cellular toxin content, and photosynthesis. J. Phycol 54, 899–917. doi: 10.1111/jpy.12794
Gu S., Xiao S. W., Zheng J. W., Li H. Y., Liu J. S., Yang W. D. (2019). ABC Transporters in Prorocentrum lima and their expression under different environmental conditions including okadaic acid production. Mar. Drugs 17, 259. doi: 10.3390/md17050259
Hallegraeff G. M., Anderson D. M., Belin C., Bottein M.-Y. D., Bresnan E., Chinain M., et al. (2021). Perceived global increase in algal blooms is attributable to intensified monitoring and emerging bloom impacts. Commun. Earth Environ. 2, 117. doi: 10.1038/s43247-021-00178-8
Hardison D. R., Sunda W. G., Tester P. A., Shea D., Wayne Litaker R. (2014). Increased cellular brevetoxins in the red tide dinoflagellate Karenia brevis under CO2 limitation of growth rate: Evolutionary implications and potential effects on bloom toxicity. Limnol Oceanogr 59, 560–577. doi: 10.4319/lo.2014.59.2.0560
Hashimoto K., Uchida H., Nishimura T., Oikawa H., Funaki H., Honma C., et al. (2021). Determination of optimal culture conditions for toxin production by a Prorocentrum lima complex strain with high diarrhetic shellfish toxins yield. Harmful Algae 103, 102025. doi: 10.1016/j.hal.2021.102025
Hou D., Liang J., Zou C., Li H., Liu J., dong W. (2016). MRP functional activity and character in the dinoflagellate Prorocentrum lima. J. Appl. Phycol. 28, 1667–1676. doi: 10.1007/s10811-015-0679-1
Hou D., Mao X., Gu S., Li H., Liu J., Yang W. (2018). Systems-level analysis of metabolic mechanism following nitrogen limitation in benthic dinoflagellate Prorocentrum lima. Algal Res. 33, 389–398. doi: 10.1016/j.algal.2018.06.004
Hu T., Marr J., de Freitas A. S. W., Quilliam M. A., Walter J. A., Wright J. L. C., et al. (1992). New diol esters isolated from cultures of the dinoflagellates Prorocentrum lima and Prorocentrum concavum. J. Nat. Prod 55, 1631–1637. doi: 10.1021/np50089a011
Hu W., Xu J., Sinkkonen J., Wu J. (2010). Polyketides from marine dinoflagellates of the genus Prorocentrum, biosynthetic origin and bioactivity of their okadaic acid analogues. Mini-Reviews Medicinal Chem. 10, 51–61. doi: 10.2174/138955710791112541
Jia Y., Gao H., Tong M., Anderson D. M. (2019). Cell cycle regulation of the mixotrophic dinoflagellate Dinophysis acuminata: Growth, photosynthetic efficiency and toxin production. Harmful Algae 89, 101672. doi: 10.1016/j.hal.2019.101672
Jiao F. W., Wang Y. S., You X. T., Wei W., Chen Y., Yang C. L., et al. (2021). An NADPH-dependent ketoreductase catalyses the tetracyclic to pentacyclic skeletal rearrangement in chartreusin biosynthesis. Angew Chem. Int. Edit . 60 (50), 26378–26384. doi: 10.1002/anie.202112047
Keatinge-Clay A. T., Stroud R. M. (2006). The structure of a ketoreductase determines the organization of the β-carbon processing enzymes of modular polyketide synthases. Structure . 14 (4), 737–748. doi: 10.1016/j.str.2006.01.009
Koike K., Sato S., Yamaji M., Nagahama Y., Kotaki Y., Ogata T., et al. (1998). Occurrence of okadaic acid-producing Prorocentrum lima on the sanriku coast, northern Japan. Toxicon 36, 2039–2042. doi: 10.1016/S0041-0101(98)00132-9
Korman T. P., Hill J. A., Thanh N. V., Tsai S. C. (2004). Structural analysis of actinorhodin polyketide ketoreductase: Cofactor binding and substrate specificity. Biochemistry 43 (46), 14529–14538. doi: 10.1021/bi048133a
Krock B., Tillmann U., John U., Cembella A. (2008). LC-MS-MS aboard ship: Tandem mass spectrometry in the search for phycotoxins and novel toxigenic plankton from the north Sea. Anal. Bioanal Chem. 392 (5), 797–803. doi: 10.1007/s00216-008-2221-7
Lalegerie F., Lajili S., Bedoux G., Taupin L., Stiger-Pouvreau V., Connan S. (2019). Photo-protective compounds in red macroalgae from Brittany: Considerable diversity in mycosporine-like amino acids (MAAs). Mar. Environ. Res. 147, 37–48. doi: 10.1016/j.marenvres.2019.04.001
Lee T. C. H., Fong F. L. Y., Ho K. C., Lee F. W. F. (2016). The mechanism of diarrhetic shellfish poisoning toxin production in Prorocentrum spp.: Physiological and molecular perspectives. Toxins (Basel). 8, 272. doi: 10.3390/toxins8100272
Lee L. K., Lim Z. F., Gu H., Chan L. L., Litaker R. W., Tester P. A., et al. (2020). Effects of substratum and depth on benthic harmful dinoflagellate assemblages. Sci. Rep. 10, 1–15. doi: 10.1038/s41598-020-68136-6
Li Z., Lan T., Zhang J., Gao K., Beardall J., Wu Y. (2021). Nitrogen limitation decreases the repair capacity and enhances photoinhibition of photosystem ii in a diatom. Photochem. Photobiol. 97, 745–752. doi: 10.1111/php.13386
López-Rosales L., Gallardo-Rodríguez J. J., Sánchez-Mirón A., Cerón-García M., del C., Belarbi E. H., et al. (2014). Simultaneous effect of temperature and irradiance on growth and okadaic acid production from the marine dinoflagellate Prorocentrum belizeanum. Toxins (Basel). 6, 229–253. doi: 10.3390/toxins6010229
Louzao M. C., Fernández D. A., Abal P., Fraga M., Vilariño N., Vieytes M. R., et al. (2015). Diarrhetic effect of okadaic acid could be related with its neuronal action: Changes in neuropeptide y. Toxicol. Lett. 237, 151–160. doi: 10.1016/j.toxlet.2015.06.004
Luo Z., Zhang H., Krock B., Lu S., Yang W., Gu H. (2017). Morphology, molecular phylogeny and okadaic acid production of epibenthic Prorocentrum (Dinophyceae) species from the northern south China Sea. Algal Res. 22, 14–30. doi: 10.1016/j.algal.2016.11.020
Mackenzie L. A. (2019). A long-term time series of Dinophysis acuminata blooms and associated shellfish toxin contamination in port underwood, Marlborough sounds, new Zealand. Toxins (Basel) 11 (2), 74. doi: 10.3390/toxins11020074
Macpherson G. R., Burton I. W., Leblanc P., Walter J. A., Wright J. L. C. (2003). Studies of the biosynthesis of DTX-5a and DTX-5b by the dinoflagellate Prorocentrum maculosum : Regiospecificity of the putative baeyer - villigerase and insertion of a single amino acid in a polyketide chain. J. Org. Chem. 68 (5), 1659–1664. doi: 10.1021/jo0204754
Mafra L. L., Nolli P. K. W., Mota L. E., Domit C., Soeth M., Luz L. F. G., et al. (2019). Multi-species okadaic acid contamination and human poisoning during a massive bloom of Dinophysis acuminata complex in southern Brazil. Harmful Algae 89, 101662. doi: 10.1016/j.hal.2019.101662
Martino S., Gianella F., Davidson K. (2020). An approach for evaluating the economic impacts of harmful algal blooms: The effects of blooms of toxic dinophysis spp. on the productivity of Scottish shellfish farms. Harmful Algae 99, 101912. doi: 10.1016/j.hal.2020.101912
McLachlan J. L., Marr J. C., Conlon-Keily A., Adamson A. (1994). Effects of nitrogen concentration and cold temperature on DSP-toxin concentrations in the dinoflagellate Prorocentrum lima (prorocentrales, dinophyceae). Nat. Toxins 2, 263–270. doi: 10.1002/nt.2620020504
Moreira-González A. R., Fernandes L. F., Uchida H., Uesugi A., Suzuki T., Chomérat N., et al. (2019). Variations in morphology, growth, and toxicity among strains of the Prorocentrum lima species complex isolated from Cuba and Brazil. J. Appl. Phycol. 31, 519–532. doi: 10.1007/s10811-018-1587-y
Moroney J. V., Jungnick N., Dimario R. J., Longstreth D. J. (2013). Photorespiration and carbon concentrating mechanisms: Two adaptations to high O2, low CO2 conditions. Photosynth. Res. 117, 121–131. doi: 10.1007/s11120-013-9865-7
Morton S. L., Bomber J. W., Tindall P. M. (1994). Environmental effects on the production of okadaic acid from Prorocentrum hoffmannianum Faust i. temperature, light, and salinity. J. Exp. Mar. Bio. Ecol. 178, 67–77. doi: 10.1016/0022-0981(94)90225-9
Morton S. L., Norris D. R., Bomber J. W. (1992). Effect of temperature, salinity and light intensity on the growth and seasonality of toxic dinoflagellates associated with ciguatera. J. Exp. Mar. Bio. Ecol. 157, 79–90. doi: 10.1016/0022-0981(92)90076-M
Murakami Y., Oshima Y., Yasumoto T. (1982). Identification of okadaic acid as a toxic component of a marine dinoflagellate Prorocentrum lima. Nippon Suisan Gakkaishi 48, 69–72. doi: 10.2331/suisan.48.69
Nagai S., Suzuki T., Nishikawa T., Kamiyama T. (2011). Differences in the production and excretion kinetics of okadaic acid, dinophysistoxin-1, and pectenotoxin-2 between cultures of Dinophysis acuminata and Dinophysis fortii isolated from western japan. J. Phycol 47, 1326–1337. doi: 10.1111/j.1529-8817.2011.01076.x
Nakahara H., Sakami T., Chinain M., Ishida Y. (1996). The role of macroalgae in epiphytism of the toxic dinoflagellate Gambierdiscus toxicus (Dinophyceae). Phycol. Res. 44, 113–117. doi: 10.1111/j.1440-1835.1996.tb00385.x
Nascimento S. M., Mendes M. C. Q., Menezes M., Rodríguez F., Alves-de-Souza C., Branco S., et al. (2017). Morphology and phylogeny of Prorocentrum caipirignum sp. nov. (Dinophyceae), a new tropical toxic benthic dinoflagellate. Harmful Algae 70, 73–89. doi: 10.1016/j.hal.2017.11.001
Nascimento S. M., Purdie D. A., Morris S. (2005). Morphology, toxin composition and pigment content of Prorocentrum lima strains isolated from a coastal lagoon in southern UK. Toxicon 45, 633–649. doi: 10.1016/j.toxicon.2004.12.023
Needham J., McLachlan J. L., Walter J. A., Wright J. L. C. (1994). Biosynthetic origin of c-37 and c-38 in the polyether toxins okadaic acid and dinophysistoxin-1. J. Chem. Soc Chem. Commun. 22, 2599–2600. doi: 10.1039/c39940002599
Nielsen L. T., Krock B., Hansen P. J. (2013). Production and excretion of okadaic acid, pectenotoxin-2 and a novel dinophysistoxin from the DSP-causing marine dinoflagellate Dinophysis acuta - effects of light, food availability and growth phase. Harmful Algae 23, 34–45. doi: 10.1016/j.hal.2012.12.004
Nishimura T., Uchida H., Noguchi R., Oikawa H., Suzuki T., Funaki H., et al. (2020). Abundance of the benthic dinoflagellate Prorocentrum and the diversity, distribution, and diarrhetic shellfish toxin production of Prorocentrum lima complex and p. caipirignum Japan. Harmful Algae 96, 101687. doi: 10.1016/j.hal.2019.101687
Pan Y., Cembella A., Quilliam M. A. (1999). Cell cycle and toxin production in the benthic dinoflagellate Prorocentrum lima. Mar. Biol. 134, 541–549. doi: 10.1007/s002270050569
Park M. G., Park J. S., Kim M., Yih W. (2008). Plastid dynamics during survival of Dinophysis caudata without its ciliate prey. J. Phycol 44, 1154–1163. doi: 10.1111/j.1529-8817.2008.00579.x
Patil J. S., Rodrigues R. V., Paul P., Sathish K., Rafi M., Anil A. C. (2017). Benthic dinoflagellate blooms in tropical intertidal rock pools: elucidation of photoprotection mechanisms. Mar. Biol. 164, 89. doi: 10.1007/s00227-017-3123-z
Pleasance S., Quilliam M. A., de Freitas A. S. W. (1990). Ion-spray mass spectrometry of marine toxins 11. analysis of diarrhetic shellfish toxins in plankton by liquid chromatography / mass spectrometry? Rapid Commun. Mass Spectrometry 4, 206–213. doi: 10.1002/rcm.1290040608
Praptiwi R. A. (2014). Optimisation of high value metabolite production from benthic marine dinoflagellate Prorocentrum lima. Robert Gordon University 148-155. doi: 10.1002/rcm.1290040608
Quilliam M. A., Ishida N., Mclachlan J. L., Ross N. W., Windust A. J. (1996). “Production of diarrhetic shellfish poisoning (DSP) toxins by Prorocentrum lima in culture and development of analytical methods,” in Harmful and toxic algal blooms (Paris: IOC/UNESCO).
Ransom Hardison D., Sunda W. G., Wayne Litaker R., Shea D., Tester P. A. (2012). Nitrogen limitation increases brevetoxins in karenia brevis (Dinophyceae): Implications for bloom toxicity. J. Phycol. 48 (4), 844–858. doi: 10.1111/j.1529-8817.2012.01186.x
Reguera B., Velo-Suárez L., Raine R., Park M. G. (2012). Harmful Dinophysis species: A review. Harmful Algae 14, 87–106. doi: 10.1016/j.hal.2011.10.016
Reñé A., Hoppenrath M., Reboul G., Moreira D., López-García P. (2021). Composition and temporal dynamics of sand-dwelling dinoflagellate communities from three Mediterranean beaches. Aquat. Microb. Ecol. 86, 85–98. doi: 10.3354/ame01960
Richlen M. L., Lobel P. S. (2011). Effects of depth, habitat, and water motion on the abundance and distribution of ciguatera dinoflagellates at Johnston atoll, pacific ocean. Mar. Ecol. Prog. Ser. 421, 51–66. doi: 10.3354/meps08854
Schaeffer B. A., Kamykowski D., McKay L., Sinclair G., Milligan E. J. (2007). A comparison of photoresponse among ten different Karenia brevis (Dinophyceae) isolates. J. Phycol. 43 (4), 702–714. doi: 10.1111/j.1529-8817.2007.00377
Souto M. L., Fernández J. J., Norte M., Fernández M. L., Martínez A. (2001). Influence of amino acids on okadaic acid production. Toxicon 39, 659–664. doi: 10.1016/S0041-0101(00)00190-2
Strasser R. J., Srivastava A., Tsimilli-Michael M. (2000). “. the fluorescence transient as a tool to characterize and screen photosynthetic samples,” in Probing photosynthesis: Mechanism, regulation and adaptation. Eds. Yunus M., Pathre U., Mohanty P. (London: Taylor and Francis), 445–483.
Suggett D. J., Goyen S., Evenhuis C., Szabó M., Pettay D. T., Warner M. E., et al. (2015). Functional diversity of photobiological traits within the genus Symbiodinium appears to be governed by the interaction of cell size with cladal designation. New Phytol. 208, 370–381. doi: 10.1111/nph.13483
Sugg L. M., VanDolah F. M. (1999). No evidence for an allelopathic role of okadaic acid among ciguatera-associated dinoflagellates. J. Phycol. 35 (1), 93–103. doi: 10.1046/j.1529-8817.1999.3510093.x
Taira H., Aoki S., Yamanoha B., Taguchi S. (2004). Daily variation in cellular content of UV-absorbing compounds mycosporine-like amino acids in the marine dinoflagellate Scrippsiella sweeneyae. J. Photochem. Photobiol. B Biol. 75, 145–155. doi: 10.1016/j.jphotobiol.2004.06.002
Takahashi S., Badger M. R. (2011). Photoprotection in plants: a new light on photosystem II damage. Trends Plant Sci. 16, 53–60. doi: 10.1016/j.tplants.2010.10.001
Takahashi S., Murata N. (2008). How do environmental stresses accelerate photoinhibition? Trends Plant Sci. 13, 178–182. doi: 10.1016/j.tplants.2008.01.005
Thessen A. E., Bowers H. A., Stoecker D. K. (2009). Intra- and interspecies differences in growth and toxicity of Pseudo-nitzschia while using different nitrogen sources. Harmful Algae 8, 792–810. doi: 10.1016/j.hal.2009.01.003
Tong M., Kulis D. M., Fux E., Smith J. L., Hess P., Zhou Q., et al. (2011). The effects of growth phase and light intensity on toxin production by Dinophysis acuminata from the northeastern united states. Harmful Algae 10, 254–264. doi: 10.1016/j.hal.2010.10.005
Tong M., Smith J. L., Kulis D. M., Anderson D. M. (2015). Role of dissolved nitrate and phosphate in isolates of Mesodinium rubrum and toxin-producing Dinophysis acuminata. Aquat. Microbial Ecol. 75, 169–185. doi: 10.3354/ame01757
Torsi G., Chiavari G., Laghi C., Asmudsdottir A. M. (1990). Responses of different UV-visible detectors in high-performance liquid chromatographic measurements when the absolute number of moles of an analyte is measured. J. Chromatogr. A 518, 135–140. doi: 10.1016/S0021-9673(01)93168-1
Tyystjärvi E., Aro E. M. (1996). The rate constant of photoinhibition, measured in lincomycin-treated leaves, is directly proportional to light intensity. Proc. Natl. Acad. Sci. U. S. A. 93, 2213–2218. doi: 10.1073/pnas.93.5.2213
Valdiglesias V., Prego-Faraldo M. V., Paśaro E., Meńdez J., Laffon B. (2013). Okadaic acid: More than a diarrheic toxin. Mar. Drugs 11(11), 4328-4349. doi: 10.3390/md11114328
Vanucci S., Guerrini F., Milandri A., Pistocchi R. (2010). Effects of different levels of n- and p-deficiency on cell yield, okadaic acid, DTX-1, protein and carbohydrate dynamics in the benthic dinoflagellate Prorocentrum lima. Harmful Algae 9, 590–599. doi: 10.1016/j.hal.2010.04.009
Van Wagoner R. M., Satake M., Wright J. L. C. (2014). Polyketide biosynthesis in dinoflagellates: what makes it different? Nat. Prod. Rep. 31, 1101. doi: 10.1039/C4NP00016A
Varkitzi I., Pagou K., Granéli E., Hatzianestis I., Pyrgaki C., Pavlidou A., et al. (2010). Unbalanced N:P ratios and nutrient stress controlling growth and toxin production of the harmful dinoflagellate Prorocentrum lima (Ehrenberg) dodge. Harmful Algae 9, 304–311. doi: 10.1016/j.hal.2009.12.001
Vilariño N., Louzao M. C., Abal P., Cagide E., Carrera C., Vieytes M. R., et al. (2018). Human poisoning from marine toxins: Unknowns for optimal consumer protection. Toxins (Basel) 10 (8), 324. doi: 10.3390/toxins10080324
Villareal T. A., Morton S. L. (2002). Use of cell-specific PAM-fluorometry to characterize host shading in the epiphytic dinoflagellate Gambierdiscus toxicus. Mar. Ecol. 23, 127–140. doi: 10.1046/j.1439-0485.2002.02777.x
Windust A. J., Wright J. L. C., McLachlan J. L. (1996). The effects of the diarrhetic shellfish poisoning toxins, okadaic acid and dinophysistoxin-1, on the growth of microalgae. Mar. Biol. 126 (1), 19–25. doi: 10.1007/BF00571373
Wu H., Chen J., Peng J., Zhong Y., Zheng G., Guo M., et al. (2020). Nontarget screening and toxicity evaluation of diol esters of okadaic acid and dinophysistoxins reveal intraspecies difference of Prorocentrum lima. environ. Sci. Technol. 54, 12366–12375. doi: 10.1021/acs.est.0c03691
Yamazaki M., Tachibana K., Satake M. (2011). Complete 13C-labeling pattern of yessotoxin a marine ladder-frame polyether. Tetrahedron 67, 877–880. doi: 10.1016/j.tet.2010.12.015
Yasumoto T., Oshima Y., Sugawara W., Fukuyo Y., Oguri H., Igarashi T., et al. (1980). Identification of Dinophysis fortii as the causative organism of diarrhetic shellfish poisoning. Nippon Suisan Gakkaishi 46, 1405–1411. doi: 10.2331/suisan.46.1405
Yasumoto T., Oshima Y., Yamaguchi M. (1978). Occurrence of a new type of shellfish poisoning in the tohoku district. Nippon Suisan Gakkaishi 44, 1249–1255. doi: 10.2331/suisan.44.1249
Young N., Robin C., Kwiatkowska R., Beck C., Mellon D., Edwards P., et al. (2019). Outbreak of diarrhetic shellfish poisoning associated with consumption of mussels, united kingdom, may to June 2019. Eurosurveillance 24, 1–5. doi: 10.2807/1560-7917.ES.2019.24.35.1900513
Zhang H., Li Y., Cen J., Wang H., Cui L., Dong Y., et al. (2015). Morphotypes of Prorocentrum lima (Dinophyceae) from hainan island, south China Sea: Morphological and molecular characterization. Phycologia 54, 503–516. doi: 10.2216/15-8.1
Keywords: light, morphotype, okadaic acid (OA), Prorocentrum lima complex, diarrhetic shellfish toxins (DST)
Citation: Chen H, Huang K, Guan W, Zhang H, Liu S and Lu S (2023) Diarrhetic shellfish toxins production appears to be driven by photosynthesis and phosphate–revealed by different light-adapted strains of Prorocentrum lima complex and P. caipirignum. Front. Mar. Sci. 10:1119370. doi: 10.3389/fmars.2023.1119370
Received: 08 December 2022; Accepted: 06 January 2023;
Published: 08 February 2023.
Edited by:
Pengzhi Qi, Zhejiang Ocean University, ChinaReviewed by:
Sai Elangovan S., Centre for Marine Living Resources and Ecology (CMLRE), IndiaCopyright © 2023 Chen, Huang, Guan, Zhang, Liu and Lu. This is an open-access article distributed under the terms of the Creative Commons Attribution License (CC BY). The use, distribution or reproduction in other forums is permitted, provided the original author(s) and the copyright owner(s) are credited and that the original publication in this journal is cited, in accordance with accepted academic practice. No use, distribution or reproduction is permitted which does not comply with these terms.
*Correspondence: Songhui Lu, bHVzb25naHVpMTk2M0AxNjMuY29t
†These authors have contributed equally to this work
Disclaimer: All claims expressed in this article are solely those of the authors and do not necessarily represent those of their affiliated organizations, or those of the publisher, the editors and the reviewers. Any product that may be evaluated in this article or claim that may be made by its manufacturer is not guaranteed or endorsed by the publisher.
Research integrity at Frontiers
Learn more about the work of our research integrity team to safeguard the quality of each article we publish.