 Xiuliang Wang
 Xiaoqi Yang1,2,3
 Chang Lu
 Delin Duan
95% of researchers rate our articles as excellent or good
Learn more about the work of our research integrity team to safeguard the quality of each article we publish.
Find out more
ORIGINAL RESEARCH article
Front. Mar. Sci. , 26 January 2023
Sec. Marine Molecular Biology and Ecology
Volume 10 - 2023 | https://doi.org/10.3389/fmars.2023.1116412
This article is part of the Research Topic Seaweed Phylogenetics, Evolution and Biogeography View all 6 articles
MAS (marker assisted selection) is useful for cultivar development in the lower plant Saccharina japonica. In this study, 167 screened SSR markers and 125 individuals were used to construct a S.japonica genetic linkage map with 27 linkage groups and a total Haldane length of 2069 cM. Constructed linkage groups were aligned with assembled pseudo-chromosomes of S. japonica genome sequences (NCBI: MEHQ00000000) and anchored to 23 of 31 pseudo-chromosomes. A genetic linkage map including 33 linkage groups was constructed with combined 3397 SSR and SNP markers. In the integrated genetic map used for QTL mapping, SSR marker M1895 was closely associated with the major QTL for blade length and width with LOD threshold of >5.0. Annotation indicated that SjPT, coded as a high affinity phosphate transporter, was mapped to this major QTL with cDNA sequence of 1422 bp, which coded 473 aa for 8 transmembrane helics. qRT-PCR and the transcriptomic detection confirmed that SjPT transcription was consistent with increases in kelp blade length and width. Marker M1895 appears to be particularly useful for MAS (marker assisted selection) in S. japonica breeding.
Saccharina japonica has been commercially cultivated on large scale in China for nearly seventy years with 2020 productivity of 1651,673 tons (dry weight), production due in part to applications related to elite varieties (FAO, 2022). Generally, new S. japonica varieties have been developed through selection and hybridization related to blade length, blade width and blade thickness (Hwang et al., 2019; Wang et al., 2020). Recently, marker assisted selection (MAS) has been adopted in commercial seaweed breeding (Bernardo, 2008; Collard and Mackill, 2008; Wang et al., 2020).
In higher plants, QTL mapping has successfully deciphered genotypes for many yield related traits (Xing and Zhang, 2010; Zuo and Li, 2014; Tian et al., 2019; Zhang et al., 2022). However, there are only a limited number of reports on seaweeds such as Pyropia yezoensis (Huang and Yan, 2019; Wang et al., 2021), Pyropia hatanensis (Xu et al., 2015), Undaria pinnatifida (Shan et al., 2015), Ectocarpus sp. (Heesch et al., 2010; Avia et al., 2017). Linkage maps have been constructed for S. japonica with dominant or co-dominant markers (Li Y.H. et al., 2007; Yang et al., 2009; Liu et al., 2009; Liu et al., 2010; Zhang et al., 2015; Zhang et al., 2015b; Wang et al., 2018) but those maps do not compare well to each other due to the nonspecific nature of dominant markers or the scarcity of selected anchor markers. Therefore, there is need for a single set of anchor markers for S. japonica to allow construction of a genetic linkage map that can be compared with and even integrated into QTL mapping.
Ecologically, the phenotype of Laminarials in the field can be affected by biotic and abiotic factors in the field such as waves, temperature, photoperiod and grazing (Dring, 1982; Hurd et al., 2014). Genetically, although genome sequencing for macroalgae is progressing, few genes have been fully characterized for brown algae morphology (Charrier et al., 2012). Many QTLs associated with blade length and width in S. japonica have been detected (Liu et al., 2010; Zhang et al., 2015; Wang et al., 2018), and candidate genes have been localized (Chen et al., 2019) but the molecular mechanism underlying the blade length and width in S. japonica deserves additional exploration.
Reflecting how important genetic linkage maps are in genome assembling (Rice and Green, 2019), for the brown seaweed model species Ectocarpus spp., a linkage map was based on 406 SSR markers and an attempt was made to anchor 325 of longest super contigs representing 70.1% of the genome sequence (Heesch et al., 2010). Draft S. japonica genome sequences (Ye et al., 2015; Liu et al., 2019) contain many unassembled contigs and scaffolds (Fan et al., 2020), suggesting that a genetic linkage map with anchor markers could significantly improve S. japonica genome assembly.
The present study describes a primary genetic linkage map with SSR markers anchored in pseudo-chromosomes (NCBI: MEHQ00000000). Together with previously reported SNP-based linkage map, the present study’s successful mapping of QTL association with blade length and width should help S. japonica MAS in the future.
The ever extensively cultivated “860” variety of S.japonica and the species S.longissima were selected as parents for the mapping population. Variety “860” usually has blade length of 240.2±23.1 cm and a blade width 25.4±3.0 cm; S.longissima usually has blade length of 5~8 m and blade width of 15~25 cm (Zhang et al., 2007; Zhang et al., 2015). Morphology of S.japonica and S.longissima in the wild has been described (Kawashima, 2012). The mapping population used in this study for genetic linkage maping and QTL mapping for S. japonica has been reported (2018). In brief, the male gametophytes of “860” and the female gametophytes of S. longissima were crossed to produce F1 hybrid generation. After cultured F1 sporophytes in the laboratory reached 1~2 cm in blade length, seedlings were moved to outdoor cultivation in the sea at Shandong Gaolv Aquatic Farm (E122°62´, N37°22´). Subsequently, one mature F1 sporophyte was selected for self-fertilization in the laboratory to produce the F2 mapping population. The F2 population was cultivated in the same sea farming area as the F1 population. Blade length and width of individual sporophytes were measured at different observation days during cultivation, with blade length measured from the top of stipe to the blade tip and blade width measured at the widest part of the blade.
DNA extraction for samples was according to established method (Wang et al., 2004). 182 simple sequence repeat (SSR) markers selected from over 2000 SSRs were used for a genetic linkage map (Table S1). Selected SSR markers could produce polymorphic and expected reproducible DNA bands between two parents as well as from F2 individuals. Some of the selected markers have been reported (Shi et al., 2007; Zhang et al., 2015; Zhang et al., 2015a) and 128 markers were developed by our group (Li et al., 2016). SSR marker analysis was via an ABI PRISM 3730 sequencer (Applied Biosystems, USA). Marker alleles were sized using GeneMapper ID v3.2 (Zhang et al., 2017).
JoinMap 5 (van Ooijen, 2018) was used for genetic linkage map construction. Segregation on each SSR marker locus from the expected 1:2:1 Mendelian segregation ration was checked by a χ2–test (p=0.05). Loci with significantly distorted segregation were removed. LOD score of >4.0 was set as the linkage threshold for grouping markers. Haldane mapping function was adopted for calculating map distance between markers.
SSR markers on the genetic linkage map were aligned with assembled kelp pseudo-chromosomes (NCBI: MEHQ00000000) with BLASTN (Altschul et al., 1990). Based on BLAST analysis with right and left primers anchored on the same pseudo-chromosome and with expected length of ePCR products, SSR markers were assumed to be located on the targeted pseudo-chromosome.
JoinMap 5 (van Ooijen, 2018) was used to integrate the SSR-based genetic linkage map with the previously constructed SNP-based genetic linkage map (Wang et al., 2018). QTL IciMapping (Li et al., 2007) and MapQTL 6 (van Ooijen, 2009) were applied to blade length and width based on the integrated genetic linkage map. The inclusive composite interval mapping (ICIM) model in software QTL IciMapping, and the interval mapping (IM) model in MapQTL6.0 were used for QTL mapping. The genome-wide significant threshold of each trait was determined by permutation test of more than 1,000 times at P< 0.05 in MapQTL 6 (van Ooijen, 2009).
Candidate genes for QTL were analyzed by established method (Wang et al., 2018). In brief, primer sequences corresponding to marker in the mapped QTL were used in a BLAST analysis and compared with kelp assembled genome sequences (MEHQ00000000). Candidate genes were annotated and analyzed via the NCBI database (http://www.ncbi.nlm.nih.gov). SjPT (registered as ON872174 in NCBI) and the other orthologous proteins (Table S5) were phylogenetically analyzed by software MEGA 11 (Tamura et al., 2021). The phylogenetic tree was generated by maximum likelihood (ML) with best LG+G5 model, complete deletion of gap and 1000 bootstrap (Tamura et al., 2021). Online server TMHMM (https://services.healthtech.dtu.dk/service.php?TMHMM-2.0) was used to predict transmembrane helics (Table S5). PIs and molecular weight (MW) were deduced by the ExPASyProParam (https://web.expasy.org/protparam/) (Table S5). Cellular localization of SjPT was predicted with online server Cellon (http://cello.life.nctu.edu.tw).
RNA extraction and RT-qPCR analysis were by established method (Wang et al., 2018). Sporophyte blades of the “90-1” S.japonica strain (Zhang et al., 2007) cultivated at Shandong Gaolv Aquatic Farm (E122°62´, N37°22´) were collected on five observation days for RNA extraction. Meristematic tissue in the joint between blade and stipe was used to extract RNA. Primer pairs specific to SjPT for 150-bp amplicon region were in the Table S6. Transcript profiling of SjPT was examined according to the method described by Lu et al. (2020). T ranscriptome data used (NCBI: PRJN512328) was reported by Shao et al. (2019). RSEM software (Li and Dewey, 2011) was used to analyze gene abundance and expression levels were normalized by fragments per kilobase of transcript per million mapped reads (FPKM). EdgeR package was used to identify differentially expressed genes (Robinson et al., 2010).
125 S.japonica individuals were genotyped with 182 SSR markers. Segregation and mapping analysis resulted in 15 SSR markers being excluded or unmapped due to segregation distortion or duplication. The remaining 167 SSR markers were mapped on 27 linkage groups (Table 1; Figure S1) that included 5 doublets (Lg4, Lg20, Lg21, Lg26, Lg27) and 3 triplets (Lg3, Lg19, Lg25). Linkage group lengths ranged from 2.09 cM (Lg20) to 281.45 cM (Lg1), with average length 13.07 cM and total length 2069.07 cM. Between 2 and 20 markers were mapped on each linkage group, with an average of 6.2 markers per group. Yielded map density of the marker loci was 1 per 12.39 cM.
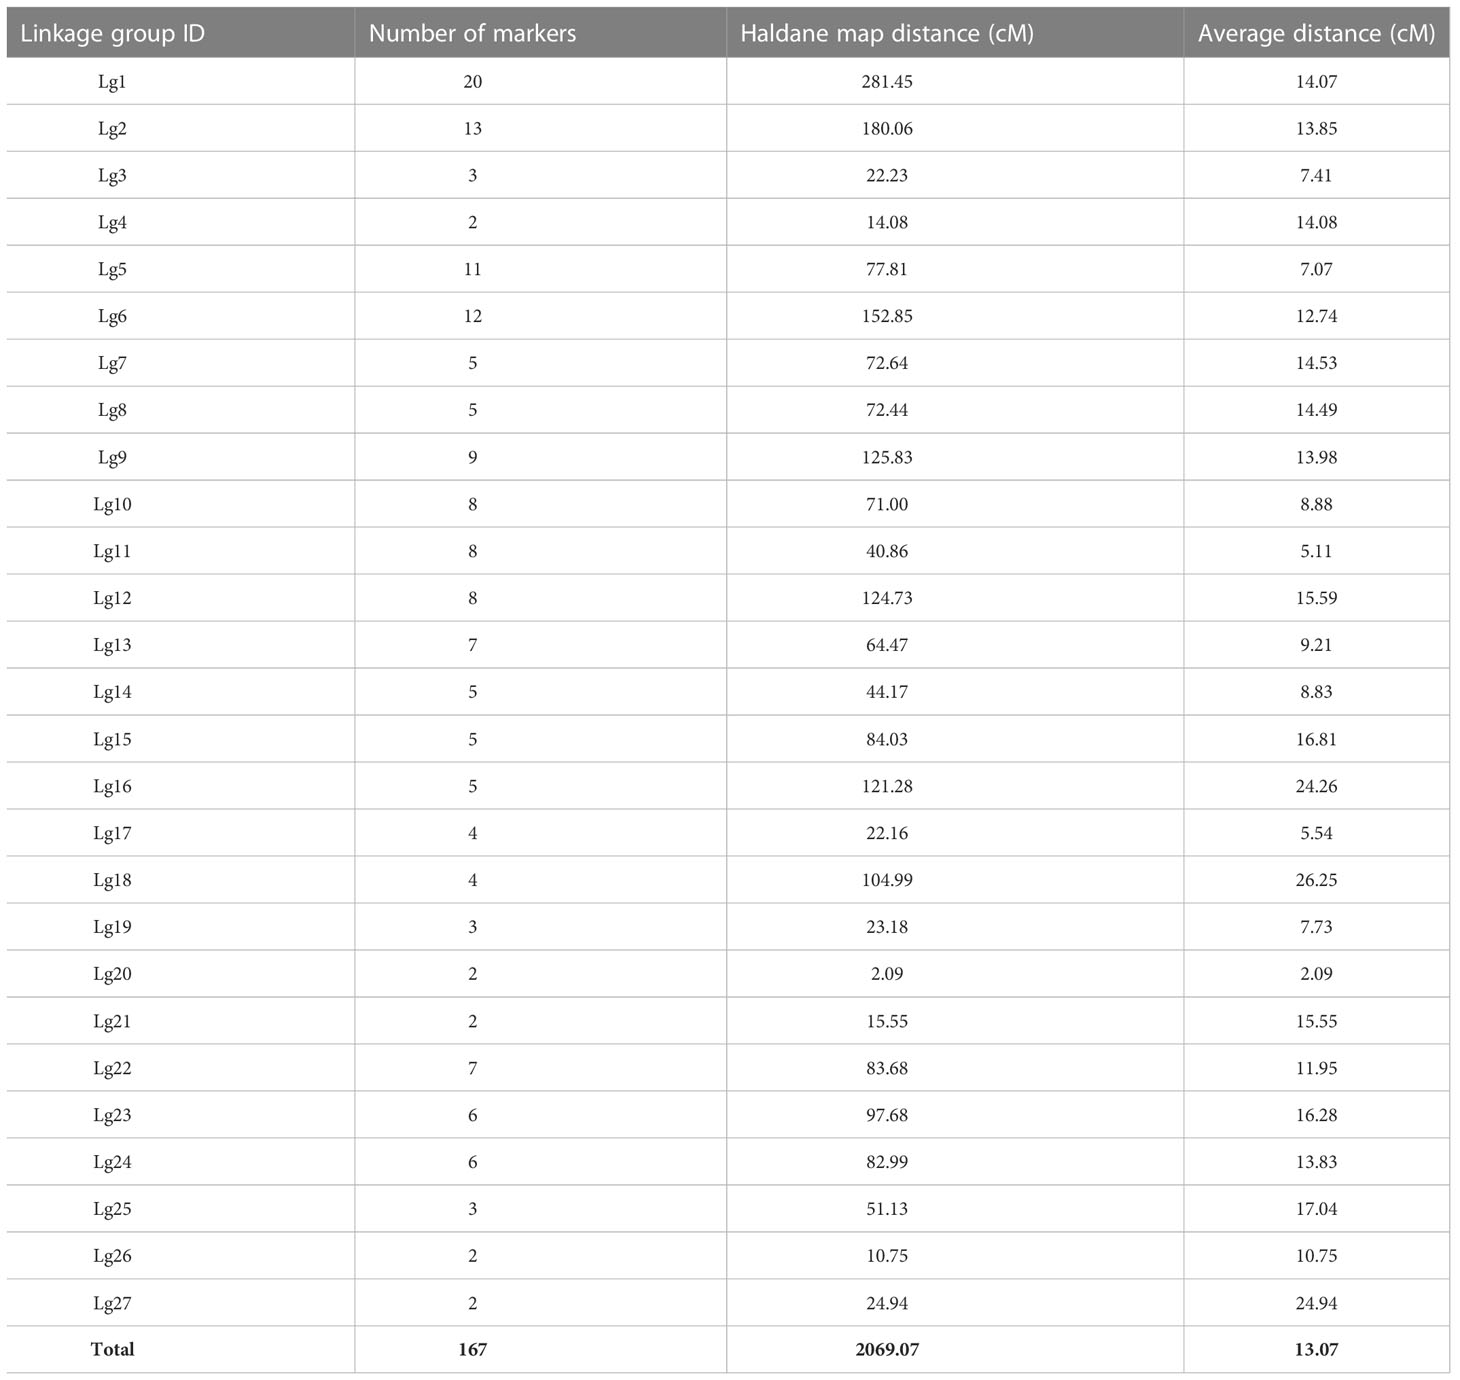
Table 1 Summary of SSR-based genetic linkage mapping for S.japonica.
Compared with the previous genetic linkage map (Zhang et al., 2015), 13 pairs of genetic linkage groups may have been from the same chromosome (Table 2) but pairs Lg9 and LG28, Lg13 and LG24, Lg25 and LG20 exhibited only one common SSR marker.
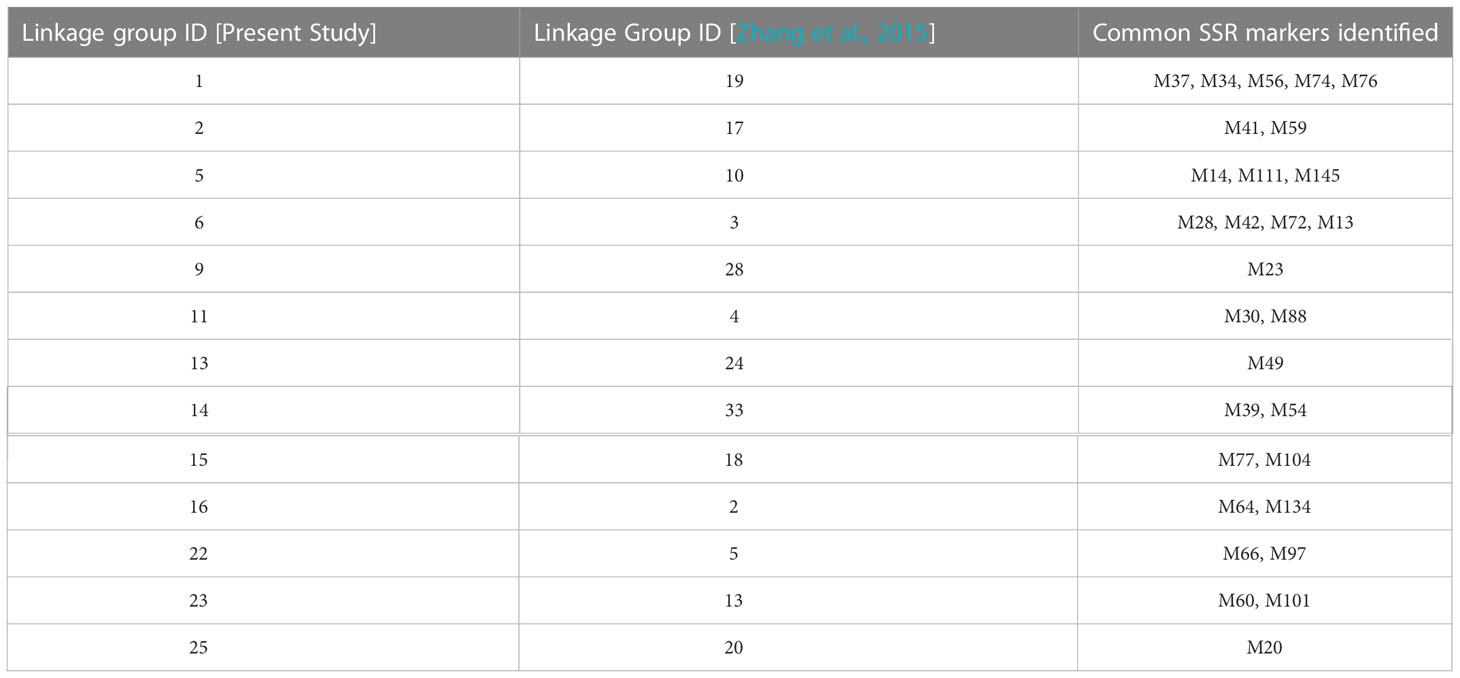
Table 2 Genetic linkage group commonality for S.japonica in the present study and in Zhang et al., 2015.
27 linkage groups were mapped on the 23 pseudo-chromosomes in S. japonica (Table 3). No. 3 and No. 5 linkage groups were co-mapped on chr12, No. 7 and No. 27 were on chr02, No. 4 and No. 18 were co-mapped on the chr03. No. 22 was not anchored on any pseudo-chromosomes. 127 SSR markers in the linkage map were anchored on assembled pseudo-chromosomes (Table 3). SSR marker locations on the pseudo-chromosomes are in Table S2. Right and left primers of M43, M1140, M768 and M200 from the Lg1 (Figure S1) were not verified in chr06; only the right primer of M37 was anchored to chr06 (Table S2). M284 were mapped on two locations in chr06 (Table S2). Some linkage groups had the same marker order as the corresponding pseudo-chromosome, such as M88-M114-M78-M2048—M30-M1907 in Lg11 (Figure S1), which was consistently anchored to the chr11 except M58 and M220 (Table S2). The two SSR markers at the end of linkage groups was inverse order compared to the same markers in corresponding pseudo-chromosomes, such as M374-M1445 on Lg13 (Figure S1) and M1445-M374 on the chr16 (Table S2). Physical distance per cM was not uniform in the linkage group, such as in Lg7 with 7.8 cM genetic distance between M1878 and M1679, less than 22.2 cM between M1101 and M128, but 153433 bp per cM between M1878 and M1679 was larger than 77968 bp between M1101 and M128.
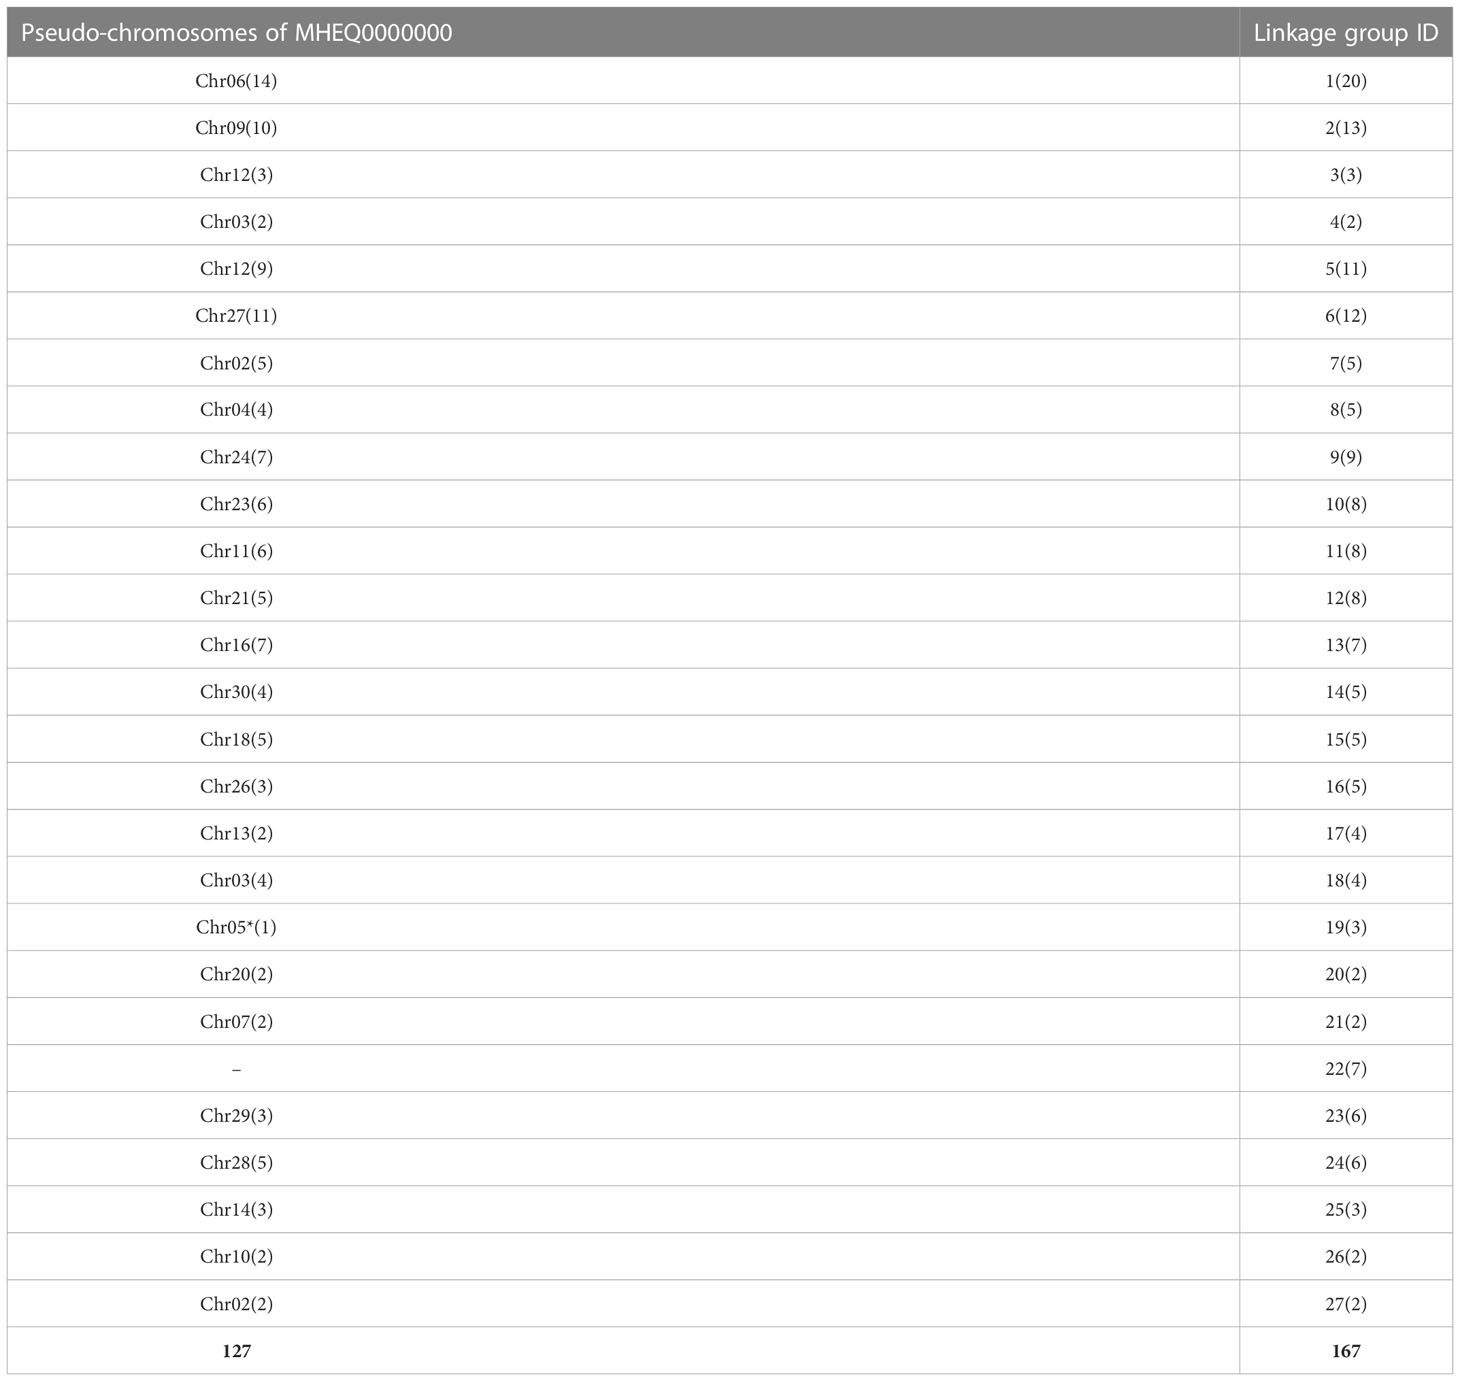
Table 3 Alignment of SSR-based linkage map with assembled pseudo-chromosomes of S.japonica.
7627 SNPs and 182 SSRs were used to integrate a linkage map with 3397 markers (3224 SNPs and 173 SSRs) mapped to 33 linkage groups, of which No. 32 and No. 33 included only SSR markers while No. 13 and No. 28 merely had SNP markers (S1; Table S3). Seven ungrouped SSR markers (M2102, M439, M1237, M1236, M1699, M2219, M151) in the SSR-based genetic linkage map were successfully mapped to the new integrated linkage groups, such as M1236 and M1699 on No. 20. A verage genetic distance between markers in the merged map was 2.87 cM in terms of Haldane map function. Table S3 shows collinearity of the integrated genetic linkage groups with SSR-based linkage groups, assembled pseudo-chromosomes and previous SNP-based linkage groups.
Blade length and width observed on May 8th, May 22nd and June 9th, were the same as in our previous report (Table 2, in Wang et al., 2018). Frequency distribution patterns of blade length and width of the mapping populationat three observation days appear in Figure S2. Before QTL mapping, the genome wide significant LOD threshold for detecting QTLs for each trait was calculated by permutation test in MapQTL6.0 (Table S4). 30 QTLs were detected by the ICIM (inclusive composite interval mapping) method for QTL IciMapping (Table 4; Figure S3). According to the calculated significant LOD threshold (Table S4), few significant QTLs were mapped such as the QTL in the interval of Marker1203S-Marker1895S (Table 4). Similarly, Marker1895S was found to be closely associated with blade length and width at three observation days by the interval mapping (IM) method in MapQTL 6.0 (Figure 1).
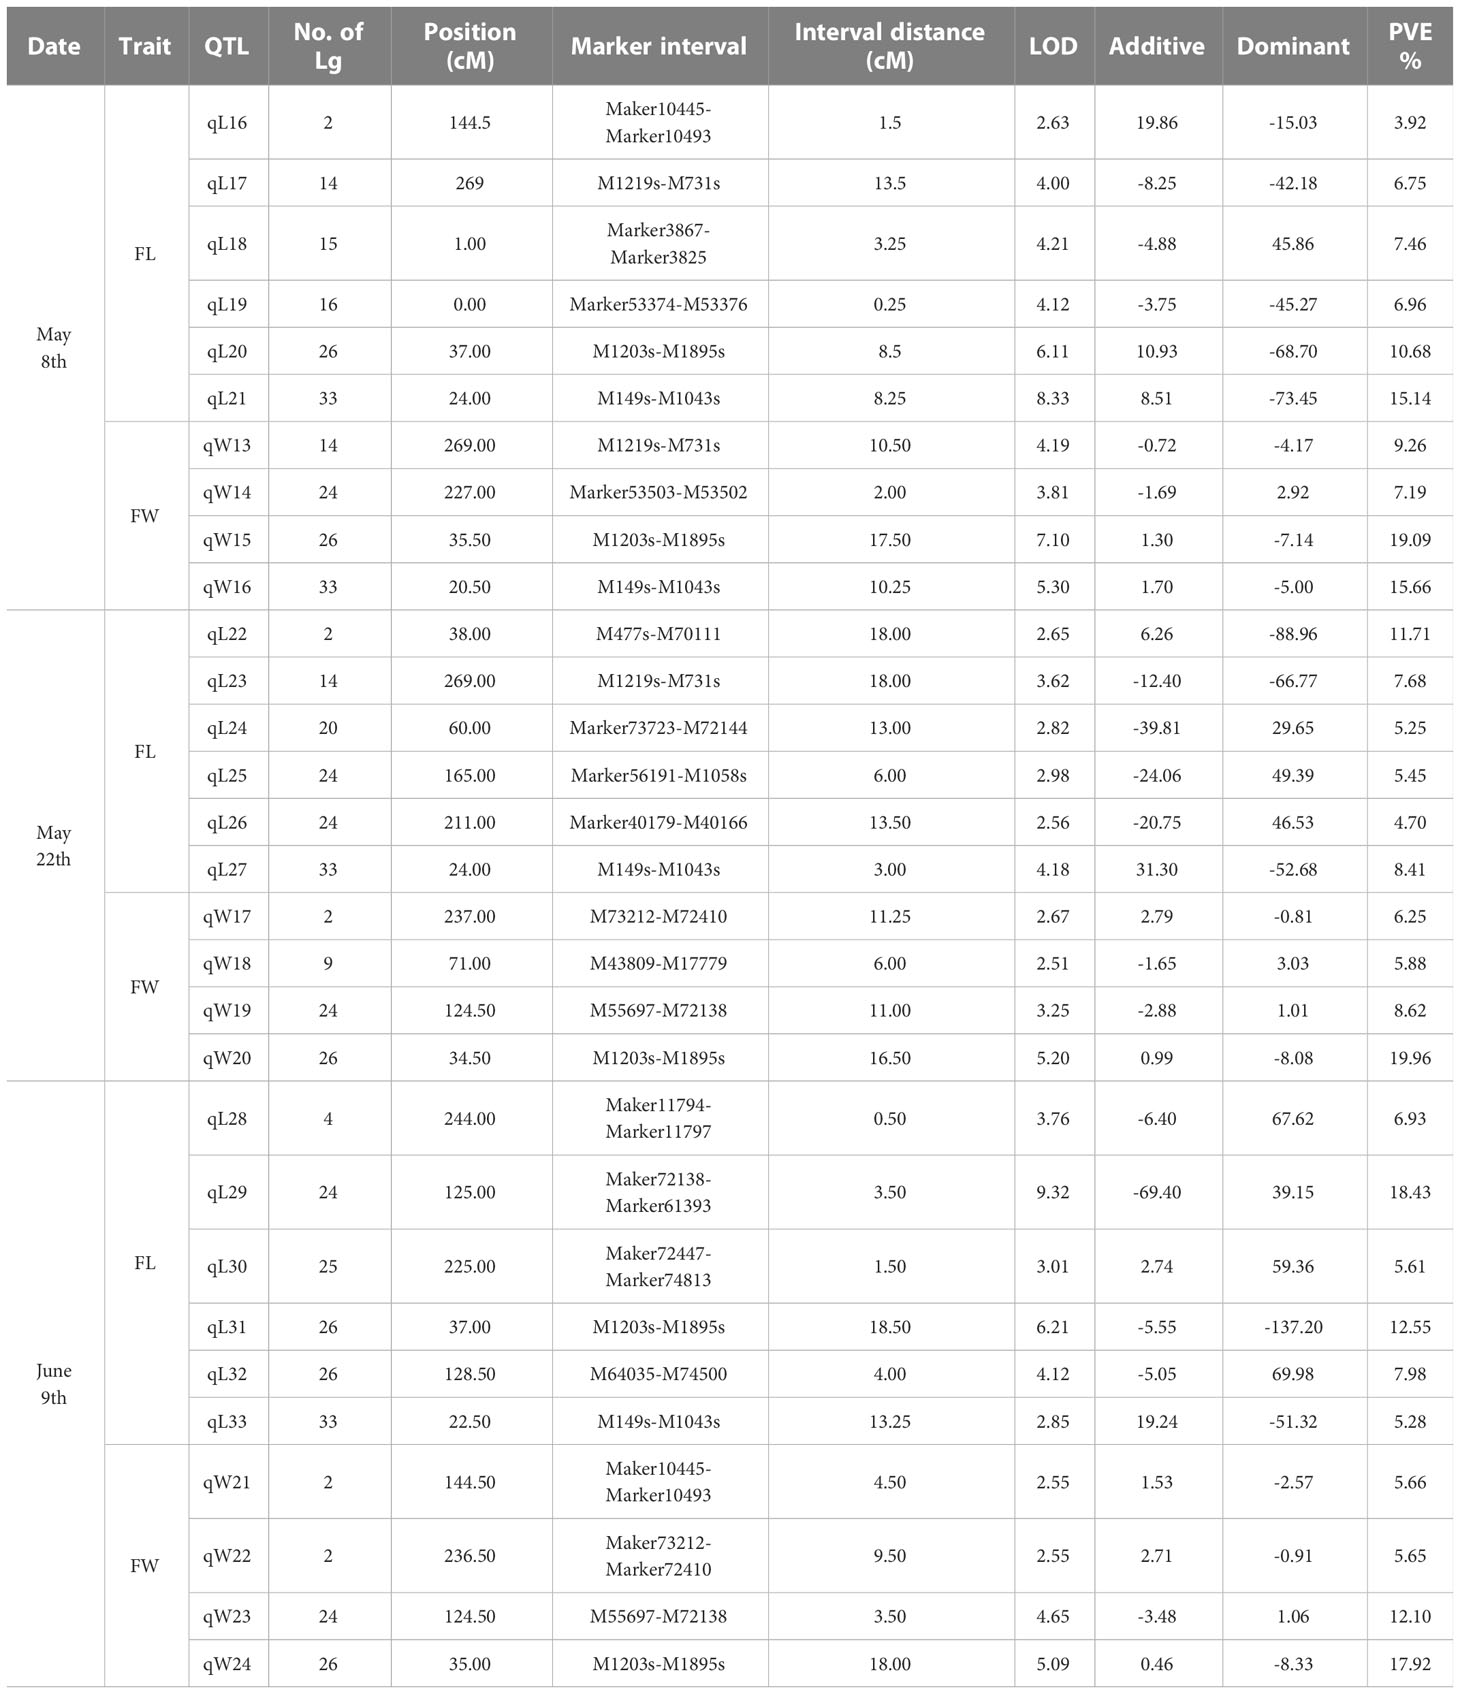
Table 4 QTLs detected for blade length (FL) and width (FW) in S.japonica on three observation days with integrated genetic linkage map using the ICIM method in QTL IciMapping.
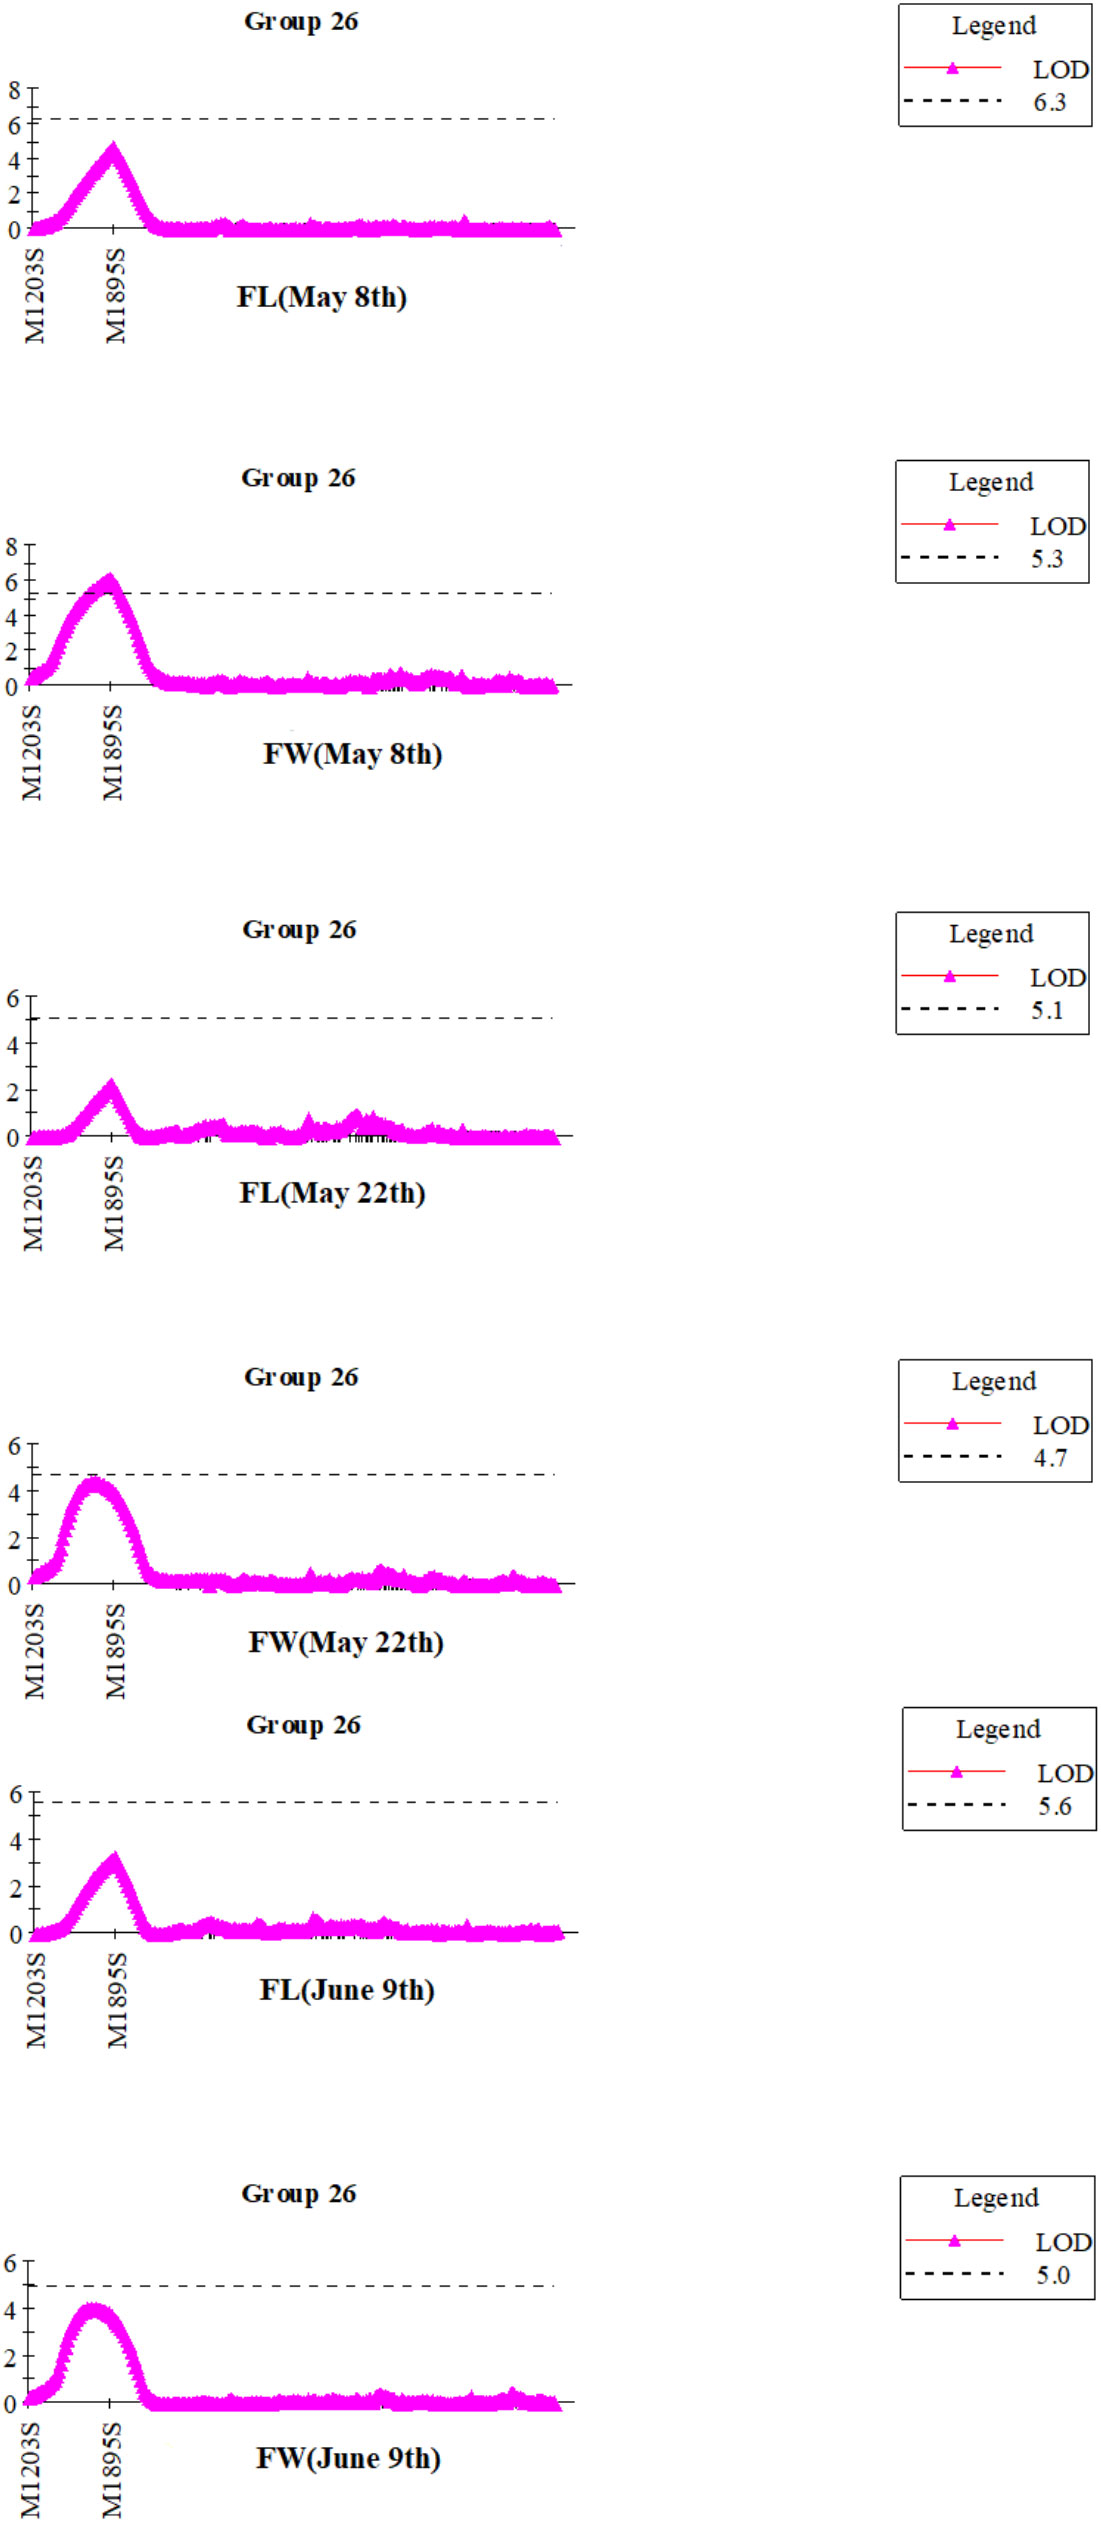
Figure 1 QTL mapping for the blade length (FL) and width (FW) of S.japonica in integrated linkage group 26 at three observation days by IM method in MapQTL6.0.
SjPT was annotated in the QTL closely associated with M1895S, which could explain phenotype variations of blade length from 10.68% ~ 12.55% and blade width from 17.92% ~ 19.96% (Table 4). Figure 2 shows right and left primer positions of M1895S and five exons and introns of SjPT. The sequence of right primer of M1895S located at the 356-378 bp interval of the first exon. SjPT coding sequence was 1422 bp coded one protein for presumed high affinity phosphate transporter with 473 aa, 8 transmembrane helices, 50.24 kDa molecular weight, and 5.75 isoelectric point. Table S5 shows biochemical characters of SjPT with other counterparts. Phylogenetic relationship between SjPT and others analyzed by MEGA11 (Figure 3) showed that high plants with canonical 12 conserved membrane-spanning domains cluster together and non-canonical 8 transmembrane helixes exist in S. japoncia and other group (Table S5; Figure 3).
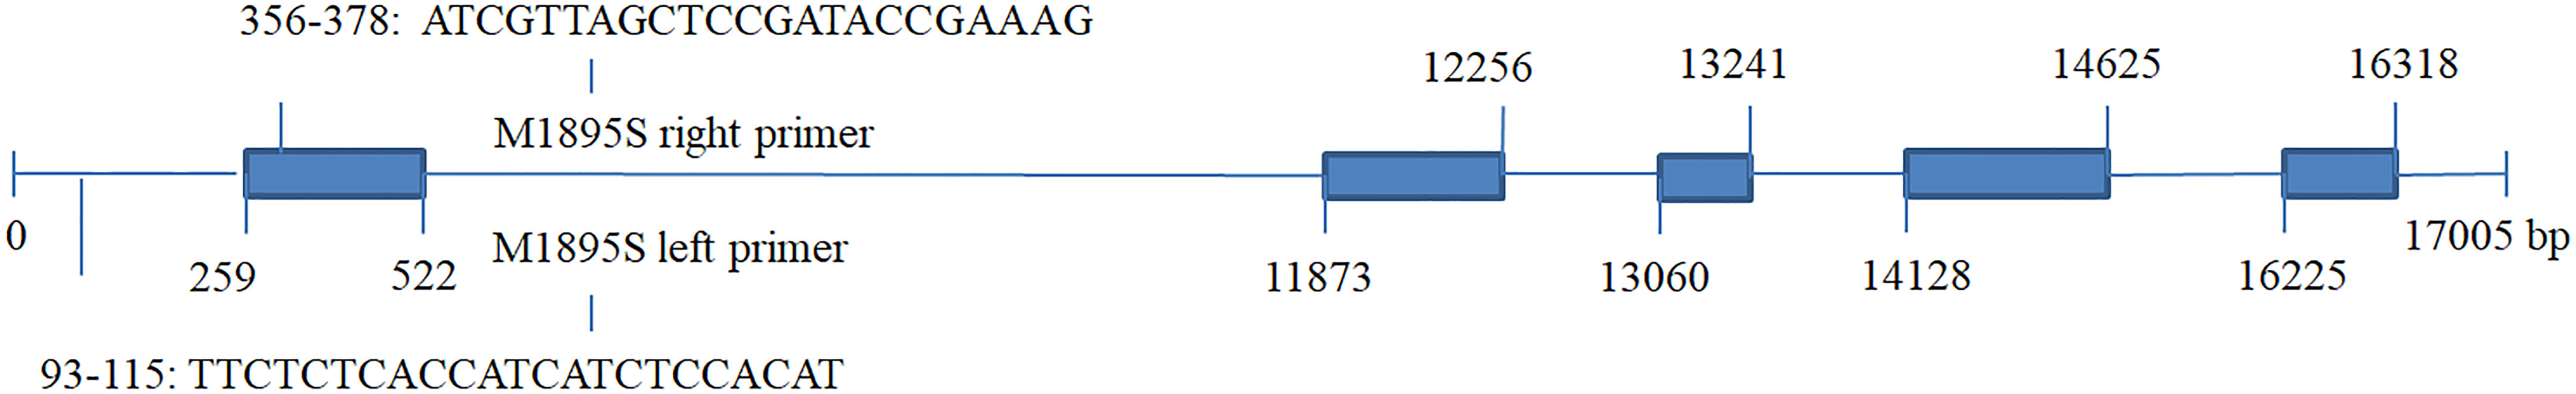
Figure 2 Positions of left and right primers of M1895S, and exons in the SjPT gene closely associated with QTL for blade length and width in S.japonica. *Blue blocks represent five exons and lines between the blue blocks represent introns in the SjPT gene.
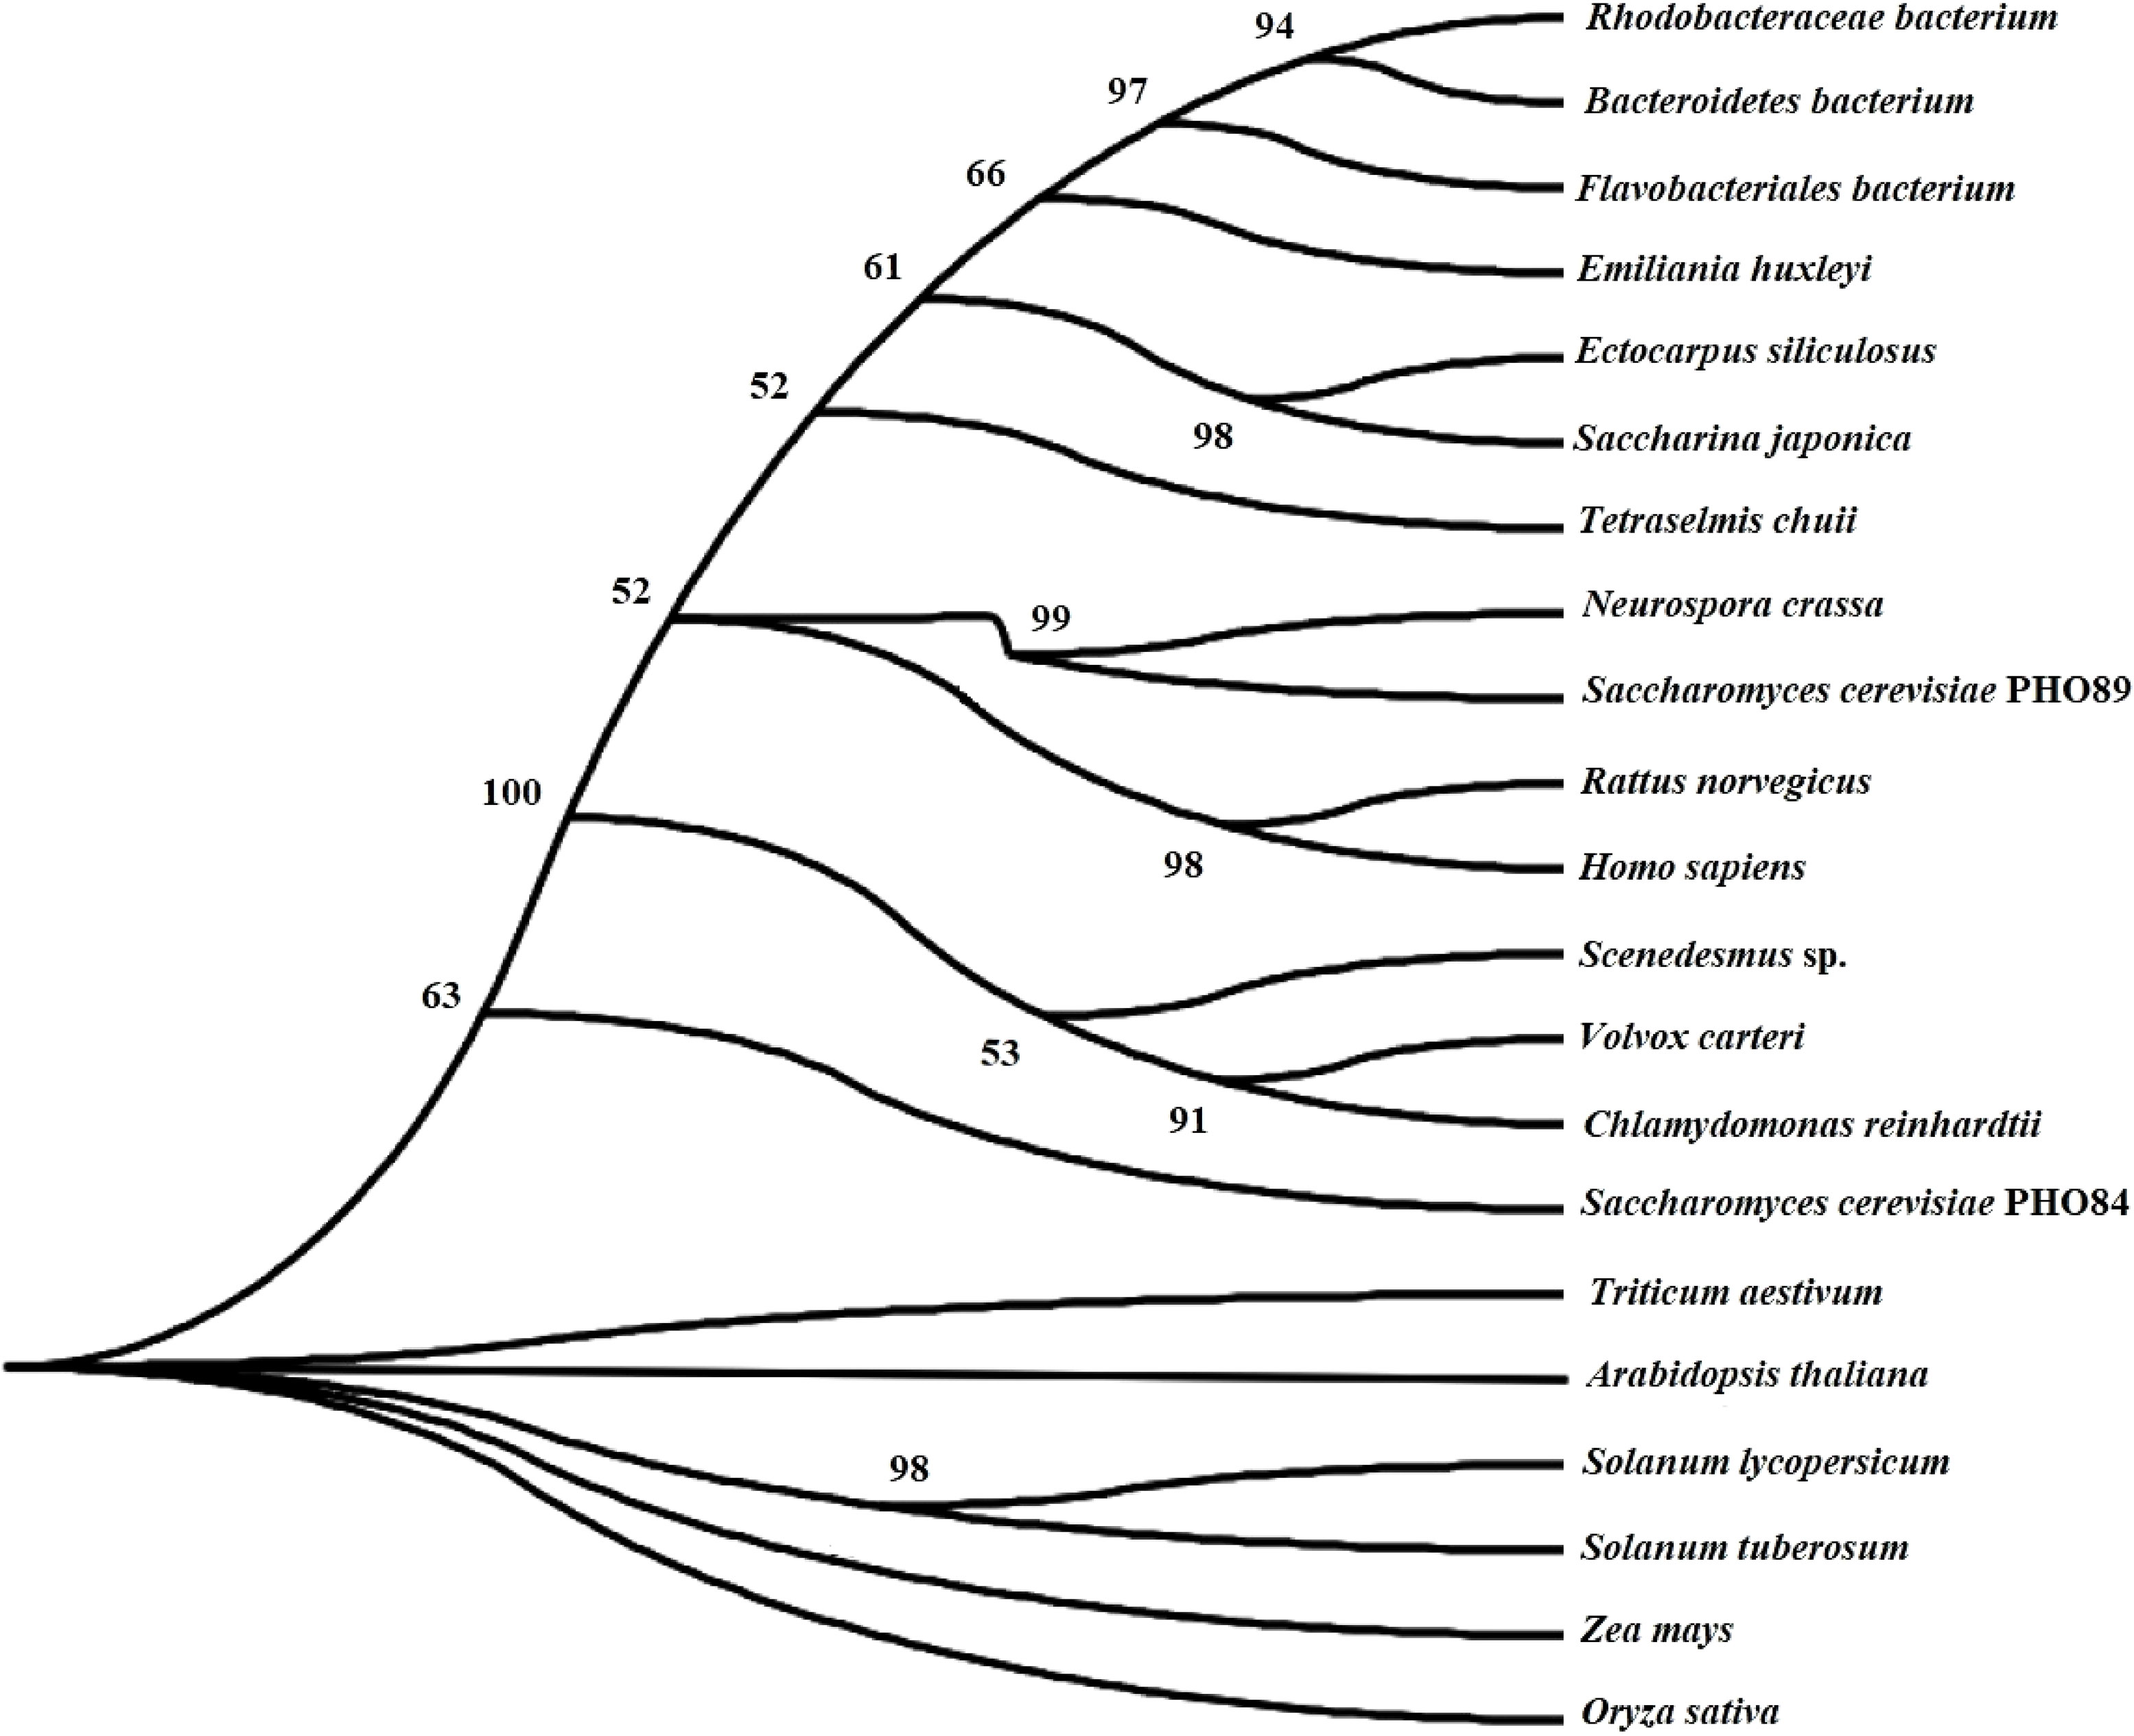
Figure 3 Phylogenetic relationship between SjPT and other homologues with bootstrap value >50.
Evaluation at different observation days based on RNA-Seq data and fragments per kilobase of exon model per million mapped reads (FPKM) showed that SjPT transcriptions obviously increased with growth in blade length and width (Figure 4C), especially from May to June (Figure 4A). qRT-PCR detection exhibited similar tendencies from March to April (Figure 4B).
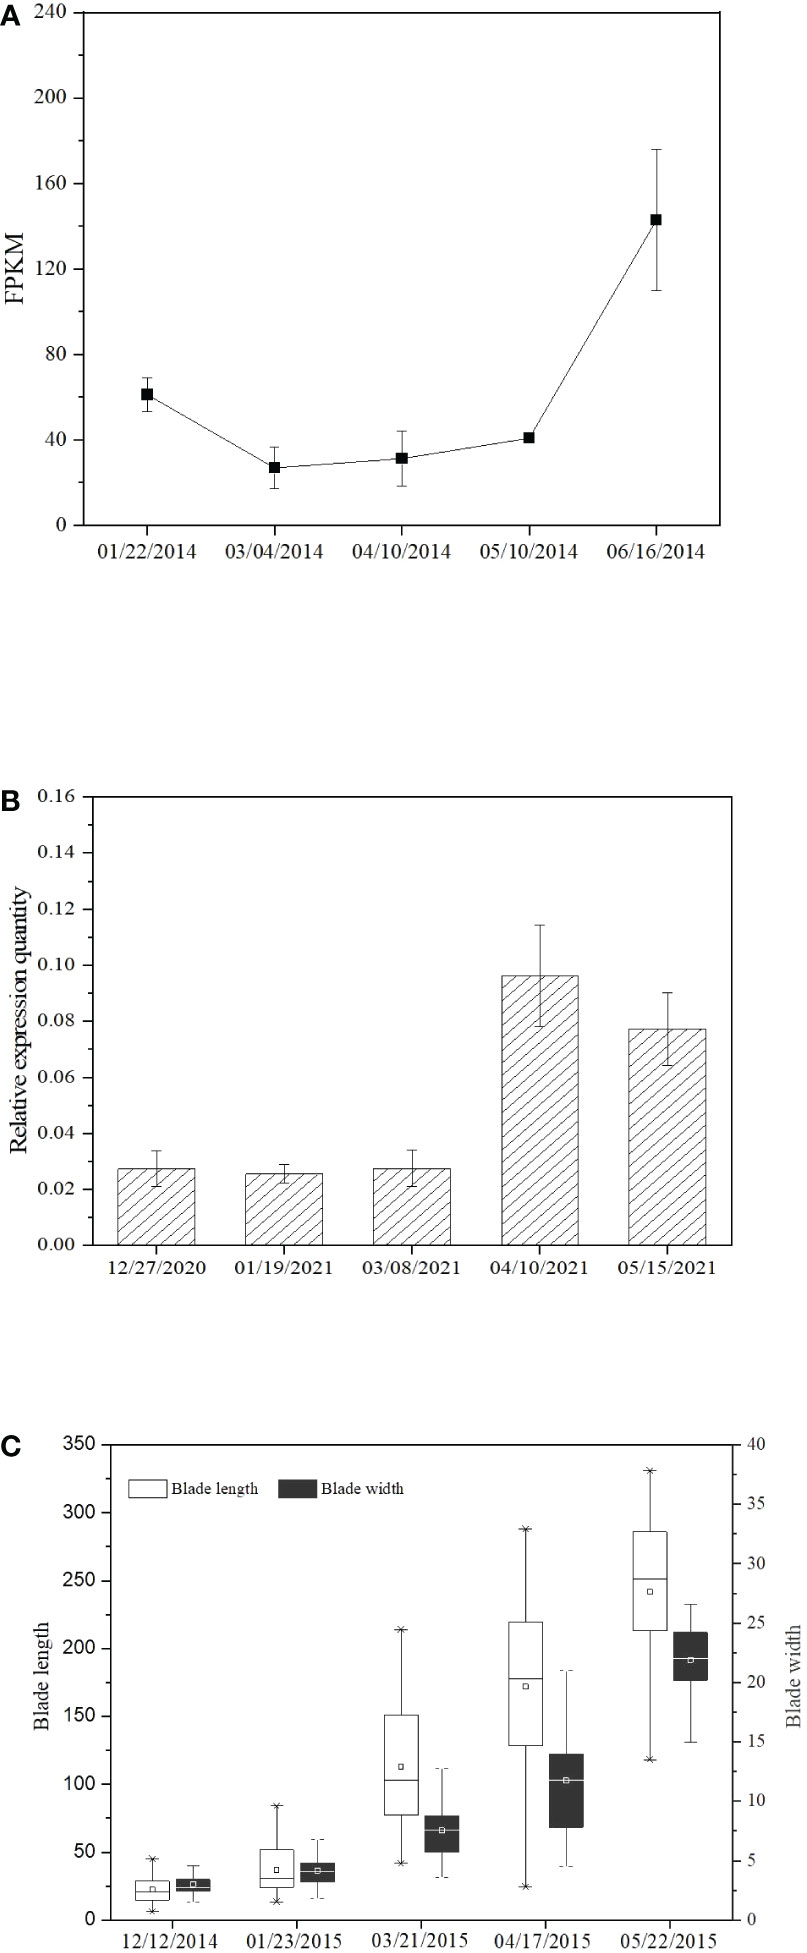
Figure 4 SjPT expression and growth of the blade length and width of S.japonica at different observation days. (A) SjPT expression detected with qRT-PCR. (B) SjPT expression examined by RNA-Seq. (C) The growth of the blade length and width of S.japonica.
A high-quality genetic map is generally important in plant genome assembly (Rice and Green, 2019) and for model species Ectocarpus sp. in brown algae, a SSR-based genetic linkage map was constructed and tried for genome assembly (Heesch et al., 2010). In the present study, the SSR-based genetic map constructed for S. japonica had 27 linkage groups (Table 1; Figure S1) that were anchored to 23 of 31 assembled pseudo-chromosomes (MHEQ0000000) in S. japonica (Table 3). Due to the less available SSR marker, some linkage groups were incomplete and some pseudo-chromosomes separated into two linkage groups (Table 3). Nevertheless, consistent SSR markers remained in the linkage group and the counterpart pseudo-chromosome. Compared to the previous reported map (Zhang et al., 2015), the newly constructed SSR-based genetic linkage map showed ten pairs of linkage groups from the same chromosome (Table 2) although a different method was adopted for map construction. Presumably, using more SSR markers and qualified mapping populations allows high qualify genetic linkage maps to be constructed that will be valid for lower plant genome assemblies and comparative genomic studies.
Using the integrated genetic map with 3397 SNPs and SSRs (S1, Table S3), 30 QTLs with different LOD values related to the blade length and width were detected (Table 4; Figure S3). Phenotypic variance explained (PVE) for each QTL ranged from 3.92 to 19.96, with 6 loci of >15 PVE%. Characterized QTLs for blade length and width was consistent with quantitative traits determined for several loci with large estimated genetic effects (Falconer and Mackay, 1996; Lynch and Walsh, 1998).
Due to the exaggerations of QTL mapping (Beavis, 1994), and the non-independent multi-test flaw, selecting the right LOD value for significant QTLs was indispensable (Churchill and Doerge, 1994; Lander and Kruglyak, 1995; Doerge and Rebai, 1996; van Ooijen, 1999). The permutation test in MapQTL6.0 allowed calculation of the genome wide LOD value at the relative cumulative value of 0.95 for each QTL analysis (Table S4). According to the significant LOD threshold of 4.7 for blade width detected on the 22th May (Table S4), only qW20 with LOD of 5.20 was significant (Table 4). In addition, a significant QTL between M1203s-M1895s was chosen to identify candidate genes associated with the blade length and width (Table 4; Figure 1).
So far, few genes have been finely mapped and deciphered to the morphology, especially quantitative traits of the macroalgae. Le Bail et al. (2011) found the ETL locus related to branching in Ectocarpus, but the gene for the locus was not cloned and determined. The RNAi experiment verified that the AUREO1 caused preferential branching at the blue light irradiated side of the Vaucheria thallus (Takahashi et al., 2007). Generally, genes for the QTLs were identified by constructing the large second mapping population and testing in mutants with transgene technology (Xing and Zhang, 2010; Zuo and Li, 2014; Tian et al., 2019; Zhang et al., 2022). Here, we preliminarily mapped the SjPT to one QTL of the blade length and width using the primary mapping population because of short of the second mapping population and mutant strain to S.japonica at now. Cellular localization indicated SjPT in the plasma membrane, with non-typical transmembrane structure of six-loop-two (Table S5), suggesting that one Na+-coupled phosphate transporter in the brown seaweed was similar to transporters from Saaharomyces cerevisiae and animals (Chung et al., 2003). Earlier studies showed that phosphate transporters in the higher plants are H+-coupled, with typical six-loop-six transmembrane structure (Gu et al., 2016). Our phylogenetic analysis indicated that SjPT clusters with other homologues from algae, fungi, animal, bacteria etc., except in high plants (Figure 3), which further verified SiPT as an Na+-coupled phosphate transporter in S.japonica. Although qRT-PCR detection and RNA-seq analysis showed similar tendencies with the increase of kelp blade length and width (Figure 4), the mechanism for its function in the kelp growth deserves additional studies in the future.
To summarize, a new genetic linkage map based on SSR markers anchored to S. japonica pseudo-chromosomes was successfully applied to localize QTL for blade length and width. SjPT, which coded the high affinity phosphate transporter, was mapped on the QTL between Marker 1203S-M1895S as the candidate gene for blade length and width, a finding that should prove helpful for MAS in S. japonica in the future.
The original contributions presented in the study are included in the article/Supplementary Material. Further inquiries can be directed to the corresponding author.
XW conceived and designed the project. JY and CL provided samples and some analytical data. XY, QL, and CL performed the molecular experiments and analysed. XW analyzed and integrated the data. XW drafted the manuscript, XW and DD revised the manuscript. DD supervised the project. All authors contributed to the article and approved the submitted version.
This research was funded by NSFC (31772848, 31900279), Joint Research Project between China and Japan (No.2017YFE0130900), Project for Improving Innovation Capability of Small and Medium-sized Scientific and Technological Enterprises in Shandong Province (2022TSGC1305), and Global Common Challenge Project of Chinese Academy of Sciences (133137KYSB20210034).
We want to thank Dr. Don Sturge for the English revision and improvement to this paper.
The authors declare that the research was conducted in the absence of any commercial or financial relationships that could be construed as a potential conflict of interest.
All claims expressed in this article are solely those of the authors and do not necessarily represent those of their affiliated organizations, or those of the publisher, the editors and the reviewers. Any product that may be evaluated in this article, or claim that may be made by its manufacturer, is not guaranteed or endorsed by the publisher.
The Supplementary Material for this article can be found online at: https://www.frontiersin.org/articles/10.3389/fmars.2023.1116412/full#supplementary-material
Altschul S. F., Gish W., Miller W., Myers E. W., Lipman D. J. (1990). Basic local alignment search tool. J. Mol. Biol. 215, 403–410. doi: 10.1016/S0022-2836(05)80360-2
Avia K., Coelho S. M., Montecinos G. J., Cormier A., Lerck F., Mauger S., et al. (2017). High-density genetic map and identification of QTLs for responses to temperature and salinity stresses in the model brown alga Ectocarpus. Sci. Rep. 7, 43241. doi: 10.1038/srep43241
Beavis W. D. (1994). “The power and deceit of QTL experiments: lessons from comparative QTL studies,” in Proceedings of the forty-ninth annual corn and sorghum industry research conference. Ed. Koepp N. (Washington DC, USA: American Seed), 252–268.
Bernardo R. (2008). Molecular markers and selection for complex traits in plants: learning from the last 20 years. Crop Sci. 48, 1649–1664. doi: 10.2135/cropsci2008.03.0131
Charrier B., Le Bail A., de Reviers B. (2012). Plant Proteus: brown algal morphological plasticity and underlying developmental mechanisms. Trend Plant Sci. 17 (8), 468–477. doi: 10.1016/j.tplants.2012.03.003
Chen Z., Wang X., Li S., Yao J., Shao Z., Duan D. (2019). Verification of the Saccharina japonica translocon Tic20 and its localization in the chloroplast membrane in diatoms. Int. J. Mol. Sci. 20, 4000. doi: 10.3390/ijms20164000
Chung C., Hwang S.-P. L., Chang J. (2003). Identification of a high-affinity phosphate transporter gene in a prasinophyte alga, Tetraselmis chui, and its expression under nutrient limitation. Appl. Environ. Microbiol. 69 (2), 754–759. doi: 10.1128/AEM.69.2.754-759.2003
Churchill G. A., Doerge R. W. (1994). Empirical threshold values for quantitative trait mapping. Genetics 138, 963–971. doi: 10.1093/genetics/138.3.963
Collard B. C. Y., Mackill D. J. (2008). Marker-assisted selection: an approach for precision plant breeding in the twenty-first century. Phil Trans. R. Soc B. 363, 557–572. doi: 10.1098/rstb.2007.2170
Doerge R. W., Rebai A. (1996). Significance threshholds for QTL interval mapping tests. Heredity 77, 459–464. doi: 10.1038/hdy.1996.68
Fan X., Han W. T., Teng L. H., Jiang P., Zhang X. W., Xu D., et al. (2020). Single-base methylome profiling of the giant kelp Saccharina japonica reveals significant differences in DNA methylation to microalgae and plants. New Phytol. 225 (1), 234–249. doi: 10.1111/nph.16125
Gu M., Chen A., Sun S., Xu G. H. (2016). Complex regulation of plant phosphate transporters and the gap between molecular mechanisms and practical application: what is missing? Mol. Plant 9, 396–416. doi: 10.1016/j.molp.2015.12.012
Heesch S., Cho G. Y., Peters A. F., Le Corguille G., Falentin C., Boutet G., et al. (2010). A sequence-tagged genetic map for the brown alga Ectocarpus siliculosus provides large-scale assembly of the genome sequence. New Phytol. 188, 42–51. doi: 10.1111/j.1469-8137.2010.03273.x
Huang L. B., Yan X. H. (2019). Construction of a genetic linkage map in Pyropia yezoensis (Bangiales, rhodophyta) and QTL analysis of several economic traits of blades. PloS One 14 (3), e0209128. doi: 10.1371/journal.pone.0209128
Hurd C. L., Harrison P. J., Bischof K., Lobban C. S. (2014). Seaweed ecology and physiology (Cambridge: Cambridge University Press).
Hwang E. K., Yotsukura N., Pang S. J., Su L., Shan T. (2019). Seaweed breeding programs and progress in eastern Asian countries. Phycologia 58 (5), 484–495. doi: 10.1080/00318884.2019.1639436
Kawashima S. (2012). Morphology and taxonomy of the laminariaceous algae in cold water area of Japan (in Japanese) (Tokyo: Oya Nisan Publiser).
Lander E. S., Kruglyak L. (1995). Genetic dissection of complex traits: guidelines for interpreting and reporting linkage results. Nat. Genet. 11, 241–247. doi: 10.1038/ng1195-241
Le Bail A., Billoud B., Le Panse S., Chenivesse S., Charrier B. (2011). ETOILE regulates developmental patterning in the filamentous brown alga. Ectocarpus siliculosus Plant Cell 23, 1666–1678. doi: 10.1105/tpc.110.081919
Li B., Dewey C. N. (2011). RESM: accurate transcript quantification from RNA-seq data with or without a reference genome. BMC Bioinf. 12, 323. doi: 10.1186/1471-2105-12-323
Liu F. L., Shao Z. R., Zhang H. N., Liu J. D., Wang X. L., Duan D. L. (2010). QTL mapping for frond length and width in Laminaria japonica aresch (Laminariales, phaeophyta) using AFLP and SSR markers. Mar. Biotechnol. 12 (4), 386–394. doi: 10.1007/s10126-009-9229-7
Liu F., Wang X., Liu J., Fu W., Duan D., Yang Y. (2009). Genetic mapping of the Laminaria japonica (Laminariales, phaeophyta) using amplified fragment length polymorphism markers. J. Phycol 45 (5), 1228–1233. doi: 10.1111/j.1529-8817.2009.00729.x
Liu T., Wang X. M., Wang G. L., Jia S. G., Liu G. M., Shan G. L., et al. (2019). Evolution of complex thallus alga: genome sequencing of Saccharina japonica. Front. Genet. 10. doi: 10.3389/fgene.2019.00378
Li Y. H., Yang Y. X., Liu J. D., Wang X. L., Gao T. X., Duan D. L. (2007). Genetic mapping of Lamianria japonica and L.longissima using amplified fragment length polymorphism markers in a “two-way pseudo-testcross“ stratey. J. Integr. Plant Biol. 49 (3), 392–400. doi: 10.1111/j.1744-7909.2007.00397.x
Li H., Ye J., Wang J. (2007). A modified algorithm for the improvement of composite interval mapping. Genetics 175, 361–374. doi: 10.1534/genetics.106.066811
Li Q. Y., Zhang J., Yao J. T., Wang X. L., Duan D. L. (2016). Development of Saccharina japonica genomic SSR markers using next-generation sequencing. J. Appl. Phycol 28 (2), 1387–1390. doi: 10.1007/s10811-015-0643-0
Lu C., Shao Z. R., Zhang P. Y., Duan D. L. (2020). Genome-wide analysis of the Saccharina japonica sulfotransferase genes and their transcriptional profiles during whole developmental periods and under abiotic stresses. BMC Plant Biol. 20, 271. doi: 10.1186/s12870-020-02422-3
Lynch M., Walsh B. (1998). Genetics and analysis of quantitative traits (Sunderland: Sinauer Assoc).
Rice E. S., Green R. E. (2019). New approaches for genome assembly and scaffolding. Annu. Rev. Anim. Biosci. 7, 17–40. doi: 10.1146/annurev-animal-020518-115344
Robinson M. D., McCarthy D. J., Smyth G. K. (2010). edgeR: a bioconductor package for differential expression analysis of digital gene expression data. Boinformatics 26, 139–140. doi: 10.1093/bioinformatics/btp616
Shan T. F., Pang S. J., Li J., Li X., Su L. (2015). Construction of a high-density genetic map and mapping of a sex-linked locus for the brown alga Undaria pinnatifida (Phaeophyceae) based on large scale marker development by specific length amplified fragment (SLAF) sequencing. BMC Genomics 16, 902. doi: 10.1186/s12864-015-2184-y
Shao Z. R., Zhang P. Y., Lu C., Li S. X., Chen Z. H., Wang X. L., et al. (2019). Transcriptome sequencing of Saccharina japonica sporophytes during whole developmental periods reveals regulatory networks underlying alginate and mannitol biosynthesis. BMC Genomics 20, 975. doi: 10.1186/s12864-019-6366-x
Shi Y. Y., Yang G. P., Liu Y. J., Liao M. J., Li X. J., Cong Y. Z. (2007). Development of 18 polymorphic microsatellite DNA markers of Laminaria japonica (Phaeophyceae). Mol. Ecol. Notes 7 (4), 620–622. doi: 10.1111/j.1471-8286.2006.01652.x
Takahashi F., Yamagata D., Ishikawa M., Fukamatsu Y., Ogura Y., Kasahara M., et al. (2007). AUREOCHROME, a photoreceptor required for photomorphogenesis in stramenopiles. Proc. Natl. Acad. Sci. U.S.A. 104 (19), 625–630. doi: 10.1073/pnas.0707692104
Tamura K., Stecher G., Kumar S. (2021). MEGA11: Molecular evolutionary genetics analysis version 11. Mol. Biol. Evol. 38, 3022–3027. doi: 10.1093/molbev/msab120
Tian J. G., Wang C. L., Xia J. L., Wu L. S., Xu G. H., Wu W. H., et al. (2019). Teosinte ligule allele narrows plant architecture and enhances high-density maize yields. Science 365, 658–664. doi: 10.1126/science.aax5482
van Ooijen J. W. (1999). LOD significance thresholds for QTL analysis in experimental populations of diploid species. Heredity 83, 613–624. doi: 10.1038/sj.hdy.6886230
van Ooijen J. W. (2009). MapQTL®6, software for the mapping of quantitative trait loci in experimental populations of diploid species (Wageningen: Kyazma B.V).
van Ooijen J. W. (2018). JoinMap ®5, software for the calculation of genetic linkage maps in experiment populations of diploid species (Wageningen: Kyazma B.V).
Wang X. L., Chen Z. H., Li Q. Y., Zhang J., Liu S., Duan D. L. (2018). High-density SNP-based QTL mapping and candidate gene screening for yield-related blade length and width in Saccharina japonica (Laminariales, phaeophyta). Sci. Rep. 8 (1), 13591. doi: 10.1038/s41598-018-32015-y
Wang L., Xu K. P., Tang X. H., Wang J. H., Kong F. N., Mao Y. X. (2021). Construction of high-density genetic linkage map of Pyropia yezoensis (Bangiales, rhodophyta) and identification of red color trait QTLs in the thalli. J. Oceanol Limnol 39 (3), 1103–1117. doi: 10.1007/s00343-020-0184-5
Wang X. L., Yang Y. X., Cong Y. Z., Duan D. L. (2004). DNA Fingerprinting of selected Lamianria (Phaeophyta) gemetophytes by RAPD markers. Aquaculture 238 (1-4), 143–153. doi: 10.1016/j.aquaculture.2004.05.007
Wang X. L., Yao J. T., Zhang J., Duan D. L. (2020). Status of genetic studies and breeding of Saccharina japonica in China. J. Oceanol Limnol 38 (4), 1064–1079. doi: 10.1007/s00343-020-0070-1
Xing Y. Z., Zhang Q. F. (2010). Genetic and molecular bases of rice yield. Annu. Rev. Plant Biol. 61, 421–442. doi: 10.1146/annurev-arplant-042809-112209
Xu Y., Huang L., Ji D. H., Chen C. S., Zheng H. K., Xie C. T. (2015). Construction of a dense genetic linkage map and mapping quantitative trait loci for economic traits of a doubled haploid population of Pyropia haitanensis (Bangiales, rhodophyta). BMC Plant Biol. 15 (1), 228. doi: 10.1186/s12870-015-0604-4
Yang G. P., Sun Y., Shi Y. Y., Zhang L. N., Guo S. S., Li B. J., et al. (2009). Construction and characterization of a tentative amplified fragment length polymorphism-simple sequence repeat linkage map of Laminaria (Laminariales, phaeophyta). J. Phycol 45 (4), 873–878. doi: 10.1111/j.1529-8817.2009.00720.x
Ye N. H., Zhang X. W., Miao M., Fan X., Zheng Y., Xu D., et al. (2015). Saccharina genomes provide novel insight into kelp biology. Nat. Commun. 6 (1), 6986. doi: 10.1038/ncomms7986
Zhang J., Li W., Qu J. Q., Wang X. M., Liu C., Liu T. (2015a). Development and characterization of microsatellite markers from an enriched genome library of Saccharina japonica. J. Appl. Phycol 27 (1), 479–487. doi: 10.1007/s10811-014-0301-y
Zhang J., Liu T., Feng R. F., Liu C., Chi S. (2015). Genetic map construction and quantitative trait locus (QTL) detection of six economic traits using an F2 population of the hybrid from Saccharina longissima and Saccharina japonica. PloS One 10 (5), e0128558. doi: 10.1371/journal.pone.0128588
Zhang Q. S., Tang X. X., Cong Y. Z., Qu S. C., Luo S. J., Yang G. P. (2007). Breeding of an elite Laminaria variety 90-1 through inter-specific gametophyte crossing. J. Appl. Phycol 19, 303–311. doi: 10.1007/s10811-006-9137-4
Zhang J., Wang X. L., Yao J. T., Li Q. Y., Liu F. L., Yotsukura N., et al. (2017). Effect of domestication on the genetic diversity and structure of Saccharina japonica populations in China. Sci. Rep. 7, 42158. doi: 10.1038/srep42158
Zhang N., Zhang L. N., Tao Y., Guo L., Sun J., Li X., et al. (2015b). Construction of a high density SNP linkage map of kelp (Saccharina japonica) by sequencing taq I site associated DNA and mapping of a sex determining locus. BMC Genomics 16, 189. doi: 10.1186/s12864-015-1371-1
Zhang H., Zhou J. F., Kan Y., Shan J. X., Ye W. W., Dong N. Q., et al. (2022). A genetic module at one locus in rice protects chloroplasts to enhance thermotolerance. Science 376, 1293–1300. doi: 10.1126/science.abo5721
Keywords: quantitative trait locus, genetic linkage map, genome assembly, high affinity phosphate transporter, marker assisted selection, seaweed, Saccharina japonica
Citation: Wang X, Yang X, Yao J, Li Q, Lu C and Duan D (2023) Genetic linkage map construction and QTL mapping of blade length and width in Saccharina japonica using SSR and SNP markers. Front. Mar. Sci. 10:1116412. doi: 10.3389/fmars.2023.1116412
Received: 05 December 2022; Accepted: 17 January 2023;
Published: 26 January 2023.
Edited by:
Taewoo Ryu, Okinawa Institute of Science and Technology Graduate University, JapanReviewed by:
Yuehuan Zhang, South China Sea Institute of Oceanology (CAS), ChinaCopyright © 2023 Wang, Yang, Yao, Li, Lu and Duan. This is an open-access article distributed under the terms of the Creative Commons Attribution License (CC BY). The use, distribution or reproduction in other forums is permitted, provided the original author(s) and the copyright owner(s) are credited and that the original publication in this journal is cited, in accordance with accepted academic practice. No use, distribution or reproduction is permitted which does not comply with these terms.
*Correspondence: Delin Duan, ZGxkdWFuQHFkaW8uYWMuY24=
Disclaimer: All claims expressed in this article are solely those of the authors and do not necessarily represent those of their affiliated organizations, or those of the publisher, the editors and the reviewers. Any product that may be evaluated in this article or claim that may be made by its manufacturer is not guaranteed or endorsed by the publisher.
Research integrity at Frontiers
Learn more about the work of our research integrity team to safeguard the quality of each article we publish.