
95% of researchers rate our articles as excellent or good
Learn more about the work of our research integrity team to safeguard the quality of each article we publish.
Find out more
ORIGINAL RESEARCH article
Front. Mar. Sci. , 26 January 2023
Sec. Aquatic Microbiology
Volume 10 - 2023 | https://doi.org/10.3389/fmars.2023.1116050
This article is part of the Research Topic The Impacts of Anthropogenic Activity and Climate Change on the Formation of Harmful Algal Blooms (HABs) and Its Ecological Consequence View all 16 articles
 Quandong Xin1,2,3†
 Xiaohan Qin1†Guannan Wu1
 Xiaokun Ding1
 Xinliang Wang3
 Qingjing Hu3
 Changkao Mu2
 Yuqiu Wei3
 Jufa Chen3*
 Tao Jiang1*
The Western Subarctic Gyre (WSG) is a cyclonic upwelling gyre in the northwest subarctic Pacific, which is a region with a high concentration of nutrients but low chlorophyll. We investigated the community structure and spatial distribution of phytoplankton in this area by using HPLC-pigment CHEMTAX (a chemotaxonomy program) and metabarcoding sequencing during the summer of 2021. The phytoplankton community showed significant differences between the two methods. The CHEMTAX analyses identified eight major marine phytoplankton assemblages. Cryptophytes were the major contributors (24.96%) to the total Chl a, followed by pelagophytes, prymnesiophytes, diatoms, and chlorophytes. The eukaryotic phytoplankton OTUs obtained by metabarcoding were categorized into 149 species in 96 genera of 6 major groups (diatoms, prymnesiophytes, pelagophytes, chlorophytes, cryptophytes, and dinoflagellates). Dinoflagellates were the most abundant group, accounting for 44.74% of the total OTUs obtained, followed by cryptophytes and pelagophytes. Sixteen out of the 97 identified species were annotated as harmful algal species, and Heterocapsa rotundata, Karlodinium veneficum, and Aureococcus anophagefferens were assigned to the abundant group (i.e., at least 0.1% of the total reads). Nutrients were more important in shaping the phytoplankton community than temperature and salinity. The 24 stations were divided into southern and northern regions along 44°N according to the k-means method, with the former being dominated by high Chl a and low nutrients. Although different phytoplankton assemblages analyzed by the two methods showed various relationships with environmental factors, a common feature was that the dinoflagellate proportion showed a significantly negative correlation with low nutrients and a positive correlation with Chl a.
Marine phytoplankton form the basis of the marine food web and play an essential role in biogeochemical processes and the mitigation of global climate change (Sunagawa et al., 2015). The geographic patterns of phytoplankton assemblages are governed by spatial and environmental factors, especially temperature, on a global scale (Villar et al., 2015). For regional areas, the distribution of phytoplankton community compositions is also shaped by different processes, such as ocean currents, water column depths and environmental stresses (e.g., nutrient and light limitation) (Paerl et al., 2018; Wu et al., 2020; Liu et al., 2022). Considering phytoplankton’s ability to rapidly adapt to environmental changes, these can be used as indicators of marine environmental changes (Paerl et al., 2018).
Accurate identification of phytoplankton population structure is difficult, especially for small-sized (e.g., picoplankton) or fragile cells. This is a hindrance in studying the spatial and temporal dynamics of phytoplankton assemblages in the natural environment (Hattori et al., 2004; Wang et al., 2022). Traditionally, information on phytoplankton assemblages is determined through the use of taxonomic methods (i.e., microscopic observation and HPLC-pigment analyses) (e.g., Hattori et al., 2004; Fujiki et al., 2009; Kwak et al., 2014; Waga et al., 2022). Only large phytoplankton (> 10 μm, such as diatoms and dinoflagellates) were identified and counted by light microscopy in most previous studies due to the lack of distinguishing characteristics of small phytoplankton and the limitation of microscope resolution (Hattori et al., 2004; Komuro et al., 2005; Fujiki et al., 2009). Many phytoplankton species are fragile and often damaged during the fixation process by Lugol’s solution or formalin. Moreover, taxonomic identification is extremely time-consuming and requires well-trained specialists (Wang et al., 2022). By comparison, HPLC-pigment CHEMTAX analyses are highly efficient in measuring the biomass of different phytoplankton assemblages, including picoplankton and fragile cells (e.g., cryptophytes), in batches. Consequently, HPLC-pigment analyses have been widely used for qualitative and quantitative analyses of phytoplankton groups in various sea areas (e.g., Obayashi et al., 2001; Fujiki et al., 2009; Kwak et al., 2014; Waga et al., 2022). Nevertheless, the main problem with HPLC-pigment CHEMTAX is that the phytoplankton population classification is at the phylum level, not at the species level or even the class level.
Our ability to assess the biodiversity of phytoplankton and identify their ecological significance in the marine environment has been enhanced due to the development of molecular biology-based methods (Bik et al., 2012). Based on these modern molecular approaches, phytoplankton assemblages showed much greater diversity across different aquatic environments than was detectable by traditional methods, such as microscopy and HPLC-pigment analyses (Gong et al., 2020; Wang et al., 2022). In particular, DNA metabarcoding methods based on molecular marker amplification and high-throughput sequencing approaches have been rapidly developed in recent years (Gong et al., 2020). In numerous studies, the metabarcoding method has been applied widely to investigate phytoplankton communities in various seas, such as the northwestern Pacific Ocean (Wu et al., 2020), South China Sea (Wang et al., 2022), Neuse River Estuary (Gong et al., 2020), and Jiaozhou Bay (Liu et al., 2022). Those studies showed that environmental factors (i.e., environmental selection) and geographical distance (i.e., dispersal limitation) are important factors that shape the phytoplankton community in the ocean, even on a small scale (Wu et al., 2020; Li et al., 2022; Zhang et al., 2022). In particular, metabarcoding has an extraordinary advantage in distinguishing harmful and/or toxic algal species, some of which are easily missed by microscopic methods (Liu et al., 2022; Wang et al., 2022). Consequently, the metabarcoding approach has expanded our understanding of the relationship between environmental factors and phytoplankton population diversity in the marine environment.
The Western Subarctic Gyre (WSG) is situated in the subarctic North Pacific, which is characterized by high nutrient and low chlorophyll (HNLC) concentrations and contains distinctive differences in oceanographic and biogeochemical processes. Fe deficiency and grazing pressure are the main reasons for the low Chl a concentration in this area (Harrison et al., 2004). Nevertheless, seasonal phytoplankton blooms with high Chl a concentrations (1−12 μg/L) occurred frequently during late spring in the WSG (Obayashi et al., 2001; Imai et al., 2002), which suggests that the environmental factors affecting the spatial and temporal distribution of phytoplankton populations are complex. Consequently, the phytoplankton community structure and the correlation between phytoplankton assemblages and environmental factors in this area have been extensively studied. Nevertheless, phytoplankton community structure was investigated by microscopy and HPLC-pigment methods in previous studies (e.g., Suzuki et al., 2002; Harrison et al., 2004; Fujiki et al., 2009; Kwak et al., 2014; Waga et al., 2022). Information on the molecular composition of phytoplankton is very limited in the WSG, which suggests a significant knowledge gap in understanding the spatial and temporal distribution of the algal community.
In the present study, we combined HPLC-pigment CHEMTAX and metabarcoding of the V4 region of the 18S rDNA sequence (1) to investigate the diversity and spatial distribution of phytoplankton assemblages in WSG during summer, (2) to investigate how environmental factors affect the spatial distribution of phytoplankton communities, and (3) to determine the agreement between CHEMTAX and metabarcoding and discuss their advantages and disadvantages. To the best of our knowledge, this study presents the first combined metabarcoding and HPLC-pigment analyses of the phytoplankton community in open oceans.
From 23 May to 17 July 2021, a field investigation was conducted in the WSG of the Northwest Pacific Ocean (40°25’12”-48°4’48”N, 163°25’12”-171°26’24”E) by the saury fishing vessel “Minghualun” (Figure 1). A total of 24 stations (St. M1−M24, listed in chronological order) were randomly set up depending on the navigation track of the fishing vessel, in south to north order. Temperature and salinity were measured using a SBE-37 MicroCAT recorder (Seabird Electronics, Inc., Washington, USA).
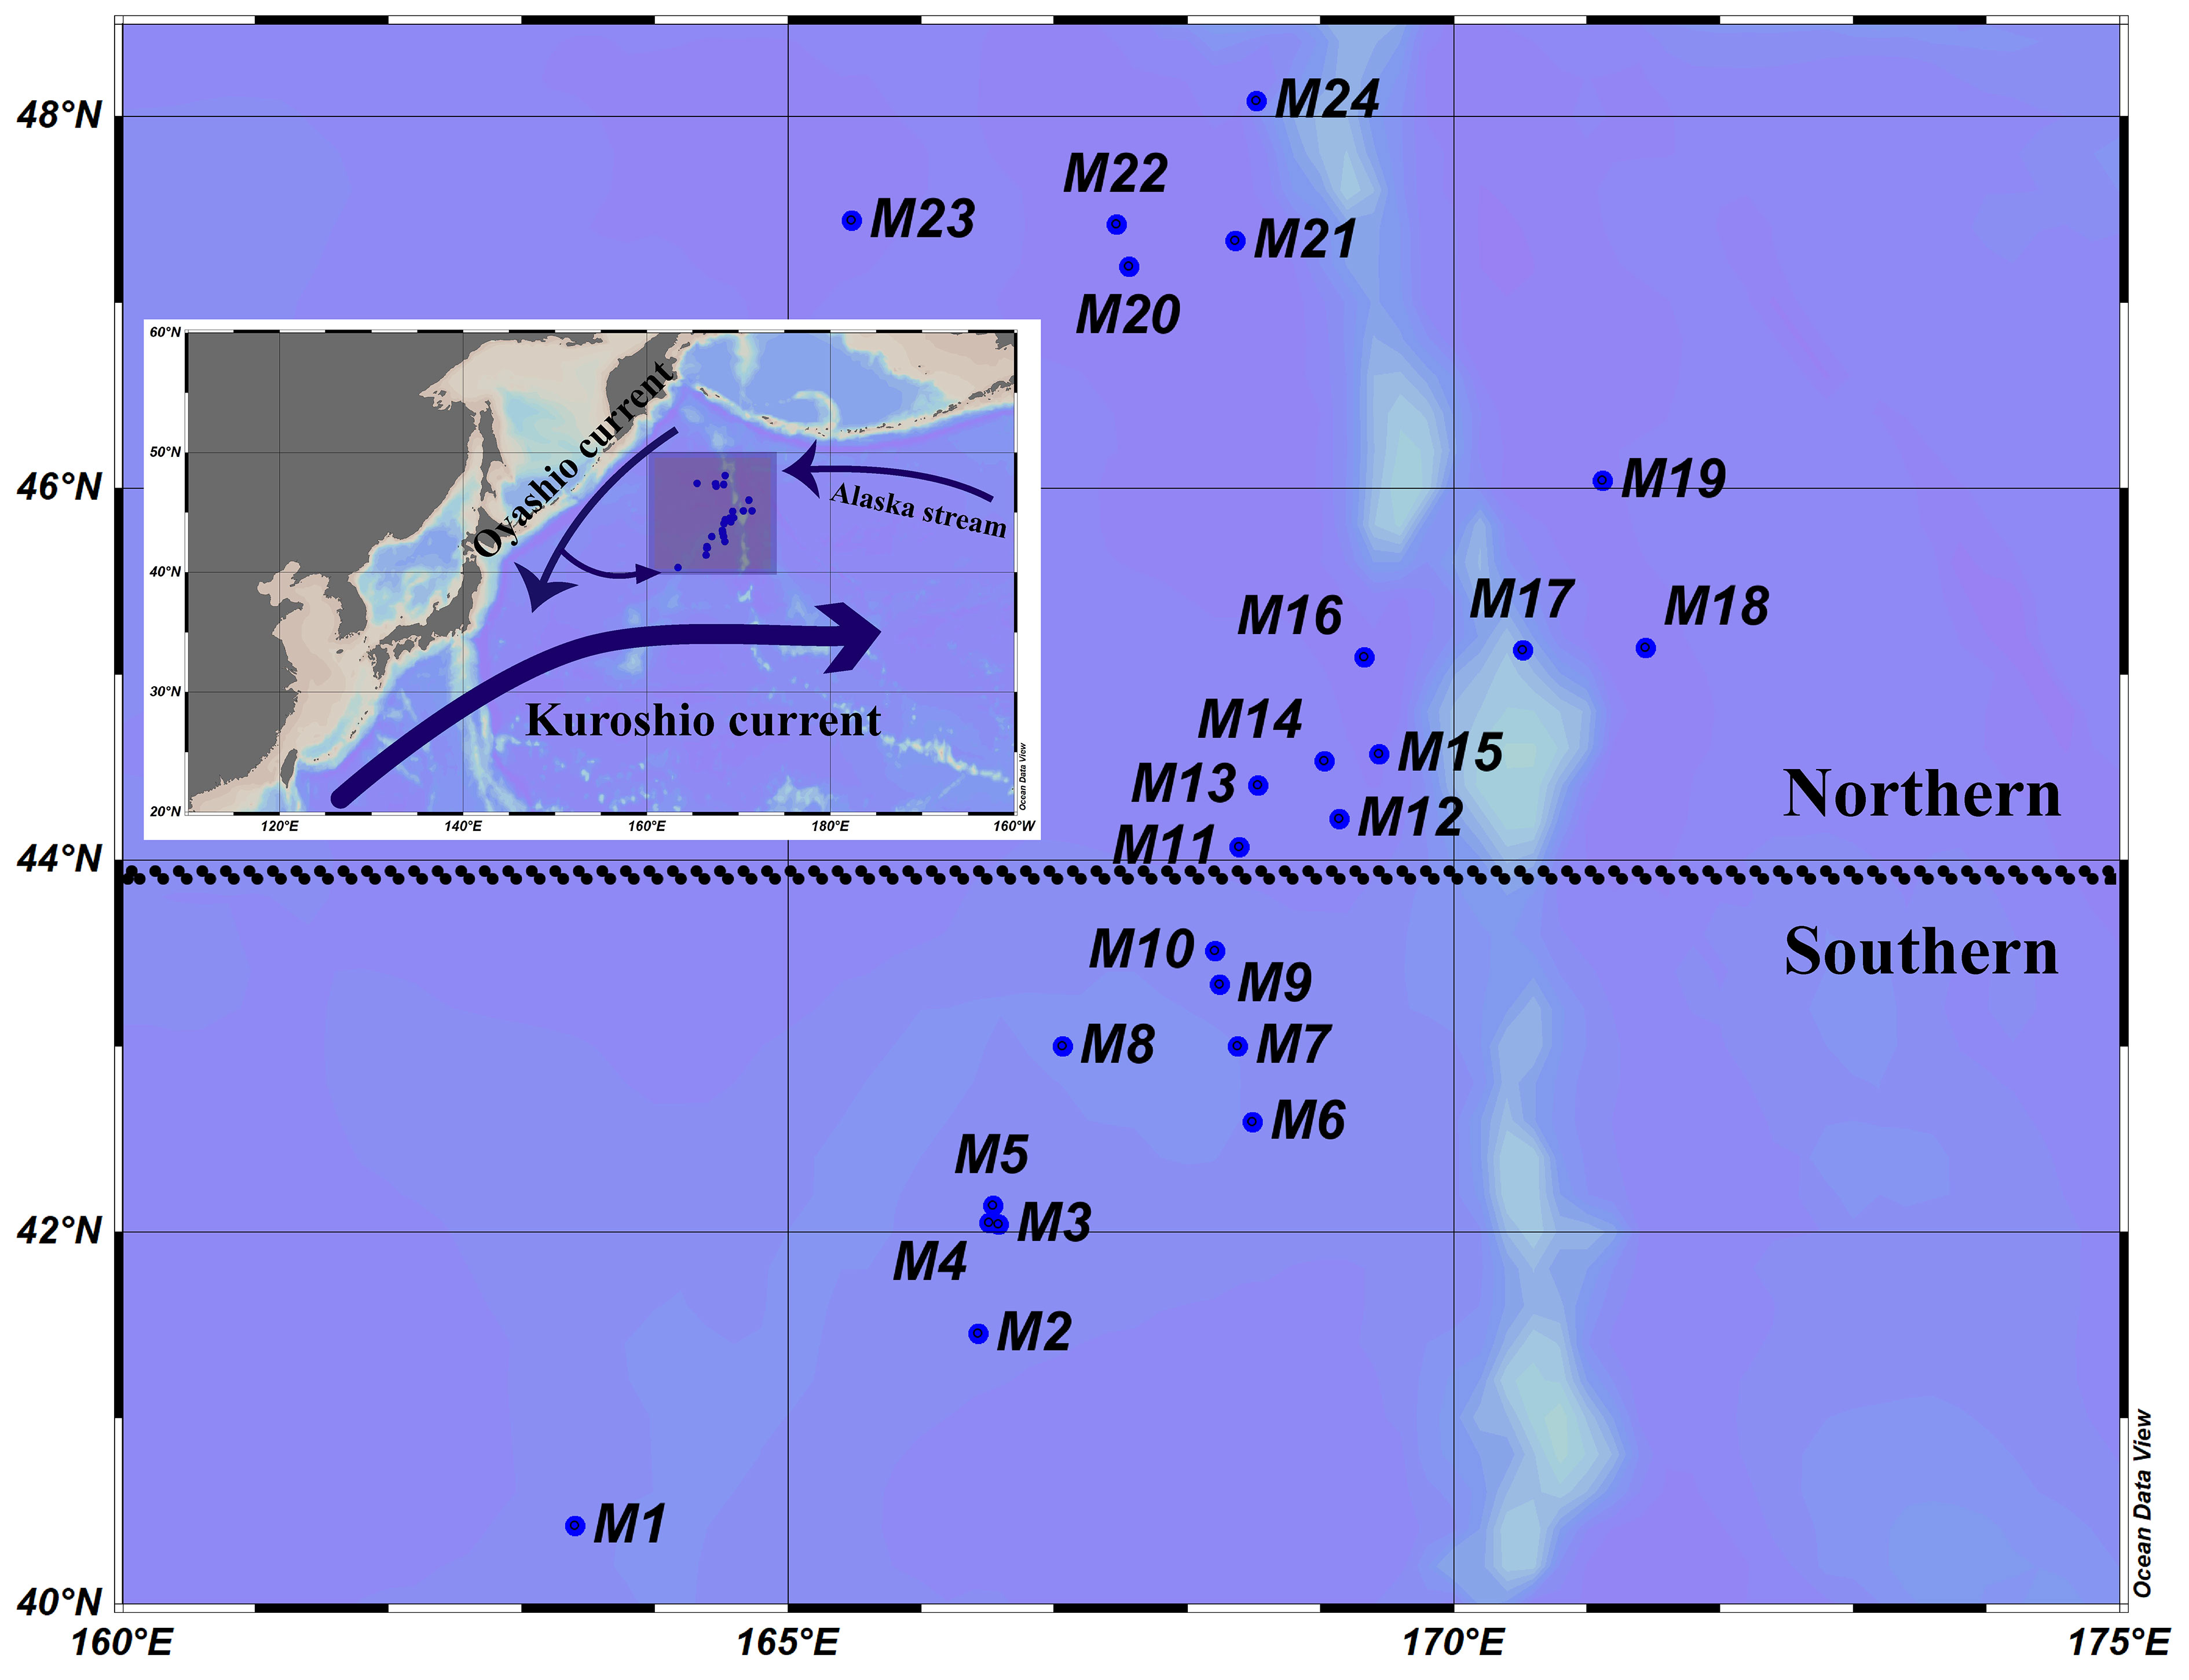
Figure 1 Sampling sites and schematic illustration of the Kuroshio and Oyashio currents. Southern area: M1–M10; northern area: M11–M24.
Triplicate water samples were taken from the surface layer (5 m) of each site by using a Niskin water sampler (5 L). For phytopigment analyses, 2.5 L seawater was filtered by GF/F membranes (0.7 μm pore size, Whatman, Britain), which were quickly stored in liquid nitrogen in the laboratory for HPLC analyses. The filtered seawater (300 mL) was stored at -20°C for later nutrient analyses. For molecular analyses, the phytoplankton cells were collected through 0.22 μm polycarbonate membranes (0.22 μm, Whatman, Britain) from 3 L seawater for three parallel samples, which were stored in liquid nitrogen.
Nutrients, including nitrate (), nitrite (), ammonium (), dissolved reactive phosphorous (DIP), and dissolved silicate (DSi), were determined by a QuAAtro continuous flow analyzer (SEAL, Germany), as described by Strickland and Parsons (Strickland and Parsons, 1972). Concentrations of DIN were the sum of , , and .
The frozen filters were cut into small pieces and transferred into a 15 mL polypropylene centrifuge tube, to which 3 mL 95% HPLC-grade acetone was added. The mixture was sonicated for 5 min in an ice bath under low light conditions. Pigment determination was performed according to the method of Zapata et al. (2004). The HPLC instrument (Agilent 1200, USA) was equipped with an autosampler and diode array detector (Model G1315C). The pigments extracted were separated by a C8 column (150 mm, 4.6 mm, Waters Symmetry) at 25°C.
The following 20 authentic pigment standards were purchased from DHI Inc. (Denmark): Chl a, Chl b, Chl c2, Chl c3, pheophythin a (Phe a), pheophorbide a (Pheide a), Mg-2,4-divinylpheoporphyrin (MgDVP), alloxanthin (Allo), 19’-but-fucoxanthin (But-Fuco), β-carotene (β-Car), diadinoxanthin (Diadino), diatoxanthin (Diato), fucoxanthin (Fuco), 19’-hex-fucoxanthin (Hex), lutein (Lut), neoxanthin (Neo), Peridinin (Peri), prasinoxanthin (Pras), violaxanthin (Viola), and zeaxanthin (Zea).
We calculated the relative contribution of the different phytoplankton groups to the total Chl a from pigment concentration data by using version 1.95 of the CHEMTAX software (Mackey et al., 1996; Wright et al., 2009). The program uses factor analyses and the steepest descent algorithm to find the best fit to the data based on an initial guess of the pigment ratios for the algal group to be determined (Mackey et al., 1996; Suzuki et al., 2002). To select the best input ratios for the pigment data set, we generated a series of 60 derivative pigment ratio matrixes by multiplying each cell of the initial input ratio by a random function to optimize the matrix. We considered the best 10% of the results as the optimized results. We presented the output data as absolute concentrations of Chl a (μg/L) attributed to each algal group (Table 1; Figure 2).
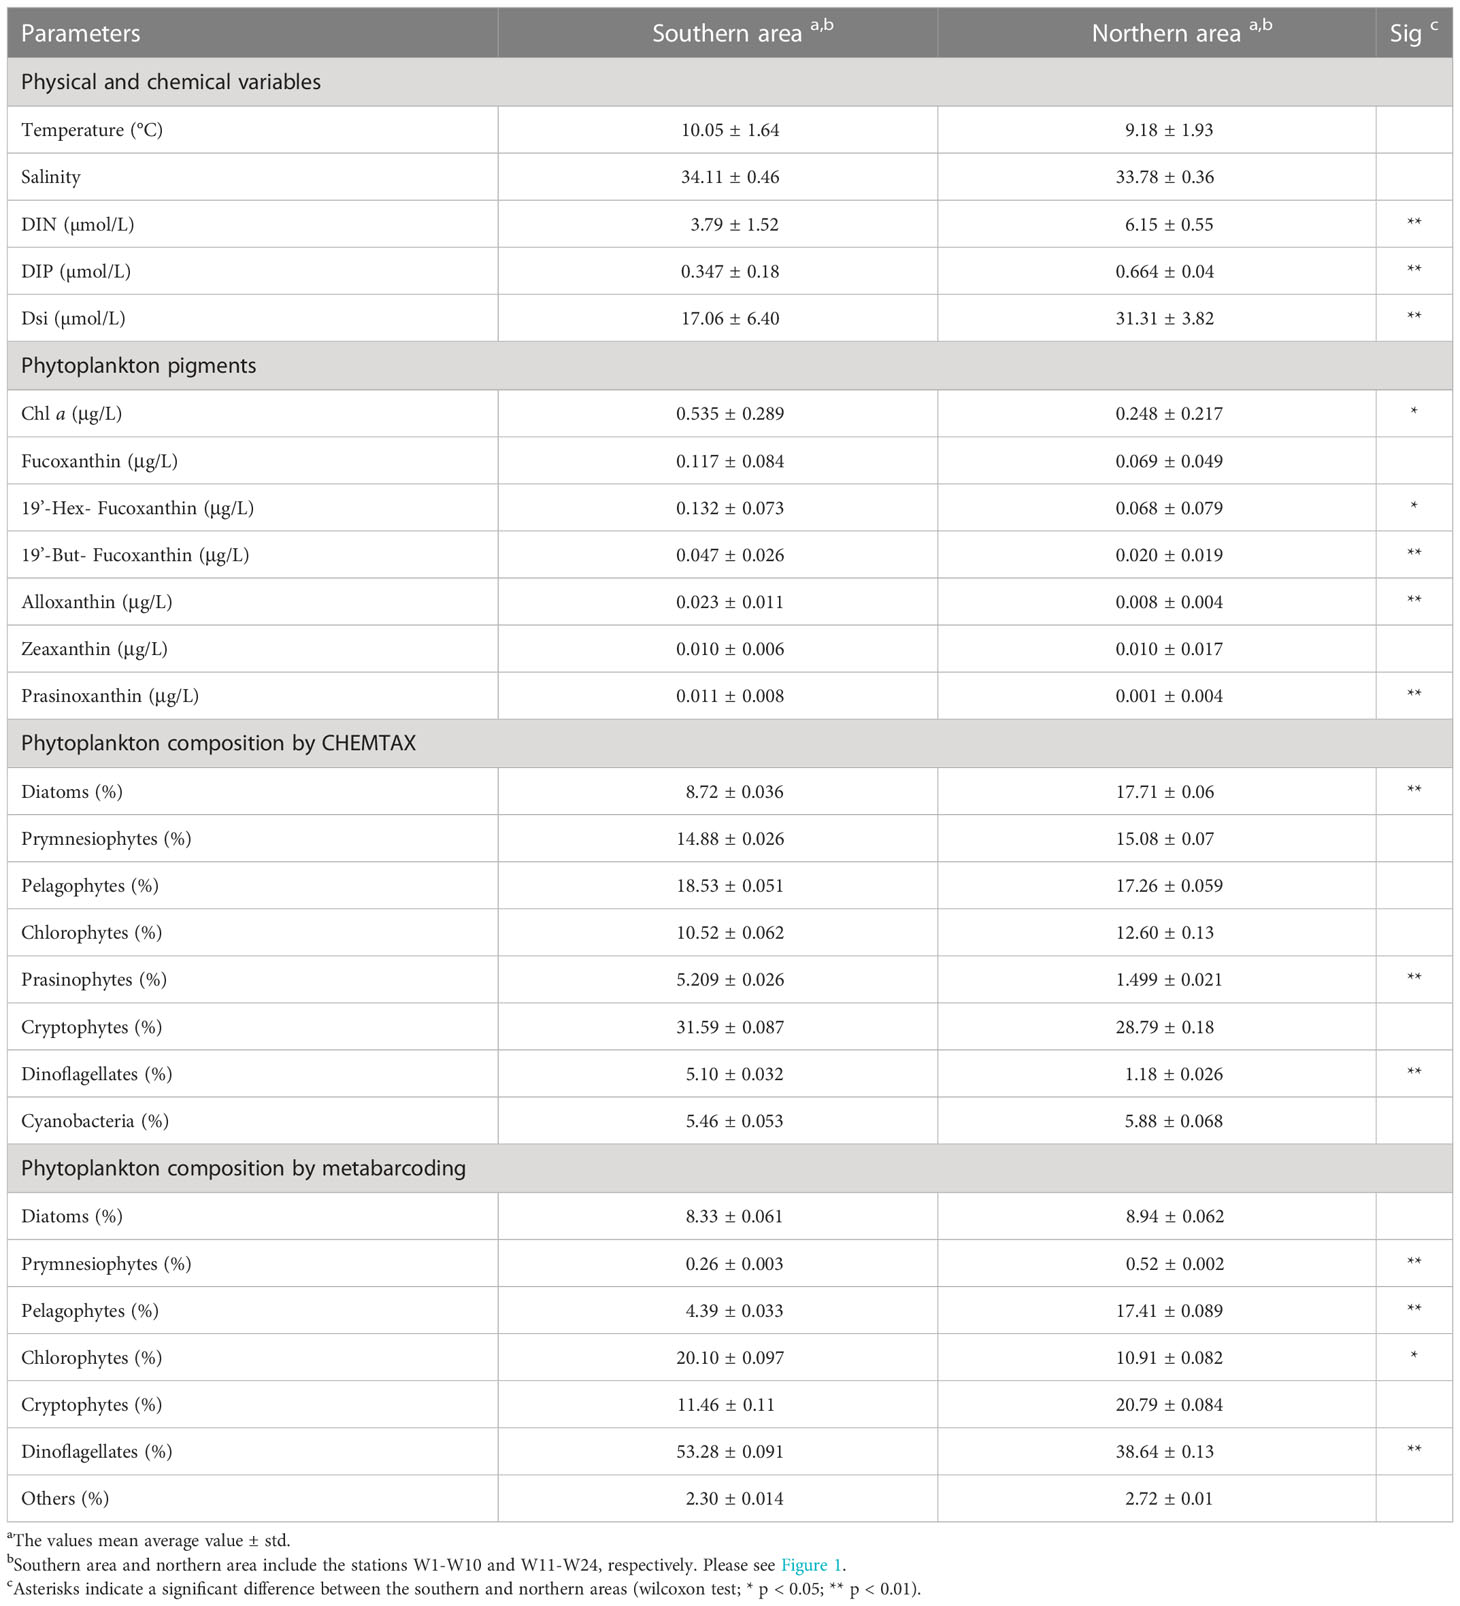
Table 1 Average values of environmental factors and phytoplankton pigments in the WSG.
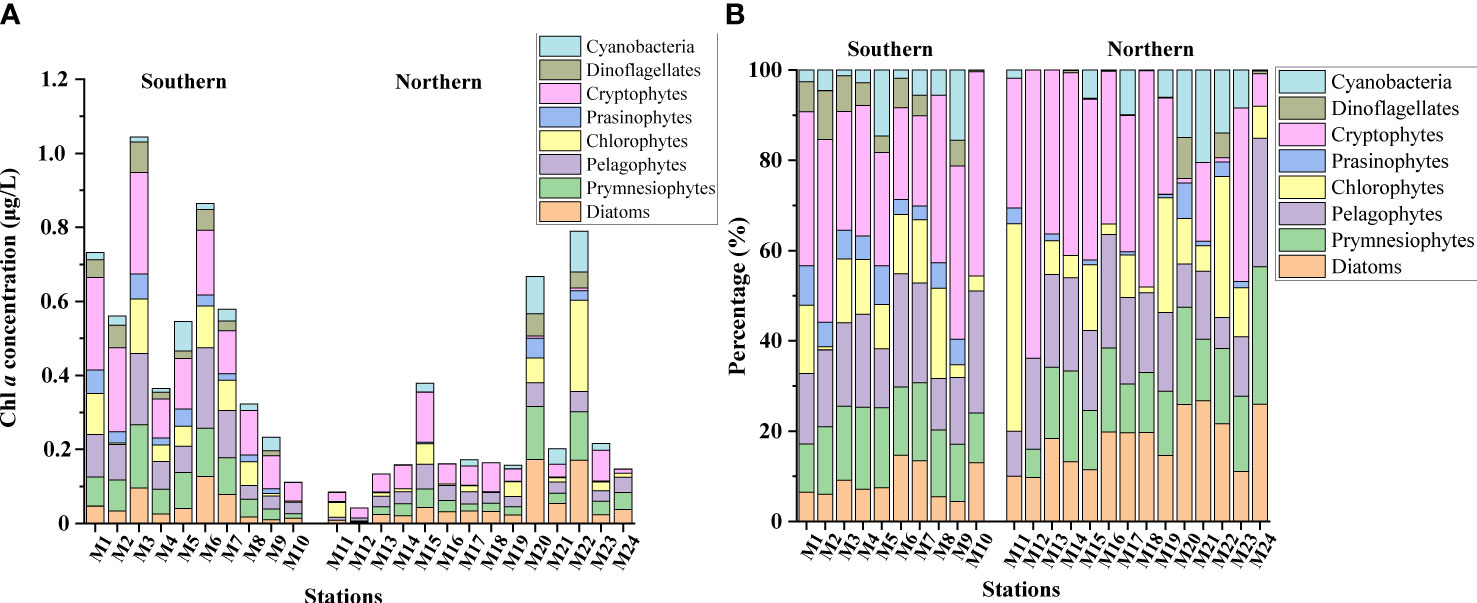
Figure 2 Absolute (A) and relative (B) CHEMTAX-derived Chl a concentrations of phytoplankton groups in the summer in the Northwest Pacific Ocean.
Total genomic DNA of each sample was extracted by using a DNeasy Power Water Kit (QIAGEN, USA) according to the manufacturer’s protocols, and the qualified DNA samples were stored at -80°C for subsequent analyses. The V4 variable region of the 18S rDNA gene was amplified using universal primers (TAReuk454FWD1F: 5’- CCAGCA(G/C)C(C/T)GCGGTAATTCC-3’ and TAReukREV3R: 5’- ACTTTCGTTCTTGAT(C/T)(A/G)A-3’) (Stoeck et al., 2010) by an ABI GeneAmp® 9700 PCR thermocycler (ABI, CA, USA). The PCR mixture contained 5 × Trans Start Fast Pfu buffer 4 μL, 2.5 mM dNTPs 2 μL, forward primer (5 μM) 0.8 μL, reverse primer (5 μM) 0.8 μL, Trans Start Fast Pfu DNA Polymerase 0.4 μL, template DNA 10 ng, and ddH2O up to 20 μL. PCRs were performed in triplicate. The PCR conditions were as follows: first, the initial denaturation at 95°C for 3 min; then, 35 cycles of 95°C for 30 s, 55°C for 30 s, 72°C for 45 s; and finally, the extension at 72°C for 10 min. Degradation and contamination of PCR products were monitored on 2% agarose gels and purified with the AxyPrep DNA Gel Extraction Kit (Axygen Biosciences, Union City, CA, USA). The purified amplicons were pooled in equimolar amounts, and then paired-end sequencing was performed on an Illumina NovaSeq PE250 platform (Illumina, San Diego, USA) using the standard protocols of Majorbio Bio-Pharm Technology Co., Ltd. (Shanghai, China). All raw reads were deposited in the NCBI Sequence Read Archive (SRA) database (Accession Number: SRP392983).
Raw sequencing reads were denoised, trimmed, and filtered using Fastq version 0.20.0 (Chen et al., 2018) and merged by FLASH version 1.2.7 (Magoč and Salzberg, 2011). OTUs were generated on the basis of 97% similarity after the removal of singletons and doubletons (Edgar, 2013). The taxonomy of each OTU representative sequence was analyzed by RDP Classifier version 2.2 (Wang et al., 2007) against the SILVA 18S rRNA database (release138, www.arb-silva.de) for phytoplankton and zooplankton groups using a confidence threshold of 0.7. The raw sequencing data were equalized using the “gclus” package in R based on random subsampling of the least sequence number per sample (10757 sequence reads here) to standardize sampling efforts and bring the data from different samples onto a common scale. We identified eukaryotic algae OTUs by using the taxonomic information of AlgaeBase (https://www.algaebase.org/). The species was annotated as a harmful algal bloom (HAB) species if it was categorized as harmful microalgae in the IOC-UNESCO Taxonomic Reference List of Harmful Micro Algae (http://www.marinespecies.org/hab/) or had been reported as an HAB species in previous studies.
Analyses of sites were clustered using the “stats” package by the k-means method. ODV (Ocean Data View) was used to draw the station map and spatial distribution contour map of temperature, salinity, nutrients and abundant HAB species. Alpha-diversity analyses were calculated by the “vegan” package in R (v. 4.1.3), including richness (OTUs) and Shannon diversity. The rarefaction curves were plotted with richness using the R package “vegan” for all samples. For beta-diversity analyses, nonmetric multidimensional scaling (NMDS) analyses were performed in R based on Bray−Curtis similarity by the “vegan” package. The Wilcoxon signed-rank test was used to analyze the differences in the environmental parameters, alpha diversity indices, and relative abundance of specific taxa across all samples. The analyses of ADONIS were used to statistically test for significant differences in microeukaryotic communities in the two regions. Bar and bubble charts were plotted using the R package ggplot2 (Wickham, 2016). Mantel tests of the environmental factors with phytoplankton were carried out by using the R package ggcor, and the figures were drawn by the R package ggplot2. After the prediction of detrended correspondence analysis (DCA) using the R package vegan, Redundancy analyses (RDA) were performed with CANOCO 5 software to explore the relationships between environmental and phytoplankton variables. The agreement between the CHEMTAX and metabarcoding results was evaluated by regression analyses using Origin 2017 software. Correlations between phytoplankton and zooplankton from phyla to OTU levels were analyzed using the Spearman method using the R package psych and visualized using the R package circlize (Gu et al., 2014) and cytoscape. The interactions were filtered with Spearman’s coefficient < 0.6 and p > 0.05 clustered into phylum levels for visualization.
Clustering was performed according to the k-means method, and the 24 stations were divided into southern (M1−M10) and northern (M11−M24) regions along 44°N (Figure 1). The environmental parameters in the surface layer have been described in detail by Figure S1 and Table 1. The temperature and salinity ranged from 6.96°C to 13.71°C and from 33.22 to 34.92 with average values of 9.54°C and 33.92, respectively. No significant differences were found between the southern and northern regions (Wilcoxon test, p > 0.05). Nevertheless, the nutrient concentrations of DIN (1.63−7.38 μmol/L), DIP (0.10−0.94 μmol/L), and DSi (7.51−39.01 μmol/L) in the northern area were significantly higher than those in the southern area (Wilcoxon test, p < 0.01).
A total of 20 pigments were identified in this survey by high-performance liquid chromatography (HPLC), and the average Chl a concentration was 0.37μg/L and ranged from 0.042μg/L (M12) to 1.04μg/L (M3) (Figure 2A) and showed a significant decline from the southern to northern area (p < 0.05; Table 1). Similarly, the concentrations of 19’-hex-fucoxanthin, 19’-but-fucoxanthin, alloxanthin, lutein and prasinoxanthin in the southern area were significantly higher than those in the northern area. The CHEMTAX analyses identified eight major marine phytoplankton assemblages (Figure 2B). Cryptophytes were the major contributors (24.96%) to the total Chl a, followed by pelagophytes (16.86%), prymnesiophytes (15.85%), diatoms (13.27%) and chlorophytes (13.17%) in the whole study area (Figure 3A). The proportion of diatoms to total Chl a in the southern area was significantly lower than in the northern area, whereas prasinophytes and dinoflagellates showed the reverse trend (p < 0.05; Table 1).
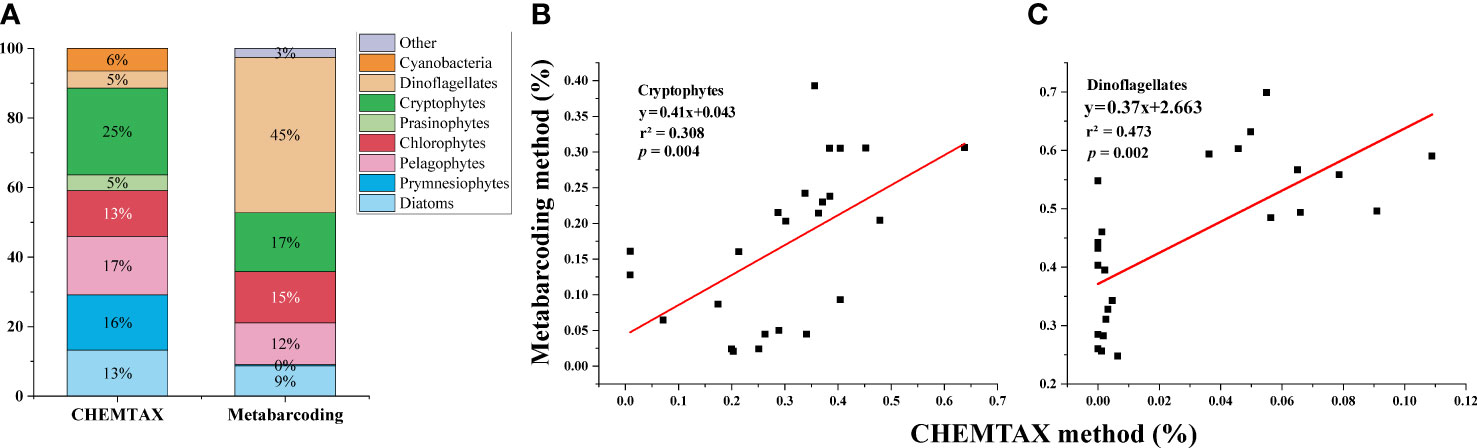
Figure 3 Composition of phytoplankton assemblages based on the phylum level by HPLC-pigment CHEMTAX and metabarcoding analyses (A). Pairwise comparison of CHEMTAX and metabarcoding in determining phytoplankton taxonomic composition: Cryptophytes (B) and Dinoflagellates (C).
After quality control, chimeric filtering, singleton deletion, and screening, 3,948,649 high-quality sequences were obtained from 72 samples. Through random sampling according to the lowest read number (10,757), 527 operational taxonomic units (OTUs) were clustered at the 0.03 distance level. The rarefaction curves were roughly saturated for all samples (Figure S2A). In α diversity analyses, the richness index showed no remarkable differences (p > 0.05, Wilcoxon’s test) across the southern and northern regions. However, the Shannon diversity index of samples in the northern region was significantly higher than in the southern region (p < 0.01, Wilcoxon’s test) (Figure S2B). In β diversity analyses, the first two principal components of the NMDS plot could explain 58.11% of the total variation among all samples (Figure 4A), and the 24 sites could be clearly clustered into southern and northern groups. Analyses of similarity (ADONIS) also showed that the communities of the two regions were significantly (p < 0.01) separated.
The eukaryotic phytoplankton OTUs were categorized into 149 species in 96 genera of 6 major groups (diatoms, prymnesiophytes, pelagophytes, chlorophytes, cryptophytes, and dinoflagellates) (Figure 4A). Dinoflagellates were the most abundant group, accounting for 44.74% of the total obtained OTUs, followed by cryptophytes and pelagophytes, accounting for 16.90% and 11.99%, respectively (Figure 4B). The relative abundances of different phytoplankton groups in the two regions exhibited different patterns (Table 1; Figure S3B). The dinoflagellate and chlorophyte distribution characteristics were obviously higher in the south than in the north (p < 0.05), whereas pelagophytes showed the opposite distribution trend (p < 0.01). In addition, a difference was found in the average abundance of cryptophytes between the two regions, but it was not significant (p > 0.05).
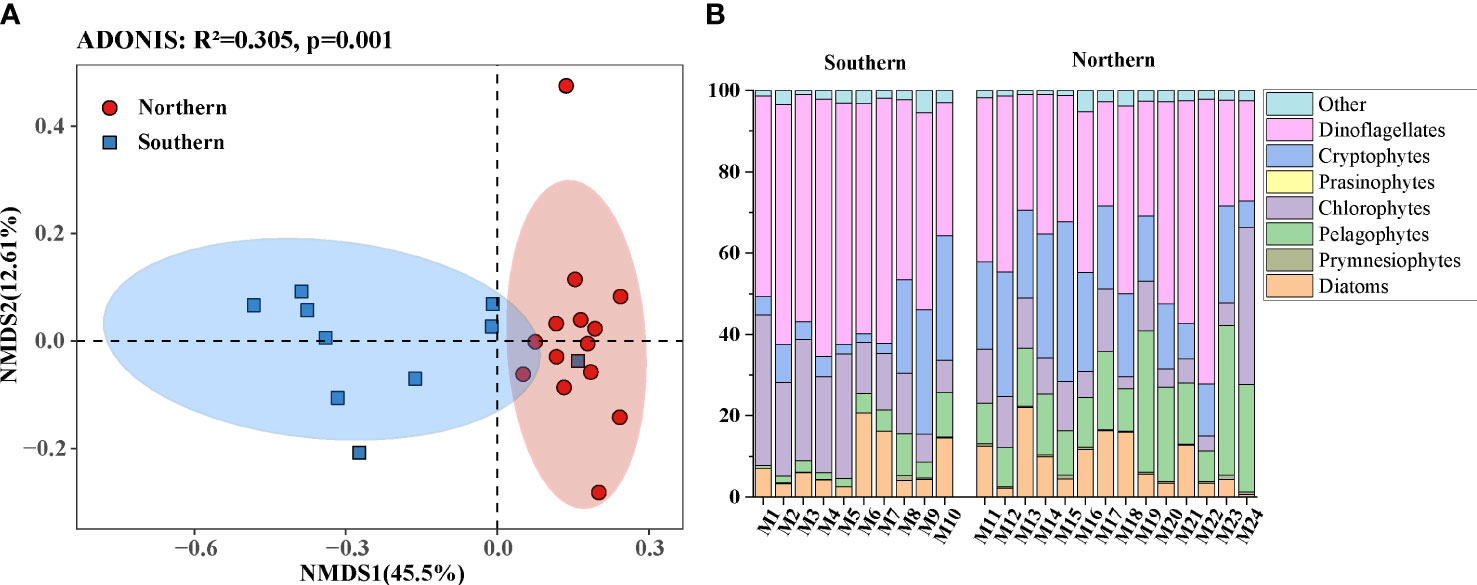
Figure 4 NMDS analyses were analyzed between southern and northern seawater to test the differences (A). Relative abundance of major phytoplankton groups of the Northwest Pacific Ocean as determined by metabarcoding in the summer (B).
The phytoplankton community showed significant differences between the results from CHEMTAX and metabarcoding analyses. Cryptophytes predominated in the phytoplankton community based on CHEMTAX estimates, and dinoflagellates dominated based on metabarcoding analyses (Figure 3A). At the phylum level, metabarcoding annotated more phyla (13 phyla) than CHEMTAX (8 phyla). Six phyla of phytoplankton were identified by both methods. Cyanobacteria were not detected by metabarcoding methods, because we used eukaryotic primers. In addition, metabarcoding analyses detected a small percentage of the phylum (< 2.5%), such as prasinophytes, raphidophytes, and xanthophytes. The linear fitting curve showed that only cryptophytes and dinoflagellates had significantly positive correlations between the two methods (p < 0.01) (Figures 3B, C). However, no significant correlation was found for other phytoplankton groups (p > 0.05) (Figure S4).
To further explore the distribution of harmful algal bloom (HAB) causative species in the study area, 16 out of the 97 identified species were annotated as HAB-forming species if they were previously reported to be HAB-forming species (Table 2; Figure 5), including 8 diatom species, 6 dinoflagellate species, 1 haptophyte species, and 1 heterokontophyte species. The HAB-forming species were classified into three groups according to their relative abundance (Logares et al., 2014). Nine HAB-forming species were assigned to the rare group (i.e., no more than 0.01% of the total reads), four HAB-forming species were assigned to the intermediate group (i.e., between 0.1% and 0.01% of the total reads), and Heterocapsa rotundata, Karlodinium veneficum, and Aureococcus anophagefferens were assigned to the abundant group (i.e., at least 0.1% of the total reads).
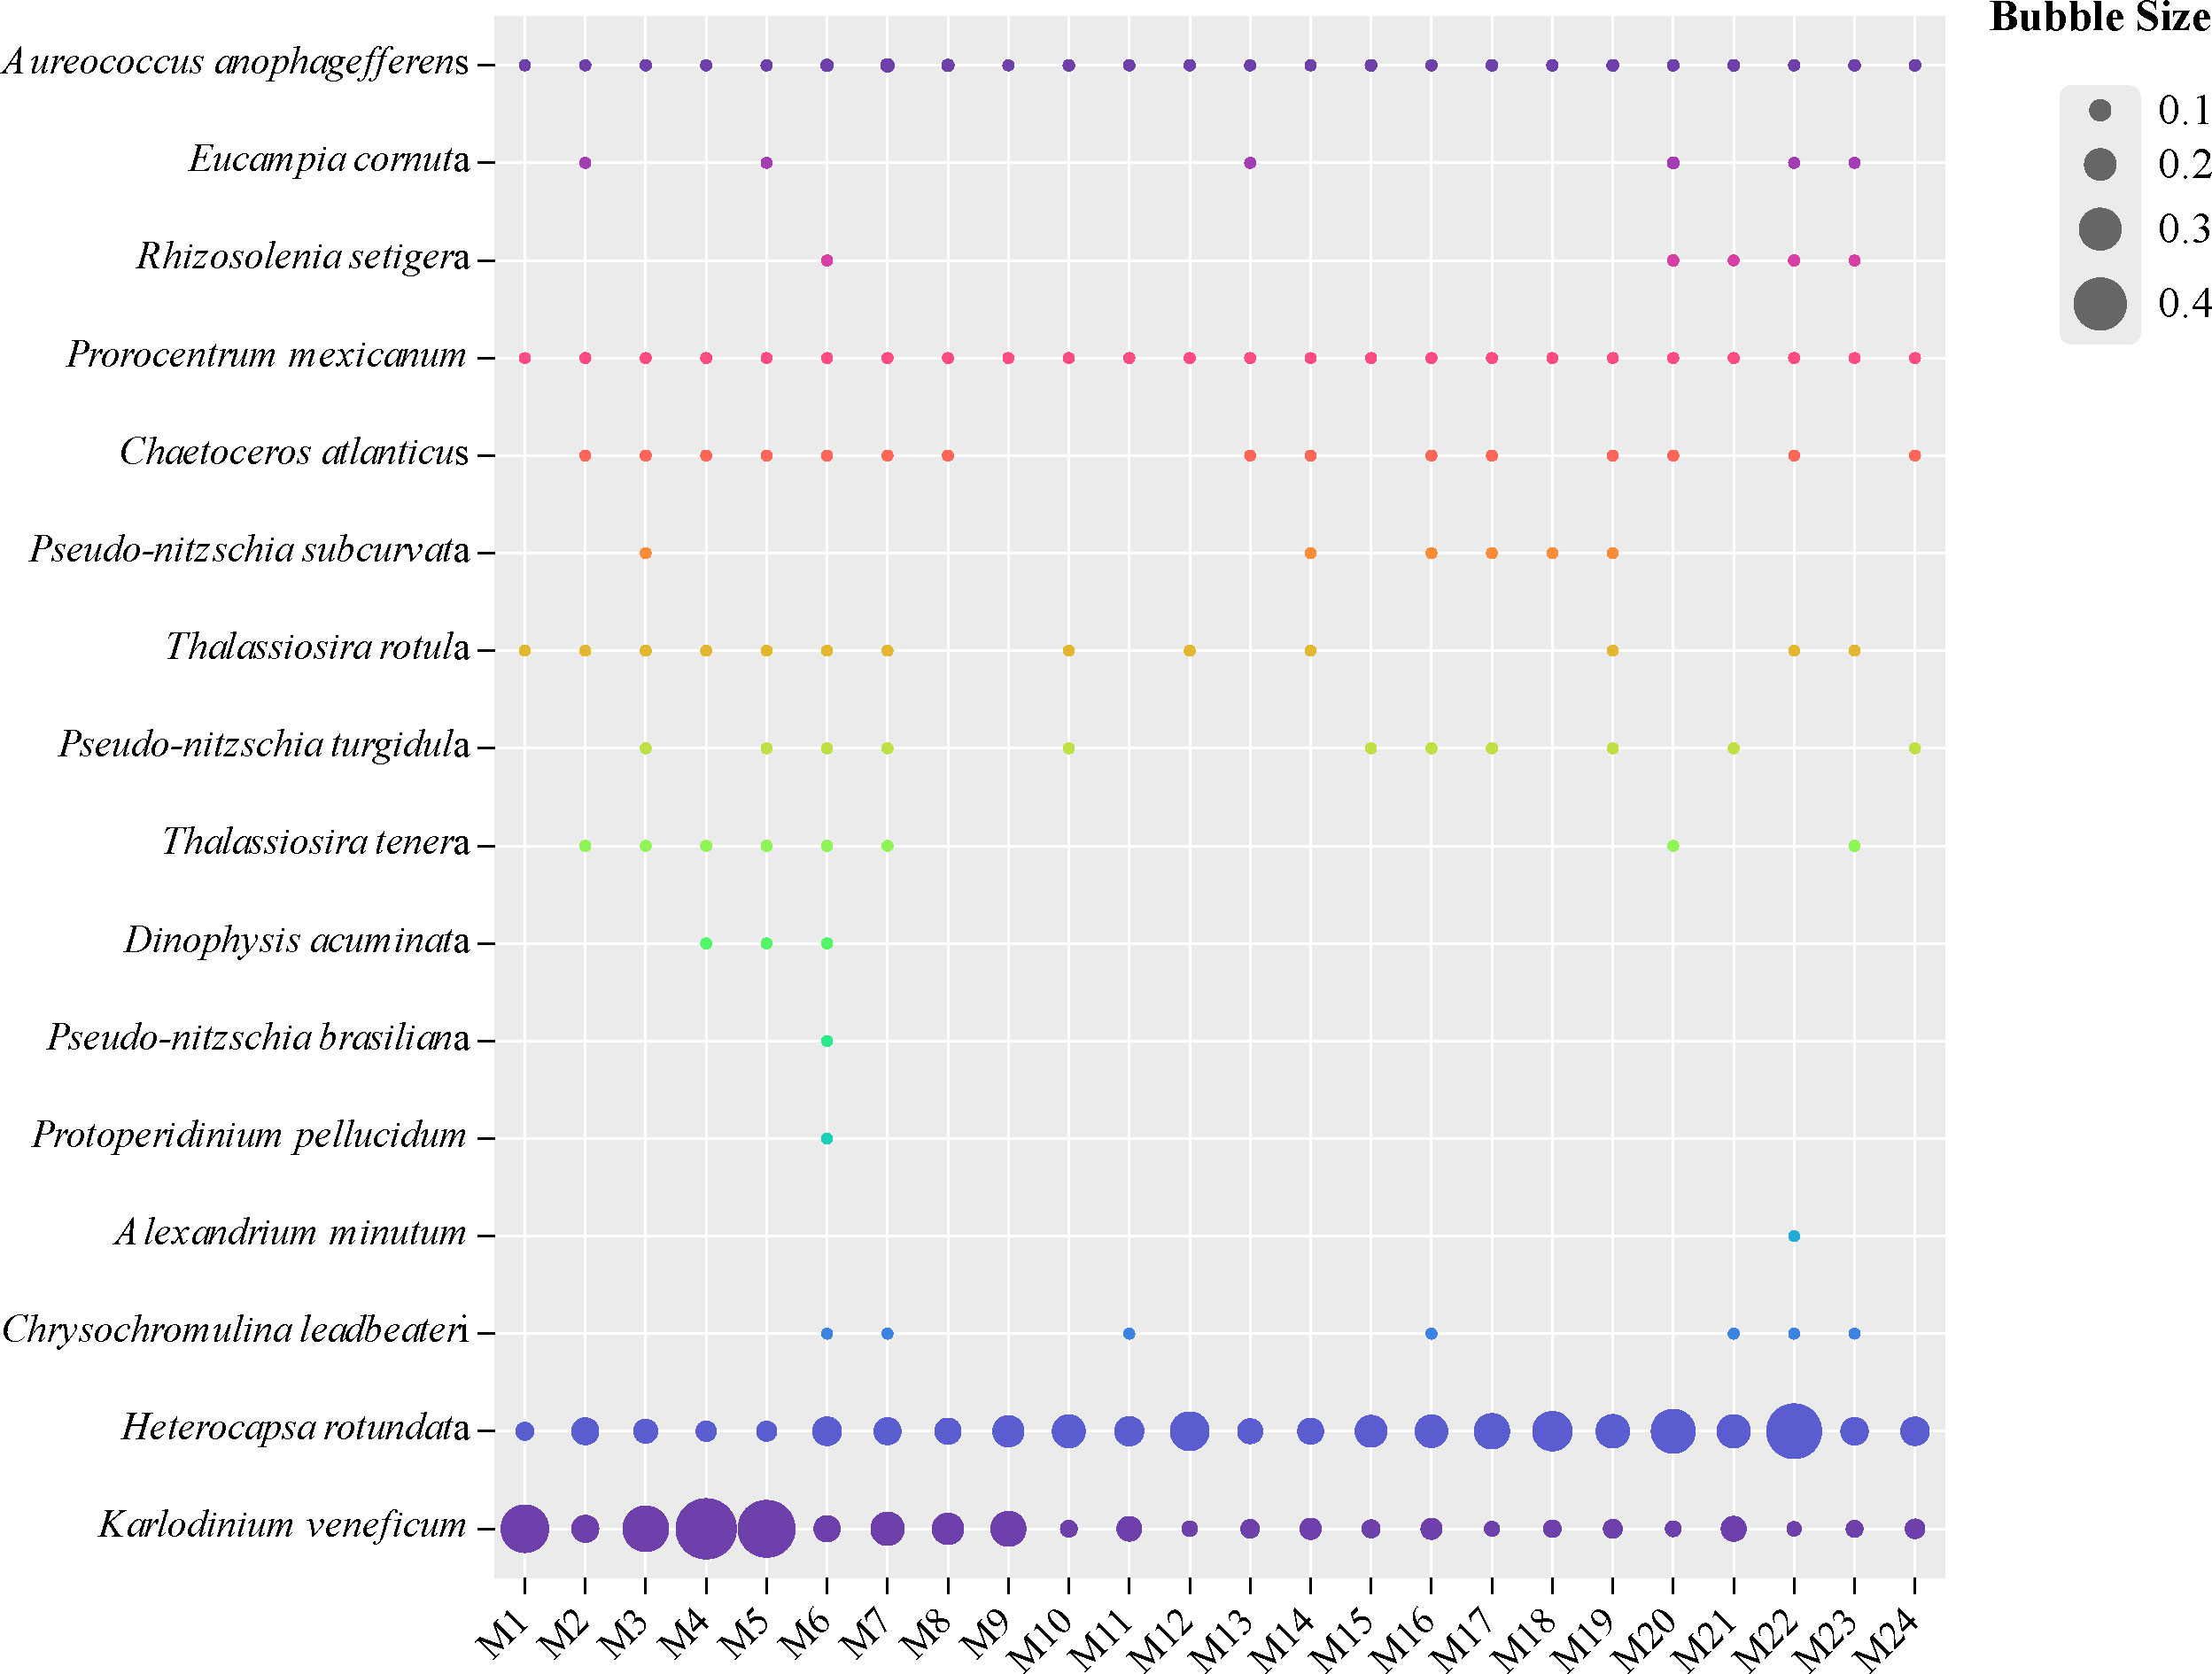
Figure 5 The distribution and relative abundance of 16 HAB-forming species in the surface seawater of the Northwest Pacific Ocean.
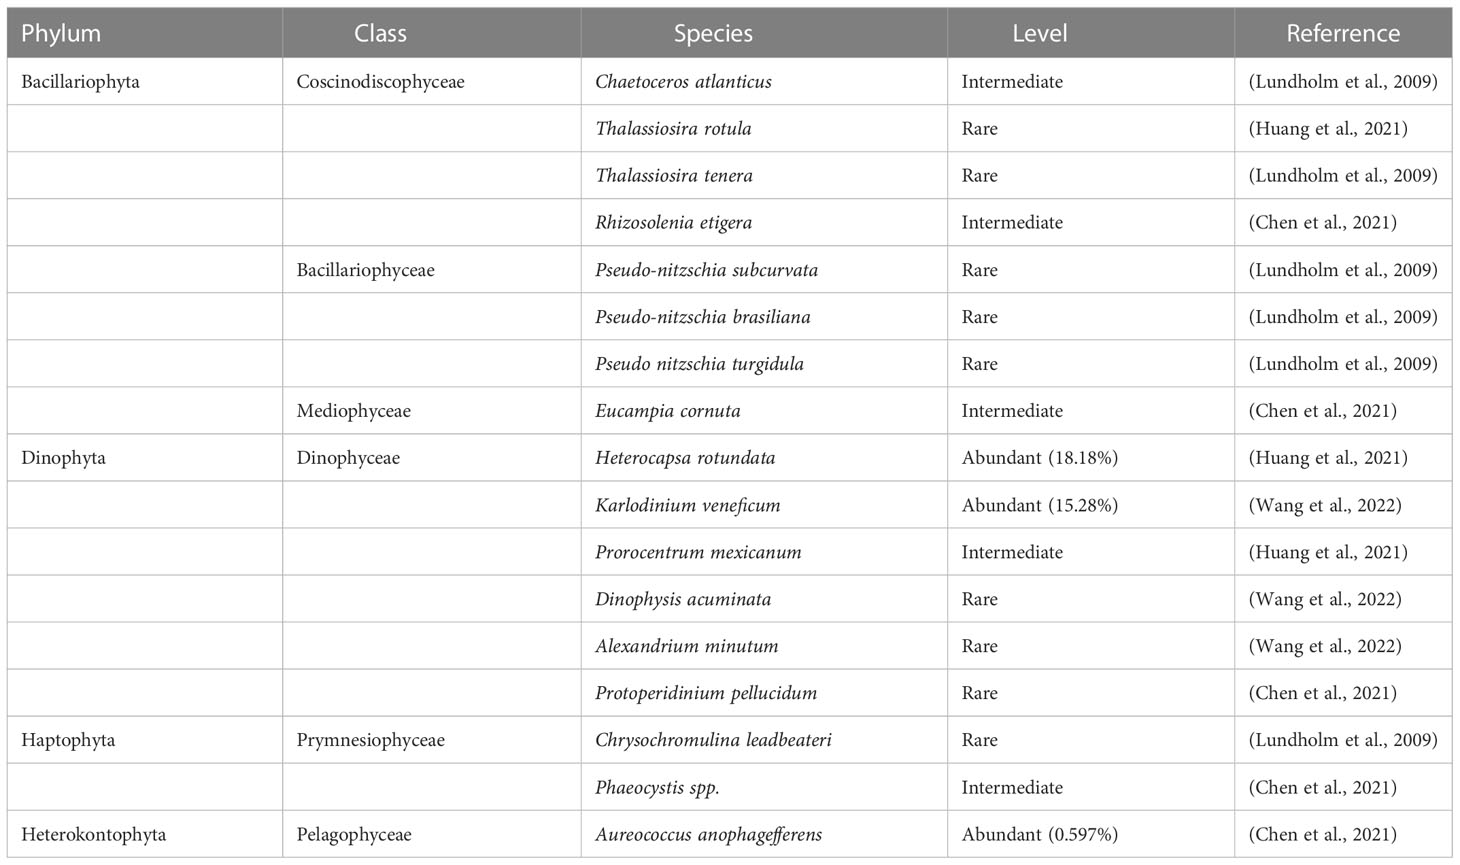
Table 2 HAB species detected in surface water samples from the Northwest Pacific Ocean based on metabarcoding analysis.
Different HAB-forming species exhibited differential geographical dynamics even for those belonging to the same phylum. The dinoflagellate H. rotundata showed preference to the northern region (p < 0.01), whereas K. veneficum showed the opposite geographical pattern (p < 0.01) (Figures S4B and 5). However, the abundance of the pelagophyte A. anophagefferens showed no significant difference between the southern and northern areas (p > 0.05) (Figure S4C). The HAB-forming species annotated here might be an underestimation of the number of HAB-forming species in the WSG. Some species can only be identified at the genus level, such as Phaeocystis spp., Coscinodiscus spp., and Neoceratium spp.
We used the Mantel test to determine the impact of environmental factors on shaping the phytoplankton communities. Nutrients, Chl a, and geographical location were the main factors affecting phytoplankton communities. According to CHEMTAX analyses (Figure 6A), prasinophytes and dinoflagellates were significantly correlated with nutrients, Chl a, and latitude (p < 0.01). Based on metabarcoding analyses (Figure 6B), more phytoplankton groups were associated with environmental factors. For example, prasinophytes and dinoflagellates were significantly correlated with most nutrient elements and Chl a (p < 0.01), and pelagophytes and chlorophytes were correlated with nutrients, latitude, and longitude (p < 0.01 or p < 0.05). However, we found no correlation between temperature and salinity and phytoplankton populations by using either method. When both methods’ results were pooled together, redundancy analyses (RDA) revealed that the sampling stations were separated into two groups along the nutrient gradient and the first axis (Figure 6C), which was consistent with the results of the k-means method. Dioflagellates (as found by CHEMTAX and metabrarcoding) were positively associated with Chl a and salinity and negatively associated with nutrients. We selected the three abundant HAB-forming species by metabarcoding for RDA analyses. K. veneficum was positively correlated with temperature, salinity, and Chl a and negatively correlated with nutrients at the first axis, whereas H. rotundata showed the opposite pattern. A. anophagefferens showed no correlation with these environmental factors (Figure 6C).
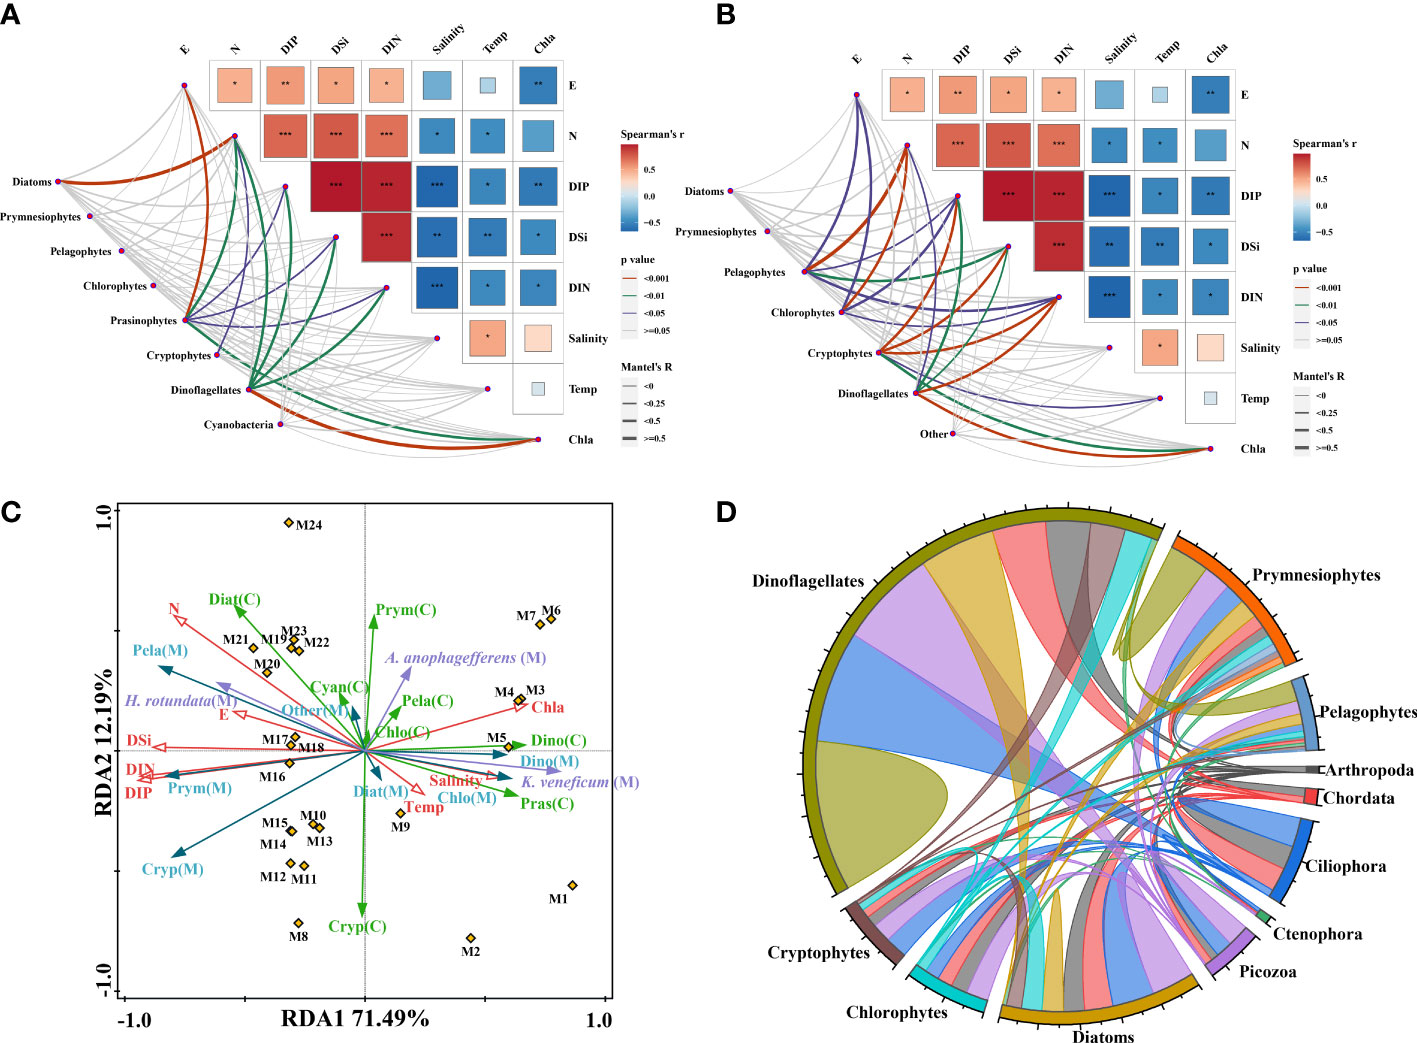
Figure 6 Comparisons of environmental factors and the major phytoplankton communities based on CHEMTAX (A) and metabarcoding analyses (B). Redundancy analyses (RDA) of environmental factors (red) and phytoplankton communities by CHEMTAX (green), metabarcoding (blue), and abundant HAB-forming species (purple) (C). Interaction networks between major phytoplankton OTUs with phytoplankton and the top five zooplankton (D).
The top five most abundant zooplankton groups, such as Arthropoda, Chordata, Ciliophora, Ctenophora, and Picozoa, were selected for correlation analyses with the predominant phytoplankton communities in this area (Figure 6D). A total of 120 OTUs showed 1917 significant correlations between zooplankton and phytoplankton communities by screening, and 68.54% of the total correlations established in the chordal graph were positive. This finding suggested that zooplankton survival selection might play an important role in shaping phytoplankton communities.
HPLC-pigment CHEMTAX is widely used for qualification and quantification of phytoplankton assemblages in the WSG (Suzuki et al., 2002; Fujiki et al., 2009; Fujiki et al., 2014; Gong et al., 2020). Consistent with previous investigations, the present study showed that no single phytoplankton group absolutely dominated the phytoplankton assemblages in this area. Recently, the metabarcoding approach has been widely used in oceans and has become a competitive method for determining the biodiversity of marine phytoplankton communities (Gong and Marchetti, 2019; Liu et al., 2022), which was not performed in the WSG. This study used the V4 region of 18 s rDNA, which is among the best choices for metabarcoding the whole eukaryotic algal community in the marine environment (Lear et al., 2017). Although metabarcoding can provide detailed phytoplankton species/genus composition, only the composition at the phylum level can be compared for the results obtained from the two methods. The structure of the phytoplankton community displayed marked differences for some phytoplankton assemblages, according to the two methods. Dinoflagellates were more represented when the metabarcoding approach was used compared with CHEMTAX. This might be ascribed to the fact that (1) some dinoflagellates could not be counted by the CHEMTAX method due to a lack of Peridinin (Mackey et al., 1996) and (2) dinoflagellates contain larger genome sizes and higher 18S gene copy numbers than other phytoplankton assemblages, especially diatoms (Lin, 2011; Gong and Marchetti, 2019; Liu et al., 2022). Similarly, Wang et al. (2022) showed that metabarcoding overestimated the contribution of dinoflagellates to total phytoplankton compared with microscopic analyses. It was strange that prymnesiophytes were almost absent from the metabarcoding analyses, whereas they were abundant according to CHEMTAX (Figure 3A). Morphological analyses by SEM confirmed the existence of a large number of haptophyte (i.e., prymnesiophyte) cells in this area, as mentioned in previous studies (Taylor and Waters, 1982; Hattori et al., 2004; Komuro et al., 2005). The results of those studies revealed that Coccolithus pelagicus f. pelagicus and Emiliania huxleyi var. huxleyi were the most abundant taxa in the WSG and in the western subarctic Pacific. Our results and those from previous studies (Fujiki et al., 2009; Fujiki et al., 2014) showed that the content of Hex-Fuco (the marker pigment of prymnesiophytes) was the highest among all carotenoids. Furthermore, the results of rbcL gene analysis in the summer of 2020 showed that haptophytes were the most abundant phylum, accounting for approximately 30.80% of the total chromophytic phytoplankton in the same area (Jiang et al., 2022). In addition, prasinophytes accounted for 5% of phytoplankton by CHEMTAX, whereas those were not identified by metabarcoding. Similar to our results, prasinophytes made up an important component of phytoplankton biomass (7.5%−30.9%) by CHEMTAX in previous studies (Liu et al., 2004; Fujiki et al., 2009; Fujiki et al., 2014). Furthermore, the results of microscopic observations also showed that prasinophyte species, such as Micromonas pusilla, were abundant in the WSG (Taylor and Waters, 1982; Fujiki et al., 2009). Consequently, our results combined with those of previous studies (e.g., Taylor and Waters, 1982; Hattori et al., 2004; Liu et al., 2004; Komuro et al., 2005; Jiang et al., 2022) indicate that metabarcoding might underestimate the contribution of prymnesiophytes and prasinophytes to the total phytoplankton.
The comparison between metabarcoding and CHEMTAX was rarely reported; one study that performed this comparison was conducted by Gong et al. (2020), who revealed that 18S rRNA gene sequencing and CHEMTAX displayed similar compositions of phytoplankton communities in the Neuse River Estuary. The results of Gong et al. (2020) are strikingly different from those of this study, which might be ascribed to the difference in the phytoplankton communities between the two investigation areas. The eight phytoplankton assemblages derived from CHEMTAX accounted for 5%−25% of the total phytoplankton with no absolutely dominant groups in our results. Comparatively, the investigation area of Gong et al. (2020) was a eutrophic estuary, where chlorophytes (i.e., Trebouxiophyceae) were the dominant phytoplankton group based on CHEMTAX and 18S sequencing. The absolute dominance of Trebouxiophyceae could cause a good linear relationship between both methods, according to Gong et al. (2020). Nevertheless, a significant positive correlation of cryptophytes between the metabarcoding analyses and CHEMTAX was also observed in the present study (Figures 6A, B), and such correlation deserves further study.
In summary, some limitations and uncertainties of CHEMTAX and metabarcoding should be considered, because these could further help elucidate the discrepancy of the results from both methods. The factors affecting CHEMTAX calculation mainly included the following aspects. (1) The marker pigment/Chl a ratios of the local phytoplankton assemblages were largely unknown in the study area, which might greatly affect the results obtained, as the choice of the initial pigment ratio matrix is very important (Mackey et al., 1996). (2) It was not clear whether some dinoflagellate species contain Peridinin (the marker pigment of dinoflagellates) in this area. (3) Several algal assemblages contained the same marker pigments. For example, fucoxanthin can be produced by diatoms, prymnesiophytes, and pelagophytes (Fujiki et al., 2014). Nevertheless, the HPLC-pigment CHEMTAX method still has broad application prospects because of its high efficiency, low cost, and strong comparability between different research results. For metabarcoding, some limitations cannot be ignored. The real biomass of different phytoplankton species or assemblages cannot be effectively quantified based on the absolute sequence abundance (Pochon et al., 2015). Variation in DNA copy number among algal species can lead to differential amplification in PCR and result in sequence read abundances that do not match species abundances. For example, experiments that used mock communities showed that the relative abundance obtained using high-throughput DNA sequencing differed significantly from that counted by microscopic analyses even in the same phytoplankton genus, such as Skeletonema (Canesi and Rynearson, 2016). Although metabarcoding analyses may misjudge the composition of different phytoplankton assemblages, it is effective for identifying the algal species composition (especially small-sized, rare, and cryptic species) in the phytoplankton community, as discussed in the following sections. Furthermore, this study strongly suggested that microscopic counting of phytoplankton abundance should be included in the future study. As the classical and most common technique, light microscopy can quantify and qualify phytoplankton communities, involving identification, cells counting, and size measurement (Pan et al., 2020), which is significant to verify the accuracy of phytoplankton species identification by molecular methods (Gong et al., 2020; Wang et al., 2022). However, microscopic still has many deficiencies in many aspects. For example, large phytoplankton (> 10 μm) can be identified and counted easily by light microscopy, which omits some small-sized phytoplankton assemblages (e.g., pico-phytoplankton and fragile cells) and cause an overestimation of diatom and dinoflagellate proportions to total phytoplankton (Pan et al., 2020; Wang et al., 2022). Each method has its own shortcomings, which requires the combination of various methods as far as possible to analyze the composition characteristics of phytoplankton in more detail.
Dinoflagellates were the dominant phytoplankton assemblages in the study area, according to metabarcoding. Their abundance was comparable with those reported in temperate areas of the northwestern Pacific (Huang et al., 2020; Wu et al., 2020; Liu et al., 2022) and much lower than those in tropical regions, such as the South China Sea (Wang et al., 2022) and the Western Pacific seamount regions (Xu et al., 2021). By comparison, haptophytes were the minor component (0.53% of phytoplankton) in the WSG, but they occupied a relatively high proportion of phytoplankton in the South China Sea (Wang et al., 2022) and the temperate regions of the northwest Pacific controlled by the Kuroshio current (Wu et al., 2020). A high proportion of pelagophytes and cryptophytes was an important characteristic of the WSG when compared with previous studies (Huang et al., 2020; Wu et al., 2020; Xu et al., 2021). Environmental selection and dispersal limitation might be important factors that shape the phytoplankton communities in the subarctic area of this study, which was characterized by high macronutrients (i.e., N, P, and Si) and Fe deficiency (Suzuki et al., 2002; Harrison et al., 2004).
Our analyses identified 97 phytoplankton species, many of which were newly recorded in the WSG. For example, K. veneficum, H. rotundata, and A. anophagefferens were first reported and showed high contributions to total phytoplankton in this area. Those species were HAB-forming species. The other 13 HAB-forming species were rare but were also identified by metabarcoding analyses, which demonstrated the advantage of identifying HAB-forming species in the phytoplankton community.
Karlodinium is a mixotrophic dinoflagellate genus with several fish killing members. Mixotrophic characters make this genus grow relying on photosynthesis and/or by feeding on various tiny marine organisms, e.g., diatoms, dinoflagellates, and even zooplanktons (Place et al., 2012). This species is common in coastal sea areas but is easily overlooked or misidentified in microscopic analyses due to its small cell size (< 8−12 μm) and lack of obvious morphological characteristics (Huang et al., 2019; Huang et al., 2020). It is frequently present with relatively low cell abundance but can form intense blooms that are often associated with fish kills. Numerous mortality events of wild and cultured fish were found to be associated with K. veneficum blooms around the world (Huang et al., 2019; Karlson et al., 2021). The WSG and its adjacent waters are important fishing grounds for Pacific saury in the world. Consequently, more effort should be made to study the temporal and spatial distributions of the genus Karlodinium and its impact on marine animals in the WSG, which has shown a saury biomass decline in recent decades (Kulik et al., 2022).
H. rotundata is ubiquitously distributed in various marine environments and occasionally forms large blooms, e.g., in Manim Bay (Shahi et al., 2015), the Baltic Sea (Jaschinski et al., 2015), and Chesapeake Bay (Millette et al., 2015). It is nontoxic, although several Heterocapsa species, such as H. circularisquama, are toxic to marine animals (Sato et al., 2002). H. rotundata is mixotrophic and can ingest picoplankton, including bacteria (Millette et al., 2016); thus, it can outcompete other phytoplankton species in the WSG that suffer from Fe deficiency (Suzuki et al., 2002; Harrison et al., 2004).
Among the 16 HAB-forming species, Alexandrium minutum, Dinophysis acuminata, Pseudonitzschia brasiliana, and P. turgidula produce paralytic shellfish poisoning toxins (PSTs), diarrhetic shellfish poisoning toxins (DSTs), and domoic acid (DA), respectively (Lundholm et al., 2009; Lian et al., 2022). These toxins are known to accumulate in shellfish and fish and lead to human intoxication (Lian et al., 2022). The accurate identification of Pseudonitzschia species is difficult under light microscopy (Mochizuki et al., 2002; Jiang et al., 2017), but this can be resolved easily by metabarcoding (Wang et al., 2022). Three Pseudonitzschia species, including P. brasiliana, P. turgidula, and P. subcurvata, were identified in our results, among which the former two species can produce DA (Lundholm et al., 2009). The above toxic algal species show a wide distribution in the coastal waters of the world (Lundholm et al., 2009; Jiang et al., 2017; Wang et al., 2022) but are rarely observed in the WSG and subarctic Pacific in previous studies (e.g., Taylor and Waters, 1982; Mochizuki et al., 2002; Komuro et al., 2005). Although the four species make up a small proportion of the total phytoplankton, the rare taxa could also act as seeds for seasonal succession or sporadic blooms (Logares et al., 2014). For example, toxic A. tamarense blooms were found in the Chukchi Sea of the Arctic Ocean. Increased temperatures might be an important factor in promoting the cell growth and cyst germination of toxic algal taxa, such as Alexandrium (Natsuike et al., 2017). With the intensification of global climate change (e.g., global warming and ocean acidification), these toxic algal species deserve attention because of their potential role in inducing blooms in subarctic sea areas (Lian et al., 2022).
The investigation stations were divided into southern and northern regions along 44°N. Similarly, Favorite et al. (1976) defined that the Pacific Subarctic Gyres Province (PSAG) and the Transition Zone are divided by the temperature 4°C at 100 m depth. Combined with the temperature of 100m depth in 2021 (unpublished), this result is consistent with our classification. In the southern area, the physical and chemical parameters showed patchy distributions, suggesting the mixing process of the subarctic current and Kuroshio current. By comparison, environmental parameters presented a relatively uniform distribution in the northern area. Wu et al. (2020) showed that protistan composition fluctuated obviously among different sites in the mixed water region between the Kuroshio and Oyashio currents. Similarly, the phytoplankton composition of our results also varied among different stations and showed a significant difference between the southern and northern regions, suggesting that the mixing process of the Kuroshio and subarctic currents in the surface seawater played an important role in controlling the distribution of phytoplankton.
In this study, nutrients played an important role in shaping the distribution of phytoplankton assemblages, as shown by the Mantel test and RDA analyses (Figure 6C). Different algal species adapt to their optimal growth concentrations in the marine environment (Follows and Dutkiewicz, 2011; Pei et al., 2019). However, the relationship between phytoplankton assemblages, according to metabarcoding and CHEMTAX, and nutrients is different, mostly due to the discrepancy in phytoplankton composition by the two methods. Nevertheless, dinoflagellates determined by the two methods grouped together in the RDA analyses and showed a significantly negative correlation with nutrients (Figure 6C), which indicated that they could outcompete other algal assemblages in the southern region with low nutrient concentrations, presumably due to their mixotrophic characteristic. In contrast, pelagophytes, and cryptophytes, a significant correlation with nutrients was demonstrated by metabarcoding, whereas this trend was not observed by CHEMTAX. Although the two methods can analyze the composition characteristics of phytoplankton in detail, they easily lead to confusion in the analyses of the relationship between phytoplankton and environmental factors.
Numerous studies have shown that temperature and salinity have important impacts on community composition and diversity in the marine environment (Li et al., 2018; Wang et al., 2018; Wu et al., 2020). In this study, temperature and salinity were not significantly correlated with the phytoplankton assemblages, as analyzed by the Mantel test. Eddies at various scales (shown by the patchy distribution of temperature and salinity) in the transition domain caused by the mixing process of subarctic and subtropical waters lead to a heterogeneous phytoplankton distribution (Mochizuki et al., 2002), which might be the reason for the lack of a significant correlation between the two physical factors and phytoplankton. Notably, the two dominant species, H. rotundata and K. veneficum, showed significantly negative and positive correlations with temperature and salinity, respectively (P < 0.05; Figures 6A, B), indicating that they are in different ecological niches. Place et al. (2012) suggest that K. veneficum blooms are caused by eutrophic environments and/or co-occurrence of cryptophytes and K. veneficum, which were not observed in this study.
Some complex chemical and biological factors also influence the distribution of various phytoplankton assemblages, such as the input of Fe from atmospheric deposition in Fe-deficient areas (Boyd and Ellwood, 2010) and top-down control of zooplankton (Liu et al., 2022). Atmospheric deposition has been suggested as an important source of Fe to these regions (Boyd and Ellwood, 2010). Episode supplies of aeolian dust containing Fe from central Asia were possible reasons for the sporadic phytoplankton blooms in the WSG (Liu et al., 2004). The dust storms in central Asia in the spring of 2021 are the strongest in the past 10 years. For example, between 6 and 24 May (during the early stage of this investigation), three dust storms in Central Asia seriously affected the eastern coastal provinces of China, although no data are available in the sea (China Meteorological Administration, 2022). Tang et al. (2022) showed that the center of the spring dust storm reached the northwest Pacific at latitudes between 30° and 40°, which was south of our study area. The atmospheric deposition of nutrients, especially Fe, might be the main factor for the high phytoplankton biomass (i.e., Chl a) in the southern region of the study area (Figure S1). Moreover, most phytoplankton and zooplankton groups had more correlations than connections within phytoplankton groups (Figure 6D), suggesting that zooplankton assemblages had an important impact on the distribution of phytoplankton assemblages. Overall, the relationship between phytoplankton and environmental factors seems to be cloaked by the above uncertainties and the relatively small span of latitude and longitude in our study area. More research is needed to investigate the relationship among phytoplankton, zooplankton, and physical and chemical factors in such complex marine ecosystems.
The structure of phytoplankton communities determined by HPLC-pigment CHEMTAX and metabarcoding analyses displayed marked differences for some phytoplankton assemblages in the study area. Determining which method gives more accurate results is difficult, because each method has led to some uncertainties. Although CHEMTAX can only give the composition of phytoplankton groups, we strongly suggest that this method be applied widely in WSG to investigate the long-term succession of phytoplankton community structure, as it has been used for this purpose for several decades. By comparison, metabarcoding provides a more informative assessment of phytoplankton species and better elucidates their responses to environmental conditions than the CHEMTAX method. For example, some toxic and HAB-forming species that have not been reported in previous studies were identified in the WSG. This study highlights the benefits of the combination of CHEMTAX and metabarcoding analyses in determining the phytoplankton communities in a marine environment, especially in open seas such as the subarctic North Pacific.
The datasets presented in this study can be found in online repositories. The names of the repository/repositories and accession number(s) can be found in the article/Supplementary Material.
QX: Conceptualization, Methodology, Software, Writing – original draft. GW: Software, Writing, Data curation. XQ: Methodology, Software, Investigation, Writing – original draft. XD: Methodology, Resources, Writing – review & editing, Data curation. XW: Validation, Formal analysis, Visualiza- tion. QH: Software, Investigation, Writing – review & editing. CM: Methodology, Resources, Writing – review & editing, Data curation. YW: Methodology, Resources. JC: Methodology, Writing – review & editing. All authors contributed to the article and approved the submitted version.
This study was funded by the National Key Research and Development Program of China (2019YFD0901401), Natural Science Foundation of Shandong Province (ZR2021MD071).
The authors declare that the research was conducted in the absence of any commercial or financial relationships that could be construed as a potential conflict of interest.
All claims expressed in this article are solely those of the authors and do not necessarily represent those of their affiliated organizations, or those of the publisher, the editors and the reviewers. Any product that may be evaluated in this article, or claim that may be made by its manufacturer, is not guaranteed or endorsed by the publisher.
The Supplementary Material for this article can be found online at: https://www.frontiersin.org/articles/10.3389/fmars.2023.1116050/full#supplementary-material
Bik H. M., Porazinska D. L., Creer S., Caporaso J. G., Knight R., Thomas W. K. (2012). Sequencing our way towards understanding global eukaryotic biodiversity. Trends Ecol. Evol. 27, 233–243. doi: 10.1016/j.tree.2011.11.010
Boyd P., Ellwood M. (2010). The biogeochemical cycle of iron in the ocean. Nat. Geosci. 3, 675–682. doi: 10.1038/ngeo964
Canesi K., Rynearson T. (2016). Temporal variation of skeletonema community composition from a long-term time series in Narragansett bay identified using high-throughput sequencing. Mar. Ecol. Prog. Ser. 556, 1–16. doi: 10.3354/meps11843
Chen S., Zhou Y., Chen Y., Gu J. (2018). Fastp: an ultra-fast all-in-one FASTQ preprocessor. Bioinformatics 34, i884–i890. doi: 10.1093/bioinformatics/bty560
China Meteorological Administration. (2022). China Meteorological Administration China Climate Bulletin in 2021. Meteorological Press, Beijing.
Edgar R. C. (2013). UPARSE: highly accurate OTU sequences from microbial amplicon reads. Nat. Methods 10, 996–998. doi: 10.1038/nmeth.2604
Favorite F., Dodimead A., Nasu K. (1976). Oceanography of the subarctic pacific region 1960–1971. Bull. Int. North Pac. Fish. Comm. 33, 1–187.
Follows M., Dutkiewicz S. (2011). Modeling diverse communities of marine microbes. Annu. Rev. Mar. Sci. 3, 427–451. doi: 10.1146/annurev-marine-120709-142848
Fujiki T., Matsumoto K., Honda M. C., Kawakami H., Watanabe S. (2009). Phytoplankton composition in the subarctic north pacific during autumn 2005. J. Plankton Res. 31, 179–191. doi: 10.1093/plankt/fbn108
Fujiki T., Matsumoto K., Mino Y., Sasaoka K., Wakita M., Kawakami H., et al. (2014). Seasonal cycle of phytoplankton community structure and photophysiological state in the western subarctic gyre of the north pacific. Limnol. Oceanogr. 59, 887–900. doi: 10.4319/lo.2014.59.3.0887
Gong W., Hall N., Paerl H., Marchetti A. (2020). Phytoplankton composition in a eutrophic estuary: Comparison of multiple taxonomic approaches and influence of environmental factors. Environ. Microbiol. 22, 4718–4731. doi: 10.1111/1462-2920.15221
Gong W., Marchetti A. (2019). Estimation of 18S gene copy number in marine eukaryotic plankton using a next-generation sequencing approach. Front. Mar. Sci. 6. doi: 10.3389/fmars.2019.00219
Gu Z., Gu L., Eils R., Schlesner M., Brors B. (2014). Circlize implements and enhances circular visualization in r. Bioinformatics 30, 2811–2812. doi: 10.1093/bioinformatics/btu393
Harrison P., Whitney F., Tsuda A., Saito H., Tadokoro K. (2004). Nutrient and plankton dynamics in the NE and NW gyres of the subarctic pacific ocean. J. Oceanogr. 60, 93–117. doi: 10.1023/B:JOCE.0000038321.57391.2a
Hattori H., Koike M., Tachikawa K., Saito H., Nagasawa K. (2004). Spatial variability of living coccolithophore distribution in the Western subarctic pacific and Western Bering Sea. J. Oceanogr. 60, 505–515. doi: 10.1023/B:JOCE.0000038063.81738.ab
Huang B., Liang Y., Pan H., Xie L., Jiang T., Jiang T. (2020). Hemolytic and cytotoxic activity from cultures of aureococcus anophagefferens–a causative species of brown tides in the north-western bohai Sea, China. Chemosphere 247, 125819. doi: 10.1016/j.chemosphere.2020.125819
Huang H.-L., Shao Q.-W., Zhu X.-J., Luo J., Meng R., Zhou C.-X., et al. (2019). Distribution of karlodinium veneficum in the coastal region of xiangshan bay in the East China Sea, as detected by a real-time quantitative PCR assay of ribosomal ITS sequence. Harmful Algae 81, 65–76. doi: 10.1016/j.hal.2018.12.001
Imai K., Nojiri Y., Tsurushima N., Saino T. (2002). Time series of seasonal variation of primary productivity at station KNOT (44°N, 155°E) in the sub-arctic western north pacific. Deep Sea Res. Part II: Topic. Stud. Oceanogr. 49, 5395–5408. doi: 10.1016/S0967-0645(02)00198-4
Jaschinski S., Flöder S., Petenati T., Göbel J. (2015). Effects of nitrogen concentration on the taxonomic and functional structure of phytoplankton communities in the Western Baltic Sea and implications for the European water framework directive. Hydrobiologia 745, 201–210. doi: 10.1007/s10750-014-2109-9
Jiang T., Liu L., Li Y., Zhang J., Tan Z., Wu H., et al. (2017). Occurrence of marine algal toxins in oyster and phytoplankton samples in daya bay, south China Sea. Chemosphere 183, 80–88. doi: 10.1016/j.chemosphere.2017.05.067
Jiang T., Qin X., Wu G., Zhao H., Yu X., Xiao X., et al. (2022) Distribution of chromophytic phytoplankton in the Western subarctic gyre of pacific ocean revealed by morphological observation and rbcL gene sequences. J. Oceanol. Limnol. doi: 10.1007/s00343-022-2197-8
Karlson B., Andersen P., Arneborg L., Cembella A., Eikrem W., John U., et al. (2021). Harmful algal blooms and their effects in coastal seas of northern Europe. Harmful Algae 102, 101989. doi: 10.1016/j.hal.2021.101989
Komuro C., Narita H., Imai K., Nojiri Y., Jordan R. W. (2005). Microplankton assemblages at station KNOT in the subarctic western pacific 1999–2000. Deep Sea Res. Part II: Topic. Stud. Oceanogr. 52, 2206–2217. doi: 10.1016/j.dsr2.2005.08.006
Kulik V. V., Prants S. V., Uleysky M., Uleysky M. Y., Budyansky M. V. (2022). Lagrangian Characteristics in the western north pacific help to explain variability in pacific saury fishery. Fish. Res. 252, 106361. doi: 10.1016/j.fishres.2022.106361
Kwak J. H., Lee S. H., Hwang J., Suh Y.-S., Je Park H., Chang K.-I., et al. (2014). Summer primary productivity and phytoplankton community composition driven by different hydrographic structures in the East/Japan Sea and the Western subarctic pacific. J. Geophys. Res.: Oceans 119, 4505–4519. doi: 10.1002/2014JC009874
Lear G., Dickie I., Banks J. C., Boyer S., Buckley H. L., Buckley T. R., et al. (2018) Methods for the extraction, storage, amplification and sequencing of DNA from environmental samples. New Z. J. Ecol. 42, 10–50A. doi: 10.20417/nzjecol.42.9
Lian Z., Li F., He X., Chen J., Yu R.-C. (2022). Rising CO2 will increase toxicity of marine dinoflagellate alexandrium minutum. J. Hazard. Mater. 431, 128627. doi: 10.1016/j.jhazmat.2022.128627
Li Y.-Y., Chen X.-H., Xie Z.-X., Li D.-X., Wu P.-F., Kong L.-F., et al. (2018). Bacterial diversity and nitrogen utilization strategies in the upper layer of the northwestern pacific ocean. Front. Microbiol. 9. doi: 10.3389/fmicb.2018.00797
Li C., Liu J., Chen X., Ren H., Su B., Ma K., et al. (2022). Determinism governs the succession of disturbed bacterioplankton communities in a coastal maricultural ecosystem. Sci. Total Environ. 828, 154457. doi: 10.1016/j.scitotenv.2022.154457
Lin S. (2011). Genomic understanding of dinoflagellates. Res. Microbiol. 162, 551–569. doi: 10.1016/j.resmic.2011.04.006
Liu S., Cui Z., Zhao Y., Chen N. (2022). Composition and spatial-temporal dynamics of phytoplankton community shaped by environmental selection and interactions in the jiaozhou bay. Water Res. 218, 118488. doi: 10.1016/j.watres.2022.118488
Liu H., Suzuki K., Saito H. (2004). Community structure and dynamics of phytoplankton in the Western subarctic pacific ocean: A synthesis. J. Oceanogr. 60, 119–137. doi: 10.1023/B:JOCE.0000038322.79644.36
Logares R., Audic S., Bass D., Bittner L., Boutte C., Christen R., et al. (2014). Patterns of rare and abundant marine microbial eukaryotes. Curr. Biol. 24, 813–821. doi: 10.1016/j.cub.2014.02.050
Lundholm N., Churro C., Fraga S., Hoppenrath M., Iwataki M., Larsen J., et al. (2009) IOC-UNESCO taxonomic reference list of harmful micro algae. Available at: https://www.marinespecies.org/hab.
Mackey M., Mackey D., Higgins H., Wright S. (1996). CHEMTAX - a program for estimating class abundances from chemical markers: Application to HPLC measurements of phytoplankton. Mar. Ecol. - Prog. Ser. 144, 265–283. doi: 10.3354/meps144265
Magoč T., Salzberg S. L. (2011). FLASH: fast length adjustment of short reads to improve genome assemblies. Bioinformatics 27, 2957–2963. doi: 10.1093/bioinformatics/btr507
Millette N. C., Pierson J. J., Aceves A., Stoecker D. K. (2016). Mixotrophy in heterocapsa rotundata: A mechanism for dominating the winter phytoplankton: Mixotrophy in heterocapsa rotundata. Limnol. Oceanogr. 62, 836–845. doi: 10.1002/lno.10470
Millette N., Stoecker D., Pierson J. (2015). Top-down control of micro- and mesozooplankton on winter dinoflagellate blooms of heterocapsa rotundata. Aquat. Microb. Ecol. 76, 15–25. doi: 10.3354/ame01763
Mochizuki M., Shiga N., Saito M., Imai K., Nojiri Y. (2002). Seasonal changes in nutrients, chlorophyll a and the phytoplankton assemblage of the western subarctic gyre in the pacific ocean. Deep Sea Res. Part II: Topic. Stud. Oceanogr. 49, 5421–5439. doi: 10.1016/S0967-0645(02)00209-6
Natsuike M., Matsuno K., Hirawake T., Yamaguchi A., Nishino S., Imai I. (2017). Possible spreading of toxic alexandrium tamarense blooms on the chukchi Sea shelf with the inflow of pacific summer water due to climatic warming. Harmful Algae 61, 80–86. doi: 10.1016/j.hal.2016.11.019
Obayashi Y., Tanoue E., Suzuki K., Handa N., Nojiri Y., Wong C. (2001). Spatial and temporal variabilities of phytoplankton community structure in the northern north pacific as determined by phytoplankton pigments. Deep-sea Res. Part I-oceanogr. Res. Pap. - DEEP-SEA Res. PT. I-OCEANOG. Res. 48, 439–469. doi: 10.1016/S0967-0637(00)00036-4
Paerl H. W., Crosswell J. R., Van Dam B., Hall N. S., Rossignol K. L., Osburn C. L., et al. (2018). Two decades of tropical cyclone impacts on north carolina’s estuarine carbon, nutrient and phytoplankton dynamics: implications for biogeochemical cycling and water quality in a stormier world. Biogeochemistry 141, 307–332. doi: 10.1007/s10533-018-0438-x
Pan H., Li A., Cui Z., Ding D., Qu K., Zheng Y., et al. (2020). A comparative study of phytoplankton community structure and biomass determined by HPLC-CHEMTAX and microscopic methods during summer and autumn in the central bohai Sea, China. Mar. pollut. Bull. 155, 111172. doi: 10.1016/j.marpolbul.2020.111172
Pei S., Laws E. A., Zhu Y., Zhang H., Ye S., Yuan H., et al. (2019). Nutrient dynamics and their interaction with phytoplankton growth during autumn in liaodong bay, China. Continent. Shelf Res. 186, 34–47. doi: 10.1016/j.csr.2019.07.012
Place A. R., Bowers H. A., Bachvaroff T. R., Adolf J. E., Deeds J. R., Sheng J. (2012). Karlodinium veneficum–the little dinoflagellate with a big bite. Harmful Algae 14, 179–195. doi: 10.1016/j.hal.2011.10.021
Pochon X., Wood S. A., Keeley N. B., Lejzerowicz F., Esling P., Drew J., et al. (2015). Accurate assessment of the impact of salmon farming on benthic sediment enrichment using foraminiferal metabarcoding. Mar. pollut. Bull. 100, 370–382. doi: 10.1016/j.marpolbul.2015.08.022
Sato Y., Oda T., Muramatsu T., Matsuyama Y., Honjo T. (2002). Photosensitizing hemolytic toxin in heterocapsa circularisquama, a newly identified harmful red tide dinoflagellate. Aquat. Toxicol. (Amsterdam Netherlands) 56, 191–196. doi: 10.1016/S0166-445X(01)00191-6
Shahi N., Godhe A., Mallik S., Aloisi K., Nayak B. (2015). The relationship between variation of phytoplankton species composition and physico-chemical parameters in northern coastal waters of Mumbai, India. Indian Journal of Geo-Marine Sciences 44, 673–684.
Stoeck T., Bass D., Nebel M., Christen R., Jones M. D. M., Breiner H.-W., et al. (2010). Multiple marker parallel tag environmental DNA sequencing reveals a highly complex eukaryotic community in marine anoxic water. Mol. Ecol. 19, 21–31. doi: 10.1111/j.1365-294X.2009.04480.x
Strickland J. D. H., Parsons T. R.. (1972). A practical handbook of seawater analysis. Bulletin. doi: 10.1086/406210
Sunagawa S., Coelho L. P., Chaffron S., Kultima J. R., Labadie K., Salazar G., et al. (2015). Structure and function of the global ocean microbiome. Science 348, 1261359. doi: 10.1126/science.1261359
Suzuki K., Minami C., Liu H., Saino T. (2002). Temporal and spatial patterns of chemotaxonomic algal pigments in the subarctic pacific and the Bering Sea during the early summer of 1999. Deep Sea Res. Part II: Topic. Stud. Oceanogr. 49, 5685–5704. doi: 10.1016/S0967-0645(02)00218-7
Tang W., Dai T., Cheng Y., Wang S., Liu Y. (2022). A study of a severe spring dust event in 2021 over East Asia with WRF-chem and multiple platforms of observations. Remote Sens. 14, 3795. doi: 10.3390/rs14153795
Taylor F. J. R., Waters R. E. (1982). Spring phytoplankton in the subarctic north pacific ocean. Mar. Biol. 67, 323–335. doi: 10.1007/BF00397673
Villar E., Farrant G. K., Follows M., Garczarek L., Speich S., Audic S., et al. (2015). Environmental characteristics of agulhas rings affect interocean plankton transport. Science 348, 1261447. doi: 10.1126/science.1261447
Waga H., Fujiwara A., Hirawake T., Suzuki K., Yoshida K., Abe H., et al. (2022). Primary productivity and phytoplankton community structure in surface waters of the western subarctic pacific and the Bering Sea during summer with reference to bloom stages. Prog. Oceanogr. 201, 102738. doi: 10.1016/j.pocean.2021.102738
Wang Q., Garrity G. M., Tiedje J. M., Cole J. R. (2007). Naive Bayesian classifier for rapid assignment of rRNA sequences into the new bacterial taxonomy. Appl. Environ. Microbiol. 73, 5261–5267. doi: 10.1128/AEM.00062-07
Wang Z., Liu L., Tang Y., Li A., Liu C., Xie C., et al. (2022). Phytoplankton community and HAB species in the south China Sea detected by morphological and metabarcoding approaches. Harmful Algae 118, 102297. doi: 10.1016/j.hal.2022.102297
Wang F., Xie Y., Wu W., Sun P., Wang L., Huang B. (2018). Picoeukaryotic diversity and activity in the northwestern pacific ocean based on rDNA and rRNA high-throughput sequencing. Front. Microbiol. 9. doi: 10.3389/fmicb.2018.03259
Wickham H. (2016). ggplot2: Elegant graphics for data analysis (New York: Springer-Verlag). Available at: https://ggplot2.tidyverse.org.
Wright S. W., Ishikawa A., Marchant H. J., Davidson A. T., van den Enden R. L., Nash G. V. (2009). Composition and significance of picophytoplankton in Antarctic waters. Polar Biol. 32, 797–808. doi: 10.1007/s00300-009-0582-9
Wu P.-F., Li D.-X., Kong L.-F., Li Y.-Y., Zhang H., Xie Z.-X., et al. (2020). The diversity and biogeography of microeukaryotes in the euphotic zone of the northwestern pacific ocean. Sci. Total Environ. 698, 134289. doi: 10.1016/j.scitotenv.2019.134289
Xu Q., Wang C., Xu K., Chen N. (2021). Metabarcoding analysis of harmful algal bloom species in the Western pacific seamount regions. Int. J. Environ. Res. Public Health 18, 11470. doi: 10.3390/ijerph182111470
Zapata M., Jeffrey S., Wright S., Rodríguez F., Garrido J., Clementson L. (2004). Photosynthetic pigments in 37 species (65 strains) of haptophyta. Mar. Ecol.-Prog. Ser. 270, 83–102. doi: 10.3354/meps270083
Keywords: metabarcoding analysis, pigments, phytoplankton, Western Subarctic Gyre metabarcoding analysis, Western Subarctic Gyre
Citation: Xin Q, Qin X, Wu G, Ding X, Wang X, Hu Q, Mu C, Wei Y, Chen J and Jiang T (2023) Phytoplankton community structure in the Western Subarctic Gyre of the Pacific Ocean during summer determined by a combined approach of HPLC-pigment CHEMTAX and metabarcoding sequencing. Front. Mar. Sci. 10:1116050. doi: 10.3389/fmars.2023.1116050
Received: 05 December 2022; Accepted: 09 January 2023;
Published: 26 January 2023.
Edited by:
Zhangxi Hu, Guangdong Ocean University, ChinaReviewed by:
Yang Li, South China Normal University, ChinaCopyright © 2023 Xin, Qin, Wu, Ding, Wang, Hu, Mu, Wei, Chen and Jiang. This is an open-access article distributed under the terms of the Creative Commons Attribution License (CC BY). The use, distribution or reproduction in other forums is permitted, provided the original author(s) and the copyright owner(s) are credited and that the original publication in this journal is cited, in accordance with accepted academic practice. No use, distribution or reproduction is permitted which does not comply with these terms.
*Correspondence: Jufa Chen, Y2hlbmpmQHlzZnJpLmFjLmNu; Tao Jiang, amlhbmd0YW9qbnVAMTYzLmNvbQ==
†These authors have contributed equally to this work and share first authorship
Disclaimer: All claims expressed in this article are solely those of the authors and do not necessarily represent those of their affiliated organizations, or those of the publisher, the editors and the reviewers. Any product that may be evaluated in this article or claim that may be made by its manufacturer is not guaranteed or endorsed by the publisher.
Research integrity at Frontiers
Learn more about the work of our research integrity team to safeguard the quality of each article we publish.