 Wen Wu
 Jinming Hu
 Dehai Song
- 1College of Oceanic and Atmospheric Sciences, Ocean University of China, Qingdao, China
- 2Institute of Marine Development, Ocean University of China, Qingdao, China
- 3Frontier Science Center for Deep Ocean Multispheres and Earth System (FDOMES) and Physical Oceanography Laboratory, Ocean University of China, Qingdao, China
- 4Laoshan Laboratory, Qingdao, China
Introduction: Major bays worldwide have been disturbed by human pressures to varying degrees in recent years, resulting in many ecological and environmental issues. Maintaining the health of the bay ecosystem has national and international significances, as it enhances the environmental regulation function and resource development value of the region. This study aims to examine the evolution trend and regulatory mechanism of ecosystem health in Laizhou Bay (LZB), China.
Methods: A comprehensive DPSIR-based indicator framework is established, comprising 40 representative indicators of the natural environment status, ecological service function, and social values of the LZB ecosystem. The subjective and objective integrated weighting method is applied to determine the indicator weight. The Ecosystem Health Index is then calculated to assess the LZB ecosystem health from 1980 to 2019 and key influencing factors are identified through the scenario analysis.
Results: The results show that the health status of the LZB ecosystem has fluctuated and then increased overall over the past 40 years, with a fairly healthy state in the 1980s, an unhealthy state in 2005, and then a rebound to a subhealthy state. The key factors affecting the LZB ecosystem health are mostly pressure items, with land-based pollution, particularly agricultural non-point source pollution, having a more significant impact than reclamations.
Discussion: Reasonable recommendations are finally put forward on improving the ecosystem health in the study area, including refining the legislation and integrated mechanism related to regional management, building a coordinated land-sea governance system and exploring new technologies for integrated marine management. This study fills the knowledge gap of ecosystem health assessment for the entire LZB in such a long-time scale, and the research outcomes are expected to provide scientific references and guidance for decision-making and social-economic sustainable development in LZB and other bays.
1 Introduction
Bays are a vital resource for human survival and a crucial support for the sustainable development of marine economy and society. In recent years, with the increased utilization of resources and the rapid growth of marine economy, the major bays in the world have been subject to various human pressures (Lyu et al., 2022; Yu et al., 2022). This leads to the saturation of environmental carrying capacity and a serious decline in the health of the bay ecosystem. Now it has been widely recognized that maintaining the health of the bay ecosystem is conducive to enhancing the environmental regulation function and resource development value of the region (Borja et al., 2016; Padua et al., 2023).
Marine ecosystems are composed of abundant biological communities in seawater and marine environment, with functions of energy flow, material circulation and information transmission. As the largest ecosystem in the biosphere, they play an important role in regulating the global climate and maintaining the water cycle and carbon cycle in the biosphere (Editorial Committee of Biological Volume in General Editorial Committee of China Agricultural Encyclopedia, 1991). The term “marine ecosystem health” was initiated in 1990s by Leppard and Munawar (1992). A healthy marine ecosystem is considered to be “a living organism” with sustainable productivity and metabolic vitality, internal structure maintenance ability, self-control and maintenance, threat-response and resilience capability, etc. (Epstein, 1999; First Institute of Oceanography, State Oceanic Administration, 2007; Shi et al., 2010). In addition to these characteristics, the marine ecosystem’s function of providing sustainable services for human society is also emphasized (Wiegand et al., 2010; Costanza, 2012; Halpern et al., 2012; Borja et al., 2016). Human activities have a profound impact on the health of the marine ecosystem, which can produce direct or cumulative effects and lead to the deterioration of the marine ecosystem (Epstein et al., 1994; Rombouts et al., 2013; Lyu et al., 2022; Yu et al., 2022).
Various methods have been applied to assess the marine ecosystem health, such as the Ocean Health Index (OHI), the bio-evaluation method, the indicator framework method and others. For example, based on 10 representative indicators and the utilization of assessment area, OHI has been used to effectively quantify the degree of variation in marine ecosystem health (Halpern et al., 2012). It provides a new idea and method for China’s research and management practice in this field (e.g., Xu, 2012; Zheng and You, 2013; Wu and Chen, 2019). The core aspect of bio-evaluation method is to select specific species that can reflect the ecosystem health within a certain range. The health of the ecosystem in the study area can be determined through the physiological state of the selected species directly or by calculating relevant biological indices or mapping based on it indirectly (Quan and Zhu, 2011). The bio-evaluation methods mainly include the indicator species method (e.g., Kennedy and Jacoby, 1999; Wells et al., 2004; Mallory et al., 2006; Vassallo et al., 2006; Whitfield and Harrison, 2008; Zhao et al., 2015; Aguirre-Rubí et al., 2018), the biological index method (e.g. Borja et al., 2003; Cai, 2003; Sun, 2013; Baek et al., 2014; Zhao et al., 2015; Zhang and Zhao, 2018), the graphic analysis method (e.g., Gray, 1981; Warwick, 1986; Zhang, 2005; Tang et al., 2006), etc.
The indicator framework method is based on the selection of appropriate evaluation indicators, the clarification of indicator weights, and the determination of appropriate evaluation criteria (Quan and Zhu, 2011). The indicator framework can systematically illustrate the evolution process of the ecosystem as well as fully reflect its complexity of structure and function, which is helpful for assessing the health status of the regional ecosystem in a comprehensive matter. The Pressure-State-Response (PSR) model, jointly developed by the Organization for Economic Co-operation and Development (OECD) and the United Nations Environment Programme (UNEP), is one of the most widely used conceptual framework and report tools (OECD, 1993; Hammond, 1995; UNEP, 2006). The PSR model answers the following three questions: what happened, why it happened and how humans should respond. Pressure indicators (P) describe human activities that can affect the marine ecosystem, representing the pressures caused by human activities on the environment. State indicators (S) reflect the ecosystem’s response on human activities, representing the status of environmental qualities and natural resources. Response indicators (R) refer to social actions to environmental and ecological problems (OECD, 1993; OECD, 2003; UNEP, 2006).
The PSR model has been modified to form the Driver-Pressure-State-Impact-Response (DPSIR) model (see Section 3.2) by the UNEP and the European Environment Agency (EEA) (EEA, 2005; Ramos et al., 2007), which has been applied to the studies of evaluating the sustainable development of marine economy, marine ecological security, sustainable utilization of resources and marine ecosystem health, etc. (e.g., Xu and Ma, 2017; Chen and Chen, 2021; Ma and Sun, 2021). The PSR/DPSIR models provide the basis for many other frameworks and pathways for the indicator development and are used worldwide (Wu et al., 2017). Furthermore, the PSR model considers both ecological and social connotations of marine ecosystems; while the DPSIR model formulates the coupling relationship between human activities and ecosystems in a more intuitive and effective way. Thus, in this study, the DPSIR model is accepted as the fundamental direction for the indicator establishment and ecosystem health assessment.
Laizhou Bay (LZB) is one of the three major bays in the Bohai Sea and the largest bay in Shandong Province, China (Wang et al., 2021). Since the 1980s, the rapid development of marine economy in LZB has been driven by its geographical location advantages, resources and environment endowment (Li et al., 2014). Now LZB has become a high-quality development strategic location for Shandong Province to promote the construction of a strong marine province. However, due to its dense population distribution and diverse human activities, there are many environmental and ecological problems, and the ecosystem health of this region is not optimistic. Therefore, it is of great importance to identify the evolution trend of its ecological environment and the key factors that affect the health of the LZB ecosystem.
So far, a few studies have been conducted on the ecosystem health assessment of LZB and its internal waters and adjacent sea areas, as summarized in Table 1. It can be seen that the study periods of existing studies are relatively short, which could not sufficiently illustrate the dynamic changes of LZB ecosystem health. In addition, the majority of current studies have adopted the Analytic Hierarchy Process (AHP) as the weighting method which is relatively subjective and have ignored the use of objective methods such as the Entropy method. Few studies have considered the impact of human activities on the ecosystem and the social values of marine ecosystem. Currently, there is a lack of long-time-scale research on the assessment of ecosystem health covering both the watershed and sea area of LZB. Therefore, this paper aims to fill this knowledge gap by investigating the ecosystem health assessment and environmental management strategies of LZB.
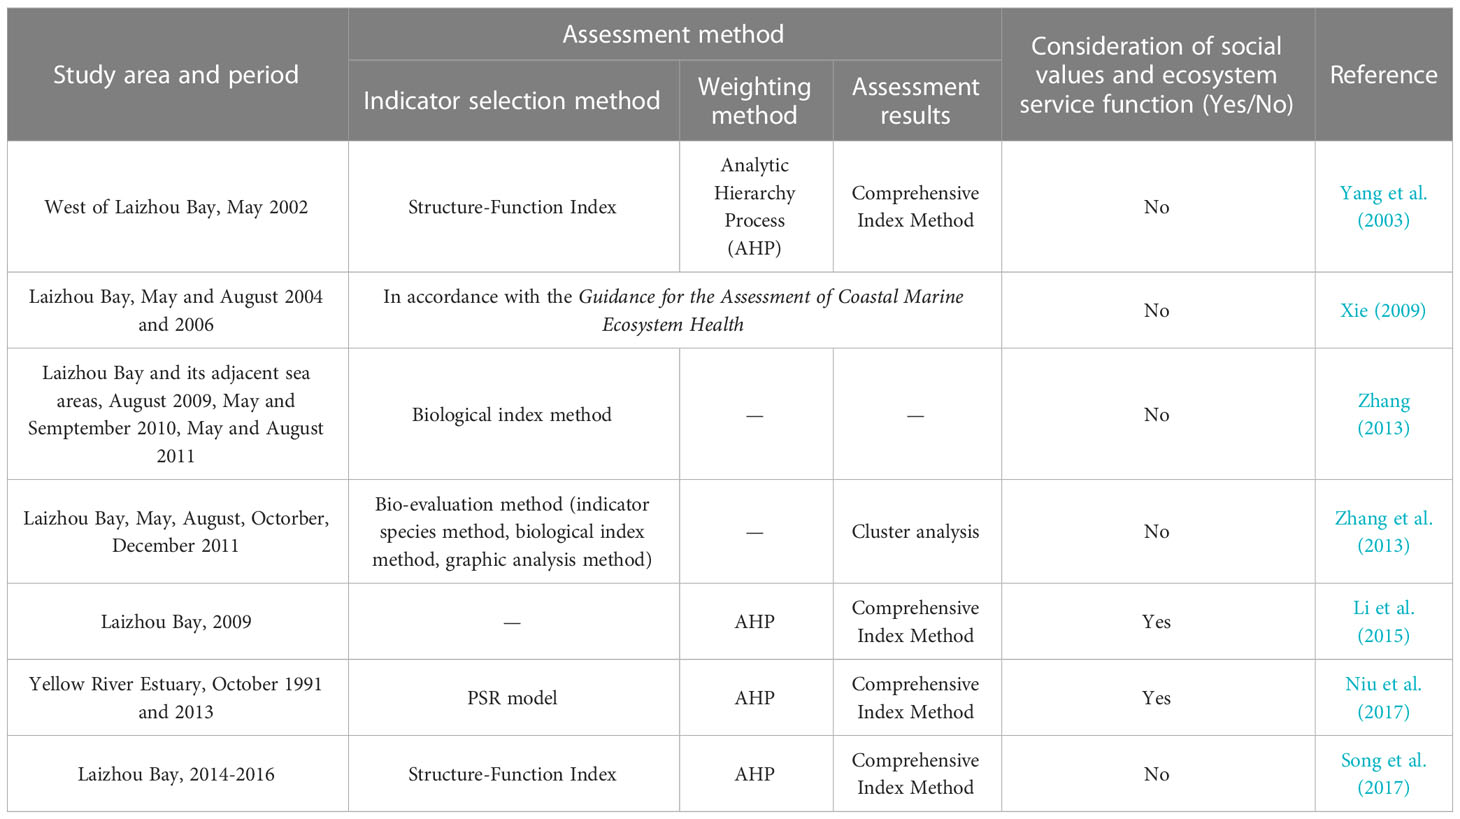
Table 1 Summary of existing studies on ecosystem health assessment in Laizhou Bay.
This paper is arranged as follows: in Section 2, the study area will be briefly introduced and main anthropogenic pressures and their impacts on LZB will be analyzed; a comprehensive and supportive indicator framework incorporating natural environment, ecological service function and social values will be presented in Section 3; a weighting procedure combining subjective and objective methods will be conducted to determine the index weight, and data and assessment method will also be described in this section; Section 4 will provide results and discussion on the LZB ecosystem health assessment through the calculation of Ecosystem Health Index (EHI); key factors of anthropogenic influence will be identified and the impacts of single and composite factors on the LZB ecosystem health be explored through the scenario analysis subsequently; countermeasures and suggestions on how to improve the LZB ecosystem health will be given in Section 5; and Section 6 offers conclusions of this study.
2 Study area
The study area consists of both sea and land areas, as shown in Figure 1. The sea study area covers the entire LZB (36°25′~37°45′N, 118°17′~120°45′E), including the Yellow River estuary in the west of the bay, which is a typical semi-enclosed bay with a coast length of 319.06 km and bay area of 6966.93 km2 (Li et al., 2007; Zhao et al., 2016). The basin of rivers discharged into LZB covers a total of 51 counties (districts and county-level cities) belonging to 14 prefecture-level cities in Shandong Province, which are taken as the land study area.

Figure 1 The map of the study area.
The water-depth in LZB is less than 10 m on average, with a maximum of about 18 m. The bay is dominated by semidiurnal tides, with an average tidal range is 0.92~1.43 m. There are over 10 rivers discharged into the bay such as the Yellow River, the Xiaoqing River, the Weihe River and so on. The Xiaoqing River, with a length of 240 km, is the second longest river (secondary to the Yellow River) draining into LZB. Since the 1970s, the industrialization progress along the Xiaoqing River has altered the river functions from flood, irrigation and shipping to sewage discharge. The annual runoff of Xiaoqing River is much smaller than that of the Yellow River; however, it carries a large amount of pollutants (e.g., nutrients, organic pollutants, and heavy metals) into the sea. That is one of the main reasons for the substantial degeneration of water quality in LZB (Ma et al., 2004; Shandong Academy for Environmental Planning, 2018).
According to the statistics, in 2019, the population and gross domestic product (GDP) in the study area accounted for 35.9% and 34.4% of Shandong Province respectively. The population growth and economic development already generated severe ecological and environmental issues in LZB, including pollution, eutrophication, habitat destruction, decline of marine ecological services and potential marine hazard risk, which lead to increased pressures on the health of the bay ecosystem. This would in turn impose rigid constraints on the sustainable development of economy, society, resources and environment in coastal zones surrounding LZB.
3 Data and methods
3.1 Data sources
Due to the instability of Shandong Province’s administrative divisions and the difficulty of collecting statistical material prior to China’s Opening Policy in the late 1970s, as well as the human pressures on LZB since 1990, this paper chooses 1980~2019 as the research scale. Nine years (i.e., 1980, 1985, 1990, 1995, 2000, 2005, 2010, 2015 and 2019) are selected for analysis with a time interval of five years, except for the last interval which is four years due to the impact of COVID-19 on statistical work.
Relevant data and information are all obtained from secondary data sources, including bulletins (e.g., China River Sediment Bulletin, Bulletin of China Marine Ecological Environment Status, Bulletin of China Offshore Environmental Quality, Bulletin of China Marine Disaster, Bulletin of Ecological Environment Status of Shandong Province, Bulletin of Marine Environmental Quality of Shandong Province, Bulletin of Marine Environment Status of North China Sea Region, Bulletin of Marine Disaster of North China Sea Region), yearbooks (e.g., China Statistical Yearbook On Environment, China Country Statistical Yearbook, Shandong Statistical Yearbook, statistical yearbooks of related cities), monitoring stations, literatures (e.g., Gao and Zhang, 1996; Wang, 2000; Zhao and Kong, 2000; Ma et al., 2002; Hao et al., 2005; Jiang et al., 2005; Li et al., 2006; Zhang et al., 2006; Zhao et al., 2010; Lin et al., 2013; Ma et al., 2015; Zhou et al., 2015; Jiang et al., 2018; Song et al., 2018; Wei et al., 2018; Xin et al., 2019; Huang et al., 2021), monographs (e.g., Shandong Association for Science and Technology, 1991; Tian et al., 1996; Zhang et al., 2003; He et al., 2009; Liu et al., 2010; Xu et al., 2013; Project Team of “Research on Monitoring and Controlling Technology of Economic Activities Around Bohai Sea Based on Environmental Carrying Capacity”, 2016; Yu et al., 2016; Zhang and Hu, 2019; Ye et al., 2021), dissertations (e.g., Zhang, 2013; Yang, 2018), reports (e.g., Technical Report on the Study of Spatial and Temporal Distribution Characteristics and Variation Trend of Pollution in Shandong Coastal Sea Areas), official websites (e.g., Ministry of Natural Resources of the People’s Republic of China, Ministry of Ecology and Environment of the People’s Republic of China, Tidal Table on the China Maritime Service webpage; Department of Ecology and Environment of Shandong Province) and other kinds of statistical data (e.g., Shandong Cencus Data 1990). The analogy and interpolation methods are used to supplement the data missing at the initial and middle time periods for each indicator, respectively.
3.2 Establishment of the indicator framework
In order to explore the internal logic of land-sea coupling in LZB, a DPSIR conceptual model is adopted for the establishment of the indicator framework, taking into account previous research outcomes related to the assessment of marine ecosystem health and specific features of the study area. Figure 2 illustrates the closed feedback loop structure of the DPSIR model, which provides a clear logic and comprehensive explanations of the internal causal relationship between socio-economic development and ecosystem evolution.
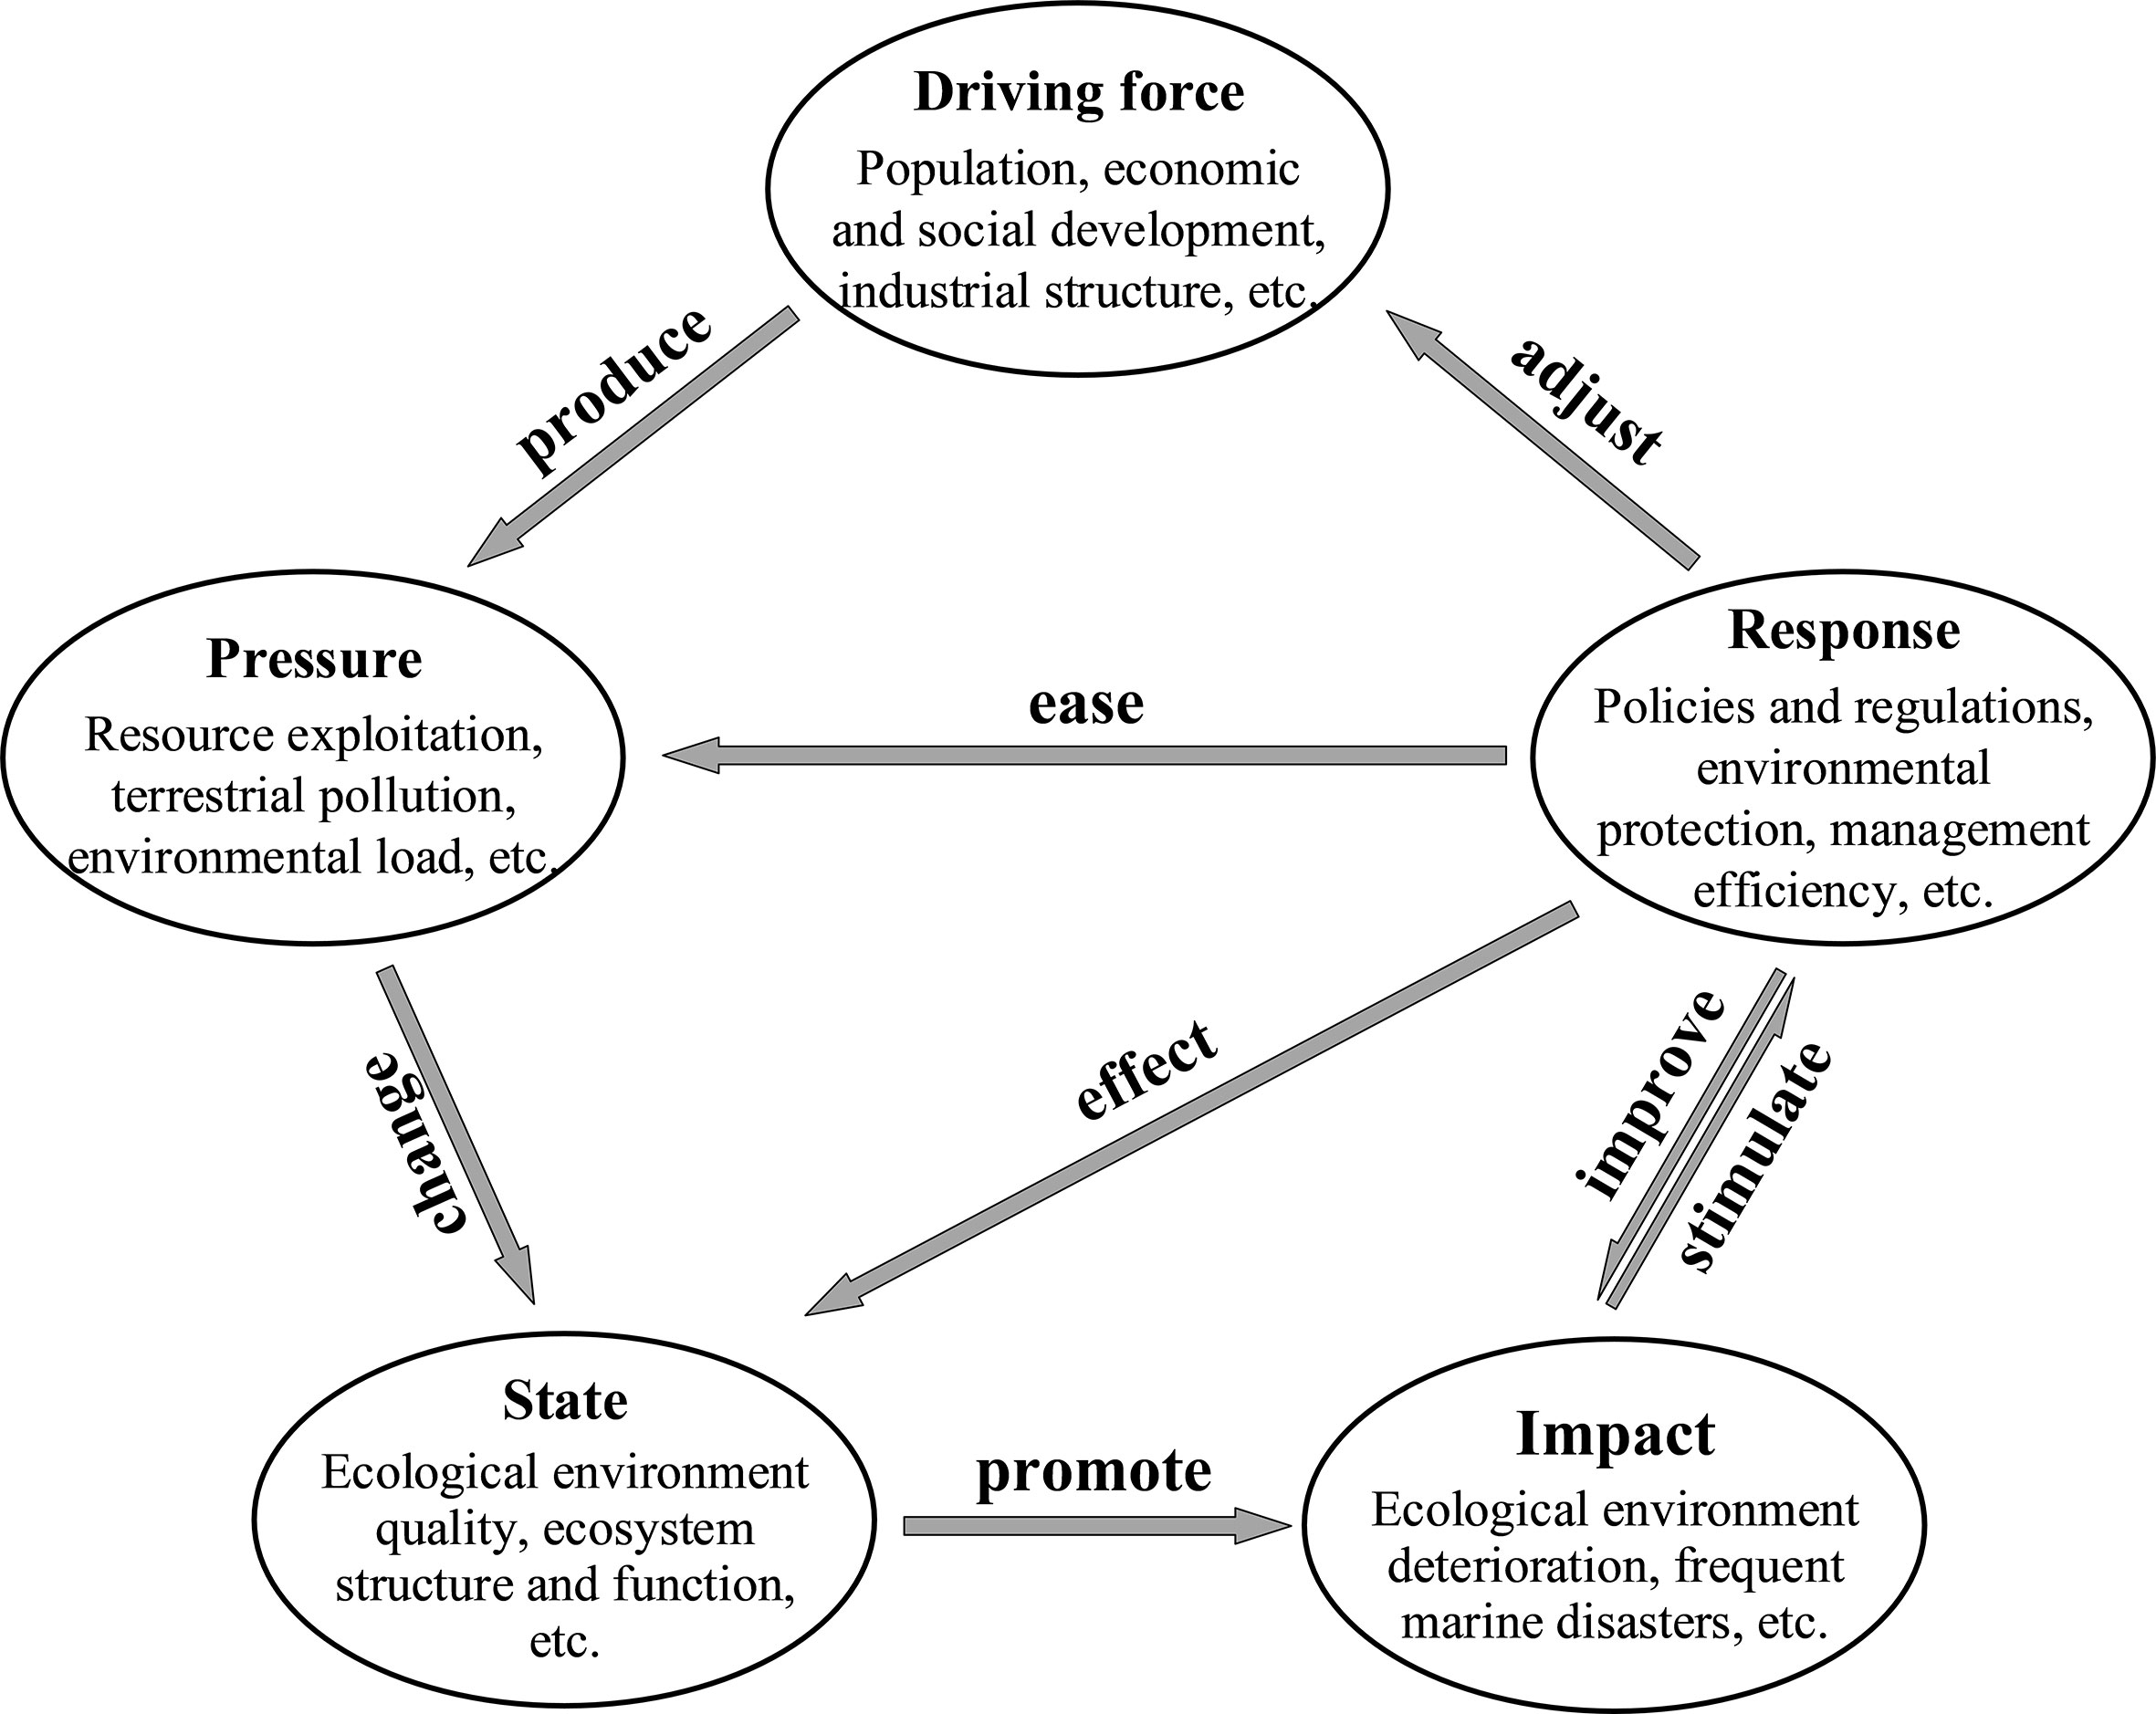
Figure 2 The DPSIR conceptual model for the ecosystem health assessment indicator framework in Laizhou Bay.
To assess the health of the LZB marine ecosystem, an indicator framework is developed based on economic and social value related factors of the land area, and environmental characteristics and ecosystem service function related factors of the sea area. Principles such as policy consistency, representativeness, simplicity, understandability, data accessibility, information precision, data-computing readiness and communication convenience, have been considered while selecting indicators (Wu et al., 2017).
The indicator framework is divided into target layer, criterion layer and indicator layer (Table 2). The target layer is Laizhou Bay Ecosystem Health Index. According to the classification criteria of DPSIR model, the criterion layer contains five dimensions: driving force (D); pressure (P); state (S); impact (I); and response (R). The indicator layer covers 40 indicators affecting the ecosystem health of LZB.
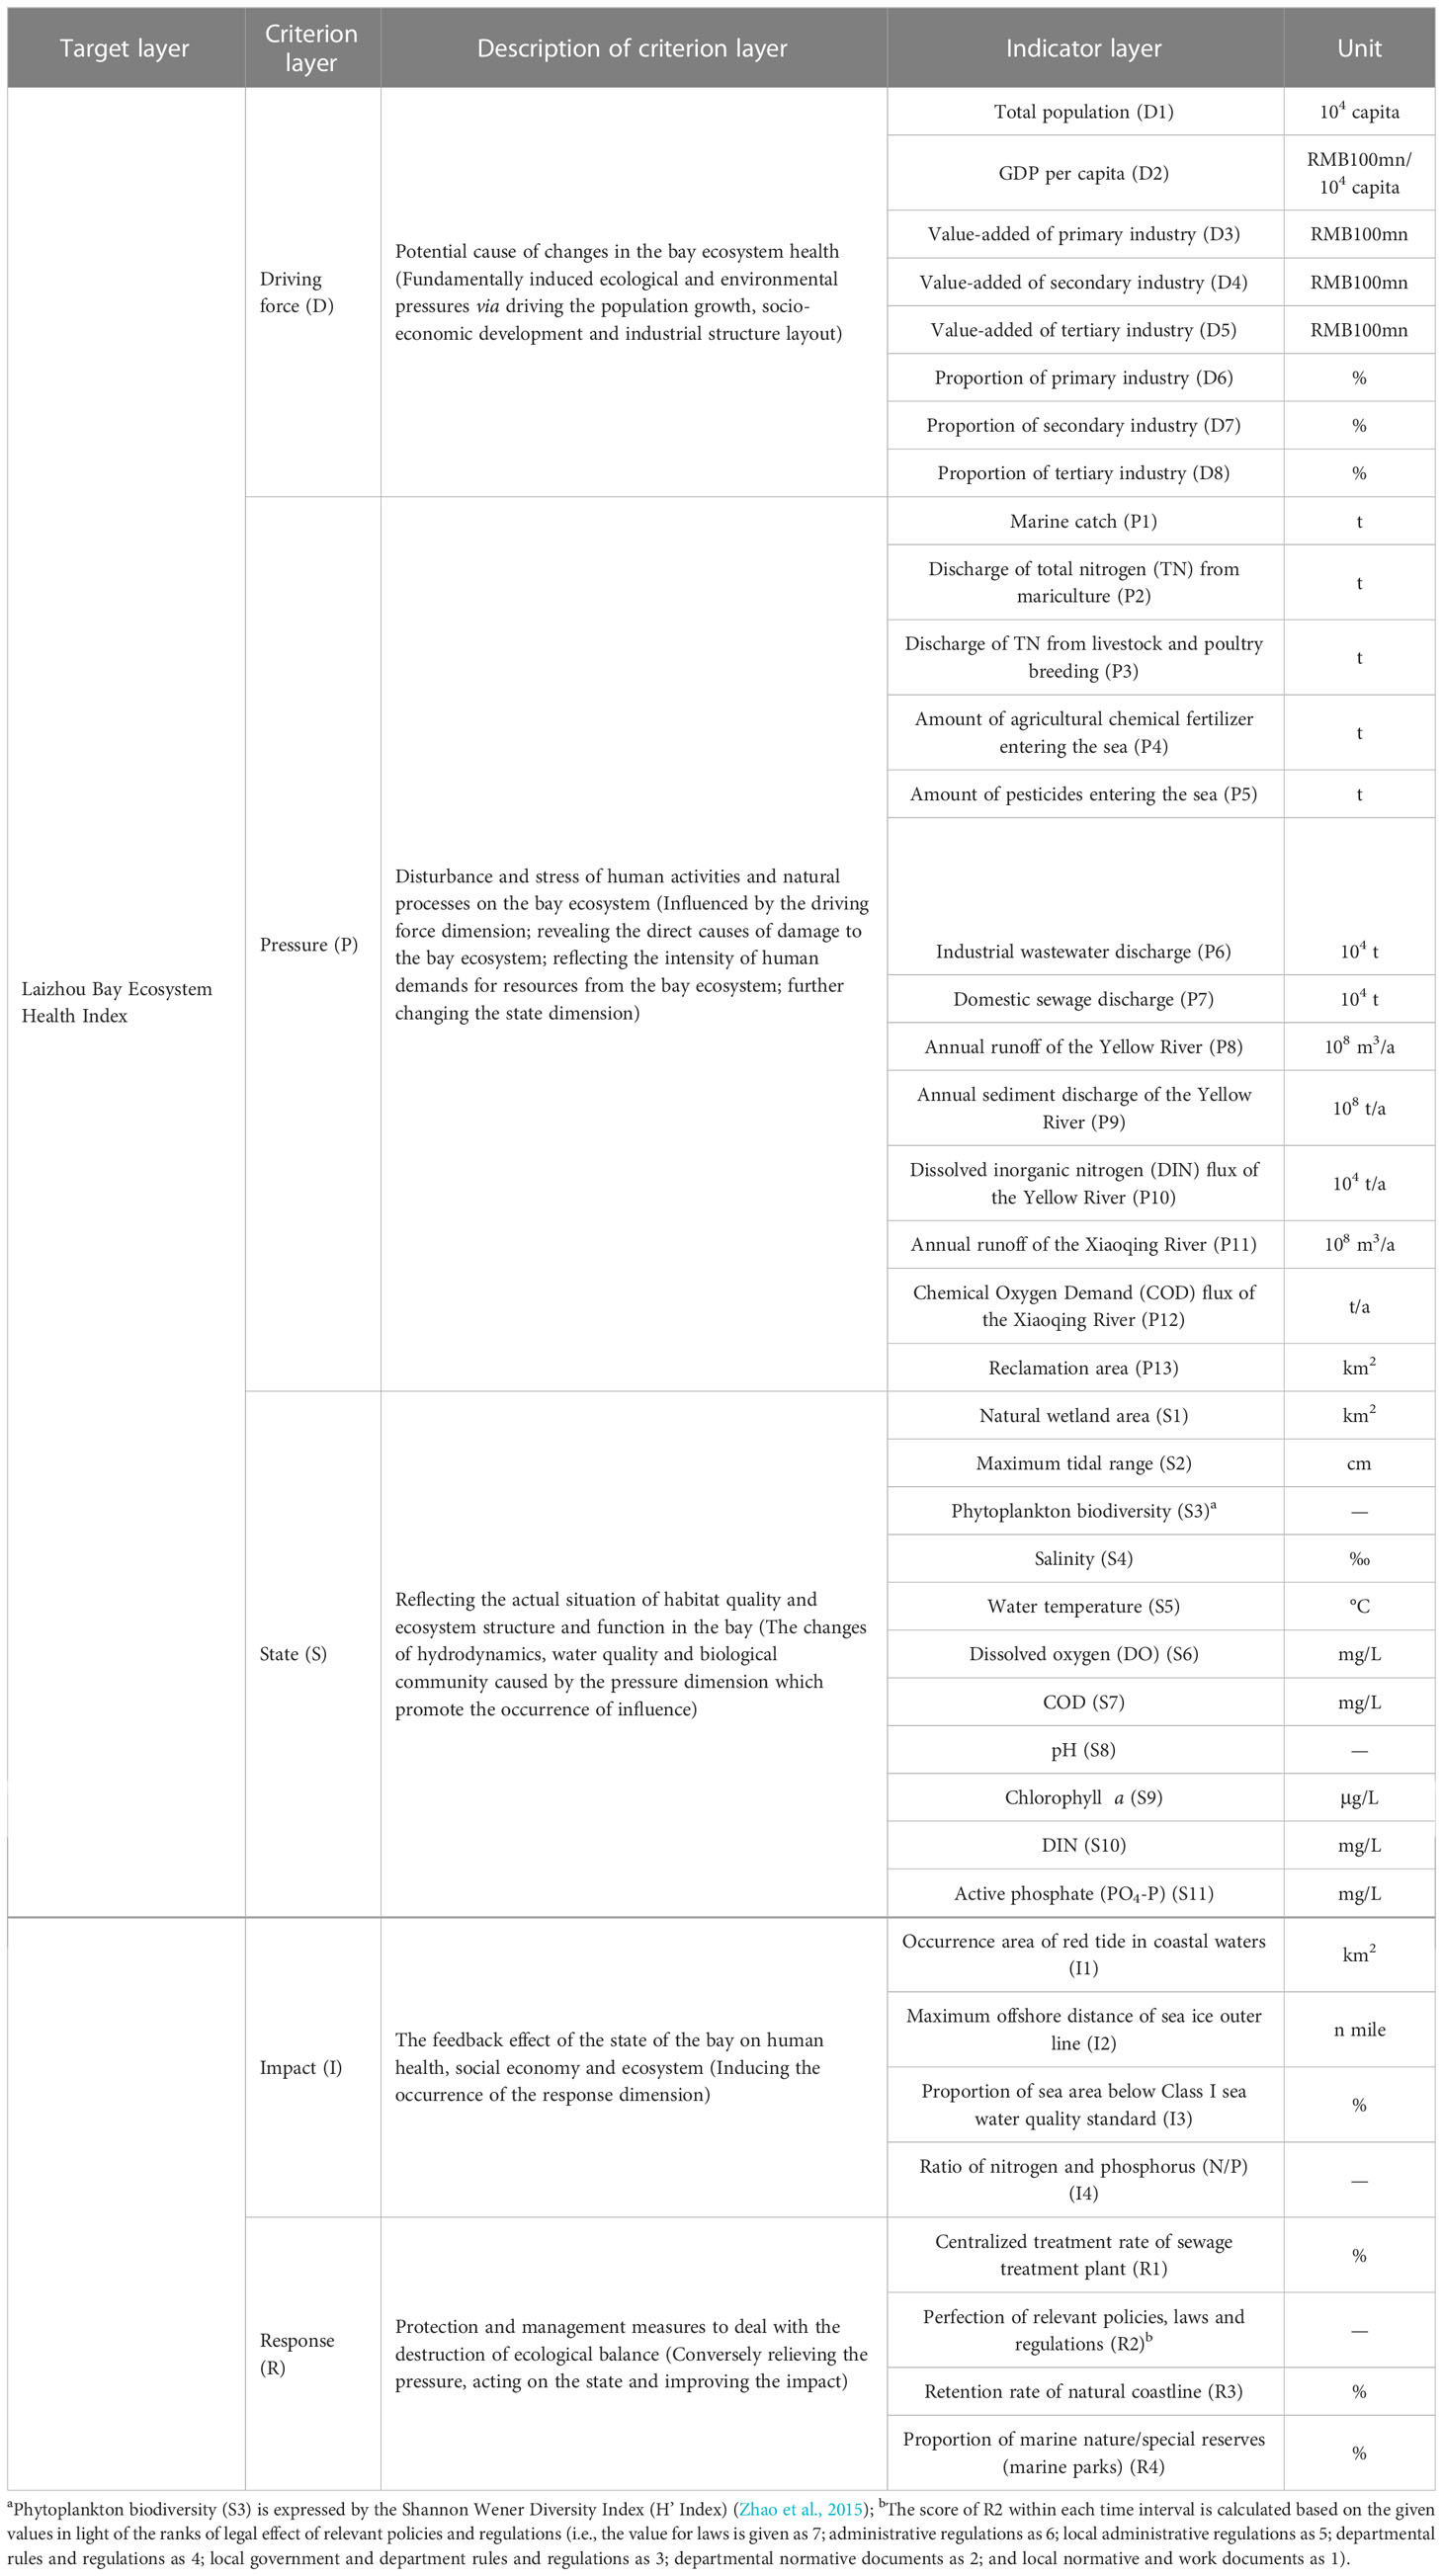
Table 2 The indicator framework for the ecosystem health assessment in Laizhou Bay.
3.3 Indicator standardization and weighting
After building the indicator framework, the positive processing and standardization should be conducted for the indicators. According to Ye (2003), there are four types of indicators classified during the positive processing based on the indicator attribute: (1) maximum-style indicator, also called benefit-style indicator, denoting that the larger the value the better; (2) minimum-style indicator, also called cost-style indicator, denoting that the smaller the value the better; (3) intermediate-style indicator, denoting that the closer the value is to a specific value the better; and (4) interval-style indicator, denoting that it is better if the value falls within an optimal range. The deviation standardization is achieved through the dimensionless processing for the indicators.
The comprehensive weighting method, combining with the subjective AHP (Saaty, 1977) and objective Entropy Weight Method (EWM) (Dong, 2019), is used to determine the indicator weight, in order to understand the contribution rate of different indicators to the health evolution of LZB ecosystem. This method effectively eliminates subjectivity and uncertainty of assessment and improves the rationality of indicator weighting. An expert indicator ranking procedure was conducted following the AHP method, expecting to highlight indicator priorities. A total of 21 experts, selected based on their knowledge and experience of marine management, ecosystem health assessment and the study area, were invited to conduct the indicator ranking process.
Through reasonably integrating subjective and objective weights, the comprehensive weight Wj of each indicator is calculated according to Liu et al. (2015):
where ej is the information entropy of the jth indicator; and m denotes the indicator ( m=40 ).
3.4 Assessment method and criteria
The Ecosystem Health Index (EHI) is calculated by the weighted summation of standardized indicator data, with a higher value indicating a higher health degree (Lu et al., 2013):
where is standardized indicator data; Wj is the comprehensive weight the jth indicator; n and m denotes the number of time interval and indicator, respectively ( n=9 ; and m=40 ).
As given in Table 3, the assessment criteria are divided into five levels, namely, morbid, unhealthy, subhealthy, fairly healthy and healthy (e.g., Lu et al., 2013; Wu and Chen, 2019).
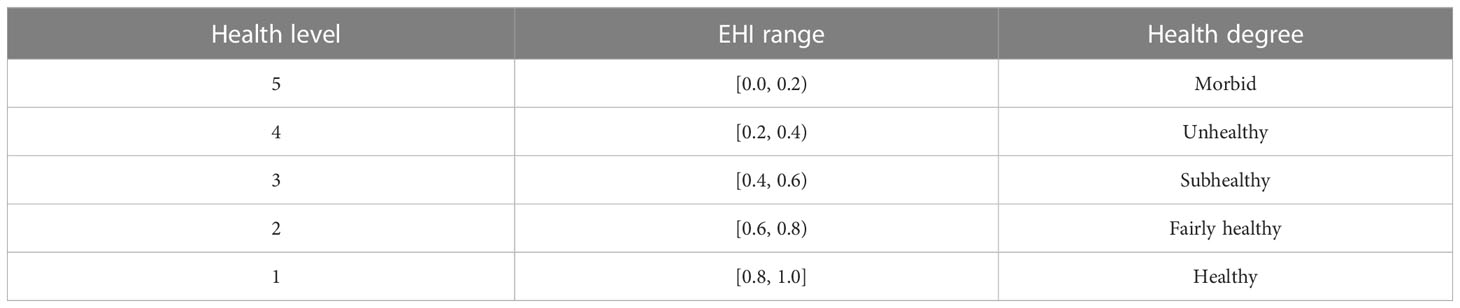
Table 3 Classification of EHI levels in Laizhou Bay.
4 Results and discussion
4.1 Assessment of LZB ecosystem health
According to Section 3.3, the results of positive processing and deviation standardization of indicators are presented in Tables A1, A2, respectively; the results of indicator weighting are presented in Table A3 (Supplementary Material). Figure 3 illustrates the proportion of integrated indicator weight value of criterion layer and comparison of integrated weight values of each indicator. It can be seen that the pressure dimension has the highest proportion of weight, followed by the state, driving force, response and impact dimensions. Of the top 10 indicators, six belong to the pressure dimension, indicating that multiple pressure sources from land and bay environment are the primary factors affecting the LZB ecosystem health.
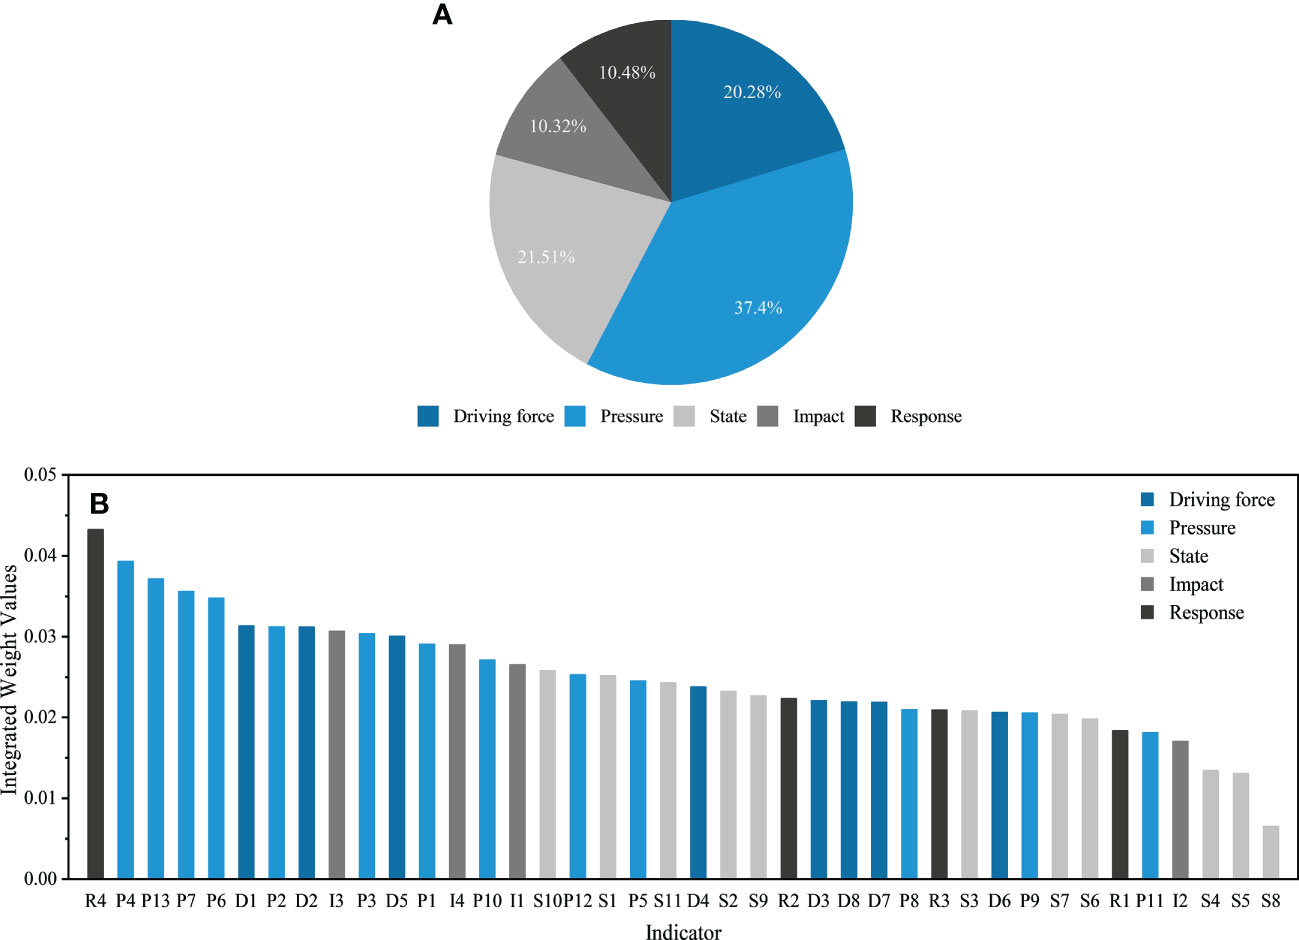
Figure 3 The indicator framework of ecosystem health assessment in Laizhou Bay: (A) the proportion of integrated indicator weight value of criterion layer; and (B) comparison of integrated weight values of each indicator.
According to Section 3.4, the EHI value are calculated and the health degree of each year can be obtained accordingly, so as to determine the evolution trend of LZB ecosystem health in the past 40 years. Table 4 shows that the highest EHI value (0.6359) was observed in 1985, indicating a fairly healthy state; the lowest value (0.3813) was observed in 2005, indicating an unhealthy state, which is consistent with the results of Xie (2009). Additionally, the EHI value in 1980 was the second highest, and the rest of the years were in a subhealthy status, which is also in agreement with previous studies (Song et al., 2017).
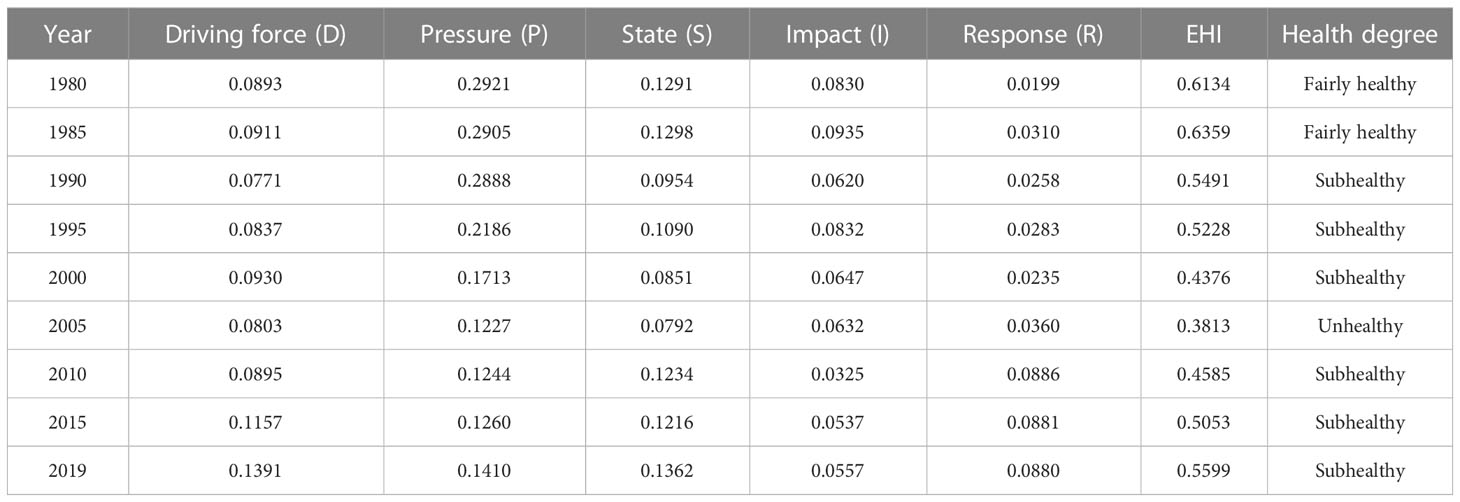
Table 4 Ecosystem Health Index (EHI) and health degree of the ecosystem health in Laizhou Bay.
The evolution trend of EHI value from 1980 to 2019 is shown in Figure 4A. It can be seen that the overall health status of LZB ecosystem has demonstrated a phased feature with a trend of first fluctuating and then continuously rising. China initiated the Openings Policy since the 1980s, when economic development just started. The LZB ecological environment can be treated as a baseline without pollution, thus its ecosystem health was good in the 1980s. However, in the 1990s, the environmental status of the bay was not optimistic due to multivariate and composite pressures along the coast (e.g. reclamation, land-based pollution, marine aquaculture, and overfishing), resulting in the continuous deterioration of LZB ecosystem health. After reaching the lowest value in 2005, the EHI recovered to a certain extent, indicating that the comprehensive environmental improvement of LZB was well implemented at this stage (Li et al., 2020).
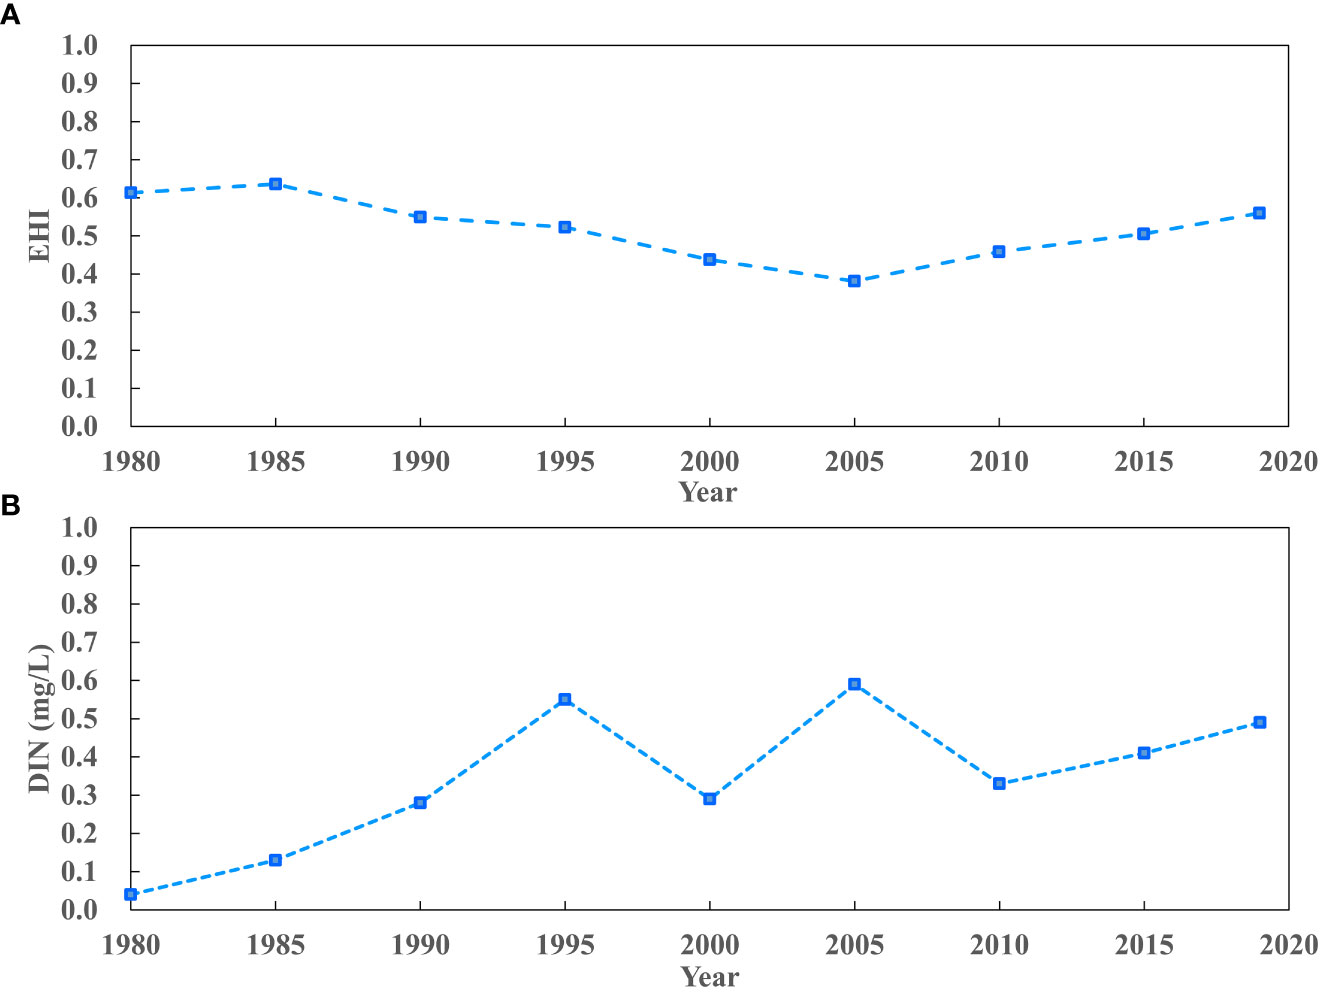
Figure 4 (A) The evolution trend of EHI value and (B) the DIN concentration in Laizhou Bay from 1980 to 2019.
4.2 DPSIR analysis
As the health status of LZB ecosystem is jointly determined by the variation trend of indicators at each criterion layer, this section will discuss the evolution trends of sub-index in criterion layers and their motivations (Figure 5).
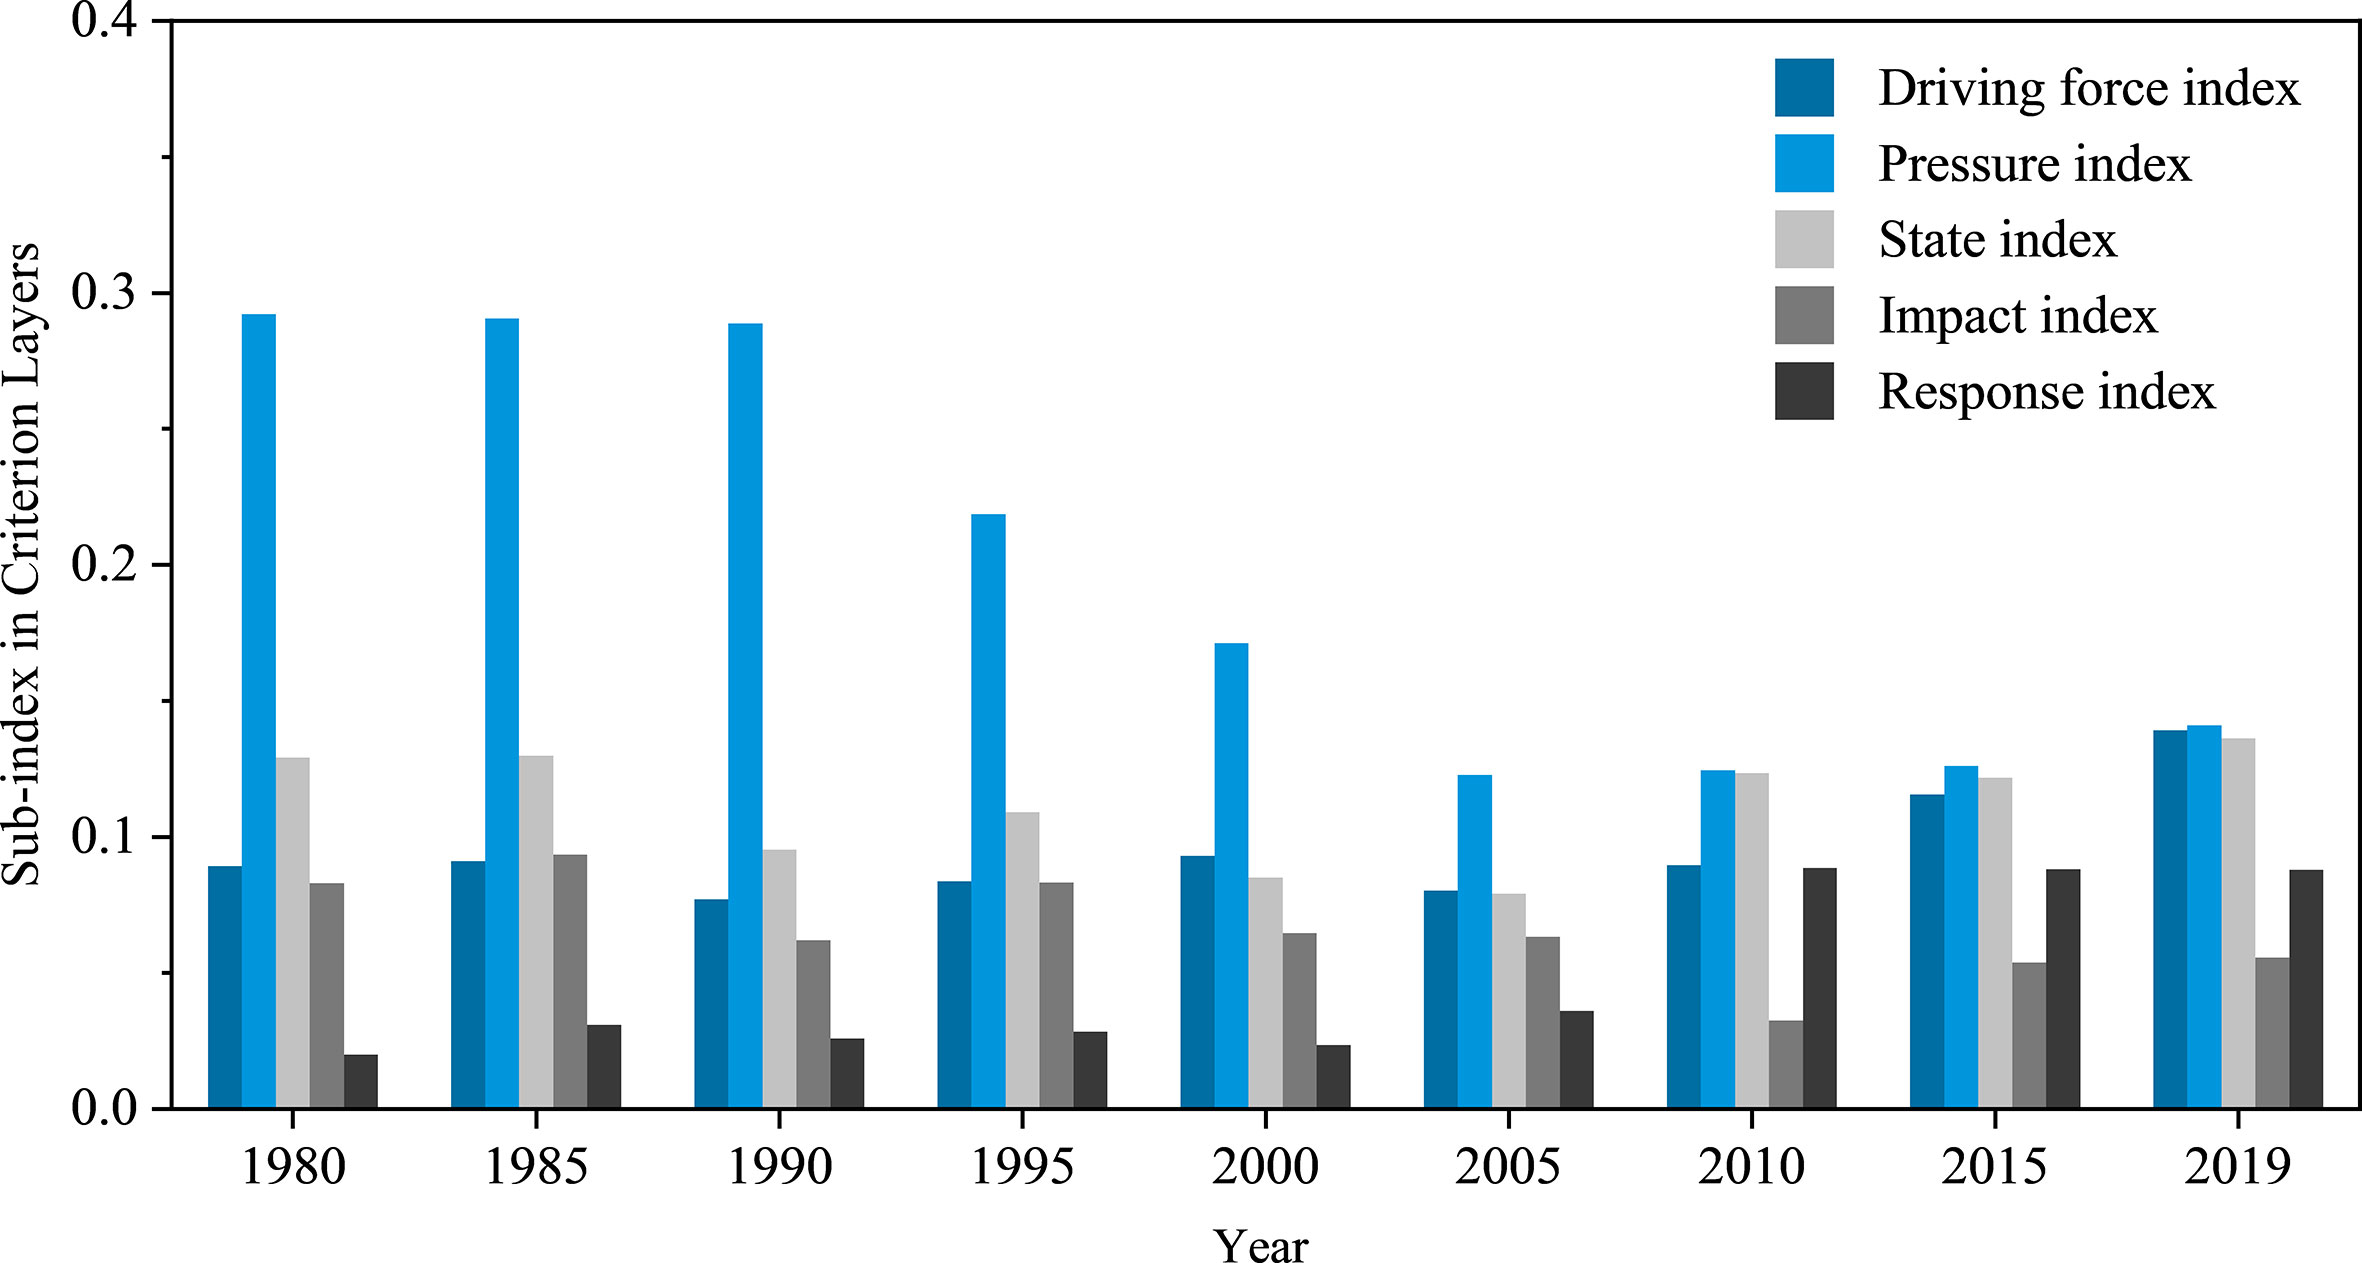
Figure 5 The evolution trends of sub-index in criterion layers for the ecosystem health assessment in Laizhou Bay.
(1) Driving force
With the rapid and high-quality development of marine economy in LZB in recent 40 years (Li et al., 2014), the driving force index presents a fluctuating and rising trend as a whole. According to Figure 3, indicators such as total population (D1) and GDP per capita (D2) play a leading role in the driving force layer. This indicates the population growth and socio-economic development in the land areas surrounding LZB are likely to cause ecological and environmental pressures and impact the ecosystem health, as described in Section 2.
(2) Pressure
Following the positive processing of indicators, a higher pressure index represents a lower pressure. The pressure index has been dominant from 1980 to 2005. During this period, it had a slight downward trend between 1980 and 1990, followed by a sharp decrease until reaching the minimum value in 2005 and a subsequent slow rebound. Indicators such as discharge of TN from livestock and poultry breeding (P3), marine catch (P1), DIN flux of the Yellow River (P10), COD flux of the Xiaoqing River (P12) and annual runoff of the Xiaoqing River (P11) all reached relatively low or lowest values in 2005 (Table A2). This suggests that non-point source pollution from agricultural, animal husbandry and fishery production activities in the land areas surrounding LZB were likely major contributors to the bay’s ecosystem health, particularly in 2005.
On one hand, the implementation of a summer fishing moratorium in the Bohai Sea since 1995 has increased the amount of fishery resources in the Bohai Sea, resulting in a peak marine catch in LZB in 2005. However, the strong fishing volume has not been able to prevent the decline of fishery resources, leading to a decrease in marine catch in LZB after 2005 (Hu et al., 2020). On the other hand, the Yellow River and Xiaoqing River basins, which are densely populated and contain numerous chemical industry zones, are two of the main pollution sources in LZB (Zhang et al., 2022). Industrial wastewater and domestic sewage, carrying large amounts of nutrients into the sea (Section 2; Shandong Academy for Environmental Planning, 2018; Li et al., 2020), have great impact on the distribution and structure of nutrients in the seawater (Strokal et al., 2017). For example, as reported by the Bulletin of Marine Environmental Quality of Shandong Province, 87% of the 23 sections in the Xiaoqing River basin, had a Class IV water quality (Sea Water Quality Standard of China) or worse in 2019. Excessive use of nitrogen fertilizer in agricultural production has also contributed to the pollutant flux into the sea. For example, the fertilizer consumption in Shandong Province increased by over three times between the 1980s and the 1990s (Xiong and Weng, 2015). These factors have caused water eutrophication, altered the nutrient structure and biodiversity of the sea area, and ultimately led to the deterioration of ecosystem health in LZB (Wang et al., 2021; Zhang et al., 2022).
(3) State
The state index of LZB ecosystem has exhibited a fluctuating evolution trend, with higher values in the 1980s and 2010s and the lowest value in 2005. The DIN concentration (S10) reached the highest value in 2005 (Figure 4B), which is in agreement with the findings of Zhang et al. (2022). This can be attributed to the increased nutrient flux from rivers and the reduction of sea area due to reclamations before 2005 (Ding et al., 2018; Xu et al., 2021). Zhang et al. (2022) also found the riverine inputs are the primary contributor to the increase of DIN concentration. Subsequently, the implementation of pollution control and environmental protection surrounding LZB have led to a decrease in nutrient concentration (Feng et al., 1999; Zhang et al., 2022).
(4) Impact
The impact index of LZB ecosystem has a certain degree of uncertainty and contingency, yet its overall downward trend with fluctuation has resulted in an increasing negative impact on the ecosystem health. After 2010, the impact index rebounded mainly due to the cold current weather. As reported by the Bulletin of China Marine Disaster, in 2010, the most severe sea ice disaster occurred in LZB in the past 40 years.
(5) Response
Overall, the response index of LZB ecosystem has presented an upward trend with fluctuation and the growth rate during 2005~2010 has been particularly rapid. This is mainly due to the indicator “proportion of marine nature/special reserves (marine parks)” (R4), which has the highest weight in the indicator framework and is the key factor affecting the ecosystem health (Section 4.3). The establishment of the first national marine reserve in LZB, the Dongying Yellow River Estuary Ecological National Marine Special Reserve, in November 2008 has contributed to the rise of the response index. This indicates an increased awareness of marine protection and improved abilities to prevent and respond to marine pollution, marine disasters and other events, ultimately demonstrating the stable and sound development of LZB ecosystem.
4.3 Identification of key factors on EHI
For the past 40 years, the key factors affecting the health of LZB ecosystem can be distinguished according to the weight value of each indicator (Section 4.1.2). As shown in Figure 3, the integrated indicator weight of both pressure and state layers has exceeded 50%, with the weight of pressure layer exceeding one-third of the total weight. This indicates that the key influencing factors are mostly indicators in the two criterion layers. Among all 40 indicators, R4 in the response layer has the highest weight, which may be attributed to the small information entropy of indicator data.
In the pressure layer, indicators with high weight include amount of agricultural chemical fertilizer entering the sea (P4), reclamation area (P13), domestic sewage discharge (P7) and industrial wastewater discharge (P6), etc. This suggests that the ecological and socio-economic damage caused by land-based sewage discharge and reclamation has severely restricted the healthy development of LZB ecosystem. For example, land-based sewage discharge is the main source of pollution in the Bohai Sea, accounting for approximately 90% of the total pollution (Zhang et al., 2007). Therefore, this section adopts the limit thought method to conduct a scenario analysis. It is assumed to remove one single key factors such as reclamation and different types of land-based sewage discharge (e.g., agricultural and productions, residents’ daily life) as well as the combined effect of these two kinds of anthropogenic pressures. Thus, the variation degree and trend of EHI value can be observed, in order to explore the direction of efforts to improve the LZB ecosystem health in the future.
The scenario simulation results (Figure 6) illustrate that the EHI value of removing the combined effect of reclamation and land-based sewage discharge is the highest. Different from the trend of original index, its highest value appeared in 2019 which was fairly healthy, and the removal of combined key factors has a more significant impact over time. The lowest values of seven broken lines in Figure 6 all appeared in 2005, while all simulated scenarios were in a subhealthy status in that year except for the original index. As illustrated in Table 5, the health status of LZB ecosystem after removing the composite effect was improved in 2015 and 2019 which was fairly healthy, indicating that reducing the intensity of human pressures can effectively alleviate the LZB ecosystem health. In terms of the effects of removing single key factor, the highest EHI values appeared while removing “amount of agricultural chemical fertilizer entering the sea” (P4) from 1985 to 2015 and “reclamation area” (P13) in 2019, respectively.
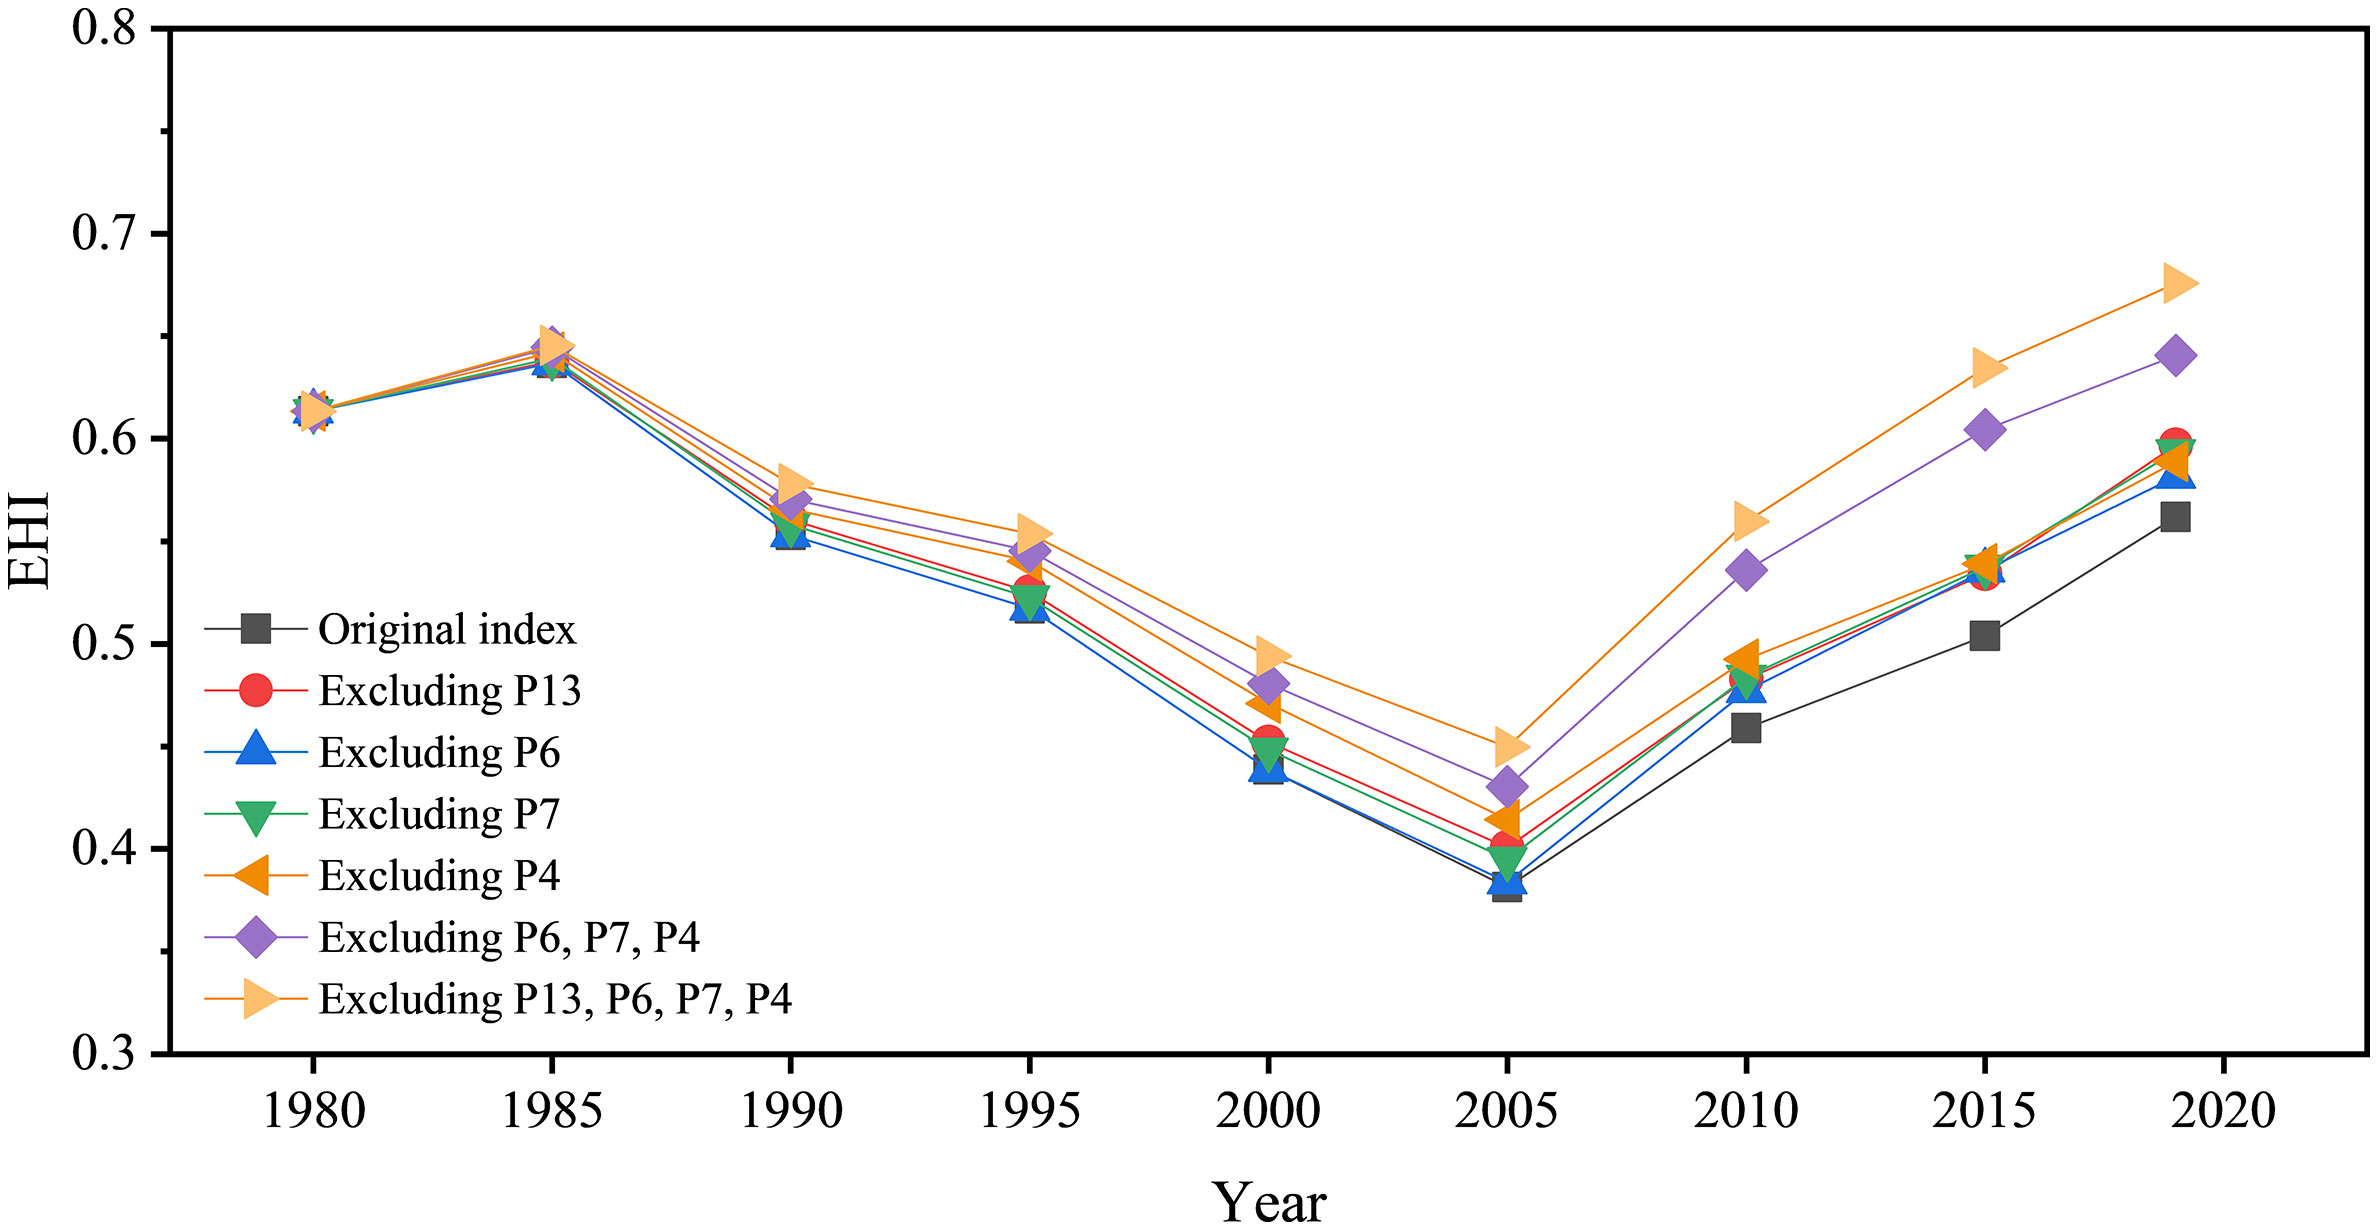
Figure 6 Scenario analysis of ecosystem health in Laizhou Bay.
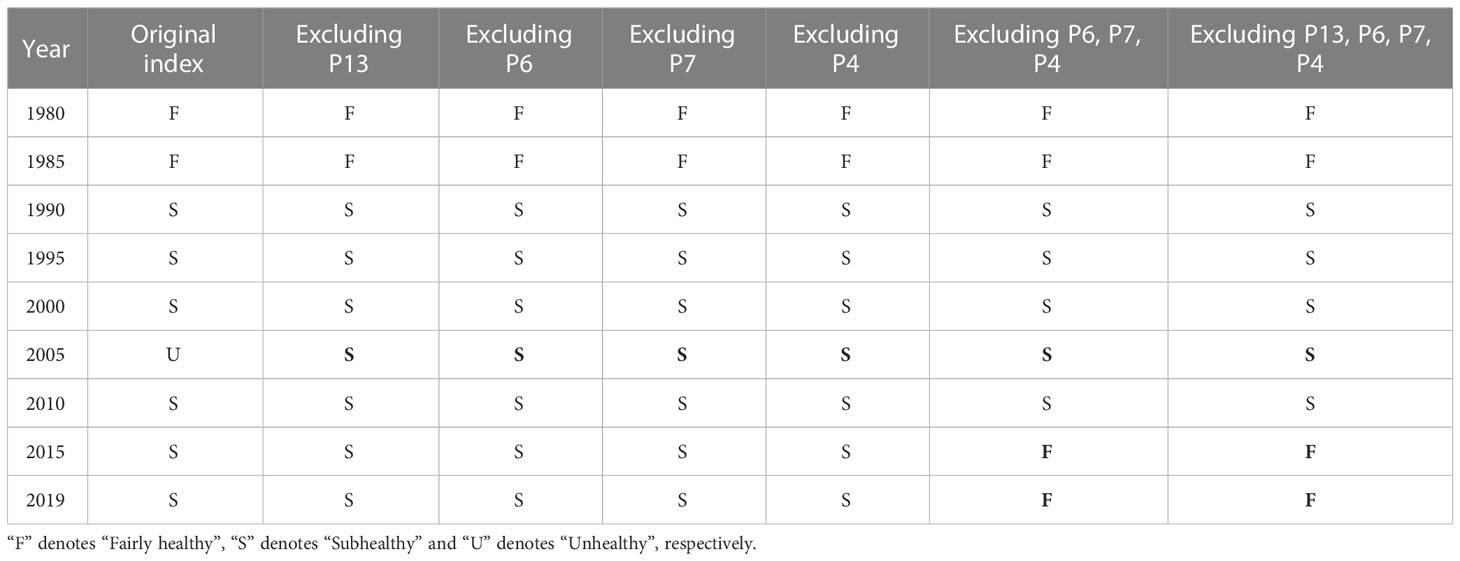
Table 5 Summary of ecosystem health level corresponding to EHI obtained by removing the key factors of pressure layer in Laizhou Bay.
Reclamation in the Bohai Sea has been halted since 2017, yet the impacts of reclaimed areas on the hydrodynamic, water environment and ecosystem factors of the bay are irreversible, such as changes in landforms, reduced environmental and tidal capacities, occupation of biological habitats and accelerated coastal erosion (Choi et al., 2010; Park et al., 2014). For example, from 1968 to 2015, the natural wetland and intertidal area of LZB was reduced by 17.2% and 56.1%, respectively; from 2003 to 2013, the LZB water area was reduced by 7.38% and the average tidal volume by 5.75% due to the reclamation (Xu et al., 2021). Thus, the sea area should be restored by returning farmland and dikes to the sea and dismantling abandoned aquaculture ponds, etc.; the hydrodynamic environment of LZB should be improved by dredging key waterways and bay crest, etc.
Meanwhile, the main agricultural production areas in northern Shandong are distributed along the LZB coast (Project Team of “Research on Monitoring and Controlling Technology of Economic Activities Around Bohai Sea Based on Environmental Carrying Capacity”, 2016). As stated above, agricultural chemical fertilizers infiltrate into the surface or underground through surface runoff and leaching and eventually enter the bay, affecting its ecological environment. Since 2015, the Ministry of Agriculture (now as the Ministry of Agriculture and Rural Areas) of the People’s Republic of China has made great efforts to promote rational and scientific fertilization and achieved optimistic results to some extent. Additionally, the LZB region has a solid industrial foundation (see Section 5.2 in detail). However, industrial production is accompanied by pollutant discharge, particularly the compact industrial layout and concentrated wastewater discharge around the Xiaoqing River basin, which pollutes the LZB ecological environment (Section 2; Wang et al., 2021). With the continuous improvement of urbanization level in the LZB area, the domestic sewage discharge has been gradually increasing in recent years (Zhang et al., 2022). Therefore, measures should be taken to explore scientific methods to reduce discharges of land-based pollutants. A long-term mechanism for economic and ecological assessment of environmental damage caused by land-based pollution should be established. These measures are beneficial in reducing the amount of land-based pollutants entering the sea and improving the LZB ecosystem health.
5 Recommendations for improving LZB ecosystem health
Although the healthy status of LZB ecosystem has become increasingly obvious in recent years, the disturbance and stress suffered by the bay still exist and the health level (EHI) is still lower than the historical situation. Therefore, based on the above assessment results and the situation of study area, this section will put forward specific countermeasures and suggestions for improving the LZB ecosystem health. The following recommendations are expected to achieve the sustainable development of regional economy and ecological environment in a coordinated way.
5.1 Refining regional management of LZB ecosystem health
(1) Perfecting the legislation related to regional management
It is evident from the evolution trend of R2 (Section 4.1) that the legal system construction based on the LZB ecosystem health presents certain phased characteristics, which is closely related to its health status. The introduction of policies and regulations has been beneficial in improving the efficiency of ecological pollution control, while the intensification of environmental pollution has also, to some extent, driven the construction of a legal system. In China, relevant laws concerning land and sea ecological protection and governance have been established. However, there is still a lack of a basic law that comprehensively guides integrated marine management from the perspective of land and sea coordination. Furthermore, the majority of existing relevant provisions are scattered in policies and regulations with lower legal effect (e.g., administrative regulations, and departmental rules) (Section 3.2) which can hinder departmental collaboration and resource allocation, thus affecting the effectiveness of marine management. Taking into account the strong regional characteristics of the generation of environmental pressure, the features of aquatic ecology and the rigid demand for resource utilization, relying solely on laws and regulations within the national management scope for ecological governance is insufficient. The Law on Special Measures for Seto Naikai Environmental Protection of Japan is a good example of how to address this issue. Therefore, China can draw lessons from the experience of other countries to refine relevant law making of regional management. For example, special laws for specific regions (e.g., the Bohai Sea, Laizhou Bay or the Xiaoqing River) can be formulated, establishing strategic objectives, responsibility subjects, and regulatory requirements for governance of regional ecosystem. The strictest mechanism and most rigorous rule of law should be adhered to in order to maintain the LZB ecosystem health.
(2) Improving the integrated mechanism of regional management
The management of sea and land areas in LZB is generally based on the division of administrative ownership (Section 2). This can lead to fragmentation and unclear rights and responsibilities among multiple local administrative departments, making it difficult to achieve the high-level coordinated decision-making management. Thus, this paper suggests the establishment of an integrated and coordinated organization to guide the management, strengthen the overall planning, coordination and communication among administrative departments, and improve the regional management integration mechanism of LZB.
Extreme weather events, such as heavy rainfall, can have significant cumulative impacts on the ecological environment of coastal waters, as evidenced by the influx of large amounts of fresh water and nutrients (Walker et al., 2021). Human activities can further exacerbate the risks posed by these extreme weather events, necessitating the exploration of an integrated mechanism for managing the cumulative impacts of human activities and extreme weather processes on the environment and ecosystem in the LZB area, supported by long-term observation.
5.2 Building a coordinated land-sea governance system
To strengthen the linkage between land and sea areas in LZB, it is essential to consider the socio-economic and ecological functions of these two spatial domains as an organic entirety. The specific layout ways can be summarized as follows.
(1) Source-based Pollution Control
Based on the results of assessment (Section 4.1) and key factor identification (Section 4.3), the regulation and control of pollution sources should be prioritized. For example, a comprehensive consideration of LZB resources and environmental carrying capacity should be taken into account when establishing an environmental permit constraint mechanism; rewards and punishments should be provided accordingly. The utilization efficiency and management (e.g., utilization type, proportion, method and intensity) of fertilizer and pesticide should be strengthened and improved. Cleaner production technology should be promoted; production evaluation standards and audit should be improved. Additionally, the pollutant diffusion pathway should be changed. All sewage outlets into the sea should be investigated, recorded and renovated (Wang et al., 2021); wastewater treatment plants and pipe networks should be built, modified or expanded; and the sewage treatment process should be improved if necessary. The quality of cultivated land and farming methods should be improved; intensive and large-scale livestock and poultry breeding models should be established. Ponds and wetlands should be rehabilitated and the aquaculture scale be controlled. These measures should assist in controlling the total amount of pollutants and enhancing the management efficiency of joint prevention and control of land and sea pollution.
(2) Industrial structure adjustment and layout optimization
From the indicator weight results (Section 4.1), it can be seen that the structures of three types of industries in the LZB area do not directly affect its ecosystem health. However, influenced by factors such as natural environment, social background, industrial foundation and national policy guidance, the adjustment of industrial structure and layout will regulate the resource allocation, thus indirectly promoting the evolution trend of the LZB ecosystem health. As shown in Figure 7, in the past 40 years, the industrial structure of the LZB area has gradually changed from “secondary-primary-tertiary” to “secondary-tertiary-primary” and finally presented a preliminary “tertiary-secondary-primary” pattern.
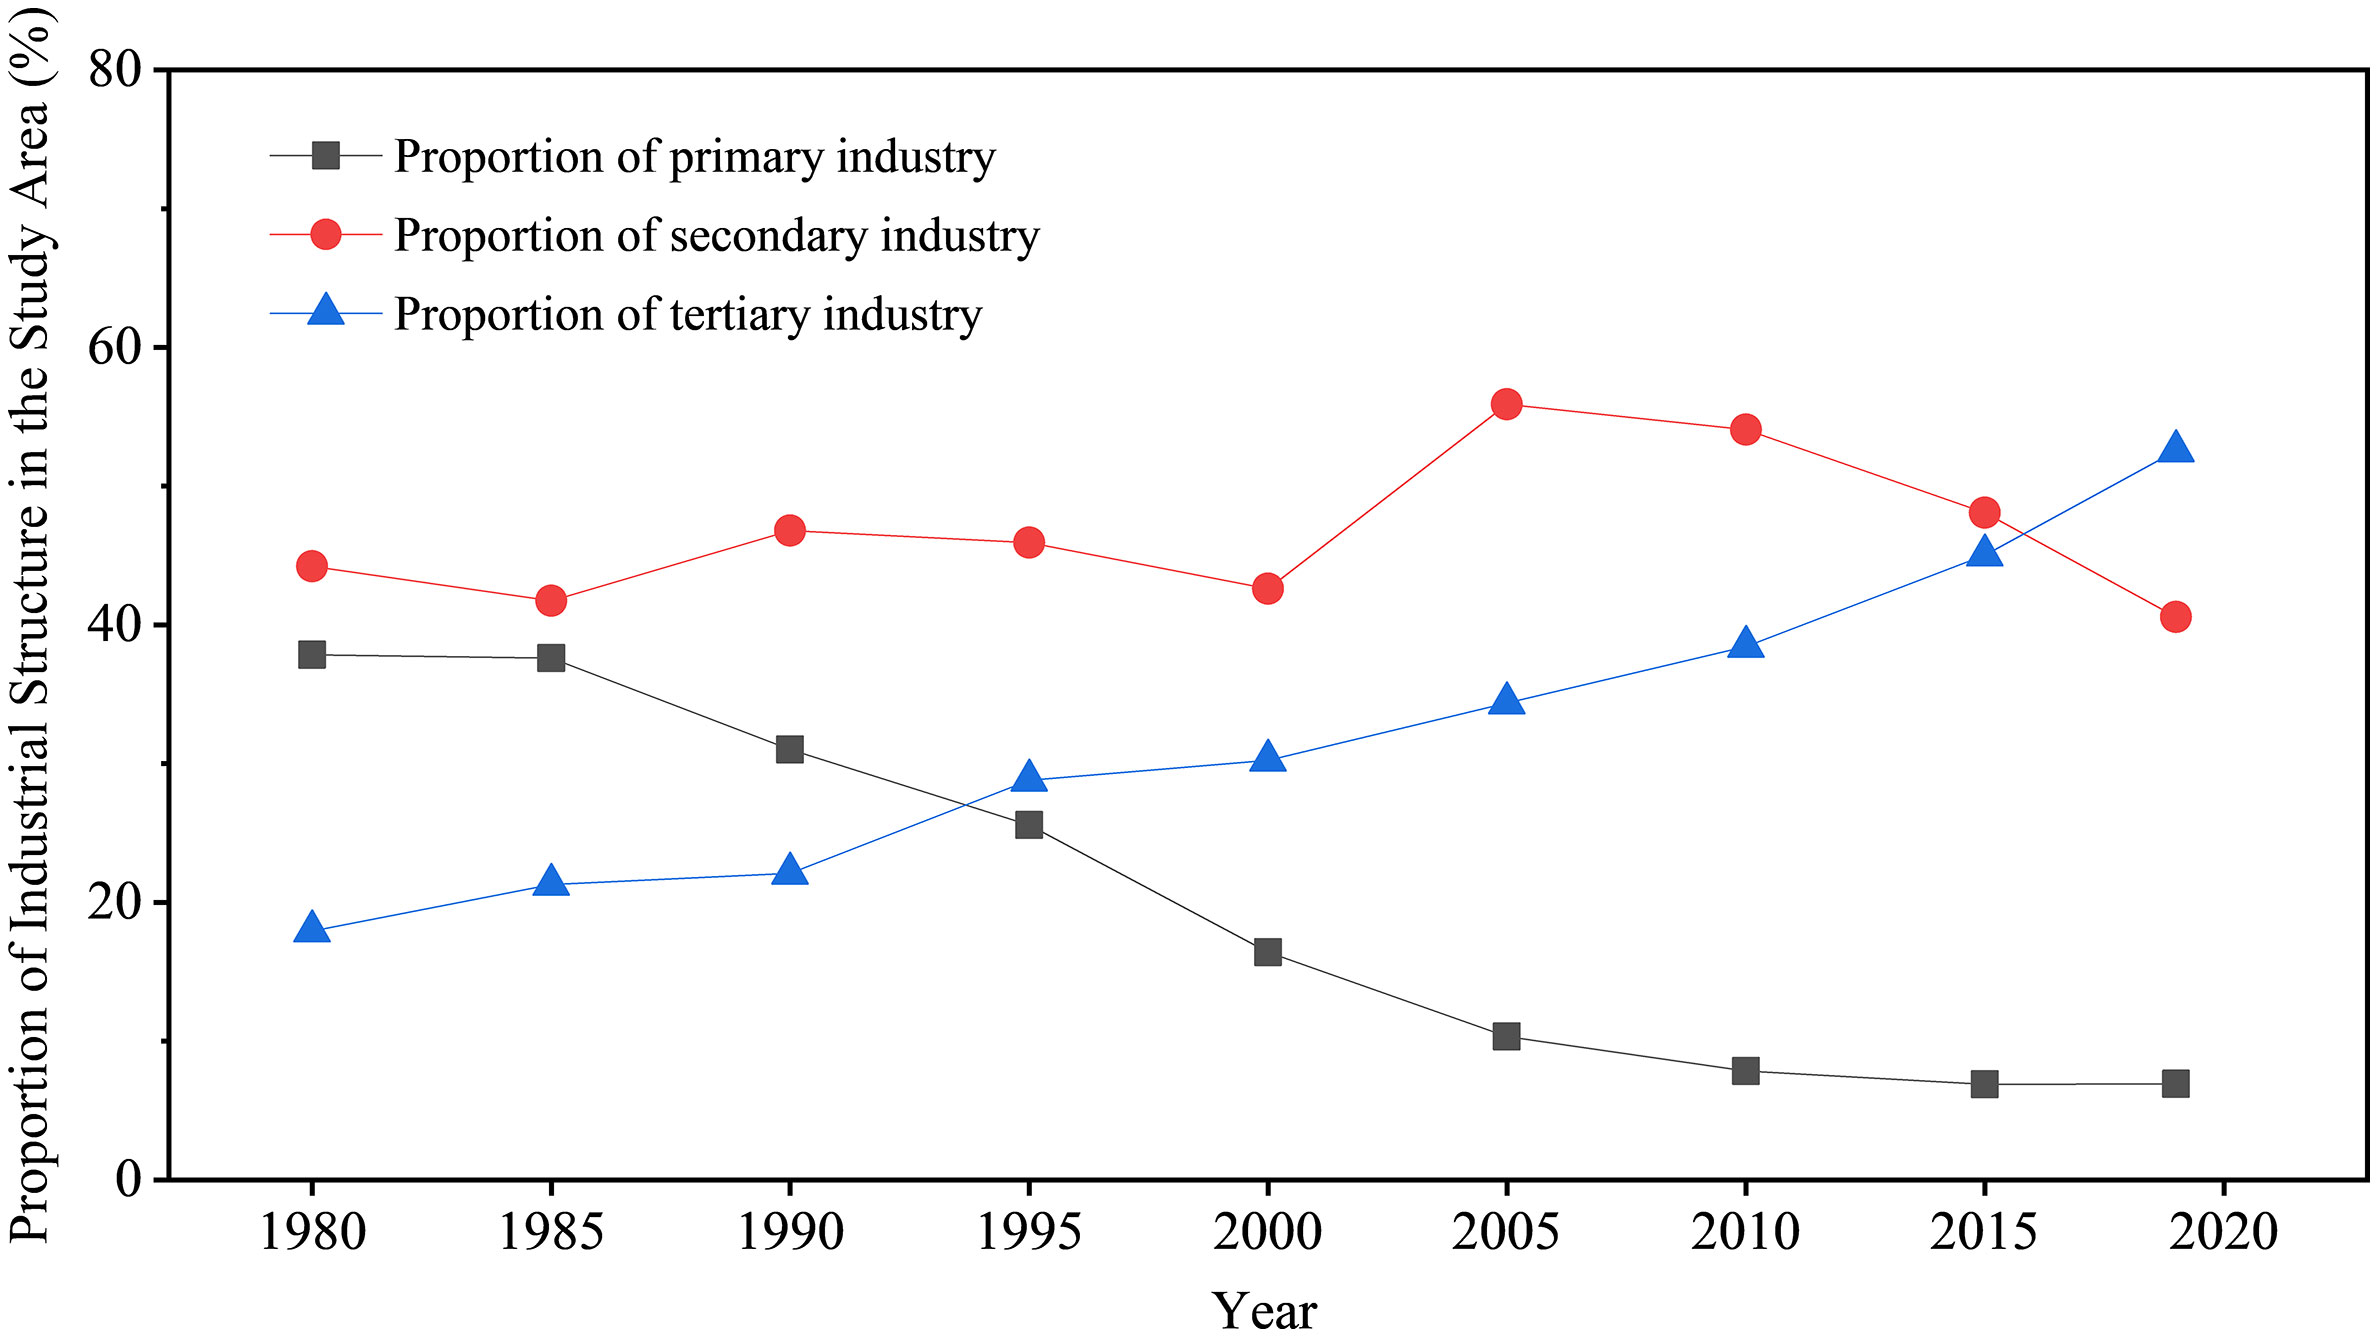
Figure 7 Industrial structure variations in the Laizhou Bay Area from 1980 to 2019.
As the predominant industry for a long period in the LZB area, the cumulative effect of environmental pollution caused by the industrial production cannot be ignored (Section 4.1). Consequently, the LZB area should optimize the structure of secondary industry and accelerate the process of new industrialization according to the principles of market demand guidance, scientific and technological conditions, regional coordinated development, pillar industry orientation, comprehensive benefits and sustainable development, etc. The tertiary industry should be the strategic focus of deepening the adjustment of industrial structure and modern competitive service industries should be vigorously developed (e.g., biotechnology, environmental monitoring, transportation, port logistics and eco-tourism). The transformation and upgrading of traditional marine industries should be promoted (e.g., marine chemical industry, marine mineral resources exploitation and marine fishery); new growth aspects for the development of marine innovative and service-oriented high-tech industries should be created (e.g., marine engineering equipment, marine biomedicine, seawater desalination and comprehensive utilization, and marine new energy).
(3) Promoting protection and restoration of the bay habitat
The highest weight of the R4 indicator (Section 4) implies that the protection and restoration of habitats is essential for the recovery of the LZB ecosystem health. To this end, a range of countermeasures can be implemented to protect and restore fragile and sensitive bay habitats, such as establishing marine reserves, strictly adhering to ecological protection red lines, strengthening the supervision of important ecological functional areas, implementing the siltation promotion and shoal reinforcement projects, and enhancing the coastal environment renovation. These measures would be beneficial for the sustainable development of marine resources and the construction of marine ecological civilization.
(4) Strengthening the capacity of marine spatial governance
According to the analysis in Section 4.3, reclamation is one of the key factors affecting the LZB ecosystem health. Therefore, the dynamic management of coastline use should be strengthened, the exploitation and utilization of coastal and island spatial resources should be strictly controlled, and the retention rate of natural coastline should be improved. The sea area functions should be clarified to meet the requirements for marine spatial planning under the new round of territorial spatial planning system in China (Xinhua News Agency, 2019). Additionally, the three fundamental systems regulated by the Law of the People’s Republic of China on the Administration of the Use of Sea Areas (i.e., management of sea area ownership, sea area use demonstration, paid use of sea area system) should be further refined to achieve the synchronous improvement of social function values and ecological benefits in LZB.
5.3 Exploring new technologies for integrated marine management
In view of the assessment results and analysis in Section 4, the comprehensive governance of LZB necessitates scientific and technological innovation to address numerous issues at hand.
(1) Strengthening environmental monitoring and supervision mechanism
The environmental monitoring and emergency response capacity-building systems and a dynamic monitoring mechanism for coastal ecological environment based on the land and sea coordination should be established in the LZB region. Additionally, the risk prevention and control system for major marine environmental risk sources and environmental sensitive factors should be improved; the capability of marine observation and ecological early warning should be strengthened. Moreover, the integrated law-enforcement system for LZB should be refined with clearer responsibilities at all administrative levels and all kinds of illegal marine development activities must be punished resolutely.
(2) Promoting marine science and technology innovation capability
Shandong Province is a leader in marine science and technology in China, with advantages in promoting marine scientific and technological innovation. For example, it has nearly 50% of China’s marine science and technology talents, more than 50 marine scientific research and teaching institutions, and over 230 marine science and technology platforms above provincial level (China Shandong Network, 2020). However, the transformation mechanism of scientific and technological achievements specific for the entire sea area of LZB is relatively weak; the allocation of scientific research resources is inadequate; the strategic support for marine science and technology is still insufficient. These issues impede the construction of a scientific and technological innovation system, which is not conducive to the healthy development of the bay ecosystem. Thus, for the LZB area, an integrated innovation platform of “Industry-University-Research” for marine science and technology should be gradually built and the transformation of scientific and technological achievements be steadily promoted. Additionally, an information resources sharing mechanism should be established to avoid the data fragmentation and strengthen the data management. Furthermore, the construction of “Smart Ocean” should be carried out in depth, using advanced technical means such as artificial intelligence, big data and cloud computing to achieve the marine informatization.
6 Conclusions
The effective maintenance and management of ecosystem health and its balanced operation are essential for the sustainable development of human society and economy. This study established a DPSIR-based assessment indicator framework and quantitatively assessed the status and evolution trend of LZB ecosystem health from 1980 to 2019. The key factors affecting the health of LZB ecosystem were identified, and the influential effects of single and composite factors were simulated. Based on this, specific regulation strategies and management recommendations were put forward.
Over the past 40 years, the LZB ecosystem has been in a subhealthy status for a long period of time, with a healthy state demonstrated in the 1980s. Subsequently, due to the compound effect of multiple human pressures and imperfect management policies, the health status of the LZB ecosystem deteriorated and reached an unhealthy state in 2005. With the improvement of public awareness of environmental protection and the implementation of ecological renovation, its health status has rebounded, showing a subhealthy state.
The key factors affecting the health of the LZB ecosystem are mostly pressure indicators, including the amount of agricultural chemical fertilizer entering the sea, reclamation area, the discharge of domestic sewage and industrial wastewater, etc. The scenario analysis indicates that land-based pollutant discharge, particularly agricultural non-point source pollution, has a more significant impact than the construction of reclamation projects. Consequently, eliminating the impacts of the above indicators will help to improve and restore the LZB ecosystem health.
This study is an initial attempt to develop a comprehensive indicator framework incorporating “physical-chemical-biological-social” coupling factors for the assessment of ecosystem health in LZB. The research outcomes provide theoretical basis and practical guidance for the reasonable management of LZB ecosystem, and may also serve as references for the ecosystem health assessment of other bays if necessary.
It should be noted that some indicators are difficult to quantify due to data availability and temporal continuity limitations. Thus, they are not included in the indicator framework (e.g., seawater intrusion area, marine oil spill area, fish biomass, sediment quality, the proportion of capital investment for marine environmental protection in GDP, public participation, etc.). Additionally, the LZB area is divided by many administrative regions, making it difficult to carry out unified statistics. The average values of selected 51 counties (districts and county-level cities) in 14 cities of Shandong Province (Section 2) are used as the data of land area indicators; however, the responsibility sharing of each region for the health evolution of LZB ecosystem has not been considered yet. These issues are expected to be addressed in future research.
Data availability statement
The original contributions presented in the study are included in the article/Supplementary Material. Further inquiries can be directed to the corresponding author.
Author contributions
WW: Conceptualization, Data curation, Formal analysis, Validation, Visualization, Writing -original draft, review & editing. JH: Investigation, Software, Data curation, Formal analysis, Writing -original draft. DS: Conceptualization, Visualization, Review, Funding acquisition. All authors contributed to the article and approved the submitted version.
Funding
This paper was financially supported by the National Natural Science Foundation of China (U1706215 and 41806132), the National Key Research and Development Program of China (2018YFC1407602), the Special Funds for Taishan Scholar Project (No. tsqn202211056), and the Fundamental Research Funds for the Central Universities of China (202042008).
Acknowledgments
The authors would like to thank Prof. Shengkang Liang and Prof. Keqiang Li from Ocean University of China for their constructive suggestions and data collection, as well as indicator ranking experts for their participation and support. Furthermore, the authors are grateful to the reviewers of this paper.
Conflict of interest
The authors declare that the research was conducted in the absence of any commercial or financial relationships that could be construed as a potential conflict of interest.
Publisher’s note
All claims expressed in this article are solely those of the authors and do not necessarily represent those of their affiliated organizations, or those of the publisher, the editors and the reviewers. Any product that may be evaluated in this article, or claim that may be made by its manufacturer, is not guaranteed or endorsed by the publisher.
Supplementary material
The Supplementary Material for this article can be found online at: https://www.frontiersin.org/articles/10.3389/fmars.2023.1115896/full#supplementary-material
References
Aguirre-Rubí J., Luna-Acosta A., Ortiz-Zarragoitia M., Zaldibar B., Izagirre U., Ahrens M. J., et al. (2018). Assessment of ecosystem health disturbance in mangrove-lined Caribbean coastal systems using the oyster Crassostrea rhizophorae as sentinel species. Sci. Total Environ. 618, 718–735. doi: 10.1016/j.scitotenv.2017.08.098
Baek S. H., Son M., Kim D., Choi H.-W., Kim Y.-O. (2014). Assessing the ecosystem health status of Korea Gwangyang and Jinhae bays based on a planktonic index of biotic integrity (P-IBI). Ocean Sci. J. 49 (3), 291–311. doi: 10.1007/s12601-014-0029-2
Borja Á., Elliott M., Andersen J. H., Berg T., Carstensen J., Halpern B. S., et al. (2016). Overview of integrative assessment of marine systems: The ecosystem approach in practice. Front. Mar. Sci. 3. doi: 10.3389/fmars.2016.00020
Borja Á., Franco J., Muxika I. (2003). Classification tools for marine ecological quality assessment: the usefulness of macrobenthic communities in an area affected by a submarine outfall. In ICES CM 2003/Session J-02 Tallinn (Estonia), 24–28 September, 2003.
Cai L. Z. (2003). Macrozoobenthos pollution index (MPI). Acta Scientiae Circumstantiae 23 (5), 625–629. doi: 10.13671/j.hjkxxb.2003.05.012. (in Chinese)
Chen M. H., Chen F. (2021). Evaluation and analysis of ecosystem health of the coastal zone in Zhanjiang Bay based on the DPSIR model. Environ. Dev. 33 (2), 18–23+30. doi: 10.16647/j.cnki.cn15-1369/X.2021.02.003. (in Chinese)
China Shandong Network (2020) Nearly half of china’s marine science and technology talents gather in Shandong. Available at: http://news.sdchina.com/show/4551572.html (Accessed November 13 2022). (in Chinese)
Choi B. H., Kim K. O., Lee H. S., Yuk J. H. (2010). Perturbation of regional ocean tides due to coastal dikes. Continental Shelf Res. 30 (6), 553–563. doi: 10.1016/j.csr.2009.09.009
Costanza R. (2012). Ecosystem health and ecological engineering. Ecol. Eng. 45, 24–29. doi: 10.1016/j.ecoleng.2012.03.023
Ding X. S., Shan X. J., Chen Y. L., Jin X. S., Yuan Z. H., Yang T. (2018). Study on the change rate of shoreline based on digital coastal analysis system (DSAS): taking the shoreline of the Yellow River Delta and Laizhou Bay as an example. Mar. Sci. Bull. 37 (5), 565–575. (in Chinese)
Dong J. (2019). Evaluation and empirical analysis of marine ecological civilization construction in China: Shandong Province as a case study (Qingdao: Ocean University of China). (in Chinese)
Editorial Committee of Biological Volume in General Editorial Committee of China Agricultural Encyclopedia (1991). China Agricultural Encyclopedia· Biology Volume (Beijing: Agricultural Publishing House). (in Chinese)
Epstein P. R. (1999). “Large marine ecosystem health and human health,” in The Gulf of Mexico large marine ecosystem: assessment, sustainability, and management, vol. 417-438. (S.l: Blackwell Science).
Epstein P. R., Ford T. E., Puccia C., Possas C. A. (1994). Marine ecosystem health-implications for public-health. Ann. New York Acad. Sci. 740:13–23. doi: 10.1111/j.1749-6632.1994.tb19850.x
European Environment Agency (EEA) (2005). EEA core set of indicators-guide, EEA technical report no 1/2005 (Luxembourg: Office for Official Publications of the European Communities).
Feng S. Z., Li F. Q., Li S. J. (1999). Introduction to marine science (Beijing: Higher Education Press). (in Chinese)
First Institute of Oceanography in State Oceanic Administration (2007). Specifications for oceanographic survey-part 9: Guidelines for marine ecological survey (GB/T 12763.9-2007) (Beijing: General Administration of Quality Supervision, Inspection and Quarantine of the People’s Republic of China). (in Chinese)
Gao Y. X., Zhang G. Z. (1996). Current situation and prospect of poultry industry in Shandong Province. China Poultry 4, 31–33. (in Chinese)
Gray J. S. (1981). Detecting pollution induced changes in communities using the log-normal distribution of individuals among species. Mar. Pollut. Bull. 12 (5), 173–176. doi: 10.1016/0025-326X(81)90230-7
Halpern B. S., Longo C., Hardy D., McLeod K. L., Samhouri J. F., Katona S. K., et al. (2012). An index to assess the health and benefits of the global ocean. Nature 488, 615–620. doi: 10.1038/nature11397
Hammond A. (1995). Environmental indicators: A systematic approach to measuring and reporting on environmental policy performancee in the context of sustainable development Vol. 43 (Washington, DC: World Resources Institute).
Hao Y. J., Wang Z. L., Zhu M. Y., Li R. X., Sun P. X., Xia B., et al. (2005). Investigation and assessment of nutrients and phytoplankton diversity in the Laizhou Bay. Adv. Mar. Sci. 23 (2), 197–204. (in Chinese)
He G. S., Wang X. H., Zhou Y. P. (2009). Research on environmental legislation of Bohai Sea based on regional economic development (Beijing: China Ocean Press). (in Chinese)
Hu Z. J., Shan X. J., Yang T., Ding Q. (2020). Preliminary evaluation of summer fishing moratorium in the Bohai Sea. Prog. Fishery Sci. 41 (5), 13–21. doi: 10.19663/j.issn2095-9869.20190623001
Huang J. T., Zheng W., Wan N. X., Lu J. F., Li J. (2021). Characteristics of changes occurring in the landscape patterns in the coastal wetlands of the Laizhou Bay in the last 30 years. Mar. Sci. 45 (2), 76–90. doi: 10.11759/hykx20191003001. (in Chinese)
Jiang H., Cui Y., Chen B. J., Chen J. F., Song Y. L. (2005). The variation trend of nutrient salts in the Bohai Sea. Mar. Fisheries Res. 26 (6), 61–67. (in Chinese)
Jiang H. C., Wang Y. J., Li J. H., Tao H. M., Bai Y. Y., Su B., et al. (2018). Annual variation and spatial distribution of nutrients in the Laizhou Bay. Mar. Pollut. Bull. 37 (4), 411–423. (in Chinese)
Kennedy A. D., Jacoby C. A. (1999). Biological indicators of marine environmental health: Meiofauna−A neglected benthic component? Environ. Monit. Assess. 54, 47–68. doi: 10.1023/A:1005854731889
Leppard G. G., Munawar M. (1992). The ultrastructural indicators of aquatic ecosystem health. J. Aquat. Ecosystem Health 1, 309–317. doi: 10.1007/BF00044172
Li G. L., Chen B. J., Cui Y., Ma S. S., Tang X. X. (2006). Ecological characteristics of phytoplankton in the Laizhou Bay. J. Fishery Sci. China 13 (2), 292–299. (in Chinese)
Li C., Chen L. G., He Z. S. (2020). Analysis of water quality change and causes of Xiaoqing River estuary in Laizhou Bay. Environ. Dev. 32 (11), 118–119+121. doi: 10.16647/j.cnki.cn15-1369/X.2020.11.054
Li G. L., Cui Y., Chen B. J., Chen J. F., Song Y. L., Guo F. (2007). Status and evaluation on nutrients in Laizhou Bay in autumn. Mar. Environ. Sci. 26 (1), 45–48+57.
Li Y. F., Song X. X., Wu Z. X., Yu Z. M. (2015). An integrated methodology for quantitative assessment on impact of human activities on marine ecosystems: A case study in Laizhou Bay, China. Oceanologia Et Limnologia Sin. 46 (1), 133–139. (in Chinese)
Li H., Song X. X., Yu Z. M., Liang Y. B., Wu Z. X. (2014). An integrative assessment of marine ecosystem health in coastal waters along the Shandong Peninsula. Mar. Sci. 38 (10), 40–45. (in Chinese)
Lin L., Li F. L., Chen X. Q., Huang J. W., Bu Q. W., Fu S. D. (2013). Characteristics of channel evolution and runoff temporal and spatial distribution in Hsiao-Ching River. Yellow River 35 (12), 77–79+82. (in Chinese)
Liu D. H., Gong W., Xing W. X., Li X. X., Ma X. J., Yu Y. (2015). Comprehensive method for determining the weights of vulnerability assessment indexes on islands and the coastal zone based on the AHP weight method and entropy weight method. Mar. Environ. Sci. 34 (3), 462–467. doi: 10.13634/j.cnki.mes.2015.03.024. (in Chinese)
Liu P., Zhang Z. H., Wang J. (2010). State of the coastal report of dongying Municipality, Shandong Province, People’s Republic of China (Beijing: China Ocean Press). (in Chinese)
Lu W. H., Zeng R., Xiang X. Q. (2013). Study of the marine ecological health assessment for the coastal area. Mar. Sci. Bull. 32 (5), 580–585. (in Chinese)
Lyu H., Song D., Zhang S., Wu W., Bao X. (2022). Compound effect of land reclamation and land-based pollutant input on water quality in Qinzhou Bay, China. Sci. Total Environ. 154183. doi: 10.1016/j.scitotenv.2022.154183
Ma X., Sun Y. H. (2021). Dynamic evaluation of tourism ecological security in the Yellow River basin based on DPSIR framework. Ecol. Economy 37 (12), 145–151+162.
Ma S. S., Xin F. Y., Cui Y., Qiao X. Y. (2004). Assessment of main pollution matter volume into the sea from Yellow River and Xiaoqing River. Mar. Fisheries Res. 25 (5), 47–51. (in Chinese)
Ma Y. X., Zang J. Y., Che H., Zheng L. L., Zhang B. T., Ran X. B. (2015). Trend and distributions of nutrient elements in the Huanghe (Yellow) River. Oceanologia Et Limnologia Sin. 46 (1), 140–147. (in Chinese)
Ma J. X., Zheng Z. H., Li Y. P., Xing H. Y., Liu Y. H. (2002). The distribution characteristics of phytoplankton in Laizhou Bay. Trans. Oceanology Limnology 4, 63–67. doi: 10.13984/j.cnki.cn37-1141.2002.04.011
Mallory M. L., Gilchrist H. G., Braune B. M., Gaston A. J. (2006). Marine birds as indicators of Arctic marine ecosystem health: Linking the northern ecosystem initiative to long-term studies. Environ. Monit. Assess. 113, 31–48. doi: 10.1007/s10661-005-9095-3
Niu M. X., Wang J., Xu B. D. (2017). Assessment of the ecosystem health of the Yellow River estuary based on the pressure-state-response model. Acta Ecologica Sin. 37 (3), 943–952. doi: 10.5846/stxb201508131702. (in Chinese)
Organization for Economic Co-operation and Development (OECD) (1993). OECD core set of indicators for environmental performance reviews-a synthesis report by the group on the state of the environment (Paris: OECD).
Organization for Economic Co-operation and Development (OECD) (2003). OECD environmental indicators-development, measurement and use (Nairobi: UNEP).
Padua S., Kripa V., Prema D., Mohamed K. S., Jeyabaskaran R., Kaladharan P., et al. (2023). Assessment of ecosystem health of a micro−level ramsar coastal zone in the Vembanad Lake, Kerala, India. Environ. Monit Assess. 195, 95. doi: 10.1007/s10661-022-10692-7
Park Y. G., Kim H. Y., Hwang J. H., Kim T., Park S., Nam J. H., et al. (2014). Dynamics of dike effects on tidal circulation around Saemangeum, Korea. Ocean Coast. Manage. 102, 572–582. doi: 10.1016/j.ocecoaman.2014.02.016
Project Team of “Research on Monitoring and Controlling Technology of Economic Activities Around Bohai Sea Based on Environmental Carrying Capacity” (2016). Study on the overall control of pollution pressure and marine response around Bohai Sea (Beijing: China Ocean Press). (in Chinese)
Quan F., Zhu L. (2011). The methods of coastal ecosystem health assessment. J. Hainan Normal Univ. (Natural Science) 24 (2), 204–209. (in Chinese)
Ramos T. B., Alves I., Subtil R., de Melo J. J. (2007). Environmental performance policy indicators for the public sector: The case of the defence sector. J. Environ. Manage. 82, 410–432. doi: 10.1016/j.jenvman.2005.12.020
Rombouts I., Beaugrand G., Artigas L. F., Dauvin J. C. (2013). Evaluating marine ecosystem health: Case studies of indicators using direct observations and modelling methods. Ecol. Indic. 24, 353–365. doi: 10.1016/j.ecolind.2012.07.001
Saaty T. L. (1977). A scaling method for priorities in hierarchical structures. J. Math. Psychol. 15 (3), 234–281. doi: 10.1016/0022-2496(77)90033-5
Shandong Academy for Environmental Planning (2018). Research and practice on environmental protection strategy of Shandong Province during the “Twelfth five year plan” (Beijing: China Environment Publishing Group). (in Chinese)
Shandong Association for Science & Technology (1991). Study on the comprehensive treatment of Xiaoqing River (Jinan: Shandong Science and Technology Press).
Shi H., Zheng W., Ding D., Yang J. (2010). “Several views on the study of evaluation of marine ecosystem health in China,” in 2010 International Conference on Challenges in Environmental Science & Computer Engineering (Wuhan, China), 124–127. doi: 10.1109/CESCE.2010.252
Song D. B., Gao Z. Q., Zhang H., Xu F. X., Zheng X. Y., Ai J. Q., et al. (2017). GIS-based health assessment of the marine ecosystem in Laizhou Bay, China. Mar. pollut. Bull. 125, 242–249. doi: 10.1016/j.marpolbul.2017.08.027. (in Chinese)
Song N. Q., Wang N., Wu N., Lin W. N. (2018). Temporal and spatial distribution of harmful algal blooms in the Bohai Sea during 1952~2016 based on GIS. China Environ. Sci. 38 (3), 1142–1148. doi: 10.19674/j.cnki.issn1000-6923.2018.0136
Strokal M., Kroeze C., Wang M., Lin M. (2017). Reducing future river export of nutrients to coastal waters of China in optimistic scenarios. Sci. Total Environ. 579, 517–528. doi: 10.1016/j.scitotenv.2016.11.065
Sun Y. K. (2013). The study of jiaozhou bay ecological environment comprehensive evaluation method based on index of biotic integrity (Qingdao: University of Chinese Academy of Sciences (Institute of Oceanology). (in Chinese)
Tang Y. J., Yu S. X., Ke Z. J., He G. W., Gan E. C., He Z. F., et al. (2006). An evaluation on the environment condition of Zhanjiang mangrove nature reserves by the ABC curve method. J. Guangdong Educ. Institute 26 (3), 70–74. (in Chinese)
Tian J. Y., Mu J. B., Wang A. D. (1996). Study on water pollution and water quality management of Xiaoqing River basin in Shandong Province (Dongying: China University of Petroleum Press). (in Chinese)
United Nations Environment Programme (UNEP) (2006). Environmental indicators for north America (Nairobi: UNEP).
Vassallo P., Fabiano M., Vezzulli L., Sandulli R., Marques J. C., Jørgensen S. E. (2006). Assessing the health of coastal marine ecosystems: A holistic approach based on sediment micro and meio-benthic measures. Ecol. Indic. 6 (3), 525–542. doi: 10.1016/j.ecolind.2005.07.003
Walker L. M., Montagna P. A., Hu X., Wetz M. S. (2021). Timescales and magnitude of water quality change in three Texas estuaries induced by passage of hurricane Harvey. Estuaries Coasts 44 (4), 960–971. doi: 10.1007/s12237-020-00846-6
Wang J. (2000). Study on population dynamics of phytoplankton in Laizhou Bay. Mar. Fisheries Res. 21 (3), 33–38. (in Chinese)
Wang Y., Mu X. J., Xu C. F. (2021). Preliminary study on marine ecological environment and pollution prevention in Laizhou Bay. Mar. Environ. Sci. 40 (6), 823–837. doi: 10.13634/j.cnki.mes.2021.06.003. (in Chinese)
Warwick R. M. (1986). A new method for detecting pollution effects on marine macrobenthic communities. Mar. Biol. 92, 557–562. doi: 10.1007/BF00392515
Wei F., Han G. X., Zhang J. P., Li Y. Z., Zhao J. M. (2018). Evolution of coastal wetlands under the influence of sea reclamation in bohai rim during 1985-2015. Chin. J. Ecol. 37 (5), 1527–1537. doi: 10.13292/j.1000-4890.201805.028. (in Chinese)
Wells R. S., Rhinehart H. L., Hansen L. J., Sweeney J. C., Townsend F. I., Stone R., et al. (2004). Bottlenose dolphins as marine ecosystem sentinels: Developing a health monitoring system. EcoHealth 1, 246–254. doi: 10.1007/s10393-004-0094-6
Whitfield A. K., Harrison T. D. (2008). Fishes as indicators of estuarine health and estuarine importance. Encyclopedia Ecol. 2, 1593–1599. doi: 10.1016/B978-008045405-4.00104-X
Wiegand J., Raffaelli D., Smart J. C. R., White P. C. L. (2010). Assessment of temporal trends in ecosystem health using a holistic indicator. J. Environ. Manage. 91, 1446–1455. doi: 10.1016/j.jenvman.2010.02.004
Wu Z., Chen R. S. (2019). A comparative analysis of the ocean health index and the Pressure-State-Response evaluation methods for Shanghai’s ocean ecosystem health. J. East China Normal Univ. (Natural Science) 4, 174–187. (in Chinese)
Wu W., Yan S., Feng R., Song D., Chen X. (2017). Development of an environmental performance indicator framework to evaluate management effectiveness for jiaozhou bay coastal wetland special marine protected area, Qingdao, China. Ocean Coast. Manage. 142, 71–89. doi: 10.1016/j.ocecoaman.2017.03.021
Xie E. N. (2009). Pre-warning system research for bay ecosystem health-the case of Laizhou Bay (Qingdao: Ocean University of China) (in Chinese).
Xin M., Wang B. D., Xie L. P., Sun X., Wei Q. S., Liang S. K., et al. (2019). Long-term changes in nutrient regimes and their ecological effects in the Bohai Sea, China. Mar. Pollut. Bull. 146, 562–573. doi: 10.1016/j.marpolbul.2019.07.011
Xinhua News Agency (2019) Opinions of the CPC central committee and the state council on establishing and supervising the implementation of the territorial spatial planning system. Available at: http://www.gov.cn/zhengce/2019-05/23/content_5394187.htm (Accessed December 22 2020).
Xiong H., Weng Z. L. (2015). The influence of factor input and institutional innovation on grain production of eastern, central and western regions–—Based on comparative analysis of Shandong, Jiangxi and Sichuan Province. Chin. Agric. Sci. Bull. 31 (1), 258–264. (in Chinese)
Xu Y. (2012). The marine ecosystem Dalian Haiwang nine islands (Dalian: Dalian Maritime University). (in Chinese)
Xu Y., Gao H., Wei X., Zhu J. L. (2021). The effects of reclamation activity and Yellow River runoff on coastline and area of the Laizhou Bay, China. J. Ocean Univ. China 20 (3), 729–739. doi: 10.1007/s11802-021-4746-8. (in Chinese)
Xu S., Ma Z. W. (2017). Sustainable development evaluation of marine economy based on the DPSIR model–a case study of the Bohai rim region. Mar. Economy 8 (3), 28–35. doi: 10.19426/j.cnki.cn12-1424/p.2017.04.004
Xu X. M., Shi J., Ling X. (2013). Study of the current legal document management in Bohai (Beijing: People’s Publishing House).
Yang F. (2018). Human activity intensity and the ecological effects of coastal wetland in Laizhou Bay (Qingdao: Qingdao Technological University). (in Chinese)
Yang J. Q., Cui W. L., Zhang H. L., Xu Z. J. (2003). Marine ecosystem health structure and function index assessment in the West of Laizhou Bay. Mar. Sci. Bull. 22 (5), 58–63. (in Chinese)
Ye Z. Y. (2003). On the choice of the methods of the positive and dimensionless indexes in multi-index comprehensive evaluation. Zhejiang Stat 4, 25–26. (in Chinese)
Ye S. Y., Xie L. J., He L. (2021). Wetlands: The kidney of the earth, the boat of life (Beijing: China Science Press). (in Chinese)
Yu F. J., Dong J. X., Xu F. X. (2016). China Coastal Sea areas: Marine disasters (Beijing: China Ocean Press). (in Chinese)
Yu W. W., Zhang D., Liao J. J., Ma L., Zhu X. F., Zhang W. T., et al. (2022). Linking ecosystem services to a coastal bay ecosystem health assessment: A comparative case study between Jiaozhou Bay and Daya Bay, China. Ecol. Indic. 135, 108530. doi: 10.1016/j.ecolind.2021.108530
Zhang P. Y. (2005). Studies on ecology of zoobenthos and environmental quality assessment in coastal waters of Bohai Bay (Qingdao: Ocean University of China). (in Chinese)
Zhang J. (2013). Health assessment of benthic habitat based on the biotic index in Laizhou Bay and its adjacent waters (Qingdao: Ocean University of China). (in Chinese)
Zhang X. (2013). Spatio-temporal variability of principal pollutants in Laizhou Bay in near 30 years and establishment of evaluation index system in water of Xiaoqing River Estuary (Qingdao: Ocean University of China). (in Chinese)
Zhang A. J., Gao Z. H., Liu Y. T. (2007). “The main impact of land-based pollution on the offshore environment and management countermeasures,” in 2007 national advanced seminar and exchange on water pollution control, treatment, ecological restoration technology and emergency treatment system construction for sudden water pollution accidents (Shanghai: Chinese Society of Environmental Sciences), 108–112.
Zhang C., Hu R. F. (2019). Chinese farmers’ pesticide use: Behavior characteristics, health impacts and driving factors (Beijing: Beijing Institute of Technology Press). (in Chinese)
Zhang Y., Li S. W., Lü Z. B., Ma Y. Q., Liu Y. J., Wei Z. H., et al. (2013). Application of polychaete in ecological environment evaluation of Laizhou Bay. Acta Ecologica Sin. 33 (8), 2522–2530. doi: 10.5846/stxb201207311086. (in Chinese)
Zhang Z. R., Li B. Q., Wang F. D. (2003). Study on the evaluation and countermeasures of Xiaoqing River comprehensive treatment (Jinan: Shandong Science and Technology Press). (in Chinese)
Zhang M., Lu Q. Y., Wang D. W., Ding D. S., Cui Z. G., Shi H. H. (2022). Spatiotemporal evolution of nutrients and the influencing factors in Laizhou Bay over the past 40 years. Mar. Pollut. Bull. 184, 114186. doi: 10.1016/j.marpolbul.2022.114186. (in Chinese)
Zhang H. L., Yang J. Q., Cui W. L. (2006). Status of salinity changes and the effect on marine environments and ecosystem in Laizhou Bay. Mar. Environ. Sci. 25 (S1), 11–14. (in Chinese)
Zhang X. J., Zhao S. (2018). Relationship between phytoplankton community and environmental factors in western Laizhou Bay. J. Dalian Ocean Univ. 33 (4), 532–538. doi: 10.16535/j.cnki.dlhyxb.2018.04.019. (in Chinese)
Zhao P., Jiang W. S., Mao X. Y., Gao H. W., Guo X. Y. (2010). Salinity change and influencing factor in the Laizhou Bay from 2000 to 2005. Oceanologia Et Limnologia Sin. 41 (1), 12–23. (in Chinese)
Zhao Z. Y., Kong L. H. (2000). Environmental status quo and protection countermeasures in Bohai marine areas. Res. Environ. Sci. 13 (2), 23–27. doi: 10.13198/j.res.2000.02.26.zhaozhy.008. (in Chinese)
Zhao Y. T., Liu X., Li J. H., Tao H. M., Sun S., Ma Y. Q. (2016). Distribution and seasonal variation in nutrients in Laizhou Bay. Mar. Environ. Sci. 35 (1), 95–99. doi: 10.13634/j.cnki.mes.2016.01.015. (in Chinese)
Zhao M., Yu J., Chen P. M., Feng X., Nie Y. K. (2015). Research advances in assessment of bay ecosystem health. J. Anhui Agric. Sci. 43 (35), 8–11. doi: 10.13989/j.cnki.0517-6611.2015.35.004. (in Chinese)
Zheng T., You X. Y. (2013). Assessment of marine ecosystem health of Tianjin offshore, China. Oceanological Hydrobiological Stud. 42 (4), 442–450. doi: 10.2478/s13545-013-0100-0. (in Chinese)
Keywords: marine ecosystem health assessment, DPSIR-based indicator framework, evolution trend, key influencing factors, Laizhou Bay
Citation: Wu W, Hu J and Song D (2023) Assessment of marine ecosystem health and its key influencing factors in Laizhou Bay, China. Front. Mar. Sci. 10:1115896. doi: 10.3389/fmars.2023.1115896
Received: 04 December 2022; Accepted: 20 February 2023;
Published: 09 March 2023.
Edited by:
Guanqiong Ye, Zhejiang University, ChinaReviewed by:
Huang Honghui, South China Sea Fisheries Research Institute (CAFS), ChinaPeriyadan K. Krishnakumar, King Fahd University of Petroleum and Minerals, Saudi Arabia
Copyright © 2023 Wu, Hu and Song. This is an open-access article distributed under the terms of the Creative Commons Attribution License (CC BY). The use, distribution or reproduction in other forums is permitted, provided the original author(s) and the copyright owner(s) are credited and that the original publication in this journal is cited, in accordance with accepted academic practice. No use, distribution or reproduction is permitted which does not comply with these terms.
*Correspondence: Dehai Song, c29uZ2RoQG91Yy5lZHUuY24=