 Chao Zhan†
 Qing Wang
 Lin Zeng
 Cheng Dong
- Institute of Coastal Research, Ludong University, Yantai, China
Historically, the river course and coastline of the Yellow River Delta changed frequently, and many studies focused on these change trends and their driving forces. Few studies have explored the influence of historical river channels and historical coastlines on the response of modern landscape patterns. This study examines the impact of channel migration and coastline evolution on the modern landscape pattern of historical subdeltas and coastal wetlands, utilizing a combination of Geo-informatics and Remote Sensing images in 1989, 1998, 2009, and 2016. The results showed that: (1) Subdeltaic landscapes changed from 1998 to 2016, with slight changes in most landscape types in the Ancient Qing Shui Course Subdelta (AQSD), an increase in building sites by 17% in the Zhimai Course Subdelta (ZMSD), a decrease in the proportion of Phragmites/cogongrass communities by 15.8% in the Diao Kou Course Subdelta (DKSD), and domination by natural landscapes in the Modern Qing Shui Course Subdelta (MQSD). (2) Coastal wetlands also experienced changes, with an increase in cultivated land to 60% in the coastal wetlands of CWI, a decline in natural landscapes, and an increase in artificial landscapes in the coastal wetlands of CWII and CWIII, and domination by natural landscapes but an increase in salt fields and culture ponds by 3.45% in the coastal wetlands of CWIV. (3) Channel migration and coastline evolution influenced the direction of landscape succession, causing the landscape-type centroids in the entire delta to move eastward or northward. (4) Throughout the delta, the human tendency to live by rivers was observed. This was due to the availability of freshwater from these rivers, which led to the expansion of inhabited areas and man-made water bodies along the river banks. Channel migration and coastline evolution aggravated the salinization of coastal wetlands and promoted the salt industry and aquaculture in some estuaries of the Yellow River. In general, human activities play a dominant role in shaping the landscape pattern in the Yellow River Delta, but they were largely restricted to historical channel migration and historical coastline evolution.
1 Introduction
Landscape patterns consist of landscape elements or complexes, and refer to the way they are arranged spatially, including their types, quantities, and distribution. The purpose of exploring the evolution of landscape patterns is to explain the relationship between landscape patterns and ecological processes to infer the factors driving landscape change and to predict development trends (Zeng et al., 2011; Peng et al., 2015). In recent years, many studies of landscape patterns have focused on exploring the relationship between landscape patterns and ecological processes (Fu et al., 2010; Li et al., 2016; Li et al., 2017), the forces driving landscape patterns (Liu et al., 2014b; Cong et al., 2019), the influence of data sources on landscape pattern analysis (Ottinger et al., 2013; Liu et al., 2014a), and gradient analysis of landscape patterns (Wu et al., 2017; Tanner and Fuhlendorf, 2018). The research methods have involved the use of 2-dimensional (2D) and 3-dimensional (3D) landscape index analyses (Cao et al., 2015; Ding et al., 2017), the construction of numerical models (Wang et al., 2012; Yang et al., 2014), the use of buffer analyses (Zhao and Lu, 2017), and the use of moving split-window analyses (Liu et al., 2017).
The modern Yellow River Delta (YRD) is one of the youngest, most extensive, and most biodiverse estuarine coastal wetlands in China’s warm temperate region (Chu et al., 2006; Li et al., 2009; Li et al., 2013; Chen et al., 2016). In recent years, human activities, changes in the water and sediment of the Yellow River, and coastal erosion have impacted the landscape of the Yellow River Delta (YRD), leading to complex and dramatic changes in landscape types and an increased rate of landscape evolution. This makes the study of the evolution of the YRD’s landscape pattern significant (Ottinger et al., 2013; Meng et al., 2017; Cong et al., 2019). Currently, research on the landscape patterns of the Yellow River Delta (YRD) has mainly focused on quantifying the area and landscape index (Cabral and Costa, 2017), lacking sufficient clarity in the spatial expression of changes in the YRD’s landscape pattern. Moreover, many studies have analyzed the changes in the overall landscape pattern of the YRD (e.g., Chu et al., 2006; Ottinger et al., 2013; Cong et al., 2019). The impact of river and shoreline changes on the YRD landscape pattern is under-researched, particularly the impact of abandoned channels and shorelines. Studying their influence on the landscape pattern over time creates a scientific basis for future research on the evolution and driving forces of the YRD landscape pattern.
The Geo-informatic Tupu approach involves the use of a group of digitized maps, images, tables, or curves to reveal the internal structure of geographic elements and the rules of spatial differentiation (Chen et al., 2000; Qi and Chi, 2001). Graphics and historical data are two of its key features, and the Geo-informatic Tupu method can invert the geography of the past and can also predict some geographic phenomena in the future. Additionally, the combination of graphs and spectra using the Geo-informatic Tupu method can provide quantitative spatiotemporal information on the dynamic characteristics of landscape patterns (Qi and Chi, 2001; Chen et al., 2020). At present, the Geo-informatic Tupu approach is widely used in geographical research areas, including global change, regional development patterns, disaster impact, agriculture production, urban construction, development planning, and resource assessments (Chen et al., 2020). In summary, the application of the Geo-informatic Tupu method to the study of the landscape pattern in the YRD is a usable research method.
This study applied the Geo-informatic Tupu approach (Chen et al., 2000) to analyze the impact of river channels and coastline evolution on the evolution of landscape patterns in four historical subdeltas: AQSD (Ancient QingShui Course Subdelta), ZMSD (Zhimai Course Subdelta), DKSD (Diaokou Course Subdelta), and MQSD (Modern QingShui Course Subdelta). The influence of the historical river and coastline evolution on the modern landscape patterns provided an explanation of the mechanism driving the evolution of landscape patterns in the whole YRD.
2 Study area
The YRD is bordered by Bohai Bay to the north and Laizhou Bay to the east (Figures 1A, B). This delta developed as a result of frequent channel migration and sediment deposition (Cui and Li, 2011). Since the Yellow River shifted course from the South Yellow Sea to the Bohai Sea in 1855, the Yellow River has migrated many times (Xue, 1994). For example, from 1855 to 1889, alluvium deposited by the Yellow River formed the AQSD (Figure 1C). From 1929 to 1934, the Yellow River flowed southward into Laizhou Bay and formed the ZMSD (Figure 1C). From 1964 to 1976, it flowed northward into the Bohai Sea and formed the DKSD (Figure 1C). From 1976 to the present, the Yellow River has flowed eastward into Laizhou Bay, forming the MQSD (Figure 1C) (Xue, 1994; Wu et al., 2015; Ji et al., 2020). The modern YRD is composed of subdeltas that formed in different periods. Its coastline has also undergone significant changes. From 1855 to 1934, the northeastern and northern coastlines of the YRD advanced significantly towards the sea, while the eastern and southeastern coastlines of the YRD extended seaward to a lesser degree. From 1934 to 1959, the northeastern coastline protruded seaward, the northern coastline retreated landward due to severe wave erosion, and the eastern and southeastern coastline extended seaward due to deposition. From 1974 to 1988, the eastern and northeastern coastlines underwent significant seaward extension. From 1988 to 1998, the eastern coastline protruded seaward. The evolution of the river and coastline is primarily influenced by sedimentation, seawater erosion, and freshwater scouring, which can change the soil’s water content and salinity, which, in turn, impacts the vegetation coverage of the land surface.
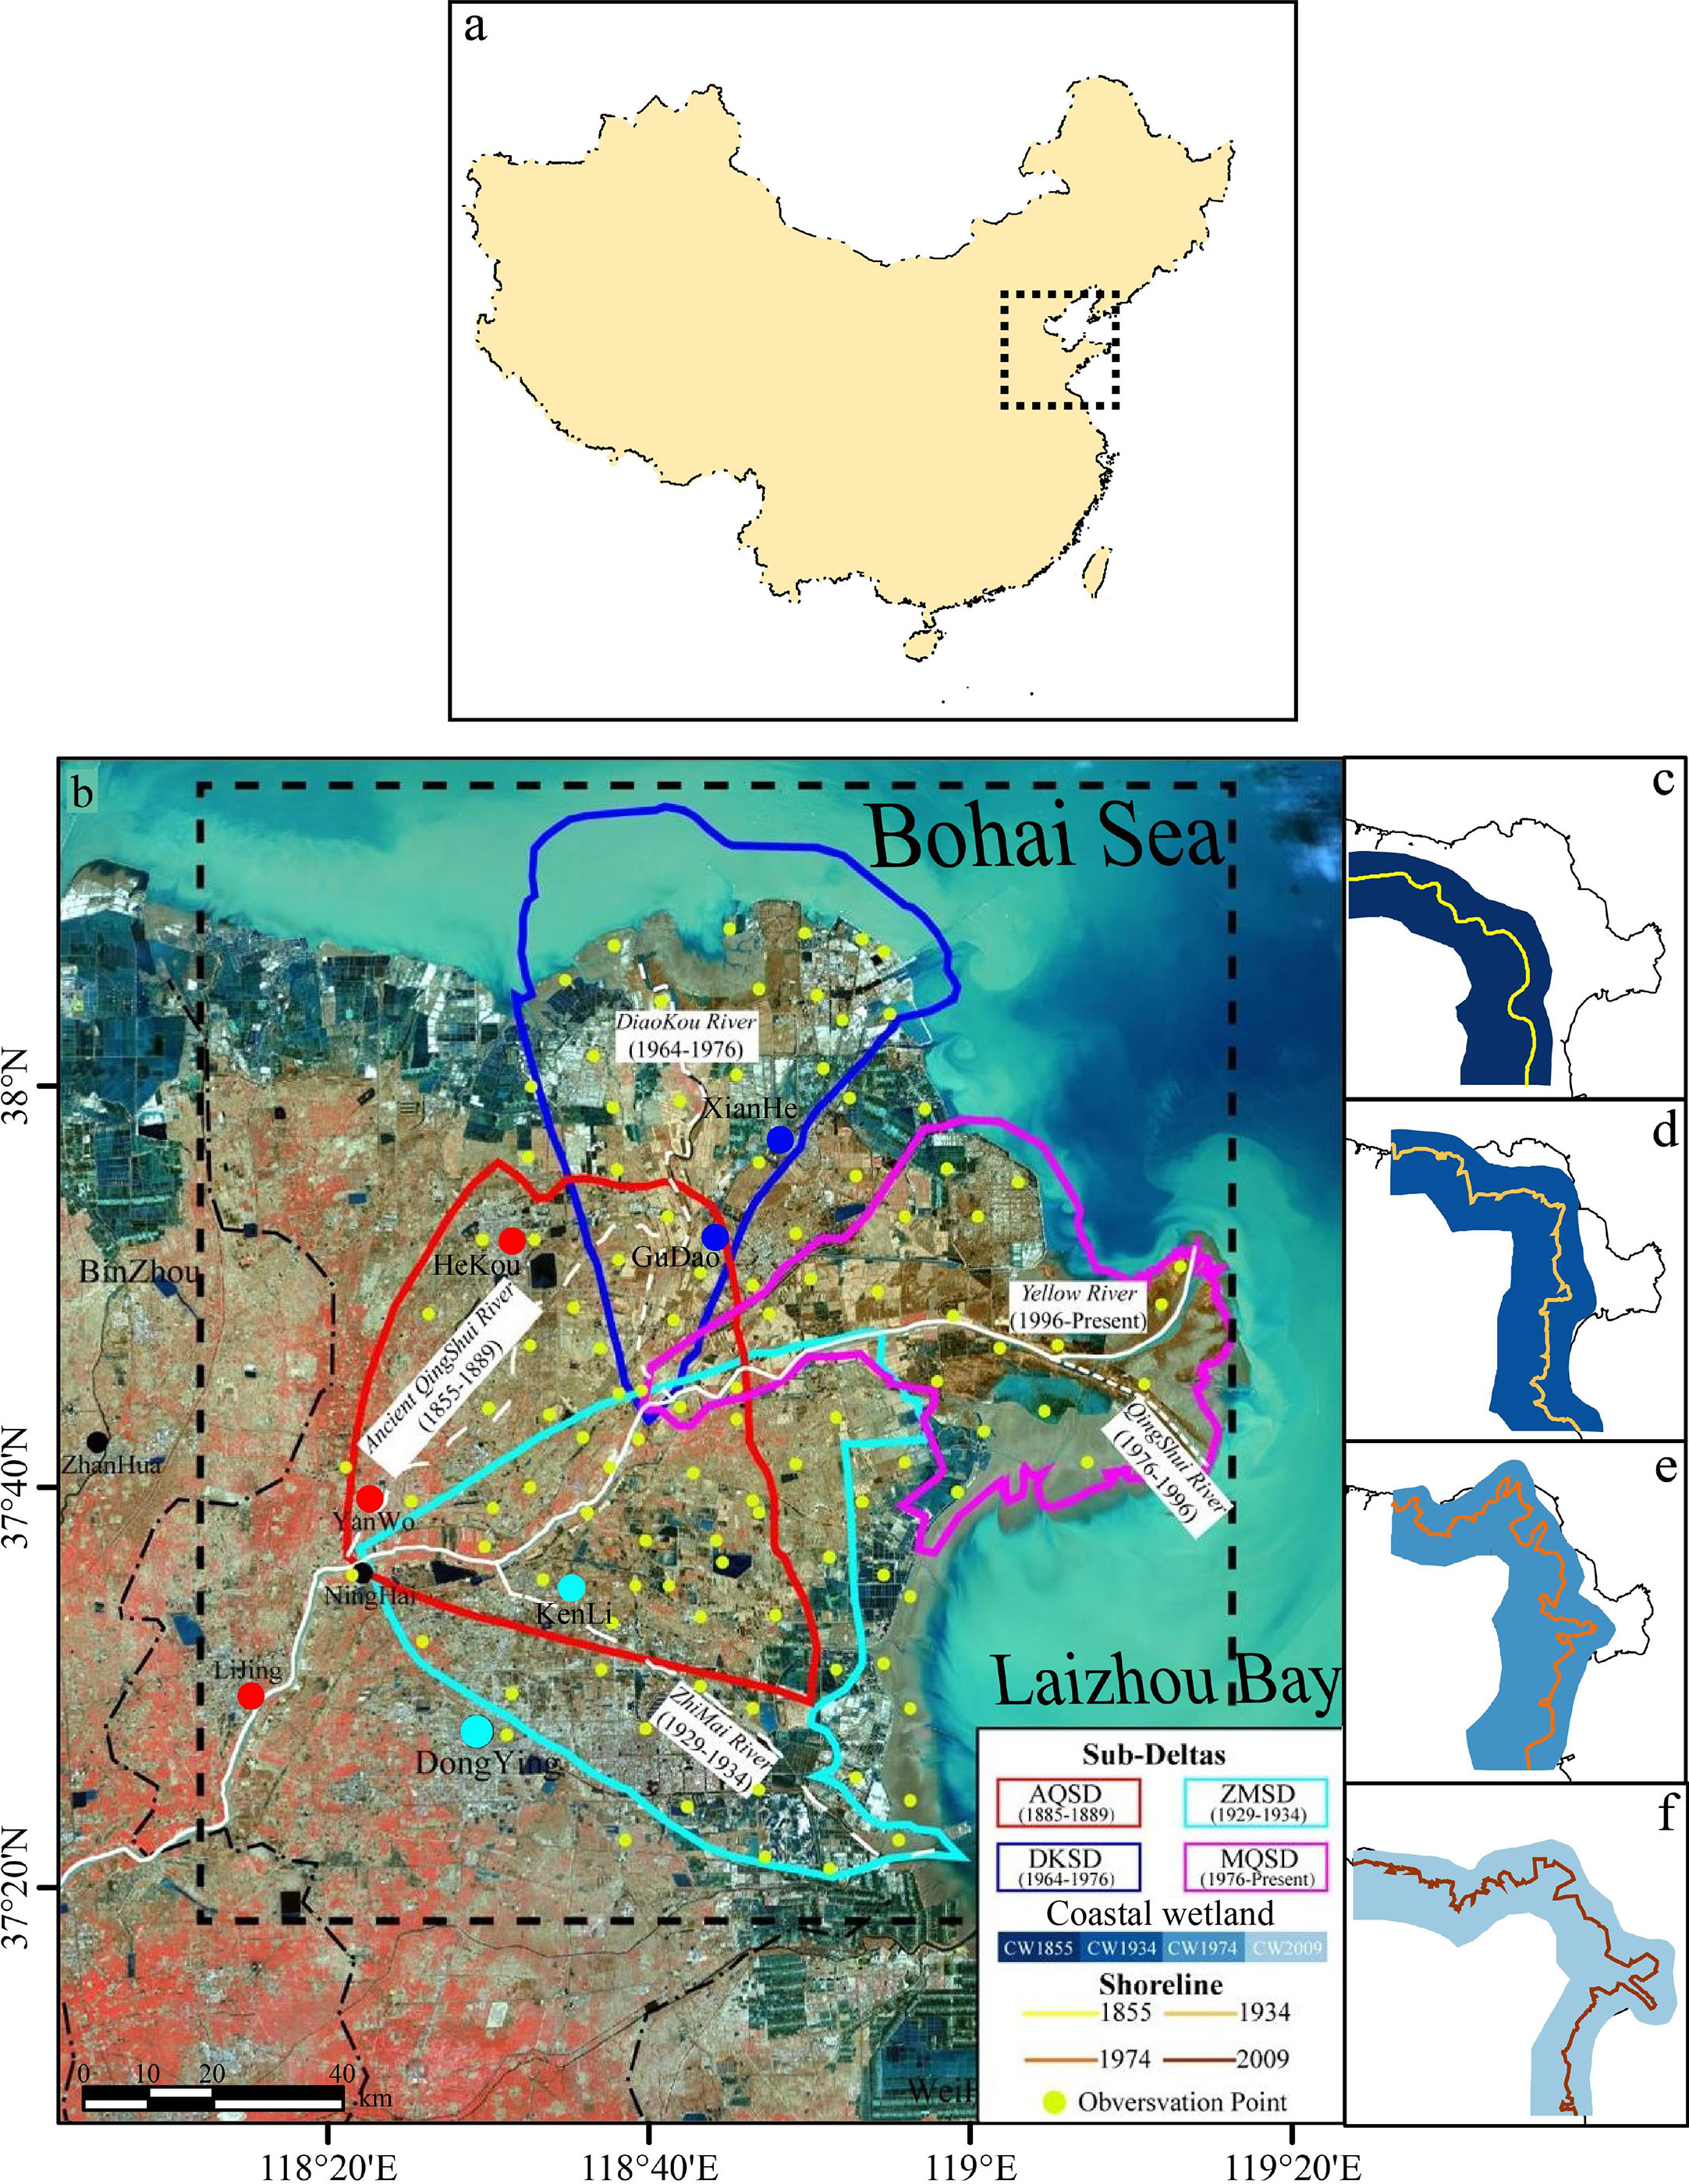
Figure 1 Geographical location of the study area (A, B) show the location of the study area in China; (C) shows the subdeltas of the Yellow River Delta that formed in different periods, including the Ancient QingShui Subdelta (AQSD), the Zhimai Subdelta (ZMSD), the DiaoKou Subdelta (DKSD), and the Modern QingShui Subdelta (MQSD); (D–F). show the shoreline and coastal wetlands of the Yellow River Delta in different periods, including the coastal wetlands of CWI, CWII, CWIII, and CWIV outlined by the shorline of 1855, 1934, 1974 and 2009, respectively.
In this study, we aim to investigate the impact of river channel and coastal changes on landscape patterns over approximately 30 years. To achieve this, we analyzed subdeltas that were formed during different periods, including AQSD (1855-1889), ZMSD (1929-1934), DKSD (1964-1976), and MQSD (2007-present) as shown in Figure 1. In particular, we focused on investigating the coastal wetlands at four crucial points in history, namely 1855, 1934, 1974, and 2009, in order to understand the evolution of coastal wetland landscapes. These study areas are referred to as Coastal Wetland I (CWI), Coastal Wetland II (CWII), Coastal Wetland III (CWIII), and Coastal Wetland IV (CWIV), respectively, each outlined by the shoreline of the corresponding year. To assist with statistical analysis, we defined buffer zones with 20 km landward and 10 km seaward boundaries, which encompass the coastal wetlands.
3 Data and methods
3.1 Data sources
In this section, the main operations are the geometric refinement of remote sensing imagery, vectorization of historical data, and landscape classification. The data utilized primarily include:
(1) Maps of the Yellow River channels, coastline, and subdeltas from 1855 to 1976 (Liu, 2003);
(2) A 1:50,000 topographic map from 1984;
(3) Field survey data from the YRD: in October 2016, a field trip to the YRD was conducted to collect landscape data from the 107 sites (the observation position is shown in Figure 1, and detailed information on the observation position is described in Table S1 of the Supplementary Materials);
(4) To evaluate the interdecadal scale changes in the YRD over the past 30 years, we selected remote sensing images with an interval of approximately 10 years. The remote sensing images used in this study were exclusively taken in September or October, due to the unique autumnal coloration of landscapes in the YRD that aids in landscape classification (Liu et al., 2018). Four remote sensing image datasets provided by the US Geological Survey (USGS) for 1989, 1998, 2009, and 2016 were finally selected as the data sources of the landscape classification (Figure 2 and Table 1).
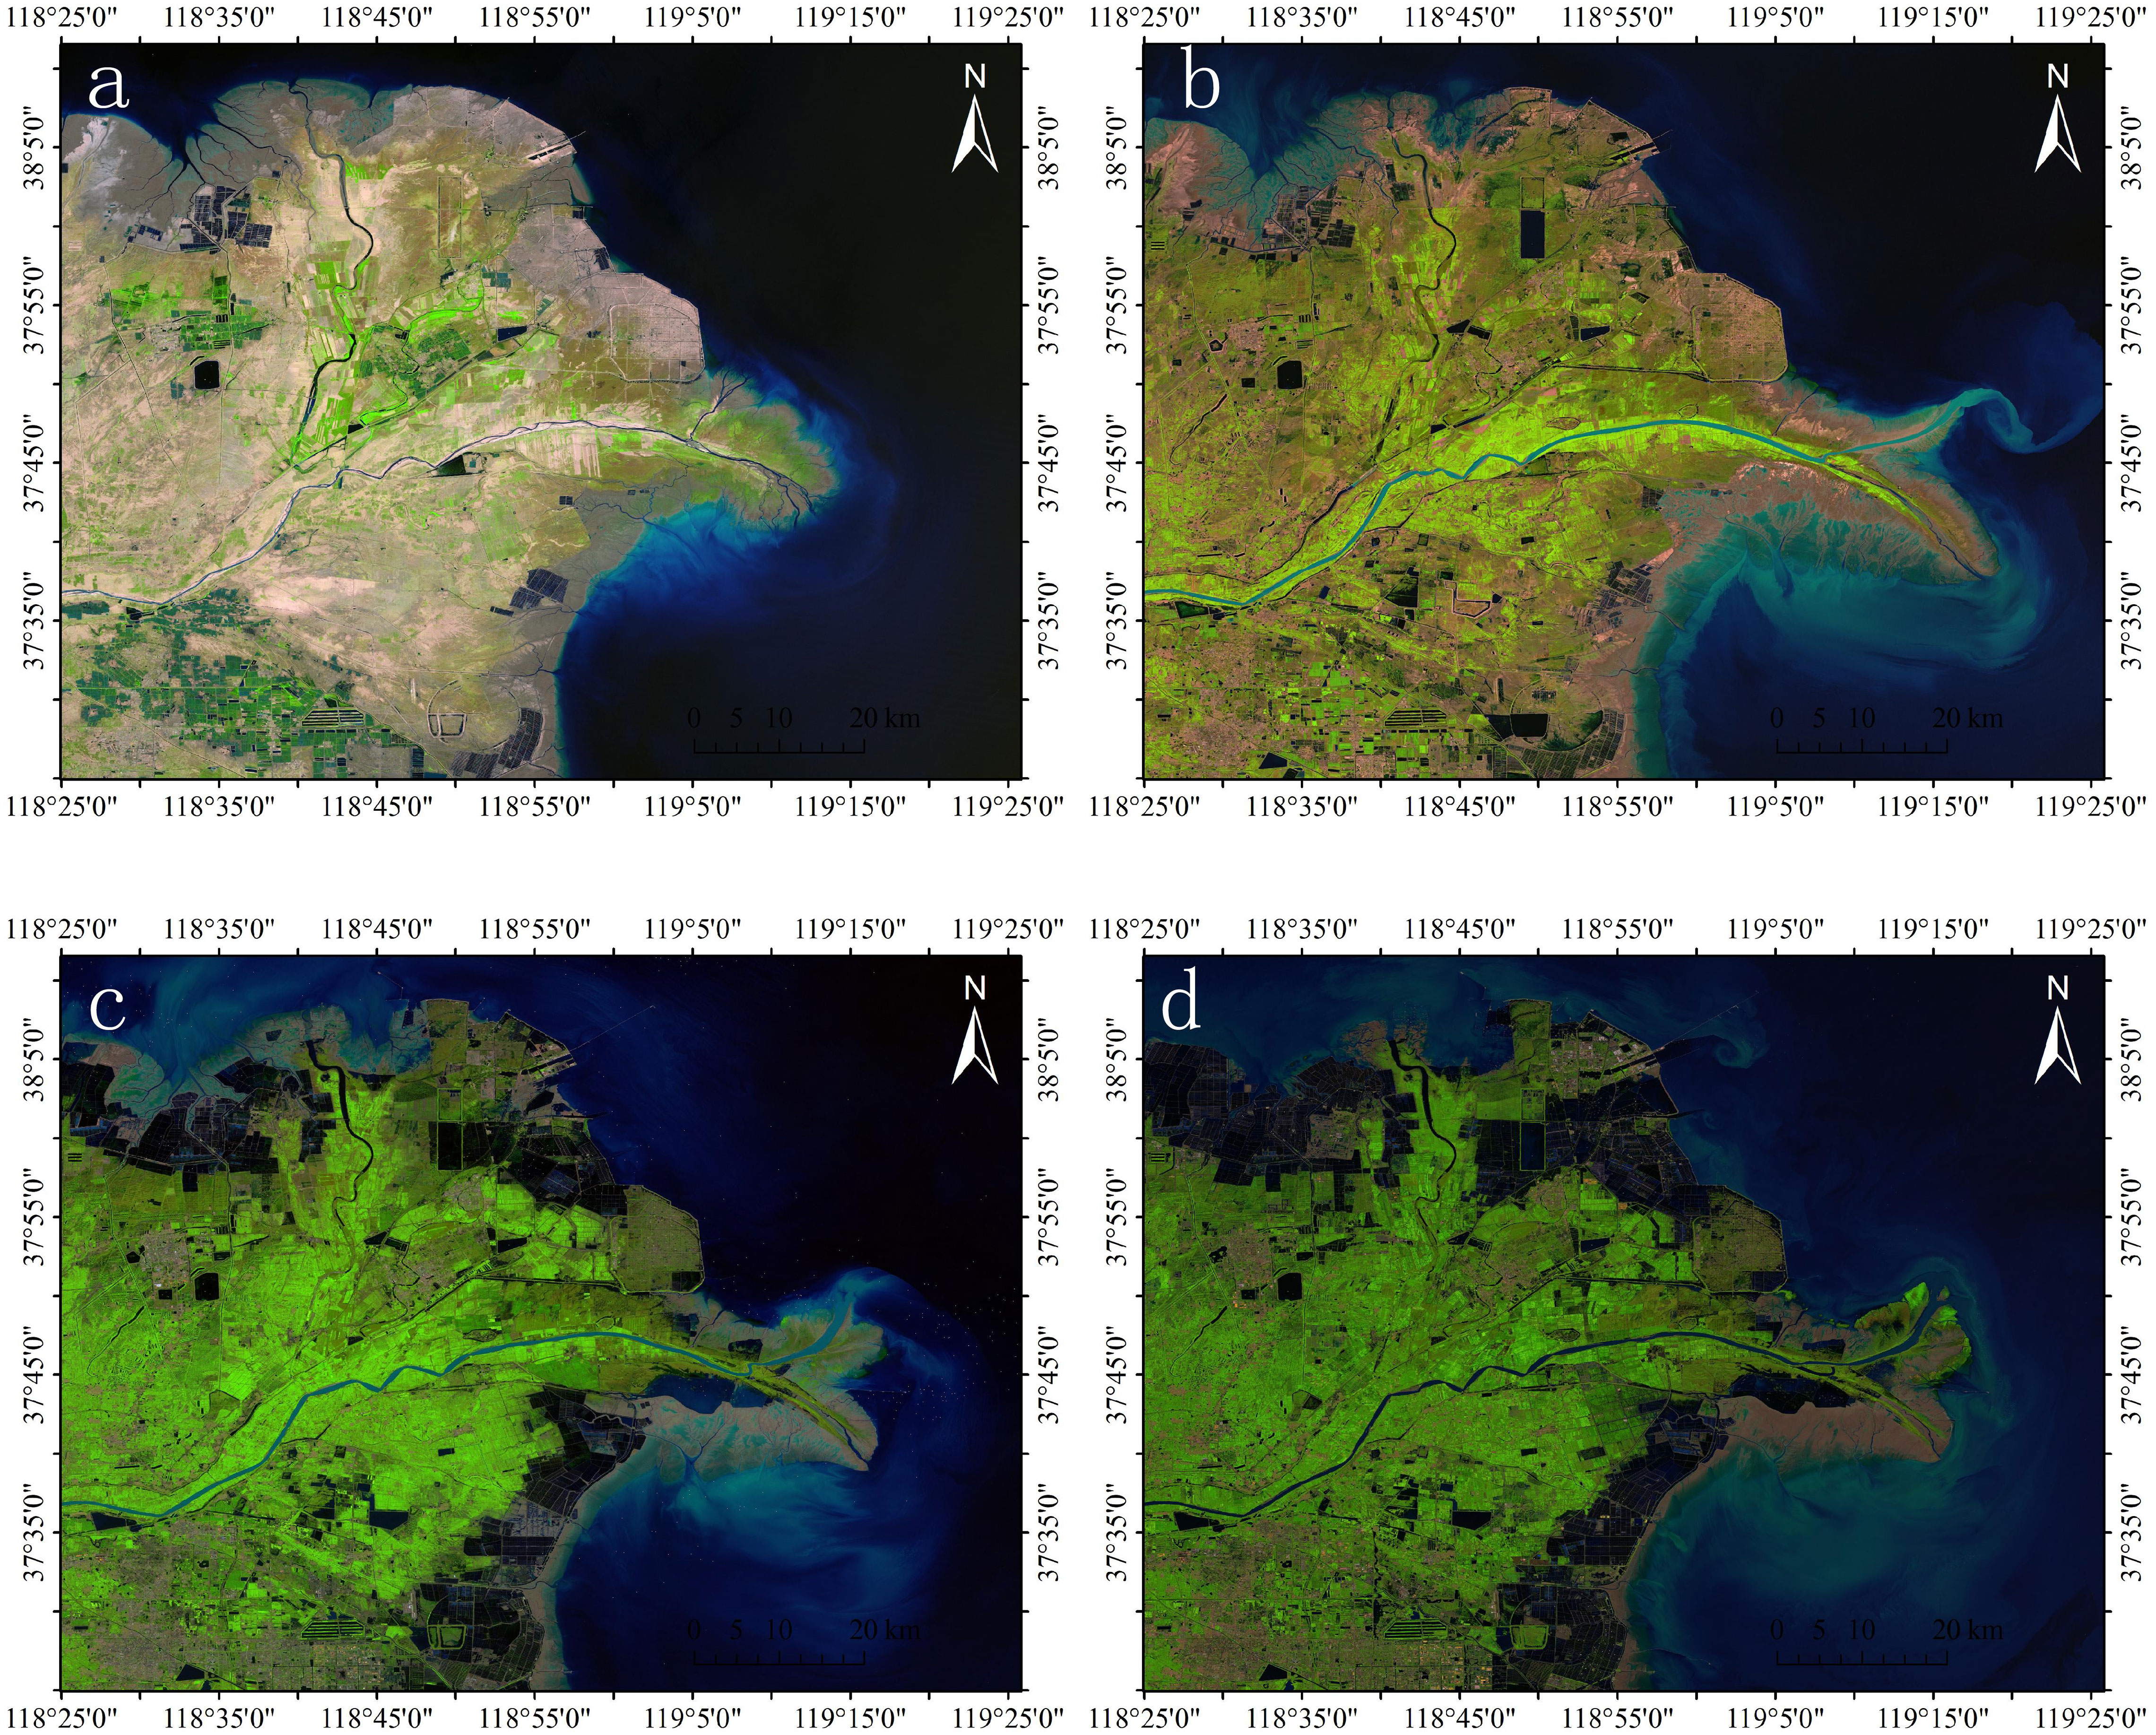
Figure 2 Remote Sensing Images in 1989 (A), 1998 (B), 2009 (C), and 2016 (D) obtained from the US Geological Survey (USGS).
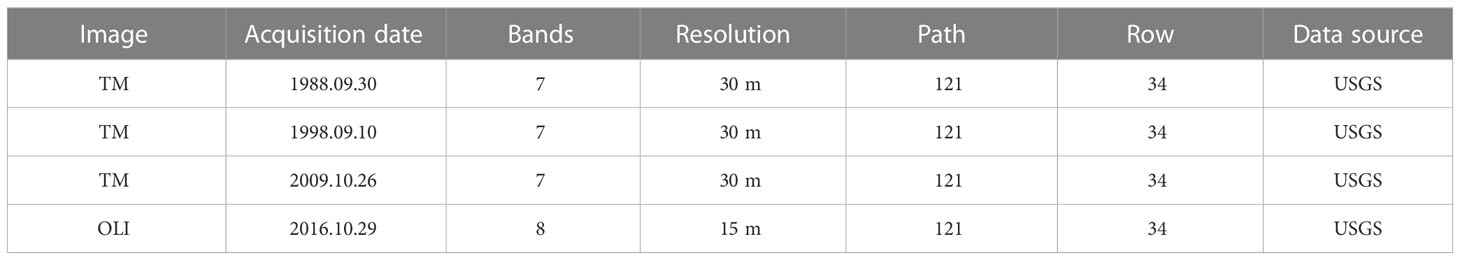
Table 1 List of images used in this research.
3.2 Data processing
Historical data related to the Yellow River, coastline, and subdelta distribution maps from 1855 to 1976 were digitally processed, georeferenced, and vectorized using ArcGIS. These results were then corrected using remote images and underwent various transformations, including projection transformation, geometric precision correction, data fusion, image resampling, and enhancement processing (Ottinger et al., 2013; Jiang et al., 2015). The processing of remotely sensed data was performed to obtain coastline data and enhance classification accuracy. The initial steps of processing, including radiometric calibration, geometric correction, cropping, and image enhancement, were performed on the remotely sensed data. Subsequently, the data underwent the KT transform and unsupervised classification, and the coastline was extracted using the instantaneous water boundary method.
The analysis of landscape-type centroids was utilized in this study to investigate the dynamic changes in various landscape types, which were automatically calculated in ArcGIS. By assessing the distribution of landscape types during each study period, the spatial trends in landscape changes could be determined (Fu et al., 2013). In the event that a landscape type experiences uniform changes in both area and spatial position, its center of mass remains relatively stable. However, if there is a substantial alteration in the area or spatial position in a single direction, the center of mass will exhibit a noticeable shift. The calculation of the area-weighted change in the center of mass of the landscape types allows for the evaluation of the pattern and trend of spatial change within the landscape. The migration of the landscape-type centroids was calculated in terms of distance and direction using measuring tools and the COGO toolbar in ArcGIS, respectively.
In recent years, the YRD region has seen an increase in soil salinization due to the impact of rising sea levels, fluctuations in groundwater levels, and a decrease in runoff from the Yellow River. This has resulted in more severe salinization and distinct spatial changes in the YRD. (Wang et al., 2018). Influenced by the migration of the Yellow River channel and coastline evolution, the salt content and water content in the soil vary greatly in different areas of the YRD and are the key factors determining the types of vegetation communities (Meng et al., 2016). Therefore, this study combined remote sensing images with field observation data and then classified the landscape types of the YRD into 9 categories according to the characteristics of the vegetation communities (Table 2).
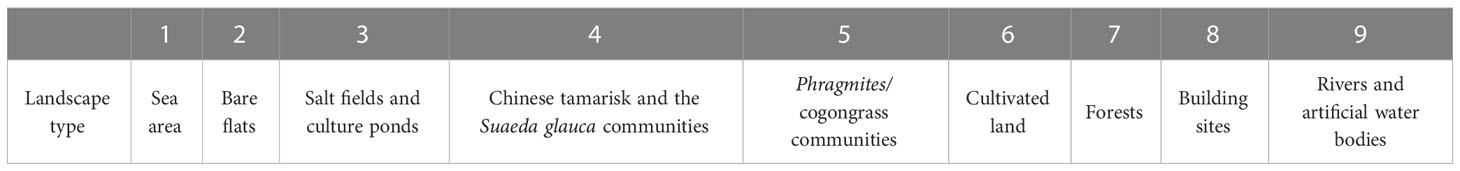
Table 2 The Yellow River Delta landscape classification scheme.
According to the definition of the landscape classification system above, this study applied the unsupervised classification method to the characteristics of the YRD to classify the information in the remote sensing images from four periods and then visually interpreted the classification results. First, field surveys (observation locations are shown in Figure 1) and land use survey data from the same period were used to verify the accuracy of the interpretation results in 2016, and the interpretation accuracy was 92.15%. Then, the landscape of the YRD was extracted from remote sensing images in 2009, 1998, and 1988 by the same method, and the use of land use survey data from the same periods for accuracy verification showed that the interpretation accuracy was 93.12%, 92.68%, and 90.12%, respectively (Table 3). The interpretation accuracy met the research requirements. Finally, the interpretation results of the four periods were divided according to the range of the subdelta and coastal wetlands to analyze the impact of the changes in the Yellow River channel and coastline on the landscape structure of the YRD.
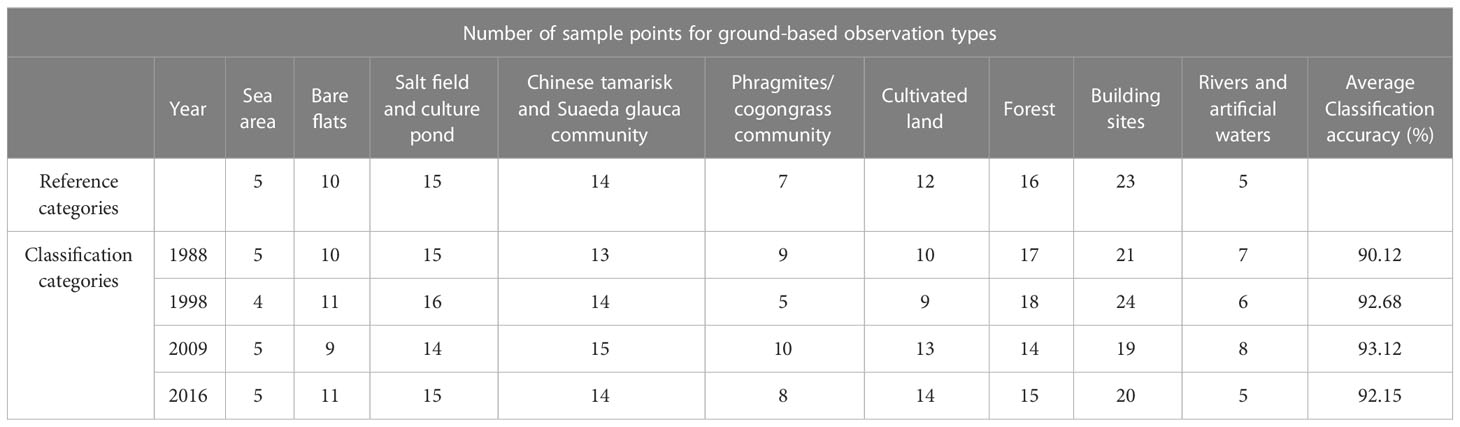
Table 3 Evaluation of classification accuracy.
This paper mainly explored the influence of the Yellow River channel and coastline evolution on the landscape pattern of the YRD according to the landscape characteristics and succession in the YRD. The subdeltas and coastal wetlands in the different periods were superimposed onto the landscape structure maps for 1988, 1998, 2009, and 2016. Then, we obtained the landscape pattern distribution of the subdeltas and coastal wetlands of the YRD in different periods (Figures 3, 4), and the ratio of the area of each landscape type to the total area was calculated. We obtained a map of the proportions of the total area of the subdelta and coastal wetland landscapes in the different periods (Figures 5, 6). We extracted the regional centroids of the subdelta and coastal wetland landscapes in the different periods, and then the regional centroid was integrated into a Geo-informatic Tupu to explore the landscape succession characteristics (Figures 7, 8).
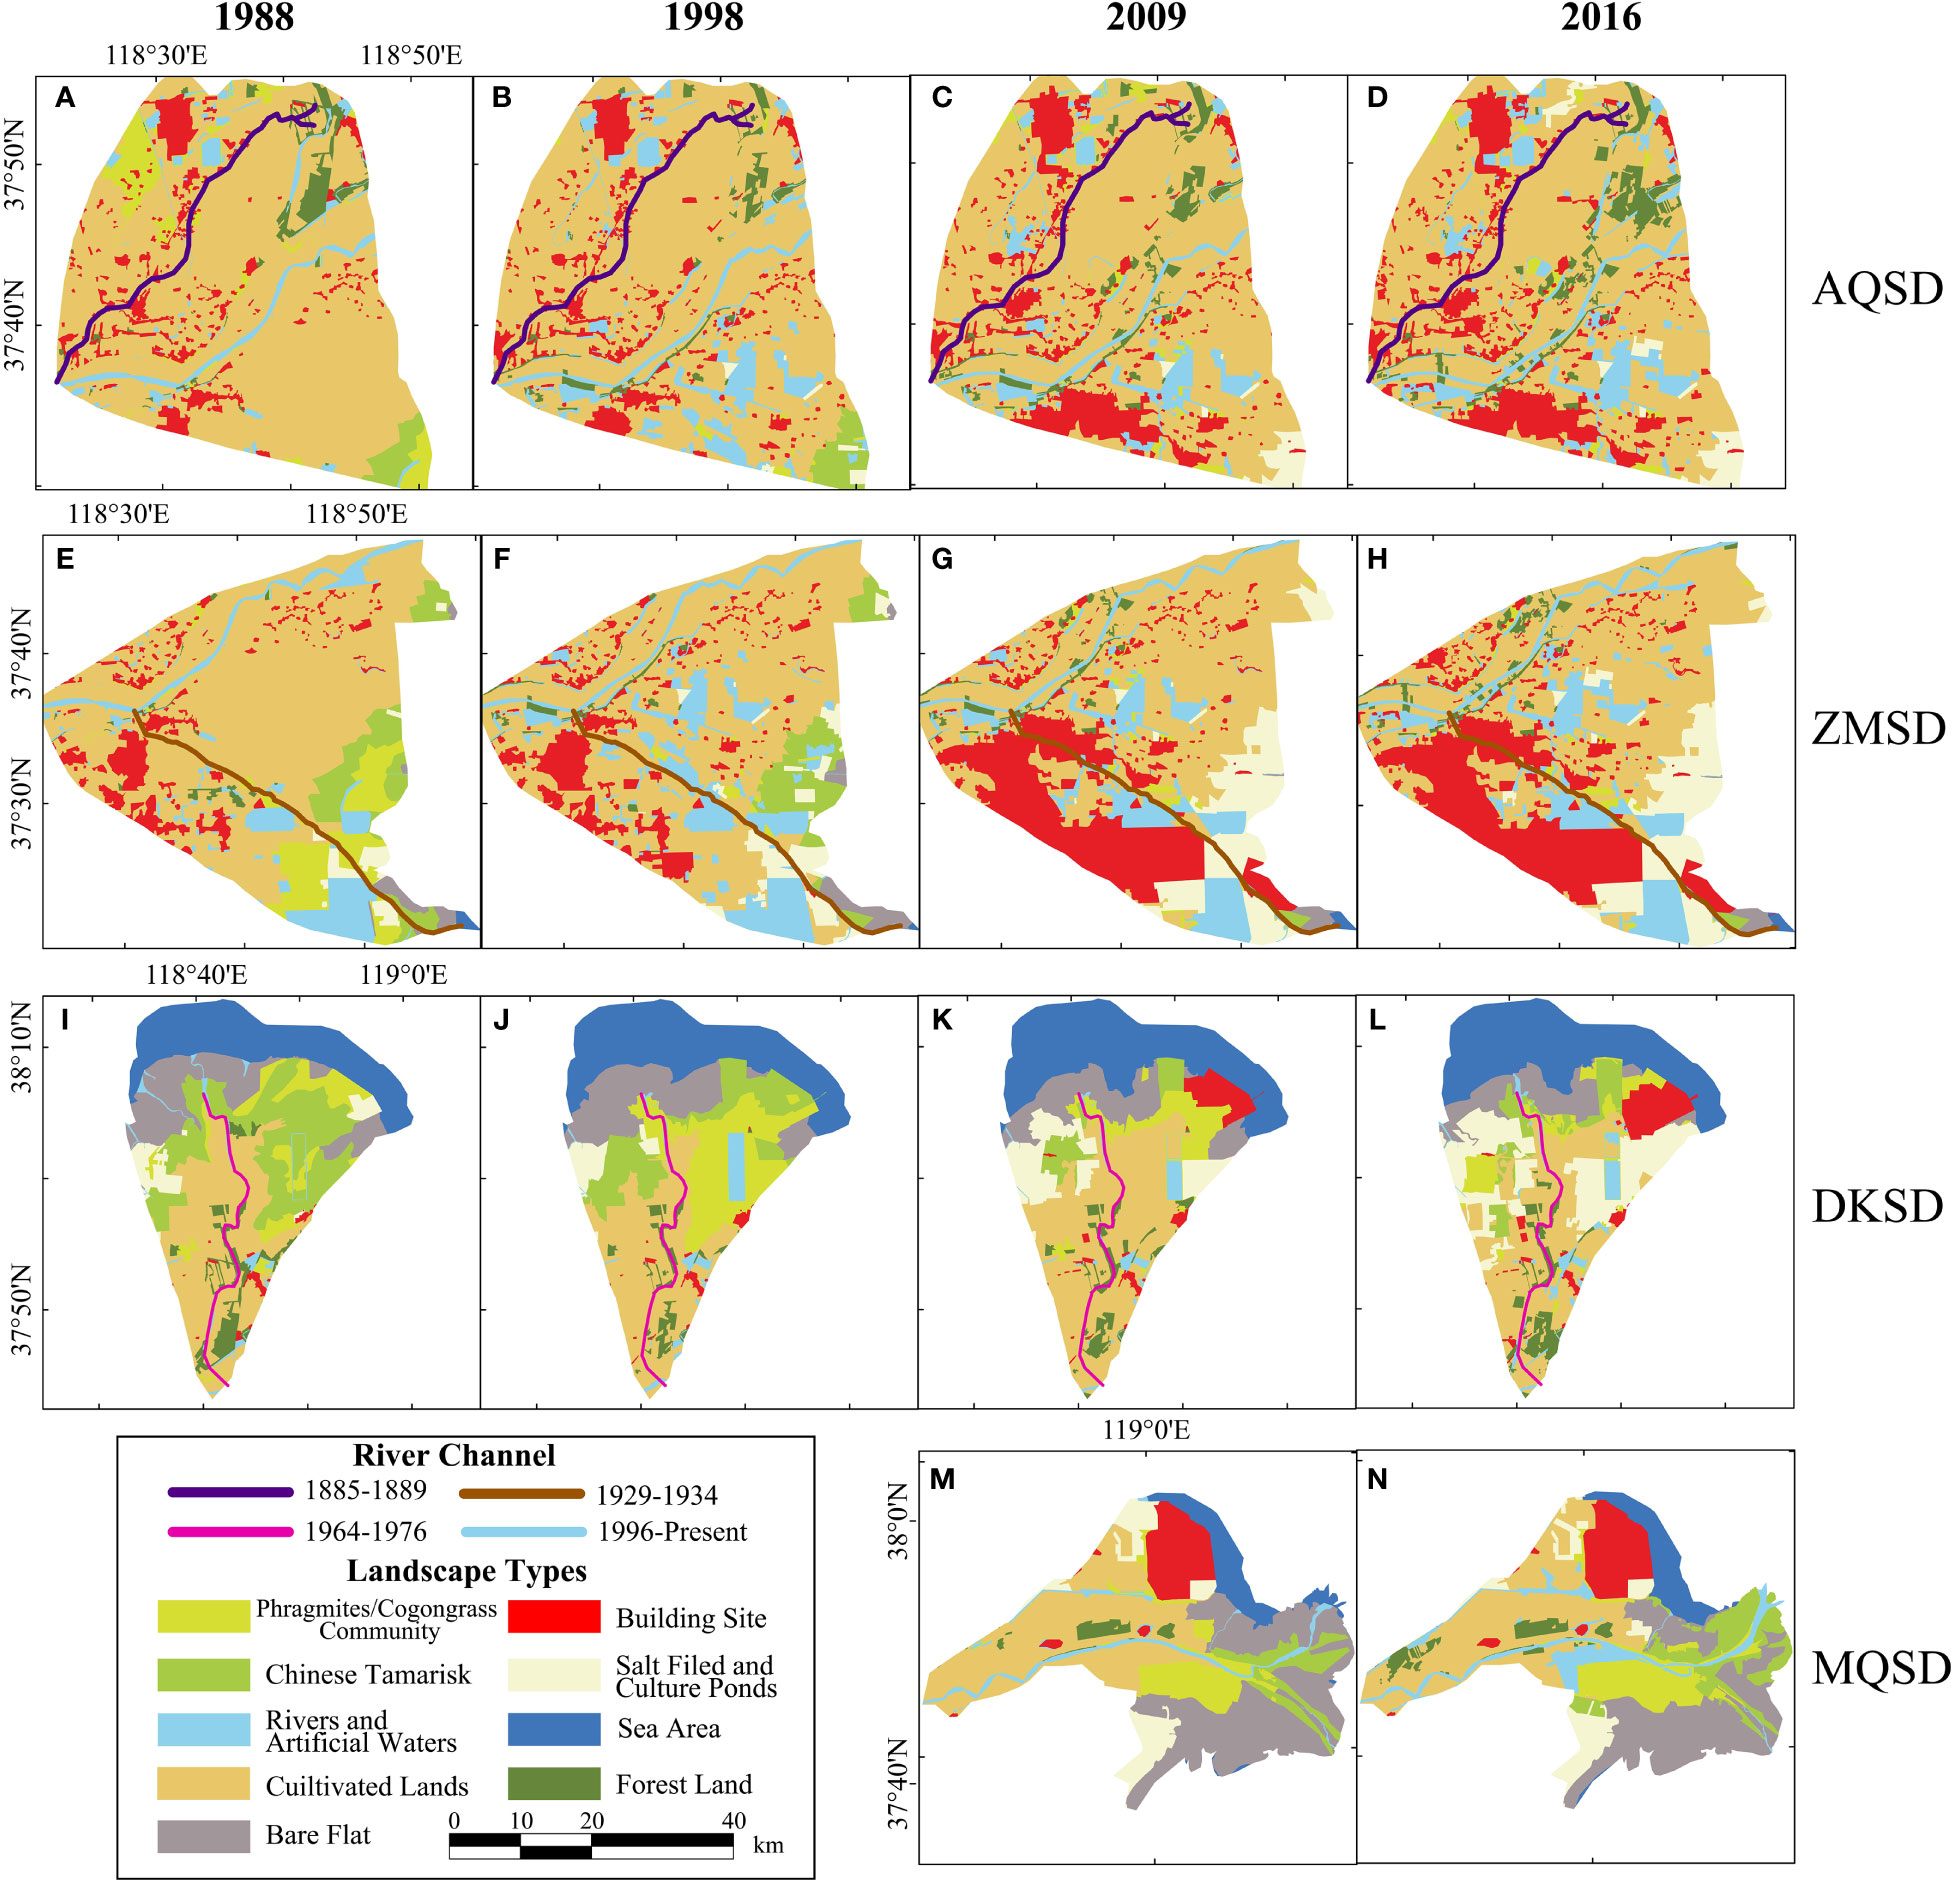
Figure 3 Maps of the distributions of the landscape types in the subdeltas AQSD (A-D), ZMSD (E-H), DKSD (I-L), and MQSD (M, N).
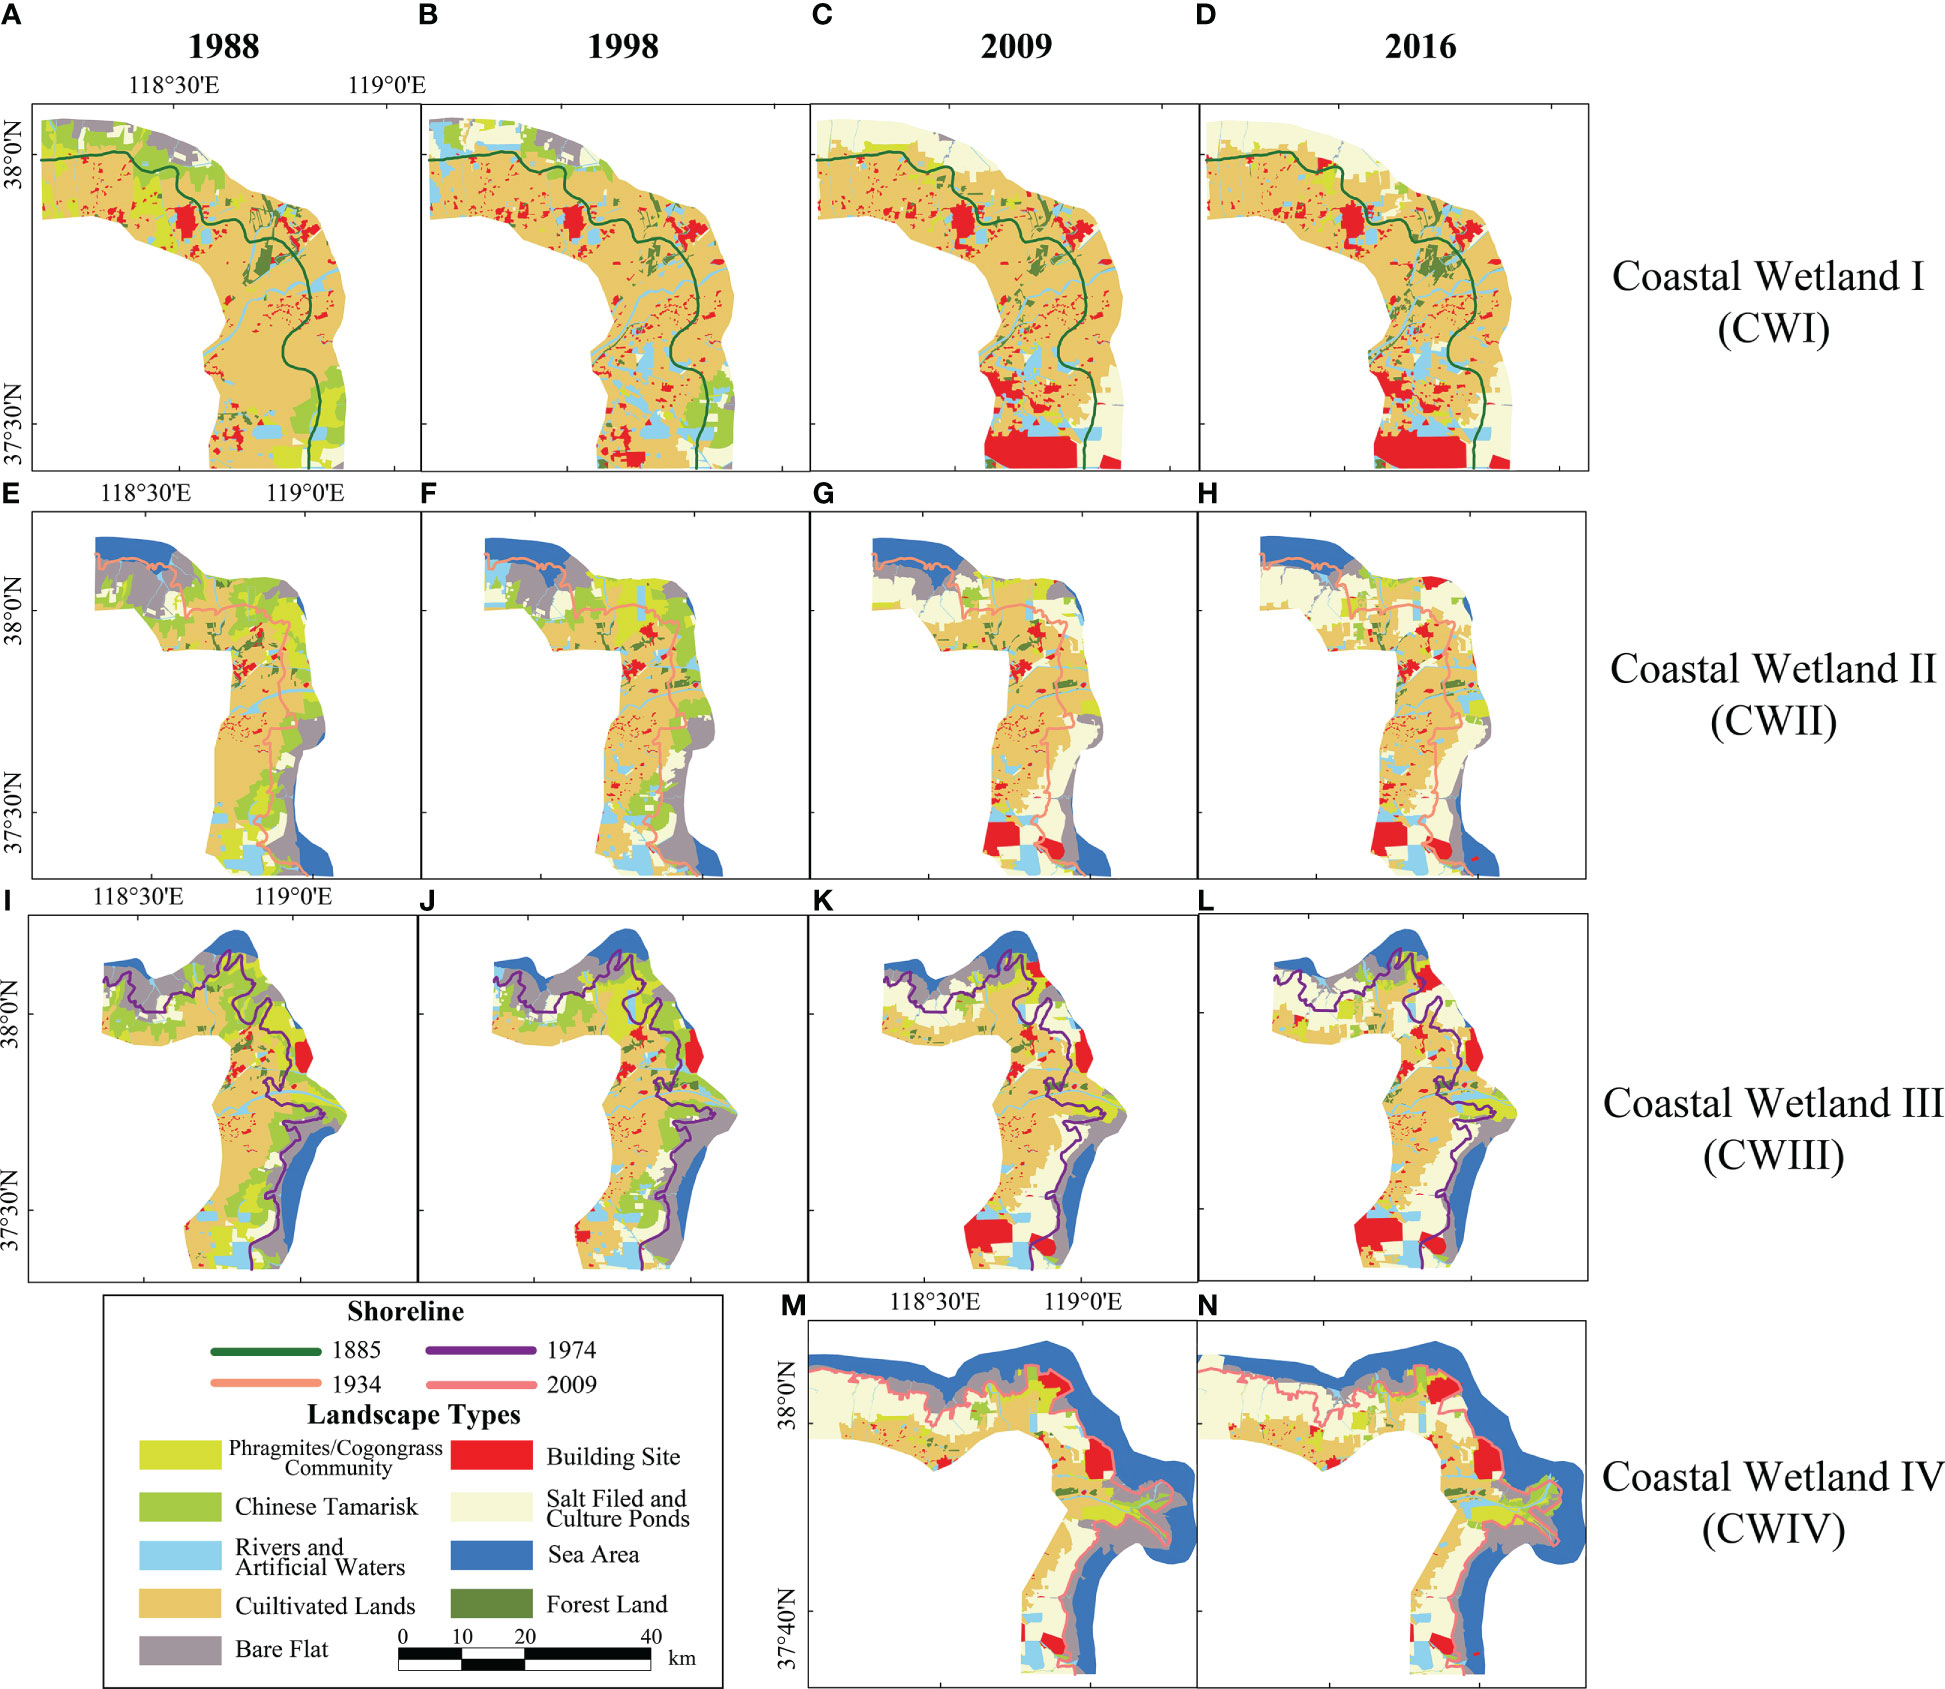
Figure 4 Maps of the distributions of the landscape types in coastal wetlands CWI (A-D), CWII (E-H), CWIII (I-L), and CWIV (M, N).
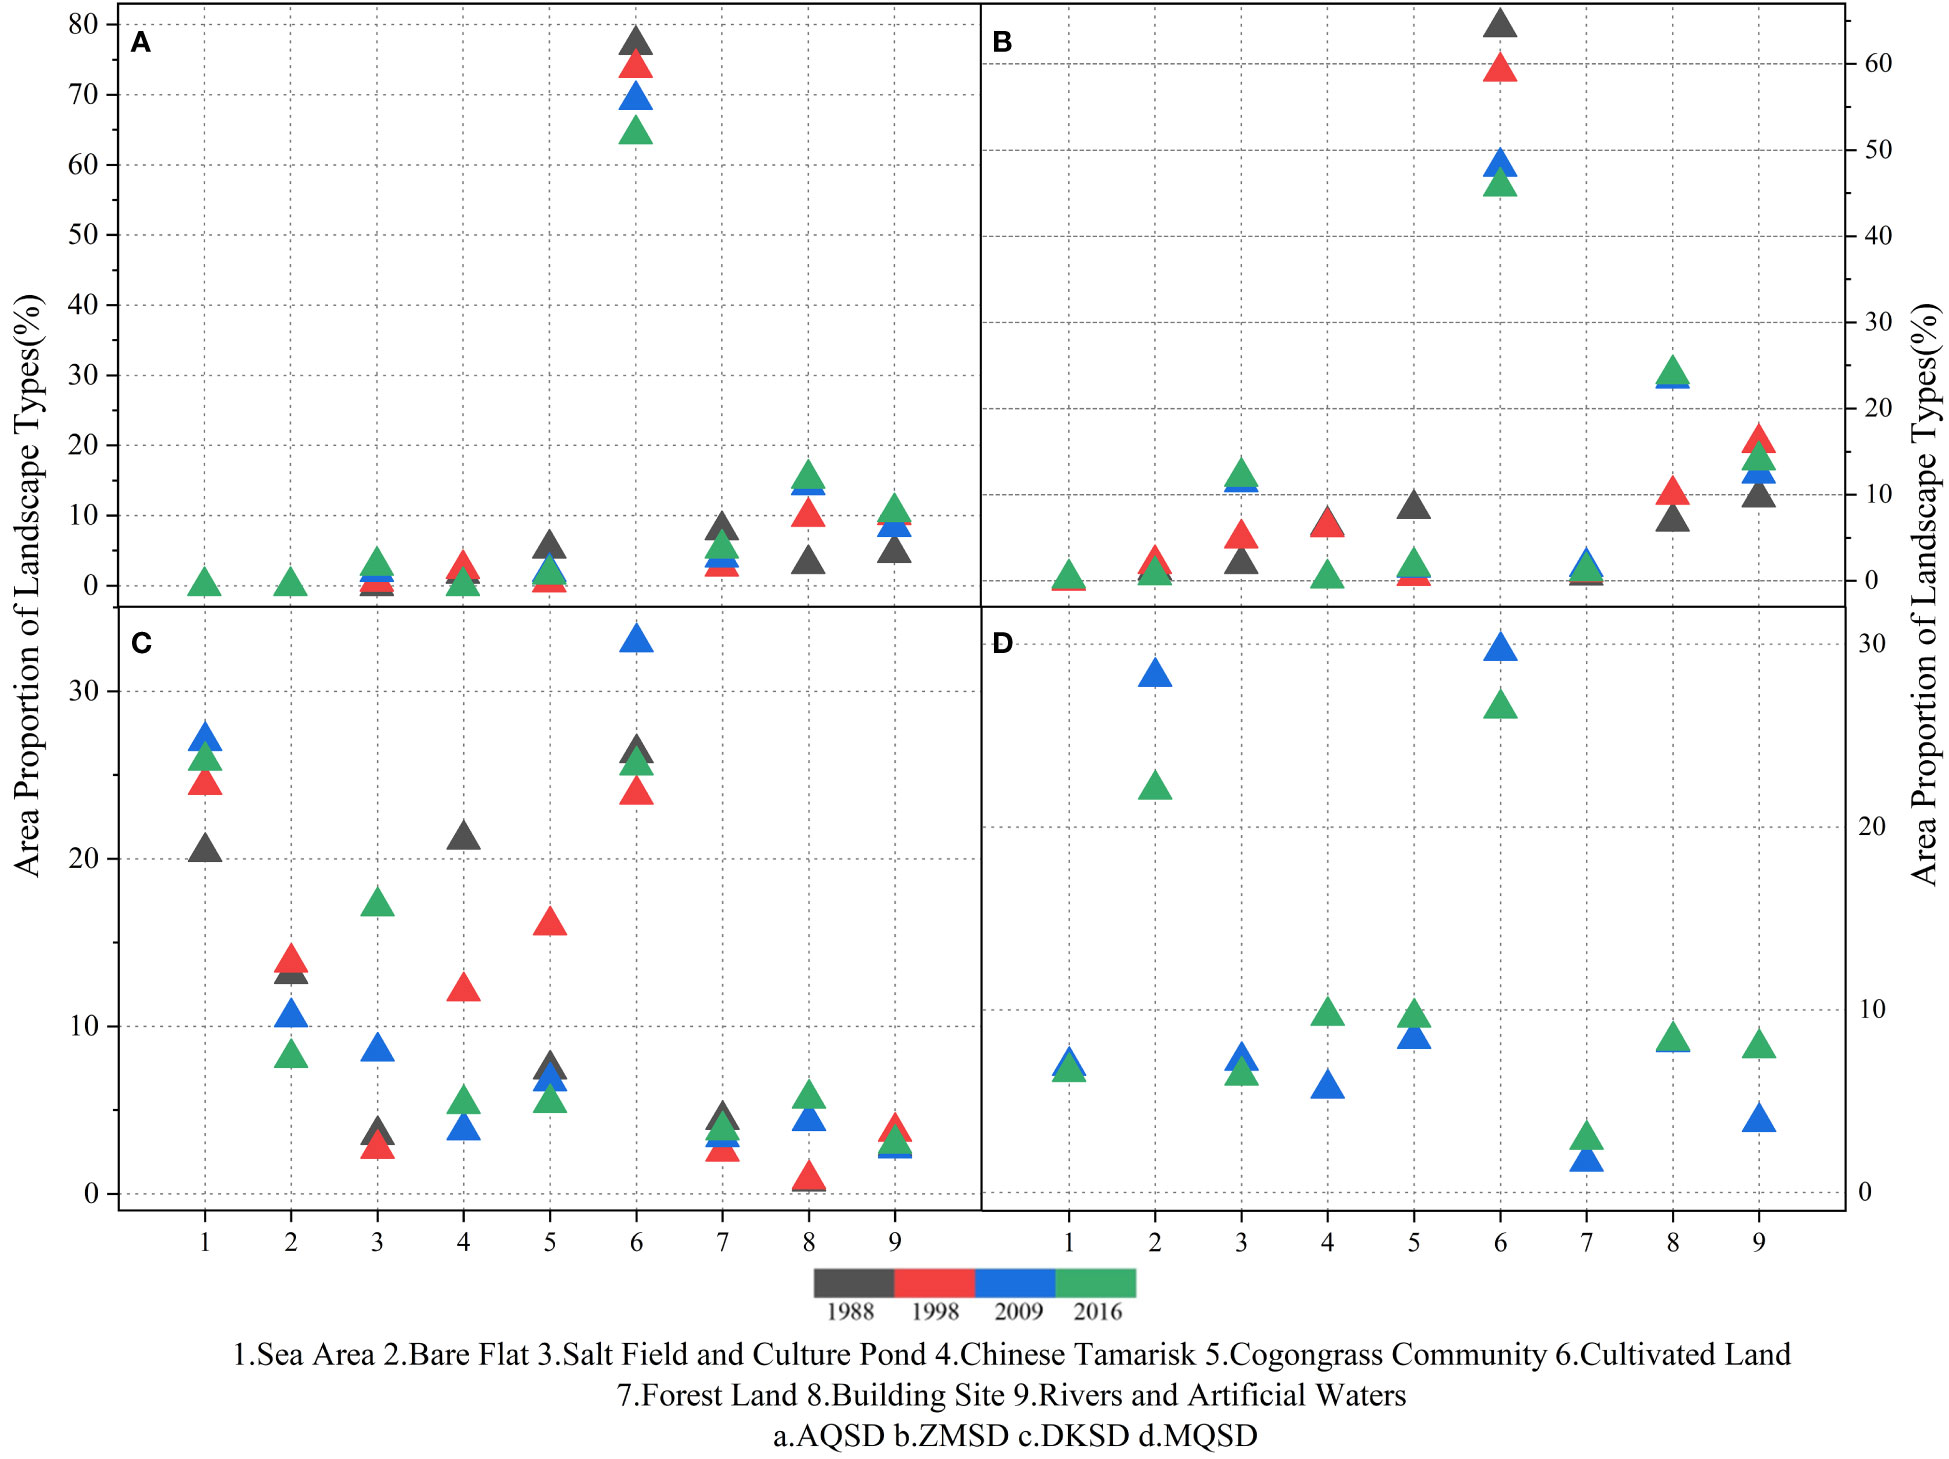
Figure 5 Percentage changes in the area of the various landscape types relative to the total area in different periods (A) AQSD; (B) ZMSD; (C) DKSD; (D) MQSD.
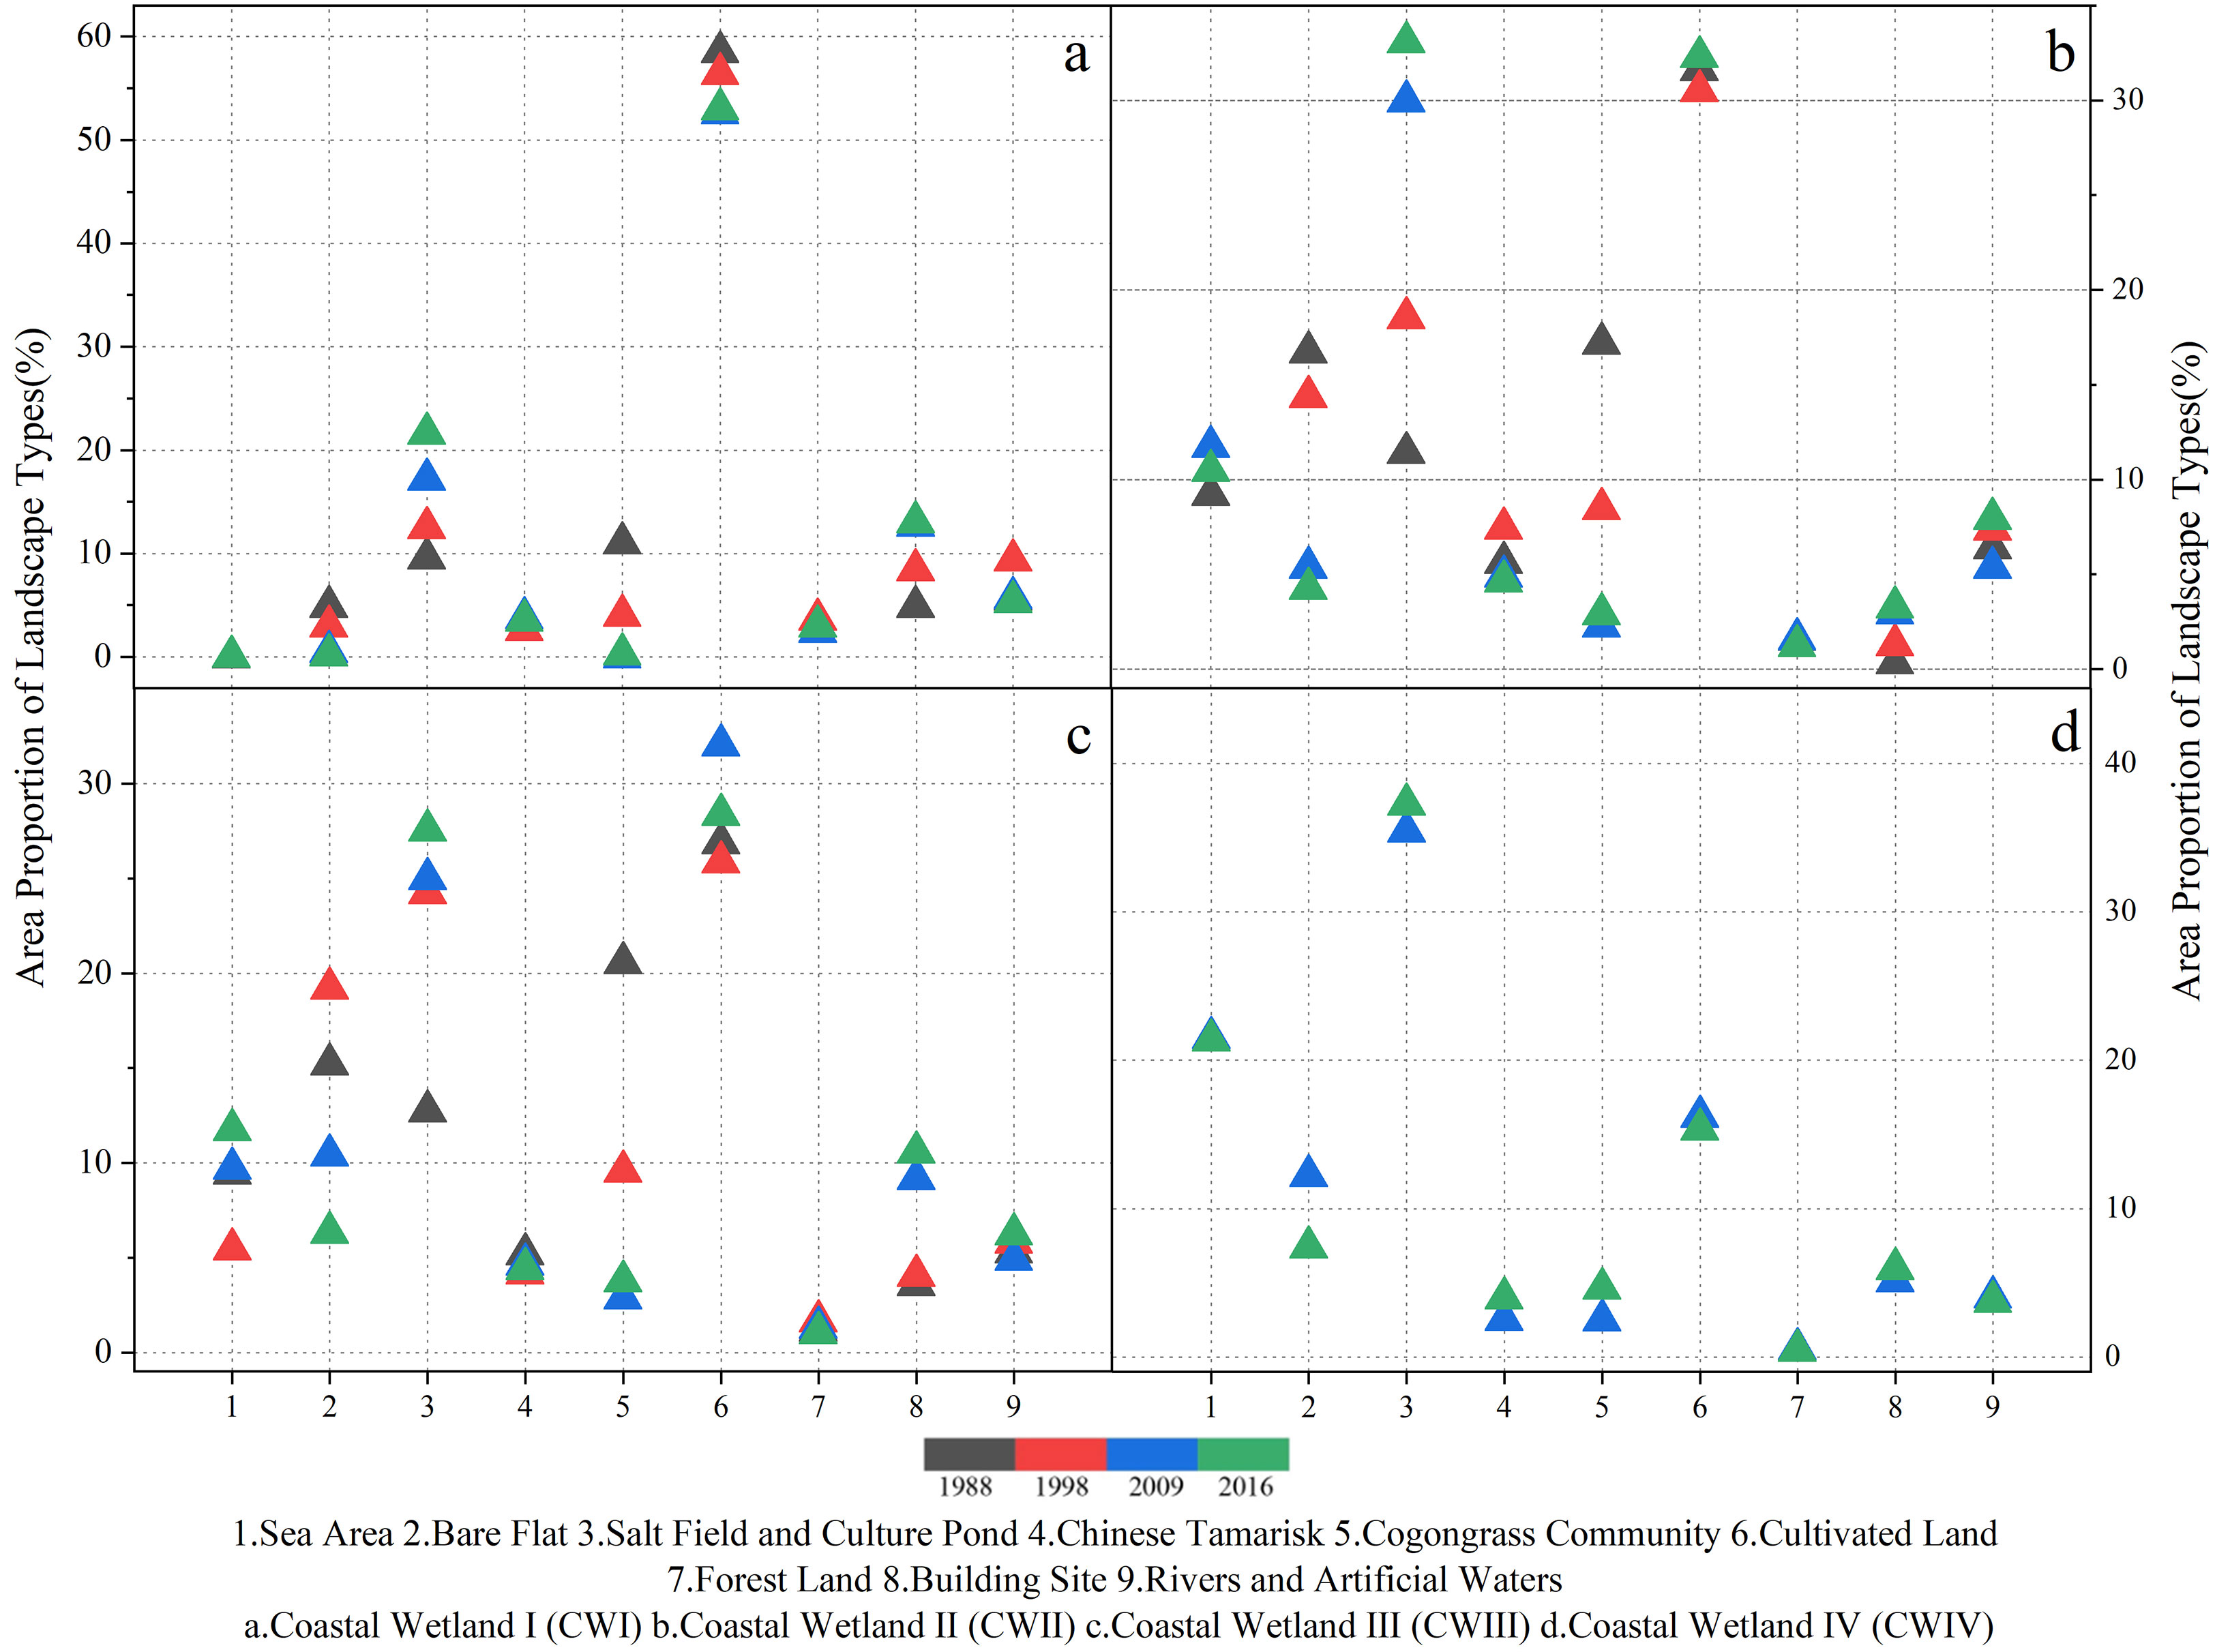
Figure 6 Percentage changes in the area of coastal wetland landscape types relative to the total area in different periods (A) CWI, (B) CWII, (C) CWIII and (D) CWIV.
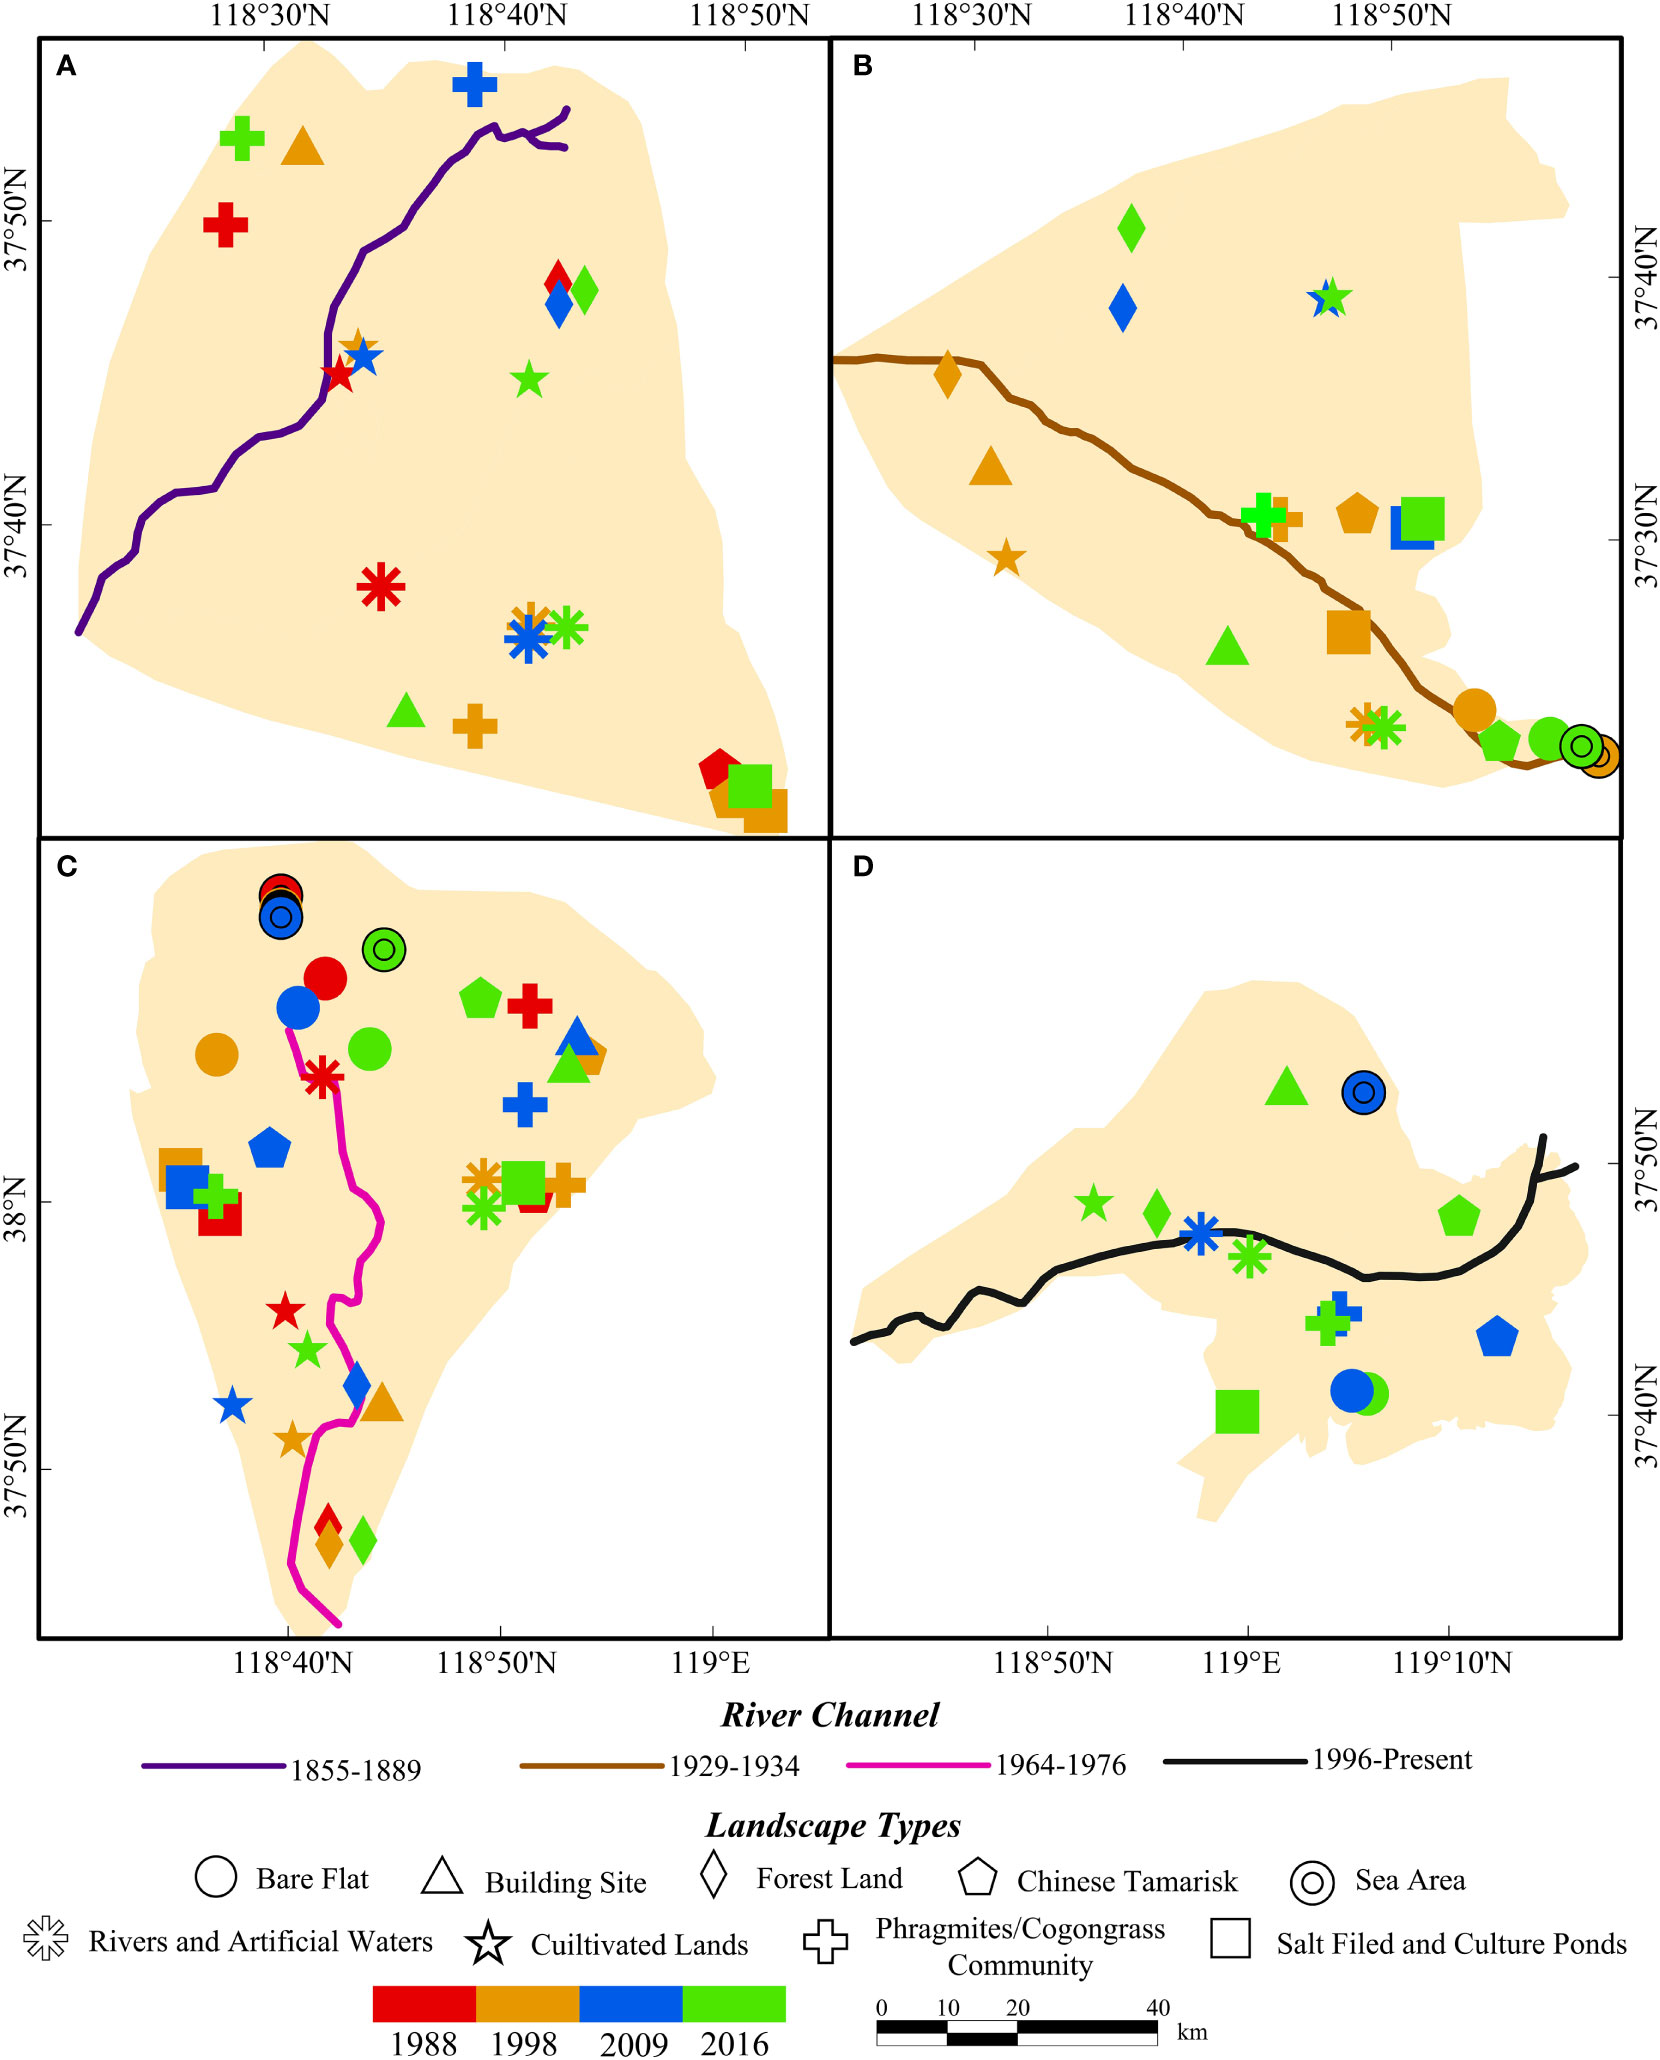
Figure 7 The regional centroids of the different landscape types in different periods (A) AQSD; (B) ZMSD; (C) DKSD; (D) MQSD.
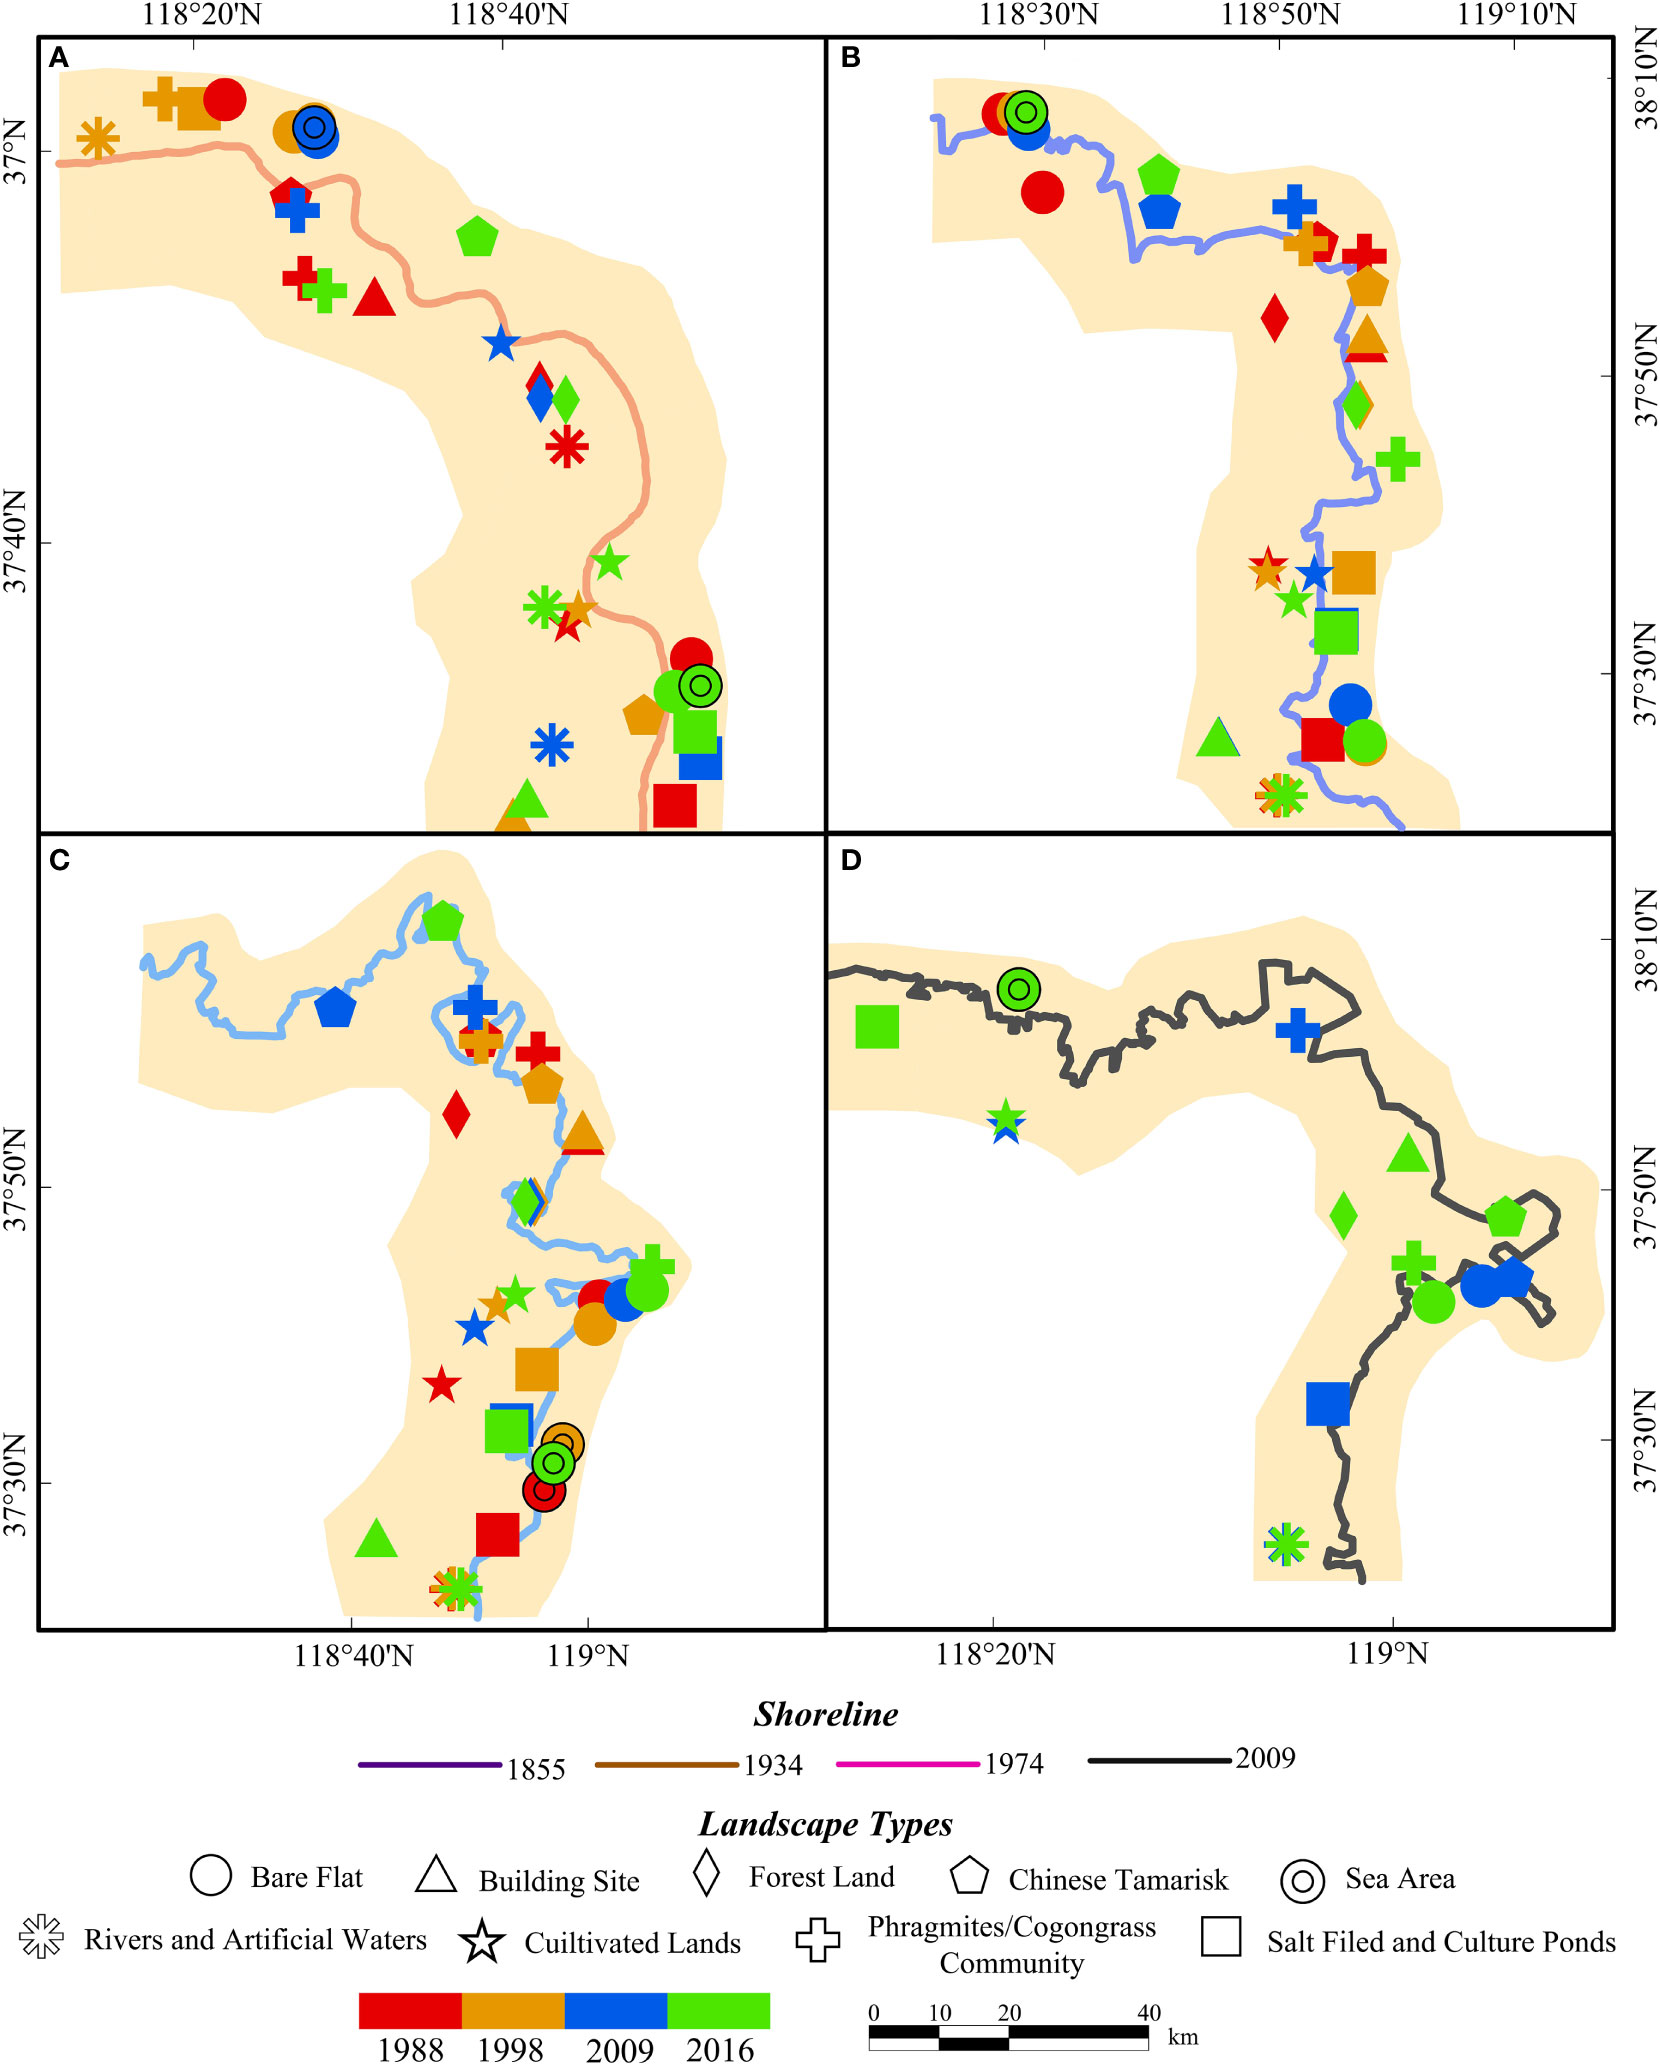
Figure 8 The regional centroids of the coastal wetland landscape types in different periods (A) CWI, (B) CWII, (C) CWIII and (D) CWIV.
4 Results
4.1 The landscape pattern of the YRD based on Geo-informatics
4.1.1 Analysis of subdelta landscape patterns in different periods
In the subdeltas analyzed, the cultivated land typically made up a high proportion of the total area over the four periods (Figure 5 and Table 4). For instance, the proportion of cultivated land in the AQSD ranged from 64.41% to 77.16% from 1988 to 2016, making it the dominant landscape type. The other landscape types, excluding cultivated land, building sites and rivers, and artificial water bodies, had relatively low proportions and remained largely unchanged over time (with a change of less than 5%). However, the proportion of cultivated land decreased over time, and the proportion of building sites increased, indicating that human activities were the primary driver of changes in the landscape structure in the AQSD.
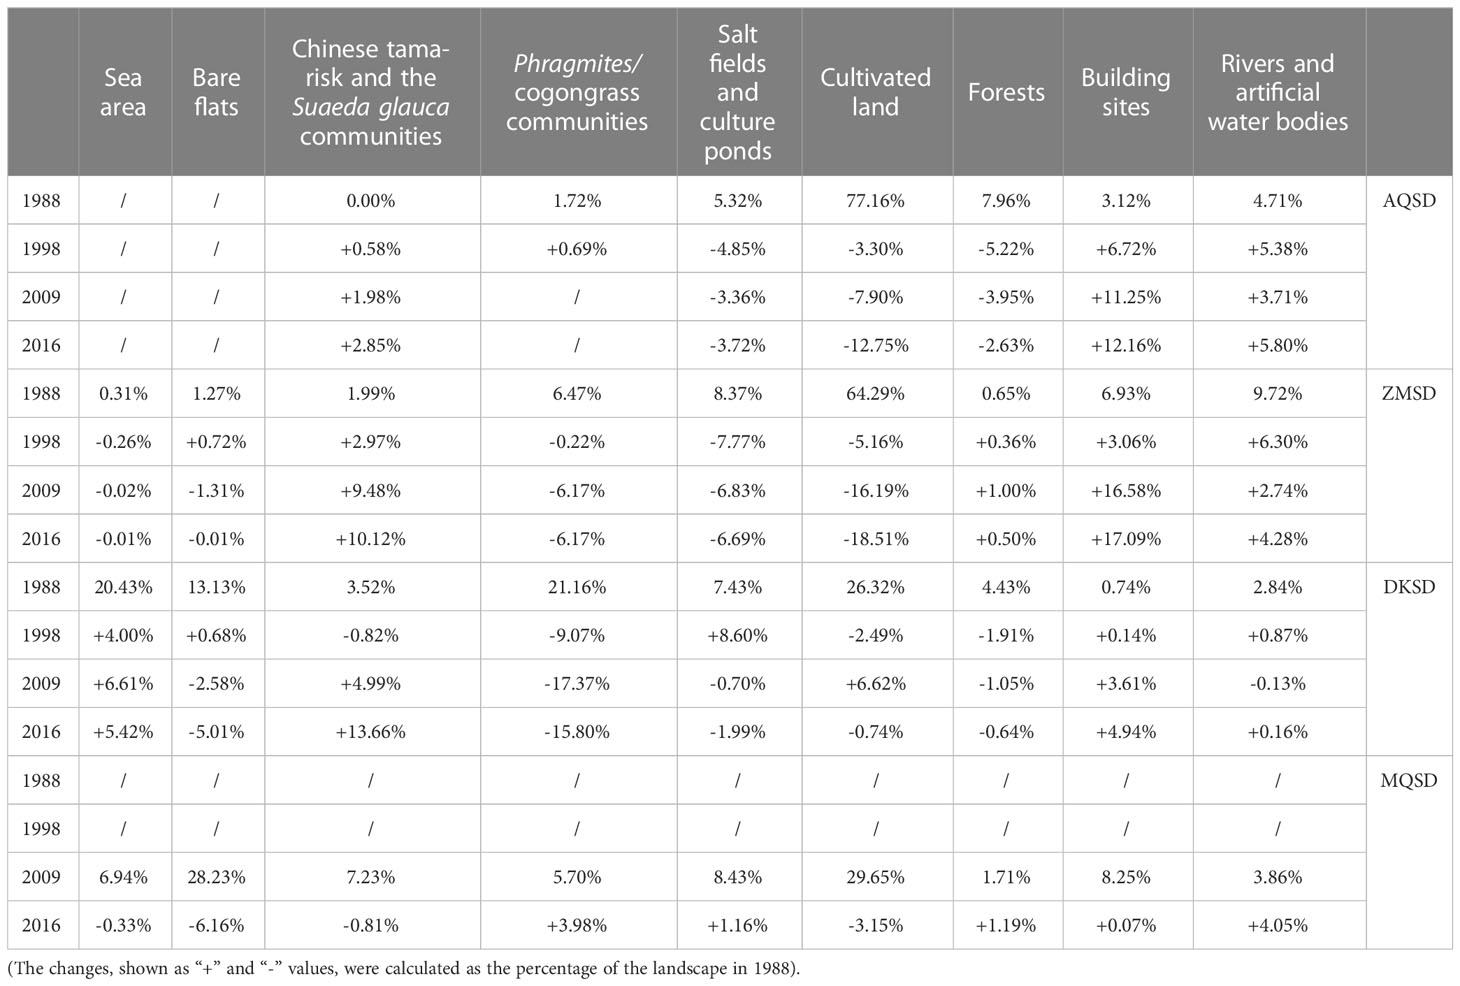
Table 4 Percentage changes in the area of the subdelta landscape types relative to the total area in different periods.
In the ZMSD, the areas of salt fields, culture ponds, forests, building sites, rivers, and artificial water bodies increased over time. The most notable increase was in the area of building sites, which showed a steady annual increase and reached a peak of nearly 17% during the period 1998-2009, becoming the second most dominant landscape type in the ZMSD.
In the DKSD region, the proportion of sea area, bare flats, salt fields, culture ponds, and Chinese tamarisk and Suaeda glauca communities showed significant changes of more than 5%, while the proportion of other landscape types varied by less than 5%. The Chinese tamarisk and Suaeda glauca communities showed the greatest changes, with a decrease from 21.16% in 1988 to 5.36% in 2016.
In the MQSD, In the MQSD region, a significant proportion of the land was used for agriculture (22.07%) and bare flat areas (26.50%) in 2016. The other landscape types comprised a relatively small portion, generally less than 10%. The area of bare flat lands decreased by 6.16% from 2009 to 2016, while the other landscape types remained relatively unchanged, with variations of less than 5%.
4.1.2 Analysis of coastal wetland landscape patterns in different periods
In CWI, CWII, and CWIII, cultivated land accounted for the largest proportion of the total area and was thus the dominant landscape type. In addition, the percentages of salt fields and culture ponds relative to the total area increased continuously to more than 20% from 1988 to 2016, making them the second most dominant landscape type (Figure 6 and Table 5).
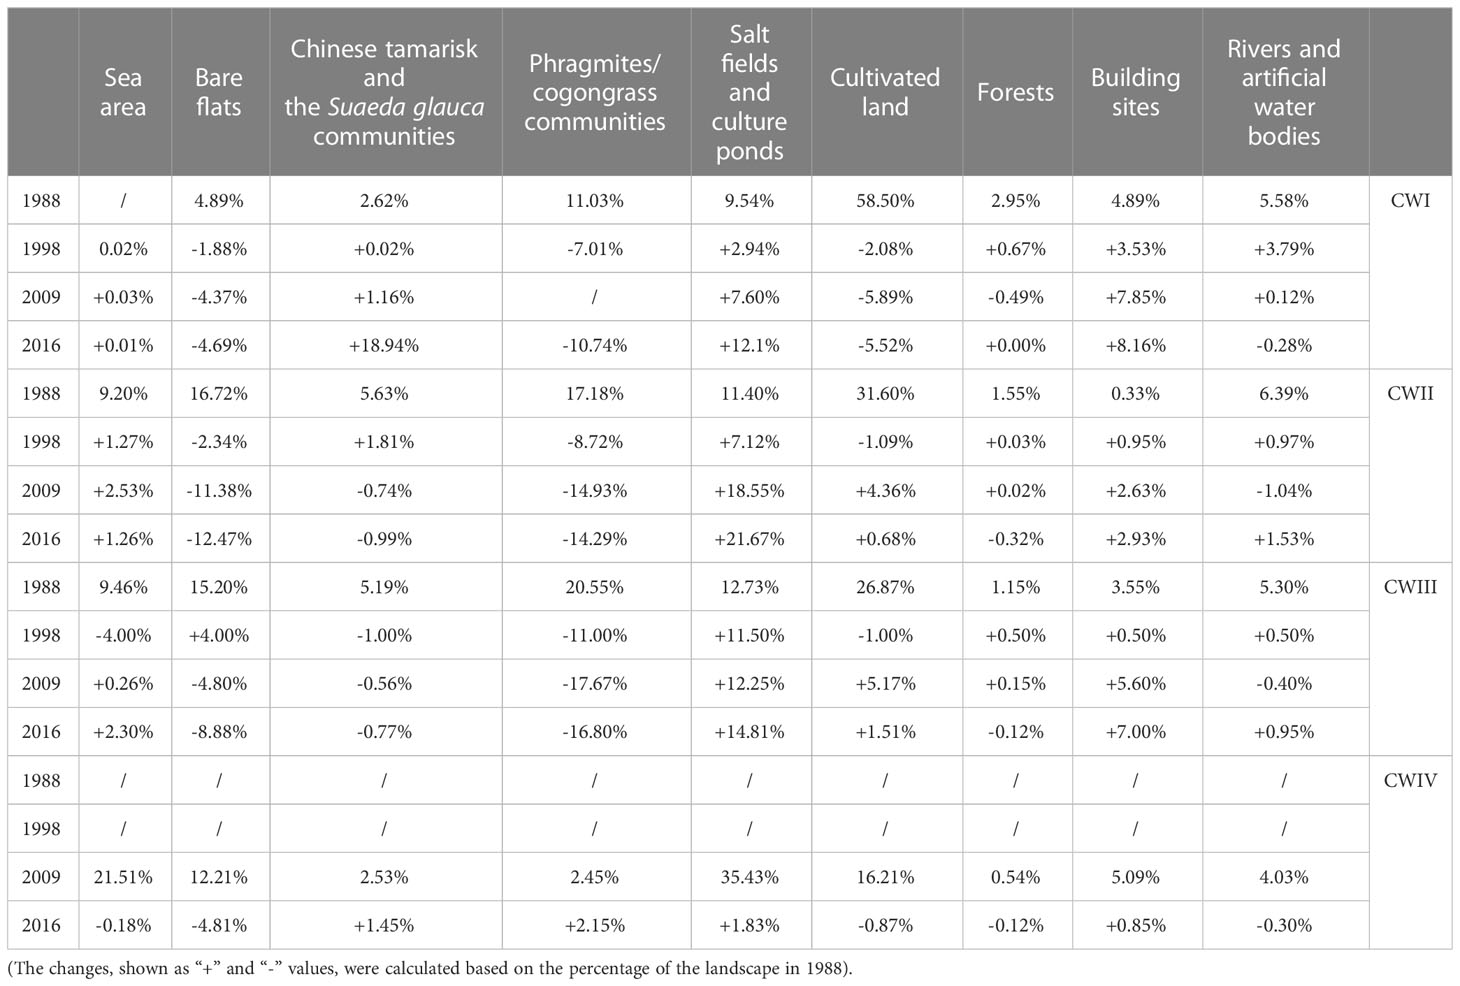
Table 5 Percentage changes in the area of coastal wetland landscape types relative to the total area in different periods.
In CWI, there were large differences in the various types of landscapes. The percentage of cultivated land was 58.50%, while that of the sea area was 0.02% in 1988. The areas of the various landscapes changed slightly over time, but the areas of salt fields and culture ponds, and building sites increased by 7.69% and 12.10%, respectively, during 1998–2009.
In CWII, the areas of natural landscapes (bare flats, Chinese tamarisk, Suaeda glauca communities, and Phragmites/cogongrass communities) decreased. Among them, the area of the Phragmites/cogongrass communities decreased by 14.29% during 1998-2009. In contrast, the area of artificial landscapes (including building sites, salt fields, and culture ponds) increased.
The evolution of the landscape pattern in CWIII was similar to that in CWII. In CWIV, the sea area was 21.51% in 2009. From 2009 to 2016, the bare flat area declined by 4.81%, while the area of salt fields and culture ponds increased by 1.83%. The areas of the other landscape types changed slightly.
4.2 The succession pattern in the YRD based on Geo-informatic analysis
4.2.1 Analysis of subdelta succession patterns in different periods
The landscape types in the AQSD were scattered and mainly distributed along the river. During the different periods, the characteristics of the artificial landscape types changed obviously. The regional centroids of cultivated land occurred mainly in the vicinity of the Yellow River but moved farther away from the river in 2016. Furthermore, the regional centroids of the building sites and rivers and artificial water bodies expanded away from the river channel over time (Figure 7).
The landscape succession patterns in the ZMSD and the DKSD were similar; in comparison to those in the AQSD, the regional centroids were more concentrated and tended to occur along the Yellow River channel. Although the regional centroids of the different landscape types changed according to the period, they were basically distributed along the direction of the river, including those of forestland, building sites, cultivated land, Phragmites/cogongrass communities, salt fields, culture ponds, rivers and artificial water bodies, Chinese tamarisk, Suaeda glauca communities, bare flats, and sea areas. Over time, the distribution of cultivated land and building sites were greatly affected by human activities, which significantly changed along the direction of the river course.
In the MQSD, the distribution centers of cultivated land, forestland, rivers and artificial water bodies, Phragmites/cogongrass communities, Chinese tamarisk, and Suaeda glauca communities were located near the Yellow River channel and were distributed along the extension direction of the river channel. Studies have shown that the regional centroids of these landscapes are mainly affected by freshwater from the Yellow River (Zhao et al., 2013). The regional centroids of the salt fields, culture ponds, building sites, rivers and artificial water bodies, and bare flats were distributed on both sides of the river, far from the channel.
4.2.2 Analysis of coastal wetland succession patterns in different periods
Unlike the pattern of subdelta landscape succession, there were no significant changes in the coastal wetland landscape in a single period. In CWI, building sites and rivers, and artificial water bodies, which were greatly affected by human activities, were distributed on the landward side, and they migrated along the coast to the north and south over time. The building sites migrated southward along the coastline to the southernmost point of the coastal wetland after 1998. Rivers and artificial water bodies migrated to the northernmost point of coastal wetlands after 1998 and moved to the southernmost point along the coastline in 2009. The changes in the other landscape centers were not obvious (Figure 8).
In CWII and CWIII, the changes in all landscape types except for building sites and cultivated land were small. The building sites and cultivated land areas migrated from the land to the sea, perpendicular to the coastline, during 1988–2016.
In CWIV, the landscapes were basically identical in 2009 and 2016, and the landscape structure had obvious regularity. From the ocean to the land, the sea area, bare flats, salt fields, culture ponds, Chinese tamarisk, Suaeda glauca communities, Phragmites/cogongrass communities, building sites, rivers and artificial water bodies, forestland, and cultivated land were distributed in turn.
In CWIV, the landscapes of the bare flats, Chinese tamarisk, Suaeda glauca communities, Phragmites/cogongrass communities, forestland, and building sites were mostly distributed near the Yellow River estuary. The landscapes of the cultivated land areas, salt fields, culture ponds, and sea areas were located in the north. The landscapes of rivers and artificial water bodies were distributed in the south.
5 Discussion
The main factors affecting the landscape pattern change in the YRD include the evolution of the Yellow River channel and coast, storm surge, and human activities and policies (Bi et al., 2011; Cao et al., 2015). The landscape types in the AQSD and the ZMSD were mainly artificial landscapes. Over time, the cultivated land gradually decreased in area, the building sites increased, and the building site landscape was mainly distributed along the river. Among the subdeltas considered, the AQSD and the ZMSD formed the earliest, and there have been only small changes in the land area since their formation. Thus, the coastline had a relatively low impact on the landscape pattern during these periods. However, the Yellow River channel runs through the two subdeltas, ensuring an ample supply of water resources for the communities located along both its banks. Thus, due to the high intensity of development and utilization (Table 6), human activities have had a strong influence on landscape succession (Liu et al., 2012; Li et al., 2013; Chen et al., 2014; Liu et al., 2018; Cong et al., 2019). The impact of the Yellow River channel on the landscape is mainly reflected in the extension of the artificial landscape types along the river to the sea.
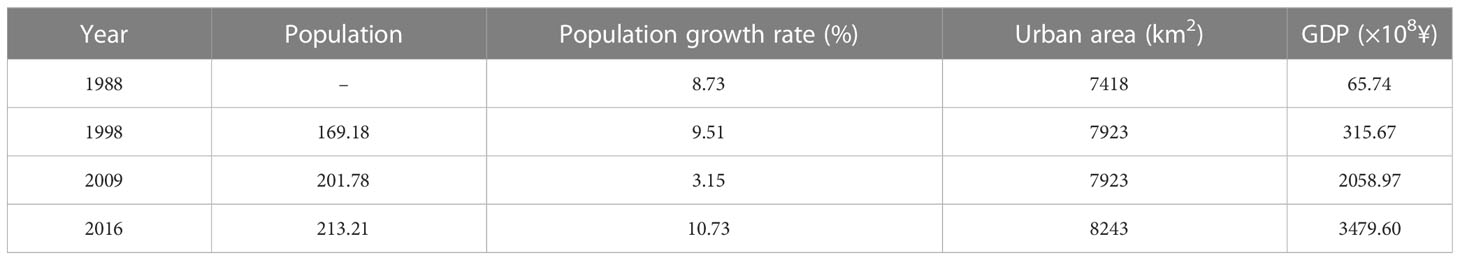
Table 6 Population, urban area, and GDP of Dongying from 1988 to 2016.
The natural landscape types in the DKSD and the MQSD were characterized by bare flats, Phragmites/cogongrass communities, Chinese tamarisk, and the Suaeda glauca communities, which were distributed along the river. The succession of each natural landscape also progressed toward the river channel. The artificial landscapes in these areas, including cultivated land, salt fields, and culture ponds, were mainly distributed along the Yellow River channel. Building sites were concentrated in certain areas, and there was no significant change in their center of distribution over time (Liu et al., 2012).
The Yellow River channel provides water for the landscape along its course, and the soil on both sides of the river is fertile and suitable for cultivation. Therefore, most natural and artificial landscape types tend to also be associated with the Yellow River. In addition, the landscape of the DKSD was also affected by the human salt industry and aquaculture, and the bare flat area decreased while the artificial water area increased. Thus, all of the landscape types except for construction land migrated from the sea to the land perpendicular to the coastline because of the increased artificial aquaculture water bodies in the DKSD.
However, the MQSD, which was formed by sediment deposition over the previous 40 years, is the youngest of the four subdeltas (Liu et al., 2013). The newly formed subdelta mainly consists of a silty coast with soft and loose soil (Bi et al., 2010). Its remote location from the city center and the difficulty of utilizing the land make it relatively less impacted by human activities (Chi et al., 2018).
In summary, the growth of the human population and the progression of urbanization have led to an increase in demand for both residential and cultivated land. This has resulted in a substantial increase in the size of residential areas and artificial irrigation water areas along the ancient QingShui River (1855-1889), Zhimai River (1929-1934), Diaokou River (1964-1976), and Yellow River (1996-present). However, the development of the petrochemical and aquaculture industries has led to a significant expansion of artificial water bodies, including salt pans and shrimp ponds, and oil extraction facilities, at the cost of reducing the size of natural habitats such as Chinese tamarisk, Suaeda glauca communities, and Phragmites/cogongrass communities.
This paper focused on the impact of the historical river channel and coastline evolution on modern landscape patterns and the direction of the succession of the YRD. Ottinger et al. (2013) suggested that the landscape changes in the YRD were mainly caused by a considerable increase in built-up areas, while changes in coastal areas were closely associated with the coastward expansion of salt fields and culture ponds. Thus, we further clarify the temporal and spatial evolution characteristics of the main landscape types at the subdelta scale. For the convenience of discussion, we divide the main landscape types into artificial landscapes (forestland, building sites, rivers and artificial water bodies, salt fields, and culture ponds) and natural landscapes (bare flats, Chinese tamarisk, and Phragmites/cogongrass communities). As Figure 9 shows, according to the calculated migration direction and distance of landscape-type centroids (Table S2), we found that the centroids of some artificial landscapes moved slowly to the north during 1998–2016. The shift in salt fields and culture ponds was 12.2 km, which was much larger than the shifts in cultivated land (3.1 km) and forestland (7.6 km). However, the migration direction of building sites and rivers, and artificial water bodies (i.e., mainly southeast) was not consistent with the above three types of artificial landscapes. Over the past 20 years, the urban built-up area of Dongying city has been expanding to the east near the coastline, and large reservoirs have been built on the plain to the east of the city (Figure 1). Thus, the landscape changes in building sites and rivers and artificial water bodies are loosely related to urban planning. The centroids of the natural landscape moved to the east, with the bare flats moving 30.6 km to the southeast, the Chinese tamarisk moving 21.4 km to the east, and the cogongrass communities moving 16.7 km to the northeast. Therefore, the different migration directions and distances of the centroids in artificial landscapes and natural landscapes essentially reflect that the changes in the Yellow River channel have led to different geomorphic development processes in the subdeltas, which directly affect human activities and the development of natural vegetation. Due to the diversion of the Yellow River channel to the southeast and the interruption of the sediment supply, the DKSD (1964–1976) is now in the stage of coastal erosion, resulting in wetland ecological degradation (Huang et al., 2012). With the development of the economy and society, human activities are increasing, resulting in an increase in cultivated land, salt fields, aquaculture ponds, and building sites. However, for the MQSD (1976–1996), the modern river course of the Yellow River generally flows to the southeast. At present, the coastline continues to advance toward the sea, which leads to the continuous expansion of the wetland ecosystem. Moreover, the Yellow River Estuary National Nature Reserve was established in 1992, which has significantly reduced the interference of human activities. Finally, the centroids of natural landscape types in the YRD moved to the southeast from 1998 to 2016.
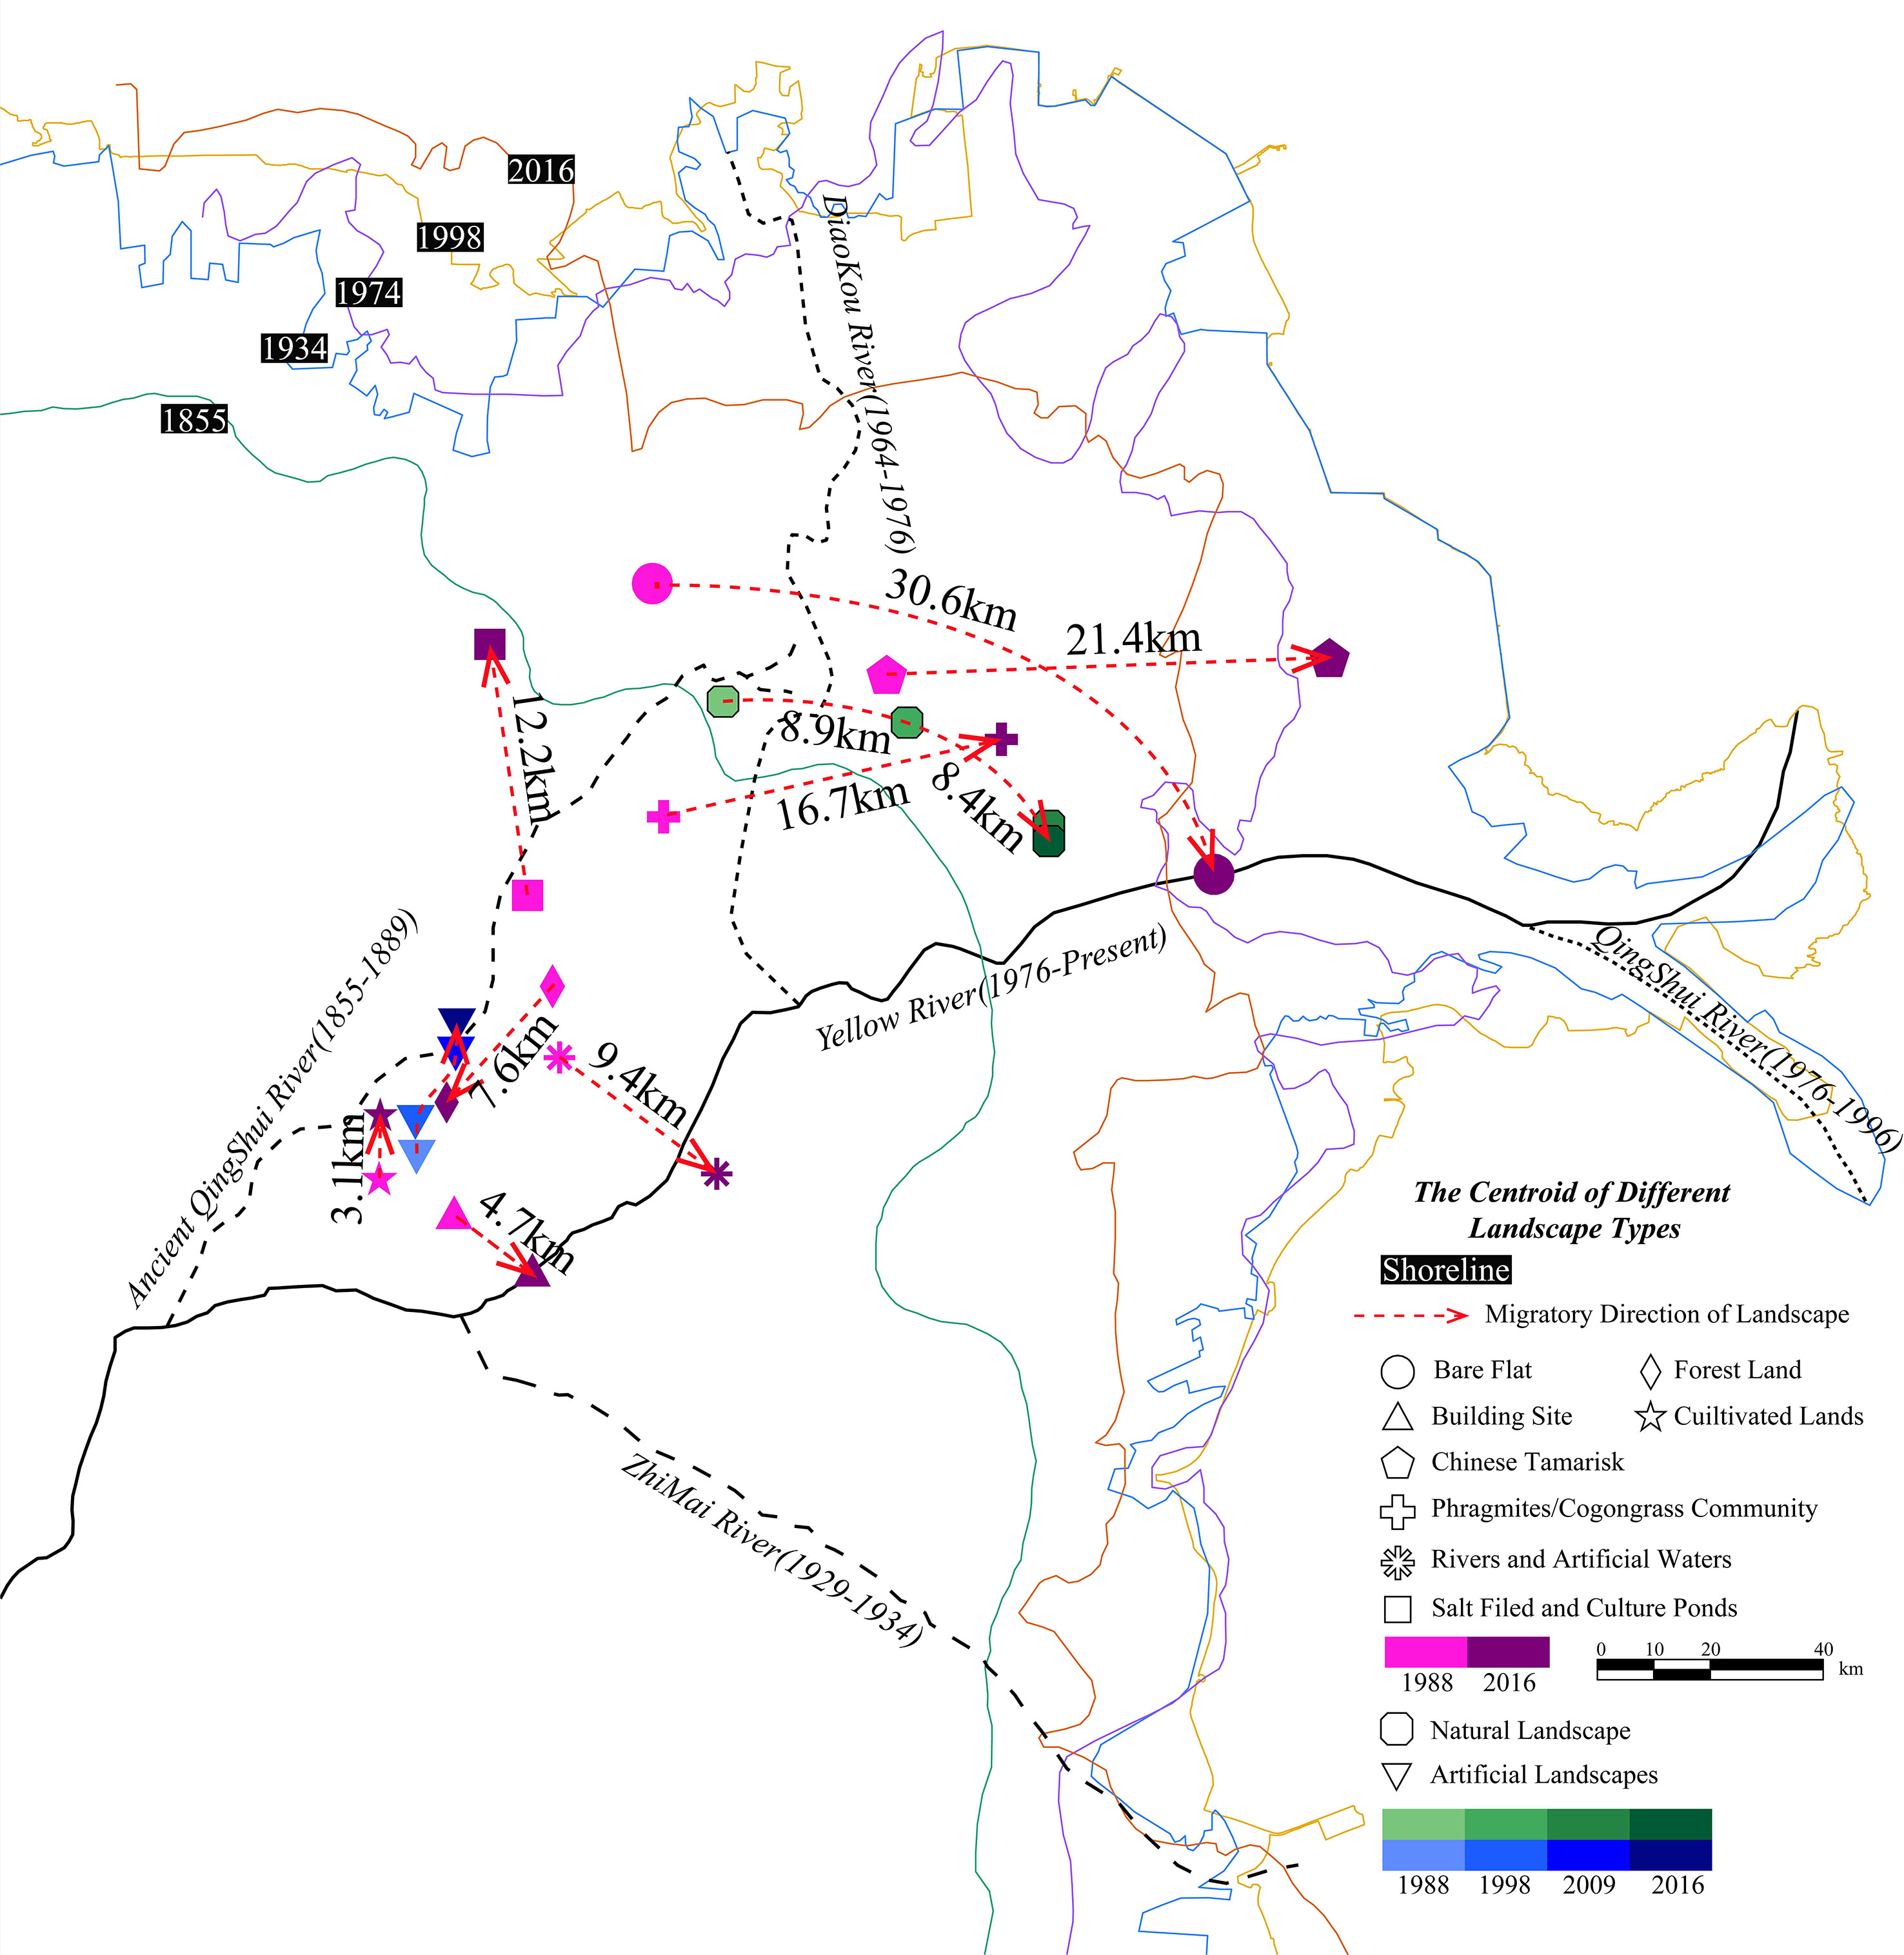
Figure 9 Analysis of the migration direction of the centroids of artificial and natural landscapes and every landscape type from 1988 to 2016.
In summary, according to the migration directions of the landscape-type centroids, most of the landscapes tended to migrate toward the east or north. Moreover, for the whole YRD, the human tendency to live near rivers was also observed here. Inhabited areas expanded along the course of the Yellow River in different historical periods due to the freshwater supplies (e.g., LiJin, YanWo, and HeKou along the Ancient QingShui River; KenLi and Dongying along the ZhiMai River; and Gudao and XianHe along the DiaoKou River); similarly, artificial water bodies for domestic and industrial and agricultural use also expanded along the river (Figure 3). Along with historical river channel migration, urbanization increased gradually, and the centroid of inhabited areas stabilized in the eastern part of Ninghai, which has not been affected by river changes since 1934. The estuaries of the Yellow River in different historical periods were more salinized due to seawater intrusion, which led to the transformation of vegetation into salt fields and culture ponds, especially for the estuaries of the Yellow River in ZMSD and the DKSD but not for the Yellow River Estuary National Nature Reserve in the MQSD (Figure 3). The range of coastline change was much lower than that of Yellow River channel migration. This aggravated the salinization of coastal land in the coastal wetlands from 1988 to 2016 but promoted the development of the salt industry and aquaculture (Figure 4). In general, human activities dominated the landscape pattern in the YRD; however, they were largely restricted by historical channel migration and historical coastline evolution.
The obtained results of landscape pattern succession showed that the degree of salinization in the YRD has increased and that the ecosystem has tended to become more fragile over time. It is necessary to make more rational use of limited water resources, optimize the industrial structure, engage in ecotourism, and achieve green and sustainable development. Moreover, it is essential to return farmland to forest and grassland, improve soil salinization bioremediation ability, and bring into play the carbon sink capacity of the YRD to help achieve the dual carbon goal.
6 Conclusion
(1) In the four historical subdeltas, the proportion of cultivated land to the total area was generally high, making it the dominant landscape type. The proportion of cultivated land area decreased over time, while the proportions of building sites and salt fields, and culture ponds increased. The landscape structures of the AQSD and the ZMSD were dominated by human activities along the Yellow River channels (1885-1889 and 1929-1934). Most of the landscape-type centroids in the DKSD tended toward the Yellow River (1976-present) and were perpendicular to the shoreline and migrated from the sea toward the land. This was the case with all landscape types except built-up land. The centroid of the landscape types in the MQSD, which were along the Yellow River (1976-present), changed slightly, except for the Chinese tamarisk, which is protected in the Yellow River Estuary National Nature Reserve.
(2) Cultivated land dominated the coastal wetlands in CWI, CWII, and CWIII, and the percentages of salt fields and culture ponds increased to more than 20% from 1988 to 2016, with this landscape type becoming the second most dominant landscape type. The sea area accounted for the largest proportion of the total area in CWIV. From 2009 to 2016, the area of bare flats declined by 5%, while the areas of salt fields and culture ponds increased by 3.45% in CWIV.
(3) According to the migration direction and distance of the landscape types, we found that the centroids of the artificial landscapes gradually shifted northward, while the centroids of the natural landscapes moved eastward between 1998 and 2016. This also indicated the human tendency to live near rivers. Inhabited areas and artificial water bodies expanded along the river courses due to freshwater supplies. The estuaries of the Yellow River in different historical periods transformed from vegetation to salt fields and culture ponds. The salinization of coastal wetlands was exacerbated by channel migration and coastline evolution, but it also fueled the growth of the salt industry and aquaculture. Human activities greatly impact the landscape in the YRD but are largely limited by past channel migration and coastal evolution.
Data availability statement
The original contributions presented in the study are included in the article/Supplementary Material. Further inquiries can be directed to the corresponding authors.
Author contributions
QW and CZ designed the research. LZ and XY analyzed data and wrote the manuscript, which was edited by all of the co-authors. SC, JY, CD refined the interpretations. All authors contributed to the article and approved the submitted version.
Funding
This work was funded by the National Science Foundation of China-Shandong United fund (U1706220), the National Natural Science Foundation of China (41901006, 41807418, 41871163), the Youth Innovation and Technology Program Team of Shandong University (2020KJH002), the Shandong Provincial Natural Science Foundation (ZR2019BD005; ZR2019MD040; ZR2020MD082), and the Shandong Society of Soil and Water Conservation Innovation Project (2019004).
Conflict of interest
The authors declare that the research was conducted in the absence of any commercial or financial relationships that could be construed as a potential conflict of interest.
Publisher’s note
All claims expressed in this article are solely those of the authors and do not necessarily represent those of their affiliated organizations, or those of the publisher, the editors and the reviewers. Any product that may be evaluated in this article, or claim that may be made by its manufacturer, is not guaranteed or endorsed by the publisher.
Supplementary material
The Supplementary Material for this article can be found online at: https://www.frontiersin.org/articles/10.3389/fmars.2023.1115720/full#supplementary-material
References
Bi X., Wang B., Lu Q. (2011). Fragmentation effects of oil wells and roads on the Yellow River Delta, north China. Ocean Coast. Manage. 54 (3), 256–264. doi: 10.1016/j.ocecoaman.2010.12.005
Bi N., Yang Z., Wang H., Hu B., Ji Y. (2010). Sediment dispersion pattern off the present huanghe (Yellow river) sub-delta and its dynamic mechanism during normal river discharge period. Estuar. Coast. Shelf S. 86 (3), 352–362. doi: 10.1016/j.ecss.2009.06.005
Cabral A., Costa F. L. (2017). Land cover changes and landscape pattern dynamics in Senegal and Guinea Bissau borderland. Appl. Geogr. 82, 115–128. doi: 10.1016/j.apgeog.2017.03.010
Cao M., Hu H., Le Z., Zhu M., Cao Y. (2015). A multi-scale approach to investigating the red-crowned crane-habitat relationship in the Yellow River Delta nature reserve, China: Implications for conservation. PloS One 10 (6), e0129833. doi: 10.1371/journal.pone.0129833
Chen A., Sui X., Wang D., Liao W., Ge H., Tao J. (2016). Landscape and avifauna changes as an indicator of yellow river delta wetland restoration. Ecol. Eng. 86, 162–173. doi: 10.1016/j.ecoleng.2015.11.017
Chen Z., Xu B., Devereux B. (2014). Urban landscape pattern analysis based on 3D landscape models. Appl. Geogr. 55, 82–91. doi: 10.1016/j.apgeog.2014.09.006
Chen S., Yue T., Li H. (2000). Studies on geo-informatic tupu and its application (in Chinese with English abstract). Geogr. Res. 19 (4), 337–343. doi: 10.11821/yj2000040002
Chen W., Zhao H., Li J., Zhu L., Wang Z., Zeng J. (2020). Land use transitions and the associated impacts on ecosystem services in the middle reaches of the Yangtze river economic belt in China based on the geo-informatic tupu method. Sci. Total Environ. 701, 134690. doi: 10.1016/j.scitotenv.2019.134690
Chi Y., Shi H., Zheng W., Sun J., Fu Z. (2018). Spatiotemporal characteristics and ecological effects of the human interference index of the Yellow River Delta in the last 30 years. Ecol.Indic 89, 880–892. doi: 10.1016/j.ecolind.2017.12.025
Chu Z., Sun X., Zhai S., Xu K. (2006). Changing pattern of accretion/erosion of the modern yellow river (Huanghe) subaerial delta, China: Based on remote sensing images. Mar. Geol. 227 (1-2), 13–30. doi: 10.1016/j.margeo.2005.11.013
Cong P., Chen K., Qu L., Han J. (2019). Dynamic changes in the wetland landscape pattern of the Yellow River Delta from 1976 to 2016 based on satellite data. Chin. Geogr. Sci. 29 (3), 372–381. doi: 10.1007/s11769-019-1039-x
Cui B. L., Li X. Y. (2011). Coastline change of the yellow river estuary and its response to the sediment and runoff (1976–2005). Geomorphology 127, 32–40. doi: 10.1016/j.geomorph.2010.12.001
Ding Z., Liao X., Su F., Fu D. (2017). Mining coastal land use sequential pattern and its land use associations based on association rule mining. Remote Sens-Basel 9 (2), 116. doi: 10.3390/rs9020116
Fu B., Xu Y., Lv Y. (2010). Scale characteristics and coupled research of landscape pattern and soil and water loss (in Chinese with English abstract). Adv. Earth Sci. 25 (7), 673–681. doi: 10.11867/j.issn.1001-8166.2010.07.0673
Fu X., Liu G., Chai S., Huang C., Li F. (2013). Spatial-temporal analysis of wetland landscape pattern under the influence of artificial dykes in the Yellow River delta. Chinese Journal of Population, Resources and Environment 11 (02): 109–117. doi: 10.1080/10042857.2013.777204
Huang C., Liu G., Fu X., Li Y., Liu Q., Wang X. (2012). Monitoring and evaluation of wetland restoration in the abandoned diaokou estuary of yellow river delta based on HJ-1 remote sensing Data.Prog. Geogr 31 (5), 570–576. doi: 10.11820/dlkxjz.2012.05.004
Ji H. Y., Pan S. Q., Chen S. L. (2020). Impact of river discharge on hydrodynamics and sedimentary processes at yellow river delta. Mar. Geol. 425 (7), 106210. doi: 10.1016/j.margeo.2020.106210
Jiang P., Cheng L., Li M., Zhao R., Duan Y. (2015). Impacts of LUCC on soil properties in the riparian zones of desert oasis with remote sensing data: A case study of the middle heihe river basin, China. Sci. Total Environ. 506-507, 259–271. doi: 10.1016/j.scitotenv.2014.11.004
Li D., Chen S., Lloyd H., Zhu S., Shan K., Zhang Z. (2013). The importance of artificial habitats to migratory waterbirds within a natural/artificial wetland mosaic, Yellow River Delta, China. Bird Conserv. Int. 23 (2), 184–198. doi: 10.1017/S0959270913000099
Li S., Cui B., Xie T., Zhang K. (2016). Diversity pattern of macrobenthos associated with different stages of wetland restoration in the Yellow River Delta. Wetlands 36 (S1), 57–67. doi: 10.1007/s13157-015-0641-7
Li J., Pu R., Gong H., Luo X., Ye M., Feng B. (2017). Evolution characteristics of landscape ecological risk patterns in coastal zones in zhejiang province, China. Sustainability-Basel 9 (4), 584. doi: 10.3390/su9040584
Li S., Wang G., Deng W., Hu Y., Hu W. (2009). Influence of hydrology process on wetland landscape pattern: A case study in the yellow river delta. Ecol. Eng. 35 (12), 1719–1726. doi: 10.1016/j.ecoleng.2009.07.009
Liu G. (2003). Dynamic monitoring and numerical simulation of ecological environment in the yellow river delta (in Chinese) (Beijing: The Science Publishing Company).
Liu S., An N., Yin Y., Cheng F., Dong S. (2017). Landscape pattern analysis and prediction of land-use change in the guangxi coastal area (in Chinese with English abstract). Acta Ecol. Sin. 37, 5915–5923. doi: 10.5846/stxb201606301335
Liu S., Hou X., Yang M., Cheng F., Coxixo A., Wu X., et al. (2018). Factors driving the relationships between vegetation and soil properties in the Yellow River Delta, China. Catena 165, 279–285. doi: 10.1016/j.catena.2018.02.004
Liu Y., Huang H., Qiu Z., Fan J. (2013). Detecting coastline change from satellite images based on beach slope estimation in a tidal flat. Int. J. Appl. Earth Obs 23, 165–176. doi: 10.1016/j.jag.2012.12.005
Liu D., Qu R., Zhao C., Liu A., Deng X. (2012). Landscape ecological risk assessment in Yellow River Delta. J. Food Agric. Environ. 10, 970–972. doi: 10.1234/4.2012.3132
Liu G., Zhang L., Zhang Q., Musyimi Z., Jiang Q. (2014a). Spatio-temporal dynamics of wetland landscape patterns based on remote sensing in Yellow River Delta, China. Wetlands 34, 787–801. doi: 10.1007/s13157-014-0542-1
Liu J., Zhao D., Tian X., Zhao L., Liu J. (2014b). Landscape pattern dynamics and driving forces analysis in the sanjiang plain from 1954 to 2010 (in Chinese with English abstract). Acta Ecol. Sin. 34 (12), 3234–3244. doi: 10.5846/stxb201306101639
Meng W., He M., Hu B., Mo X., Li H., Liu B., et al. (2017). Status of wetlands in China: A review of extent, degradation, issues and recommendations for improvement. Ocean Coast. Manage. 146, 50–59. doi: 10.1016/j.ocecoaman.2017.06.003
Meng L., Zhou S. W., Zhang H., Bi X. L. (2016). Estimating soil salinity in different landscapes of the Yellow River Delta through landsat OLI/TIRS and ETM plus data. J. Coast. Conserv. 20 (4), 271–279. doi: 10.1007/s11852-016-0437-9
Ottinger M., Kuenzer C., Liu G., Wang S., Dech S. (2013). Monitoring land cover dynamics in the Yellow River Deltafrom 1995 to 2010 based on landsat 5 TM. Appl. Geogr. 44, 53–68. doi: 10.1016/j.apgeog.2013.07.003
Peng J., Dang W., Liu Y., Zong M., Hu X. (2015). Review on landscape ecological risk assessment (in Chinese with English abstract). Acta Geogr. Sin. 70 (4), 664–677. doi: 10.11821/dlxb201504013
Qi Q., Chi T. (2001). Research on the theory and method of geo-Info-TUPU (in Chinese with English abstract). Acta Geogr. Sinica. 56 (sup), 8–18. doi: 10.11821/xb20017s002
Tanner E. P., Fuhlendorf S. D. (2018). Impact of an agri-environmental scheme on landscape patterns. Ecol. Indic. 85, 956–965. doi: 10.1016/j.ecolind.2017.11.043
Wang R., Huston S., Li Y., Ma H., Peng Y., Ding L. (2018). Temporal stability of groundwater depth in the contemporary Yellow River Delta, Eastern China. Sustainability-Basel 10 (7), 2224. doi: 10.3390/su10072224
Wang X., Lian Y., Huang C., Wang X., Wang R., Shan K., et al. (2012). Environmental flows and its evaluation of restoration effect based on LEDESS model in Yellow River Delta wetlands. Mitig. Adapt. Strat. Gl. 17, 357–367. doi: 10.1007/s11027-011-9330-x
Wu X., Bi N. S., Kanai Y., Saito Y., Zhang Y., Yang Z. S., et al. (2015). Sedimentary records off the modern huanghe (Yellow river) delta and their response to deltaic river channel shifts over the last 200 years. J. Asian Earth Sci. 108, 68–80. doi: 10.1016/j.jseaes.2015.04.028
Wu H., Zeng G., Liang J., Chen J., Xu J., Dai J., et al. (2017). Responses of landscape pattern of china’s two largest freshwater lakes to early dry season after the impoundment of three-gorges dam. Int. J. Appl. Earth Obs. 56, 36–43. doi: 10.1016/j.jag.2016.11.006
Xue C. (1994). Division and recorgnition of modern yellow river delta lobes (in Chinese with English abstract). Geogr. Res. 13, 59–66. doi: 10.11821/yj1994020009
Yang X., Zheng X., Chen R. (2014). A land use change model: Integrating landscape pattern indexes and Markov-CA. Ecol. Model. 283, 1–7. doi: 10.1016/j.ecolmodel.2014.03.011
Zeng S., Zhang T., Gao Y., Ouyang Z., Chen J., Li B., et al. (2011). Effects of road age and distance on plant biodiversity: A case study in the Yellow River Delta of China. Plant Ecol. 212 (7), 1213–1229. doi: 10.1007/s11258-011-9899-x
Zhao Y., Jia X., Liu J., Liu G. (2013). Analysis and forecast of landscape pattern in xi′an from 2000 to 2011 (in Chinese with English abstract). Acta Ecol. Sin. 33 (8), 2556–2564. doi: 10.5846/STXB201106190846
Keywords: Yellow River Delta, Geo-informatic Tupu, landscape pattern, channel migration, coastal evolution
Citation: Zhan C, Wang Q, Cheng S, Zeng L, Yu J, Dong C and Yu X (2023) Investigating the evolution of landscape patterns in historical subdeltas and coastal wetlands in the Yellow River Delta over the last 30 years: A geo-informatics approach. Front. Mar. Sci. 10:1115720. doi: 10.3389/fmars.2023.1115720
Received: 04 December 2022; Accepted: 24 February 2023;
Published: 10 March 2023.
Edited by:
Iacopo Carnacina, Liverpool John Moores University, United KingdomCopyright © 2023 Zhan, Wang, Cheng, Zeng, Yu, Dong and Yu. This is an open-access article distributed under the terms of the Creative Commons Attribution License (CC BY). The use, distribution or reproduction in other forums is permitted, provided the original author(s) and the copyright owner(s) are credited and that the original publication in this journal is cited, in accordance with accepted academic practice. No use, distribution or reproduction is permitted which does not comply with these terms.
*Correspondence: Lin Zeng, emVuZ2xpbkBsZHUuZWR1LmNu; Xiang Yu, eXV4aWFuZ3l0QDEyNi5jb20=
†These authors share first authorship