 Laura Casas
 Fran Saborido-Rey
94% of researchers rate our articles as excellent or good
Learn more about the work of our research integrity team to safeguard the quality of each article we publish.
Find out more
REVIEW article
Front. Mar. Sci., 07 July 2023
Sec. Marine Fisheries, Aquaculture and Living Resources
Volume 10 - 2023 | https://doi.org/10.3389/fmars.2023.1113870
This article is part of the Research TopicProspects and Challenges for the Implementation of HTS Genetic Methods in Fisheries Research Surveys and Stock Assessments.View all 15 articles
Stock assessments serve to monitor the condition of fish stocks and exploit them sustainably but require accurate data such as growth and mortality rates as input parameters. Most species fished worldwide lack the data needed to assess their status and even those closely assessed are often based on parameters that are known to contain uncertainty. This has resulted in an increased share of overfished stocks over the last half century, demanding urgently innovative methodologies that can provide novel means to reduce uncertainty of fish stocks assessments and expand the range of assessed species. CKMR has emerged recently attracting a great interest due to its potential to provide accurate demographic parameters of interest in stock assessments. The method is at the crossroads between fisheries science and genomics, requiring specialized knowledge that is usually outside of the experience of fisheries scientist and modellers, complicating the application of the method and its uptake in regular fisheries assessments. In this review, we provide useful information to perform the genomics and bioinformatics steps required to complete successfully a CKMR study. We discuss the most suitable genomics assays, considering the amount of information they provide, their easiness of use and cost of genotyping accurately the large number of individuals needed to assess most fish stocks. We provide an overview of methods of analysis and statistical methodologies that can be used to infer kinship with the accuracy required in a large population setting with sparse sampling, where most individuals are unrelated, determining a low probability of finding closely related individuals. We analyse potential sources of biases and errors and provide recommendations to facilitate the application of CKMR to a wider range of fish stocks.
Close-kin mark-recapture (CKMR) provides a fisheries-independent method for estimating demographic parameters (e.g. abundance, population trend, survival rates) of fish stocks, based on the frequency and degree of kinship determined from genetic samples (Bravington et al., 2016b).
The underlying principle is analogous to classical mark recapture, but uses the genomic information to determine if any given individual (“capture”) has one or more close relatives (“recapture/s”) in a sample. The probability of finding relatives (“recaptures”) diminishes as the size of the population increases, providing information on adult abundance. The inverse relationship between abundance and probability of recapture holds if individuals represent a random sample from the population of interest (Bravington et al., 2016b).
CKMR relies on a mark‐recapture analysis framework (Bravington and Grewe, 2007) and can be divided into five different stages (Figure 1); design, sampling, marker discovery and genotyping, kin finding and demographic/statistical modelling of the population.
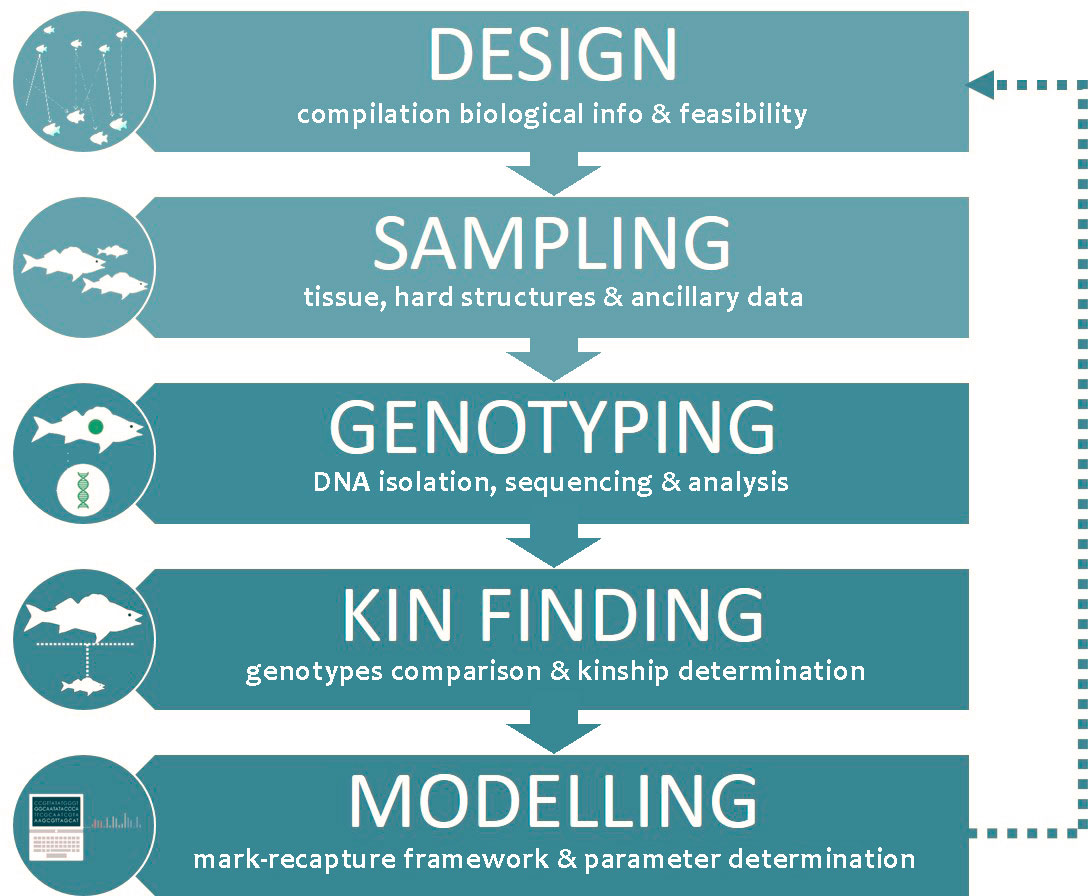
Figure 1 Flowchart displaying the five components of a CKMR study. The arrows indicate the succession of stages, including a connection between the final stage and the initial design stage, indicating an iterative process.
The design stage involves several steps, starting with the compilation of existing biological knowledge, catch data (if available) and estimated stock parameters, including approximate population size, if the population is assessed. This information is needed to perform a preliminary evaluation of the potential feasibility of CKMR to assess the population of interest, which consists of an estimation of the number of samples and ancillary information required to infer population parameters with accuracy, the potential complications and the technical considerations for the design of the CKMR study. If the study is deemed viable, the next step is the design of sampling, considering the relevant biology (e.g., the presence of population substructure with differentiated adult and juvenile habitats (nursery grounds) or with biased sex-ratio in spawning-grounds) and the estimated samples sizes required for the target level of precision in the population estimates (Maunder et al., 2021).
The second stage is the sampling, which involves the collection of samples, including tissue and hard structures (otoliths, scales or vertebrae, among others) as well as ancillary data, such as length, sex, and maturation stage.
The next two stages involve the use of genomics and bioinformatics tools. The term “genomics” refers to an organism’s complete collection of heritable information stored in its DNA. Modern genomic technologies provide the means to study this information and uncover differences in genome content that provide insights into individuals, populations and species. Such differences, also known as DNA polymorphisms (in biology, polymorphism describes the existence of multiple forms) are the source of genetic diversity and can be used as molecular markers (Del Giacco and Cattaneo, 2012). Bioinformatics, on the other hand, can be defined as the application of tools of computation and analysis to capture and interpret biological data (Bayat, 2002). Both disciplines are involved in the third stage, the genotyping, which entails the determination of the DNA sequence at polymorphic positions within the genome of an individual. It requires the isolation of DNA from the tissues collected for each specimen, the amplification and sequencing of this DNA through a selected method, and searching for polymorphic regions across their genomes to produce unique genotypes. The fourth stage addresses the search of close relatives (equivalent to "recaptures") among the specimens and requires a bioinformatics workflow to perform a kinship analysis among the unique genotypes aimed at detecting highly related individuals. In the last stage, variants of capture‐recapture modelling are applied to the kinship data to produce direct estimates of parental population abundance and other demographic parameters such as mortality or fecundity, depending on the type of kinship relationships analysed. The results obtained serve to feed back the design stage in an iterative process to refine and optimize the CKMR model (Delaval et al., 2022).
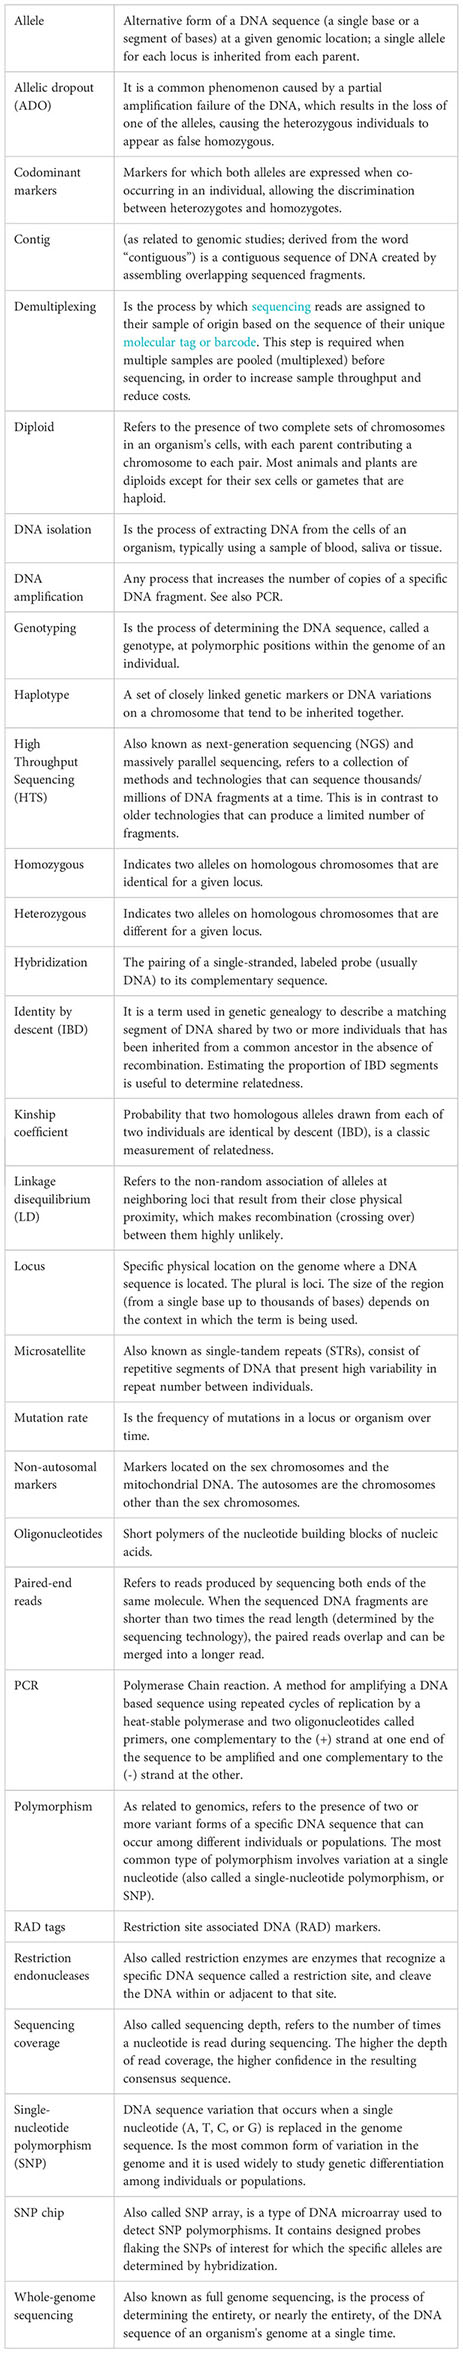
The CKMR method is at the crossroads between fisheries science and genomics, requiring specialized knowledge that is usually outside of the experience of fisheries scientist and modellers, complicating the application of the method and its uptake in regular fisheries assessments (Davies et al., 2015). This review expands and complements the review made by Casas and Saborido-Rey, (2023) within this Research Topic focused on close-kin mark–recapture (CKMR) as an emerging tool to estimate population parameters, focused on the theory behind the method, the stages of design and sampling (one and two) and existing case studies. The present manuscript addresses stages three and four, which involve the use of genomic and bioinformatics tools. The rapid advances in genomic technologies and the plethora of software and analysis pipelines represent a notable challenge and can be overwhelming when approaching a CKMR project. A simple terminology is used across the manuscript to reach potential users of the method, such as fisheries managers and scientist, with no expertise in genomics. Additionally, a brief glossary for key genomics and bioinformatics terms is included. We provide an overview of molecular marker types that have been applied in CKMR studies to date, their characteristics and give recommendations for future CKMR studies. We discuss the genomic methods with higher potential for CKMR applications, considering the amount of information they provide, their easiness of use and cost. We provide an overview of methods of analysis and statistical methodologies that can be used to infer kinship, together with the potential sources of error and biases. Finally, we provide recommendations and important considerations to carry out close kin studies to assess fish populations, to facilitate bridging the gap between geneticists and fisheries assessment scientists and promote the use of genomic tools in fisheries science.
The genotyping stage consists of several steps that involve laboratory work to isolate, amplify and sequence each specimen´s DNA, followed by a bioinformatics workflow to analyse the resulting sequences (Figure 2). This analysis aims at detecting and scoring variable regions among the individuals that can be used as markers to produce unique genotypes.
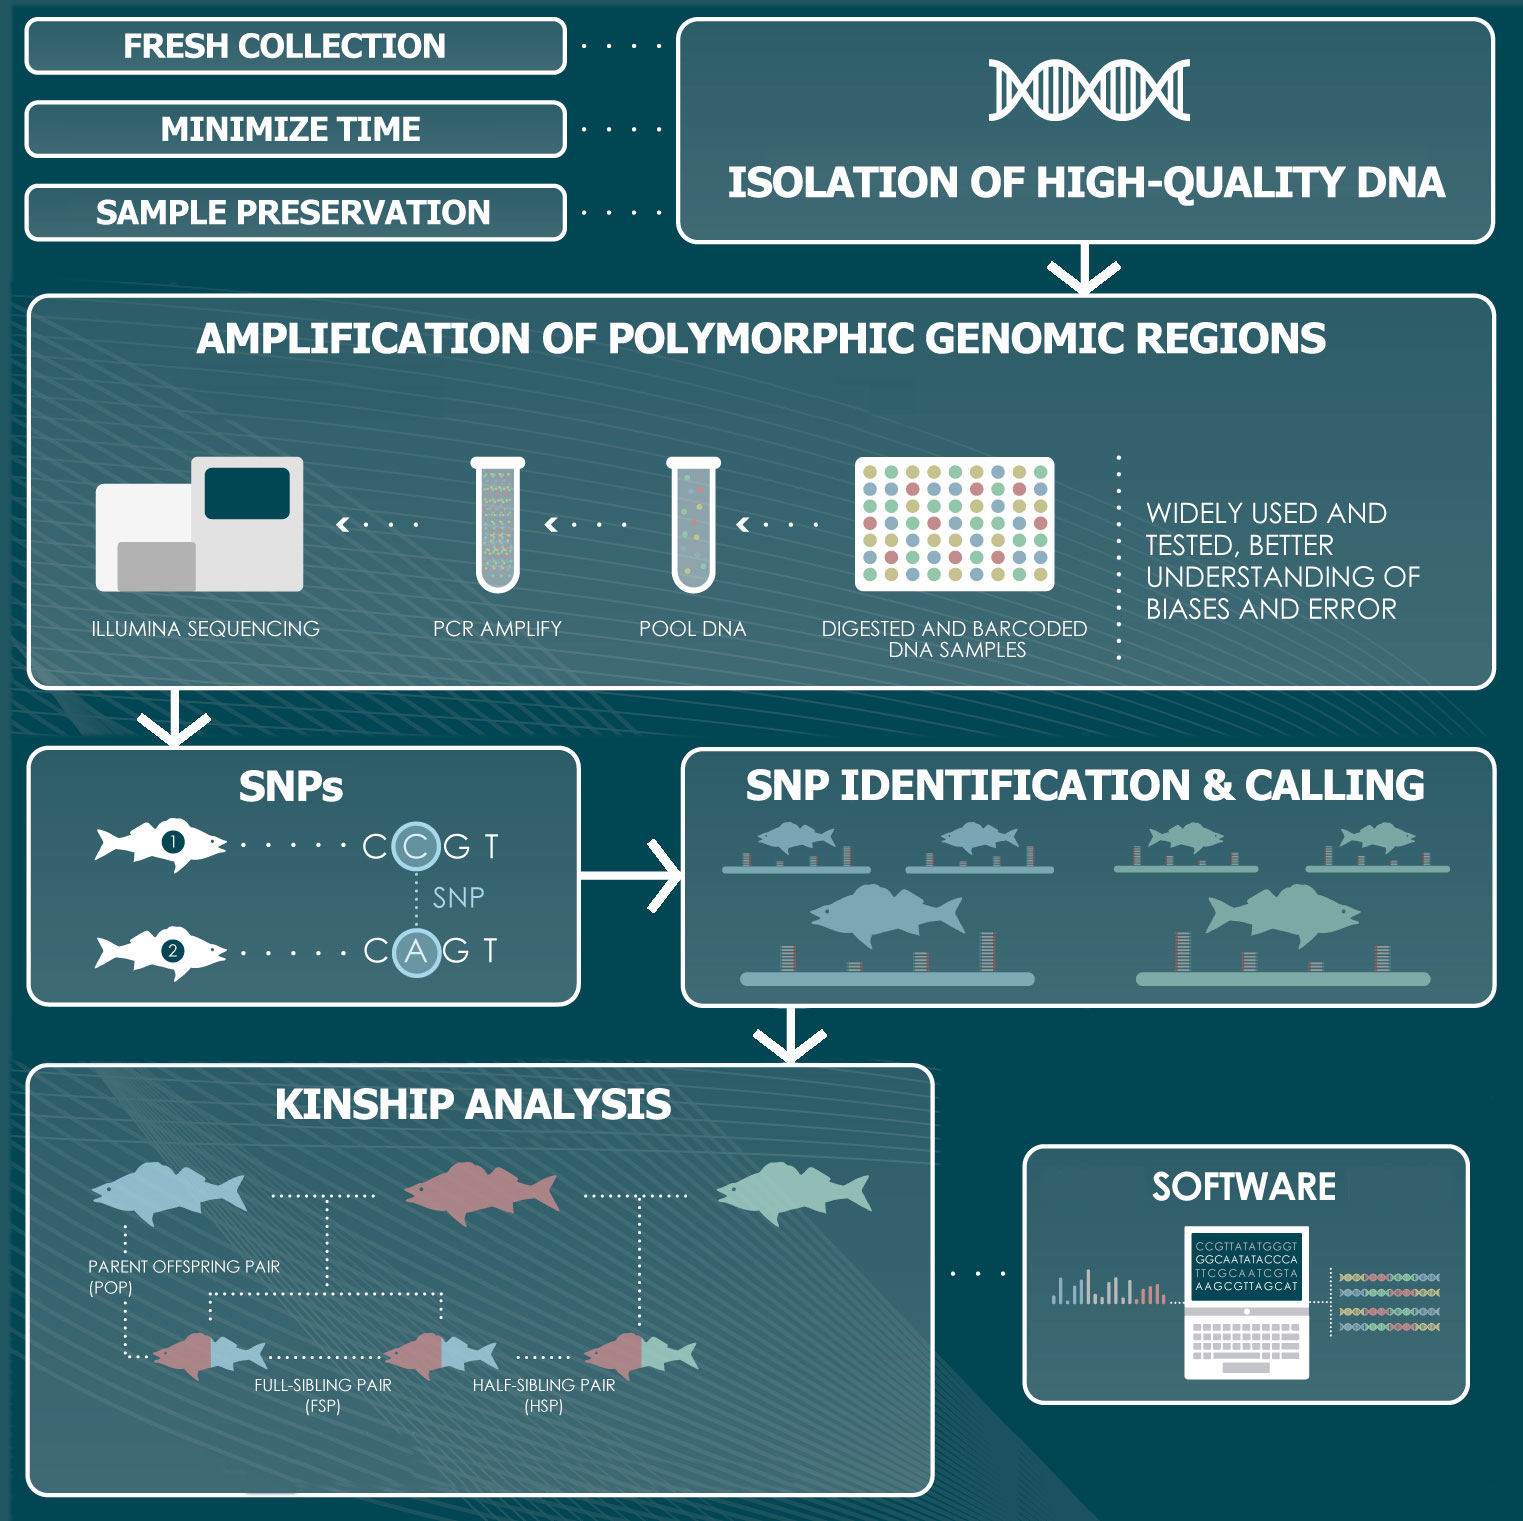
Figure 2 Representation of the genomics and bioinformatics steps involved in a CKMR study. The workflow entails the isolation of DNA, the amplification of polymorphic regions across the genome of the species of interest, the identification of molecular markers and the genotyping of the specimens, followed by an analysis of the kinship relationships among them to infer parent-offspring and half-sibling relationships.
The first step is the isolation of DNA and the importance of obtaining the highest possible quality cannot be overemphasized, as it is essential to later produce the best possible sequencing reads. The collection of tissue samples for CKMR studies commonly relies on a biopsy of tissue, such as a fin clip or a small piece of skin, which does not require the sacrifice of the specimen. Alternatively, a range of soft tissues can be targeted, including spleen, heart, blood, kidney or muscle, if specimens are sacrificed. A suitable storage of the tissues collected is essential to guarantee the integrity of the DNA. An adequate preserving solution (e.g. 90% ethanol, DNAzol, DMSO-EDTA, DNA/RNA Shield™, RNAlater) should be used, and is also important to minimize the time between collection and storage to prevent tissue degradation (Mulcahy et al., 2016; Oosting et al., 2020; Dahn et al., 2022). If the DNA is not isolated promptly, samples should be kept at -20°C. Handling procedures should minimize the risk of cross-contamination between different individuals. This is especially pertinent to studies involving the collection of tissue samples at sea, on board of research or commercial vessels, where access to sterile tools and clean workspaces is often limited (Anderson et al., 2023). Care is also needed in subsequent steps, as the risk of contamination remains along the sample processing. Sample contamination and mixing can seriously impact downstream results, causing erroneous inferences and is a common problem in large-scale studies (Zajac et al., 2019; Francois et al., 2020; Anderson et al., 2023).
Several DNA isolation methods can be used, from the classic phenol–chloroform DNA extraction method to any of the multiple high purity DNA isolation commercial kits available, as long as they produce high molecular weight genomic DNA. A large number of comparative studies have tested the efficiency of different methods in terms of DNA quality, quantity and purity (i.e. rate of fragmentation, concentration and rate of contaminants, respectively) showing that it is highly dependent on the tissue processed, the storage conditions and the species [e.g. (Silva et al., 2019; Martincová and Aghová, 2020; Lutz et al., 2023)]. Martincová and Aghová (2020), tested 12 different DNA extraction methods from eight manufacturers, including some the most widely used commercial silica membrane-based kits. The authors assessed the quality of the DNA obtained from four tissues of two vertebrate species and found that the highest DNA yields were consistently obtained with one of the kits but different ones produced a better DNA quality, in terms of purity and fragmentation. In the tests carried out by Lutz et al. (2023), three extraction methods were tested on several fish tissues and the results are in contrast with those found by Shuttleworth and Oosthuizen (2022) and Oduoye et al. (2020), who also tested several isolation methods in fishes from different species. These marked differences highlight the need of a thorough testing and optimization of the DNA preservation and isolation method on every CKMR study. Additionally, when selecting a method is also important to consider the cost, the processing time and the technical requirements of the different methodologies, as they differ widely (Silva et al., 2019; Martincová and Aghová, 2020; Oduoye et al., 2020).
The DNA quality, quantity and purity strongly affects downstream molecular analysis, conditioning the subsequent choices of markers and methods, as well as the bioinformatics workflow but poor quality DNA is highly unlikely to produce the accurate data need in CKMR studies, regardless of the choices.
After obtaining high-quality genomic DNA for each individual, the next step consists on the amplification and sequencing of this material to discover polymorphic regions across the genome of the species under study. These variable regions are heritable and, therefore, can be used as genetic markers, enabling the identification of closely related specimens (Stage 3) needed in CKMR studies. Accurate kinship analysis requires high resolution markers, which can be either highly polymorphic or very numerous to tackle the inherent challenges of studying wild populations, often characterized by large sizes, small numbers of true closely related individuals sampled and a high number of comparisons (Städele and Vigilant, 2016). All CKMR studies published to date have relied on either microsatellites (STRs) (Bravington et al., 2016a; Ruzzante et al., 2019; Marcy-Quay et al., 2020; Prystupa et al., 2021) or, more recently, on single nucleotide polymorphisms (SNPs) (Hillary et al., 2018; Wacker et al., 2021; Delaval et al., 2022; Patterson et al., 2022; Trenkel et al., 2022). The former consist of tandem repeats of short (one to six base pairs) genetic elements, in which differences between alleles are primarily in the number of repeats (Webster and Reichart, 2005). The latter, constitute the most common form of variation in a genome and are characterized by the substitution of a single nucleotide at a specific location (van Dijk et al., 2014). Both types have advantages and drawbacks and the optimal choice depends on several factors, reviewed below.
The first CKMR study that demonstrated the ability of the method to estimate abundance of a fish population was based on STRs and several others followed suit (Bravington et al., 2016a; Ruzzante et al., 2019; Marcy-Quay et al., 2020; Prystupa et al., 2021). The use of STRs involves a costly and time-consuming investment in their isolation and characterization, although the emergence of high capacity sequencing technologies have facilitated this process in recent years (Ellis et al., 2011; De Barba et al., 2017). High-throughput sequencing techniques (HTS) enable the simultaneous sequencing of large numbers of DNA fragments, sensibly reducing costs and processing times compared to previous technologies (Reuter et al., 2015). Several tools for identifying STRs from high-throughput data exist [e.g.: SSR pipeline, (Miller et al., 2013)], although false positive results and limited quality is still an issue, requiring often further experiments to identify and validate the polymorphic STRs (Guang et al., 2019). Moreover, current techniques present difficulties regarding amplification calibration and the choice of informative STRs with high specificity (Pimentel et al., 2018). The analysis of STRs from high-throughput sequences is hampered by their high propensity to vary in size during both the PCR amplification and the sequencing reaction itself. Another disadvantage of STRs, due to their PCR based nature, is that mutations in primer regions can lead to non-amplifying ‘‘null alleles’’ that can pose problems for kinship assignments (Paetkau and Strobeck, 1995; Ishibashi et al., 1996). Nonetheless, STRs also carry a number of significant advantages, being the most important, in the context of CKMR studies, a series of characteristics that make them especially useful for estimating kinship and relatedness. They are codominant markers, highly polymorphic due to high mutation rates, with a high power for paternity analyses (≈6× that of SNPs) and low requirements in terms of DNA amount and quality. In fact, the ability of STRs to accurately assign parentage from highly degraded DNA samples has been validated (De Barba et al., 2017). Therefore, they might be a suitable choice for CKMR studies that have to rely on the analysis of samples that do not reach the recommended DNA quality standards, if identification of first-degree relatives alone is sufficient. Moreover, STR genotyping is less expensive than SNP genotyping (Puckett, 2017; Lemopoulos et al., 2019), a very relevant factor in any CKMR study involving natural populations of interest in fisheries, as these mostly require the analysis of very large numbers of individuals [e.g (Bravington et al., 2016a; Trenkel et al., 2022)].
Single nucleotide polymorphisms (SNPs), on the other hand, have become increasingly popular in population genetic studies (von Thaden et al., 2017; Torrado et al., 2020; Wenne et al., 2020; Crespel et al., 2021) and, more specifically, in CKMR studies (Hillary et al., 2018; Wacker et al., 2021; Delaval et al., 2022; Trenkel et al., 2022). SNP markers show several practical improvements over STRs to conduct kinship analysis, including their higher abundance in the genomes, a lower and predictable mutation rate and their easier automation that results in a higher reproducibility (Amorim and Pereira, 2005; Anderson and Garza, 2006; Fisher et al., 2009). Their main constraint is the limited genetic information they provide per locus, but given a sufficient number of markers, their collective strength can resolve almost any parentage or close kin relationship. Several studies have compared the power of SNPs and STRs in a parentage context and in virtually every case, the studies concluded that SNPs are at least as powerful as STR markers [for review see (Flanagan and Jones, 2019)].
Considering their characteristic, the latest CKMR studies and the increasing efficiency and affordability of genotyping genomic techniques, we argue that SNP markers are the sensible choice for any project initiating today, unless budget constraints or DNA quality advises otherwise. Thus, hereafter, we focus on methodologies and bioinformatics pipelines solely based on SNPs.
In spite of the outstanding developments in sequencing technologies and bioinformatics tools in the last decades and the worldwide initiatives to improve genomic resources across species [e.g.: the Vertebrate Genomes Project, (Rhie et al., 2021)], these are still scarce in non-model species (Christiansen et al., 2021). This is particularly true for fish (Fan et al., 2020) and thus, in a fisheries context, CKMR studies must target, mostly, wild populations of thousands to millions of individuals for which few prior genomic resources are available. Several methodologies can be used for the simultaneous discovery of thousands of genomic regions containing SNPs across genomes, and they can be broadly grouped into three categories (Table 1); i) restriction enzyme-based methods, ii) combined enzyme-based hybridization capture methods, iii) whole-genome sequencing methods.
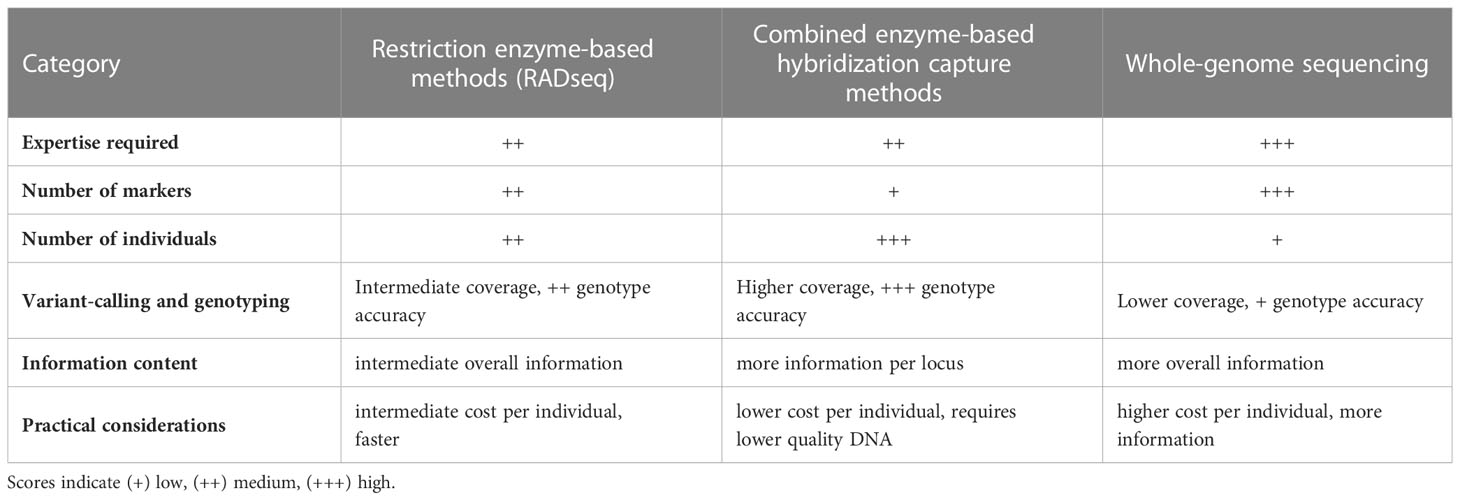
Table 1 Comparison of the main properties of restriction enzyme-based methods, combined enzyme-based hybridization capture methods and whole-genome sequencing methods for the discovery of SNP markers across genomes.
The first two categories measure polymorphisms in a subset of genomic regions, a more economical approach than sequencing the whole genome, especially in studies involving a large number of individuals. They can assess accurately a wide array of biological questions and have been the choice in CKMR studies based on SNPs published to date (Hillary et al., 2018; Wacker et al., 2021; Delaval et al., 2022; Trenkel et al., 2022).
Restriction-enzyme-based methods were specifically developed to reduce the proportion of the genome targeted for sequencing. They define a large group of HTS methodologies that involve the digestion of genomic DNA with restriction endonucleases and the sequencing of the resulting restriction fragments. They encompass several classes of methodologies, including genotyping-by-sequencing [GBS (Elshire et al., 2011)], reduced-representation libraries [RRLs, (Van Tassell et al., 2008)], complexity reduction of polymorphic sequences [CroPS, (van Orsouw et al., 2007)] and restriction-site-associated DNA sequencing [RADseq (Miller et al., 2007; Baird et al., 2008)] that share key steps but also have substantial differences [reviewed in (Davey et al., 2011)]. The latter are especially useful for CKMR studies that often target organisms lacking a well-assembled reference genome, as they can provide high genome-wide marker densities scored with high accuracy (Davey et al., 2011). The term RADseq is used today to refer not only to the original (single digest) RADseq protocol but also to a number of variants that were developed to suit specific experimental needs. These include ddRADseq (Peterson et al., 2012), 2bRAD (Wang et al., 2012), ezRAD (Toonen et al., 2013), 3RAD (Graham et al., 2015), nextRAD (Fu et al., 2017) and quaddRAD (Franchini et al., 2017), among others (reviewed by Andrews et al., 2016; Campbell et al., 2018). However, with the notable exception of double-digest RADseq (ddRAD), the majority of these derivatives consist of only minor and subtle modifications of the parent protocol and have only been marginally used and tested, preventing their application in CKMR studies. The 2RAD and 3RAD methods (Bayona-Vásquez et al., 2019; Glenn et al., 2019) are also noteworthy as they overcome some of the technical challenges of RADseq-based methods, providing an efficient, flexible, and low-cost system to analyse large numbers of individuals. The 2RAD/3RAD methods have a lower startup cost and a higher capacity for sample multiplexing, as well as a simplified workflow that facilitates their implementation (Bayona-Vásquez et al., 2019). Nonetheless, it is important to note that technical differences among the methods lead to important considerations for the types of bias and error inherent in the resulting data and these are much better understood in sequences generated by sdRADseq and ddRADseq techniques (Andrews et al., 2016).
The original single digest Restriction site Associated DNA is arguably the most popular reduced representation sequencing technique and has a number of advantages for identifying kinship-informative SNPs in non-model organisms. This technique sequences short regions surrounding essentially all restriction sites for a given restriction endonuclease (assuming a sufficient sequencing depth). Restriction fragments are randomly sheared to a length suitable for the sequencing platform of choice, and selective PCR is normally used to amplify for sequencing only those fragments containing a restriction site, generating a data set of RAD tags (sequences downstream of restriction sites) that derive from a much-reduced part of the original genome. The most popular derivative, ddRADseq differs from sdRADseq in two principal aspects. First, it eliminates the need for a sonicator, a specialized instrument not necessarily available in a standard molecular laboratory, using instead a double restriction enzyme digest (i.e., a restriction digest with two enzymes simultaneously). Second, it introduces a precise selection for genomic fragments by size since it relies on the distance between cut sites to determine the length of DNA that is sampled (Peterson et al., 2012).
Both techniques are flexible in the number of loci they can target as the choice of restriction enzyme(s) determines the number of resultant SNP markers. Considering that in CKMR studies it is critical to obtain a sufficient number to resolve kinship accurately, it is highly recommended to perform a prospective data simulation to model accurately the number and distribution of expected RAD loci before initiating a study. Simulations allow testing the behaviour of different molecular protocols in the system of interest, as well as assessing the magnitude of data recovered given variable experimental conditions. This can be performed by several tools, including simRAD (Lepais and Weir, 2014), ddRADseqtools (Mora-Márquez et al., 2017), RADinitio (Rivera-Colón et al., 2021) and PredRAD (Vendrami et al., 2019).
Restriction enzyme techniques are suitable to analyse sample sizes of a few thousand individuals or less, the range of most teleost CKMR studies published to date (Hillary et al., 2018; Ruzzante et al., 2019; Marcy-Quay et al., 2020; Prystupa et al., 2021; Wacker et al., 2021; Delaval et al., 2022). For larger sample sizes, a better strategy, in terms of costs and time, is the use of RADseq on a subset of samples for SNP discovery first, and subsequently using this information to design a custom panel of SNPs (called SNP chip or SNP array) for genotyping of the remaining samples (Trenkel et al., 2022). This approach has further advantages as it ensures consistent sequencing of the same genomic regions and significantly simplifies the analysis. SNP chips serve as a black-box presence-absence for each allele at each locus and a computer reports which alleles are present. The current generation of microarrays can accommodate hundreds of thousands or millions of DNA fragments (oligonucleotides) and the genotyping in parallel of hundreds of individuals (Adler et al., 2013). SNP chips can also serve as a workaround when is not possible to consistently obtain high-quality DNA samples, although the design of a SNP chip inevitably requires a small number of high-quality samples (Maunder et al., 2021).
This is precisely the basis of the second category of assays “combined enzyme-based hybridization capture methods”, which use a restriction-enzyme-based method to identify candidate SNP loci for capture bait design and subsequently employs custom capture baits to enrich candidate SNP loci before sequencing (Hoffberg et al., 2016). The coupling of these two strategies improves the consistency of genotype data compared to stand alone restriction enzyme methods as it produces higher sequence read coverage of a refined set of loci, improving confidence in genotype calls. Additionally, it allows the multiplexing of a larger number of samples within a fixed sequencing effort, substantially reducing the cost per individual (Andrews et al., 2014; Ali et al., 2016). This group of “enriched” methods encompass several approaches, including Rapture (Restriction-site associated DNA capture; RAD capture) (Ali et al., 2016), Hybridization Capture Using RAD Probes (hyRAD), RADcap (Hoffberg et al., 2016) or HyRADX (Schmid et al., 2017).
The third category that could be used for the discovery of SNPs across a given genome are whole-genome sequencing (WGS) methods, which are rapidly becoming popular in ecological studies although have never been tested in a CKMR approach (Taylor et al., 2021). WGS methodologies provide significantly more information compared to the previous two categories, as they can theoretically unveil all the polymorphisms in a genome. Although they have, in principle, more resolution than needed for CKMR studies and a significantly higher cost, the application of WGS has the potential to boost the power of close kin analyses. Current studies are based on close kinship involving first and second order relatives; parent-offspring and half-sibling pairs. Nonetheless, WGS in species with well-assembled genomes could provide sufficient information to reliably identify one or two orders more distant pairwise relationships (e.g. half-first cousins or great uncles) requiring the analysis of a smaller percentage of the population´s individuals to accurately estimate parameters of interest (Anderson, 2022b).
Once the sequences have been obtained, the next step involves the use of bioinformatics tools to convert this raw genetic data into a final set of SNP and genotype calls consisting of an inferred allele (i.e. AA, BB, AB) at each SNP locus for each individual analysed. Although analytic strategies vary across different high-throughput technologies, they all require critical validation to ensure precise and unbiased interpretation (Shafer et al., 2017). The number of SNP loci required to ensure a suitable statistical power for kinship analyses will vary across study systems based on genetic diversity, mating system, and the number of individuals sampled (Kopps et al., 2015).
The steps of the bioinformatics pipeline used to produce the genotypes need to be tailored to the methodology used to generate the libraries and the sequencing technology; however, all bioinformatics workflows share some common goals. For example, they must take into account the moderate genotyping error rate inherent in HTS data, identify and remove SNPs in paralogous and other repetitive genomic regions, and generate a set of unlinked loci. There are some basic steps that are similar among all pipelines, starting with the demultiplexing step that serves to assign each sequence to its individual of origin [e.g. (Torkamaneh et al., 2017)]. This is followed by a pre-processing of the reads that includes a quality control and filtering steps to eliminate poor-quality or suspected artifactual SNP loci. The reads are subsequently assembled or aligned. If a reference genome is available, sequence reads are aligned to the reference using an alignment software such as Bowtie2, TopHat2, BWA or STAR, among others [for a comparison of their performance see (Musich et al., 2021)]. Alternatively, loci can be assembled de novo by clustering similar sequence reads together and assuming that variation among reads at a locus represents either sequencing error or true allelic variation. The final step consists on the discovery of polymorphic loci and the inference of the genotypes at these loci for each individual. Bi-allelic SNPs are identified for each individual sample and a filtering step is used to remove uninformative and unreliable loci to keep only high quality, error free genotypes. Retaining only reliably scored SNPs is essential in CKMR studies since the genotypes are subsequently used to infer kinship, thus locus appearing inconsistent with the assumptions underlying Hardy-Weinberg Equilibrium, showing linkage disequilibrium, and with low call frequencies must be filtered out (Trenkel et al., 2022).
There are a number of bioinformatics software packages that have been developed specifically to aid the workflow analysis of reduced-representation sequencing data. Several of these platforms utilize the same tools and algorithms commonly applied to whole-genome sequence data, while others utilize specifically developed algorithms. For RADseq, the most popular software analysis is Stacks v2 (Rochette et al., 2019) and its previous version, Stacks v1 (Catchen et al., 2013). This program is designed modularly to perform sequentially cleaning and filtering of raw sequence data, building loci, creating a catalog of loci, and matching samples back against the catalogue, transposing the data, adding paired-end reads to the analysis and calling genotypes.
Stacks employs a de Bruijn graph assembler to build contigs from paired-end reads and overlap those contigs with the corresponding single-end loci. This enables a Bayesian genotype caller to provide precise SNPs, and a robust algorithm to phase those SNPs into long haplotypes, generating RAD loci spanning several hundred base pairs (Rivera-Colón et al., 2021). Stacks implements several alternative models to call SNPs and genotypes and then converts SNPs into phased haplotypes using a graph‐based algorithm that relies on sequence data, specifically on co‐observations of alleles within a read pair. Despite its wide adoption, generating a reliable set of loci for downstream analysis requires appropriate use of the software and this implies the non-trivial task of selecting some parameters throughout the pipeline. Such parameters depend on key features of the RADseq dataset under analysis and enforces to explore the parameter space and assess how the analysis software interacts with the biological signal (Paris et al., 2017). Although these complex genomic analyses remain a daunting task for many researchers, very detailed road maps for a correct use of Stacks and robust SNP calling are available (Paris et al., 2017; Rochette and Catchen, 2017; Rochette et al., 2019; Rivera-Colón and Catchen, 2022).
Other alternatives include Ipyrad (Eaton and Overcast, 2020) which allows for the inclusion of indel variation and requires selecting a set of parameters that will affect SNP calling, analogous to Stacks v2. The pipeline dDocent (Puritz et al., 2014a), depends largely on other bioinformatics software packages and performs SNP calling using a Bayesian statistical framework with FreeBayes (Garrison and Marth, 2012). There are also a number of software that use genotype likelihoods and probabilities rather than explicit genotype calls. Analysis of Next Generation Sequencing Data (ANGSD) (Korneliussen et al., 2014) and polyRAD (Clark et al., 2019) estimate a posterior probability from the priors and likelihoods for each individual and allele using Bayes’ theorem (Wang et al., 2019), facilitating the incorporation of statistical uncertainty regarding genotypes.
Genotype data produced by high throughput sequencing and SNP arrays are imperfect due to missing (errors of omission) and erroneous (errors of commission) genotypes (Faria et al., 2011; Carroll et al., 2018). These errors strongly affect genotype-based analyses, such as inferences of identity, relatedness and relationship, resulting in incorrect assignments (Wang, 2010; Gomez-Raya et al., 2022). CKMR studies often target natural populations where most individuals are unrelated. In this context, ignoring or underestimating genotyping errors during SNP-based kinship inference can cause the exclusion of true relatives or false-positive assignments, having a great impact on the subsequent estimation of population parameters. Thus, in CKMR studies it is essential to minimize genotyping errors by avoiding artefacts that have the potential to bias allele frequencies and cause false alleles. Allelic dropout causes the masking of some alleles and occurs when there is a failure during the amplification of one or both alleles of a diploid individual (Sommer et al., 2013). If only one allele drops out, the other is revealed alone causing the misinterpretation of the individual as homozygous at the concerned locus. If drop out affects both alleles, it causes missing genotypes. In enzyme-based methods, allelic dropout manifests when the restriction enzyme recognition site contains a polymorphism, resulting in a failure to cut the genomic DNA at that location (Andrews et al., 2016). It has been shown that allele dropout increases with overall levels of polymorphism and has a greater impact on data generated by ddRAD than the original sdRAD, because loci depend on the presence of two cut sites rather than one (Arnold et al., 2013a; Gautier et al., 2013a). In capture-targeted assays, variability in regions surrounding the targeted SNP sites can interfere with hybridization introducing dropout-like effects (Gershoni et al., 2022).
Allelic dropout is generally caused by random effect and strongly correlated with three well know artefacts that can be introduced at various stages of the genomic workflow; poor DNA quality and quantity, low sequencing coverage and PCR duplicates (Nielsen et al., 2011; Puritz et al., 2014b).
Poor DNA quality strongly compromises the accuracy of genotype data. Restriction enzyme methods are highly susceptible to degraded DNA, since it reduces dramatically the percentage of identical regions amplified among samples, strongly affecting the ability to identify SNPs. Additionally, the sequences produced from low quality DNA suffer from low quality scores or high uncertainty of base calls, resulting in high error rates and low genotyping call rates (Graham et al., 2015). Low amounts of DNA, on the other hand, require more cycles in protocols that include a PCR enrichment step to produce enough DNA for sequencing, introducing further biases and additional sequencing errors due to PCR amplification (Davey et al., 2013; Cumer et al., 2021). However, newer protocols like 3RAD have an improved performance, compared to traditional RADseq methods, that makes them better suited to low input DNA concentrations (Bayona-Vásquez et al., 2019).
To a less extent, targeted sequencing assays that select regions of interest through PCR amplification (amplicon-based approaches) or hybridization enrichment (bait hybridization) are also affected by poor DNA quality and quantity. The former requires annealing to the locations flanking the regions of interest while in the second the DNA hybridizes to a bait oligonucleotide. In both cases, the use of degraded DNA affects the uniformity of coverage across genomic targets and increases the likelihood of capturing off-target regions (So et al., 2018). With small amounts of DNA, extensive PCR amplification is needed, to generate a sufficient number of sequencing library molecules, exacerbating biases associated to this process.
Coverage (or depth) in DNA sequencing refers to the number of reads that align to a specific locus in a given genome. Since high throughput sequencing has an inherent error rate that compares unfavourably to Sanger sequencing, it normally requires a minimal number of reads to ensure accuracy of the bases detected (Huang and Knowles, 2016). A high coverage permits the calling algorithms to assess SNPs with a higher likelihood, resulting in a larger percentage of true loci (Paris et al., 2017). Loci below the coverage threshold has, in contrast, a high uncertainty and should be filtered out during the bioinformatics analysis, but when the starting coverage is deficient, this may result in the removal of all or most of the loci. Insufficient coverage is a common mistake in restriction-enzyme based studies and the main reason behind large genotyping error rates in SNPs (Fountain et al., 2016). This is especially relevant in CKMR studies that aim at determining kinship relationships. As a general rule, studies using restriction enzyme methods should aim at a minimum depth coverage of 25X to minimize genotyping error rates (Paris et al., 2017). Moreover, before embarking in a RADseq experiment, an estimation of the coverage should always be performed before library construction, based on the number of cut sites and the number of multiplexed samples (Rivera-Colón et al., 2021).
Finally, high throughput sequencing generally involves the preparation of libraries that mostly include a PCR step that generates copies (“PCR duplicates”) of the original DNA fragments (“parent fragments”). Stochastic effects during PCR can cause uneven amplification of heterozygous alleles, causing two undesired phenomena. First, heterozygotes would appear as homozygotes and additionally, alleles containing PCR errors can appear as true alleles because PCR duplicates spuriously increase confidence in their calling (Andrews et al., 2014; Puritz et al., 2014b). Failure to remove bioinformatically PCR duplicates can potentially lead to downstream errors in genotyping (Tin et al., 2015; Flanagan and Jones, 2019) although this phenomenon is still being intensely debated ((Euclide et al., 2020). Thus, an important point to consider when selecting the genotyping method in a CKMR study is whether the assay allows the removal of PCR duplicates (Andrews et al., 2016). For instance, both sd- and ddRAD methods have a PCR step in their protocols, but only the first allows their removal. This is possible because the sdRADseq protocol has a mechanical fragmentation step, absent in ddRADseq, which generates fragments of slightly different sizes. Removal of PCR duplicates is only possible with ddRADseq if the protocol is modified to incorporate random oligo-nucleotides into the barcodes of the molecular library (Rochette et al., 2019). Thus, dual-digest techniques like quaddRAD and 2RAD/3RAD are suitable for CKMR studies, as they include molecular ID tags that allow detection and removal of PCR duplicates (Franchini et al., 2017; Bayona-Vásquez et al., 2019). Another alternative would be the use of a PCR-free protocol with any RADseq-based method but this approach has important drawbacks, as it is costly and has substantial technical limitations, especially with regard to the starting DNA amount (Toonen et al., 2013; Rochette et al., 2023).
The last step of the bioinformatics pipeline in any CKMR study consists on a precise detection of the close inter-familial relationships between the individuals present in a sample, based on their genotypes, using statistical methods that need to be adapted to the nature of the data (Bravington et al., 2016b; Ruzzante et al., 2019). The identification of related specimens is possible because of inheritance, as different types of kinship share different degrees of genetic relatedness (Städele and Vigilant, 2016). When two specimens reproduce, they each pass, on average, half of their DNA on to their progeny, in diploid organisms (i.e. those that have two complete sets of chromosomes, one from each parent; includes most animals). Thus, parent-offspring share 50% of their genome, approximately the same percentage as full-siblings although each of these relationships has a distinct chromosomal sharing pattern. Second-degree relatives (half-siblings) share, on average, 25% of their genomes and are also informative in CKMR studies (Waples et al., 2018; Delaval et al., 2022; Patterson et al., 2022). Despite the distinctiveness of the shared patterns, assigning individuals into discrete kinship categories such as “full-siblings” or “half-siblings” is difficult because the percentage of the genome shared can vary considerably due to stochastic processes that occur during cell division (Städele and Vigilant, 2016). Kinship analysis in wild marine fish populations is, moreover, a unique challenge due to the necessity to make large numbers of pairwise comparisons and the low percentage of true kinship pairs, requiring large panels of genomic markers to infer close relationships with accuracy [e.g. (Marcy-Quay et al., 2020; Delaval et al., 2022; Trenkel et al., 2022)].
Statistical methods used to assess kin relationships from molecular data can be grouped into three broad categories: 1) exclusion methods; 2) relatedness-based methods; and 3) likelihood-based methods, which are of increasing power, but have substantial computational costs as a trade-off (Huisman, 2017).
Exclusion methods are qualitatively based on Mendel’s laws of inheritance, excluding a relationship among a set of individuals if their genotypes are incompatible given the relationship under the laws. They are very fast and simple in concept and implementation, but suffer from several weaknesses, including the difficulty to incorporate genotyping errors and mutations that can invalidate true kinship pairs (Wang, 2012).
Relatedness-based methods estimate pairwise relatedness or kinship coefficients between individuals, and use these to categorize the data into first-degree relatives, second-degree relatives and unrelated. These coefficients quantify the amount of genetic sharing between pairs of individuals reflecting the actual level of shared ancestry between two individuals based on their DNA (Goudet et al., 2018). In simple systems, with non-overlapping generations and no inbreeding, a simple measure of relatedness, defined as the probability that a pair of randomly sampled homologous alleles are identical by descent (IBD), might be sufficient to assign kinship (Huisman, 2017). Nonetheless, most marine fish populations are characterized by overlapping generations, requiring a more precise description to differentiate between kinship types. Table 2 reflects the probability of sharing 0, 1 or 2 alleles that are IBD (kinship coefficients κ0, κ1 and κ2), for some common relationships, although neither pairwise measure can distinguish between half-siblings, grandparents and full aunts/uncles (all k=0.25).
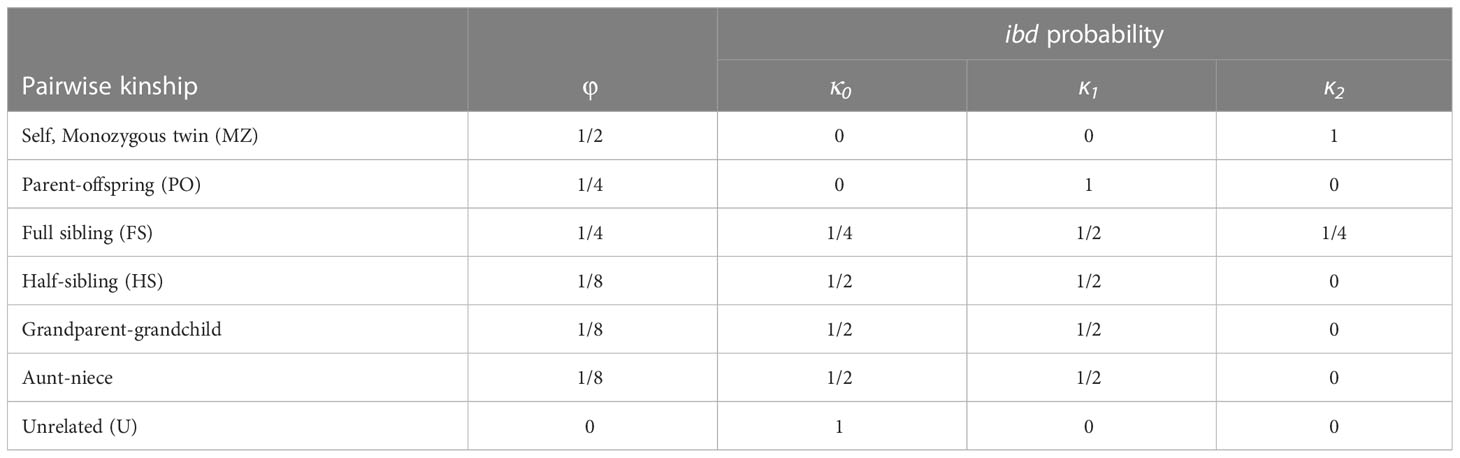
Table 2 Kinship categories (pairwise kinship) with their corresponding kinship coefficient (φ) and probability of sharing zero, one or two alleleles identitcal-by-descent (ibd) (κ0, κ1 and κ2).
Likelihood methods are, in comparison, more powerful, accurate, and robust but computationally more demanding and thus, more suitable to achieve the accuracy needed in CKMR studies. Methods in this third category consider the relationships among all individuals in a sample to assign kinship so for large data sets with many individuals and markers, this approach can be computationally daunting (Wang, 2012). In such cases, is common to reduce computational cost by considering only pairwise likelihoods, ignoring all other individuals related or unrelated to the pair (Huisman, 2017). This group of methods work upon genotype likelihoods or posterior probabilities, allowing the incorporation of the uncertainty of genotype calls (Herzig et al., 2022).
Accuracy of kinship inference can be affected by two issues, false-positives that happen when an unrelated pair share enough alleles by chance to look as a related pair, and false-negatives that arise when a pair appears not to share alleles that are, in fact, present in both. The chance of false positives decreases with the increment in number of loci used and needs to be assessed in advance using the allele frequencies (and the per-locus exclusion criterion) to ensure the use of enough loci (Harrison et al., 2013a; Harrison et al., 2013b). False negatives cannot be predicted in advance and appear due to null alleles and genotyping errors that produce the incorrect recording of the true alleles, leading to the rejection of true kinship pairs (O’Leary et al., 2018). Incorporating both errors in kinship assignment is paramount in CKMR studies of marine teleost since they mostly target large populations. In a pairwise analysis of kinship, the expected number of related pairs is only a very small fraction of the total number of comparisons [e.g. (Bravington et al., 2016a; Trenkel et al., 2022)]. The large-scale sparse kinship nature of such applications determines a large effect of the inclusion of spurious kin or the exclusion of real kin pairs on subsequent estimates of population parameters.
Published CKMR studies targeting marine populations to date have all been based on the detection of Parent-Offspring-Pairs (POPs) and/or Half-Sibling-Pairs (HSP) (Bravington et al., 2016a; Hillary et al., 2018; Ruzzante et al., 2019; Marcy-Quay et al., 2020; Prystupa et al., 2021; Wacker et al., 2021; Delaval et al., 2022; Trenkel et al., 2022). They have mostly relied on the use of specifically designed algorithms to incorporate false positive and negative rates (see (Bravington et al., 2016a; Bravington et al., 2016b; Hillary et al., 2018) for full details of developing a likelihood-ratio kin identification statistic). Two statistics known as WPSEX (Weighted PSeudo-EXclusion) and PLOD (Pseudo log-odds) scores have been used in CKMR studies to calculate the probability of POPs and HSPs, respectively, between pairs of individuals (Bravington et al., 2016b; Hillary et al., 2018; Trenkel et al., 2022). WPSEX is designed to robustly identify parent-offspring pairs from biallelic SNP data characterized by many loci that may have (heritable) null alleles, and occasional genotyping errors that may prevent the (non-heritable) detection of alleles. The frequency of null alleles per locus is estimated in advance by maximum-likelihood, assuming Hardy-Weinberg equilibrium and does not require estimates of genotyping error rate (Trenkel et al., 2022). The PLOD score provides the pseudo-likelihood that a pair of animals are HSPs and results from summing the log-likelihood per locus. A higher WPSEX or PLOD value indicates a greater likelihood that the pair are a POP/HSP, respectively. These scores are ultimately used to identify threshold values for the robust classification of kinship categories (POP, HSP, or UP (Unrelated Pair; all more-distant kinship categories)) (Hillary et al., 2018; Patterson et al., 2022).
An alternative approach followed by CKMR studies targeting solely POPs in populations with simple structure and life-histories [e.g., brown trout (Ruzzante et al., 2019)] was the use of widely available kinship inference software. COLONY (Jones and Wang, 2010) has been often the program of choice (Ruzzante et al., 2019; Marcy-Quay et al., 2020; Wacker et al., 2021) although a bewildering variety of software packages can be used to infer kinship (e.g. SNPRelate (Zheng et al., 2012); NGSRelate (Hanghøj et al., 2019); Sequoia (Huisman, 2017), among many others). Nonetheless, is not always clear how (or indeed whether) some methods differ from others and no systematic comparison studies have been performed, even less so in a CKMR framework. Moreover, such full-pedigree methods that attempt to address the huge complexities of family-reconstruction might be computationally too demanding to analyse many teleosts populations, due to their large sizes that imply huge number of possible pairwise relationships (Bravington et al., 2017).
The R package CKMRsim has been recently released and was specifically developed to compute likelihood ratios for different relationships between all pairs of individuals in a data set for close kin mark recapture studies. The software allows the assessment of false positive and false negative rates through Monte Carlo methods (Anderson, 2022a). CKMRsim simulates the genotypes of related pairs of individuals from the estimated allele frequencies and then calculates the probabilities of those genotype pairs to compute a log-likelihood ratio of the true relationship vs. the hypothesis of no relationship. Similarly, genotypes of unrelated pairs are also simulated and their log-likelihood ratios computed. The comparison of observed likelihood ratio values of related kin pairs with the distribution of simulated pairwise values is used to select the threshold values for classifying a pair into a given relationship, minimizing wrong assignments.
Two CKMR studies have compared CKMRsim with other kinship inference software. In blue skate, ML-relate identified a slightly higher number of kinship pairs than CKMRsim (27 vs. 19), all HSPs with lower relatedness values than those of HSPs detected by both methods (Delaval et al., 2022). COLONY unveiled, on average (5 runs) 11 more POPs than CKMRsim in Arctic Grayling (37.67 vs 26) (Prystupa et al., 2021). In both cases, all the related pairs detected with CKMRsim were also inferred by the other software’s, but the former was more conservative. These differences are very relevant in CKMR studies, having large effects due to low numbers of kin pairs normally detected. Thus, if a software is selected to perform kinship inference, it is essential to determine whether the package of choice provides sufficient control over false-positive and false-negative error rates to assess confidence in kinship inference.
In addition to genetic markers, complementary biological data (ideally age, otherwise length can be used, sex) should be used as a check point of the feasibility of the inferred kin relationships and identify false‐positive kinship assignments. For example, ancillary data can serve to identify pairs that cannot have the purported relationship due to their relative ages. Depending on the life history of the species, age may also be useful to differentiate relationships that are indistinguishable otherwise. For example, half siblings may be discriminated from grandparent–grandoffspring by the age difference between the individuals in species in which the reproductive life span is shorter than roughly twice the age at first reproduction. This information is also essential to separate within and among-cohort relationships, since only the later are useful in CKMR studies (Hillary et al., 2018; Davies et al., 2020; Maunder et al., 2021; Waples and Feutry, 2022).
Besides nuclear markers, CKMR studies can strongly benefit from the information provided by mitochondrial DNA (mtDNA) (Bravington et al., 2017). While the former are bi-parentally inherited, mtDNA is acquired only from the mother in most animals, including fishes (Breton and Stewart, 2015). This inheritance pattern can be extremely useful in kinship analysis as it can be used to discriminate between half siblings that are related through the father (paternal HSP) and the mother (maternal HSP) (Thompson et al., 2020). This maternally inherited marker is also useful for identifying false-positive assignments of kinship with Mendelian incompatibilities as well as for reducing the misclassification rates (Kopps et al., 2015). In addition, mtDNA of identified kin pairs can be used to uncover differences in the reproductive dynamics of females and males and obtain information on sex ratios, sexually dimorphic mortality, mating strategies or spatial reproductive structure (Mace et al., 2020).
Most species fished worldwide lack the data needed to assess their status, despite the increasing trend of overfished stocks in the last four decades (FAO, 2022). Only a low number of fish stocks, among those targeted by fisheries, are subjected to detailed assessments and all inhabit the waters of developed regions (as in Europe, the USA, Canada or Australia) (Palomares et al., 2020). Even these detailed assessments suffer from recognized shortcomings as they utilize parameters that are known to contain uncertainty (Kokkalis et al., 2017), having a great impact on the quality of the scientific advice provided to management bodies and hence on fishery activity.
There is a crucial need for innovative methodologies that can provide novel means to reduce uncertainty of fish stocks assessments and expand the range of assessed species. Close kin mark recapture is an emerging fisheries independent approach to estimate population parameters with potential to improve fisheries assessments (Bravington et al., 2016b). The method is grounded in genomics and its application requires expertise and knowledge in two distinct fields that have largely evolved separately, complicating its uptake and implementation by fisheries scientist and modellers. In spite of the value of genomic based methods to inform fisheries management being acknowledged, they have seldom been incorporated and remain underutilized to these days (Bernatchez et al., 2017).
The rapid advances and extraordinary number of sequencing and computational technologies certainly represent a major challenge to those outside the genomics field. Moreover, to date CKMR has only been applied to a handful of species, mainly characterized by smaller population sizes than most exploited fish stocks (Bravington et al., 2016a; Hillary et al., 2018; Ruzzante et al., 2019; Marcy-Quay et al., 2020; Prystupa et al., 2021; Wacker et al., 2021; Delaval et al., 2022; Trenkel et al., 2022).
The nature of CKMR studies in a large population setting with sparse sampling, where most individuals are unrelated and the probability of finding closely related individuals is low, determines a large effect of small deviations from true kin numbers on subsequent estimates of population parameters.
Achieving accurate kinship determinations requires strict quality controls at every stage, starting with the isolation of high-quality DNA samples, which is contingent upon an adequate sample preservation. Genetic markers should be selected in terms of the quality and amount of information they provide and we argue that SNPs should be preferred to STRs in contemporary and future CKMR projects. While studies using STRs can often confidently identify only first-order kin relations (parent–offspring or full-sibling), the use of high-density, genome-wide SNP markers can enable reasonably accurate assignment of individuals to second-order (e.g. half-siblings), thereby sensibly reducing the sample size needed in CKMR studies, a requirement that has possibly prevented more widespread adoption of kinship-based methodologies.
A plethora of methods can be used for marker discovery and genotyping but enzyme-based, particularly RADseq methods together with hybridization-based methodologies are particularly suited for CKMR applications. For RADseq, many different protocols are available and each has its own trade-offs but the original sdRADseq has been more intensively tested across multiple systems and the sources of bias in the resulting data are better known (Andrews et al., 2014; Flanagan and Jones, 2019; Rochette et al., 2019). Other variants can also be used as long as they allow identification and removal of PCR duplicates, including the 2RAD/3RAD protocols, which provide a streamlined workflow at a lower cost and can have an increased utility with low-concentration DNA samples (Bayona-Vásquez et al., 2019; Glenn et al., 2019). Undeniably, none of these methods are characterized by the simplicity of their protocols and they require an enormous amount of post-processing, but their advantages clearly outweigh these drawbacks. In parallel, a large number of bioinformatics software, dependent on the genomic method selected, can be applied for the analysis but their use is not always straightforward since it needs to be tailored to the user´s data characteristics. Nonetheless, these steps do not need to be carried out necessarily in-house as they can be outsourced to an ever growing number of companies worldwide.
Inference of kinship using a specific relatedness software is challenging due to the lack of systematic comparison studies among them and because not all provide a sufficient control over false-positive and false-negative error rates to assess confidence in kinship inference. To avoid this problem, the statistics WPSEX and PLOD can be used, alternatively, to identify reliable threshold values for the robust classification of kinship categories (Bravington et al., 2016b; Bradford et al., 2018; Hillary et al., 2018; Thompson et al., 2020; Trenkel et al., 2022). The package CKMRsim was specifically developed to compute likelihood ratios for different relationships between pairs of individuals in a CKMR framework. It has proved more conservative than other software’s in a few studies (Prystupa et al., 2021; Delaval et al., 2022) but its accuracy has not been tested with individuals of known pedigree, to the best of our knowledge.
The use of ancillary data (age/length, sex) and non-autosomal markers (mtDNA) is pivotal to check the feasibility of the inferred kin relationships and identify false‐positive kinship assignments but also to discriminate among types of a degree of kinship (e.g. grandparent–grandoffspring and half-siblings).
Although here we provide useful information to complete the genomics and bioinformatics steps required in a CKMR study today, it is very important to highlight that the application of the method is still very marginal. Considering this fact and the fast pace with which technology in this field progresses, we foresee the incorporation of newer methodologies with the capacity to boost the power of close kin analyses, and facilitate its application to a wider range of fish stocks.
All authors contributed to the article and approved the submitted version.
The information and views set out in this manuscript are based on scientific data and information collected under Service Contract “Improving cost-efficiency of fisheries research surveys and fish stocks assessments using next-generation genetic sequencing methods [EMFF/2018/015]” signed with the European Climate, Infrastructure and Environment Executive Agency (CINEA) and funded by the European Union.
The authors would like to express their gratitude to Gary Carvalho, Laszlo Orban and Allan Tucker for their advice and expert revision of the State of the Art review in which this manuscript is based on.
The authors declare that the research was conducted in the absence of any commercial or financial relationships that could be construed as a potential conflict of interest.
All claims expressed in this article are solely those of the authors and do not necessarily represent those of their affiliated organizations, or those of the publisher, the editors and the reviewers. Any product that may be evaluated in this article, or claim that may be made by its manufacturer, is not guaranteed or endorsed by the publisher.
Adler A. J., Wiley G. B., Gaffney P. M. (2013). Infinium assay for Large-scale SNP genotyping applications. J. Vis. Exp (81), e50683. doi: 10.3791/50683
Ali O. A., O’Rourke S. M., Amish S. J., Meek M. H., Luikart G., Jeffres C., et al. (2016). RAD capture (Rapture): flexible and efficient sequence-based genotyping. Genetics 202, 389–400. doi: 10.1534/genetics.115.183665
Amorim A., Pereira L. (2005). Pros and cons in the use of SNPs in forensic kinship investigation: a comparative analysis with STRs. Forensic Sci. Int. 150, 17–21. doi: 10.1016/j.forsciint.2004.06.018
Anderson E. (2022a). CKMRsim: inference of pairwise relationships using likelihood ratios (R package version). https://eriqande.github.io/CKMRsim/authors.html#citation
Anderson E. C. (2022b). CKMRpop: forward-in-time simulation and tabulation of pairwise kin relationships in age-structured populations. Mol. Ecol. Resour 22, 1190–1199. doi: 10.1111/1755-0998.13513
Anderson E. C., Garza J. C. (2006). The power of single-nucleotide polymorphisms for Large-scale parentage inference. Genetics 172, 2567–2582. doi: 10.1534/genetics.105.048074
Anderson G., Macdonald J. I., Potts J., Feutry P., Grewe P. M., Boutigny M., et al. (2023). Evaluating DNA cross-contamination risk using different tissue sampling procedures on board fishing and research vessels. ICES J. Mar. Sci 80 (4), 728–738. doi: 10.1093/icesjms/fsad004
Andrews K. R., Good J. M., Miller M. R., Luikart G., Hohenlohe P. A. (2016). Harnessing the power of RADseq for ecological and evolutionary genomics. Nat. Rev. Genet. 17, 81–92. doi: 10.1038/nrg.2015.28
Andrews K. R., Hohenlohe P. A., Miller M. R., Hand B. K., Seeb J. E., Luikart G. (2014). Trade-offs and utility of alternative RADseq methods. Mol. Ecol. 23, 5943–5946. doi: 10.1111/mec.12964
Arnold B., Corbett-Detig R. B., Hartl D., Bomblies K. (2013a). RADseq underestimates diversity and introduces genealogical biases due to nonrandom haplotype sampling. Mol. Ecol. 22, 3179–3190. doi: 10.1111/mec.12276
Baird N. A., Etter P. D., Atwood T. S., Currey M. C., Shiver A. L., Lewis Z. A., et al. (2008). Rapid SNP discovery and genetic mapping using sequenced RAD markers. PloS One 3, e3376. doi: 10.1371/journal.pone.0003376
Bayat A. (2002). Science, medicine, and the future: bioinformatics. BMJ 324, 1018–1022. doi: 10.1136/bmj.324.7344.1018
Bayona-Vásquez N. J., Glenn T. C., Kieran T. J., Pierson T. W., Hoffberg S. L., Scott P. A., et al. (2019). Adapterama III: quadruple-indexed, double/triple-enzyme RADseq libraries (2RAD/3RAD). PeerJ 7, e7724. doi: 10.7717/peerj.7724
Bernatchez L., Wellenreuther M., Araneda C., Ashton D. T., Barth J. M. I., Beacham T. D., et al. (2017). Harnessing the power of genomics to secure the future of seafood. Trends Ecol. Evol. 32, 665–680. doi: 10.1016/j.tree.2017.06.010
Bradford R. W., Thomson R., Bravington M., Foote D., Gunasekera R., Bruce B. D., et al. (2018). A close-kin mark-recapture estimate the population size and trend of east coast grey nurse shark (Tasmania: Rep to Natl Environ Sci Program, Mar Biodivers Hub CSIRO Ocean Atmos Hobart). Available at: https://www.nespmarine.edu.au/document/close-kin-mark-recapture-estimate-population-size-and-trend-east-coast-grey-nurse-shark.
Bravington M. V., Grewe J. P. (2007). A method for estimating the absolute spawning stock size of SBT, using close-kin genetics (Hobart, Australia: CSIRO). Available at: https://www.ccsbt.org/ja/system/files/resource/ja/4d93fe45b53f2/18.pdf.
Bravington M. V., Grewe P. M., Davies C. R. (2016a). Absolute abundance of southern bluefin tuna estimated by close-kin mark-recapture. Nat. Commun. 7, 13162. doi: 10.1038/ncomms13162
Bravington M. V., Skaug H. J., Anderson E. C. (2016b). Close-kin mark-recapture. Stat. Sci. 31, 259–274. doi: 10.1214/16-STS552
Bravington M., Thomson R., Davies C. (2017) Genotyping issues for CKMR on Atlantic bluefin tuna. Available at: https://www.iccat.int/GBYP/Docs/Close_Kin_Mark_Recapture_Phase_6_Genotyping_Issues.pdf.
Breton S., Stewart D. T. (2015). Atypical mitochondrial inheritance patterns in eukaryotes. Genome 58, 423–431. doi: 10.1139/gen-2015-0090
Campbell E. O., Brunet B. M. T., Dupuis J. R., Sperling F. A. H. (2018). Would an RRS by any other name sound as RAD? Methods Ecol. Evol. 9, 1920–1927. doi: 10.1111/2041-210X.13038
Carroll E. L., Bruford M. W., DeWoody J. A., Leroy G., Strand A., Waits L., et al. (2018). Genetic and genomic monitoring with minimally invasive sampling methods. Evol. Appl. 11, 1094–1119. doi: 10.1111/eva.12600
Casas L., Saborido-Rey F. (2023). A review of an emerging tool to estimate population parameters: the close-kin mark–recapture method. Front. Mar. Sci. 10. doi: 10.3389/fmars.2023.1087027
Catchen J., Hohenlohe P. A., Bassham S., Amores A., Cresko W. A. (2013). Stacks: an analysis tool set for population genomics. Mol. Ecol. 22 (11), 3124–3140. doi: 10.1111/mec.12354
Christiansen H., Heindler F. M., Hellemans B., Jossart Q., Pasotti F., Robert H., et al. (2021). Facilitating population genomics of non-model organisms through optimized experimental design for reduced representation sequencing. BMC Genomics 22, 625. doi: 10.1186/s12864-021-07917-3
Clark L. V., Lipka A. E., Sacks E. J. (2019). polyRAD: genotype calling with uncertainty from sequencing data in polyploids and diploids. G3 (Bethesda) 9 (3), 663–673. doi: 10.1534/g3.118.200913
Crespel A., Schneider K., Miller T., Rácz A., Jacobs A., Lindström J., et al. (2021). Genomic basis of fishing-associated selection varies with population density. Proc. Natl. Acad. Sci. 118 (51), e2020833118. doi: 10.1073/pnas.2020833118
Cumer T., Pouchon C., Boyer F., Yannic G., Rioux D., Bonin A., et al. (2021). Double-digest RAD-sequencing: do pre- and post-sequencing protocol parameters impact biological results? Mol. Genet. Genomics 296, 457–471. doi: 10.1007/s00438-020-01756-9
Dahn H. A., Mountcastle J., Balacco J., Winkler S., Bista I., Schmitt A. D., et al. (2022). Benchmarking ultra-high molecular weight DNA preservation methods for long-read and long-range sequencing. Gigascience 11, giac68. doi: 10.1093/gigascience/giac068
Davey J. W., Cezard T., Fuentes-Utrilla P., Eland C., Gharbi K., Blaxter M. L. (2013). Special features of RAD sequencing data: implications for genotyping. Mol. Ecol. 22, 3151–3164. doi: 10.1111/mec.12084
Davey J. W., Hohenlohe P. A., Etter P. D., Boone J. Q., Catchen J. M., Blaxter M. L. (2011). Genome-wide genetic marker discovery and genotyping using next-generation sequencing. Nat. Rev. Genet. 12, 499–510. doi: 10.1038/nrg3012
Davies C. R., Bravington M. V., Eveson J. P., Lansdell M., Aulich J., Grewe P. M. (2020) Next-generation close-kin mark recapture: using SNPs to identify half- sibling pairs in southern bluefin tuna and estimate abundance, mortality and selectivity. Available at: https://www.frdc.com.au/sites/default/files/products/2016-044-DLD.pdf.
Davies C. R., Bravington M. V., Thompson R. (2015). Advice on close-kin mark-recapture for estimating abundance of eastern Atlantic blue tuna:a scoping study. ICAAT GBYP07 20, 34. Available at: https://www.iccat.int/GBYP/Docs/Close_Kin_Mark_Recapture_Phase_6_Scoping_Study.pdf.
De Barba M., Miquel C., Lobréaux S., Quenette P. Y., Swenson J. E., Taberlet P. (2017). High-throughput microsatellite genotyping in ecology: improved accuracy, efficiency, standardization and success with low-quantity and degraded DNA. Mol. Ecol. Resour 17, 492–507. doi: 10.1111/1755-0998.12594
Delaval A., Bendall V., Hetherington S. J., Skaug H. J., Frost M., Jones C. S., et al. (2022). Evaluating the suitability of close-kin mark-recapture as a demographic modelling tool for a critically endangered elasmobranch population. Evol. Appl 16 (2), 461–473. doi: 10.1111/eva.13474
Del Giacco L., Cattaneo C. (2012). Introduction to genomics. Methods Mol Biol. 823, 79–88. doi: 10.1007/978-1-60327-216-2_6
Eaton D. A. R., Overcast I. (2020). Ipyrad: interactive assembly and analysis of RADseq data sets. Bioinformatics 36 (8), 2592–2594. doi: 10.1093/bioinformatics/btz966
Ellis J. S., Gilbey J., Armstrong A., Balstad T., Cauwelier E., Cherbonnel C., et al. (2011). Microsatellite standardization and evaluation of genotyping error in a large multi-partner research programme for conservation of Atlantic salmon (Salmo salar l.). Genetica 139, 353–367. doi: 10.1007/s10709-011-9554-4
Elshire R. J., Glaubitz J. C., Sun Q., Poland J. A., Kawamoto K., Buckler E. S., et al. (2011). A robust, simple genotyping-by-Sequencing (GBS) approach for high diversity species. PloS One 6, e19379. doi: 10.1371/journal.pone.0019379
Euclide P. T., McKinney G. J., Bootsma M., Tarsa C., Meek M. H., Larson W. A. (2020). Attack of the PCR clones: rates of clonality have little effect on RAD-seq genotype calls. Mol. Ecol. Resour 20, 66–78. doi: 10.1111/1755-0998.13087
Fan G., Song Y., Yang L., Huang X., Zhang S., Zhang M., et al. (2020). Initial data release and announcement of the 10,000 fish genomes project (Fish10K). Gigascience 9 (8), giaa080. doi: 10.1093/gigascience/giaa080
Faria P. J., Kavembe G. D., Jung’a J. O., Kimwele C. N., Estes L. D., Reillo P. R., et al. (2011). The use of non-invasive molecular techniques to confirm the presence of mountain bongo tragelaphus eurycerus isaaci populations in Kenya and preliminary inference of their mitochondrial genetic variation. Conserv. Genet. 12, 745–751. doi: 10.1007/s10592-011-0181-5
Fisher P. J., Malthus B., Walker M. C., Corbett G., Spelman R. J. (2009). The number of single nucleotide polymorphisms and on-farm data required for whole-herd parentage testing in dairy cattle herds. J. Dairy Sci. 92, 369–374. doi: 10.3168/jds.2008-1086
Flanagan S. P., Jones A. G. (2019). The future of parentage analysis: from microsatellites to SNPs and beyond. Mol. Ecol. 28, 544–567. doi: 10.1111/mec.14988
Fountain E. D., Pauli J. N., Reid B. N., Palsbøll P. J., Peery M. Z. (2016). Finding the right coverage: the impact of coverage and sequence quality on single nucleotide polymorphism genotyping error rates. Mol. Ecol. Resour 16, 966–978. doi: 10.1111/1755-0998.12519
Franchini P., Monné Parera D., Kautt A. F., Meyer A. (2017). quaddRAD: a new high-multiplexing and PCR duplicate removal ddRAD protocol produces novel evolutionary insights in a nonradiating cichlid lineage. Mol. Ecol. 26, 2783–2795. doi: 10.1111/mec.14077
Francois C. M., Durand F., Figuet E., Galtier N. (2020). Prevalence and implications of contamination in public genomic resources: a case study of 43 reference arthropod assemblies. G3 Genes|Genomes|Genetics 10, 721–730. doi: 10.1534/g3.119.400758
Fu Z., Epstein B., Kelley J. L., Zheng Q., Bergland A. O., Castillo Carrillo C. I., et al. (2017). Using NextRAD sequencing to infer movement of herbivores among host plants. PloS One 12 (5), e0177742. doi: 10.1371/journal.pone.0177742
Garrison E., Marth G. (2012). Haplotype-based variant detection from short-read sequencing. arXiv:1207.3907. doi: 10.48550/arXiv.1207.3907
Gautier M., Gharbi K., Cezard T., Foucaud J., Kerdelhué C., Pudlo P., et al. (2013a). The effect of RAD allele dropout on the estimation of genetic variation within and between populations. Mol. Ecol. 22 (11), 3165–3178. doi: 10.1111/mec.12089
Gershoni M., Shirak A., Raz R., Seroussi E. (2022). Comparing BeadChip and WGS genotyping: non-technical failed calling is attributable to additional variation within the probe target sequence. Genes (Basel) 13, 485. doi: 10.3390/genes13030485
Glenn T. C., Nilsen R. A., Kieran T. J., Sanders J. G., Bayona-Vásquez N. J., Finger J. W., et al. (2019). Adapterama I: universal stubs and primers for 384 unique dual-indexed or 147,456 combinatorially-indexed illumina libraries (iTru & iNext). PeerJ 7, e7755. doi: 10.7717/peerj.7755
Gomez-Raya L., Gómez Izquierdo E., Garcia-Ruiz F., Rauw W. M. (2022). First-degree relationships and genotyping errors deciphered by a high-density SNP array in a duroc × Iberian pig cross. BMC Genomic Data 23, 14. doi: 10.1186/s12863-022-01025-1
Goudet J., Kay T., Weir B. S. (2018). How to estimate kinship. Mol. Ecol. 27, 4121–4135. doi: 10.1111/mec.14833
Graham C. F., Glenn T. C., McArthur A. G., Boreham D. R., Kieran T., Lance S., et al. (2015). Impacts of degraded DNA on restriction enzyme associated DNA sequencing (RADSeq). Mol. Ecol. Resour 15, 1304–1315. doi: 10.1111/1755-0998.12404
Guang X.-M., Xia J.-Q., Lin J.-Q., Yu J., Wan Q.-H., Fang S.-G. (2019). IDSSR: an efficient pipeline for identifying polymorphic microsatellites from a single genome sequence. Int. J. Mol. Sci. 20, 3497. doi: 10.3390/ijms20143497
Hanghøj K., Moltke I., Andersen P. A., Manica A., Korneliussen T. S. (2019). Fast and accurate relatedness estimation from high-throughput sequencing data in the presence of inbreeding. Gigascience 8 (5), giz034. doi: 10.1093/gigascience/giz034
Harrison H. B., Saenz-Agudelo P., Planes S., Jones G. P., Berumen M. L. (2013a). On minimizing assignment errors and the trade-off between false positives and negatives in parentage analysis. Mol. Ecol. 22, 5738–5742. doi: 10.1111/mec.12527
Harrison H. B., Saenz-Agudelo P., Planes S., Jones G. P., Berumen M. L. (2013b). Relative accuracy of three common methods of parentage analysis in natural populations. Mol. Ecol. 22, 1158–1170. doi: 10.1111/mec.12138
Herzig A. F., Ciullo M., Deleuze J.-F., Génin E., Redon R., Adjou C., et al. (2022). Moment estimators of relatedness from low-depth whole-genome sequencing data. BMC Bioinf. 23, 254. doi: 10.1186/s12859-022-04795-8
Hillary R. M., Bravington M. V., Patterson T. A., Grewe P., Bradford R., Feutry P., et al. (2018). Genetic relatedness reveals total population size of white sharks in eastern Australia and new Zealand. Sci. Rep. 8, 2661. doi: 10.1038/s41598-018-20593-w
Hoffberg S. L., Kieran T. J., Catchen J. M., Devault A., Faircloth B. C., Mauricio R., et al. (2016). RADcap: sequence capture of dual-digest RADseq libraries with identifiable duplicates and reduced missing data. Mol. Ecol. Resour 16, 1264–1278. doi: 10.1111/1755-0998.12566
Huang H., Knowles L. L. (2016). Unforeseen consequences of excluding missing data from next-generation sequences: simulation study of RAD sequences. Syst. Biol. 65, 357–365. doi: 10.1093/sysbio/syu046
Huisman J. (2017). Pedigree reconstruction from SNP data: parentage assignment, sibship clustering and beyond. Mol. Ecol. Resour 17, 1009–1024. doi: 10.1111/1755-0998.12665
Ishibashi Y., Saitoh T., Abe S., Yoshida M. C. (1996). Null microsatellite alleles due to nucleotide sequence variation in the grey-sided vole clethrionomys rufocanus. [Internet]. . Mol. Ecol. 5, 589–590. doi: 10.1111/j.1365-294X.1996.tb00351.x
Jones O. R., Wang J. (2010). COLONY: a program for parentage and sibship inference from multilocus genotype data. Mol. Ecol. Resour 10, 551–555. doi: 10.1111/j.1755-0998.2009.02787.x
Kokkalis A., Eikeset A. M., Thygesen U. H., Steingrund P., Andersen K. H. (2017). Estimating uncertainty of data limited stock assessments. ICES J. Mar. Sci. 74, 69–77. doi: 10.1093/icesjms/fsw145
Kopps A. M., Kang J., Sherwin W. B., Palsbøll P. J. (2015). How well do molecular and pedigree relatedness correspond, in populations with diverse mating systems, and various types and quantities of molecular and demographic data? G3: Genes|Genomes|Genetics 5, 1815–1826. doi: 10.1534/g3.115.019323
Korneliussen T. S., Albrechtsen A., Nielsen R. (2014). ANGSD: analysis of next generation sequencing data. BMC Bioinf. 15 (1), 356. doi: 10.1186/s12859-014-0356-4
Lemopoulos A., Prokkola J. M., Uusi-Heikkilä S., Vasemägi A., Huusko A., Hyvärinen P., et al. (2019). Comparing RADseq and microsatellites for estimating genetic diversity and relatedness {{/amp]]mdash; implications for brown trout conservation. Ecol. Evol. 9, 2106–2120. doi: 10.1002/ece3.4905
Lepais O., Weir J. T. (2014). SimRAD: an r package for simulation-based prediction of the number of loci expected in RADseq and similar genotyping by sequencing approaches. Mol. Ecol. Resour 14, 1314–1321. doi: 10.1111/1755-0998.12273
Lutz Í, Miranda J., Santana P., Martins T., Ferreira C., Sampaio I., et al. (2023). Quality analysis of genomic DNA and authentication of fisheries products based on distinct methods of DNA extraction. PloS One 18, e0282369. doi: 10.1371/journal.pone.0282369
Mace P., Ritchie P., Wellenreuther M., McKenzie J., Hupman K., Hillary R., et al. (2020) Report of the workshop on the utility of genetic analyses for addressing new Zealand fisheries questions. Available at: https://www.mpi.govt.nz/dmsdocument/39668/direct.
Marcy-Quay B., Sethi S. A., Therkildsen N. O., Kraft C. E. (2020). Expanding the feasibility of fish and wildlife assessments with close-kin mark–recapture. Ecosphere 11 (10), e03259. doi: 10.1002/ecs2.3259
Martincová I., Aghová T. (2020). Comparison of 12 DNA extraction kits for vertebrate samples. Anim. Biodivers Conserv. 43 (1), 67–77. doi: 10.32800/abc.2020.43.0067
Maunder M. N., Lennert-Cody C. E., -da-Silva A., Alexandre A., Xu H. (2021) Considerations for conducting close kin mark recapture of stocks managed by the IATTC (document SAC-12-14). Available at: https://www.iattc.org/getattachment/ddc8410e-4de7-401c-87a9-73fb33090f23/SAC-12-14_Considerations-for-conducting-Close-Kin-Mark-Recapture-of-stocks-managed-by-IATTC.pdf.
Miller M. R., Dunham J. P., Amores A., Cresko W. A., Johnson E. A. (2007). Rapid and cost-effective polymorphism identification and genotyping using restriction site associated DNA (RAD) markers. Genome Res. 17, 240–248. doi: 10.1101/gr.5681207
Miller M. P., Knaus B. J., Mullins T. D., Haig S. M. (2013). SSR_pipeline: a bioinformatic infrastructure for identifying microsatellites from paired-end illumina high-throughput DNA sequencing data. J. Hered 104, 881–885. doi: 10.1093/jhered/est056
Mora-Márquez F., García-Olivares V., Emerson B. C., López de Heredia U. (2017). Ddradseqtools: a software package for in silico simulation and testing of double-digest RADseq experiments. Mol. Ecol. Resour 17, 230–246. doi: 10.1111/1755-0998.12550
Mulcahy D. G., Macdonald K. S., Brady S. G., Meyer C., Barker K. B., Coddington J. (2016). Greater than X kb: a quantitative assessment of preservation conditions on genomic DNA quality, and a proposed standard for genome-quality DNA. PeerJ 4, e2528. doi: 10.7717/peerj.2528
Musich R., Cadle-Davidson L., Osier M. V. (2021). Comparison of short-read sequence aligners indicates strengths and weaknesses for biologists to consider. Front. Plant Sci. 12. doi: 10.3389/fpls.2021.657240
Nielsen R., Paul J. S., Albrechtsen A., Song Y. S. (2011). Genotype and SNP calling from next-generation sequencing data. Nat. Rev. Genet. 12, 443–451. doi: 10.1038/nrg2986
Oduoye O., Ajayi D., Oluwasanya O., Hassan T., Olajire O., Coker D., et al. (2020). COMPARATIVE ANALYSIS OF DNA ISOLATED FROM FISH SAMPLES BY THREE DIFFERENT EXTRACTION PROTOCOLS. J. Exp. Biol. Agric. Sci. 8, 644–653. doi: 10.18006/2020.8(5).644.653
O’Leary S. J., Puritz J. B., Willis S. C., Hollenbeck C. M., Portnoy D. S. (2018). These aren’t the loci you’e looking for: principles of effective SNP filtering for molecular ecologists. Mol. Ecol. 27, 3193–3206. doi: 10.1111/mec.14792
Oosting T., Hilario E., Wellenreuther M., Ritchie P. A. (2020). DNA Degradation in fish: practical solutions and guidelines to improve DNA preservation for genomic research. Ecol. Evol. 10, 8643–8651. doi: 10.1002/ece3.6558
Paetkau D., Strobeck C. (1995). The molecular basis and evolutionary history of a microsatellite null allele in bears. Mol. Ecol. 4, 519–520. doi: 10.1111/j.1365-294X.1995.tb00248.x
Palomares M. L. D., Froese R., Derrick B., Meeuwig J. J., Nöel S.-L., Tsui G., et al. (2020). Fishery biomass trends of exploited fish populations in marine ecoregions, climatic zones and ocean basins. Estuar. Coast. Shelf Sci. 243, 106896. doi: 10.1016/j.ecss.2020.106896
Paris J. R., Stevens J. R., Catchen J. M. (2017). Lost in parameter space: a road map for STACKS. Methods Ecol. Evol. 8, 1360–1373. doi: 10.1111/2041-210X.12775
Patterson T. A., Hillary R. M., Kyne P. M., Pillans R. D., Gunasekera R. M., Marthick J. R., et al. (2022). Rapid assessment of adult abundance and demographic connectivity from juvenile kin pairs in a critically endangered species. Sci. Adv. 8 (51), eadd1679. doi: 10.1126/sciadv.add1679
Peterson B. K., Weber J. N., Kay E. H., Fisher H. S., Hoekstra H. E. (2012). Double digest RADseq: an inexpensive method for De novo SNP discovery and genotyping in model and non-model species. PloS One 7, e37135. doi: 10.1371/journal.pone.0037135
Pimentel J. S. M., Carmo A. O., Rosse I. C., Martins A. P. V., Ludwig S., Facchin S., et al. (2018). High-throughput sequencing strategy for microsatellite genotyping using Neotropical fish as a model. Front. Genet. 9, 73. doi: 10.3389/fgene.2018.00073
Prystupa S., McCracken G. R., Perry R., Ruzzante D. E. (2021). Population abundance in arctic grayling using genetics and close-kin mark-recapture. Ecol. Evol. 11, 4763–4773. doi: 10.1002/ece3.7378
Puckett E. E. (2017). Variability in total project and per sample genotyping costs under varying study designs including with microsatellites or SNPs to answer conservation genetic questions. Conserv. Genet. Resour 9, 289–304. doi: 10.1007/s12686-016-0643-7
Puritz J. B., Hollenbeck C. M., Gold J. R. (2014a). dDocent: a RADseq, variant-calling pipeline designed for population genomics of non-model organisms. PeerJ 2, e431. doi: 10.7717/peerj.431
Puritz J. B., Matz M. V., Toonen R. J., Weber J. N., Bolnick D. I., Bird C. E. (2014b). Demystifying the RAD fad. Mol. Ecol. 23, 5937–5942. doi: 10.1111/mec.12965
Reuter J. A., Spacek D. V., Snyder M. P. (2015). High-throughput sequencing technologies. Mol. Cell 58, 586–597. doi: 10.1016/j.molcel.2015.05.004
Rhie A., McCarthy S. A., Fedrigo O., Damas J., Formenti G., Koren S., et al. (2021). Towards complete and error-free genome assemblies of all vertebrate species. Nature 592, 737–746. doi: 10.1038/s41586-021-03451-0
Rivera-Colón A. G., Catchen J. (2022). “Population genomics analysis with RAD, reprised: stacks 2,” in Methods in molecular biology 2498, 99–149. doi: 10.1007/978-1-0716-2313-8_7
Rivera-Colón A. G., Rochette N. C., Catchen J. M. (2021). Simulation with RADinitio improves RADseq experimental design and sheds light on sources of missing data. Mol. Ecol. Resour 21, 363–378. doi: 10.1111/1755-0998.13163
Rochette N. C., Catchen J. M. (2017). Deriving genotypes from RAD-seq short-read data using stacks. Nat. Protoc. 12, 2640–2659. doi: 10.1038/nprot.2017.123
Rochette N. C., Rivera-Colón A. G., Catchen J. M. (2019). Stacks 2: analytical methods for paired-end sequencing improve RADseq-based population genomics. Mol. Ecol. 28, 4737–4754. doi: 10.1111/mec.15253
Rochette N. C., Rivera-Colón A. G., Walsh J., Sanger T. J., Campbell-Staton S. C., Catchen J. M. (2023). On the causes, consequences, and avoidance of PCR duplicates: towards a theory of library complexity. Mol. Ecol. Resour. doi: 10.1111/1755-0998.13800
Ruzzante D. E., McCracken G. R., Førland B., MacMillan J., Notte D., Buhariwalla C., et al. (2019). Validation of close-kin mark–recapture (CKMR) methods for estimating population abundance. Methods Ecol. Evol. 10, 1445–1453. doi: 10.1111/2041-210X.13243
Shafer A. B. A., Peart C. R., Tusso S., Maayan I., Brelsford A., Wheat C. W., et al. (2017). Bioinformatic processing of RAD-seq data dramatically impacts downstream population genetic inference. Methods Ecol. Evol. 8, 907–917. doi: 10.1111/2041-210X.12700
Schmid S., Genevest R., Gobet E., Suchan T., Sperisen C., Tinner W., et al. (2017). hyRAD-X, a versatile method combining exome capture and RAD sequencing to extract genomic information from ancient DNA. Methods Ecol. Evol. 8, 1374–1388. doi: 10.1111/2041-210X.12785
Shuttleworth L., Oosthuizen C. J. (2022). Comparing DNA yield from fish scales following different extraction protocols. Sci. Rep. 12, 2836. doi: 10.1038/s41598-022-06889-y
Silva P. C., Malabarba M. C., Vari R., Malabarba L. R. (2019). Comparison and optimization for DNA extraction of archived fish specimens. MethodsX 6, 1433–1442. doi: 10.1016/j.mex.2019.06.001
So A. P., Vilborg A., Bouhlal Y., Koehler R. T., Grimes S. M., Pouliot Y., et al. (2018). A robust targeted sequencing approach for low input and variable quality DNA from clinical samples. NPJ Genomic Med. 3, 2. doi: 10.1038/s41525-017-0041-4
Sommer S., Courtiol A., Mazzoni C. J. (2013). MHC genotyping of non-model organisms using next-generation sequencing: a new methodology to deal with artefacts and allelic dropout. BMC Genomics 14, 542. doi: 10.1186/1471-2164-14-542
Städele V., Vigilant L. (2016). Strategies for determining kinship in wild populations using genetic data. Ecol. Evol. 6, 6107–6120. doi: 10.1002/ece3.2346
Taylor R. S., Jensen E. L., Coltman D. W., Foote A. D., Lamichhaney S. (2021). Seeing the whole picture: what molecular ecology is gaining from whole genomes. Mol. Ecol. 30, 5917–5922. doi: 10.1111/mec.16282
Thompson R. B., Bravington M. V., Feutry P., Gunasekera R., Grewe P. (2020) Close kin mark recapture for school shark in the SESSF. FRDC 2014/024. Available at: https://www.frdc.com.au/sites/default/files/products/2014-024-DLD.pdf.
Tin M. M. Y., Rheindt F. E., Cros E., Mikheyev A. S. (2015). Degenerate adaptor sequences for detecting PCR duplicates in reduced representation sequencing data improve genotype calling accuracy. Mol. Ecol. Resour 15, 329–336. doi: 10.1111/1755-0998.12314
Toonen R. J., Puritz J. B., Forsman Z. H., Whitney J. L., Fernandez-Silva I., Andrews K. R., et al. (2013). ezRAD: a simplified method for genomic genotyping in non-model organisms. PeerJ 1, e203. doi: 10.7717/peerj.203
Torkamaneh D., Laroche J., Bastien M., Abed A., Belzile F. (2017). Fast-GBS: a new pipeline for the efficient and highly accurate calling of SNPs from genotyping-by-sequencing data. BMC Bioinf. 18, 5. doi: 10.1186/s12859-016-1431-9
Torrado H., Carreras C., Raventos N., Macpherson E., Pascual M. (2020). Individual-based population genomics reveal different drivers of adaptation in sympatric fish. Sci. Rep. 10, 12683. doi: 10.1038/s41598-020-69160-2
Trenkel V. M., Charrier G., Lorance P., Bravington M V. (2022). Close-kin mark–recapture abundance estimation: practical insights and lessons learned. ICES J. Mar. Sci. 79, 413–422. doi: 10.1093/icesjms/fsac002
van Dijk E. L., Auger H., Jaszczyszyn Y., Thermes C. (2014). Ten years of next-generation sequencing technology. Trends Genet. 30, 418–426. doi: 10.1016/j.tig.2014.07.001
van Orsouw N. J., Hogers R. C. J., Janssen A., Yalcin F., Snoeijers S., Verstege E., et al. (2007). Complexity reduction of polymorphic sequences (CRoPSTM): a novel approach for Large-scale polymorphism discovery in complex genomes. PloS One 2, e1172. doi: 10.1371/journal.pone.0001172
Van Tassell C. P., Smith T. P. L., Matukumalli L. K., Taylor J. F., Schnabel R. D., Lawley C. T., et al. (2008). SNP discovery and allele frequency estimation by deep sequencing of reduced representation libraries. Nat. Methods 5, 247–252. doi: 10.1038/nmeth.1185
Vendrami D. L. J., Forcada J., Hoffman J. I. (2019). Experimental validation of in silico predicted RAD locus frequencies using genomic resources and short read data from a model marine mammal. BMC Genomics 20, 72. doi: 10.1186/s12864-019-5440-8
von Thaden A., Cocchiararo B., Jarausch A., Jüngling H., Karamanlidis A. A., Tiesmeyer A., et al. (2017). Assessing SNP genotyping of noninvasively collected wildlife samples using microfluidic arrays. Sci. Rep. 7, 10768. doi: 10.1038/s41598-017-10647-w
Wacker S., Skaug H. J., Forseth T., Solem Ø, Ulvan E. M., Fiske P., et al. (2021). Considering sampling bias in close-kin mark–recapture abundance estimates of Atlantic salmon. Ecol. Evol. 11, 3917–3932. doi: 10.1002/ece3.7279
Wang J. (2010). Effects of genotyping errors on parentage exclusion analysis. Mol. Ecol. 19, 5061–5078. doi: 10.1111/j.1365-294X.2010.04865.x
Wang J. (2012). Computationally efficient sibship and parentage assignment from multilocus marker data. Genetics 191, 183–194. doi: 10.1534/genetics.111.138149
Wang S., Meyer E., McKay J. K., Matz M V. (2012). 2b-RAD: a simple and flexible method for genome-wide genotyping. Nat. Methods 9, 808–810. doi: 10.1038/nmeth.2023
Wang X., Lund M. S., Ma P., Janss L., Kadarmideen H. N., Su G. (2019). Improving genomic predictions by correction of genotypes from genotyping by sequencing in livestock populations. J. Anim. Sci. Biotechnol. 10, 8. doi: 10.1186/s40104-019-0315-z
Waples R. S., Feutry P. (2022). Close-kin methods to estimate census size and effective population size. Fish Fish 23, 273–293. doi: 10.1111/faf.12615
Waples R. S., Grewe P. M., Bravington M. W., Hillary R., Feutry P. (2018). Robust estimates of a high n e / n ratio in a top marine predator, southern bluefin tuna. Sci. Adv. 4, eaar7759. doi: 10.1126/sciadv.aar7759
Webster M. S., Reichart L. (2005). Use of microsatellites for parentage and kinship analyses in animals. Methods Enzymol. 222–238. 10.1016/S0076-6879(05)95014-3
Wenne R., Bernaś R., Kijewska A., Poćwierz-Kotus A., Strand J., Petereit C., et al. (2020). SNP genotyping reveals substructuring in weakly differentiated populations of Atlantic cod (Gadus morhua) from diverse environments in the Baltic Sea. Sci. Rep. 10, 9738. doi: 10.1038/s41598-020-66518-4
Zajac G. J. M., Fritsche L. G., Weinstock J. S., Dagenais S. L., Lyons R. H., Brummett C. M., et al. (2019). Estimation of DNA contamination and its sources in genotyped samples. Genet. Epidemiol. 43, 980–995. doi: 10.1002/gepi.22257
Keywords: CKMR, SNP markers, genotyping, kinship analysis, fisheries assessments
Citation: Casas L and Saborido-Rey F (2023) A review of genomics methods and bioinformatics tools for the analysis of close-kin mark-recapture. Front. Mar. Sci. 10:1113870. doi: 10.3389/fmars.2023.1113870
Received: 01 December 2022; Accepted: 12 May 2023;
Published: 07 July 2023.
Edited by:
Montse Pérez, Spanish Institute of Oceanography, SpainReviewed by:
Simo Njabulo Maduna, Norwegian Institute of Bioeconomy Research (NIBIO), NorwayCopyright © 2023 Casas and Saborido-Rey. This is an open-access article distributed under the terms of the Creative Commons Attribution License (CC BY). The use, distribution or reproduction in other forums is permitted, provided the original author(s) and the copyright owner(s) are credited and that the original publication in this journal is cited, in accordance with accepted academic practice. No use, distribution or reproduction is permitted which does not comply with these terms.
*Correspondence: Laura Casas, bGF1cmFjYXNhc0BpaW0uY3NpYy5lcw==; Fran Saborido-Rey, ZnJhbkBpaW0uY3NpYy5lcw==
Disclaimer: All claims expressed in this article are solely those of the authors and do not necessarily represent those of their affiliated organizations, or those of the publisher, the editors and the reviewers. Any product that may be evaluated in this article or claim that may be made by its manufacturer is not guaranteed or endorsed by the publisher.
Research integrity at Frontiers
Learn more about the work of our research integrity team to safeguard the quality of each article we publish.