 Seung-Tae Lee
 Jihun Jung
 Guebuem Kim
 Yong-Jin Tak
 Yang-Ki Cho
- 1School of Earth and Environmental Sciences/Research Institute of Oceanography, Seoul National University, Seoul, Republic of Korea
- 2Department of Marine Ecology and Environment, Gangneung-Wonju National University, Gangneung, Republic of Korea
The Fukushima Daiichi Nuclear Power Plant (FDNPP) accident on March 11, 2011 resulted in the release of immense amounts of radioactive materials into the ocean. However, the dispersion of radioactive materials in the subsurface has not yet been clarified due to the spatiotemporal limitation of observations. Thus, herein, a tracer experiment was implemented using a three-dimensional numerical model to estimate the dispersion path of 137Cs released directly from the FDNPP and its travel time in the subsurface of the North Pacific Ocean from 2011 to 2020. The results show that the subsurface 137Cs spreads by two mode waters, namely, Sub-Tropical Mode Water (STMW) and Central Mode Water (CMW). Subsurface 137Cs primarily spreads clockwise in the sub-tropical region, while a portion driven by STMW is dispersed southward. The clockwise dispersion path of 137Cs released into the ocean by STMW is relatively shallower and inward than that by CMW. The 137Cs that was spread clockwise reached the east of Taiwan and the Philippines via STMW and CMW nine years after the accident, respectively. The model described in this study is applicable for estimating the water path and travel time of tritium water planned to be discharged from Fukushima.
1 Introduction
The Fukushima Daiichi Nuclear Power Plant (FDNPP) accident on March 11, 2011 released large quantities of artificial radionuclides into the ocean (Aoyama et al., 2012; Buesseler et al., 2012; Honda et al., 2012; Nakano and Povinec, 2012; Kaeriyama, 2017). Although there is considerable uncertainty, the estimated total 137Cs inventory derived from the direct discharge of the contaminated water from Fukushima was approximately 3.0−4.0 PBq (Kaeriyama et al., 2016). The half life of 137Cs is about 30 years. Moreover, additional tritium which half life is 12.3 years is planned to be released into the ocean from FDNPP in 2023. The FDNPP is located between the subtropical and subpolar gyres (Yoshida et al., 2015). The Kuroshio and Oyashio Currents, which are the strongest currents of both gyres, respectively, can actively disperse the radioactive materials, which can subsequently pollute fishery products in the surrounding seas (Yoshida and Kanda, 2012; Wada et al., 2013; Nakata and Sugisaki, 2015; Kaeriyama et al., 2016). In particular, trans-Pacific migratory fish, such as the Pacific bluefin tuna (Thunnus orientalis) are vulnerable to radioactive materials (Fujioka et al., 2018). It is, therefore, crucial to investigate the path of dispersion, and concentration of the radioactive material to reduce their potential risks.
After the FDNPP accident, many observational and numerical modeling studies were undertaken to determine the path and concentration of the radioactive material. Honda et al. (2012) observed 134Cs and 137Cs in the sea surface layer near the FDNPP one month after the accident and found concentrations in zooplankton and suspended matter that were two orders of magnitude higher than those recorded before the accident. The half life of 134Cs is about 2.1 years. Moreover, Buesseler et al. (2012) tracked 134Cs and 137Cs released from FDNPP in seawater 30–600 km offshore and found a high correlation between near-shore eddies and radioactive material distribution. The radioactive material was distributed widely in the surface layer along the Kuroshio Current and its extension (Behrens et al., 2012; Buesseler et al., 2012; Honda et al., 2012). Meanwhile, Kaeriyama et al. (2013) assessed the Cs concentration by collecting seawater in wide areas of the Western and Central Pacific Ocean in July 2011, October 2011, and July 2012, and tracked the path of surface dispersion from FDNPP using a simple particle tracking numerical model. Similarly, Zhao et al. (2021) simulated the path and concentration of tritium released from FDNPP under various future release duration scenarios over an extended period using a numerical model. They proposed that the simulated tritium in the surface commonly moved eastward over time regardless of the considered scenario. Collectively, the findings of these observational and numerical studies suggest that radioactive Cs from FDNPP, in 2011, rapidly spread eastward via surface dispersion.
The Kuroshio current and its extension are major deliverers of radioactive materials and serve as the southern boundary of their surface movement (Buesseler et al., 2012; Honda et al., 2012). However, a different distribution pattern was observed for radioactive materials in the subsurface. More specifically, Kaeriyama et al. (2014) observed a 134Cs concentration peak in the subsurface (100–500 m) south of the main axis of the Kuroshio extension and suggested that FDNPP-derived radioactive Cs was included in Subtropical Mode Water (STMW) owing to winter mixing. Moreover, Kumamoto et al. (2014) observed high concentration of 134Cs in the subsurface layer along 149°E in February 2012. Meanwhile, Kaeriyama et al. (2016) observed meridional transects of the vertical distribution of 137Cs along 147°E and 155°E from October to November 2013, 19 months after the accident, reporting its peak concentration in the subsurface, which corresponded to the depth of STMW and Central Mode Water (CMW).
Although previous studies suggest that STMW and CMW are potential deliverers of radioactive materials, observations were limited in time and space, thus impeding elucidation of the precise path taken and travel time of radioactive material in the subsurface. Numerical model studies may prove useful for tracing the path of radioactive material in the subsurface. In fact, Zhao et al. (2021) suggested that simulated tritiums, primarily distributed at 400–600 m depth, is correlated with mode waters. However, the associated coarse model resolution prevented resolution of the different paths taken by the two mode waters.
Due to various model uncertainties, modeling studies often fail to accurately simulate the subsurface path of radioactive material (Nakano and Povinec, 2012; Zhao et al., 2021; Garraffo et al., 2016; Zulema et al., 2016). Moreover, it is challenging to simulate the realistic formation and subduction of mode waters in the study area. Therefore, the contribution of mode waters to the dispersion of radioactive materials in the subsurface remains unclear.
This study seeks to clarify the subduction of the radioactive substances released directly from FDNPP with mode waters, as well as their paths taken and travel time within the subsurface. To this end, a high resolution three-dimensional numerical model is employed. The model reliability is assessed by comparing the observed and simulated characteristics of mode waters, including temperature, salinity, and location depth.
2 Data and methods
2.1 Model description
This study applied the regional Ocean Modeling System (ROMS) (Haidvogel et al., 2000; Di Lorenzo, 2003; Marchesiello et al., 2003; Peliz et al., 2003). The ROMS is a free-surface, terrain-following, primitive equations ocean model. The primitive equations were vertically discretized over the topography using stretched terrain-following coordinates (Song and Haidvogel, 1994), and then calculated on a staggered Arakawa C-grid in the horizontal plane (Fox-Rabinovitz, 1991).
The model domain used in this study was the North Pacific region (98°E–76°W, 20°S–65°N, Figure 1). The horizontal spatial grid of the model had a resolution of 0.25°, with 300 s time steps. The model domain had 30 vertical layers with sigma coordinates. The topography was sourced from a global relief model of the Earth’s surface with a spatial resolution of 1° (Amante and Eakins, 2009).
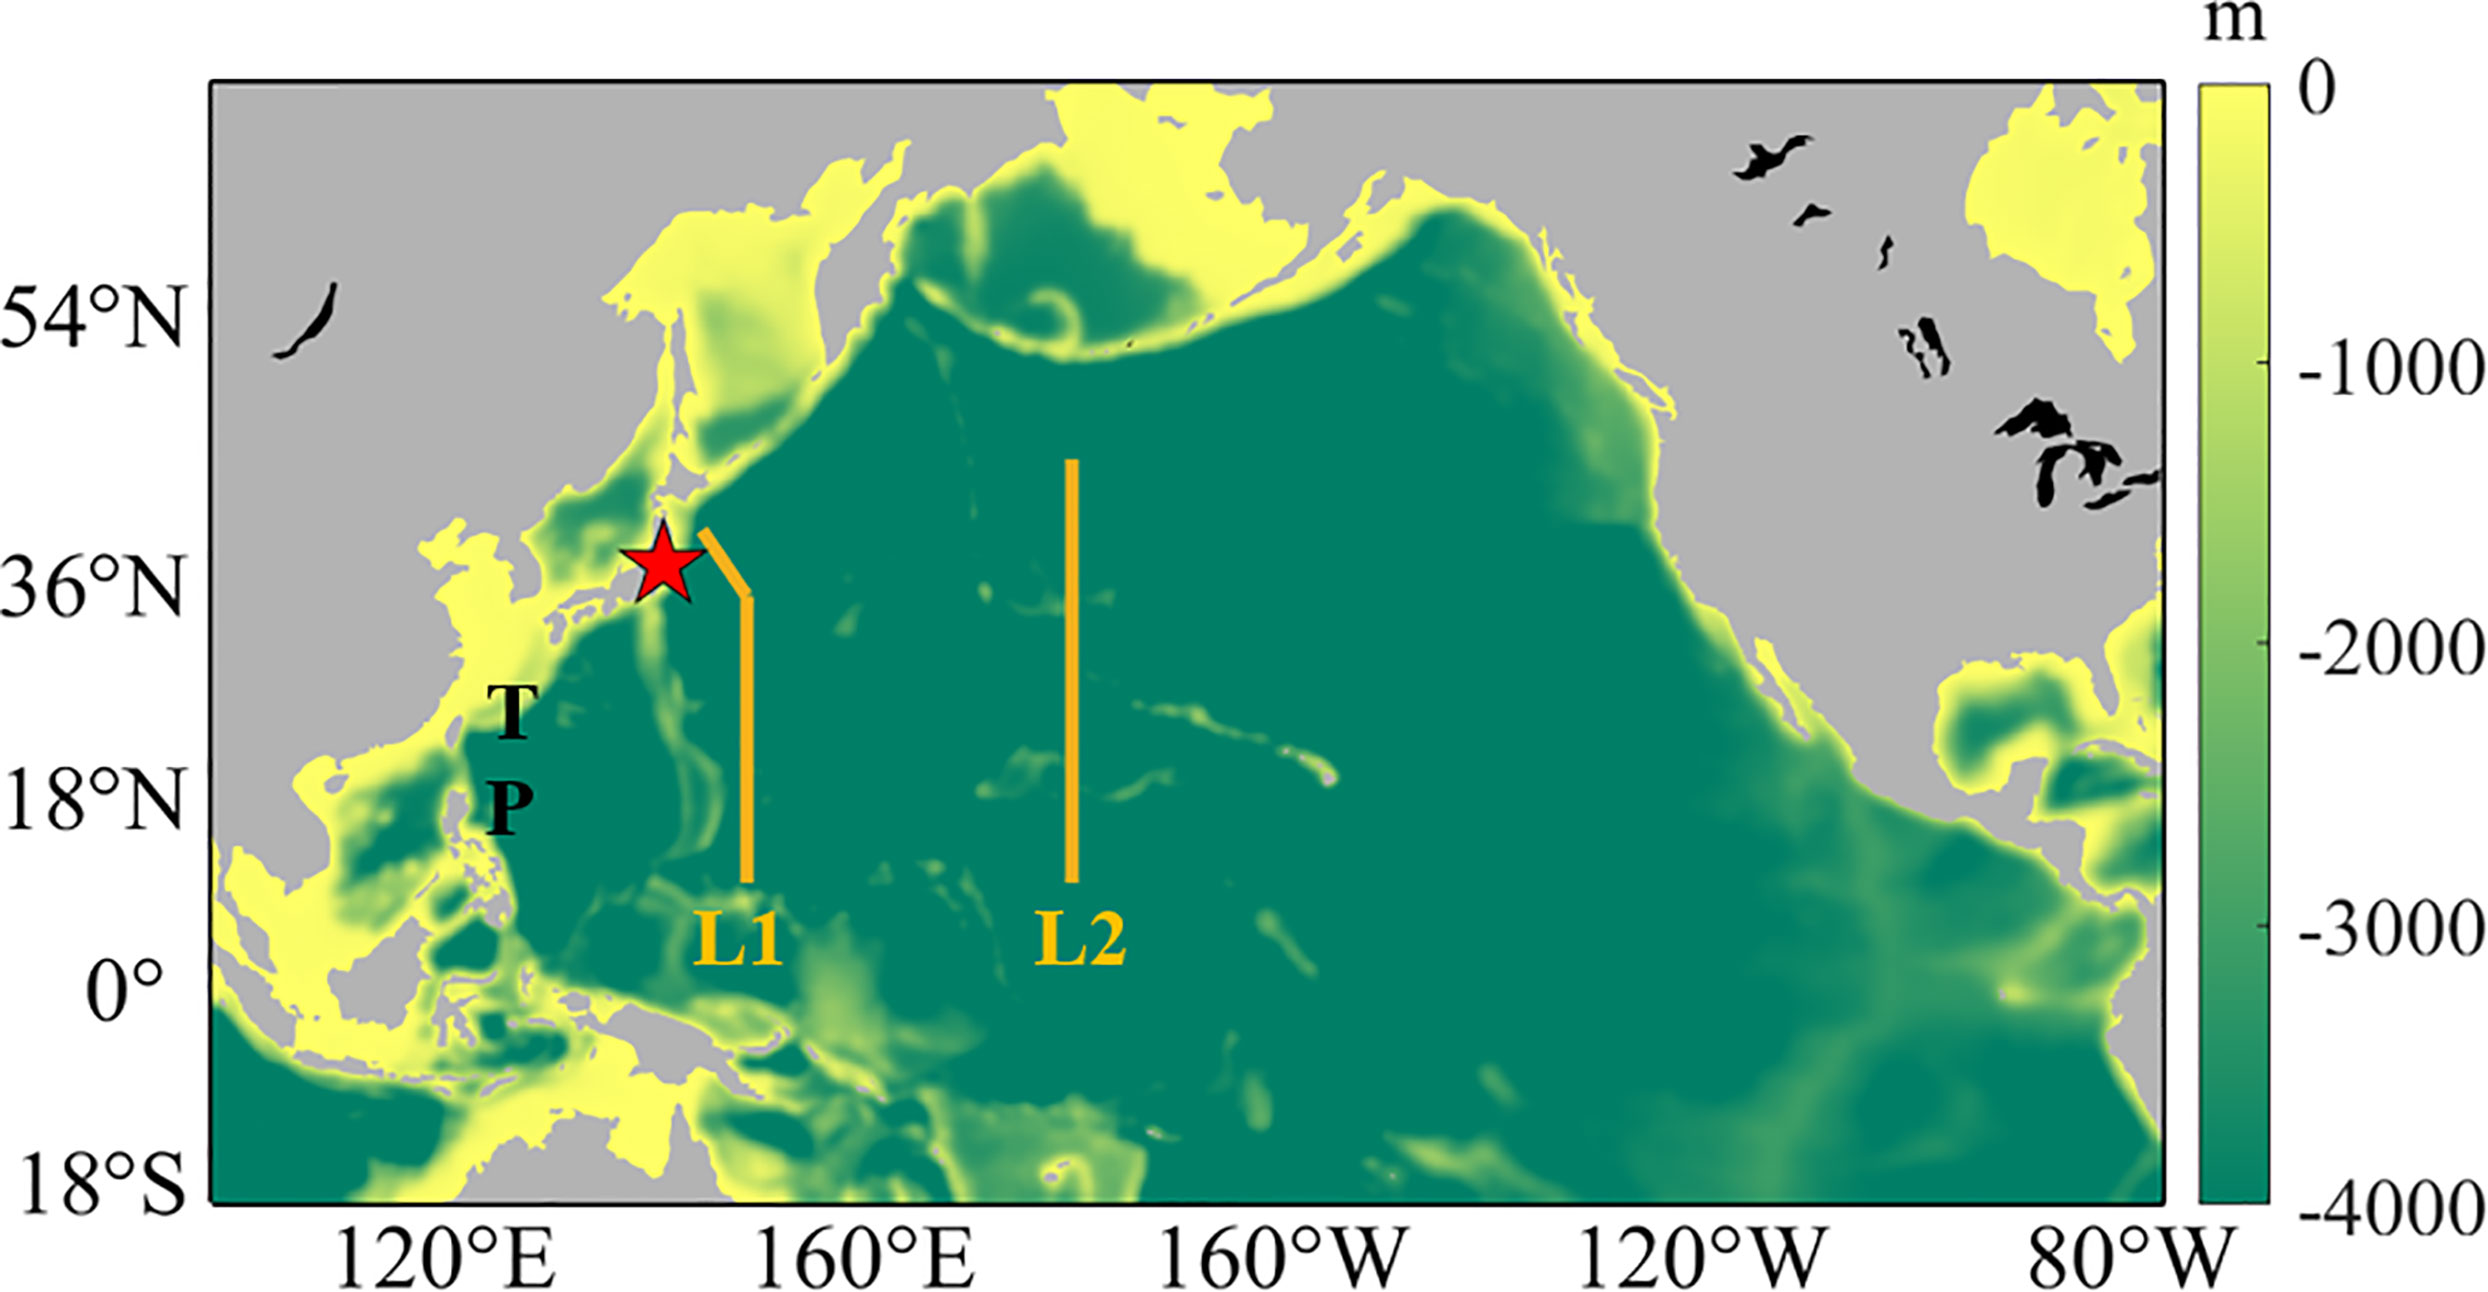
Figure 1 Model domain in the North Pacific region. Shading represents depth; red star represents the location of the Fukushima Dai-ichi Nuclear Power Plant. Lines L1 and L2 along 149°E and 180°E were selected for comparison and analysis of model results. T and P represent Taiwan and the Philippines, respectively.
As in Large et al. (1994), K-profile nonlocal closure schemes were applied for vertical mixing parameterization. The K-profile scheme was expanded to include surface and bottom oceanic boundary layers. Daily average estimates from the European Center for Medium-Range Weather Forecasts (ECMWF) Interim (ERA-Interim) datasets were used for atmospheric forcing parameters (Hersbach et al., 2020). The 2 m dew point temperature, mean sea level pressure, relative humidity, net short-wave downward radiance, 2 m air temperature, evaporation, precipitation, and 10 m zonal and meridional wind speeds were used as variables for atmospheric forcing. Simple open ocean data assimilation (SODA) version 3.4.1 was used for the open boundary data, including the temperature, salinity, and zonal and meridional velocities (Carton and Giese, 2008).
The initial data were obtained from the World Ocean Atlas 2013 version 2, objective analyses, and statistical data. The model was run for five years with the forcing in 2001 and then integrated for 10 years from January 2001 to March 2011. The results on March 11, 2011 were used as the initial data for tracer experiments.
The model results were compared with the observation data for validation. Sea Surface Temperature (SST) observation data from the Operational Sea Surface Temperature and Sea Ice Analysis (OSTIA) were used to validate the model SST (Donlon et al., 2012). The OSTIA SST data were provided by the Group for High Resolution Sea Surface Temperature (GHRSST). The observation data for model validation of Sea Surface Height (SSH) were from Archiving, Validation, and Interpretation of Satellite Data in Oceanography (AVISO), represented by the gridded altimeter SSH from the French Space Agency’s Center (https://www.aviso.altimetry.fr/en/home.html/). Absolute dynamic height data were selected among the variable SSH data for comparison. To unify the reference level of the SSH with the model, anomaly values from the spatial mean value of the absolute dynamic height of the North Pacific model domain were compared. To assess the model performance regarding mode water properties, EN4 data provided by Met Office Hadley Centre for Climate Change was used for comparison (Good et al., 2013). The water temperature, salinity, and 134Cs sections observed by Kumamoto et al. (2014) were used to validate the model performance of mode water formation and subduction.
To trace 137Cs released from the FDNPP, a passive trace experiment was conducted. The governing equation of passive tracers can be expressed as Equation (1).
where C is the concentration of the passive tracer, is the vector velocity, is the turbulent tracer fluxes, vθ is the molecular diffusivity, FC is a forcing term, and DC is the horizontal diffusive term. As the vertical mixing due to molecular viscosity is less than turbulent mixing, the terms involving vθ could be neglected. The turbulent tracer fluxes were introduced as functions of the eddy diffusivity coefficients calculated from the K-profile nonlocal closure schemes. The horizontal diffusivity coefficient was set at 20 m2/s. There was no source or sink during the experiments; therefore, the term FC could be neglected. The initial value of the tracer was assumed to be 3.5 PBq (Kaeriyama et al., 2016).
The passive tracer was released at a surface grid (141.25°E and 37.38°N) near the FDNPP on March 11,2011. The released passive tracer was dispersed by advection and diffusion. It was then tracked for approximately 10 years from March 11, 2011 to December 31, 2020. To consider the half-life of 137Cs (30 years), the concentration of 137Cs was calculated by applying a half-life function of 30 years at each time step. We do not consider atmospheric deposition because the main purpose of this study is to estimate the path and travel time of tritium water, which will be discharged from Fukushima.
2.2 Definition of STMW and CMW
The STMW and CMW have been defined in various ways (Ladd and Thompson, 2002; Oka and Suga, 2005; Oka, 2009; Davis et al., 2011; Oka et al., 2011). In this study, STMW was defined as a temperature range from 15.4 to 19.7 °C, salinity range from 34.6 to 35.0 g/kg, and density range from 25.0 to 25.9 kg/m3, as per previous studies (Kumamoto et al., 2014; Macdonald et al., 2020). The CMW was defined as a temperature range from 10.0 to 14.5 °C, salinity range from 34.3 to 34.6 g/kg, and density range from 25.5 to 26.3 kg/m3, considering previous studies (Suga et al., 1997; Oka and Suga, 2005; Macdonald et al., 2020).
The formation of the mode waters is related to the deep mixing of layers, low potential vorticity, and the anticyclonic recirculation of the Kuroshio Current system (Macdonald et al., 2020). The formation region of STMW is approximately between 130°E and 175°E, and 30°N and 35°N; reemergence occurs at the same latitude as the formation region to the east of 180° (Kumamoto et al., 2014; Tak et al., 2021). The STMW volume increases from December to March as it forms due to vertical mixing caused by surface cooling in winter (Davis et al., 2011). The CMW forms in the Central North Pacific near 165°E in winter (Oka and Suga, 2005). The CMW spreads eastward along the North Pacific Current, and then turns clockwise (Kumamoto et al., 2014).
2.3 Model validation
Model results for various parameters were validated via comparison with observations. Figure 2 represents the monthly mean SST of the OSTIA and the model. We selected February 2012, one year after the FDNPP accident, as mode waters are formed in winter (Oka, 2009). The SST distribution of the model corresponded with the OSTIA satellite over the entire model domain (Figures 2A, B). In particular, the model accurately simulated the main path of the Kuroshio extension defined by the 15 °C isotherm, similar to the OSTIA satellite SST (Figures 2C, D). The comparison results indicate that the simulated 15.0–19.7 °C isotherm corresponding to the STMW formation region corresponded with the observation (Oka, 2009; Kim et al., 2020; Wu et al., 2020; Tak et al., 2021).
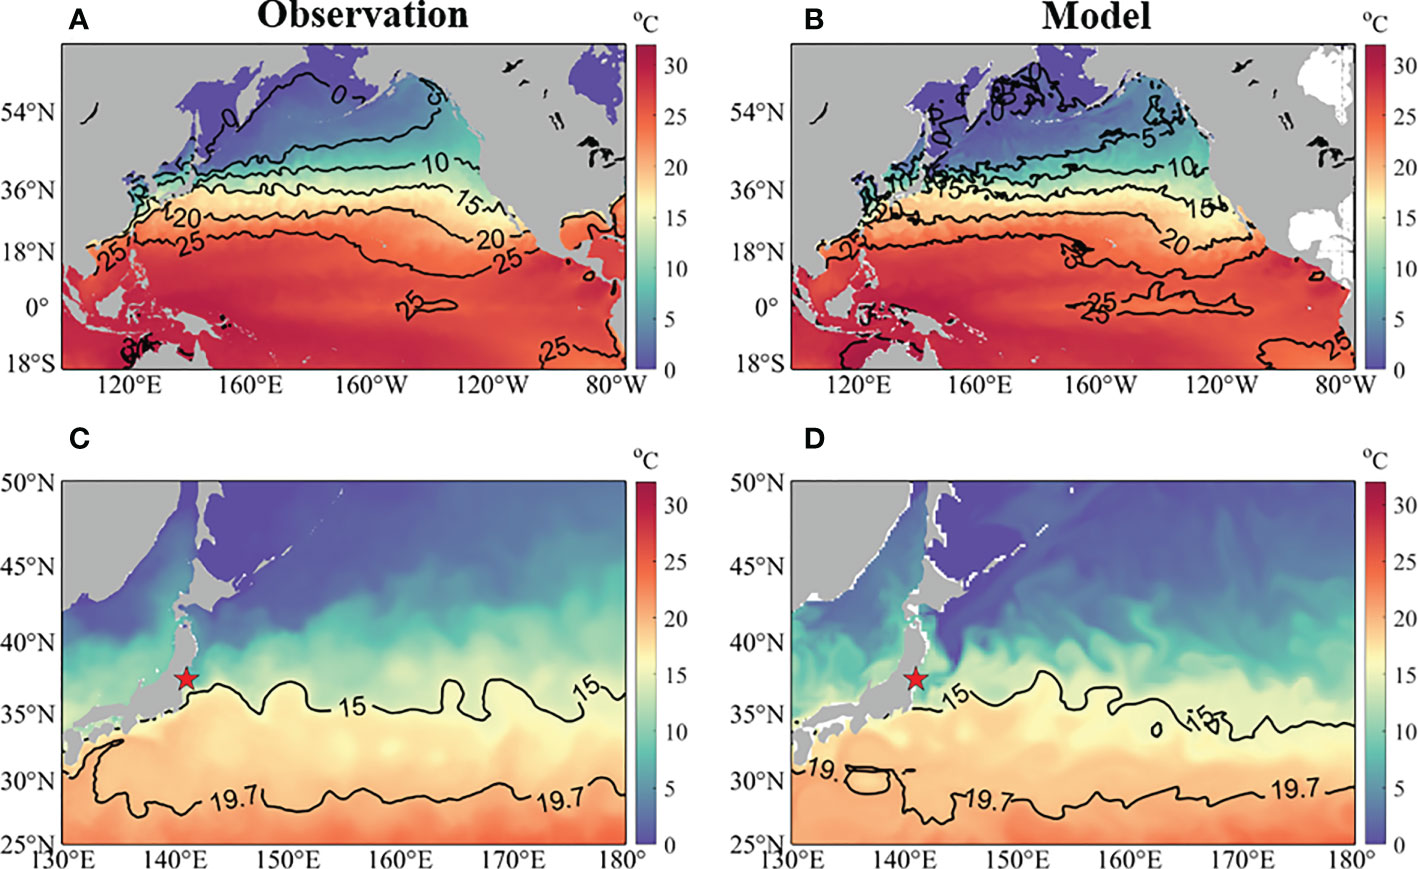
Figure 2 Comparison of the monthly mean sea surface temperature between (A, C) OSTIA and (B, D) model results in the (A, B) North Pacific and (C, D) western North Pacific in February 2012. The red star represents the FDNPP location.
The horizontal SSH distribution can be used as a proxy for surface current (Santoki et al., 2013; González-Haro et al., 2020). The overall SSH distribution of the model simulated the satellite SSH of AVISO well (Supplementary Figures 1A, B). In particular, the simulated separation latitude of the Kuroshio current south of the FDNPP was comparable with that of AVISO (Supplementary Figures 1C, D).
The observed and modelled horizontal and vertical distributions of mode waters were also compared. The distribution of STMW was compared in February and August 2012, one year after the accident, and in February and August 2020, nine years after the accident (Figure 3). Although we only present comparison results for 2012 and 2020, those for other years are similar.
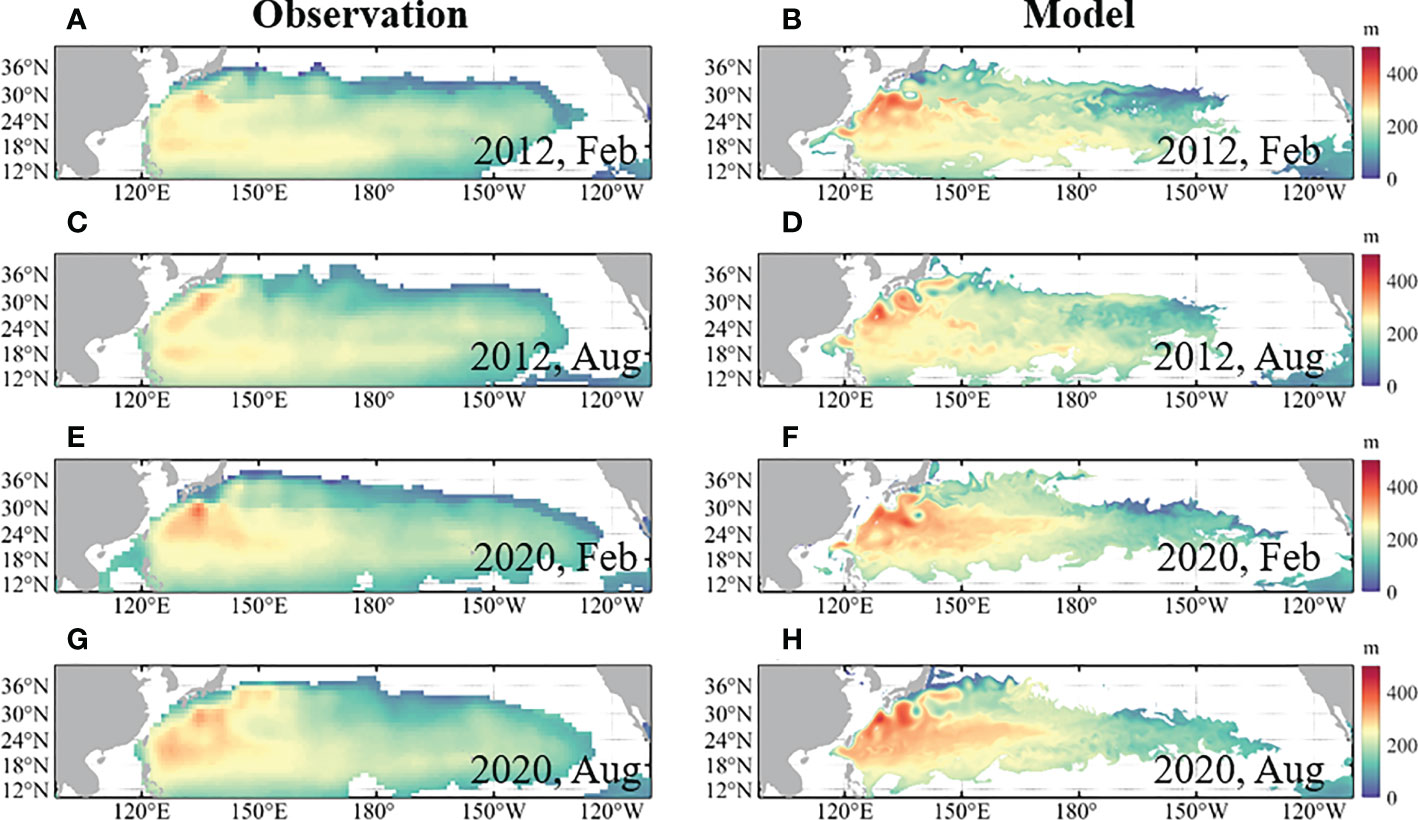
Figure 3 Comparison of the mid-depth of STMW between (A, C, E, G) EN4 and (B, D, F, H) model results in (A, B) February 2012, (C, D) August 2012, (E, F) February 2020, and (G, H) August 2020. STMW was defined by a temperature of 15.4–19.7 °C and salinity of 34.6–35.0 g/kg.
The horizontal distribution of the STMW mid-depth was then compared. The mid-depth was defined as the depth corresponding to the middle depth of STMW in each grid. Both spatial distributions of the mid-depth of STMW from EN4 and the model were commonly deep in the west and shallow in the middle, regardless of time. Most mid-depth ranges were between 200 and 300 m in the model and the observation. Although the lower horizontal grid resolution of EN4 (1°) did not depict spatially fine structure, as in the model (0.25°), the overall STMW distribution in the model matched well with that observed by EN4 (Supplementary Figure 2).
The observed and modelled CMW mid-depth were also compared for the same period (Figure 4). The simulated mid-depth corresponded well with the EN4 in the west, however it was deeper in the middle. Considering the uncertainty due to sparse observations at deep depths in the middle area, and model errors, the simulated depth of CMW was comparable with that in the observation (Supplementary Figure 3). Most mid-depth ranges were between 300 and 500 m within the model. In addition, the mid-depth of CMW was typically deeper than that of STMW in EN4 and the model.
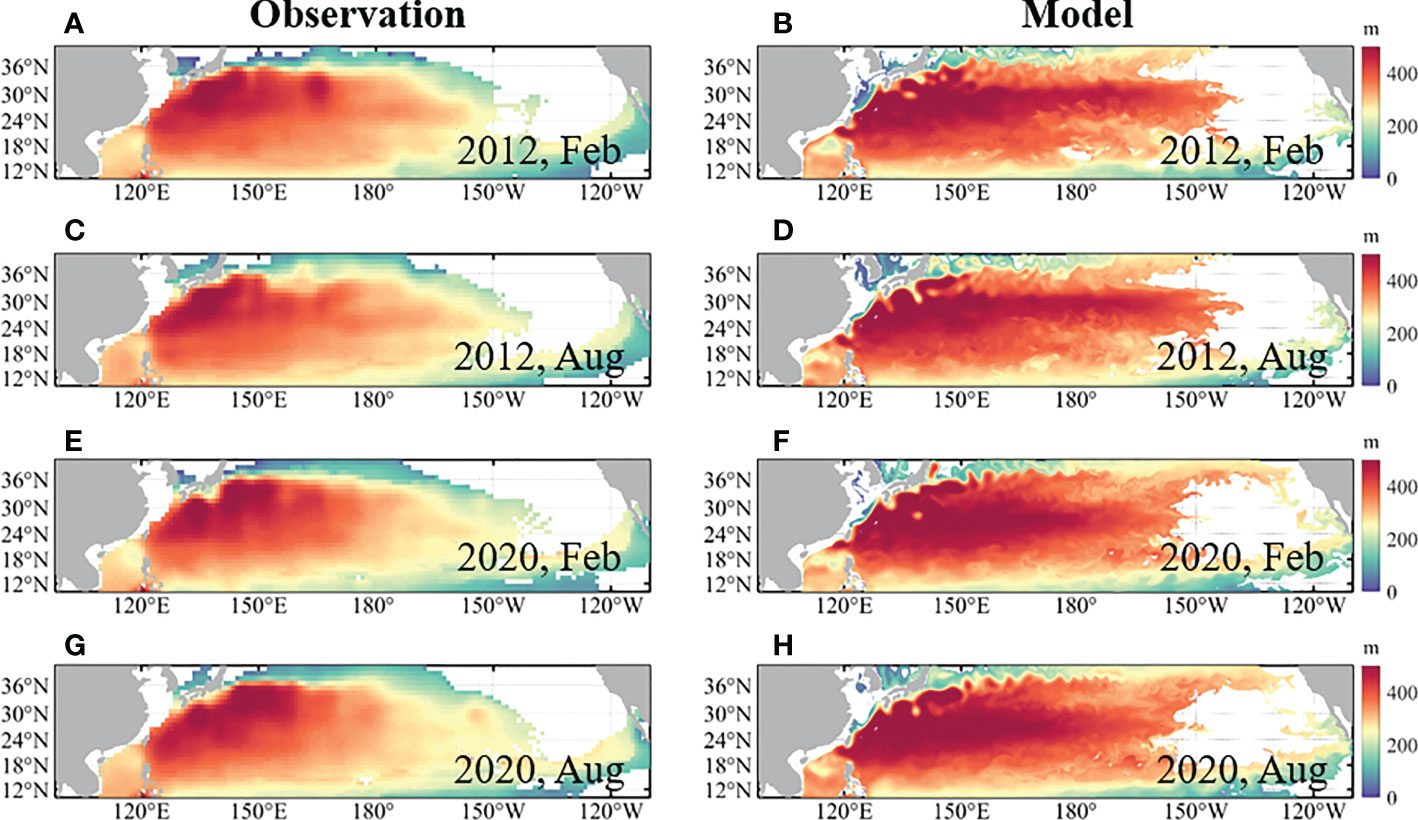
Figure 4 Comparison of the mid-depth of CMW between (A, C, E, G) EN4 and (B, D, F, H) the model result in (A, B) February 2012, (C, D) August 2012, (E, F) February 2020, and (G, H) August 2020. CMW was defined by a temperature of 10.0–14.5 °C and salinity of 34.3–34.6 g/kg.
The model results for mode water formation and its subduction structure were compared with the observation by Kumamoto et al. (2014). The meridional section of temperature, salinity, and cesium concentration observed along 149°E, east of the FDNPP (line L1 in Figure 1) in February 2012, were compared with the model results (Figure 5). The model simulated the formation of the STMW and CMW well, defined as temperatures between 15.4 and 19.7 °C, and 10.0 and 14.5 °C, respectively, north of 30°N (Figures 5A, B). The model simulated vertically homogeneous mode waters in the temperature section near the Kuroshio extension (approximately 35°N) and their thinning south of 30°N. In the observed and modelled results, the stratification became stronger and shallower toward the south. The modelled and observed salinities were also comparable, although the area with a salinity from 34.4 to 34.7 g/kg in the model was wider than that in observations (Figures 5C, D).
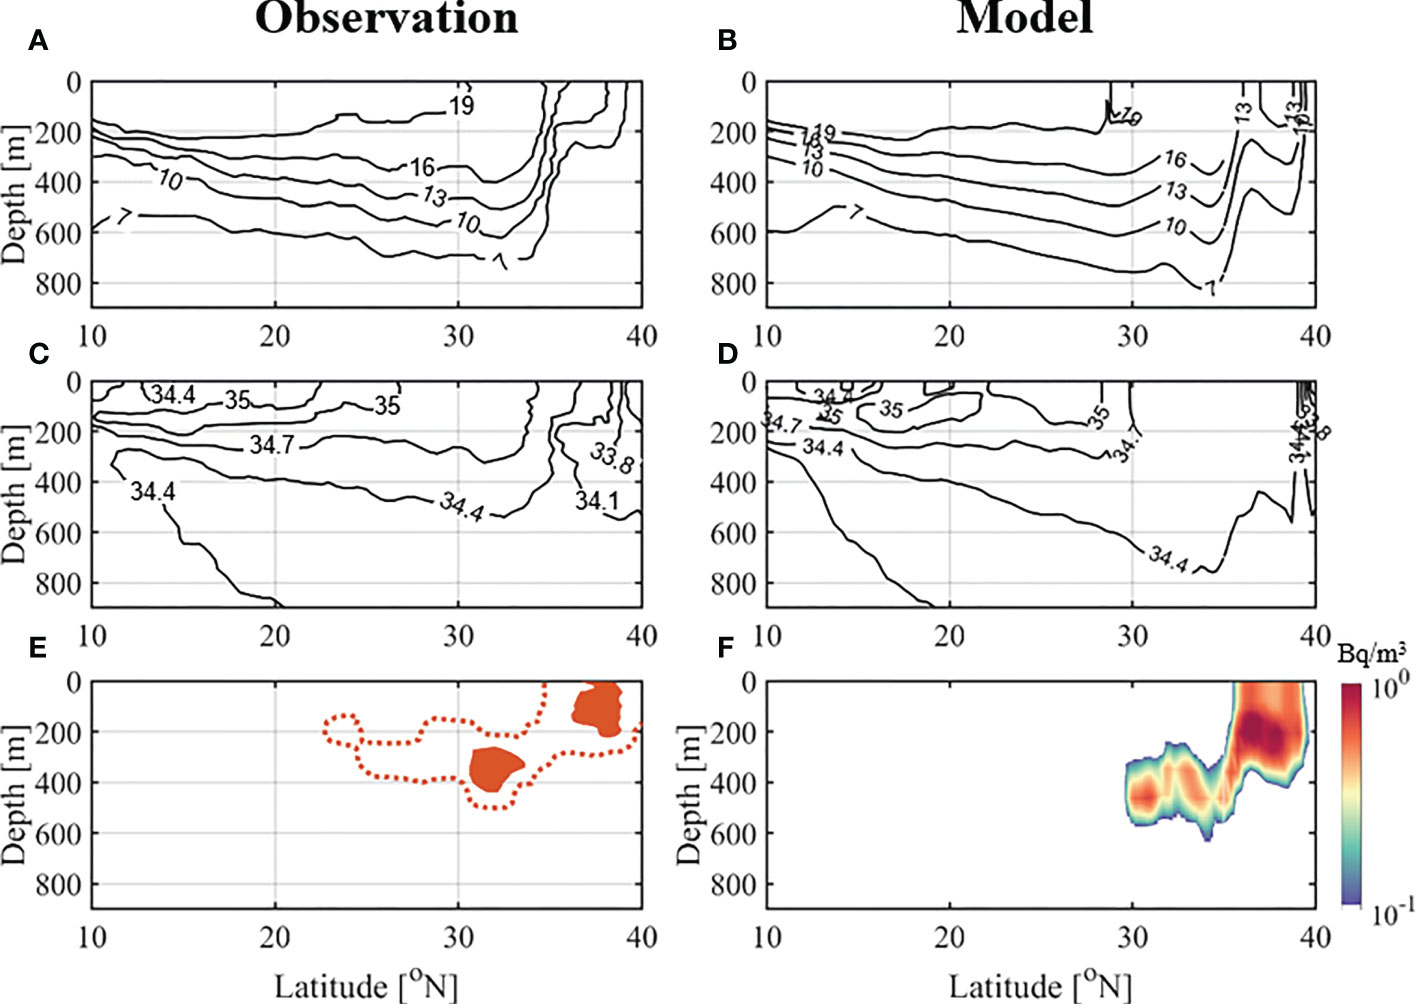
Figure 5 Vertical section of (A, B) temperature, (C, D) salinity, and (E, F) 134Cs in observation (Kumamoto et al., 2014) and model along line L1(149°E). The background contour units are (A, B) the water temperature (°C) and (C, D) the salinity (g/kg). The orange dashed lines denote 2 Bq/m3; orange shadow in the observation denotes ≥10 Bq/m3. (E) is redraw from Kumamoto et al. 2014, (Figure 3A).
The 134Cs/137Cs activity ratio released from the Fukushima accident was close to 1 and the total releases of both radioactive Cs were nearly equivalent (Aoyama et al., 2012; Nakano and Povinec, 2012). The observed 134Cs were directly compared with the model results. Because the half-life of 134Cs is as short as 2.1 years, the background concentration of 134Cs before the Fukushima accident was negligible. The observed distribution of 134Cs along the mode waters was well replicated by the model. A high concentration of 134Cs was observed in the surface layer north of 35°N and in the subsurface corresponding to the mode water layers south of 35°N (Figures 5E, F). The simulated 134Cs concentration was consistent with the observation, indicating that high 134Cs concentrations dispersed with the mode waters. The core of 134Cs, located between a salinity of 34.4 and 34.7 g/kg, was shallower than the lowest salinity layer in both the observation and model (Figures 5E, F).
The model result was also compared with the distribution of 137Cs observed by Kaeriyama et al. (2016) (Supplementary Figure 4). The high concentrations of 137Cs at 300–400 m depth from 38 to 39°N and 100–200 m depth from 38 to 39°N were comparable. Considering that atmospheric deposition was not considered, it seems that the concentration of the model was lower than that of the observation. However, the distribution of radioactive Cs was similar to the observations. For further validation, observed 134Cs concentrations along 30°N by Yoshida et al. (2015) and along 47°N by Kumamoto et al. (2017) were compared with the 134Cs concentration of model output (Supplementary Figures 5, 6). The distribution of 134Cs in each observation was similar to the distribution of 134Cs simulated by the model. Additional observations and model results were compared. Supplementary Figure 7 is a comparison of the concentration of 134Cs in the observed data from Kumamoto et al. (2022) and the model result along 47°N. The maximum concentration appeared between 160°W and 140°W, and the range was also similar.
The model result shows a lower concentration of 134Cs than the observations by Kumamoto et al. (2014) and Kaeriyama et al. (2016) near FDNPP, but a similar value to the observation by Kumamoto et al. (2022) far from FDNPP. This spatial difference might be due to atmospheric deposition. Honda et al. (2012) reported that atmospheric deposition occurs mainly near FDNPP but little in the east of 165°E (Figure 3 in Honda et al., 2012). Exclusion of atmospheric deposition in our model might cause underestimation of the 137Cs concentration in the western area near FDNPP.
3 Surface distribution of radioactive material
The radioactive material released from FDNPP spread quickly eastward by the Kuroshio extension after the accident (Buesseler et al., 2012; Honda et al., 2012). Figure 6 displays the monthly surface 137Cs concentration from the model results in April, August, December 2011 and annually from February from 2012 to 2020. In the early stage, most of the released 137Cs moved eastward while some of the 137Cs moved southeastward by the effect of meandering Kuroshio currents (Figure 6A). After that, the high concentrated 137Cs core moved eastward (Figures 6B, C) and was then distributed widely in the west, which was the STMW formation region in February 2012 (Figure 6D). It was located primarily within the central area where CMW formed in February 2013 (Figure 6E). Some 137Cs in the sub-arctic gyre region moved south near the FDNPP in 2014 (Figure 6F). This recirculation by the sub-arctic gyre increased the 137Cs concentration off the FDNPP after 2015. Most of the 137Cs moved further east and reached the west coast of North America in 2015 (Figure 6G). This simulation result was consistent with results of previous studies (Behrens et al., 2012; Zhao et al., 2021), which simulated the arrival of a high 137Cs concentration to the western coast of North America after 5 years of the accident.
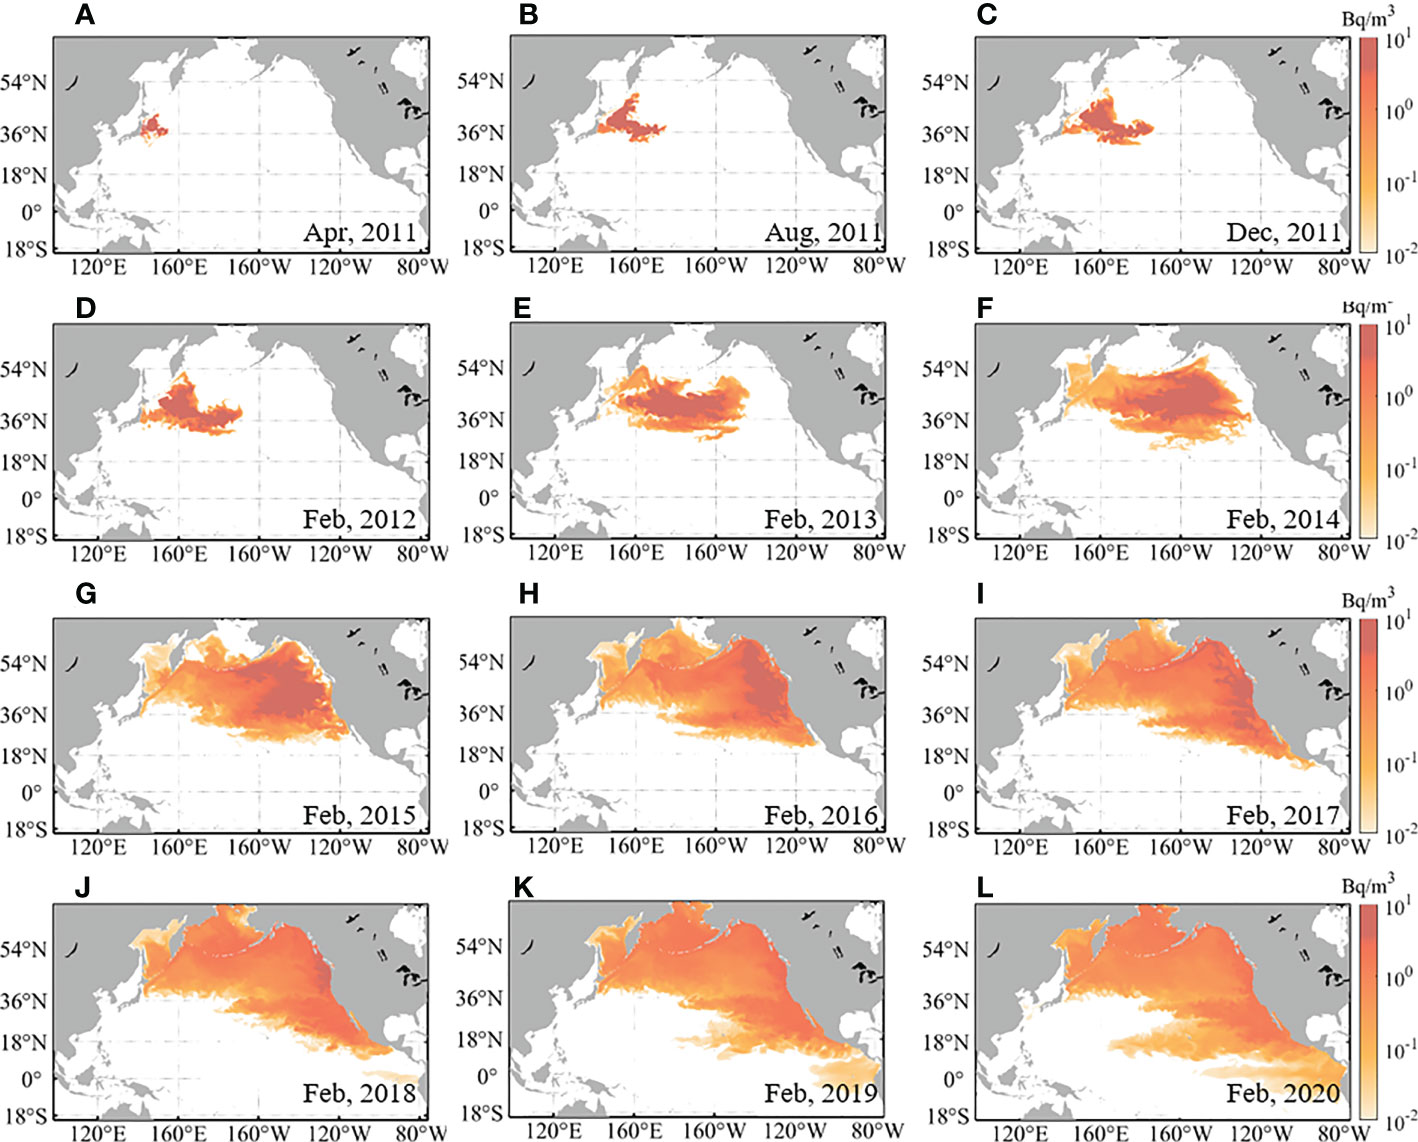
Figure 6 Monthly horizontal distribution of surface 137Cs concentration from the model results in April (A–C), August and December 2011 and each February (D–L) from 2012 to 2020. 137Cs concentration was corrected for radioactive decay (30 years).
The 137Cs off the western coast of North America moved further north and south by the currents (Figures 6H-J). The northward moving 137Cs entered the sub-arctic gyre region. A portion of the southward moving 137Cs moved to the west by the Equatorial Current in 2019 and 2020 (Figures 6K, L).
Notably, A 137Cs concentration > 1 Bq/m3 was not detected to the southwest of the Kuroshio extension from 2012 to 2020, as the Kuroshio current and its extension acted as a southern boundary for the dispersion of radioactive material along the surface. Similarly, the model result did not show a high concentration of 137Cs to the south of the Kuroshio extension, which was consistent with previous studies (Kaeriyama et al., 2013; Yoshida et al., 2015; Aoyama et al., 2016; Periáñez et al., 2019; Wu et al., 2019; Garraffo et al., 2016). However, our model result does not account for 137Cs and 134Cs in the east of Taiwan Island observed by Men et al. (2015) in May–June 2012. Moreover, the 137Cs and 134Cs detected east of Taiwan in 2012 may have resulted from atmospheric deposition.
4 Subduction of radioactive material
Observations indicated that high concentrations of 137Cs appeared in the subsurface at an approximate depth of 400 m south of 35°N, whereas the 137Cs concentration in the surface was not significant (Figure 5). This suggests that the 137Cs dispersion in the subsurface traveled along a different path than that in the surface, which is consistent with suggestions made in previous studies (Kumamoto et al., 2014; Kaeriyama et al., 2016; Zhao et al., 2021; Garraffo et al., 2016). Two vertical sections were selected to examine the temporal change in the dispersion of 137Cs by the STMW and CMW.
The vertical section along line L1, which crosses the STMW formation area, showed subsurface dispersion over time (Figure 7). The subducted 137Cs in March/April 2011 (Figure 7A) remains in the subsurface in August and December 2011 (Figures 7B, C) and connected to the newly subducted 137Cs in February 2012 (Figure 7D). The surface 137Cs subducted to the subsurface along the density of 25.0–25.9 kg/m3 corresponding to the STMW. In 2013, the 137Cs concentration decreased in the surface layer, while it dispersed widely in the subsurface (Figure 7E). All 137Cs became isolated from the surface after 2014 and moved south over time (Figures 7F-I). In 2018, the 137Cs core moved to 10°N at approximately 200 m (Figure 7J). The concentration of the southern tip at a depth of 200 m increased in 2020 (Figure 7L).
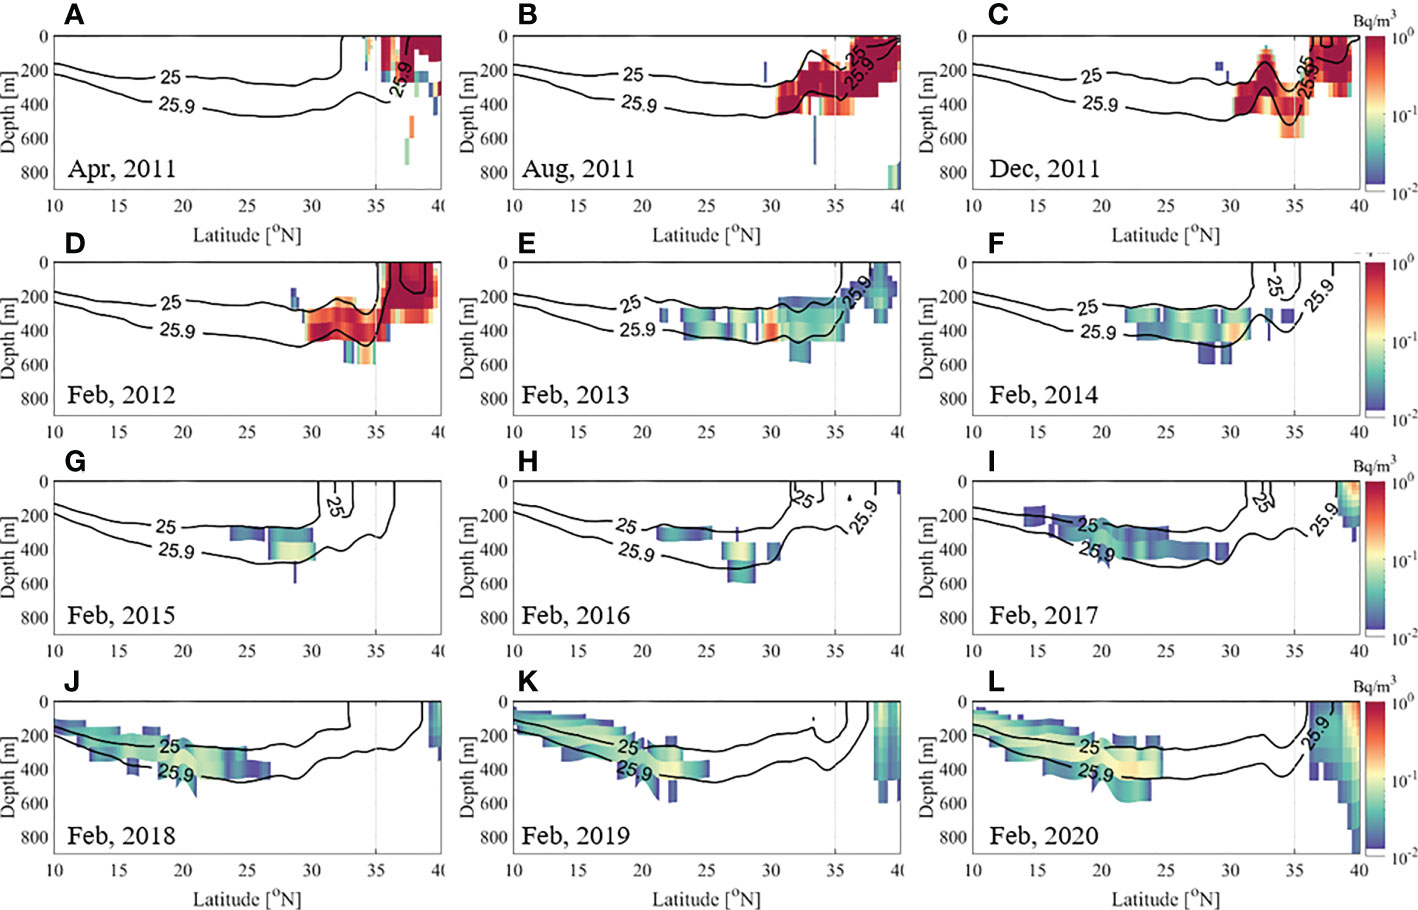
Figure 7 Monthly vertical section of 137Cs concentration along line L1 (149°E) in April (A–C), August and December 2011 and each February (D–L) from 2012 to 2020. The background contour represents the potential density (kg/m3). 137Cs concentration was corrected for radioactive decay (30 years).
However, the subduction of 137Cs along the line L2, which crosses the CMW formation area, does not occur before December 2011 due to time delay of 137Cs arrival in the surface (Figures 8A-C). After that, the vertical section along line L2 also showed the subduction of 137Cs over time, similar to line L1 (Figures 8D-L). The 137Cs in the surface layer along line L2 presented a longer retention duration than that near line L1. The 137Cs in the subsurface along line L2 was isolated from the surface after February 2016 and moved southward over time. The 137Cs concentration along line L2 was higher and its distribution was wider than that along line L1. Most 137Cs moved along the 25–26.3 kg/m3 density layer, corresponding with the STMW and CMW layers.
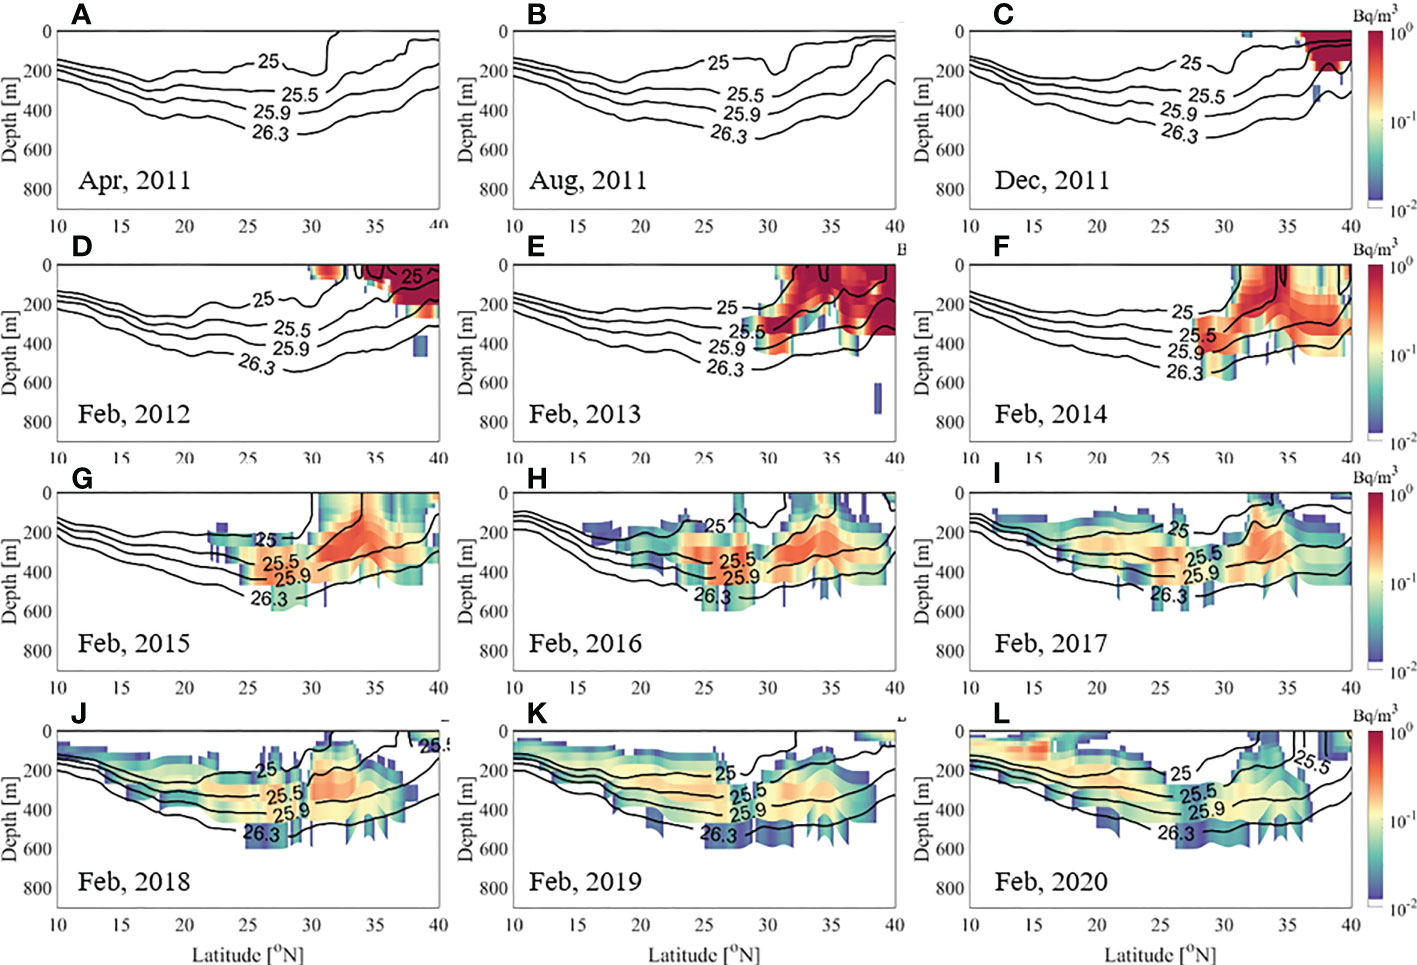
Figure 8 Monthly vertical sections of 137Cs concentration along line L2 (180°E) in April (A–C), August and December 2011 and each February (D–L) from 2012 to 2020. The background contour represents the potential density (kg/m3). 137Cs concentration was corrected for radioactive decay (30 years).
The 137Cs concentration along line L2 was high in STMW and CMW, which is consistent with the observation of a high 137Cs concentration in multiple density layers corresponding to mode waters along the 152°W vertical section in the North Pacific (Macdonald et al., 2020). The 137Cs concentration from the model was also high in both STMW and CMW along line L2. Wu et al. (2019) observed a high Pu isotopic ratio in the tropical region at 10–20°N in winter in 2014 and suggested a possibility that it was dispersed by CMW. The CMW, formed in the Central North Pacific, moves east by the North Pacific current, then turns clockwise to the south and west in the subsurface layer (Oka and Suga, 2005; Kumamoto et al., 2014).
Previous observations have reported the subduction of radioactive Cs due to mode water formations but did not show the detail dispersion path and its travel time by mode waters in the subsurface (Kaeriyama et al., 2014; Kumamoto et al., 2014; Kaeriyama et al., 2016). Zhao et al. (2021) suggested that simulated radioactive tritium could be dispersed by mode waters; however, they did not resolve the separate dispersion by two mode waters. Our model result suggests a three-dimensional dispersion path of radioactive material by STMW and CMW.
5 Dispersion of radioactive material by STMW and CMW in the subsurface
The long term evolution of the 137Cs distribution by STMW and CMW in the subsurface was examined over the whole simulation period. Figure 9 shows the monthly mean horizontal 137Cs concentrations on 25.4 and 26.3 kg/m3 density layers, corresponding to STMW and CMW. Most 137Cs moving with the STMW dispersed east, however, some also moved southward after the accident, which is consistent with the observation of Kumamoto et al. (2014). The southward movement of 137Cs by STMW continued until 2014 (Figures 9A, B). The eastward movement of 137Cs by STMW turned southward in the Central North Pacific in 2014 (Figures 9A-C). It then moved westward in 2017 and reached the east of Taiwan in 2020 (Figure 9D). The 137Cs moved by the CMW followed a clockwise path as in STMW. However, its path was larger, with a longer radius than that in STMW. The 137Cs arrived east of the Philippines in 2020 (Figure 9D). The horizontal distribution of each year from 2012 to 2020 is shown in Supplementary Figure 8.
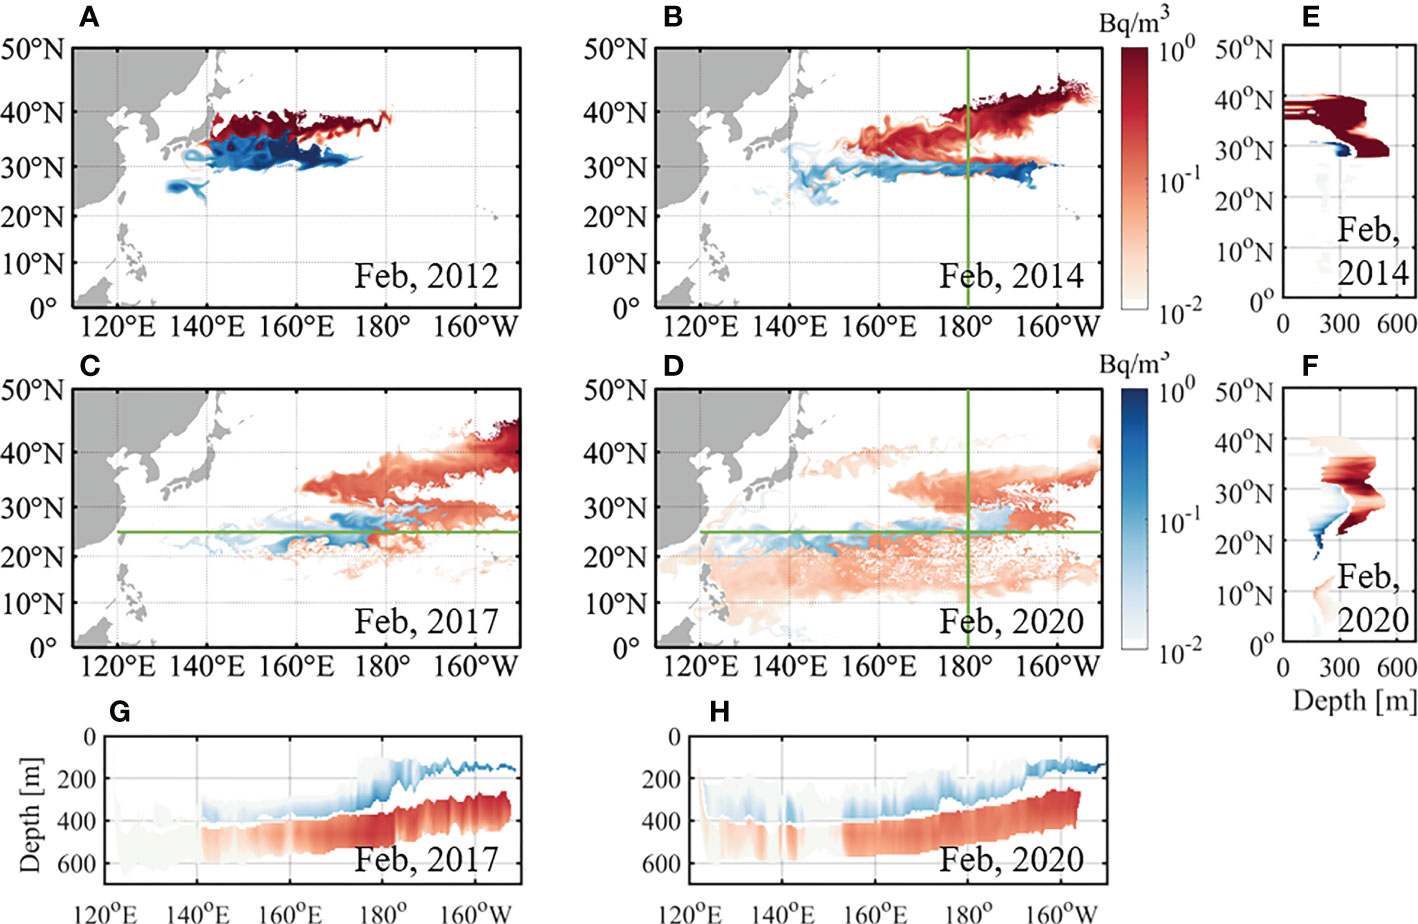
Figure 9 Monthly horizontal 137Cs concentration on the density layer of 25.4 kg/m3 (blue) and 26.3 kg/m3 (red) corresponding to STMW and CMW, respectively, in February (A) 2012, (B) 2014, (C) 2017, and (D) 2020. Monthly vertical 137Cs concentration along the meridional line (green line in (B) and (D)) at 180° in February (E) 2014 and (F) 2020. Monthly vertical 137Cs concentration along the zonal line (green line in (C) and (D)) at 25°N in February (G) 2017 and (H) 2020. 137Cs concentration was corrected for radioactive decay (30 years).
Vertical sections of 137Cs distribution across the overlaid region for the two mode waters displayed their different depths. The 137Cs in the STMW of the meridional section along 180° was located at a depth of 200–300 m at approximately 30°N, however that in CMW was distributed from the surface to a depth of approximately 500 m in February 2014 (Figure 9E). The descending structure of the 137Cs suggested CMW formation between 35°N and 40°N. The 137Cs moved further south by STMW and CMW in February 2020 (Figure 9F). The mid-depth of 137Cs moving by the STMW and CMW was approximately 200 and 400 m, respectively. The zonal section along 25°N showed that the moving depth by the STMW was shallower than that by the CMW in February 2017. The depths of both mode waters became deeper in the west (Figure 9G). This spatial distribution of 137Cs persisted from February 2017 to 2020 (Figure 9H).
Figure 10 shows the time series of the spatial mean concentrations of 137Cs in each mode water from the model. Tracers located south of 40°N were considered. Both mean concentrations decreased due to diffusion and decay over time. The mean concentration of 137Cs in CMW was higher than that in STMW for the entire period, and both concentrations in the STMW and CMW showed weak seasonal changes with high concentrations in winter. The increased concentration of 137Cs in winter may have resulted from the supply owing to vertical mixing. Considering the half-life of 137Cs is as long as 30 years, the main cause of the decrease in the concentration is likely diffusion.
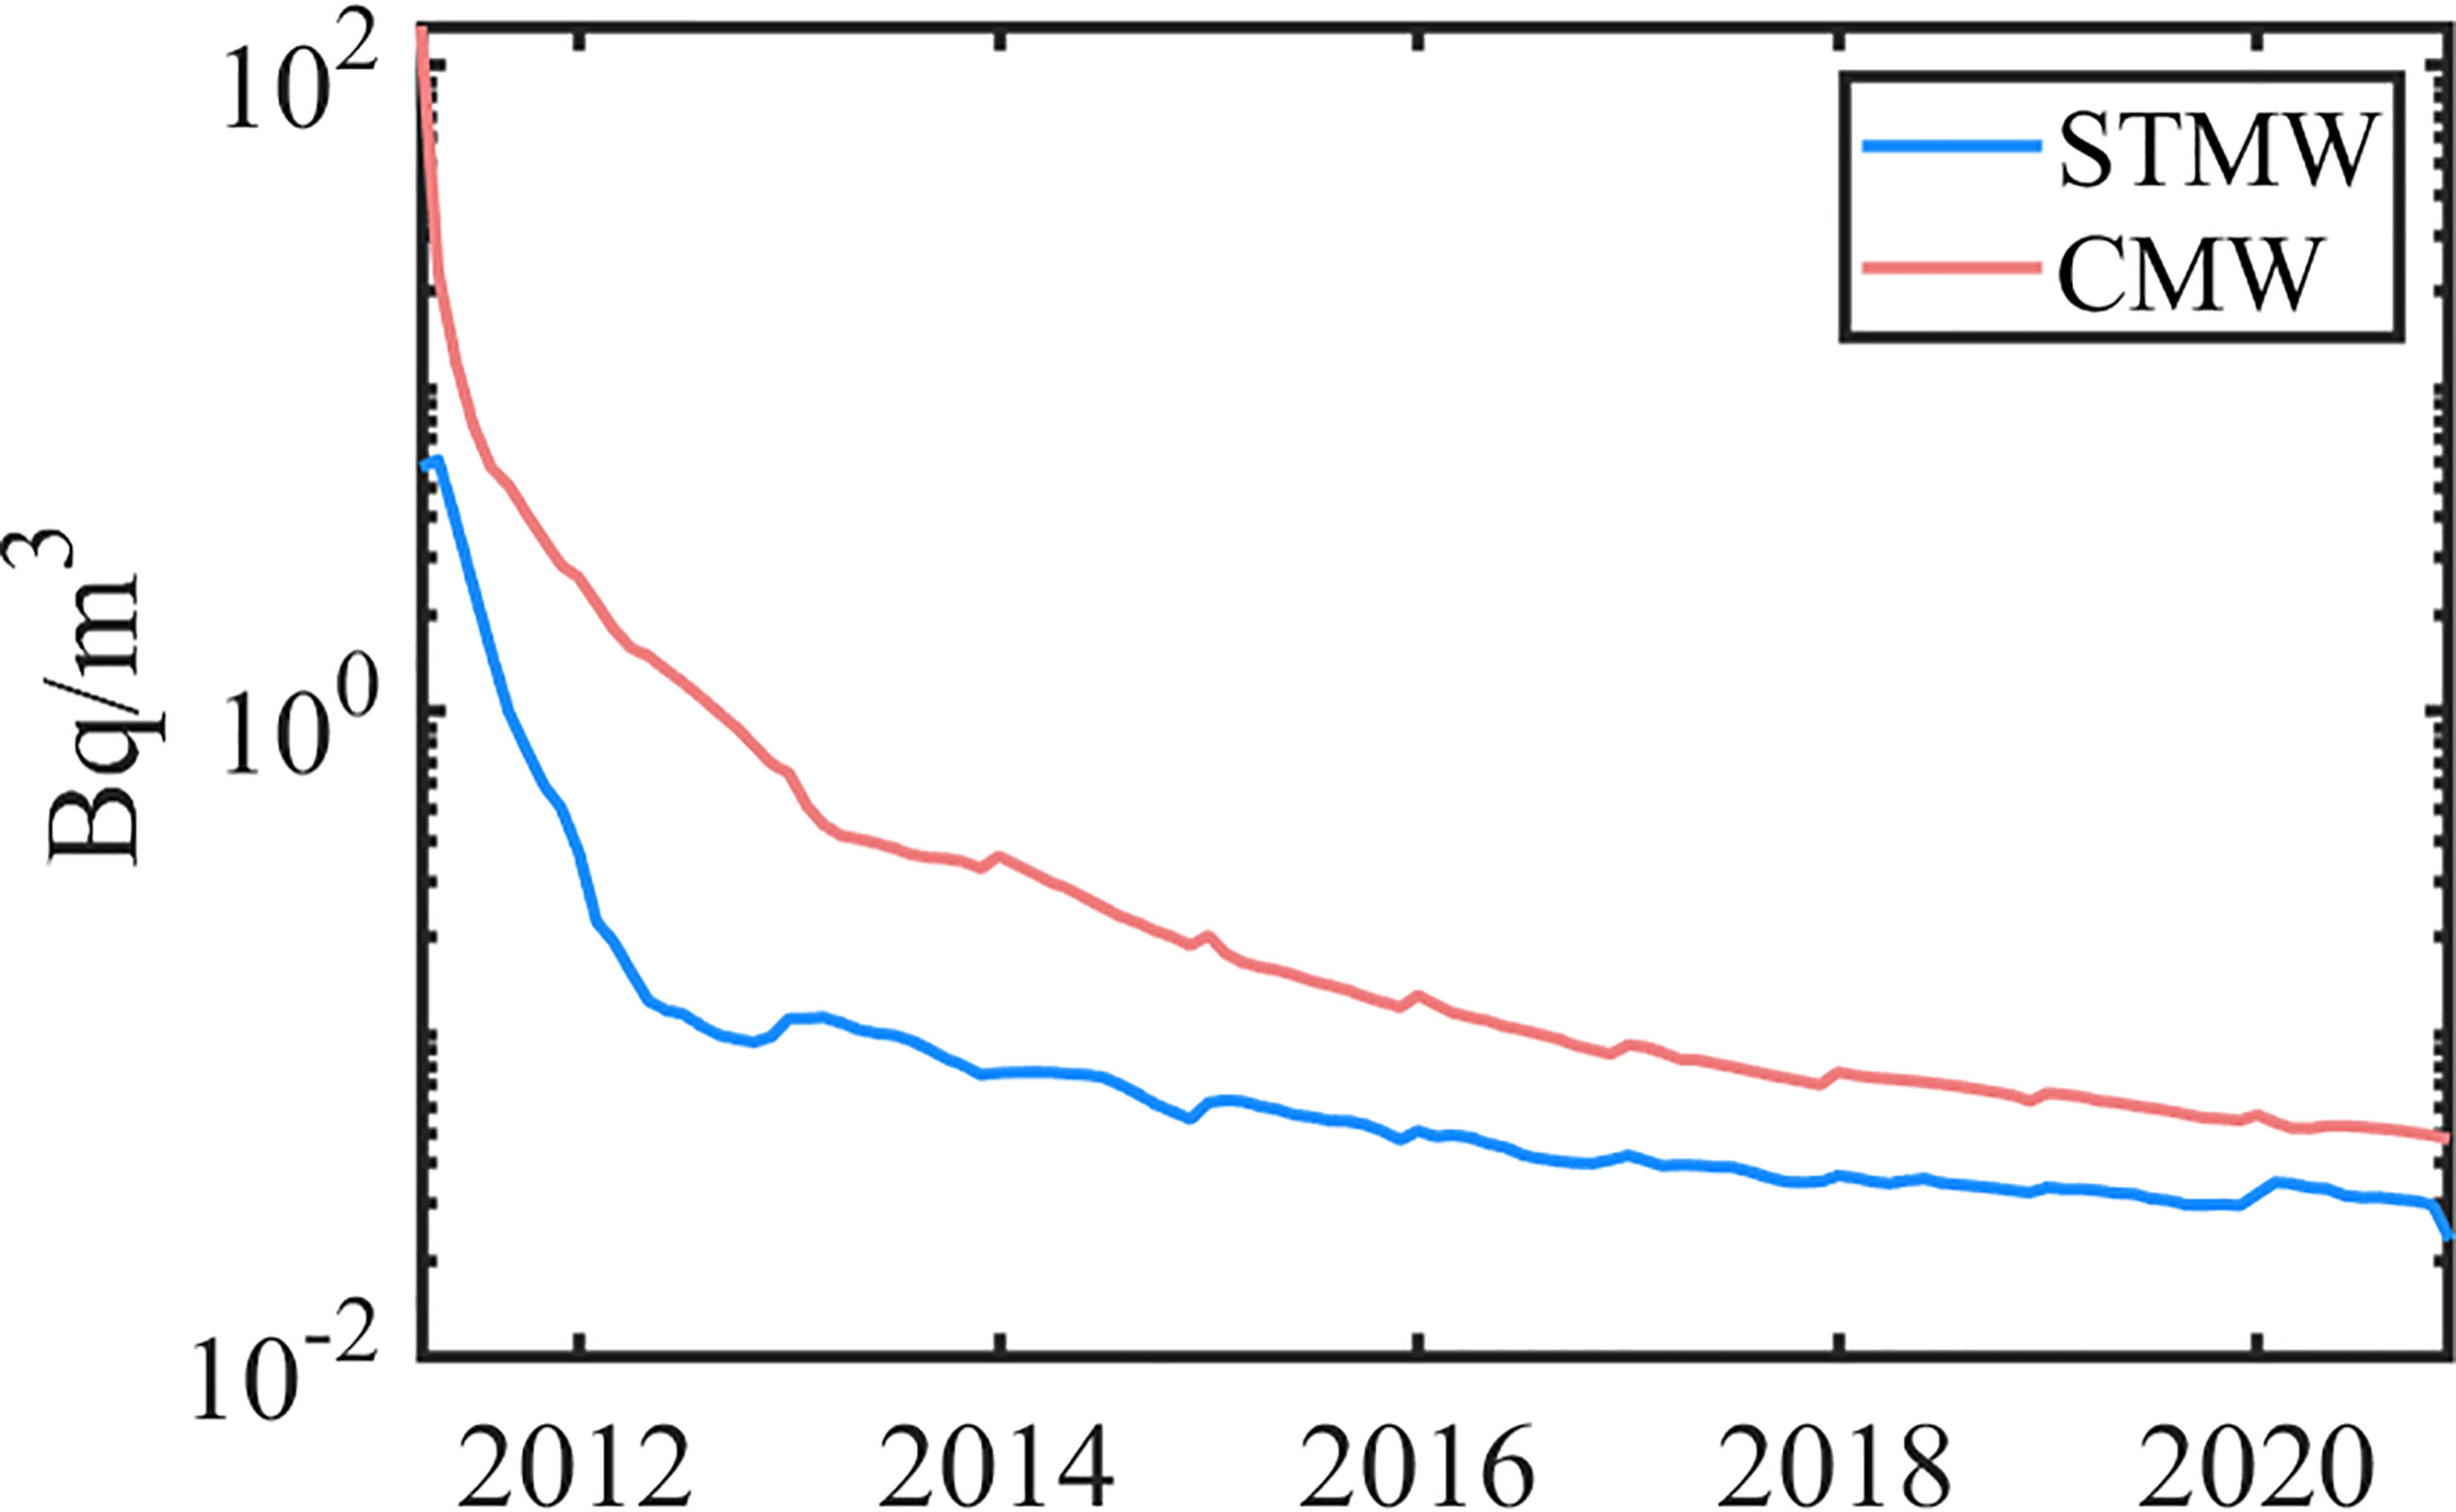
Figure 10 Time series of the spatial mean concentration of 137Cs in STMW (blue line) and CMW (red line).
A schematic diagram showing the dispersion of 137Cs released into the ocean by STMW and CMW over long periods of time has been proposed based on the model result (Figure 11). Some 137Cs moving via STMW moved south after the accident, however most moved clockwise at a relatively shallow depth (200–300 m). The 137Cs moving via CMW also exhibited clockwise movement; however, its path had a larger and deeper radius than STMW (300–500 m). In contrast, the real depth of CMW in the Central North Pacific was likely shallower considering the depth difference between the model and observation, as indicated in Figure 4.
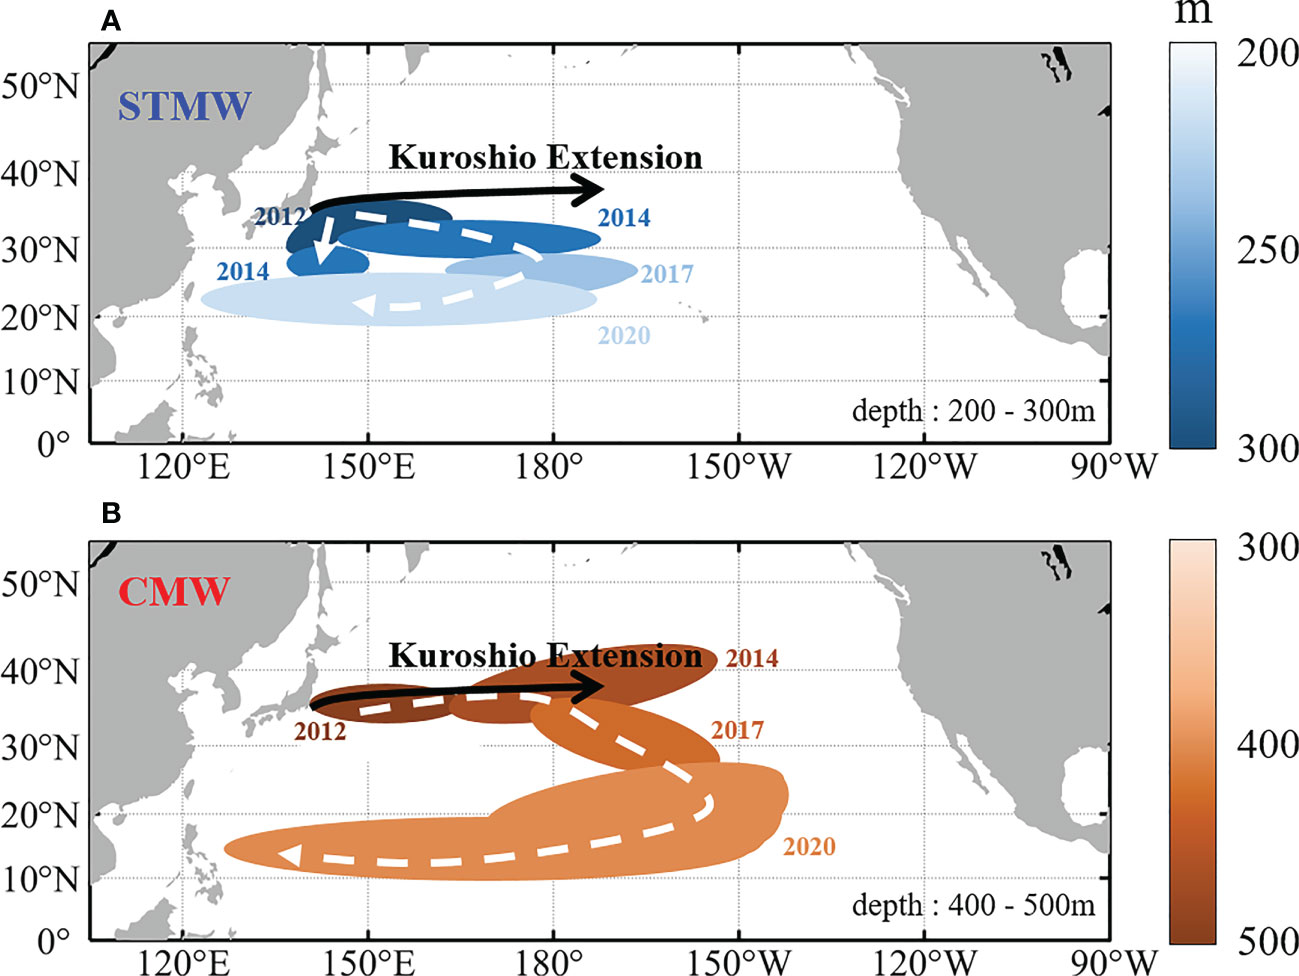
Figure 11 Schematic diagram of 137Cs path induced by (A) STMW and (B) CMW. The area of the ellipse represents the distribution of 137Cs, and the color roughly represents the mid-depth.
Considering that tritium is to be additionally released into the ocean at the FDNPP planned for 2023, the subsurface dispersion of 137Cs that leaked into the ocean in 2011, as described in this study, is expected to provide important insights regarding the path and effect of tritium after 2023. Because the discharging point is consistent with this experiment, it is expected that the discharging tritium from 2023 will give insight into understanding the dispersion in the subsurface, which is unclear. In addition, Pacific blue fin tuna (Thunnus orientalis) spend long periods of time in both mode water layers, whereas skipjack tuna (Katsuwonus pelamis) passes STMW during northward migration (Fujioka et al., 2018; Kiyofuji et al., 2019). Hence, the fishery products may face a risk of pollution; therefore, continuous tracking and observation of radioactive material by each mode water are necessary.
6 Conclusion
In this study, the subsurface dispersion of radioactive materials released into the ocean from the FDNPP accident were simulated by a three dimensional numerical model from March 11, 2011, to December 31, 2020. The model performance was validated by comparisons with various observed parameters, including water temperature, salinity, and distribution of radioactive materials at the ocean surface and subsurface.
The model results revealed that the subsurface dispersion path of the radioactive material differed from that in the surface. The 137Cs spread by two mode waters in the subsurface, whereas the surface 137Cs was driven by the strong Kuroshio and its extension, which also acted as a southern boundary for 137Cs dispersion.
Previous observational studies suggested the possibility of the subsurface dispersion of radioactive Cs by mode water. However, the dispersion path and travel time of radioactive materials in the subsurface have not been known due to the spatiotemporal limitation of observational data. Our numerical model result enabled us to decipher the path and travel time of 137Cs by STMW and CMW. 137Cs subducted to the subsurface by STMW in the western region bifurcated into two paths; one moved southward while the other moved clockwise. 137Cs subducted by CMW in the Central North Pacific was located beneath the STMW. The 137Cs in the CMW moved clockwise along an outer and deeper path than that in the STMW. The final destination for the 137Cs moving with STMW and CMW was east of Taiwan and the Philippines nine years after the accident, respectively.
The 137Cs concentration in STMW and CMW primarily decreased due to diffusion over time; however, it increased slightly during each winter, when mode waters were supplied by vertical mixing. The mean concentration of 137Cs in CMW was higher than that in STMW; in addition, the concentration in CMW decreased faster than that in STMW. Because the area and volume of CMW is larger than those in the STMW, the decrease of mean concentration in CMW by diffusion might be faster.
Our model will have important implications for estimating the potential impact of Japan’s plan to discharge contaminated water into the subsurface ecosystem. Therefore, special attention is needed to the effect on Pacific bluefin tunas (Thunnus orientalis) or skipjack tunas (Katsuwonus pelamis), which spends extended durations in STMW and CMW.
Data availability statement
The raw data supporting the conclusions of this article will be made available by the authors, without undue reservation.
Author contributions
Conceptualization, S-TL and Y-KC; Methodology, JJ and S-TL; Writing Draft, S-TL; Review and Editing, Y-JT, GK and Y-KC; Visualization, S-TL; Supervision, Y-KC. All authors contributed to the article and approved the submitted version.
Funding
Modeling for this research was partly supported by Korea Institute of Marine Science & Technology Promotion (KIMST) funded by the Ministry of Oceans and Fisheries (KIMST-20220033) and the National Research Foundation (NRF) funded by the Korean government (NRF-2022M3I6A1085698).
Acknowledgments
The constructive and thoughtful comments from two reviewers significantly improved the manuscript.
Conflict of interest
The authors declare that the research was conducted in the absence of any commercial or financial relationships that could be construed as a potential conflict of interest.
Publisher’s note
All claims expressed in this article are solely those of the authors and do not necessarily represent those of their affiliated organizations, or those of the publisher, the editors and the reviewers. Any product that may be evaluated in this article, or claim that may be made by its manufacturer, is not guaranteed or endorsed by the publisher.
Supplementary material
The Supplementary Material for this article can be found online at: https://www.frontiersin.org/articles/10.3389/fmars.2023.1104786/full#supplementary-material
References
Amante C., Eakins B. W. (2009). ETOPO1 1 arc-minute global relief model: Procedures, data sources and analysis. NOAA Tech. Memo. NESDIS NGDC-24 19, 1–19. doi: 10.1594/PANGAEA.769615
Aoyama M., Kajino M., Tanaka T. Y., Sekiyama T. T., Tsumune D., Tsubono T., et al. (2016). 134Cs and 137Cs in the north pacific ocean derived from the march 2011 TEPCO fukushima dai-ichi nuclear power plant accident, japan. part two: estimation of 134Cs and 137Cs inventories in the north pacific ocean. J. Oceanogr. 72, 67–76. doi: 10.1007/s10872-015-0332-2
Aoyama M., Tsumune D., Uematsu M., Kondo F., Hamajima Y. (2012). Temporal variation of 134Cs and 137Cs activities in surface water at stations along the coastline near the fukushima dai-ichi nuclear power plant accident site, Japan. Geochem. J. 46, 321–325. doi: 10.2343/geochemj.2.0211
Behrens E., Schwarzkopf F. U., Lübbecke J. F., Böning C. W. (2012). Model simulations on the long-term dispersal of 137Cs released into the pacific ocean off fukushima. Environ. Res. Lett. 7, 1–10. doi: 10.1088/1748-9326/7/3/034004
Buesseler K. O., Jayne S. R., Fisher N. S., Rypina I. I., Baumann H., Baumann Z., et al. (2012). Fukushima-derived radionuclides in the ocean and biota off Japan. Proc. Natl. Acad. Sci. U. S. A. 109, 5984–5988. doi: 10.1073/pnas.1120794109
Carton J. A., Giese B. S. (2008). A reanalysis of ocean climate using simple ocean data assimilation (SODA). Mon. Weather Rev. 136, 2999–3017. doi: 10.1175/2007MWR1978.1
Davis X. J., Rothstein L. M., Dewar W. K., Menemenlis D. (2011). Numerical investigations of seasonal and interannual variability of north pacific subtropical mode water and its implications for pacific climate variability. J. Clim. 24, 2648–2665. doi: 10.1175/2010JCLI3435.1
Di Lorenzo E. (2003). Seasonal dynamics of the surface circulation in the southern California current system. Deep. Res. Part II Top. Stud. Oceanogr. 50, 2371–2388. doi: 10.1016/S0967-0645(03)00125-5
Donlon C. J., Martin M., Stark J., Roberts-Jones J., Fiedler E., Wimmer W. (2012). The operational Sea surface temperature and Sea ice analysis (OSTIA) system. Remote Sens. Environ. 116, 140–158. doi: 10.1016/j.rse.2010.10.017
Fox-Rabinovitz M. S. (1991). Computational dispersion properties of horizontal staggered grids for atmospheric and ocean models. Mon. Weather Rev. 119, 1624–1639. doi: 10.1175/1520-0493(1991)119<1624:CDPOHS>2.0.CO;2
Fujioka K., Fukuda H., Tei Y., Okamoto S., Kiyofuji H., Furukawa S., et al. (2018). Spatial and temporal variability in the trans-pacific migration of pacific bluefin tuna (Thunnus orientalis) revealed by archival tags. Prog. Oceanogr. 162, 52–65. doi: 10.1016/j.pocean.2018.02.010
Garraffo Z. D., Kim H. C., Mehra A., Spindler T., Rivin I., Tolman H. L. (2016). Modeling of 137Cs as a tracer in a regional model for the western Pacific, after the Fukushima–Daiichi Nuclear Power Plant accident of March 2011. Weather and Forecasting 31(2), 553–79.
González-Haro C., Isern-Fontanet J., Tandeo P., Garello R. (2020). Ocean surface currents reconstruction: Spectral characterization of the transfer function between SST and SSH. J. Geophys. Res. Ocean. 125, e2019JC015958. doi: 10.1029/2019JC015958
Good S. A., Martin M. J., Rayner N. A. (2013). EN4: Quality controlled ocean temperature and salinity profiles and monthly objective analyses with uncertainty estimates. J. Geophys. Res. Ocean. 118, 6704–6716. doi: 10.1002/2013JC009067
Haidvogel D. B., Arango H. G., Hedstrom K., Beckmann A., Malanotte-Rizzoli P., Shchepetkin A. F. (2000). Model evaluation experiments in the north Atlantic basin: Simulations in nonlinear terrain-following coordinates. Dyn. Atmos. Ocean. 32, 239–281. doi: 10.1016/S0377-0265(00)00049-X
Hersbach H., Bell B., Berrisford P., Hirahara S., Horányi A., Muñoz-Sabater J., et al. (2020). The ERA5 global reanalysis. Q. J. R. Meteorol. Soc 146, 1999–2049. doi: 10.1002/qj.3803
Honda M. C., Aono T., Aoyama M., Hamajima Y., Kawakami H., Kitamura M., et al. (2012). Dispersion of artificial caesium-134 and-137 in the western north pacific one month after the fukushima accident. Geochem. J. 46, 1–9. doi: 10.2343/geochemj.1.0152
Kaeriyama H., Ambe D., Shimizu Y., Fujimoto K., Ono T., Yonezaki S., et al. (2013). Direct observation of 134Cs and 137Cs in surface seawater in the western and central north pacific after the fukushima dai-ichi nuclear power plant accident. Biogeosciences 10, 4287–4295. doi: 10.5194/bg-10-4287-2013
Kaeriyama H., Shimizu Y., Ambe D., Masujima M., Shigenobu Y., Fujimoto K., et al. (2014). Southwest intrusion of 134Cs and 137Cs derived from the fukushima dai-ichi nuclear power plant accident in the western north pacific. Environ. Sci. Technol. 48, 3120–3127. doi: 10.1021/es403686v
Kaeriyama H., Shimizu Y., Setou T., Kumamoto Y., Okazaki M., Ambe D., et al. (2016). Intrusion of fukushima-derived radiocaesium into subsurface water due to formation of mode waters in the north pacific. Sci. Rep. 6, 1–10. doi: 10.1038/srep22010
Kaeriyama K. (2017). Oceanic dispersion of fukushima-derived radioactive cesium a review. Fish. Oceanogr. 26, 99–113. doi: 10.1111/fog.12177
Kim S., Pak G., Lee H. J., Kwon Y., Kim Y. H. (2020). Late-1980s regime shift in the formation of the north pacific subtropical mode water. J. Geophys. Res. Ocean. 125, e2019JC015700. doi: 10.1029/2019JC015700
Kiyofuji H., Aoki Y., Kinoshita J., Okamoto S., Masujima M., Matsumoto T., et al. (2019). Northward migration dynamics of skipjack tuna (Katsuwonus pelamis) associated with the lower thermal limit in the western pacific ocean. Prog. Oceanogr. 175, 55–67. doi: 10.1016/j.pocean.2019.03.006
Kumamoto Y., Aoyama M., Hamajima Y., Aono T., Kouketsu S., Murata A., et al. (2014). Southward spreading of the fukushima-derived radiocesium across the kuroshio extension in the north pacific. Sci. Rep. 4, 1–9. doi: 10.1038/srep04276
Kumamoto Y., Aoyama M., Hamajima Y., Nagai H., Yamagata T., Murata A. (2022). Zonal and vertical transports of fukushima-derived radiocesium in the subarctic gyre of the north pacific until 2014. J. Environ. Radioact. 247, 106864. doi: 10.1016/j.jenvrad.2022.106864
Kumamoto Y., Aoyama M., Hamajima Y., Nishino S., Murata A., Kikuchi T. (2017). Radiocesium in the western subarctic area of the north pacific ocean, Bering Sea, and Arctic ocean in 2013 and 2014. Appl. Radiat. Isot. 126, 88–92. doi: 10.1016/j.apradiso.2017.02.036
Ladd C., Thompson L. A. (2002). Decadal variability of north pacific central mode water. J. Phys. Oceanogr. 32, 2870–2881. doi: 10.1175/1520-0485(2002)032<2870:DVONPC>2.0.CO;2
Large W. G., McWilliams J. C., Doney S. C. (1994). Oceanic vertical mixing: A review and a model with a nonlocal boundary layer parameterization. Rev. Geophys. 32, 363–403. doi: 10.1029/94RG01872
Macdonald A. M., Yoshida S., Pike S. M., Buesseler K. O., Rypina I. I., Jayne S. R., et al. (2020). A fukushima tracer perspective on four years of north pacific mode water evolution. Deep. Res. Part I Oceanogr. Res. Pap. 166, 103379. doi: 10.1016/j.dsr.2020.103379
Marchesiello P., McWilliams J. C., Shchepetkin A. (2003). Equilibrium structure and dynamics of the California current system. J. Phys. Oceanogr. 33, 753–783. doi: 10.1175/1520-0485(2003)33<753:ESADOT>2.0.CO;2
Men W., He J., Wang F., Wen Y., Li Y., Huang J., et al. (2015). Radioactive status of seawater in the northwest pacific more than one year after the fukushima nuclear accident. Sci. Rep. 5, 1–9. doi: 10.1038/srep07757
Nakano M., Povinec P. P. (2012). Long-term simulations of the 137Cs dispersion from the fukushima accident in the world ocean. J. Environ. Radioact. 111, 109–115. doi: 10.1016/j.jenvrad.2011.12.001
Nakata K., Sugisaki H. (2015). Impacts of the fukushima nuclear accident on fish and fishing grounds. doi: 10.1007/978-4-431-55537-7
Oka E. (2009). Seasonal and interannual variation of north pacific subtropical mode water in 2003-2006. J. Oceanogr. 65, 151–164. doi: 10.1007/s10872-009-0015-y
Oka E., Kouketsu S., Toyama K., Uehara K., Kobayashi T., Hosoda S., et al. (2011). Formation and subduction of central mode water based on profiling float data. J. Phys. Oceanogr. 41, 113–129. doi: 10.1175/2010JPO4419.1
Oka E., Suga T. (2005). Differential formation and circulation of north pacific central mode water. J. Phys. Oceanogr. 35, 1997–2011. doi: 10.1175/JPO2811.1
Peliz Á., Dubert J., Haidvogel D. B. (2003). Subinertial response of a density-driven eastern boundary poleward current to wind forcing. J. Phys. Oceanogr. 33, 1633–1650. doi: 10.1175/2415.1
Periáñez R., Bezhenar R., Brovchenko I., Jung K. T., Kamidara Y., Kim K. O., et al. (2019). Fukushima 137Cs releases dispersion modelling over the pacific ocean. comparisons of models with water, sediment and biota data. J. Environ. Radioact. 198, 50–63. doi: 10.1016/j.jenvrad.2018.12.014
Santoki M., George S., Sharma R., Joshipura K. N., Basu S. (2013). Assimilation of satellite-derived ocean surface current in an Indian ocean circulation model. Remote Sens. Lett. 4, 475–484. doi: 10.1080/2150704X.2012.750036
Song Y., Haidvogel D. (1994). A semi-implicit ocean circulation model using a generalized topography-following coordinate system. J. Comput. Phys. 115, 228–244. doi: 10.1006/jcph.1994.1189
Suga T., Takei Y., Hanawa K. (1997). Thermostad distribution in the north pacific subtropical gyre: The central mode water and the subtropical mode water. J. Phys. Oceanogr. 27, 140–152. doi: 10.1175/1520-0485(1997)027<0140:TDITNP>2.0.CO;2
Tak Y. J., Song H., Cho Y. K. (2021). Impact of the reemergence of north pacific subtropical mode water on the multi-year modulation of marine heatwaves in the north pacific ocean during winter and early spring. Environ. Res. Lett. 16, 1–9. doi: 10.1088/1748-9326/ac0cad
Wada T., Nemoto Y., Shimamura S., Fujita T., Mizuno T., Sohtome T., et al. (2013). Effects of the nuclear disaster on marine products in fukushima. J. Environ. Radioact. 124, 246–254. doi: 10.1016/j.jenvrad.2013.05.008
Wu J., Dai M., Xu Y., Zheng J. (2019). Plutonium in the western north pacific: Transport along the kuroshio and implication for the impact of fukushima daiichi nuclear power plant accident. Chem. Geol. 511, 256–264. doi: 10.1016/j.chemgeo.2018.12.006
Wu B., Lin X., Yu L. (2020). North pacific subtropical mode water is controlled by the Atlantic multidecadal variability. Nat. Clim. Change 10, 238–243. doi: 10.1038/s41558-020-0692-5
Yoshida N., Kanda J. (2012). Tracking the fukushima radionuclides. Science 336, 1115–1116. doi: 10.1126/science.1219493
Yoshida S., Macdonald A. M., Jayne S. R., Rypina I. I., Buesseler K. O. (2015). Observed eastward progression of the fukushima 134Cs signal across the north pacific. Geophys. Res. Lett. 42, 7139–7147. doi: 10.1002/2015GL065259
Zhao C., Wang G., Zhang M., Wang G., de With G., Bezhenar R., et al. (2021). Transport and dispersion of tritium from the radioactive water of the fukushima daiichi nuclear plant. Mar. pollut. Bull. 169, 1–13. doi: 10.1016/j.marpolbul.2021.112515
Keywords: Fukushima nuclear power plant, radioactive material, subtropical mode water, central mode water, North Pacific
Citation: Lee S-T, Jung J, Kim G, Tak Y-J and Cho Y-K (2023) Subsurface dispersion path and travel time of radiocesium from Fukushima by Mode Water. Front. Mar. Sci. 10:1104786. doi: 10.3389/fmars.2023.1104786
Received: 22 November 2022; Accepted: 27 January 2023;
Published: 09 February 2023.
Edited by:
Xiaohui Xie, Ministry of Natural Resources, ChinaReviewed by:
Vladimir Maderich, National Academy of Sciences of Ukraine, UkraineYuichiro Kumamoto, Japan Agency for Marine-Earth Science and Technology (JAMSTEC), Japan
Copyright © 2023 Lee, Jung, Kim, Tak and Cho. This is an open-access article distributed under the terms of the Creative Commons Attribution License (CC BY). The use, distribution or reproduction in other forums is permitted, provided the original author(s) and the copyright owner(s) are credited and that the original publication in this journal is cited, in accordance with accepted academic practice. No use, distribution or reproduction is permitted which does not comply with these terms.
*Correspondence: Yang-Ki Cho, Y2hveWtAc251LmFjLmty