 Simin Hu
 Chen Zhang1,4
 Hui Huang
95% of researchers rate our articles as excellent or good
Learn more about the work of our research integrity team to safeguard the quality of each article we publish.
Find out more
ORIGINAL RESEARCH article
Front. Mar. Sci. , 26 January 2023
Sec. Marine Pollution
Volume 10 - 2023 | https://doi.org/10.3389/fmars.2023.1102686
This article is part of the Research Topic Nuclear Power Cooling-Water System Disaster-Causing Organisms: Outbreak and Aggregation Mechanisms, Early-warning Monitoring, Prevention and Control View all 15 articles
Elevated water temperature caused by the thermal discharge from power plants can exert multiple ecological impacts on the phytoplankton community in coastal ecosystems. Most recent studies have focused on the reshaping effects on the community structure; however, the short-term response of phytoplankton physiology to thermal discharge remains unclear. This study conducted research on the scope of thermal discharge from the nuclear power plant and the size-fractionated phytoplankton structure combined with photosynthetic physiology in Daya Bay, China. The thermal discharge significantly affected the surface temperature in the outlet regions, and the thermal plume mainly diffused along the northeast coast of the outfall site, resulting in a significant difference in the surface temperature between the inlet and outlet transects (p<0.05). Elevated surface temperatures decreased the total chlorophyll a concentrations by 33.19% at the outlet regions, with pico-phytoplankton decreasing the most. Chlorophyll a concentrations were higher at sites further away from the outlets, indicating that elevated water temperature might stimulate the rapid growth of phytoplankton, especially nano-phytoplankton which replaced pico-phytoplankton as the dominant group at stations away from the outlets. Significant negative correlations were observed between the photochemical quantum yield (Fv/Fm) and temperature (p<0.05), and the relative electron transport rate (rETR) and temperature (p<0.05). Phytoplankton showed a normal photosynthetic physiological state at most sites with a surface temperature<33°C but was severely affected at the outlet site with a 5°C rise, decreasing from ~0.5 on the inlet transect to 0.07. During the diurnal survey, the high temperatures near the outlet at midday had a compensatory effect on phytoplankton’s light suppression. The results indicated that the physiological state of phytoplankton was clearly influenced by the thermal discharge with diurnal variation, and different size-fractionated phytoplankton groups exhibited heterogeneous responses. The findings may provide further insights into the ecological impacts of thermal discharges as well as global warming in subtropical regions.
In recent years, with the growth of the nuclear power industry in coastal areas, the thermal effects of circulating cooling water from nuclear power plants have become a major source of heat pollution worldwide (Poornima et al., 2006; Li et al., 2011; Jiang et al., 2019; Xu et al., 2021). According to the World Energy Outlook (2017) (WEO, 2017), it is estimated that between 2016 and 2040 more than 90% of new nuclear power resources will come from China and India. Currently, there are 44 sets of nuclear power plant units in operation in China, accounting for 9.73% of the world’s total, and 13 sets are under construction, accounting for 23.21% of the world’s total (Khttab, 2021). Most of these nuclear power plants are distributed in the coastal areas of China, and elevated seawater temperatures resulting from their circulating cooling water is expected to directly or indirectly affect the physiology of all organisms, the interactions between them, and the dynamic processes and biogeochemical cycle of the ecosystem (Shiah et al., 2006; Lewandowska et al., 2014). In summer, the surface water temperature near the outfall from nuclear power plants could increase by an average of 9.5–10°C compared with that of the inlet area, and the temperature in the receiving waters will rise significantly and mainly concentrate on the surface layer (Madden et al., 2013), Therefore, the warming effect of thermal drainage is considered one of the main threats to aquatic ecosystems, especially for the plankton community (Lin et al., 2018).
Phytoplankton is the most important primary producer in the marine food web and contributes nearly half of the global total primary production even though their photosynthetic biomass is less than 1% of terrestrial plants, playing a crucial role in the global biogeochemical cycle of carbon (Falkowski, 2012). Their small size, short reproductive cycles, and weak motility make them sensitive to environmental changes, therefore, their community dynamics can be used as indicators for predicting the ecological effects of elevated seawater temperatures from power plants (Hays et al., 2005). According to previous studies, the species composition of phytoplankton was affected by elevated temperatures near a nuclear power plant, and this effect has a seasonal difference (Li et al., 2013; Lin et al., 2018). The phytoplankton community showed a shift from diatom dominance to dinoflagellate dominance in the outlet regions in summer (Li et al., 2011). Increased temperatures in the cold season accelerated the cell division rate of phytoplankton, increasing its abundance, while in the warm season it was the opposite (Xu et al., 2021). Furthermore, increased temperatures stimulated faster growth of harmful algae species, and accelerated algal blooms near the nuclear power station (Tian et al., 2021). In natural conditions, higher temperatures and enhanced stratification led to the reduction of nutrient concentration and increased the sedimentation rate of medium-sized phytoplankton, leading to an increased biomass of smaller-sized phytoplankton. This was confirmed by long-term observations, which found that the total abundance of phytoplankton decreased with temperature increased, while the abundance of pico-phytoplankton increased (Morán et al., 2010). These changes in the size composition of phytoplankton will influence the bottom-up transmission of the food chain in the marine ecosystem (Lewandowska et al., 2014; Xu et al., 2020), therefore it is necessary to evaluate the thermal response of different size-fractionated phytoplankton.
Temperature can also influence phytoplankton’s physiological characteristics such as their photosynthetic ability, which differs between phytoplankton sizes. Significantly positive relationships were found between the photosynthetic rates of<2 μm-sized phytoplankton and temperatures, indicating that smaller phytoplankton was more capable of acclimating to rapid fluctuations in higher temperatures (Kaiblinger et al., 2007; Shiomoto, 2009). The absorbed light energy of the phytoplankton chlorophyll molecule is transferred to the reaction center in Photosystem I (PS I) and Photosystem II (PS II) for photosynthesis, and during this transmission process heat can be released or fluorescence emitted. Previous studies have shown that when phytoplankton was in a normal environment, most of the energy was transferred smoothly to the photosynthesis reaction center, but heat dissipation and fluorescence production increased when phytoplankton was in an unfavorable environment, such as under high-temperature stress (Kaiblinger et al., 2007) or nutrient limitation (Xie et al., 2015). Therefore, the evaluation of phytoplankton chlorophyll fluorescence can reflect the efficiency of photochemical energy conversion in PS II. The pulse-amplitude-modulation (PAM) technique has been widely used in plant physiological ecology research because of its convenience, rapidity, and absence of damage to samples (Schreiber, 2004). The maximum photochemical quantum yield (Fv/Fm) of PS II measured by PAM is often used as an indicator of environmental stress on plants (Schlensog and Schroeter, 2001). The Fv/Fm value under normal conditions for algae is generally between 0.6–0.7 (Franklin et al, 2006). While under thermal stress, the Fv/Fm value was found to decrease accordingly, but recovered when algae were returned to a normal temperature environment, although the recovery capacity differed among species (Wen et al., 2005). Evaluation of photosynthetic activities of the phytoplankton community has been used to reflect the characteristics of different phases of algal blooms (Shen et al., 2019), while the response of phytoplankton photosynthetic activities to thermal stress near a nuclear power plant remains unclear.
Daya Bay (DYB) is located in the north of the South China Sea and is a typical subtropical bay. In the past 20 years, the ecological environment of Daya Bay has undergone significant changes under the influence of human activities, including shifts in nutrients and plankton communities (Wang et al., 2004; Yu et al., 2007). One of the most influential human activities in Daya Bay is the thermal discharge from nuclear power plants, which can cause a significant increase in the temperature of the receiving waters. There were two nuclear power stations (Daya Bay and Lingao Nuclear Power Station) located on the northwest coast, discharging hot wastewater at a rate of 315 m3 s-1 when the stations were in operation (Li et al., 2011). The temperature of discharged water can be 8-10℃ higher than the background temperature (Zhang and Zhou, 2004). The semi-closed characteristics of the bay, owing to the mountain ranges on three sides, result in a relatively long average residence time of surface seawater and a relatively stable temperature gradient caused by the regular thermal drainage from the nuclear power plants. Therefore, Daya Bay is considered to be under short-term temperature rise stress (Zhang and Zhou, 2004). In the drainage area of the nuclear power plants, the analysis of continuous observation data for nearly 20 years showed that the average temperature of the surface layer in summer rose from 27.8°C in 1982 to 34.8°C in 2005, and the phytoplankton community structure showed a trend of transformation from diatom dominance to dinoflagellate dominance (Li et al., 2011), resulting in a trend of miniaturization (Hao and Tang, 2010). Furthermore, the frequency of harmful algal blooms is significantly positively correlated with the rise in water temperature (Yu et al., 2007; Tian et al., 2021), and the outbreaks of other organisms that could influence the nuclear power plant operation also increased (Liu et al., 2022). Most of the recent studies on the effect of thermal discharge on phytoplankton have focused on the changes in community structure; however, the physiological response of phytoplankton under thermal stress in the outlet regions is rarely reported. Moreover, Daya Bay is located in the subtropical zone, and the temperature in summer might be near the upper tolerance limit of some plankton species, thus any further increase in the ambient water temperature due to the discharge of heated effluents may seriously affect the physiology of phytoplankton. The objectives of this study were to 1) evaluate the effects of thermal discharge on the size-fractionated structure and photosynthetic physiology of phytoplankton communities, 2) investigate the relationship between the increased temperature ranges and the physiological response of phytoplankton in a subtropical region. The results of our study will help to further understand the potential influence of short-term thermal stress caused by the nuclear power plant on the phytoplankton communities and the possible response of phytoplankton to ocean warming.
This study was carried out in the northwest coastal waters near DYB nuclear power station (DNPS) and Ling-ao nuclear power station (LNPS) on July 30, 2012 (Figure 1). Five transects (A, C, E, G, and I) with a total of 38 sampling stations were set along the temperature gradient from the thermal pollution originating from the nuclear power stations. Five skiffs were used for sampling of these five transects simultaneously. Transect A (7 stations) began at the inlet station near Dapeng’ao, which was a cove located in the southwest of Daya Bay, and was the control zone, while stations along transect I (8 stations) began at the outlet region and represent the impacted zone. The stations’ depths ranged from 2.8 m to 18.7 m. The farthest stations of all transects were approximately 6.5 km to 26.7 km from the nuclear power stations, making it possible to cover all the regions potentially affected by the thermal discharge.
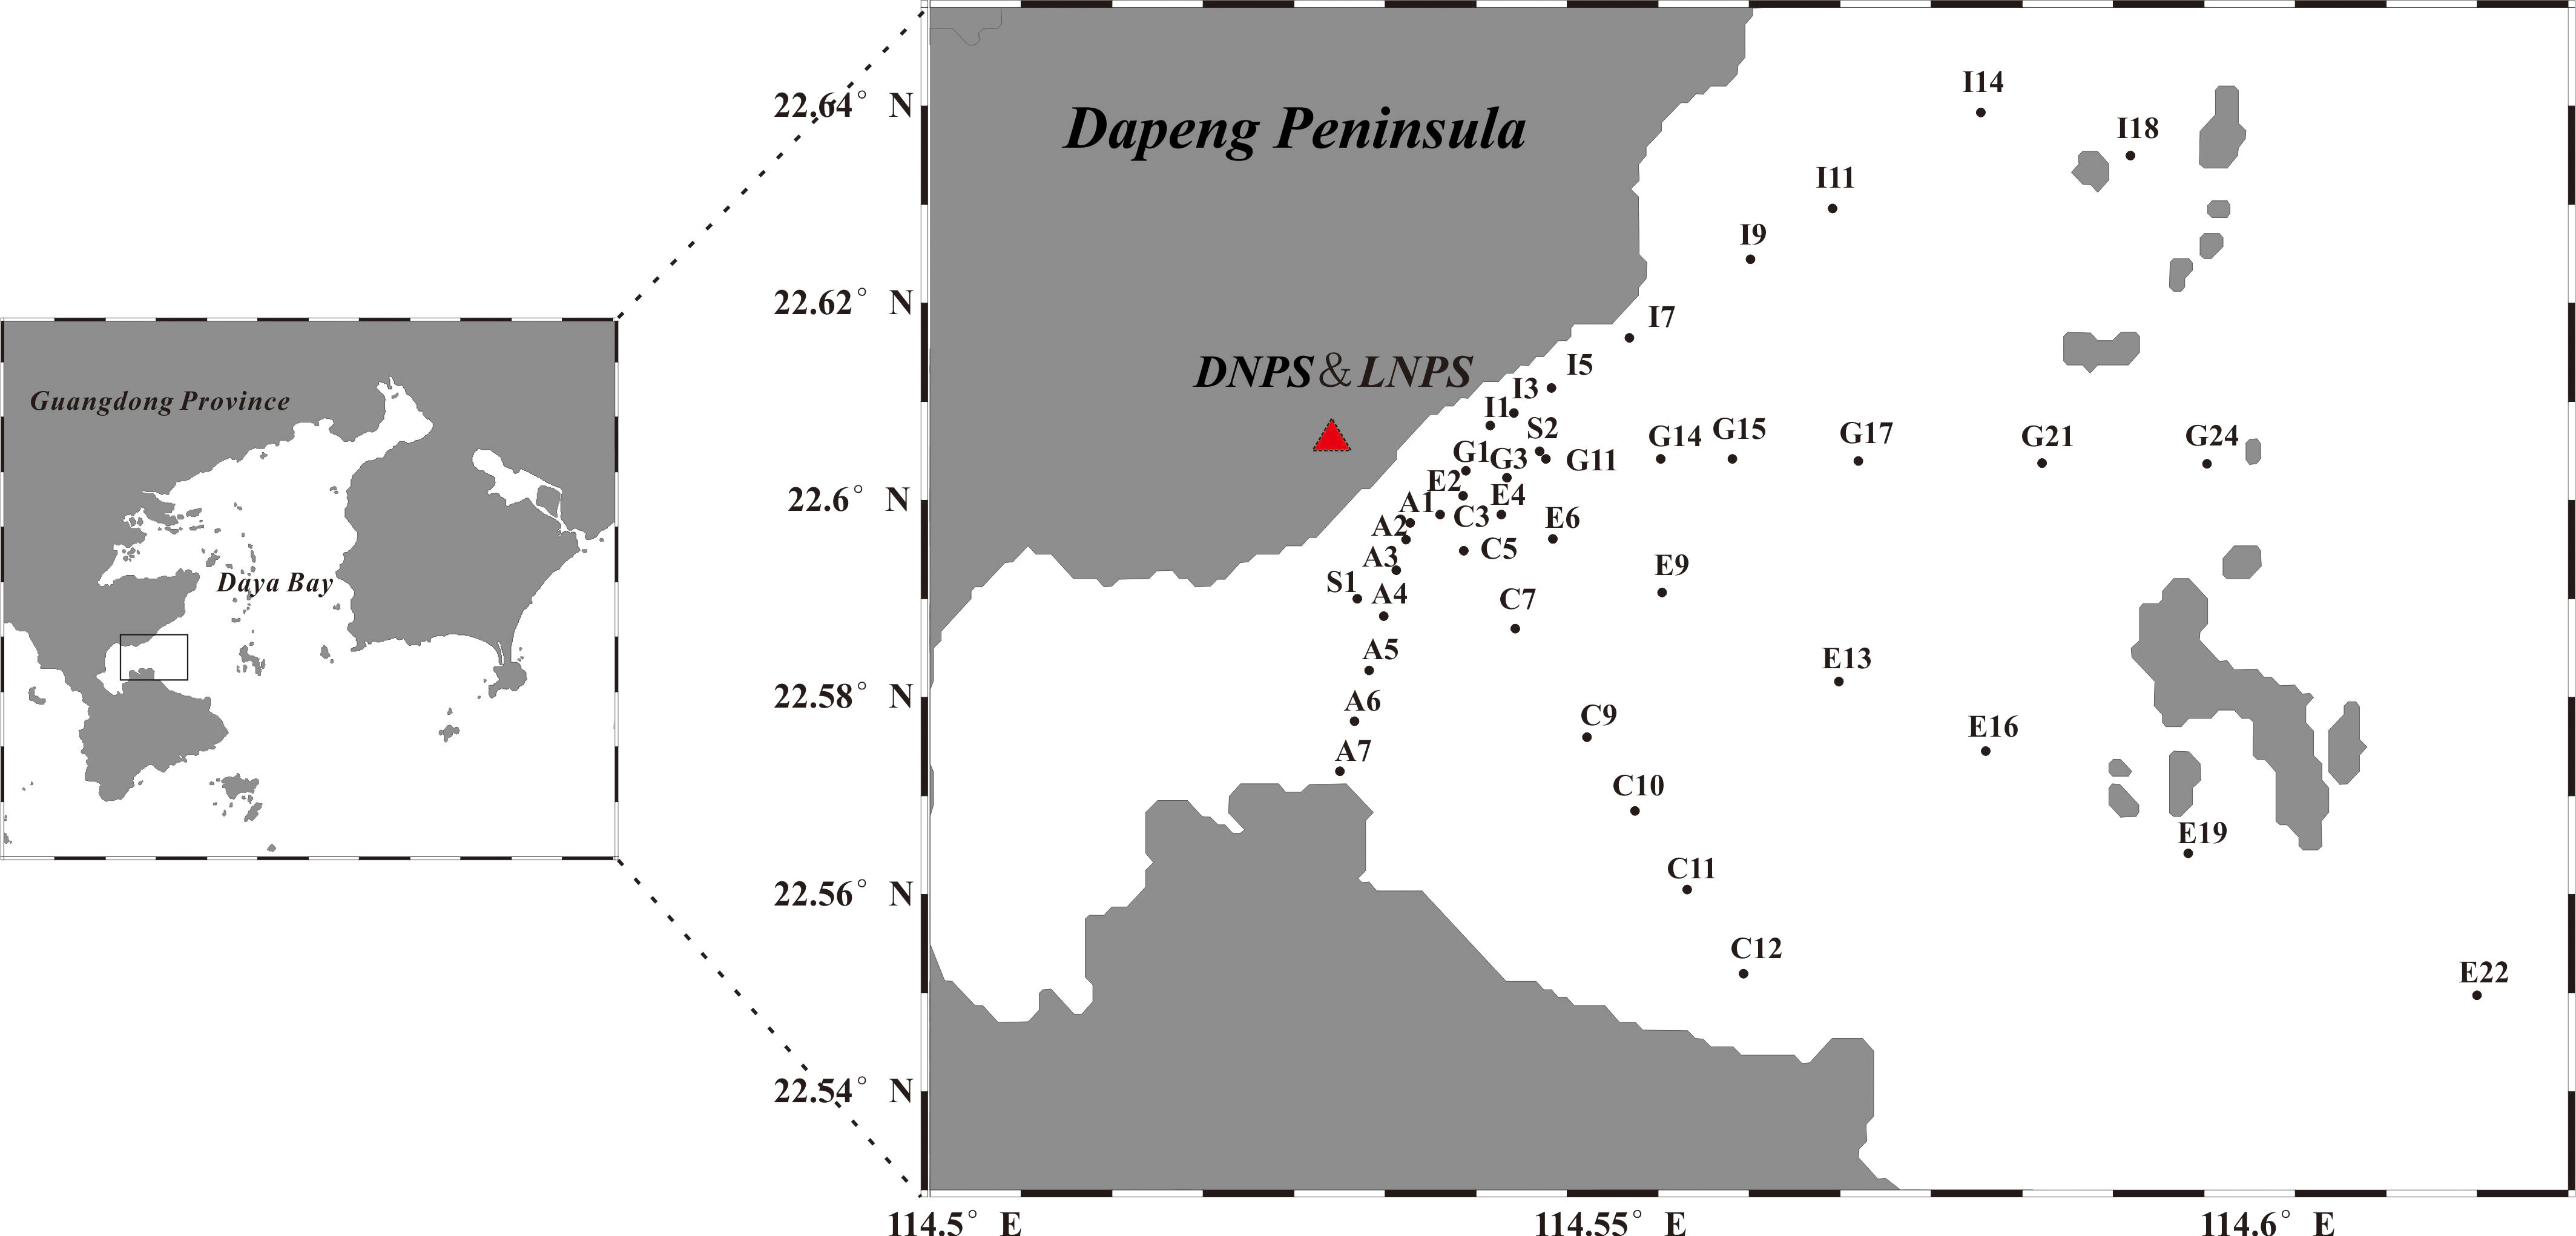
Figure 1 Sampling stations near the nuclear power plant area. The red triangles indicate the location of the Daya Bay nuclear power station (DNPS) and Ling-ao nuclear power station (LNPS). Transects A-I were only surveyed in the morning, while S1 and S2 were sites for diurnal investigation at control and outlet sites.
To evaluate the effects of fluctuating surface temperatures on the phytoplankton community and their photosynthetic physiology, a diurnal investigation was also conducted at stations near the inlet (S1 N22°35.374’, E114°32.816’) and outlet (S2 N22°36.274’, E114°34.0’) on July 31, 2012, at three sampling times, morning (6:00), midday (12:00), and night (18:00).
Temperature (Temp) and salinity (S) were measured using a YSI-6600 probe (YSI Incorporated, Ohio, USA) at each sampling site in situ. Surface seawater samples were collected using a water sampler (5 L, Watertools, China), preserved in 5 L buckets covered with black bags, and immediately taken to the laboratory. A subsample of 100 mL water was filtered through a 0.45 μm cellulose acetate filter and analyzed with a nutrient flow analyzer (SKALAR San, Netherlands) for determining the concentrations of nitrate (NO3-N), nitrite (NO2-N), ammonium salt (NH4-N), phosphate (PO4-P), and silicate (SiO4-Si).
The field seawater was taken to the laboratory immediately after sampling. Then the water-PAM (Walz, Germany) was used to determine the fluorescence parameters as follows: the water sample was kept in dark for a 10 min adaptation, then transferred to a measuring cup under the measuring light (< 1 µmol m-2 s-1) to obtain F0, and then exposed to the saturated pulse light (4000 µmol m-2 s-1) for 0.8 s to obtain Fm. The maximum quantum yield of PS II (Fv/Fm) was determined using the following formula (Han et al., 2003): Fv/Fm = (Fm-F0)/Fm, where F0 represents the background fluorescence of phytoplankton and Fm is the maximum fluorescence of the phytoplankton community.
A 500 mL water sample was obtained and fixed immediately with neutral Lugol’s solution (final concentration approximately 2%) to determine the species composition and abundance of phytoplankton at each site. The samples were kept in dark for >24 h settlement. Then, a 1 mL subsample was used for taxonomic determinations and enumeration under a microscope (OLYMPUS CX31, Japan) at 200× or 400× magnification using the Utermöhl settling method.
The size-fractionated chlorophyll a concentration was also measured. A subsample of 1000 mL seawater was filtered successively through 20 µm, 3 µm, and 0.2 µm polycarbonate membranes (Millipore, USA) for the calculation of micro-, nano-, and pico-phytoplankton biomass. Then, the pigment was extracted with 90% acetone in a dark environment with a low temperature (4°C), and the concentration was determined using a fluorometer (Turner, USA).
The abundance of each phytoplankton taxa was calculated by conversion of cell numbers per liter (cells L-1). The Shannon-Weaver diversity index (H’) (Shannon, 1948) was used for the calculation of taxonomic diversity:
where s is the number of species; N is the total number of individuals in the same sample; Ni is the number of individuals of species i.
Correlation analysis and principal component analysis (PCA) were performed in SPSS 18.0 software. R studio 4.0.3 was also used to implement graphic visualization and data analysis.
Temperature variations among different regions were observed (Figure 2A). The outlet region (I1-I3) exhibited the highest temperature while there was a relatively low-temperature area near the inlet area (transect A), ranging from 33.72°C to 36.74°C and 29.03°C to 30.1°C, respectively. Although there was no significant difference in temperatures between water inlet transect A and water outlet section I, the temperature at station I1 near the outlet in the morning and afternoon was as high as 36.7°C and 36.8°C, respectively, while the temperature at station A1 near the water inlet in the morning was only 29.0°C, and the temperature difference between the two stations was as high as 7.7°C. The temperatures along transects C, E, and G were basically stable, and the temperature differences at each station were no more than 2.0°C.
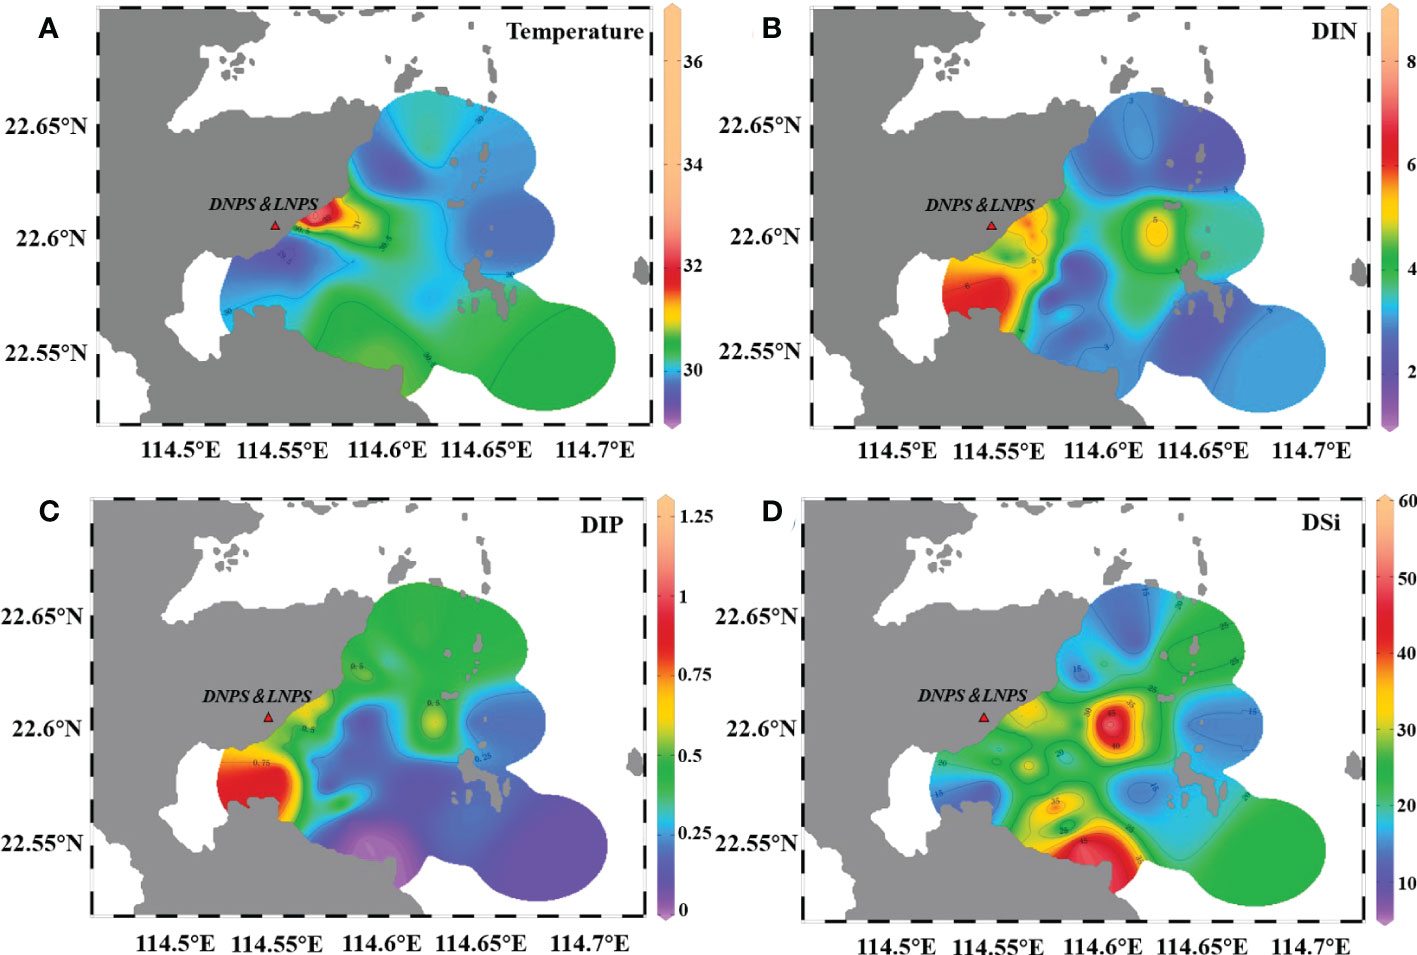
Figure 2 Sea surface temperature (A, °C) and nutrient (μmol L-1) distribution in the survey area. DIN represents the total concentration of NO3- and NO2-. (B) DIP represents the concentration of PO4- (C), and DSi represents the concentration of SiO4- (D).
Dissolved inorganic nitrogen (DIN), dissolved inorganic phosphorus (DIP), and silicate (SiO4-Si) at all stations varied within 1.36–8.48 μmol L-1, 0.03–1.30 μmol L-1, and 6.30–58.00 μmol L-1, respectively. The high-value areas of DIN and DIP were mainly distributed in the aquaculture areas near the nuclear power plants (G15 and G21) (Figures 2B, C). SiO4-Si was evenly distributed in the nearshore areas except for at stations in transect I, and the highest concentration was observed at G15 (Figure 2D). The ratio of N/P varied from 5.08 to 117.75 with an average value of 23.33, which was slightly higher than the Redfield ratio (Redfield ratio 16:1). Generally, the concentration of nutrients decreased from nearshore sites to offshore areas. Significant differences in the concentration of DIP were only detected between transects C and I, and in the concentration of SiO4-Si between transects E and G (Table S2, p<0.05, one-way ANOVA).
Generally, the phytoplankton abundance was evenly distributed along transects A (except A7), C, E, and G, varying from 6.40×10⁴ cells L-1 to 3.32×10⁶ cells L-1 (Figure 3A). Substantial differences were observed in the phytoplankton abundance of transect I and an increasing trend in cell density was observed for sites that were far away from the outlet area. The lowest value was found near the outlet site (I1, I3, and I5) with an average density of 1.32 ± 0.05 ×10⁵ cells L-1, and the abundance of phytoplankton increased to 7.31 ± 0.60×10⁵ cells L-1 at I7 and I9. However, at site I11, the abundance was as high as 106 cells L-1. Total chlorophyll a concentrations varied significantly among the different transects (p<0.05, Table S2). Generally, the chlorophyll a concentrations at sites of transects I and G (7.35 ± 5.54 μg L-1) were higher than those in transects A, C, and E (2.62 ± 1.25 μg L-1) (Figure 3B). However, the lowest chlorophyll a concentration was detected at the outlet site (I1). At sites furthest away from the outlet region (I5 to I18), the chlorophyll a concentration gradually increased to a maximum level.
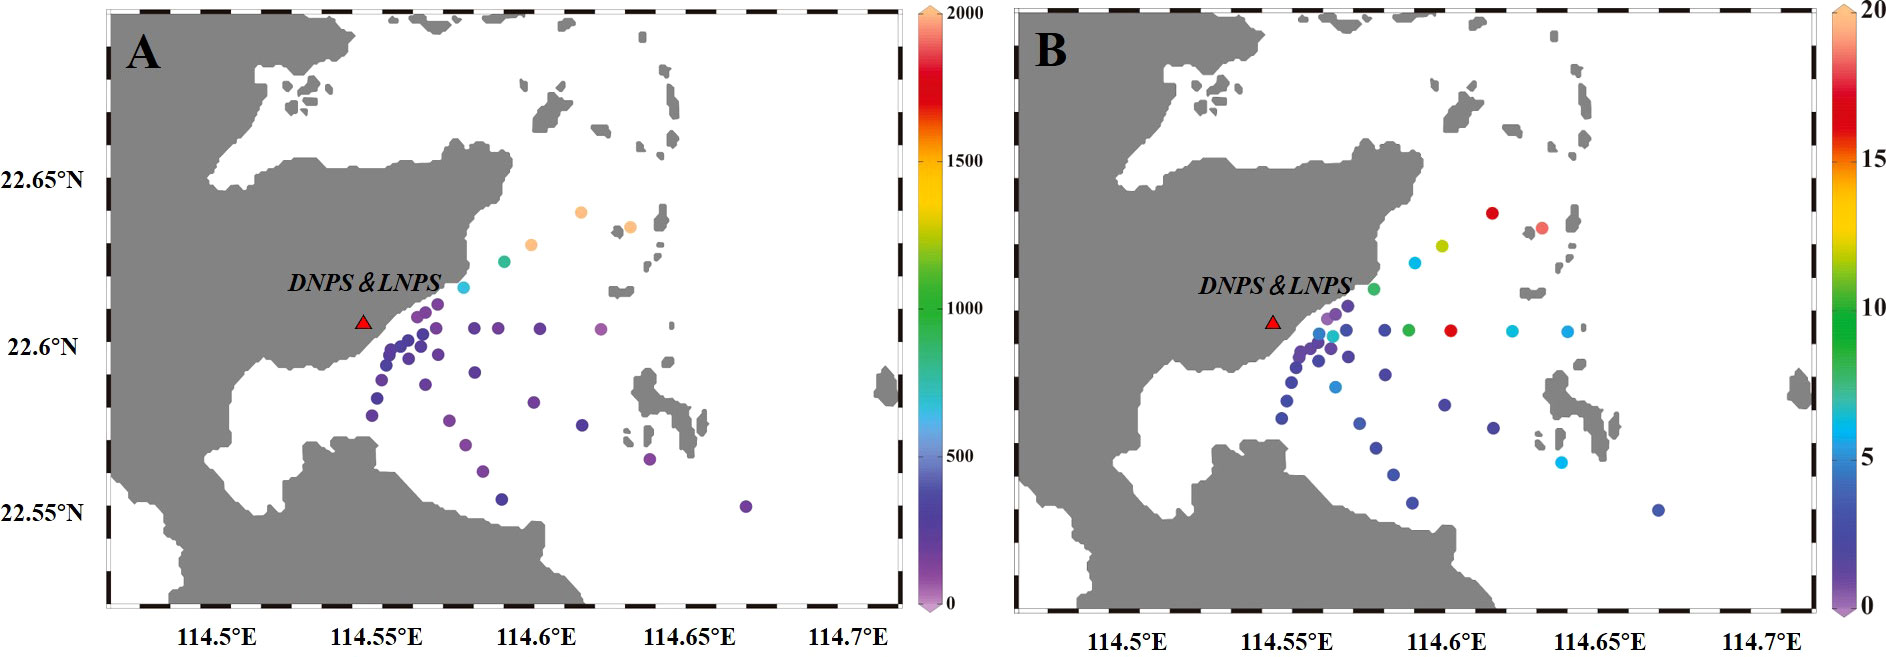
Figure 3 Distribution patterns of phytoplankton abundance [(A), cells L-1] and total chlorophyll a concentration [(B), μg L-1] in the survey area.
A total of 103 phytoplankton species were identified in all the transects, mainly belonging to diatom and dinoflagellate. There were also a few species from Cyanobacteria and others (e.g., Chrysophyceae, Raphidophyceae). The number of dinoflagellate species was higher than that of diatom in transects A, C, and E, while in the transects near the outlet regions (G and I), the number of diatom species was higher than that of dinoflagellate (Figure 4A). Regarding abundance, diatom species were more abundant than dinoflagellates at all stations, ranging from 6.40 ×10⁴ cells L-1 to 4.6 × 10⁶ cells L-1 (Figure 4B). Dinoflagellate species showed a relatively higher abundance (105 cells L-1) at I9 and E16. Thalassionema nitzschiodes was the most abundant species in almost all sites with a fraction more than 50%, followed by Skeletonema spp., Thalassiosira spp., Scrippsiella accuminata, and Chaetoceros spp. Notably, red-tide-forming species such as S. accuminata and Skeletonema costatum accounted for a much larger proportion in transect I than at other stations. The dominant species in transects A and C were diatom Thalassionema, while from transects E to I dinoflagellate species such as Prorocentrum and Scrippsiella occurred and became abundant. The dominant species in transect I shifted from Thalassionema nitzschiodes in I1 (61.39%), I3 (63.80%), and I5 (55.78%) to Chaetoceros curvisetus in I7 (48.36%) and I11 (43.79%), and to Skeletonema costatum in I14 (37.32%) and I18 (22.13%). The diversity index of the phytoplankton communities in transect I was higher than that of transect A, varying from 0.59 to 3.48, with the highest value recorded at station I9 and the lowest value at station A1.
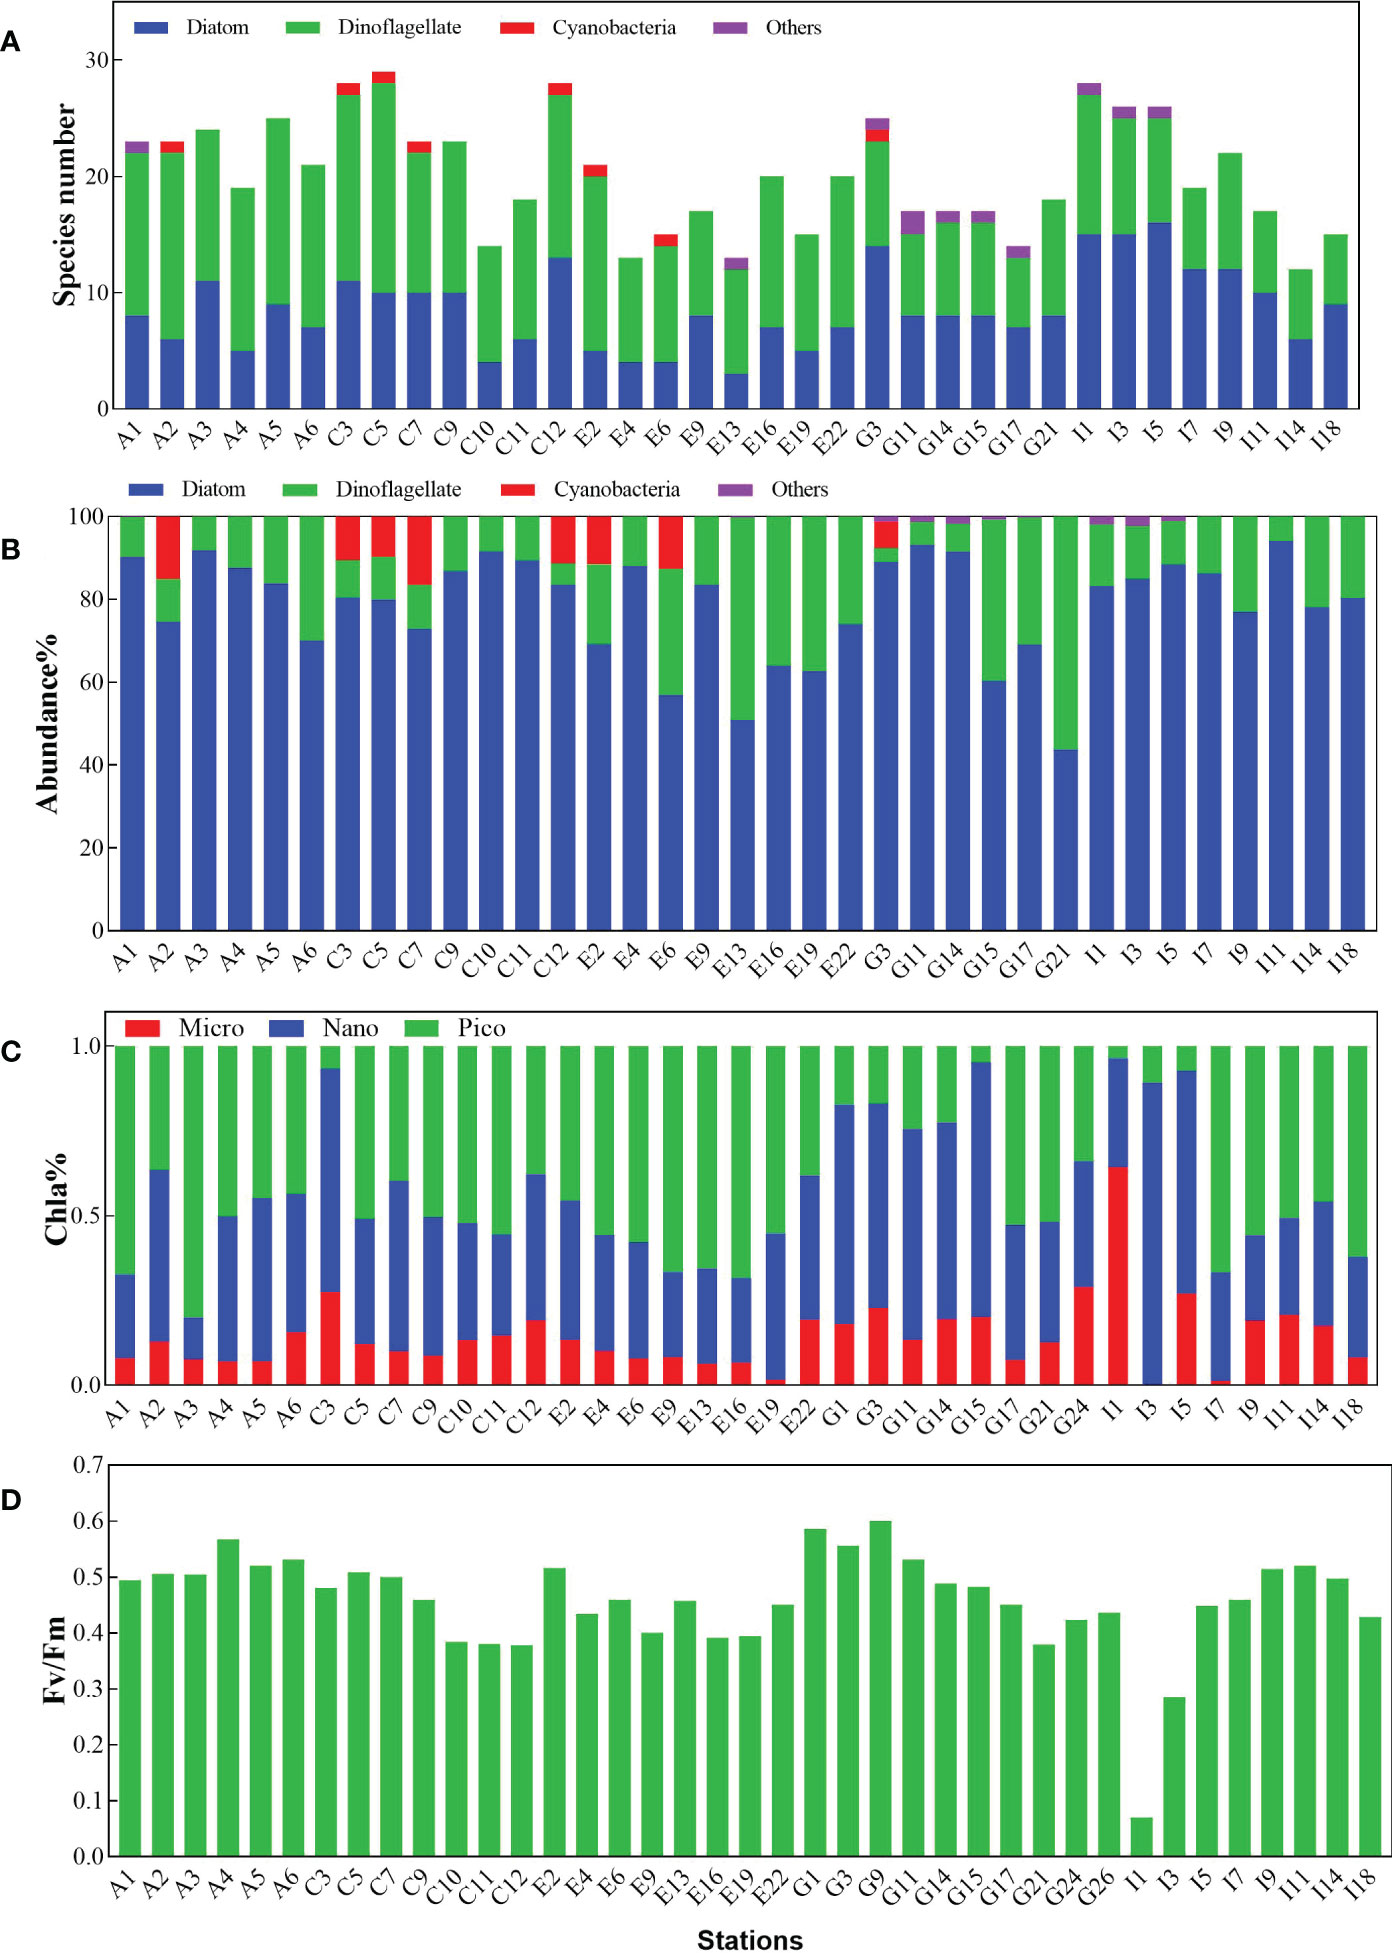
Figure 4 Relative characteristics of phytoplankton community in different sampling sites. (A) species numbers distributed in different phytoplankton groups. (B) the abundance of different phytoplankton groups. (C) size-fractionated chlorophyll a concentration. (D) the maximum quantum yield of PS II (Fv/Fm). Others represent species belonging to Chrysophyceae and Raphidophyceae.
Pico-phytoplankton occupied more than 50% of the total chlorophyll a concentration (average 52.73 ± 3.69%) at most sites in transects A, C, and E, while nano-phytoplankton became the dominant group (average 48.20 ± 5.84%) in transects I and G (Figure 4C). The average proportion of micro-phytoplankton was stable in all the transects, with a percentage of ~14.55% at all stations. Pico-phytoplankton was most affected in the outlet site and was hardly detected, but it did recover from 3–10% (I1, I3, I5) to 66% (I7) at sites further away from the outlet station.
The maximum quantum yield of PS II (Fv/Fm) varied within the range of 0.07–0.6 at the sampling sites, with an average value of 0.46 ± 0.09 (Figure 4D). The average Fv/Fm values of transect A were high (0.53 ± 0.03), followed by transects G (0.49 ± 0.06), C (0.44 ± 0.05), and E (0.44 ± 0.04). The photosynthetic physiological state of phytoplankton was significantly impacted at the outlet site (I1), with the Fv/Fm decreasing dramatically to 0.07. However, they did gradually recover to a normal state at sites further away from the outlet site.
The temperature at the outfall station (S2) was significantly higher than that of the control station (S1) (F=24.37, p<0.05), but both of them showed a rising trend from morning to night (Table S3). An average temperature difference of 5.03 ± 0.29°C was observed between S2 and S1 during the day and the highest difference (5.4°C) occurred at night. The average salinity of station S1 (32.17) was lower than that of S2 (36.57), but the dissolved oxygen (DO) in S1 was higher than that of S2. The total concentration of nitrate at all sampling times in both S1 and S2 showed no significant difference, but the total phosphate concentration in S2 was slightly higher than that in S1, showing a decreasing trend from morning to night. The N:P ratio in S2 was higher than that in S1, reaching as high as 69.6:1 at night.
The species number and abundance of phytoplankton showed no difference between S1 and S2, but the lowest value at both occurred at night (Table S3). The dominant species at S1 and S2 was Bacillariophyta species T. nitzschiodes during the sampling time. The total chlorophyll a concentration exhibited a trend of midday>morning>night at both S1 and S2, and the micro-phytoplankton group showed the same trend at the two sites (Figure 5A). The chlorophyll a concentration of micro-phytoplankton at S2 was substantially lower (decreased about 78%) than that of S1 in the morning and midday but reached a higher value at night. The proportion of nano-phytoplankton at S2 (68.4%) was higher than that of S1 (57.86%) and reached the highest value at midday at both S1 and S2. Meanwhile, the chlorophyll a concentration of pico-phytoplankton decreased significantly at S2 compared with S1, especially at midday and night, accounting for 8.61% and 18.07% that of S1, respectively. The maximum quantum yield of PS II (Fv/Fm) of phytoplankton showed a trend of morning >night>midday at both S1 and S2 (Figure 5B). The Fv/Fm at S2 was lower than that at S1 in the morning and night, but higher than S1 at midday.
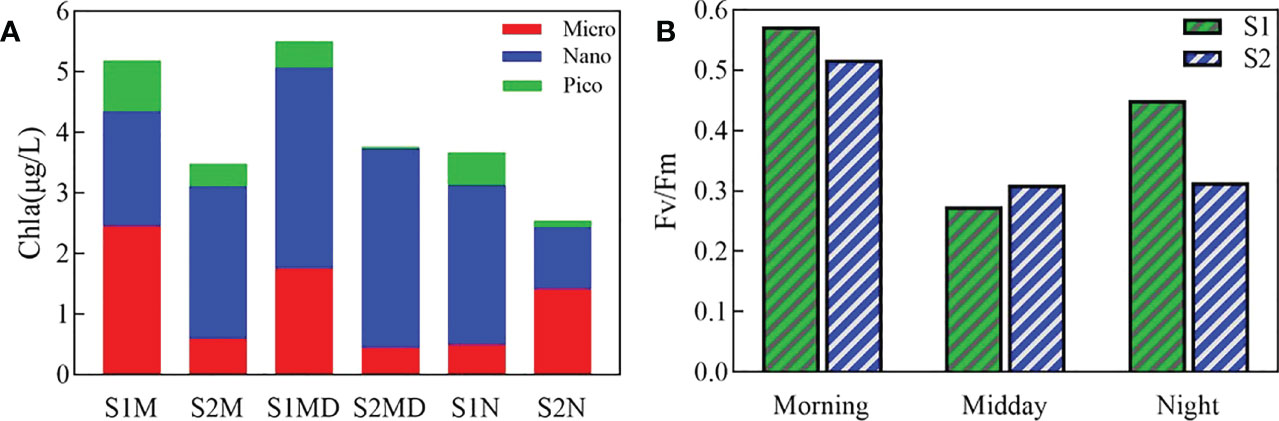
Figure 5 Size-fractionated chlorophyll a composition (A) and the maximum quantum yield (Fv/Fm) (B) at the inlet and outlet stations. S1, the inlet site. S2, the outlet site. M represents morning, MD represents midday, and N represents night.
The PCA biplot was used to analyze the distribution patterns of both the environmental parameters and the phytoplankton community traits (Figure 6A). The results indicated that 43.3% and 28.9% of the environmental and community variation could be explained by axis 1 and 2, respectively. A significant difference was only detected in temperature between transects A and I (p<0.05, Table S2), indicating that temperature acts as the main ecological constraint in the differences between the inlet and outlet sites in the sampling period, especially in I1 and I3. Negative correlations were found between Fv/Fm and temperature, as well as chlorophyll a and temperature, but no significant associations with temperature were found for the other parameters. A significant negative correlation was found through correlation analysis of temperature and Fv/Fm at all stations (n = 52, r = -0.6065, p<0.01). Generally, Fv/Fm showed a decreasing trend with the increase in temperature, and the highest values of Fv/Fm mainly occurred between 29–33°C but decreased rapidly beyond 33°C (Figure 6B). The relative electron transport rate (rETR) also exhibited a negative relationship with the temperature rise (Figure 6C).
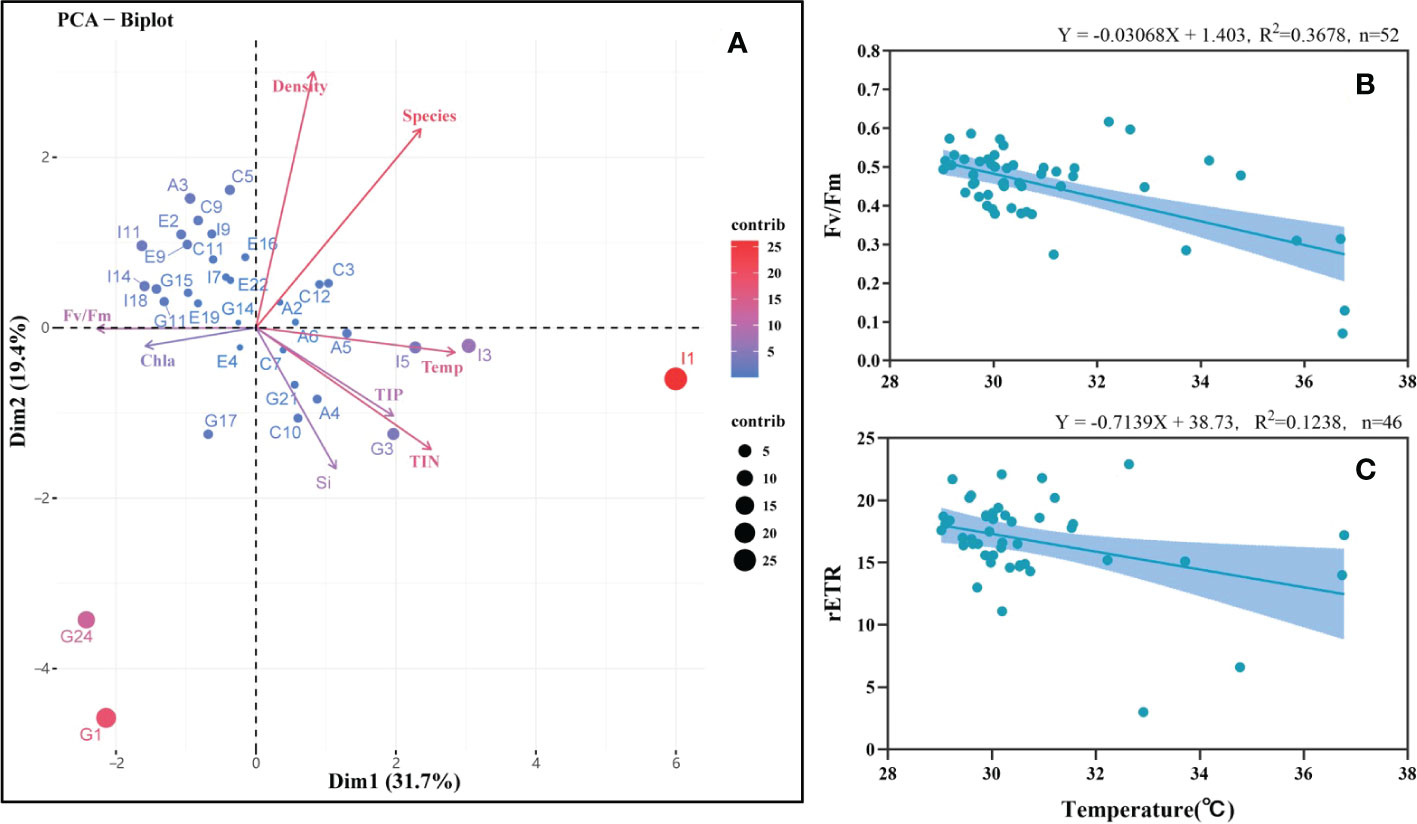
Figure 6 Relationships between the environmental parameters and phytoplankton community. (A) principal component analysis (PCA) biplot shows the variables for both environmental parameters and phytoplankton characteristics in all sampling stations. (B) correlation analysis between the maximal photochemical quantum yield (Fv/Fm) and temperature in the survey area. (C) correlation analysis between the relative electron transport rate (rETR) and temperature in the survey area.
Daya Bay is a semi-closed bay in subtropical regions with an irregular semi-diurnal tide. In summer, the bottom residual current is a low-speed clockwise circulation system, which is conducive to the transportation of rich nutrients by the open sea and rivers to Dapeng’ao and the circulating cooling of the warm drainage from the nuclear power plants. In summer, the surface current is a counterclockwise circulation, which leads to the right deflection of the warm drainage due to the Coriolis force. The warm drainage is mainly injected into Dapeng Bay, which is difficult to diffuse (Xu, 1989; Yang, 2001). This is consistent with the findings of Lin and Zhan (2000), that is, the impact range of the warm drainage of Daya Bay nuclear power plants is mainly in the coastal waters to the east of the plants, and on the opposite bank of the nuclear power plant, the water inlet region and the middle of Dapeng’ao may also be affected (Lin and Zhan, 2000). In this study, the survey data showed that the thermal effect of warm drainage from the nuclear power plant is mainly concentrated near the plant (mainly transect I), which is consistent with previous research.
In summer, the water in Daya Bay is relatively stable and a thermocline often appears, which makes it difficult to mix and exchange water vertically (Xu, 1989). In summer, the upwelling along the east coast of Guangdong often leads to a further decline of the lowest seawater temperatures (Zhang and Zhou, 2004), which is likely to cause stratification of the seawater. The position of thermal drainage from the nuclear power plant further increases the surface water temperature. In this study, the maximum temperature difference between the surface and bottom reaches 10.78°C, and the highest temperature at the surface was recorded near the outlet station, which further expands the temperature difference between the surface and bottom and strengthens the seasonal thermocline. This was not conducive to the vertical convection of the seawater and would intensify the oxygen deficiency and carbon accumulation at the bottom, limiting the biogeochemical cycle of carbon.
The concentrations of the three dissolved inorganic nutrients in this study are consistent with previous studies in Daya Bay (Wang et al., 2011). DIN and DIP were higher near the shore than they were offshore, mainly due to the input of a large number of land-based substances caused by human activities, such as the discharge of aquaculture wastewater (Jiang et al., 2013). The N/P value was greater than 16 in most sites, indicating that the growth limiting factor of phytoplankton in Daya Bay has changed from nitrogen to phosphorus (Wang et al., 2004). Although the nutrient concentration of Daya Bay is lower than that of other bays in China, the total nutrient concentration has developed from an oligotrophic to a mesotrophic level. The water quality in some areas, such as Yaling Bay, Dapeng’ao, and Fanhe port, is poor and shows a trend of eutrophication (Wang et al., 2004). Furthermore, the warm drainage from nuclear power plants promotes the eutrophication process, because increased temperatures accelerate the biogeochemical cycle turnover rate of elements, and the turnover rate of phosphorus is faster than that of nitrogen (Wang et al., 2003). This was confirmed by our study, which found that the DIP concentration at station S1 was significantly higher than that of S2, but there was no significant difference in the DIN concentration.
Principal component analysis found that the dominant factors at different stations were clustered into different categories. Station I1 was in a separate category, and temperature was an influencing factor leading to its separation (Figure 5A). There was a clear temperature gradient with a difference of 3°C from I1 to I5 (~33°C) and the temperature of I1 reached as high as 36.74°C, higher than 35°C. According to long time-series data analysis, 33°C was considered to be the threshold temperature leading to the transformation of phytoplankton community structure from diatom dominance to dinoflagellate dominance, and 35°C was the upper-temperature limit for phytoplankton growth, respectively (Li et al., 2011). Significant differences were found between the temperatures of transect I and the other transects (n=37, F=2.892, p =0.037), indicating that the increased temperature caused by thermal discharge was the most important environmental factor in the outlet regions.
In this study, the phytoplankton abundance of the outlet site (S2) was lower than that of the inlet station (S1), but the corresponding phytoplankton abundance of stations I11, I14, and I18 near the outlet region, but far away from the outlet site, was one order of magnitude higher than that of other stations. Previous surveys found that the amount of phytoplankton passing through the nuclear power plant cooling device was substantially lower in the seasons with high temperatures, but their abundance recovered quickly in the outlet area and the growth rate of phytoplankton affected by warm drainage increased three-fold (Poornima et al., 2006). The phytoplankton density in the outlet regions within a 2°C temperature rise tended to increase because the relatively higher water temperature was conducive to the rapid recovery of phytoplankton (Tang et al., 2013). On the other hand, the rapid temperature rise over a short period of time may stimulate the cell proliferation of red-tide algal species (Huang et al., 2002). In this study, a bloom of S. accuminata occurred in the afternoon at station I3 (cell density > 106 cells L-1; the temperature > 33°C), but in the morning, S. accuminata was not a dominant species at I3. In recent years, S. trochoidea was one of the species forming high-frequency dinoflagellate blooms in Daya Bay, especially in summer (Li et al., 2011; Tian et al., 2021). S. accuminata was found to be more adaptive to high temperatures and still able to grow at >30°C (Xu et al., 2004). Therefore, the frequent occurrence of this kind of harmful algal species in the outlet area is likely due to the rapid growth caused by increased temperatures. In addition, other harmful algae species, such as Chaetoceros curvisetus and Skeletonema costatum, showed relatively higher abundance in transect I, and the stimulation of warm seawaters may exacerbate the blooms of algal species in optimal hydrodynamic conditions (Tian et al., 2021).
Very few studies have investigated the size-fractioned structure of phytoplankton in Daya Bay, especially in the regions affected by thermal discharge. Li et al. (2013) found that nano-phytoplankton contributed the greatest proportion of phytoplankton chlorophyll a concentration in coastal waters along the bay (Li et al., 2013). Previous studies conducted on the phytoplankton community structure found that the concentration of chlorophyll a increased or stabilized, but the corresponding cell number of net phytoplankton (mainly micro-phytoplankton species) decreased, indicating a trend of phytoplankton miniaturization (Liu et al., 2006; Hao and Tang, 2010). This was consistent with our results that pico-phytoplankton was abundant at most of our sites except for the outlet regions. While the dominant group changed to nano-phytoplankton at sites near outlet regions and was also abundant at midday at both inlet and outlet sites with higher temperatures. This could be due to the higher sensitivity and lower recovery capability of the pico-phytoplankton group than the micro- and nano-phytoplankton groups under high-temperature conditions (Xie et al., 2015). The concentrations of total chlorophyll a in I1, I3, and I5 were very low and at site S2 the pico-phytoplankton chlorophyll a could hardly be detected, indicating that high temperatures (>33°C) can exert serious damage to phytoplankton, especially pico-phytoplankton (Li et al., 2011; Tang et al., 2013). The size-fraction structure of phytoplankton changes at the outlet regions due to the discrepant response of different groups, which may affect the trophic transmissions along the food chain.
Phytoplankton abundance and chlorophyll a concentrations can only reflect the current situation of phytoplankton, while Fv/Fm obtained from fluorescence measurements can be used to indicate the primary light energy conversion efficiency of the reaction center of PS II, which can reflect the potential physiological adaptability and predict the trend of community development (Han et al., 2003). Under coercive conditions, Fv/Fm decreases significantly, indicating that the photosynthetic electron transfer of PS II is blocked (Claquin et al., 2008). The Fv/Fm values of the total phytoplankton community in our survey areas were slightly lower than normal values of phytoplankton (0.6–0.7), indicating that the phytoplankton might be stressed by high temperatures and high light intensity in summer. Additionally, the increased temperature in the outlet regions enhanced this effect, with the Fv/Fm at the outlet sites (I1, I3, and I5) being far lower than the normal level. In particular, phytoplankton at station I1 (> 35°C) had basically lost photosynthetic activity (~0.07), but this activity can recover quickly when phytoplankton is far away from the outlet. This was supported by the Fv/Fm value showing an upward trend at the station furthest from the outlet site, which may be caused by the stimulation of phytoplankton by high temperatures (>33°C). During the diurnal investigation of the inlet and outlet sites, the Fv/Fm of S1 was close to 0.6 in the morning and 0.5 in the night but decreased to less than 0.3 at midday, indicating that the high light intensity at noon will affect the photosynthetic activity. The Fv/Fm of S2 was slightly higher than that of S1, indicating that the high temperatures at the outlet site can compensate for the light suppression caused by strong light (Sobrino and Neale, 2007; Halac et al., 2010; Li et al., 2012).
A significant negative relationship was detected between temperature and photosynthetic parameters, and 33 ℃ might be a key temperature level for the change of phytoplankton physiology, which is consistent with a previous research hypothesis on the long-term monitoring data of Daya Bay outlet regions (Li et al., 2011). The effects of temperature on the photosynthetic performance of phytoplankton were influenced by other factors, such as the duration of time and available nutrients. In the laboratory experiment, Fv/Fm of phytoplankton in the first two days was maintained at a normal level but decreased significantly after two days of incubation; adequate nutrients can promote the recovery of phytoplankton at normal temperatures (Xie et al., 2015). Therefore, the short-term stress from thermal discharge will affect the physiological performance of phytoplankton but this damage can be recovered after phytoplankton is carried away from the high-temperature region. Considering the different capabilities of different species or different size groups, the phytoplankton community might change in the long term.
In this study, the influence of the warming environment by thermal discharge on the size-fractioned phytoplankton structure and photosynthetic physiological characteristics were surveyed in the potentially affected waters around the nuclear power plants in Daya Bay. The surface water temperature was significantly elevated in the outlet area of the power plants. Moreover, we detected a fast photosynthetic physiological response of phytoplankton to the elevated temperature and a shift in the size-fractioned structure in the outlet regions. Although the photosynthetic physiology could recover when the phytoplankton was taken away from the outlet site, the high-temperature inhibition might change the physiological features and stimulate the stress response of the phytoplankton, such as the high frequency of harmful algae blooms along the coastal regions near the nuclear power plants. Therefore, on the basis of routine monitoring, it is also necessary to pay more attention to physiological changes in phytoplankton communities, especially in abnormally high temperatures or weather conditions, in order to comprehensively monitor the ecological effects of thermal discharge from the coastal power plants.
The original contributions presented in the study are included in the article/Supplementary Material. Further inquiries can be directed to the corresponding author.
Conceived and designed the experiments: SH, SL. Field survey and sampling: SH, CZ, TL, SL. Analyzed the data: SH, CZ, QL. Contributed reagents/materials/analysis tools: SL, HH. Wrote the paper: SH. All authors contributed to the article and approved the submitted version.
This research was funded by the Natural Science Foundation of China (contract No. 42176118); the Science and Technology Planning Project of Guangdong Province (contract No. 2020B1212060058); the Hainan Provincial Natural Science Foundation of China (contract No. 422QN442); and the Science and Technology Program of Guangzhou, China (contract No. 202201010674); Fund of Guangdong Provincial Key Laboratory of Fishery Ecology and Environment (FEEL-2022-6).
The authors thank the staff of the Guang Dong Daya Bay National Marine Ecosystem Research Station in Shenzhen for their logistical support. We would also like to thank Dr. Yunxu Liu for assistance with the calculation of environmental parameters and Editage (www.editage.cn) for English language editing.
The authors declare that the research was conducted in the absence of any commercial or financial relationships that could be construed as a potential conflict of interest.
All claims expressed in this article are solely those of the authors and do not necessarily represent those of their affiliated organizations, or those of the publisher, the editors and the reviewers. Any product that may be evaluated in this article, or claim that may be made by its manufacturer, is not guaranteed or endorsed by the publisher.
The Supplementary Material for this article can be found online at: https://www.frontiersin.org/articles/10.3389/fmars.2023.1102686/full#supplementary-material
Claquin P., Probert I., Lefebvre S., Veron B. (2008). Effects of temperature on photosynthetic parameters and TEP production in eight species of marine microalgae. Aquat. Microb. Ecol. 51 (1), 1–11. doi: 10.3354/ame01187
Falkowski P. (2012). Ocean science: the power of plankton. Nature 483 (7387), S17–S20. doi: 10.1038/483S17a
Franklin D. J., Cedrés C. M. M., Hoegh-Guldberg O. (2006). Increased mortality and photoinhibition in the symbiotic dinoflagellates of the indo–pacific coral Stylophora pistillata (Esper) after summer bleaching. Mar. Biol. 149 (3), 633–642. doi: 10.1007/s00227-005-0230-z
Halac S. R., Villafañe V. E., Helbling E. W. (2010). Temperature benefits the photosynthetic performance of the diatoms Chaetoceros gracilis and Thalassiosira weissflogii when exposed to UVR. J. Photochem. Photobiol. B.: Biol. 101 (3), 196–205. doi: 10.1016/j.jphotobiol.2010.07.003
Han Z. G., Han B. P., Fu X. (2003). Mechanism and model of algae photosynthesis. Sci. Press. Beijing, 72–73.
Hao Y. J., Tang D. L. (2010). Changes in phytoplankton community structure in response to water temperature increases in daya bay, China. Ecol. Environ. Sci. 19 (8), 1794–1800. doi: 10.3969/j.issn.1674-5906.2010.08.006
Hays G. C., Richardson A. J., Robinson C. (2005). Climate change and marine plankton. Trends Ecol. Evol. 20 (6), 337–344. doi: 10.1016/j.tree.2005.03.004
Huang X., Huang L., Tan Y., Zhu L. (2002). Relationship between red tide and environmental conditions in coastal waters. Mar. Environ. Science/Haiyang. Huanjing. Kexue. 21 (4), 63–69. doi: 10.3969/j.issn.1007-6336.2002.04.015
Jiang L. M., Dong L. F., Yang J. F., Xu Z. H., Sun X. X. (2013). Distribution features of nutrients in daya bay. J. Changzhou. Univ. 25 (2), 12–15. doi: 10.3969/j.issn.2095-0411.2013.02.003
Jiang Z., Du P., Liao Y., Liu Q., Chen Q., Shou L., et al. (2019). Oyster farming control on phytoplankton bloom promoted by thermal discharge from a power plant in a eutrophic, semi-enclosed bay. Water Res. 159, 1–9. doi: 10.1016/j.watres.2019.04.023
Kaiblinger C., Greisberger S., Teubner K., Dokulil M. T. (2007). Photosynthetic efficiency as a function of thermal stratification and phytoplankton size structure in an oligotrophic alpine lake. Hydrobiologia 578 (1), 29–36. doi: 10.1007/s10750-006-0430-7
Khttab K. (2021). Nuclear power reactors in the world. Atom. Dev. 33 (2), 43–55. doi: 10.1016/0140-6701(95)96544-M
Lewandowska A. M., Boyce D. G., Hofmann M., Matthiessen B., Sommer U., Worm B. (2014). Effects of sea surface warming on marine plankton. Ecol. Lett. 17 (5), 614–623. doi: 10.1111/ele.12265
Li Y., Gao K., Villafañe V. E., Helbling E. W. (2012). Ocean acidification mediates photosynthetic response to UV radiation and temperature increase in the diatom Phaeodactylum tricornutum. Biogeosciences 9 (10), 3931–3942. doi: 10.5194/bg-9-3931-2012
Li L., Jiang T., Lv S. H. (2013). Size-fractionated biomass of phytoplankton in the coastal waters of daya bay in summer and autumn. Mar. Environ. Sci. 32 (2), 185–189. doi: CNKI:SUN:HYHJ.0.2013-02-007
Li T., Liu S., Huang L., Huang H., Lian J., Yan Y., et al. (2011). Diatom to dinoflagellate shift in the summer phytoplankton community in a bay impacted by nuclear power plant thermal effluent. Mar. Ecol. Prog. Ser. 424, 75–85. doi: 10.3354/meps08974
Lin Z., Zhan H. (2000). Effects of thermal effluent on fish eggs and larvae in waters near daya bay nuclear plant. J. Trop. Oceanogr. /Redai. Haiyang. Guangzhou. 19 (1), 44–51. doi: 10.3969/j.issn.1009-5470.2000.01.007
Lin J., Zou X., Huang F. (2018). Effects of the thermal discharge from an offshore power plant on plankton and macrobenthic communities in subtropical China. Mar. pollut. Bull. 131, 106–114. doi: 10.1016/j.marpolbul.2018.04.005
Liu S., Huang L. M., Huang H., Lian J. S., Long A. M., Li T. (2006). Ecological response of phytoplankton to the operation of daya bay nuclear power station. Mar. Environ. Sci. 25 (2), 9–13.
Liu Q., Zhou L., Zhang W., Zhang L., Tan Y., Han T., et al. (2022). Rising temperature contributed to the outbreak of a macrozooplankton Creseis acicula by enhancing its feeding and assimilation for algal food nearby the coastal daya bay nuclear power plant. Ecotoxicol. Environ. Saf. 238, 113606. doi: 10.1016/j.ecoenv.2022.113606
Madden N., Lewis A., Davis M. (2013). Thermal effluent from the power sector: an analysis of once-through cooling system impacts on surface water temperature. Environ. Res. Lett. 8 (3), 035006. doi: 10.1088/1748-9326/8/3/035006
Morán X. A. G., Lopez-Urrutia Á., Calvo-Diaz A., Li W. K. (2010). Increasing importance of small phytoplankton in a warmer ocean. Global Change Biol. 16 (3), 1137–1144. doi: 10.1111/j.1365-2486.2009.01960.x
Poornima E. H., Rajadurai M., Rao V. N. R., Narasimhan S. V., Venugopalan V. P. (2006). Use of coastal waters as condenser coolant in electric power plants: Impact on phytoplankton and primary productivity. J. Thermal. Biol. 31 (7), 556–564. doi: 10.1016/j.jtherbio.2006.05.009
Schlensog M., Schroeter B. (2001). A new method for the accurate in situ monitoring of chlorophyll a fluorescence in lichens and bryophytes, in The lichenologist 33 (5), 443–452. doi: 10.1006/lich.2001.0340
Schreiber U. (2004). “Pulse-Amplitude-Modulation (PAM) fluorometry and saturation pulse method: An overview,” in Chlorophyll a fluorescence. advances in photosynthesis and respiration, vol. Vol 19 . Eds. Papageorgiou G. C., Govindjee (Dordrecht: Springer). doi: 10.1007/978-1-4020-3218-9_11
Shannon C. E. (1948). A mathematical theory of communication. Bell. System. Tech. J. 27 (3), 379–423. doi: 10.1002/j.1538-7305.1948.tb01338.x
Shen A., Ishizaka J., Yang M., Ouyang L., Yin Y., Ma Z. (2019). Changes in community structure and photosynthetic activities of total phytoplankton species during the growth, maintenance, and dissipation phases of a Prorocentrum donghaiense bloom. Harmful. Algae. 82, 35–43. doi: 10.1016/j.hal.2018.12.007
Shiah F. K., Wu T. H., Li K. Y., Kao S. J., Tseng Y. F., Chung J. L., et al. (2006). Thermal effects on heterotrophic processes in a coastal ecosystem adjacent to a nuclear power plant. Mar. Ecol. Prog. Ser. 309, 55–65. doi: 10.3354/meps309055
Shiomoto A. (2009). Photosynthetic responses to the temperature of size-fractionated phytoplankton in the wintertime north-western pacific. J. Mar. Biol. Assoc. United. Kingdom. 89 (2), 265–268. doi: 10.1017/S0025315408003275
Sobrino C., Neale P. J. (2007). Short-term and long-term effects of temperature on photosynthesis in the diatom Thalassiosira pseudonana under UVR exposures. J. Phycol. 43 (3), 426–436. doi: 10.1111/j.1529-8817.2007.00344.x
Song X., Huang L., Zhang J., Huang X., Zhang J. B., Yin J., et al (2004). ariation of phytoplankton biomass and primary production in Daya Bay during spring and summer. Mar Pollut Bull 49 (11), 1036–1044.
Tang S. M., Yan Y., Chen B. (2013). Impacts of thermal effluent on the phytoplankton community structures nearby dayawan nuclear power station in spring and summer. J. Appl. Oceanogr. 32 (3), 373–382. doi: 10.3969/J.ISSN.2095-4972.2013.03.010
Tian Y., Hu S., Lin X., Huang H., Song X., Yan Y., et al. (2021). Mechanisms of high-frequency dinoflagellate blooms of Scrippsiella trochoidea in daya bay, south China Sea. J. Oceanol. Limnol. 39 (4), 1293–1304. doi: 10.1007/s00343-020-9082-0
Wang Z. D., Lian J. S., Hu J. X., Wei G. F. (2003). The characteristics of degraded ecosystem of daya bay. Ecol. Sci. 22 (4), 313–320. doi: 10.3969/j.issn.1008-8873.2003.04.006
Wang Y., Wang Z., Huang L. (2004). Environment changes and trends in daya bay in recent 20 years. J. Trop. Oceanogr/Redai. Haiyang. Xuebao. 23 (5), 85–95. doi: 10.3969/j.issn.1009-5470.2004.05.012
Wang Z., Yang Y., Song S., Fu Y., Deng B., Wang Q., et al. (2011). Seasonal changes in nutrients and their accumulation in the surface microlayer in daya bay, south China Sea. Acta Scientiae. Circumstantiae. 31 (2), 307–315.
Wen X., Gong H., Lu C. (2005). Heat stress induces a reversible inhibition of electron transport at the acceptor side of photosystem II in a cyanobacterium Spirulina platensis. Plant Sci. 168 (6), 1471–1476. doi: 10.1016/j.plantsci.2005.01.015
World Energy Outlook (2017). Special report: Energy access outlook. outlook for china’s energy supply and investment trends: Overview of key supply and investment trends Paris. (International Energy Agency), 561–603.
Xie Y. H., Li T., Jian W. J., Hu S. M., Tian Y., Liu S. (2015). Influence of ocean warming on the community structure and photosynthetic efficiency of phytoplankton in daya bay. J. Trop. Oceanogr. 34 (2), 24–31. doi: 10.11978/j.issn.1009-5470.2015.02.004
Xu G. Z. (1989). Environments and resources of Daya Bay. (Anhui Press of Science and technology) p. 11–13.
Xu C., Hu S., Guo Z., Li T., Huang H., Chan L. L., et al. (2020). Flexible feeding patterns of copepod Centropages tenuiremis in fluctuating conditions: A possible survival strategy to cope with disturbance. Acta Oceanolog. Sin. 39 (2), 59–68. doi: 10.1007/s13131-020-1553-9
Xu N., Lv S. H., Chen J. F., He L. S., Xie. L. C., Qi Y. Z. (2004). The influence of water temperature and salinity on the growth of Scrippsiella trochoidea. Mar. Environ. Sci. 23 (3), 36–38. doi: 10.3969/j.issn.1007-6336.2004.03.011
Xu D., Wang H., Han D., Chen A., Niu Y. (2021). Phytoplankton community structural reshaping as response to the thermal effect of cooling water discharged from power plant. Environ. pollut. 285, 117517. doi: 10.1016/j.envpol.2021.117517
Yu J., Tang D., Wang S., Lian J., Wang Y. (2007). Changes of water temperature and harmful algal bloom in the daya bay in the northern south China Sea. Mar. Sci. Bull. 9 (2), 25–33. doi: 10.3969/j.issn.1000-9620.2007.02.004
Keywords: thermal discharge, phytoplankton, size-fractionated structure, photosynthetic physiology, elevated temperature
Citation: Hu S, Zhang C, Liu Q, Li T, Huang H and Liu S (2023) Short-term responses of phytoplankton size-fractionated structure and photosynthetic physiology to thermal effluent in a subtropical coastal bay. Front. Mar. Sci. 10:1102686. doi: 10.3389/fmars.2023.1102686
Received: 19 November 2022; Accepted: 10 January 2023;
Published: 26 January 2023.
Edited by:
Huang Honghui, South China Sea Fisheries Research Institute (CAFS), ChinaCopyright © 2023 Hu, Zhang, Liu, Li, Huang and Liu. This is an open-access article distributed under the terms of the Creative Commons Attribution License (CC BY). The use, distribution or reproduction in other forums is permitted, provided the original author(s) and the copyright owner(s) are credited and that the original publication in this journal is cited, in accordance with accepted academic practice. No use, distribution or reproduction is permitted which does not comply with these terms.
*Correspondence: Sheng Liu, c2hsaXVAc2NzaW8uYWMuY24=
Disclaimer: All claims expressed in this article are solely those of the authors and do not necessarily represent those of their affiliated organizations, or those of the publisher, the editors and the reviewers. Any product that may be evaluated in this article or claim that may be made by its manufacturer is not guaranteed or endorsed by the publisher.
Research integrity at Frontiers
Learn more about the work of our research integrity team to safeguard the quality of each article we publish.