
94% of researchers rate our articles as excellent or good
Learn more about the work of our research integrity team to safeguard the quality of each article we publish.
Find out more
ORIGINAL RESEARCH article
Front. Mar. Sci., 14 March 2023
Sec. Ocean Observation
Volume 10 - 2023 | https://doi.org/10.3389/fmars.2023.1102506
This article is part of the Research TopicEvaluating Invasion Processes of Alien and Neonative Species via Impact Assessment Protocols.View all 4 articles
 Leigh W. Tait1,2*
 Jeremy Bulleid1
 Lily Pryor Rodgers1
 Kimberley Seaward1
 Louis Olsen3
 Chris Woods1
 Henry Lane4
 Graeme J. Inglis3
Early detection of marine invasive species is key for mitigating and managing their impacts to marine ecosystems and industries. Human divers are considered the gold standard tool for detecting marine invasive species, especially when dive teams are familiar with the local biodiversity. However, diver operations can be expensive and dangerous, and are not always practical. Remote operated vehicles (ROVs) can potentially overcome these limitations, but it is unclear how sensitive they are compared to trained divers for detecting pests. We assessed the sensitivity and efficiency of ROVs and divers for detecting marine non-indigenous species (NIS), including the potential for automated detection algorithms to reduce post-processing costs of ROV methods. We show that ROVs can detect comparable assemblages of invasive species as divers, but with lower detection rates (0.2 NIS min-1) than divers (0.5 NIS min-1) and covered less seafloor than divers per unit time. While small invertebrates (e.g., skeleton shrimp Caprella mutica) were more easily detected by divers, the invasive goby Acentrogobius pflaumii was only detected by the ROV. We show that implementation of computer vision algorithms can provide accurate identification of larger biofouling organisms and reduce overall survey costs, yet the relative costs of ROV surveys remain almost twice that of diver surveys. We expect that as ROV technologies improve and investment in autonomous and semi-autonomous underwater vehicles increases, much of the current inefficiencies of ROVs will be mitigated, yet practitioners should be aware of limitations in taxonomic resolution and the strengths of specialist diver teams.
Control or eradication of invasive species are often dependent upon detecting populations when they are small and restricted in distribution (Myers et al., 2000; Bax et al., 2001; Inglis et al., 2006). To enable early detection, surveillance programmes for marine pests often focus on the highest risk pathways, such as ports, harbours, and marinas (Wotton and Hewitt, 2004; Lehtiniemi et al., 2015; Tamburini et al., 2021; Hatami et al., 2022). One of the most efficient and effective methods for visual detection and conformation of marine Non-Indigenous Species (NIS) is the use of divers (Peters et al., 2019), yet various health, safety, and physiological limitations can greatly limit where and when divers can be safely deployed. Harbour environments can be some of the busiest, most polluted, and most dangerous environments for deploying human divers (Barsky, 2006). Alternative methods are required to underpin post-border surveillance in increasingly busy and highly regulated marine spaces. Remote operated and autonomous underwater vehicles (AUVs) (Zereik et al., 2018) could complement or replace diver operations, yet their biases and limitations for marine pest detection are not understood.
Underwater remote operated vehicles (ROVs) have been available for marine surveys for over three decades (Capocci et al., 2017). The utility of ROVs is widely recognised in a range of scenarios, including marine science, exploration, and construction (Zereik et al., 2018). Adaptation of unmanned aerial vehicle (UAV) technology to ROVs has led to a large increase in the range of affordable models that are small, mobile, and relatively easy to operate, thereby increasing their availability to consumers and researchers (Buscher et al., 2020). ROVs are now routinely used for biodiversity surveys (Lam et al., 2006; Pacunski et al., 2008; Andaloro et al., 2013; Boavida et al., 2016), including the use of incidental imagery captured during non-scientific operations (Macreadie et al., 2018; McLean et al., 2019). The collection and retention of imagery by remote vehicles provides additional opportunity to be scrutinised by multiple trained taxonomists or automatically processed by trained algorithms (Woodall et al., 2018).
There are currently no widely accepted standards or protocols for applying ROVs to post-border surveillance for unwanted marine pest species, yet there are many examples of their use (Sammarco et al., 2010; Wells, 2011; Arthur et al., 2015; Peters et al., 2019). In fact, the use of “free-flying” ROVs (Davidson et al., 2006a; Davidson et al., 2006b; Floerl and Coutts, 2011) and hull crawling robots (Caccia et al., 2010; Eich et al., 2014) for vessel inspections is widely accepted. However, there were limitations to their effectiveness, particularly their ability to identify and obtain specimens of suspect organisms. Significant advances have been made since these studies, and removal capabilities are now available on many ROV platforms (Mazzeo et al., 2022). Moreover, AUVs are increasingly capable of the close-range imaging surveys necessary for pest detection (Bonin-Font et al., 2016; Gutnik et al., 2022). An assessment of the utility of ROVs for replacing or complementing biosecurity surveys is therefore needed, especially as the benefits of autonomous vehicles are increasingly realised.
Despite the potential of ROVs, current evidence suggests surveys undertaken with them are not as efficient as surveys using SCUBA (Self-Contained Underwater Breathing Apparatus) divers, particularly compared to diver collections (Peters et al., 2019). Peters et al. (2019) detected larger numbers of NIS on vessel hulls at reduced costs when combined samples were collected by divers compared to visual identification by ROV (Peters et al., 2019). Identifying small organisms (e.g.,<10 mm) from video feeds will be dependent on proximity of the camera to surfaces of interest, turbidity of the water, and camera resolution. However, even the most advanced systems are unable to fulfil the requirements to classify many groups of organisms (Horton et al., 2021). While current remote operated imaging systems are unlikely to match specimen-based taxonomy, ROVs provide a useful tool for identifying a large range of macro-organisms (Beisiegel et al., 2017), fish communities (Raoult et al., 2020), and can complement current methods (e.g., divers) in dangerous scenarios (e.g., high current, dangerous marine animals, in busy ports, at depths beyond 20 m).
Critical assessments of new technologies are necessary to ensure their sensitivity as a diagnostic tool (MacAulay et al., 2022). There is, however, a need to overcome surveillance bottlenecks associated with physiological limitations of human divers, workforce limitations, and declining taxonomic expertise (Cook and Coutts, 2017). Combined, these limitations highlight the potential value of remote operated camera systems and trained Artificial Intelligence (AI) detectors as a mechanism to augment human efforts, both in the field and in the laboratory (Mohanty et al., 2016; Jothiswaran et al., 2020). Despite the benefits of ROVs (and increasingly AUVs) for surveillance of marine pests, for this potential to be realised these tools must meet the three pillars for gold standard diagnostics: high sensitivity; low cost; and speed (MacAulay et al., 2022). The application of real-time computer vision algorithms at broad taxonomic levels could greatly improve the speed of ROV surveillance by reducing the need for post-processing (Wäldchen and Mäder, 2018), but whether these tools can meet the three pillars of gold standard diagnostics remains relatively unknown.
To ensure ROVs are applied appropriately to post-border marine surveillance, they must have similar detection sensitivity as divers and achieve comparable coverage for similar costs. Here, we assess the relative sensitivity and detection rates of visual surveys by divers and an ROV in post-border surveillance of macro-organisms in Aotearoa New Zealand. We note that this differs from camera surveys by divers, which like ROV surveys, require post-processing. We also assess the relative coverage and the relative costs of each method across gradients of turbidity, including potential cost savings associated with automated computer vision algorithms for processing ROV video.
To test the sensitivity and efficiency of ROVs in a marine surveillance context we deployed an ROV alongside SCUBA divers at three locations in Aotearoa New Zealand subject to targeted surveillance for NIS: Kaipara Harbour (North Island/Te Ika-a-Maui), Nelson Harbour (South Island/Te Waiponamu), and Lyttelton Harbour/Whakaraupō (South Island/Te Waiponamu) (Figure 1). The surveillance in Kaipara Harbour, Nelson Harbour, and Lyttelton Harbour/Whakaraupō are based on a bi-annual survey programme (National Marine High Risk Site Surveillance (NMHRSS) programme). The established number of NIS at each location, as determined by a mix of dedicated baseline surveys (i.e., near full census of marine biodiversity), biannual surveillance (e.g., NMHRSS), sporadic surveillance, and expert verified citizen science records (Seaward et al., 2015) are reported for each site (Figure 1). Due to the wide range of methods, in some cases deployed biannually for > 20 years, comparing the number of NIS detected in this study to total NIS detected at each location is not necessarily appropriate.
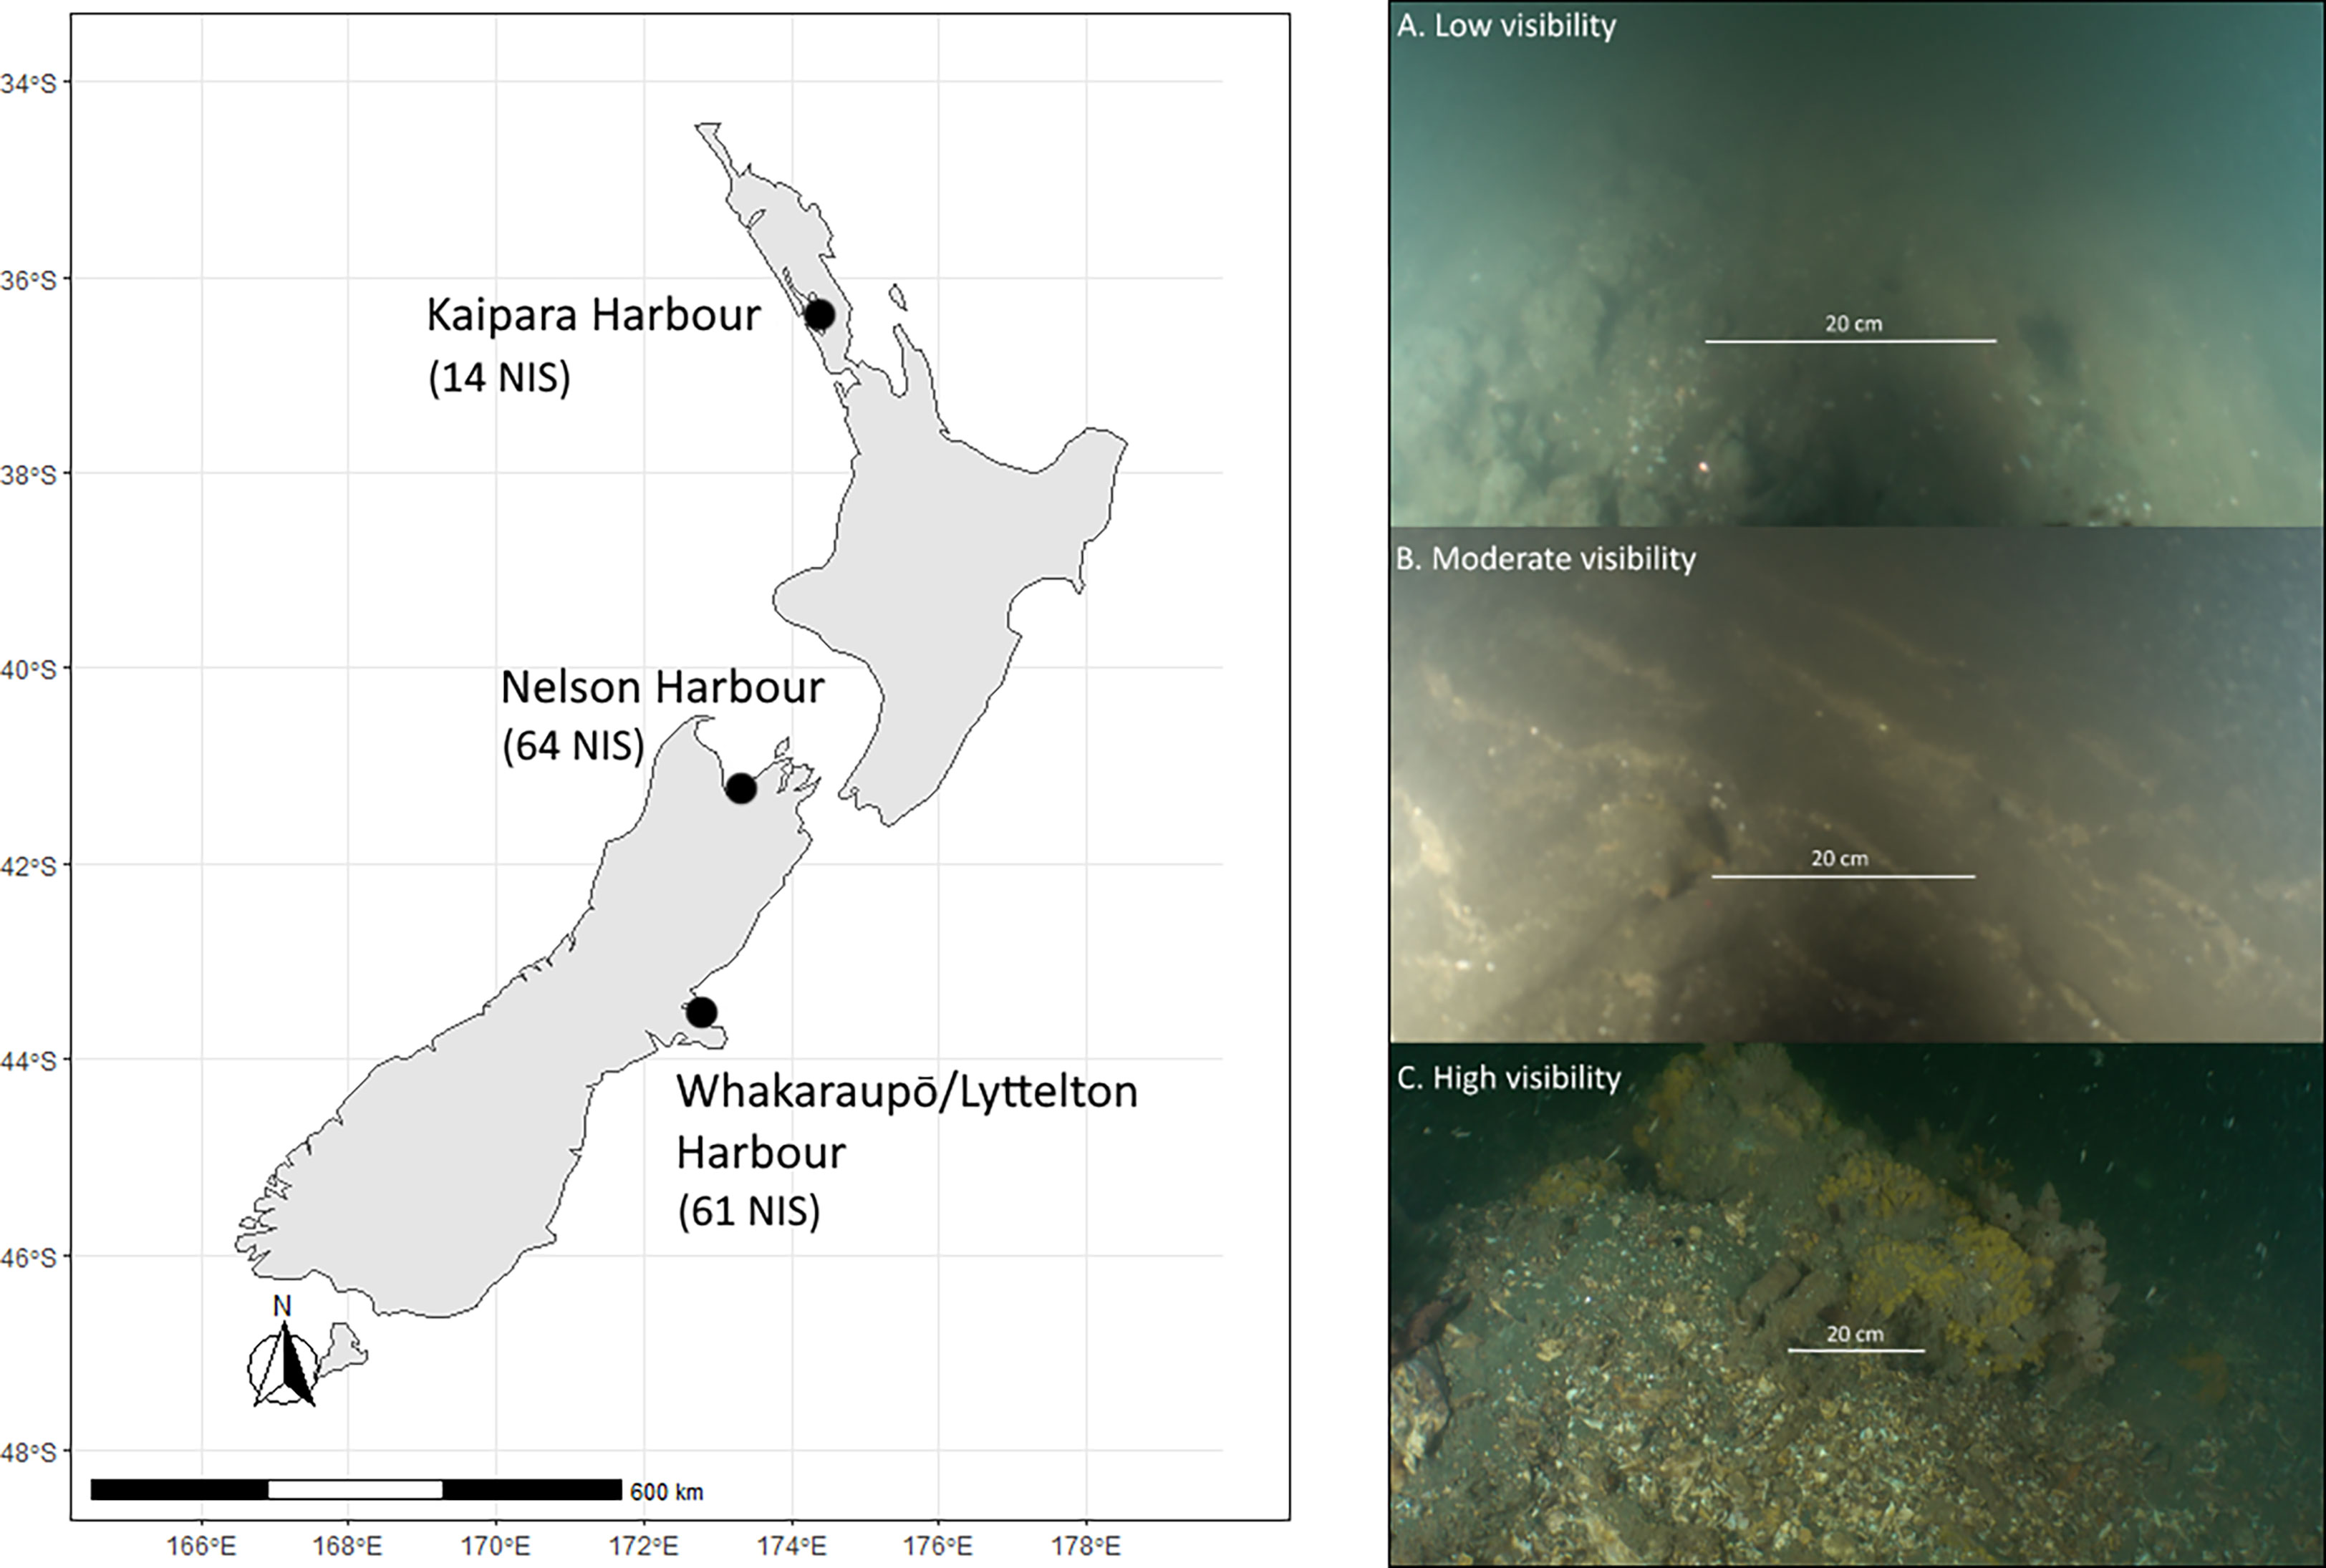
Figure 1 Study locations across Aotearoa New Zealand: Kaipara Harbour; Nelson Harbour; and Whakaraupō/Lyttelton Harbour. The number of confirmed NIS at each location are shown in brackets below the site label. The right-hand panel shows representative images of the seafloor across a gradient of water clarity in Kaipara Harbour and the decreasing swath width of seafloor visible with increasing turbidity. (A, low visibility; B, moderate visibility; and C, high visibility)
The existence of a strong turbidity/visibility gradient in Kaipara Harbour was used to assess the implications of water visibility on survey efficiency (Figures 1A–C). We tested three broad hypotheses: 1) increasing turbidity will greatly influence survey cost per unit area for both ROV and diving methods; 2) the sensitivity (i.e., the ability to detect NIS accurately), detection rate (i.e., the number of NIS detected per unit time), and the taxonomic composition of species observations will vary between methods; and 3) survey costs per unit area will be greater for ROV methods but development of automated detection algorithms will improve relative cost differences.
The ROV used for this study (Boxfish™ ROV, Boxfish Research Ltd) is relatively small (length 60 cm, height 30 cm, and width 40 cm), and is equipped with high-powered LED lights, a Sony™ RX100 (V) camera capable of recording in 4K (30 fps) and four parallel scaling lasers. The ROV is relatively lightweight (<30 kg) and was deployed from small vessels by a team of 2-3 people depending on operating conditions. For example, in conditions that allowed the vessel to be anchored or berthed at pontoons/wharfs, a two-person team was sufficient for safe operations, but during un-secured operations a three-person team was required to safely operate the vessel, the ROV, and manage the ROV’s tether.
The SCUBA diving personnel used for this study have experience in marine biosecurity surveillance across ports and harbours throughout New Zealand (Woods et al., 2018). These specialist scientific diving teams were regularly trained on the identification of high-risk marine pests, were familiar with many of the NIS present in New Zealand and maintain a high level of knowledge of native species present throughout New Zealand. Divers used in this study had a minimum of five years’ experience. Furthermore, more experienced divers (> 10 years’ experience) were always paired with less experienced divers. Although the same divers were not used for every dive in every region (on account of dive profile management and regional diver availability), the experienced diver was always denoted “Diver 1” while the less experienced diver was denoted “Diver 2”. Like ROV surveys, dive teams used artificial lighting (e.g., high powered LED torches) to illuminate their surroundings and aid in the identification of organisms.
Divers had a primary objective of detecting nine target marine pest species, five that have yet to be detected in New Zealand (the Northern Pacific seastar Asterias amurensis, the European shore crab Carcinus maenas, the green seaweed Caulerpa taxifolia, the Chinese mitten crab Eriocheir sinensis, and and the Asian clam Potamocorbula amurensis), and four established pest species (the Asian date mussel Arcuatula senhousia, the droplet tunicate Eudistoma elongatum, the Mediterranean fanworm Sabella spallanzanii, and the clubbed tunicate Styela clava). However, as a secondary objective, divers are tasked with detecting non-target NIS know to be in New Zealand waters (e.g., the Asian paddle crab Charybdis (Charybdis) japonica, the colonial ascidian Didemnum vexillum, and the kelp Undaria pinnatifida) and any suspect organisms thought to be new to New Zealand (Woods et al., 2018). A selection of these species, and other NIS commonly found in New Zealand are shown in Figure 2. When comparing the species detected by each method, we separately analysed the detection profiles for total NIS observed (i.e., primary and secondary objectives) and the target subset of organisms (i.e., the primary objective of nine target species and the three non-target species).
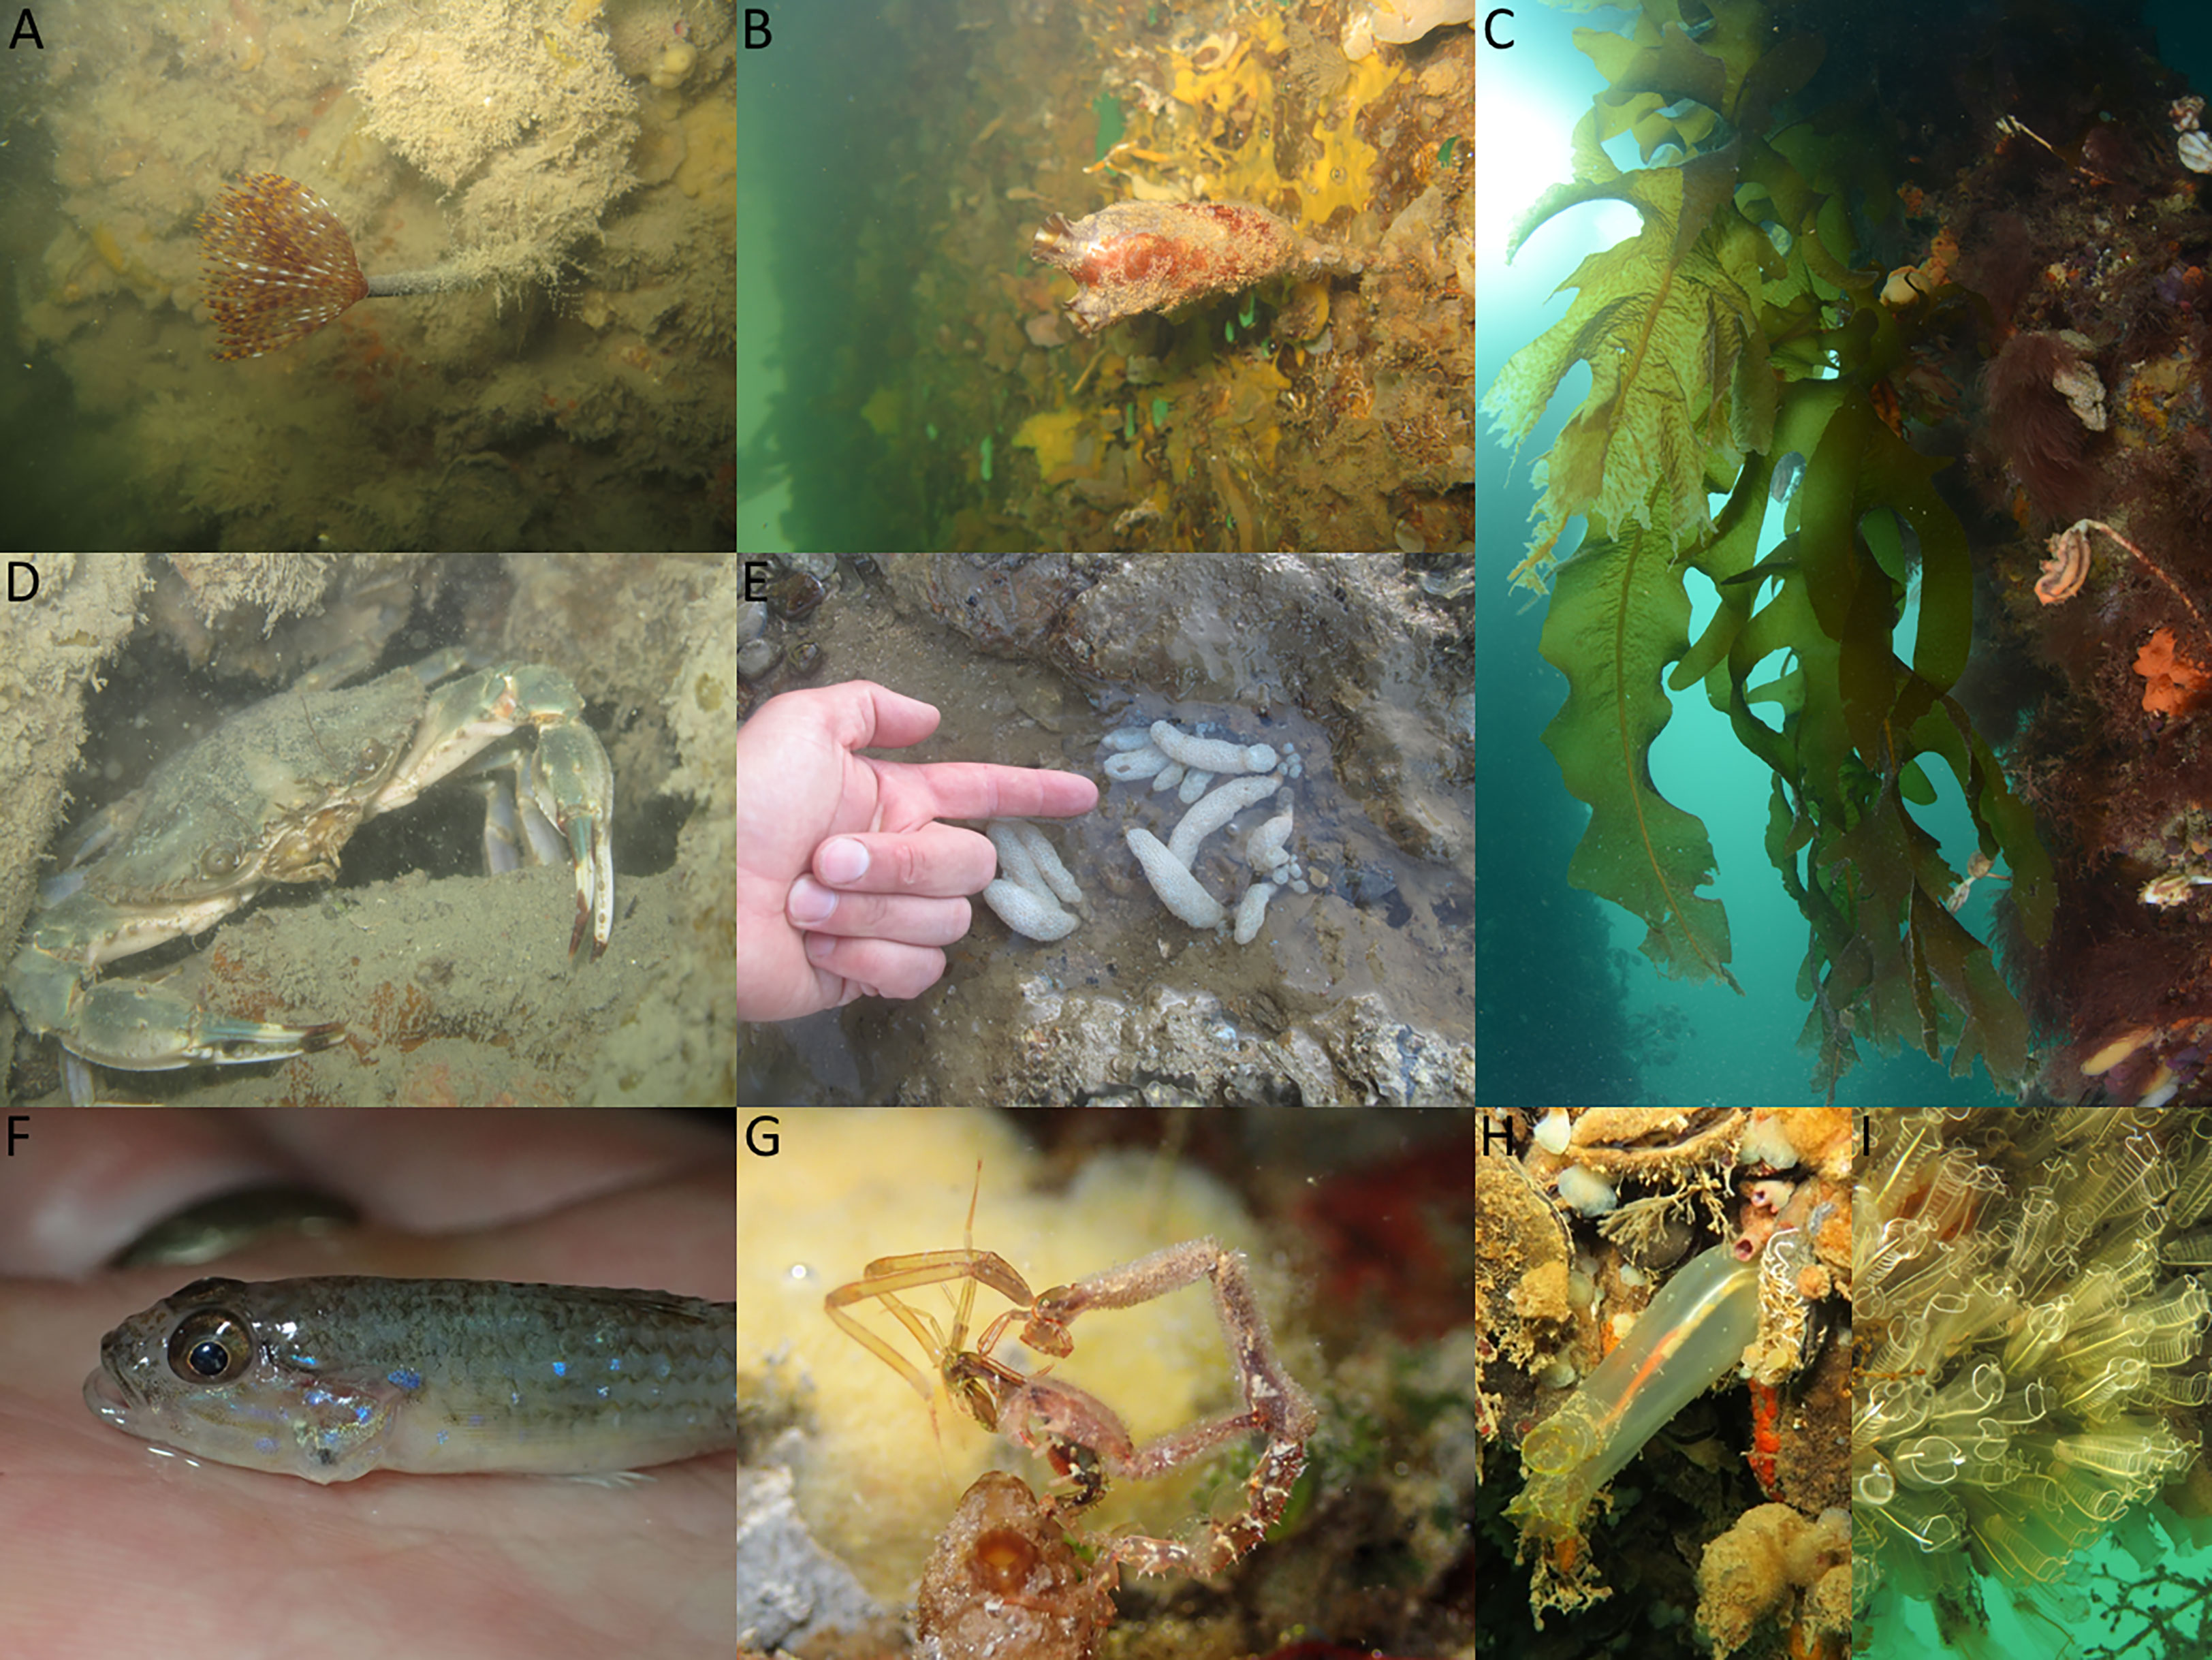
Figure 2 Non-indigenous species (NIS) commonly found in New Zealand ports and harbours. Slides include: Sabella spallanzanii (A); Styela clava (B); Undaria pinnatifida (C); Charybdis (japonica) japonica (D); Eudistoma elongata (E); Acentrogobius pflaumii (F), Caprella mutica (G); Ciona intestinalis (H); and Clavellina laepadiformis. (I) Photos taken by Crispin Middleton (A, B, D, E), Chris Woods (F–I) and Leigh Tait (C).
A key aspect of the survey protocol that these programmes have implemented for 20 years was the focus on detecting new incursions of NIS, not enumerating densities or abundance of established NIS (Woods et al., 2018). This strategy was implemented to ensure that human observers did not become overwhelmed counting abundant NIS but maintain mental capacity to observe and detect primary or secondary target species. Therefore, we assessed the efficacy and efficiency of divers and ROVs at detecting the presence or absence of NIS and do not report densities or abundances. However, we briefly report on whether NIS were identified by single specimens or abundant populations.
Kaipara Harbour (Figure 1) presented a strong turbidity gradient, from the upper arms of the harbour (turbid) to the harbour entrance (clear). We used this gradient to compare the swath of benthos sampled by divers and the ROV at high visibility (> 3 m secchi), moderate visibility (1.5 m secchi) and low visibility (0.8 m secchi) (Figures 1A–C). Two sites were investigated at each turbidity range. At each site all NIS were noted, and the time and distance covered recorded. The width of seafloor within clear view of the ROV and SCUBA divers was estimated using parallel lasers to calculate the average frame width (ROV), and half the secchi disk measurement taken at the surface (divers). While it is not appropriate to assume that the benthos could be accurately sampled by divers at the full length of the secchi measurement, we considered that half the secchi depth was a conservative swath width of human divers. Wharf piles were surveyed at locations of high and low turbidity (no wharf piles were found in regions of moderate turbidity), and the times taken to cover these features were also recorded. All NIS detected were enumerated, and any suspected NIS or unknown native species were sampled by SCUBA divers. Samples were preserved according to the taxon to which they belonged (as identified by trained parataxonomists) and sent to specialist taxonomists for formal identification.
The average point-to-point distance covered per unit time, by the ROV and divers, was estimated from the difference between the start and end Global Positioning System (GPS) coordinates and the time it took to cover the distance. The GPS coordinates were collected with a Lowrance™ HDS-16 chart-plotter with horizontal accuracy < 5 m.
ROV and SCUBA surveys were completed at all three locations (Figure 1). The 14 sites (Kaipara, four sites; Nelson, six sites; and Whakaraupō/Lyttelton, four sites) surveyed included a range of natural and artificial habitats including rocky riprap/reef, soft sediments, man-made pontoons, and wharf piles. Sites were pre-determined and were assessed by ROV first to avoid missing specimens collected by divers. SCUBA surveys were completed no more than two weeks after ROV surveys. Sampling was completed during daylight hours at each location. Sampling in Kaipara Harbour was completed during the week 20-24 May 2019; between 18-26 June 2019 in Nelson; and between 1-15 July 2019 in Whakaraupō/Lyttelton Harbour.
At each site, a defined area was sampled in line with the NMHRSS programme (Seaward et al., 2015), either 50 m benthic transect, 50 m pontoon structures, or ten wharf piles were sampled, and the time taken for each method recorded. Divers searched the prescribed area (e.g., linear distance travelled or prescribed number of wharf piles) in “buddy” pairs, swimming the same route which included observations of both overlapping and discrete habitats. Furthermore, all NIS observed by divers or ROV were recorded. The sensitivity of each method (i.e., the proportion of NIS, sampled by each diver and the ROV, compared to the total NIS sampled by all methods) and the detection rate (i.e., number of NIS sampled per minute) were calculated for each site.
Sensitivity (Equation 1) was calculated as the total number of NIS (number of species, not number of individuals) found at that site by each method (Ms) compared to the total number of NIS observed by all methods (i.e., both divers and ROV) at that site (S).
Equation 1:
Detection rates (Equation 2) were calculated as the total number of NIS detected by each method (Ms) divided by the time taken to complete the survey (Tmin). Detection rate was expressed as NIS detected per minute.
Equation 2:
Observations of NIS were recorded in situ by divers. However, ROV videos were processed following completion of field campaigns by trained parataxonomists with no prior knowledge of the observations made by the divers. In cases where NIS were suspected, but were unable to be confirmed via specimens, confirmation by diver collected specimens was used to confirm presence. We note that without performing a full biodiversity census at each site we were unable to assess the inability of both methods to detect NIS present within a site.
Species assemblages at each location and for each method (including separate detections from each diver) were used to identify differences in taxonomic profiles detected by each method. The influence of substrata, method, and region on NIS composition was examined. We analysed the total richness of NIS detected by both methods as well as the subset of primary target species to ensure that additional capability to review ROV video did not bias the detection of additional species compared to divers.
We assessed the relative efficiencies and efficacy of diver and ROV methods, including the costs of manual footage review compared to artificial intelligence (AI) augmented processing of ROV video. This was done by summing the time required to cover 1 hectare (ha) of seafloor and multiplying this by the number of people required for operations. Four people were required to complete diving operations, while three people were required for ROV operations. ROV surveys required post-processing of video to analyse the presence of NIS and this time was added to the total time costs of ROV surveys. Video processing time was added to the survey cost at the same ratio as the footage collected (i.e., one hour of benthic video = one hour post-processing). We note that equipment (e.g., ROV, dive gear, vessels) and consumables (e.g., fuel) was not factored into calculations of costs. We focus on the personnel costs of completing surveys after investing in the appropriate equipment.
To demonstrate the applicability of AI detectors we trained and tested a computer vision algorithm against expert marine biosecurity specialists. Here, we examined the potential for computer vision algorithms to recognise and discriminate a key unwanted, yet widely present invasive species of tubeworm, Sabella spallanzanii, including testing against a similar native tubeworm Pseudobranchiomma grandis (both Family Sabellidae; Figure 3). S. spallanzanii has been shown to be damaging to ecosystem services and marine industries (Soliman and Inglis, 2018; Atalah et al., 2019; Douglas et al., 2020; Tait et al., 2020). Halting regional spread of species such as S. spallanzanii is a key goal of regional and central government agencies across New Zealand and Australia (Cunningham et al., 2019; McDonald et al., 2020).
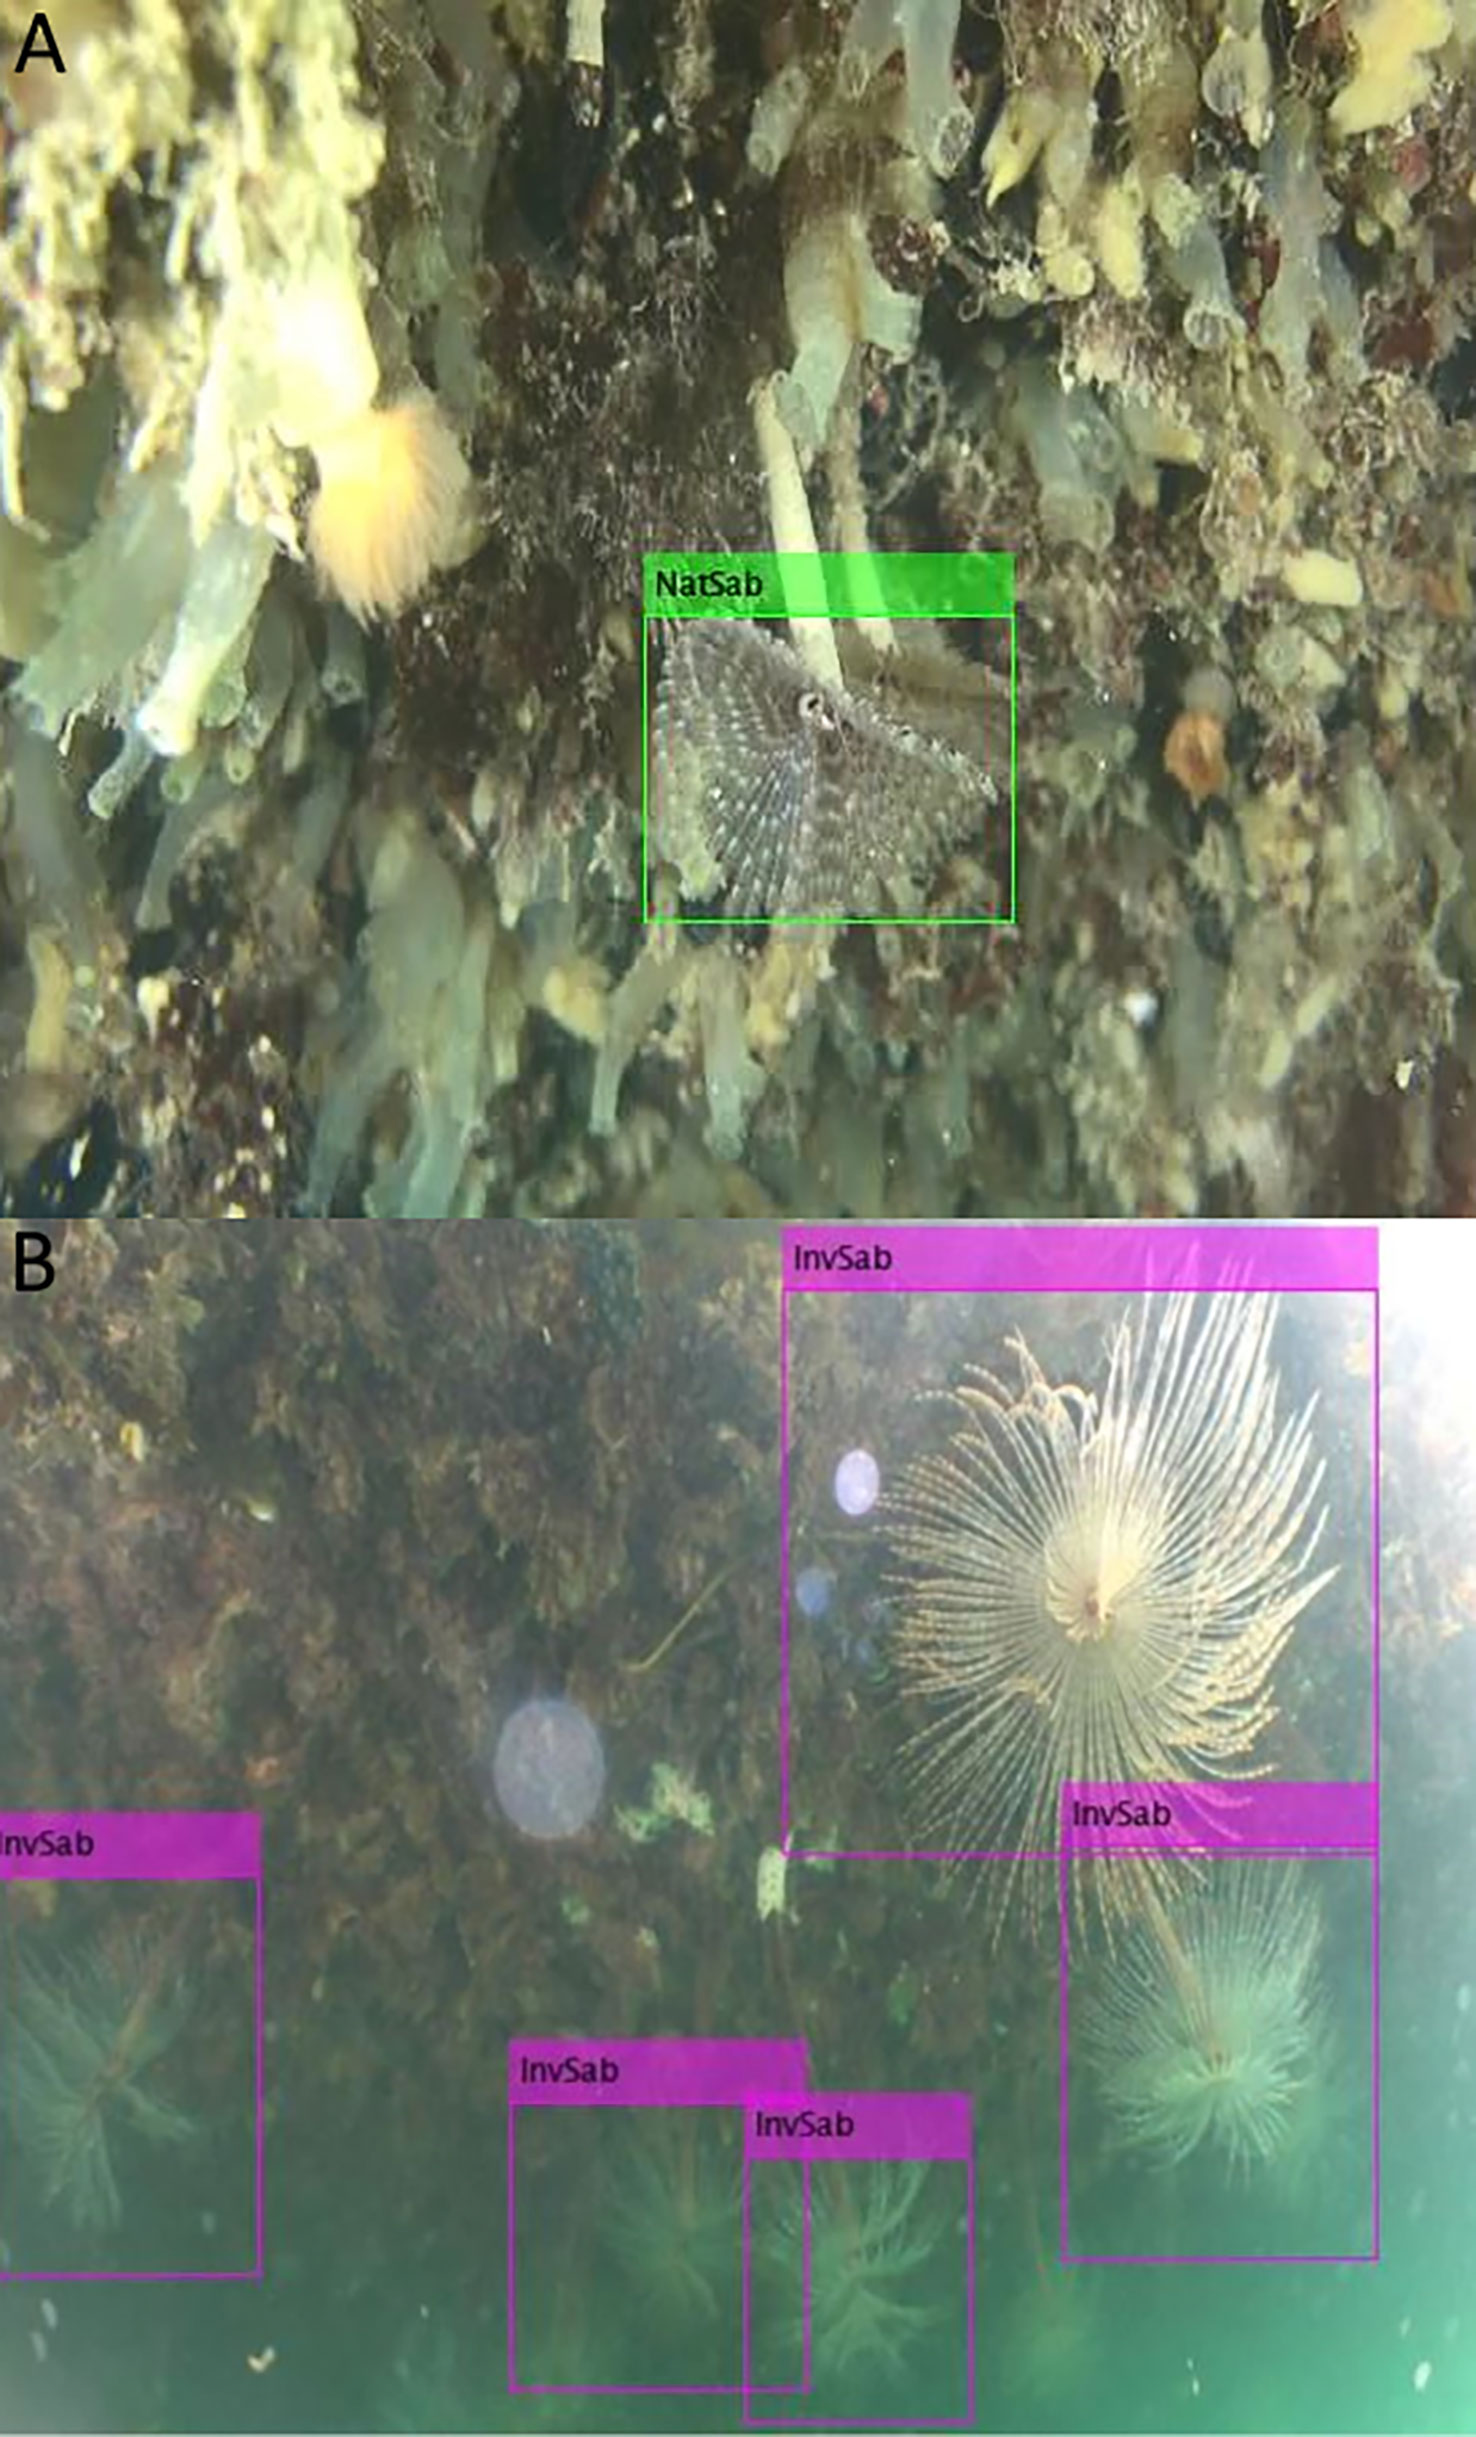
Figure 3 Example frames of video-based detectors and detections of the indigenous sabelllid tubeworm Pseudobranchiomma grandis (A) and the non-indigenous Sabella spallanzanii (B).
We explored the potential for automatic NIS detection in survey videos (collected with the Boxfish™ ROV), using AI to identify a NIS already present in New Zealand. We trained a YOLOv3 AI model to detect the non-indigenous tubeworm, S. spallanzanii and the indigenous tubeworm P. grandis. This classifier was chosen because of its suitability for object detection, and in particular its utility for real-time detection.
YOLOv3 (You Only Look Once version 3), is a real-time object detection algorithm that identifies specific targeted objects in videos (as a post-process). During training, YOLOv3 iteratively learns the features required to accurately identify its target and, after each iteration, discards any information that does not improve the accuracy. To train the YOLOv3 model we used a small dataset of approximately 100 individual images of non-indigenous tubeworm S. spallanzanii. For testing, we used independent ROV video that had not been used for training.
From our selected ROV survey video, we fed a set of 100 frames (set A) into the trained detector. When the detector predicted the presence of the target (S. spallanzanii) anywhere within the frame, it drew a coloured box around (annotated) each instance of the detected target and saved the set of 100 annotated frames (set B) for later analysis. Set A was given to one of two experts to manually count and record the number of individual S. spallanzanii that were visible in each frame. Set B was given to the second expert to count and record any AI-annotated detections in each frame. We then carried out a comparison between the instances of S. spallanzanii manually counted in set A and those automatically detected in set B. While the trained detector algorithm included both indigenous and non-indigenous tubeworms, only the invasive S. spallanzanii was present in the test video.
Variation in sensitivity and detection rates between methods (including between divers) were analysed using one-way ANOVA, including post-hoc Tukey tests. Diagnostic plots were used to check for outliers and homoscedasticity before Tukey tests were performed. Statistical tests were done in R Studio (RStudio Team, 2020).
Composition of NIS was analysed using principal coordinate analysis (PCA) and permutational ANOVA (PERMANOVA) using the R ‘vegan’ package (Oksanen, 2007). We chose multivariate analysis to retain species specific information and identify subtle biases in the detection profiles of each method. To test for and visualise these responses we overlayed the contribution of individual species using redundancy analyses to the total species profile of each replicate (i.e., a single site by one method). The Jaccard index was used for calculating dissimilarity indices for the presence-absence data. The combined effects of method (Diver 1, Diver 2, or ROV) survey substrata (rocky reef/riprap, soft sediment, or pontoons), and location (Kaipara Harbour, Nelson Harbour, and Lyttelton Harbour/Whakaraupō) on the composition of NIS detections were analysed using PCA and PERMANOVA. PCA plots included vectors representing the contribution of NIS to detection profiles and frames surrounding treatment groups.
Agreement between computer vision detection algorithms and expert observations were analysed with linear regressions. To test the deviation of the regression slope from one (i.e., perfect agreement) the difference between computer vision detections and experts’ detections were compared to expert detections. Significant deviation of the regression slope from zero was used to assess the over- or under-detection of S. spallanzanii by the computer detector.
Under decreasing water clarity, the area of seafloor or surface area of structures surveyed per unit time by divers or ROV decreased dramatically (Table 1). This was determined by the area of seafloor/structure visible under a gradient of turbidity, where decreasing water clarity affected the proximity of the ROV to the benthos/structure and therefore the area of benthos clearly visible per linear metre of benthos/structure covered or the number of piles covered per unit time. Since it was necessary for SCUBA divers to dive as buddy pairs for safety reasons, the area of benthos/structure sampled was doubled, but the area surveyed by a single diver and the ROV was comparable.

Table 1 Estimated area of seafloor and the number of wharf piles sampled by divers and ROV in a 10-minute period.
Combined, visual surveys with ROVs and divers detected 35% of all known NIS present in Kaipara Harbour, 14% of all NIS known from Nelson Harbour, and 15% of all known NIS from Whakaraupō/Lyttelton Harbour. ROV alone detected 28% of all known NIS present in Kaipara Harbour, 8% of all NIS known from Nelson Harbour, and 10% of all known NIS from Whakaraupō/Lyttelton Harbour. The sensitivity of detection was similar for each method, with no statistical difference in the proportion of the total NIS detected by each method (Figure 4A). However, detection rates (e.g., the number of unique NIS sampled per unit time) of NIS were significantly greater for divers compared to the ROV (Figure 4B; Table 2). Tukey post-hoc tests revealed no significant differences in detection rates between Diver 1 and Diver 2, or between Diver 2 and ROV, but Diver 1 had higher detection rates than ROV (Table 2).
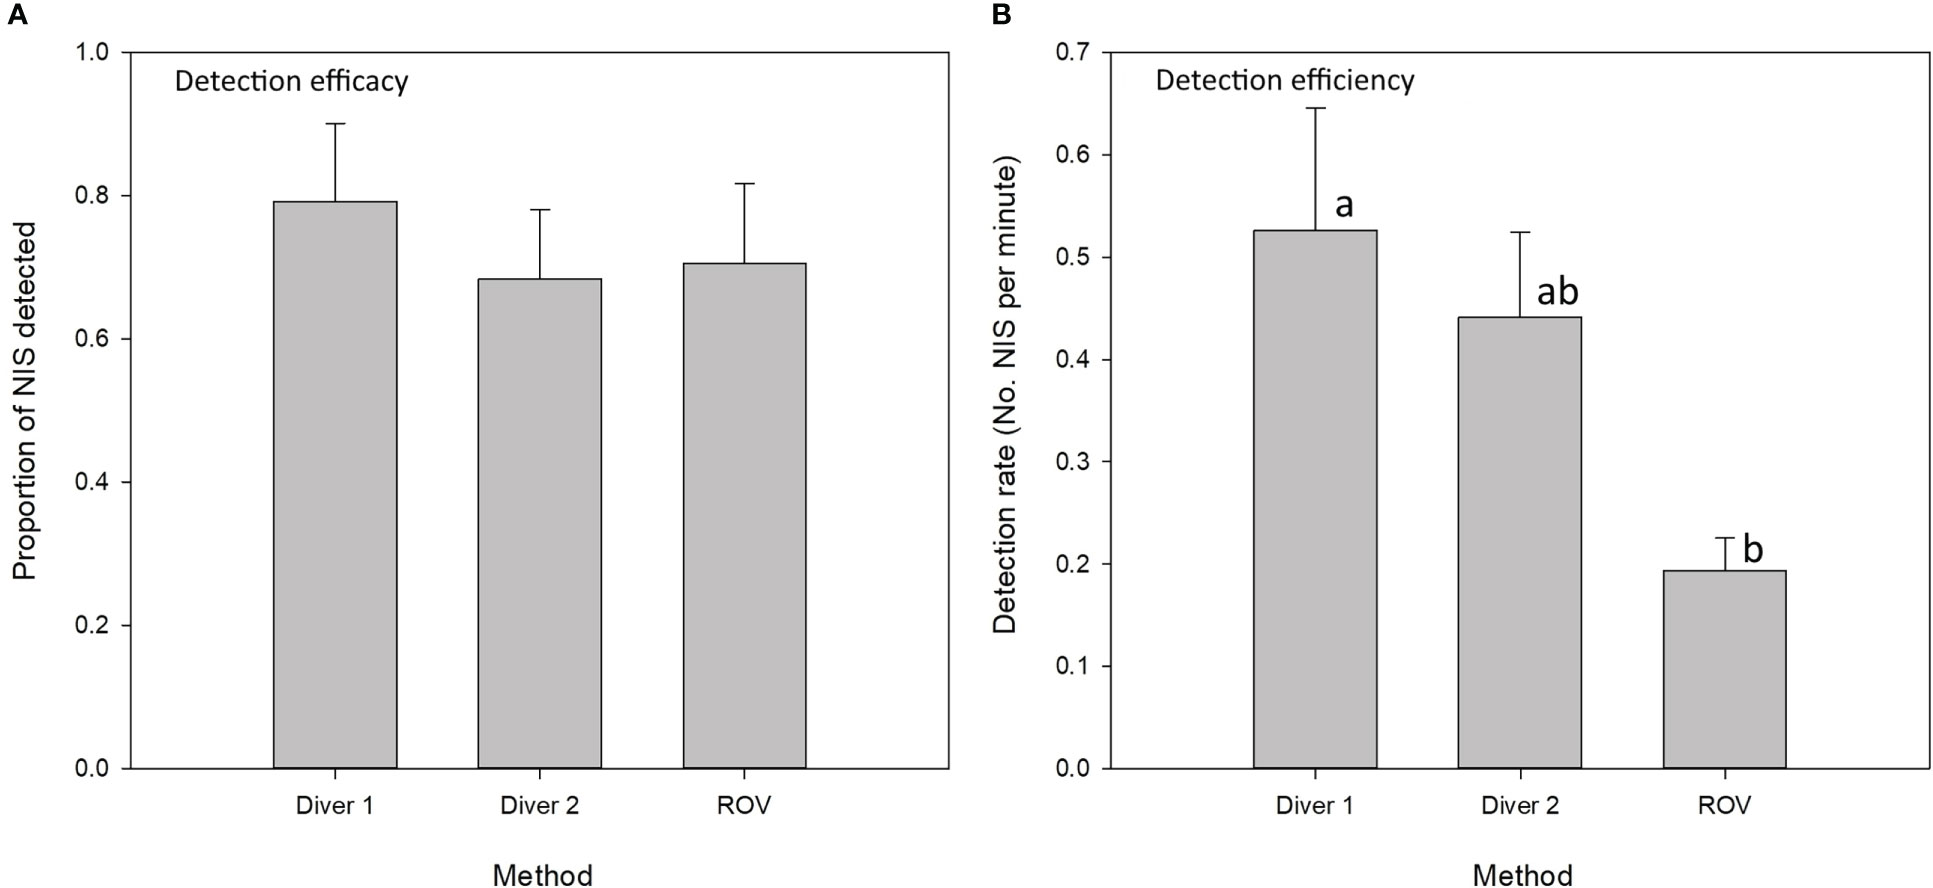
Figure 4 Comparison of SCUBA divers and ROV for NIS detection. Graph (A) shows the proportion of NIS detected at each site (detection efficacy) and graph (B) shows the detection rate per minute for each method (detection efficiency). Results of Tukey test comparisons shown by letters (a, b), with separate letters indicating statistically significant differences.

Table 2 Variation in sensitivity and detection rates between methods (including between divers) as analysed using one-way ANOVA, and post-hoc Tukey tests.
The composition of NIS assemblages as detected by each method and at each site were presented in two-dimensional space as Principal Coordinate Analyses (PCA). To visualise the overlap in detection profiles we present duplicate plots highlighting the differences between each method (Figures 5A, B), various substrates (Figures 5C, D), and regions (Figures 5E, F). Principal coordinate plots showed high overlap in the detection profiles between all methods for the full suite of NIS detected (Figure 5A) and the subset of targeted high-risk species (Figure 5B), although ROV detections captured only a subset of the overall NIS profile observed by divers (Figure 5A). Unlike survey methods, NIS profiles were distinct across substrate types (Figures 5C, D), and across regions (Figures 5E, F). PERMANOVA analysis showed that the species profiles detected by each method were not significantly different, but the species profiles differed significantly between substrata (Table 3).
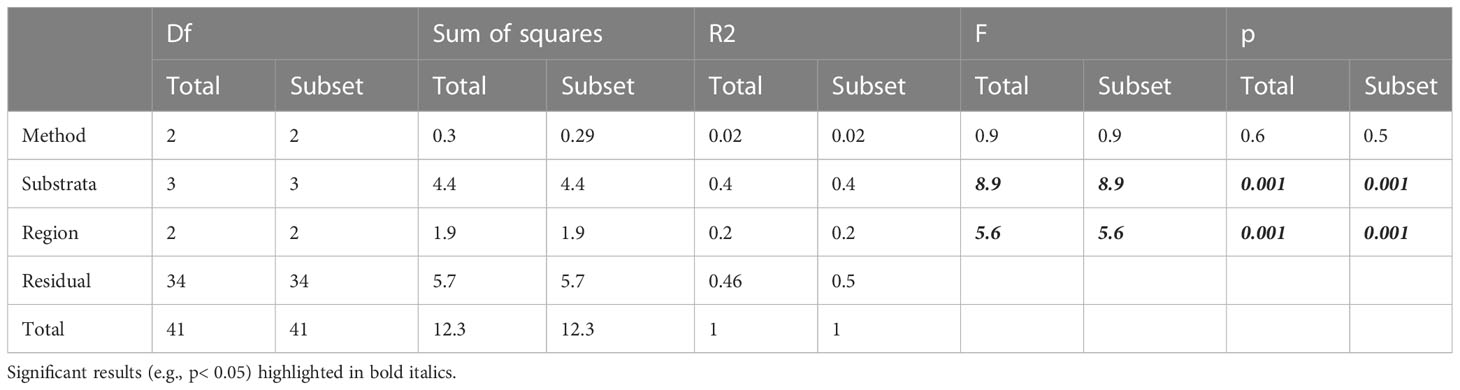
Table 3 PERMANOVA analysis of the influence of method (diver or ROV), survey substrata and region on the invasive species profiles for the entire suite of NIS detected (Total) and for the target subset (Subset).
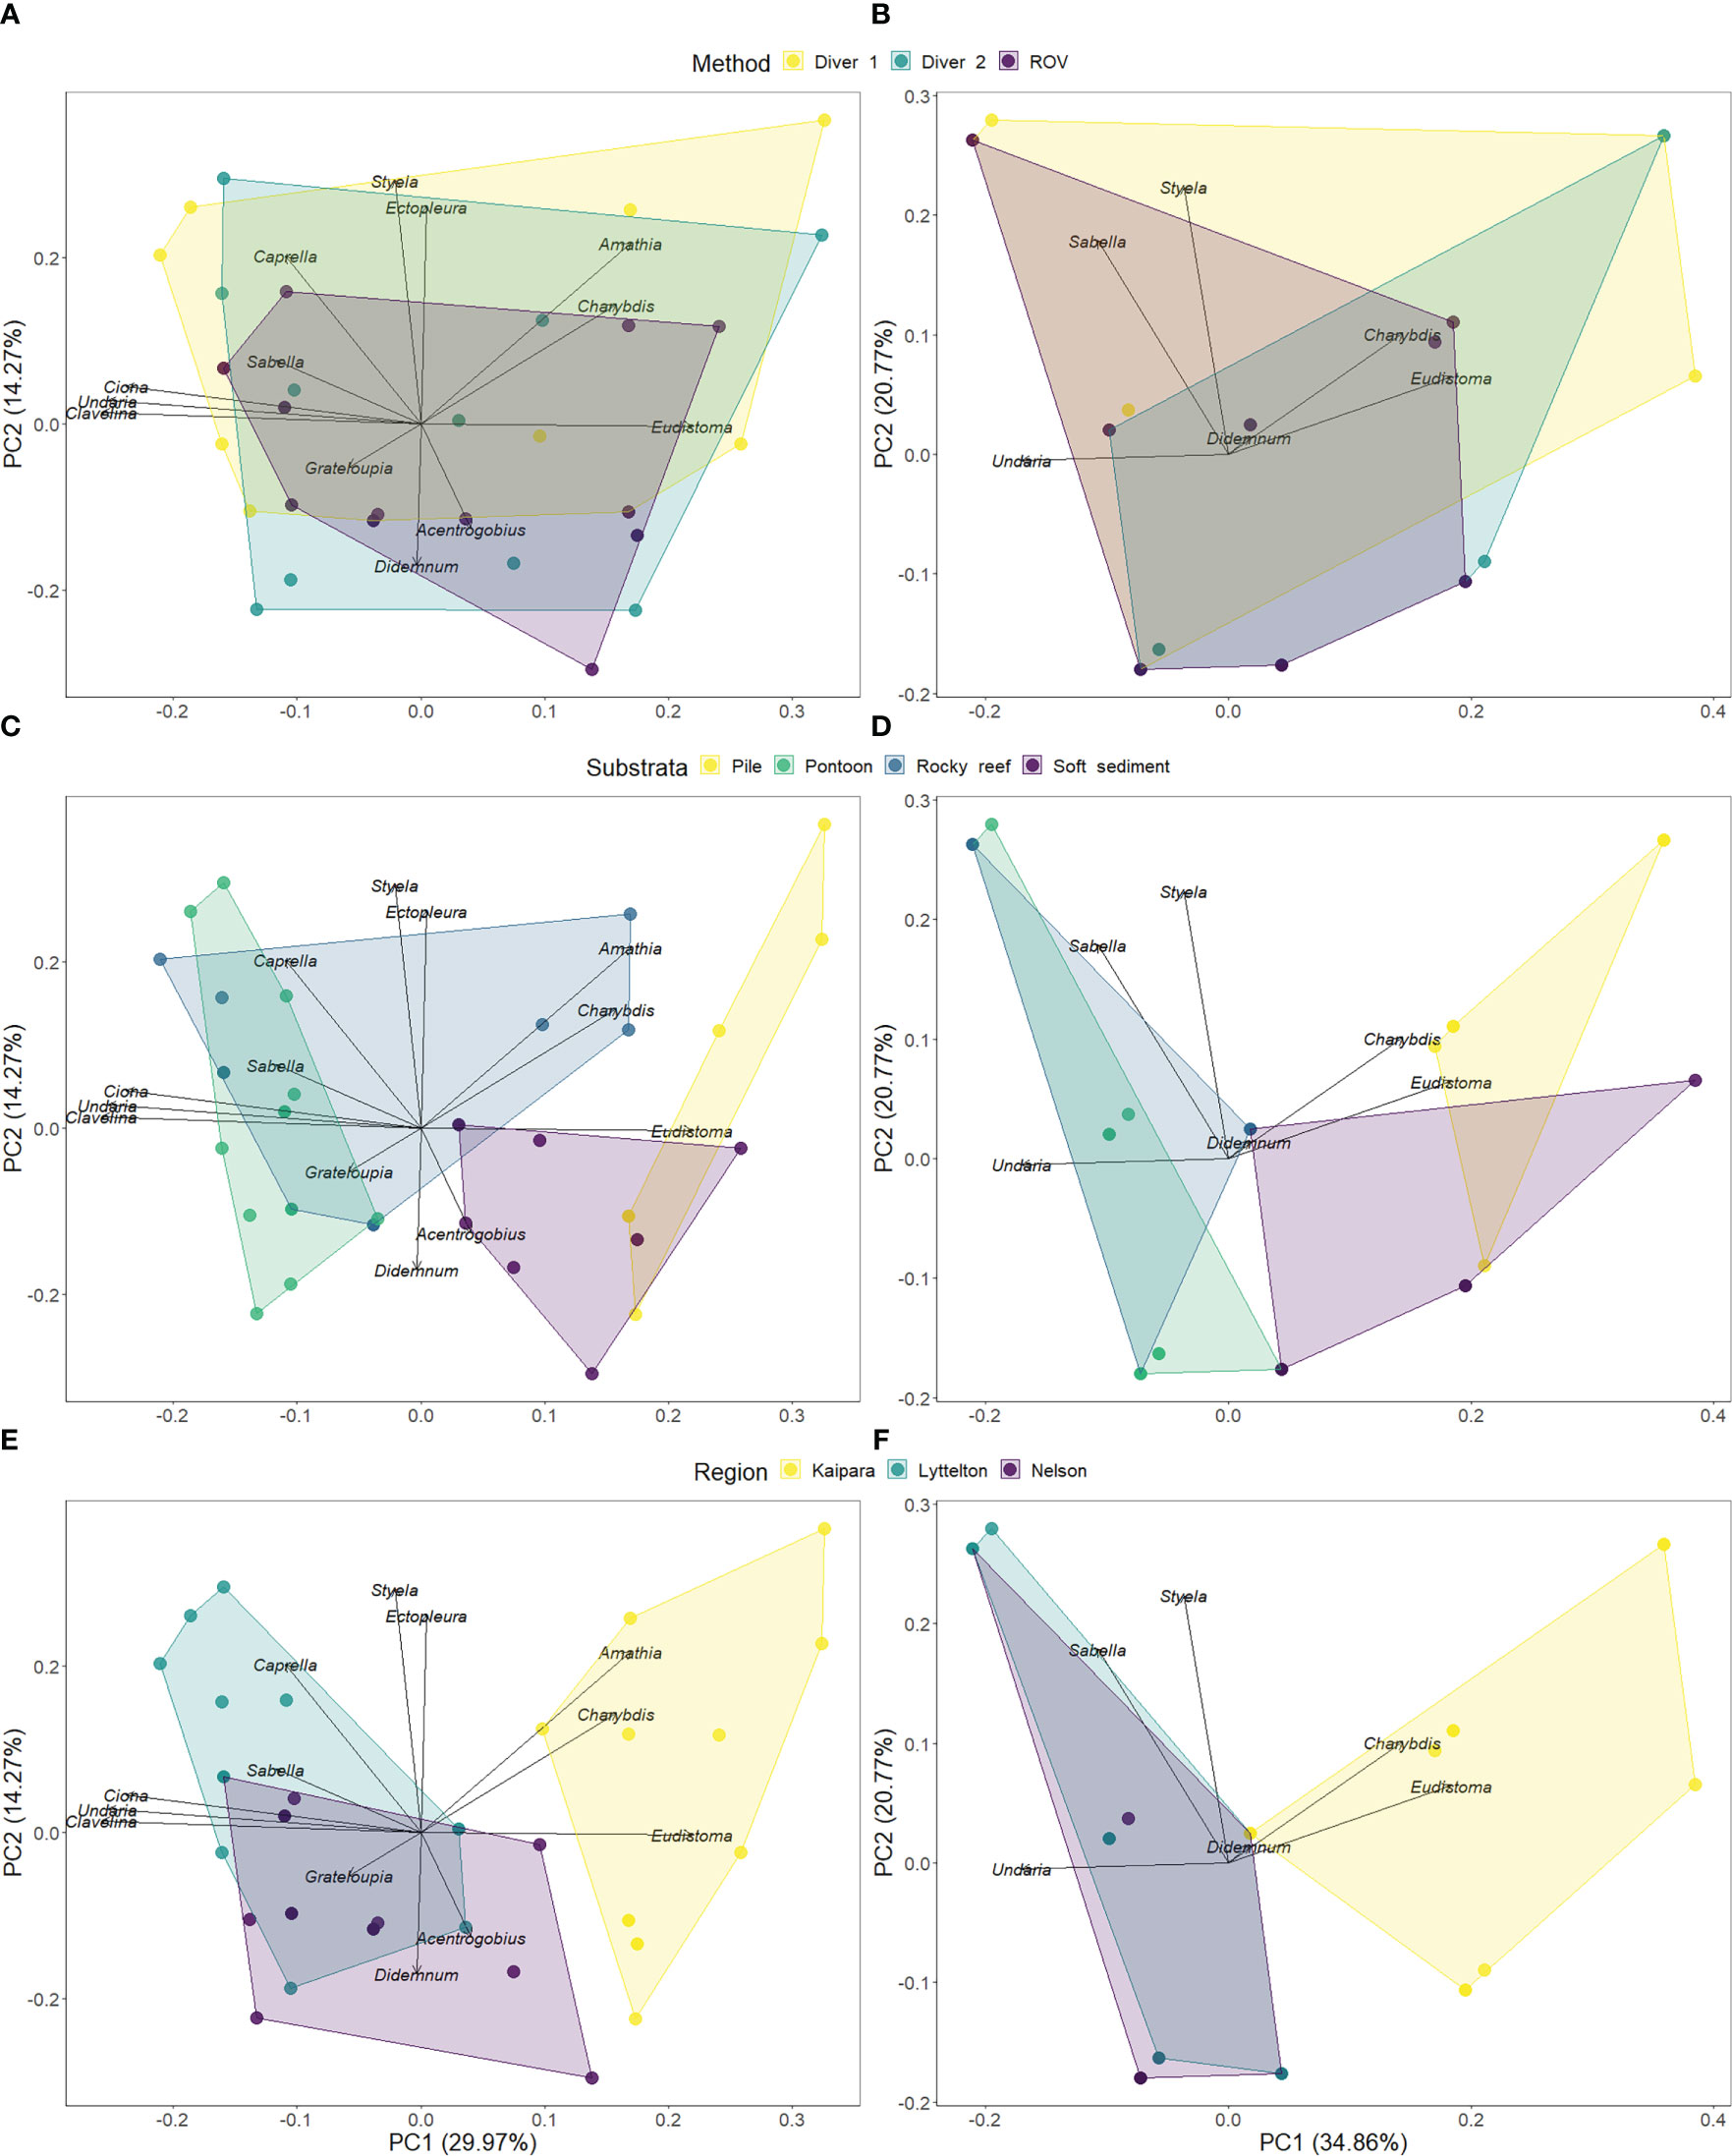
Figure 5 NIS assemblage composition detected at each replicate study site for each method (identified as coloured dots) as visualised in two-dimensional space. The spread of the points reflects the difference in the composition of species found at each site, with the contribution of each species to this spread indicated by the radiating vectors. The coloured polygons show the spread of detections encompassed within different factors (e.g., methods (A, B), habitats (C, D), and regions (E, F). Highly overlapping polygons reveal similar detection of species profiles, while non-overlapping polygons show unique species profiles. Principal Coordinate Analysis (PCA) plots are generated for the total NIS assemblage (A, D, E), and for a subset of the “targeted species” (B, D, F). For the total assemblage and the subset, each panel retains the same data, but changes in the presentation of the factors (i.e., method, habitat and region) to visualise overlap and separation of the NIS assemblages detected.
Species poorly detected by the ROV were relatively small organisms, including the skeleton shrimp Caprella mutica and the hydroid, Ectopleura crocea (Table S1). Furthermore, the ROV did not identify any of the Asian paddle crab (Charybdis (Charybdis) japonica) in Kaipara harbour which were observed by divers at the same location in sampling 24 hours apart (Table S1). However, the invasive goby Acentrogobius pflaumii was only detected by the ROV and not by divers at the same location one week later (Table S1). It is worth noting that while mobile organisms such as the crab Charybdis (japonica) japonica may have simply moved over 24 hours, the tendency of Acentrogobius pflaumii to hide in burrows means it may simply go un-noticed if disturbed.
The relative costs of diving and ROV assessments in terms of the number of people hours required to cover one hectare (ha) of seafloor showed that ROV methods were 1.8 times more expensive than divers and 2.4 times more expensive than divers if manual imagery review was required (Table 4). Both ROV and diver searches in low visibility environments (0.8 m secchi) were almost four times more expensive than searches in clear water (> 3 m secchi). The level of visibility had little impact on the relative expenses of ROV and diver-based methods (Table 4).
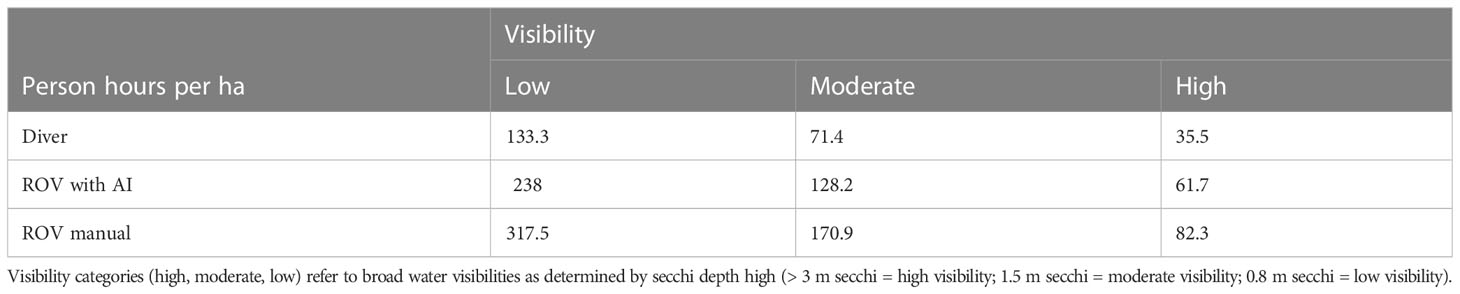
Table 4 Number of person hours required to cover 1 hectare (ha) of seafloor for ROV and divers expressed across varying degrees of turbidity.
Computer vision algorithms had no misidentification of non-indigenous tube worms as indigenous and vice versa. The independent test ROV survey video had high numbers of the non-indigenous tubeworms at various distances from the camera, providing a relatively challenging task for automated algorithms and experienced observers. Computer vision algorithms showed high agreement with expert-based video observations for the enumeration of the non-indigenous S. spallanzanii (Figure 6). There was, however, a trend of false negatives by the automated detector. Linear regression of the differential between detection by experts and the detector and the total number of specimens observed by experts showed a significant negative trend (t = -9.7, p< 0.001), indicating that increasing numbers of specimens lead to increasing ratios of false negatives by the detector. Higher agreement at lower densities shows that automated detectors provide fewer instances of false positives when presented with low numbers of Sabella spallanzanii. Overall, there were only three instances where computer vision detections exceeded expert detections by a single specimen.
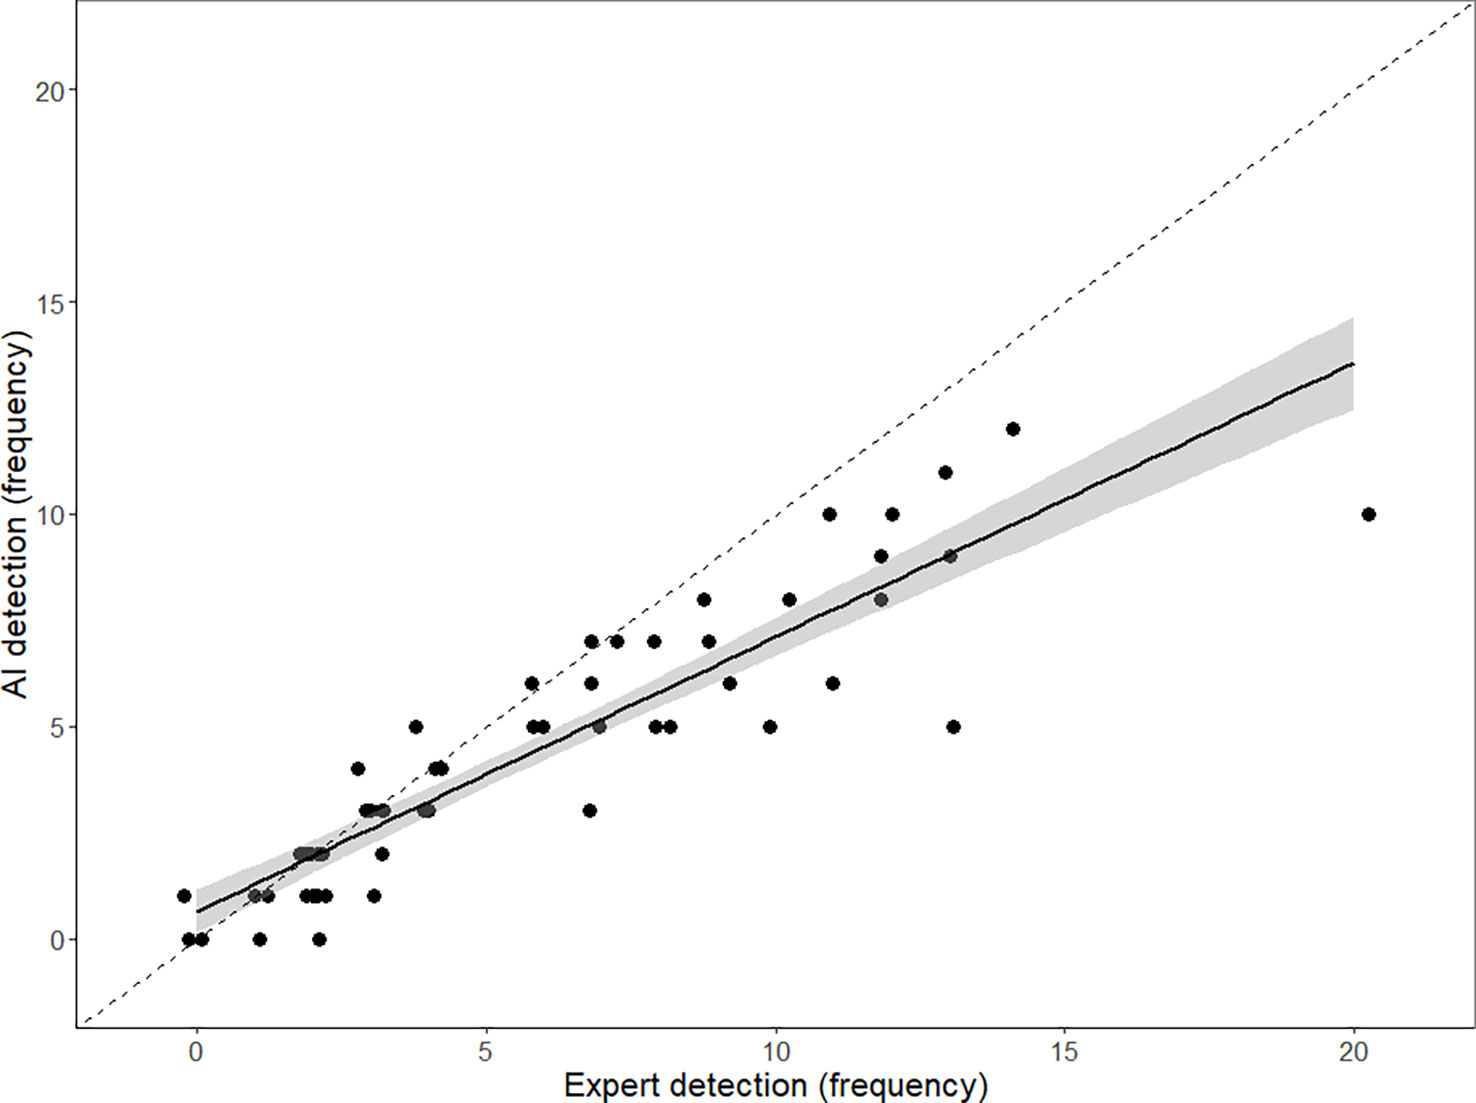
Figure 6 Expert and AI detection frequencies per frame. Linear regression and 95% CI. Dotted line shows perfect agreement. Note points “jittered” (by x = ± 0.2) to visualize the number of individual observations (n = 100).
Comparisons between scientific SCUBA divers and ROV revealed that divers were more efficient than ROVs in detecting NIS in certain surveillance situations, although there was no significant difference in sensitivity of invasive species detection for the full suite of NIS detected, and the subset of targeted high risk species. This differs slightly to previous findings that show both the sensitivity and efficiency of marine vessel inspections are higher for diver-based collections compared to camera-based ROV surveys (Peters et al., 2019). However, we show that video based ROV surveys compare well to visual diver surveys for the detection of NIS across a range of natural and artificial habitats.
Direct comparisons between diver-operated video and remote-operated video for benthic species richness metrics have revealed strong agreement (Biovida et al., 2015). Additionally, assessment of the comparability of ROVs and human snorkelers for identifying fish communities showed that ROVs detected greater abundance and diversity of fish (Raoult et al., 2020). Here we report the detection of an invasive fish Acentrogobius pflaumii by a small ROV, while divers were unable to detect this fish due to its ability to conceal itself in burrows. It is likely that at this low visibility site, A. pflaumii are sensitive to approaching divers and the noise of air exhalation and retreat into burrows before divers can detect them, whereas the quieter ROV can approach close enough without disturbing them.
Video-, or image-based analysis will always fall short of the taxonomic resolution outcomes from physical samples (Peters et al., 2019), however, collections of specimens are not always possible, and in many circumstances good quality imagery can provide high-level taxonomic information (Marshall and Evenhuis, 2015). Furthermore, machine learning algorithms are increasingly viable options for detecting organisms (Gaston and O’Neill, 2004; Wäldchen and Mäder, 2018) and we show that implementation of automated detection algorithms can substantially reduce costs associated with manual footage review in a marine biosecurity surveillance context. Care must be taken in the application of imagery alone for identification of NIS (Krell and Marshall, 2017), but the ubiquity of imagery-based techniques in marine systems necessitates that we optimise these products for a range of applications. Here we show that the use of automated detection algorithms in post-processing of video imagery can reduce the total costs of ROV surveys, but overall remote operated surveys were unable to match the efficiencies of dive teams. While it is no surprise that water visibility dramatically increased the cost of surveillance per unit area, the relative costs to diving and ROV surveys were the same.
Despite current inefficiencies of ROVs, further advancements in these technologies have the potential to approach the efficiencies of divers. Small ROVs are increasingly equipped with high-resolution cameras (e.g., 4k video) and lightweight manipulators (for sample collection). These platforms are also able to apply acoustic imaging systems (Kim and Yu, 2016), stereocamera systems (Negahdaripour and Firoozfam, 2006), and sampling systems (Mazzeo et al., 2022) that can provide further confirmation of NIS or improve operations under challenging conditions. Furthermore, with the application of underwater positioning systems, and real-time (or near real-time) detection algorithms, development of increasingly autonomous surveillance or analysis can pave the way for automated detection and geolocation of NIS at efficiencies far greater than any current method (Williams et al., 2016). This will also reduce capacity limitations and enable a greater variety of agencies and personnel to perform surveillance activities.
While we stress the power of experienced and trained biosecurity SCUBA divers for marine post-border surveillance, we acknowledge the physical, physiological and workforce limitations of these methods and provide support for the application of ROVs under specific scenarios too dangerous or challenging for divers. Such conditions include regions where dangerous marine animals are present, conditions of high tidal flushing, depths beyond c. 20 m depth, environments with especially high or erratic vessel traffic, and conditions where pollutants have the potential to affect human divers. We expect that remote operated and autonomous systems will soon become the standard for marine surveillance and establishing their limitations against gold standard methods will help identify current limitations and efficiency bottlenecks. Improvements in the swath-width of remote imaging systems provides a tangible path forward for immediate gains in efficiency of these systems.
As autonomous technologies increasingly become available for close range visual imaging, we must ensure that these technologies can be integrated seamlessly into existing monitoring or surveillance programmes. Part of this integration undoubtedly involves transition from human annotation to computer-vision recognition algorithms which will enable data-processing/analysis to keep pace with the exponential increase in data collection (Beyan and Browman, 2020). To ensure continuity of existing programmes, biases and limitations of existing or emerging technologies must be identified and quantified. We identify some limitations of camera-based ROV imaging compared to human divers and we present critical parameters required for autonomous or remote operated systems in turbid coastal environments.
Currently ROVs are unable to achieve the same efficiency as dive teams, but such systems may represent a stopgap while close-range visual imaging AUVs gain improved capabilities for navigating complex coastal environments (Gutnik et al., 2022). AUVs will eventually eclipse both methods in cost effectiveness and efficiency and greatly improve surveillance and monitoring of benthic marine ecosystems. We show that camera-based robotic surveys and integration of computer-vision algorithms can complement human-based surveillance programmes and could integrate additional emerging surveillance technologies (e.g., eDNA; Bowers et al., 2021) to provide platforms with both imaging and sampling capabilities (Yamahara et al., 2019).
The raw data supporting the conclusions of this article will be made available by the authors, without undue reservation.
LT and GI conceived the research. LT, LR, KS, LO, CW, and HL contributed to field and lab data collection, preparation, and analysis. JB contributed to the development of computer vision algorithms and analysis. LT, JB, HL, CW, KS, and GI contributed to manuscript preparation and review. All authors contributed to the article and approved the submitted version.
This research was supported by the New Zealand Government’s Strategic Science Investment Fund (SSIF; COBS2102, COBS2202, CEBS2302) to the National Institute of Water and Atmospheric Research (NIWA) and the Ministry for Primary Industries Marine High Risk Site Surveillance programme (SOW18048). Additionally, field logistics in Kaipara Harbour were supported by Auckland Council and Northland Regional Council.
We acknowledge the assistance of several technical staff in the field campaigns, including Megan Carter, Jon Stead, Matt Smith, Dane Buckthought, Richie Hughes, and Ann Parkinson. We also thank Roberta D’Archino, Dennis Gordon, and Mike Page for taxonomic identification of diver sampled organisms. We also thank Auckland Council staff and associated students (Samantha Happy, Melanie Vaughan, Hayley Nessia, and Kyle Hilliam) for field support during the Kaipara field sampling, and MPI (Abraham Growcott) for contributing via the NMHRSS programme (SOW18048).
All authors were employed by National Institute of Water and Atmospheric Research Ltd.
All claims expressed in this article are solely those of the authors and do not necessarily represent those of their affiliated organizations, or those of the publisher, the editors and the reviewers. Any product that may be evaluated in this article, or claim that may be made by its manufacturer, is not guaranteed or endorsed by the publisher.
The Supplementary Material for this article can be found online at: https://www.frontiersin.org/articles/10.3389/fmars.2023.1102506/full#supplementary-material
Supplementary Table 1 | Full list of non-indigenous species detected by Diver 1, Diver 2, and ROV across three harbours. Species detected at least once by each method are indicated by a tick, whereas species not detected by that method at any sites are indicated by a cross.
Andaloro F., Ferraro M., Mostarda E., Romeo T., Consoli P. (2013). Assessing the suitability of a remotely operated vehicle (ROV) to study the fish community associated with offshore gas platforms in the Ionian Sea: A comparative analysis with underwater visual censuses (UVCs). Helgoland marine research, 67 (2), 241–250.
Arthur T., Arrowsmith L., Parsons S., Summerson R. (2015). Monitoring for marine pests: A review of the design and use of australia’s national monitoring strategy and identification of possible improvements. ABARES Client Rep. prepared by Aust. Bureau Agric. Resource Economics Sci, 2015, 63.
Atalah J., Floerl O., Pochon X., Townsend M., Tait L., Lohrer A. M. (2019). The introduced fanworm, sabella spallanzanii, alters soft sediment macrofauna and bacterial communities. Front. Ecol. Evol. 7, 481. doi: 10.3389/fevo.2019.00481
Barsky S. M. (2006). Hidden dangers. contaminated water diving: the risks divers don’t want to acknowledge The Journal of the South Pacific Underwater Medicine Society. Diving and hyperbaric medicine 36, (1), 35.
Bax R., Bywater R., Cornaglia G., Goossens H., Hunter P., Isham V., et al. (2001). Surveillance of antimicrobial resistance–what, how and whither? Clin. Microbiol. Infection 7 (6), 316–325. doi: 10.1046/j.1198-743x.2001.00239.x
Beisiegel K., Darr A., Gogina M., Zettler M. L. (2017). Benefits and shortcomings of non-destructive benthic imagery for monitoring hard-bottom habitats. Mar. pollut. Bull. 121 (1-2), 5–15. doi: 10.1016/j.marpolbul.2017.04.009
Beyan C., Browman H. I. (2020). Setting the stage for the machine intelligence era in marine science. ICES J. Mar. Sci. 77 (4), pp.1267–1273. doi: 10.1093/icesjms/fsaa084
Boavida J., Assis J., Reed J., Serrão E. A., Gonçalves J. (2016). Comparison of small remotely operated vehicles and diver-operated video of circalittoral benthos. Hydrobiologia 766 (1), 247–260. doi: 10.1007/s10750-015-2459-y
Bonin-Font F., Campos M. M., Codina G. O. (2016). Towards visual detection, mapping and quantification of posidonia oceanica using a lightweight AUV. IFAC-PapersOnLine 49 (23), 500–505. doi: 10.1016/j.ifacol.2016.10.485
Bowers H. A., Pochon X., von Ammon U., Gemmell N., Stanton J. A. L., Jeunen G. J., et al. (2021). Towards the optimization of eDNA/eRNA sampling technologies for marine biosecurity surveillance. Water 13 (8), 1113. doi: 10.3390/w13081113
Buscher E., Mathews D. L., Bryce C., Bryce K., Joseph D., Ban N. C. (2020). Applying a low cost, mini remotely operated vehicle (ROV) to assess an ecological baseline of an indigenous seascape in Canada. Front. Mar. Sci. 7, 669. doi: 10.3389/fmars.2020.00669
Caccia M., Robino R., Bateman W., Eich M., Ortiz A., Drikos L., et al. (2010). MINOAS a marine INspection rObotic assistant: system requirements and design. IFAC Proc. Volumes 43 (16), pp.479–pp.484. doi: 10.3182/20100906-3-IT-2019.00083
Capocci R., Dooly G., Omerdić E., Coleman J., Newe T., Toal D. (2017). Inspection-class remotely operated vehicles–a review. J. Mar. Sci. Eng. 5 (1), 13. doi: 10.3390/jmse5010013
Cook J., Coutts A. (2017). “The growing role of underwater robotics as a first line of defence for protecting australia’s marine ecosystems,” in Australasian Coasts & ports 2017: Working with nature (Barton: ACT: Engineers Australia, PIANC Australia and Institute of Professional Engineers New Zealand), 268–274.
Cunningham S., Teirney L., Brunton J., McLeod R., Bowman R., Richards D., et al. (2019). Mitigating the threat of invasive marine species to fiordland: New zealand’s first pathway management plan. Manage. Biol. Invasions 10 (4), 690–708. doi: 10.3391/mbi.2019.10.4.07
Davidson I., Ruiz G., Sytsma M. (2006a). Comparing methodologies for assessing vessel biofouling: dry dock, diver and ROV sampling. (Aquatic Bioinvasion Research and Policy Institute. Final Report for California State Lands Commission., California, USA.)
Davidson I., Ruiz G., Sytsma M. (2006b). Protocols for sampling commercial vessel biofouling using remotely operated vehicle (ROV). (Aquatic Bioinvasion Research and Policy Institute. Final Report for California State Lands Commission., California, USA).
Douglas E. J., Townsend M., Tait L. W., Greenfield B. L., Inglis G. J., Lohrer A. M. (2020). Sabella spallanzanii and seafloor biodiversity enhancement in a marine soft-sediment system. Diversity 12 (6), 228. doi: 10.3390/d12060228
Eich M., Bonnin-Pascual F., Garcia-Fidalgo E., Ortiz A., Bruzzone G., Koveos Y., et al. (2014). A robot application for marine vessel inspection. J. Field Robotics 31 (2), 319–341. doi: 10.1002/rob.21498
Floerl O., Coutts A. (2011). Feasibility of using remotely operated vehicles (ROVs) for vessel biofouling inspections. prepared for Western Australian department of fisheries. Fisheries Occasional Publ. No 117, 2013.
Gaston K. J., O’Neill M. A. (2004). Automated species identification: Why not? philosophical transactions of the royal society of London. Ser. B: Biol. Sci. 359 (1444), 655–667. doi: 10.1098/rstb.2003.1442
Gutnik Y., Avni A., Treibitz T., Groper M. (2022). On the adaptation of an auv into a dedicated platform for close range imaging survey missions. J. Mar. Sci. Eng. 10 (7), 974. doi: 10.3390/jmse10070974
Hatami R., Inglis G., Lane S. E., Growcott A. (2022). Modelling the likelihood of entry of marine non-indigenous species from internationally arriving vessels to maritime ports: A case study using new Zealand data. NeoBiota 72, 183–203. doi: 10.3897/neobiota.72.77266
Horton T., Marsh L., Bett B. J., Gates A. R., Jones D. O., Benoist N., et al. (2021). Recommendations for the standardisation of open taxonomic nomenclature for image-based identifications. Front. Mar. Sci. 62. doi: 10.3389/fmars.2021.620702
Inglis G. J., Hurren H., Oldman J., Haskew R. (2006). Using habitat suitability index and particle dispersion models for early detection of marine invaders. Ecol. Appl. 16 (4), 1377–1390. doi: 10.1890/1051-0761(2006)016[1377:UHSIAP]2.0.CO;2
Jothiswaran V. V., Velumani T., Jayaraman R. (2020). Application of artificial intelligence in fisheries and aquaculture. Biotica Res. Today 2 (6), 499–502.
Kim J., Yu S. C. (2016). Convolutional neural network-based real-time ROV detection using forward-looking sonar image. 2016 IEEE/OES Autonomous Underwater Vehicles (AUV), 396–400. doi: 10.1109/AUV.2016.7778702
Krell F. T., Marshall S. A. (2017). New species described from photographs: Yes? no? sometimes? a fierce debate and a new declaration of the ICZN. Insect Systematics Diversity 1 (1), 3–19. doi: 10.1093/isd/ixx004
Lam K., Shin P. K., Bradbeer R., Randall D., Ku K. K., Hodgson P., et al. (2006). A comparison of video and point intercept transect methods for monitoring subtropical coral communities. J. Exp. Mar. Biol. Ecol. 333 (1), 115–128. doi: 10.1016/j.jembe.2005.12.009
Lehtiniemi M., Ojaveer H., David M., Galil B. (2015). Dose of truth–monitoring marine non-indigenous species to serve legislative requirements. Mar. Policy 54, 26–35. doi: 10.1016/j.marpol.2014.12.015
MacAulay S., Ellison A. R., Kille P., Cable J. (2022). Moving towards improved surveillance and earlier diagnosis of aquatic pathogens: From traditional methods to emerging technologies. Rev. Aquaculture, 1–17. doi: 10.1111/raq.12674
Macreadie P. I., McLean D. L., Thomson P. G., Partridge J. C., Jones D. O., Gates A. R., et al. (2018). Eyes in the sea: unlocking the mysteries of the ocean using industrial, remotely operated vehicles (ROVs). Sci. Total Environ. 634, 1077–1091. doi: 10.1016/j.scitotenv.2018.04.049
Marshall S. A., Evenhuis N. L. (2015). New species without dead bodies: a case for photo-based descriptions, illustrated by a striking new species of marleyimyia hesse (Diptera, bombyliidae) from south Africa. ZooKeys 525), 117.
Mazzeo A., Aguzzi J., Calisti M., Canese S., Vecchi F., Stefanni S., et al. (2022). Marine robotics for deep-sea specimen collection: A systematic review of underwater grippers. Sensors 22 (2), 648. doi: 10.3390/s22020648
McDonald J. I., Wellington C. M., Coupland G. T., Pedersen D., Kitchen B., Bridgwood S. D., et al. (2020). A united front against marine invaders: Developing a cost-effective marine biosecurity surveillance partnership between government and industry. J. Appl. Ecol. 57 (1), 77–84. doi: 10.1111/1365-2664.13557
McLean D. L., Taylor M. D., Ospina A. G., Partridge J. C. (2019). An assessment of fish and marine growth associated with an oil and gas platform jacket using an augmented remotely operated vehicle. Continental Shelf Res. 179, 66–84. doi: 10.1016/j.csr.2019.04.006
Mohanty S. P., Hughes D. P., Salathé M. (2016). Using deep learning for image-based plant disease detection. Front. Plant Sci. 7, 1419. doi: 10.3389/fpls.2016.01419
Myers J. H., Simberloff D., Kuris A. M., Carey J. R. (2000). Eradication revisited: dealing with exotic species. Trends Ecol. Evol. 15 (8), 316–320. doi: 10.1016/S0169-5347(00)01914-5
Negahdaripour S., Firoozfam P. (2006). An ROV stereovision system for ship-hull inspection. IEEE J. Oceanic Eng. 31 (3), 551–564. doi: 10.1109/JOE.2005.851391
Oksanen J. (2007). Vegan: community ecology package (R package version 1), 8–5. Available at: http://www.cran.r-project.org.
Pacunski R. E., Palsson W. A., Greene H. G., Gunderson D. (2008). Conducting visual surveys with a small ROV in shallow water. Mar. habitat Mapp. Technol. Alaska, 109–128. doi: 10.4027/mhmta.2008.08
Peters K., Sink K. J., Robinson T. B. (2019). Sampling methods and approaches to inform standardized detection of marine alien fouling species on recreational vessels. J. Environ. Manage. 230, 159–167. doi: 10.1016/j.jenvman.2018.09.063
Raoult V., Tosetto L., Harvey C., Nelson T. M., Reed J., Parikh A., et al. (2020). Remotely operated vehicles as alternatives to snorkellers for video-based marine research. J. Exp. Mar. Biol. Ecol. 522, 151253. doi: 10.1016/j.jembe.2019.151253
RStudio Team (2020). RStudio: Integrated development for r (Boston, MA: RStudio, PBC). Available at: http://www.rstudio.com/.
Sammarco P. W., Porter S. A., Cairns S. D. (2010). A new coral species introduced into the Atlantic ocean tubastraea micranthus (Ehrenberg 1834)(Cnidaria, anthozoa, scleractinia): an invasive threat? Aquat. Invasions. doi: 10.3391/ai.2010.5.2.02
Seaward K., Acosta H., Inglis G. J., Wood B., Riding T. A., Wilkens S., et al. (2015). The marine biosecurity porthole–a web-based information system on non-indigenous marine species in new Zealand.
Soliman T., Inglis G. J. (2018). Forecasting the economic impacts of two biofouling invaders on aquaculture production of green-lipped mussels perna canaliculus in new Zealand. Aquaculture Environ. Interact. 10, 1–12. doi: 10.3354/aei00249
Tait L. W., Lohrer A. M., Townsend M., Atalah J., Floerl O., Inglis G. J. (2020). Invasive ecosystem engineers threaten benthic nitrogen cycling by altering native infaunal and biofouling communities. Sci. Rep. 10 (1), 1–11. doi: 10.1038/s41598-020-58557-8
Tamburini M., Keppel E., Marchini A., Repetto M. F., Ruiz G. M., Ferrario J., et al. (2021). Monitoring non-indigenous species in port habitats: First application of a standardized north American protocol in the Mediterranean Sea. Front. Mar. Sci. 8. doi: 10.3389/fmars.2021.700730
Wäldchen J., Mäder P. (2018). Machine learning for image based species identification. Methods Ecol. Evol. 9 (11), 2216–2225. doi: 10.1111/2041-210X.13075
Wells F. (2011). Monitoring for introduced marine pests for the gorgon LNG project. APPEA J. 51 (2), 674–674. doi: 10.1071/AJ10054
Williams S. B., Pizarro O., Steinberg D. M., Friedman A., Bryson M. (2016). Reflections on a decade of autonomous underwater vehicles operations for marine survey at the Australian centre for field robotics. Annu. Rev. Control 42, 158–165. doi: 10.1016/j.arcontrol.2016.09.010
Woodall L. C., Andradi-Brown D. A., Brierley A. S., Clark M. R., Connelly D., Hall R. A., et al. (2018). A multidisciplinary approach for generating globally consistent data on mesophotic, deep-pelagic, and bathyal biological communities. Oceanography 31 (3), 76–89. doi: 10.5670/oceanog.2018.301
Woods C., Seaward K., Pryor Rodgers L., Buckthought D., Carter M., Lyon W., et al. (2018). Marine high risk site surveillance. Annu. Synopsis Rep. All High Risk Sites 2019.
Wotton D. M., Hewitt C. L. (2004). Marine biosecurity post-border management: Developing incursion response systems for New Zealand. New Z. J. Mar. Freshw. Res. 38 (3), 553–559. doi: 10.1080/00288330.2004.9517260
Yamahara K. M., Preston C. M., Birch J., Walz K., Marin R. III, Jensen S., et al. (2019). In situ autonomous acquisition and preservation of marine environmental DNA using an autonomous underwater vehicle. Front. Mar. Sci. 6, 373. doi: 10.3389/fmars.2019.00373
Keywords: biosecurity, invasive species, computer vision, artificial intelligence, remote operated vehicle
Citation: Tait LW, Bulleid J, Rodgers LP, Seaward K, Olsen L, Woods C, Lane H and Inglis GJ (2023) Towards remote surveillance of marine pests: A comparison between remote operated vehicles and diver surveys. Front. Mar. Sci. 10:1102506. doi: 10.3389/fmars.2023.1102506
Received: 19 November 2022; Accepted: 23 February 2023;
Published: 14 March 2023.
Edited by:
Xavier Pochon, The University of Auckland, New ZealandReviewed by:
Damianos Chatzievangelou, Spanish National Research Council (CSIC), SpainCopyright © 2023 Tait, Bulleid, Rodgers, Seaward, Olsen, Woods, Lane and Inglis. This is an open-access article distributed under the terms of the Creative Commons Attribution License (CC BY). The use, distribution or reproduction in other forums is permitted, provided the original author(s) and the copyright owner(s) are credited and that the original publication in this journal is cited, in accordance with accepted academic practice. No use, distribution or reproduction is permitted which does not comply with these terms.
*Correspondence: Leigh W. Tait, bGVpZ2gudGFpdEBuaXdhLmNvLm56
Disclaimer: All claims expressed in this article are solely those of the authors and do not necessarily represent those of their affiliated organizations, or those of the publisher, the editors and the reviewers. Any product that may be evaluated in this article or claim that may be made by its manufacturer is not guaranteed or endorsed by the publisher.
Research integrity at Frontiers
Learn more about the work of our research integrity team to safeguard the quality of each article we publish.