 Long-Fei Huang
 Xiao-Mei Xu
 Liang-Liang Yang
 Shen-Qin Huang1
 Xin-Hai Zhang
- 1Key Laboratory of Underwater Acoustic Communication and Marine Information Technology of The Ministry of Education, College of Ocean and Earth Sciences, Xiamen University, Xiamen, Fujian, China
- 2Guangdong Provincial Key Laboratory of Marine Disaster Prediction and Prevention, Shantou University, Shantou, China
- 3Institute of Marine Science, Shantou University, Shantou, China
Geotechnical survey is an important prerequisite to the construction of offshore wind farms. However, the impact of underwater survey noises has not yet been studied in details. In this paper, we studied transmission of underwater noises from offshore exploratory drilling (OED) at the Xiamen port. The noises were categorized into three types: hammering noises (hammering down of casings, which were 180-mm diameter steel pipes), vibrating noises (vibration of casings that had been hammered down), and drilling noises (generated during the borehole drilling process). We considered the variation in intensity of these three noise types, and set up two fixed and one movable stations to measure and analyze the source and propagation characteristics of these noises. The results indicate that hammering noise is an impulsive sound with a dominant frequency below 10 kHz, and source levels (SLs) of 197.1 dB re 1μPa @ 1 m (rms over 95% energy duration. 1–64,000 Hz) and 212.9 dB re 1μPa @ 1 m (peak). Vibrating and drilling noises are non-impulsive sounds with the fundamental frequencies of 41 Hz and 45 Hz, and SLs of 158.9 dB re 1μPa rms @ 1 m and 155.9 dB re 1μPa rms @ 1 m, respectively. The impact assessment of OED noises on five groups of marine mammals with different audible frequency ranges (Low (LF), High (HF), and Very High (VHF) frequency cetaceans, sirenians (SI), and phocid pinnipeds (PW)) demonstrates that hammering noise can induce a high risk of hearing damage to their hearing, at as far as 300 meters for VHF group, while drilling noise can only induce hearing damage at about 40 meters. Marine mammals are susceptible to behavior alteration, with a detectable distance of 1.9 km from the source, and it is recommended to set a warning zone with a radius of 1.9 km during OED construction.
1 Introduction
With the advantages of sufficient wind resources, no occupation of land resources, and proximity to power load centers (e.g., megalopolis) along the coasts, offshore wind farms (OWFs) have become the treasure of energy market and rapidly developed across the globe. However, the development and operation of OWFs will generate a series of anthropogenic underwater noises, changing the ocean soundscape over a wide area. Most OWFs employ fixed-foundation wind turbines in the near-coastal within 50 m water depth, where inhabited kinds of marine mammals (Thomsen et al., 2006). Marine mammals, which mostly rely on sound for spatial orientation, communication, and predation, are very sensitive to changes in ocean soundscape (Wartzok and Ketten, 1999; Richardson et al., 2013; Haver et al., 2018). OWFs’ noises may adversely affect marine mammals, including behavior alteration, hearing damage, physical injury, and even mortality (Ketten et al., 1993). In order to mitigate these potential effects, it is vital to measure and analyze the underwater noises during the OWFs lifecycle, and further assess the impacts of these noises on marine mammals (Díaz and Soares, 2020).
The lifecycle of an OWF can be split into four phases: pre-construction (geotechnical survey), construction, operation, and decommissioning (Nedwell and Howell, 2004; Popper et al., 2022). Underwater noises generated during the construction phase, such as pile driving noise (Herbert-Read et al., 2017; Branstetter et al., 2018; Guan and Miner, 2020) and power cable laying noise (Nedwell et al., 2003; Nedwell et al., 2012; Bald et al., 2015), and noises during the operation phase, such as the radiated underwater noise from wind turbines (Pangerc et al., 2016; Yang et al., 2018), have been monitored and analyzed. Additionally, concerns about the decommissioning noises have been heating up in recent years as more and more early-built OWFs reach their end of operational life (Fowler et al., 2018; Hall et al., 2020; Hall et al., 2022).
In contrast, research on underwater noises during the OWFs geotechnical survey phase is still scarce (Mooney et al., 2020; Popper et al., 2022). Offshore exploratory drilling (OED) is one of the most common methods in the phase, and the operating platform used for OED can be divided into two categories (Fugro Marine GeoServices, Inc 2017): standard vessel (use anchors or dynamic positioning systems to keep platforms on position) and jack-up platform (use three or four piles inserted into the seabed to lift and fix platforms above the sea surface). Jack-up platform has most machinery well above the water line, while the hull of standard vessel has good coupling with the water (Kyhn et al., 2014; Shonberg et al., 2017; Todd et al., 2020), which may result in different acoustic characteristics of OED noises. Jack-up platforms are primarily used on offshore oil (gas) exploration and exploitation projects (Erbe and McPherson, 2017; Jiménez-Arranz et al., 2020) measured the source level (SL) of geotechnical drilling noise on Sideson II jack-up rig is 142–145 dB re 1μPa rms @ 1 m (30–2000 Hz, 83 mm diameter drill rod), and Todd et al. (2020) measured the received level of underwater noises from Noble Kolskaya jack-up exploration drilling rig is 120 dB re 1μPa rms @ 41 m (2–1400 Hz). OWFs prefer to conduct OED on standard vessels because of the lower cost, deeper working depths and greater mobility (Maynard and Schneider, 2010). However, to date there has been no detailed analysis of underwater noises during OED on standard vessels.
In this paper, underwater survey noises of OED on a standard vessel were monitored in an offshore area of Xiamen, China. The OED noises were categorized into three types: hammering noise (generated by hammering down casings), vibrating noise (generated by vibrating down casings), and drilling noise (generated by borehole drilling). Considering the possible intensity variations of the three kinds of noise, two fixed and one movable measurement stations were set to obtain the accurate source intensity and propagation characteristics. Based on the measured data, the statistics [mean, standard deviation, and ranges (min–max)] of root-mean-square (rms) and zero-to-peak (peak) sound pressure levels, and sound exposure levels (SEL) were calculated, and the information on the time domains, frequency domains, and spectrograms were given in detail. Besides, by combining the auditory weighted SEL with the marine mammal noise exposure criteria, this paper further assessed the noise impacts (hearing damage and behavior alteration) on marine mammals (hearing groups of LF, HF, VHF, SI, and PW).
2 Materials and methods
2.1 Field operation
The study site was located in a sea area approximately 3 km from the coast of Xiamen, China. OED was conducted on a standard vessel of 45 m in length and 14 m in width (Figure 1A) that used 4-point anchor spread to remain in a stable location. A drilling platform of 2 m in length was welded to the deck on the middle side of the hull, and the rig derrick (Figure 1C3) was installed on the platform. OED rotated the drill rod to make the diamond bit (Figure 1C5), at the end of drill rod) grinding the soil and rock layer to obtain the cylindrical soil samples (Figure 1C6) and rock samples (Figure 1C7), and used steel casings (Figure 1C4) to protect the borehole. The specific steps are as follows (Figure 1B):
1. Hammering down casings with a hammer (Figure 1C1). After the drilling platform was in position, a 200 kg hammer was lifted to a height of 1.5–2 m and then released instantaneously to impact casings (180 mm diameter) at an interval of approximately 3 s, until the end of casings penetrated into the hard soil layer. This step was to prevent the borehole from collapsing in the loose soil layer during borehole drilling, and it lasted about 30 min in total (excluding the time to extend casings).
2. Vibrating down casings with a vibrator (Figure 1C2). The vibrator generated high-frequency vibrations to liquefy the soil structure and reduce the frictional resistance between the casing and soil, and then casings continued to be driven into the ground by the weight of casings and vibrator until the end of casings encountered the stiff fine-grained layer (about 3–5 m below the seabed). Switching from hammer to vibrator was to avoid damaging casings because of the strong instantaneous impact between the casing and hard soil. This step also lasted about 30 min.
3. Borehole drilling. A steel hollow drill rod (91 mm diameter) was lowered inside casings and driven by a motor to rotate advance along the soil and rock layers in 300 rpm. The diamond bit drilled and cut the soil (rock) layer to obtain cylindrical samples, until the bit reached the fixed depth (about 10 m below the bedrock). This step lasted approximately 20 hours because of the high hardness of the rock layer.
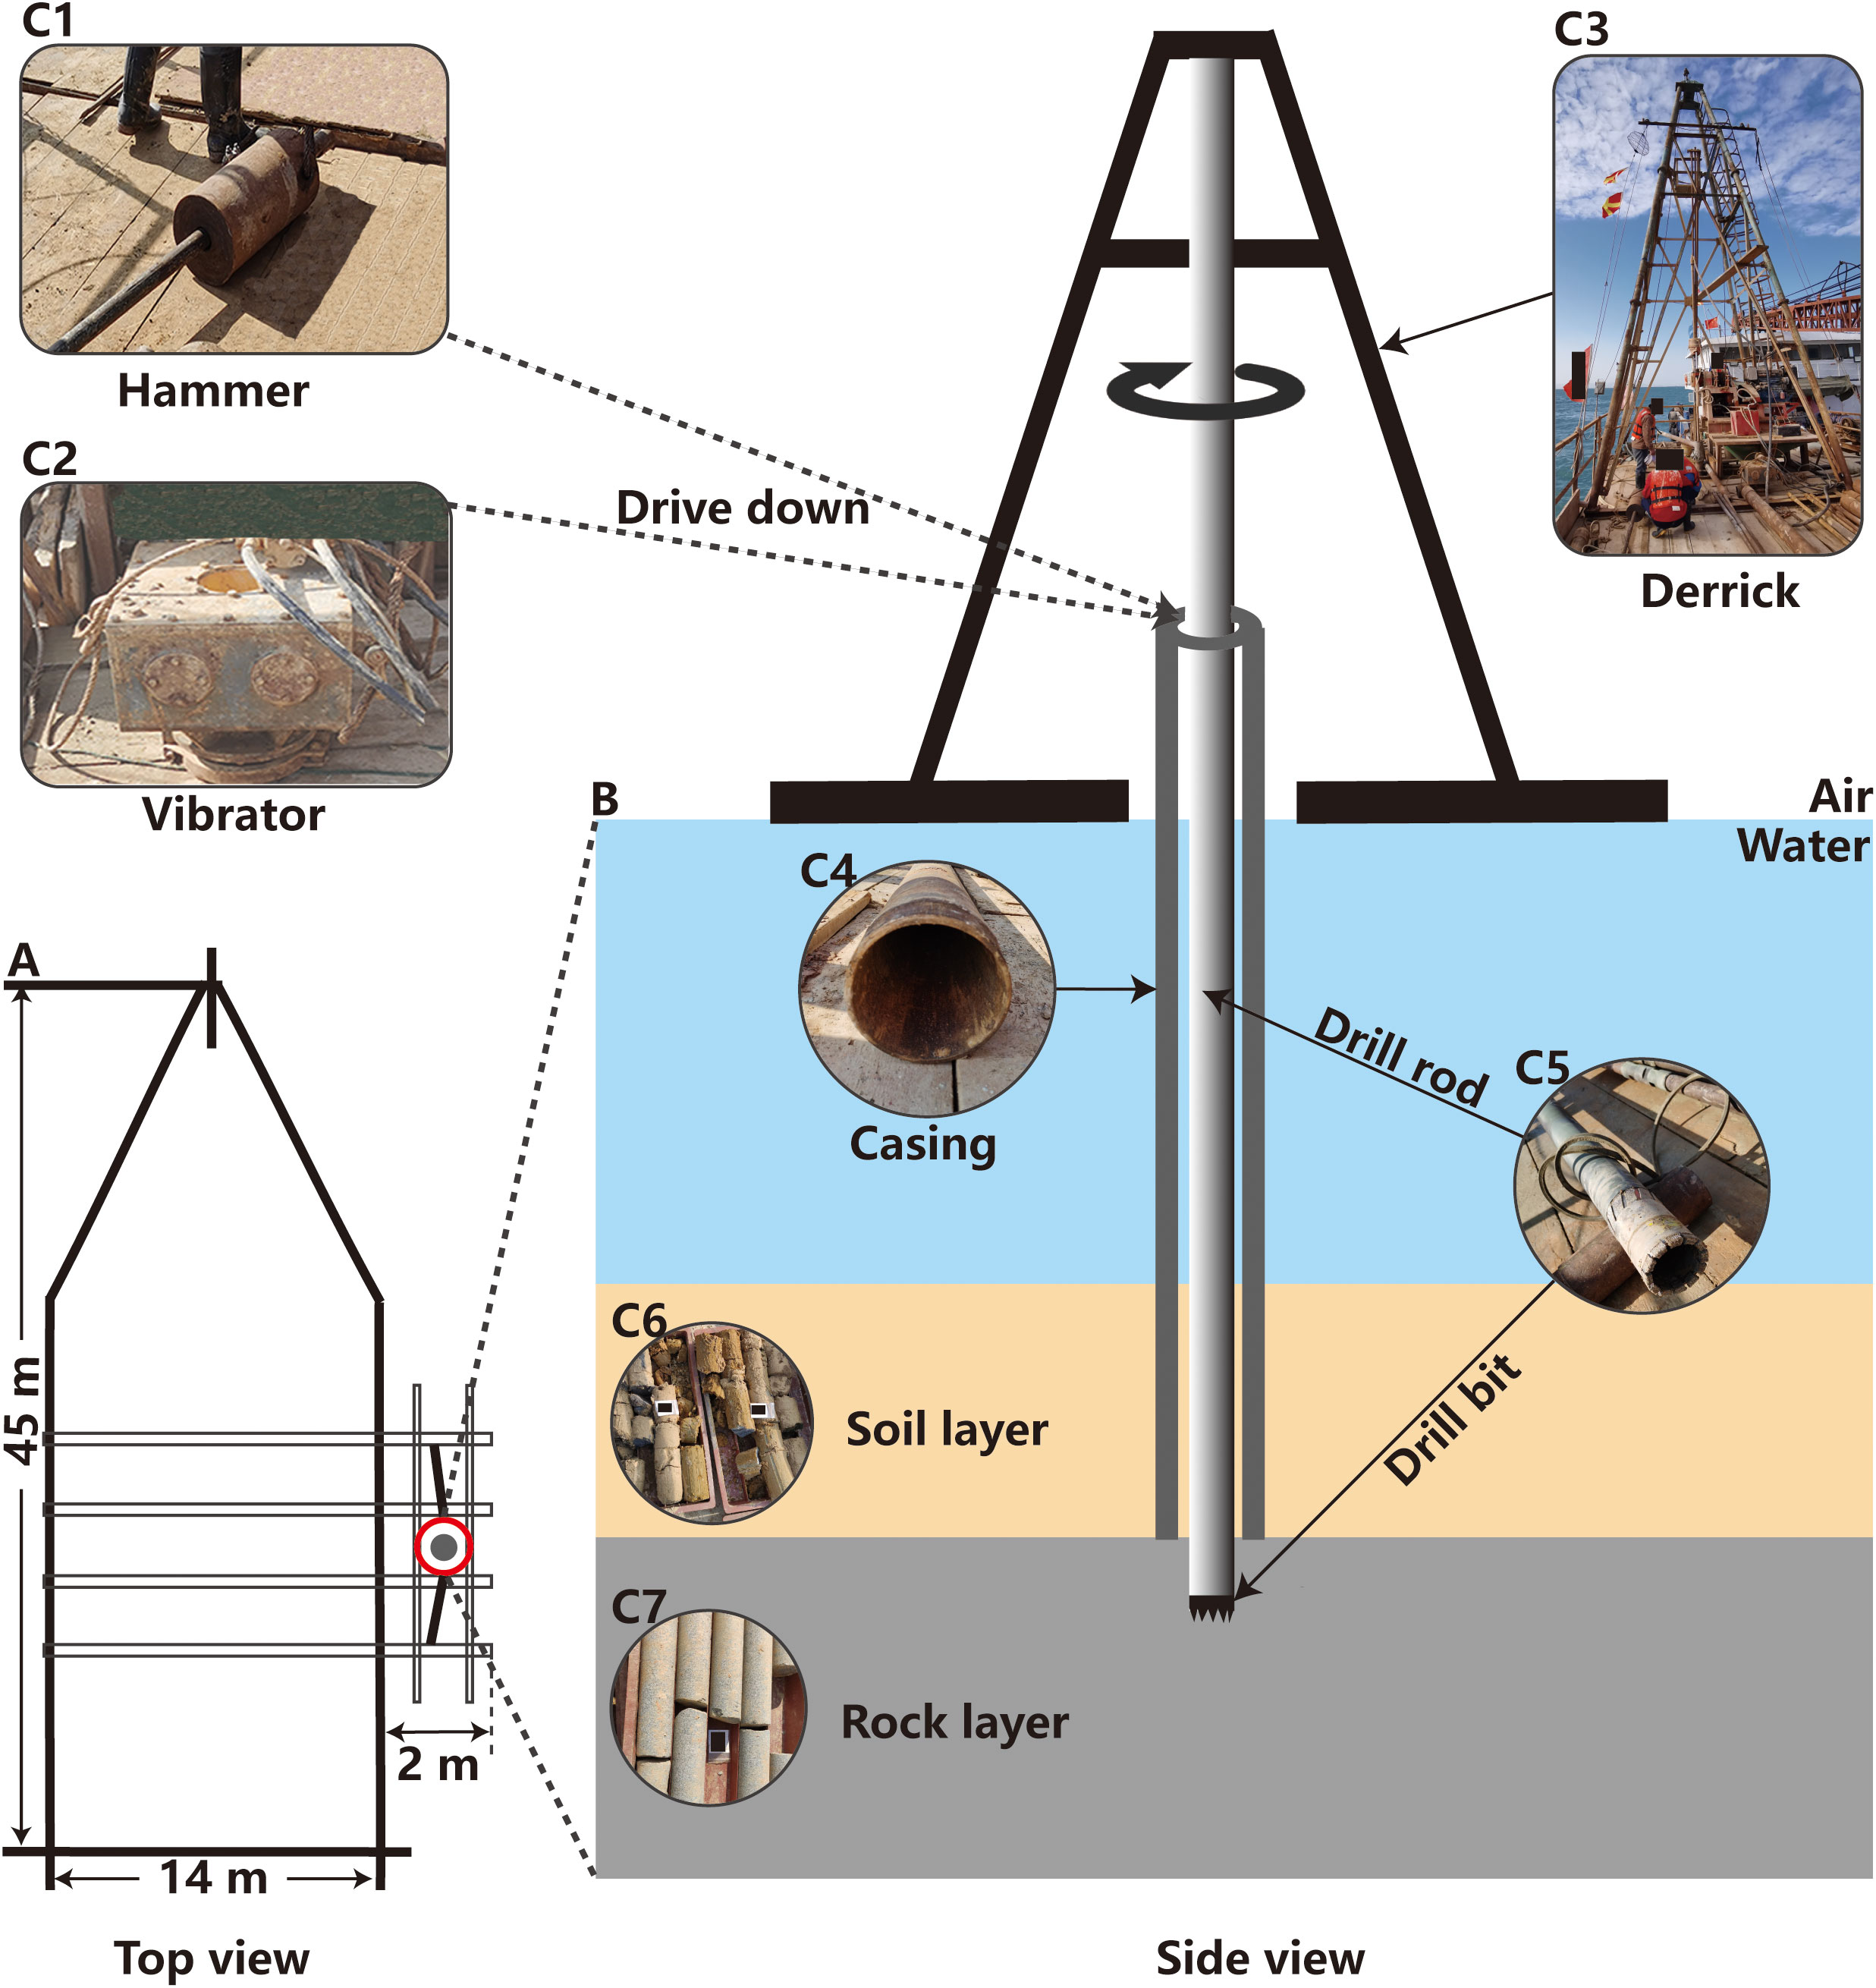
Figure 1 Schematic diagram of offshore exploration drilling (OED) on standard vessel [(A): top view of OED platform; (B): side view of OED construction]. (C1, C2): the hammer and vibrator used to drive down the casing (C4); (C3): the derrick for fixing drilling machines; (C5): the drill rod, which uses the drill bit at the end to obtain the samples of soil layer (C6) and rock layer (C7).
According to the field operation, underwater noises during OED on the anchored vessel were mainly categorized into three types: hammering noise (generated in step 1), vibrating noise (generated in step 2), and drilling noise (generated in step 3).
2.2 Noise recording
The noise monitoring was conducted on January 10, 2021, with the weather of sunny and the sea state of 2. The OED area’s seafloor is flat, and the water depth was about 7 m (measured by Base X, a sound speed profiler made by Oceanographic AML, inc.) during monitoring. Two fixed measurement stations (station 1 and 2) and one movable measurement station (station 3) were set up to monitor the three kinds of noise, as illustrated in the measurement configuration diagram (Figure 2). Station 1 and 2 were set on the drilling vessel, with distances of 6 m and 18 m from the source, respectively. Station 3 was set on a movable boat with a distance of 280 m from the source during hammering and vibrating down casings, and 40 m during borehole drilling. The distances were measured by a laser rangefinder at the source. At station 1 and 3, underwater noises were recorded by a self-contained LoPAS-L recorder (Hangzhou Soniclnfo Technology Co., Ltd., China, the receiving voltage sensitivity is -192.6 dB re 1 V/μPa) at 3 m water depth, with a sampling frequency of 128,000 Hz. At station 2, noises were recorded by a B&K 8105 hydrophone at 3 m water depth (Brüel & Kjær, inc., the receiving voltage sensitivity ranges from -205.8 to -209.6 dB re 1V/μPa), and then collected by a USB 4431 multi-channel coherent data acquisition card (National Instrument, inc.), with a sampling frequency of 65,536 Hz. Additionally, background noise of the drilling area was monitored when the platform was silent.
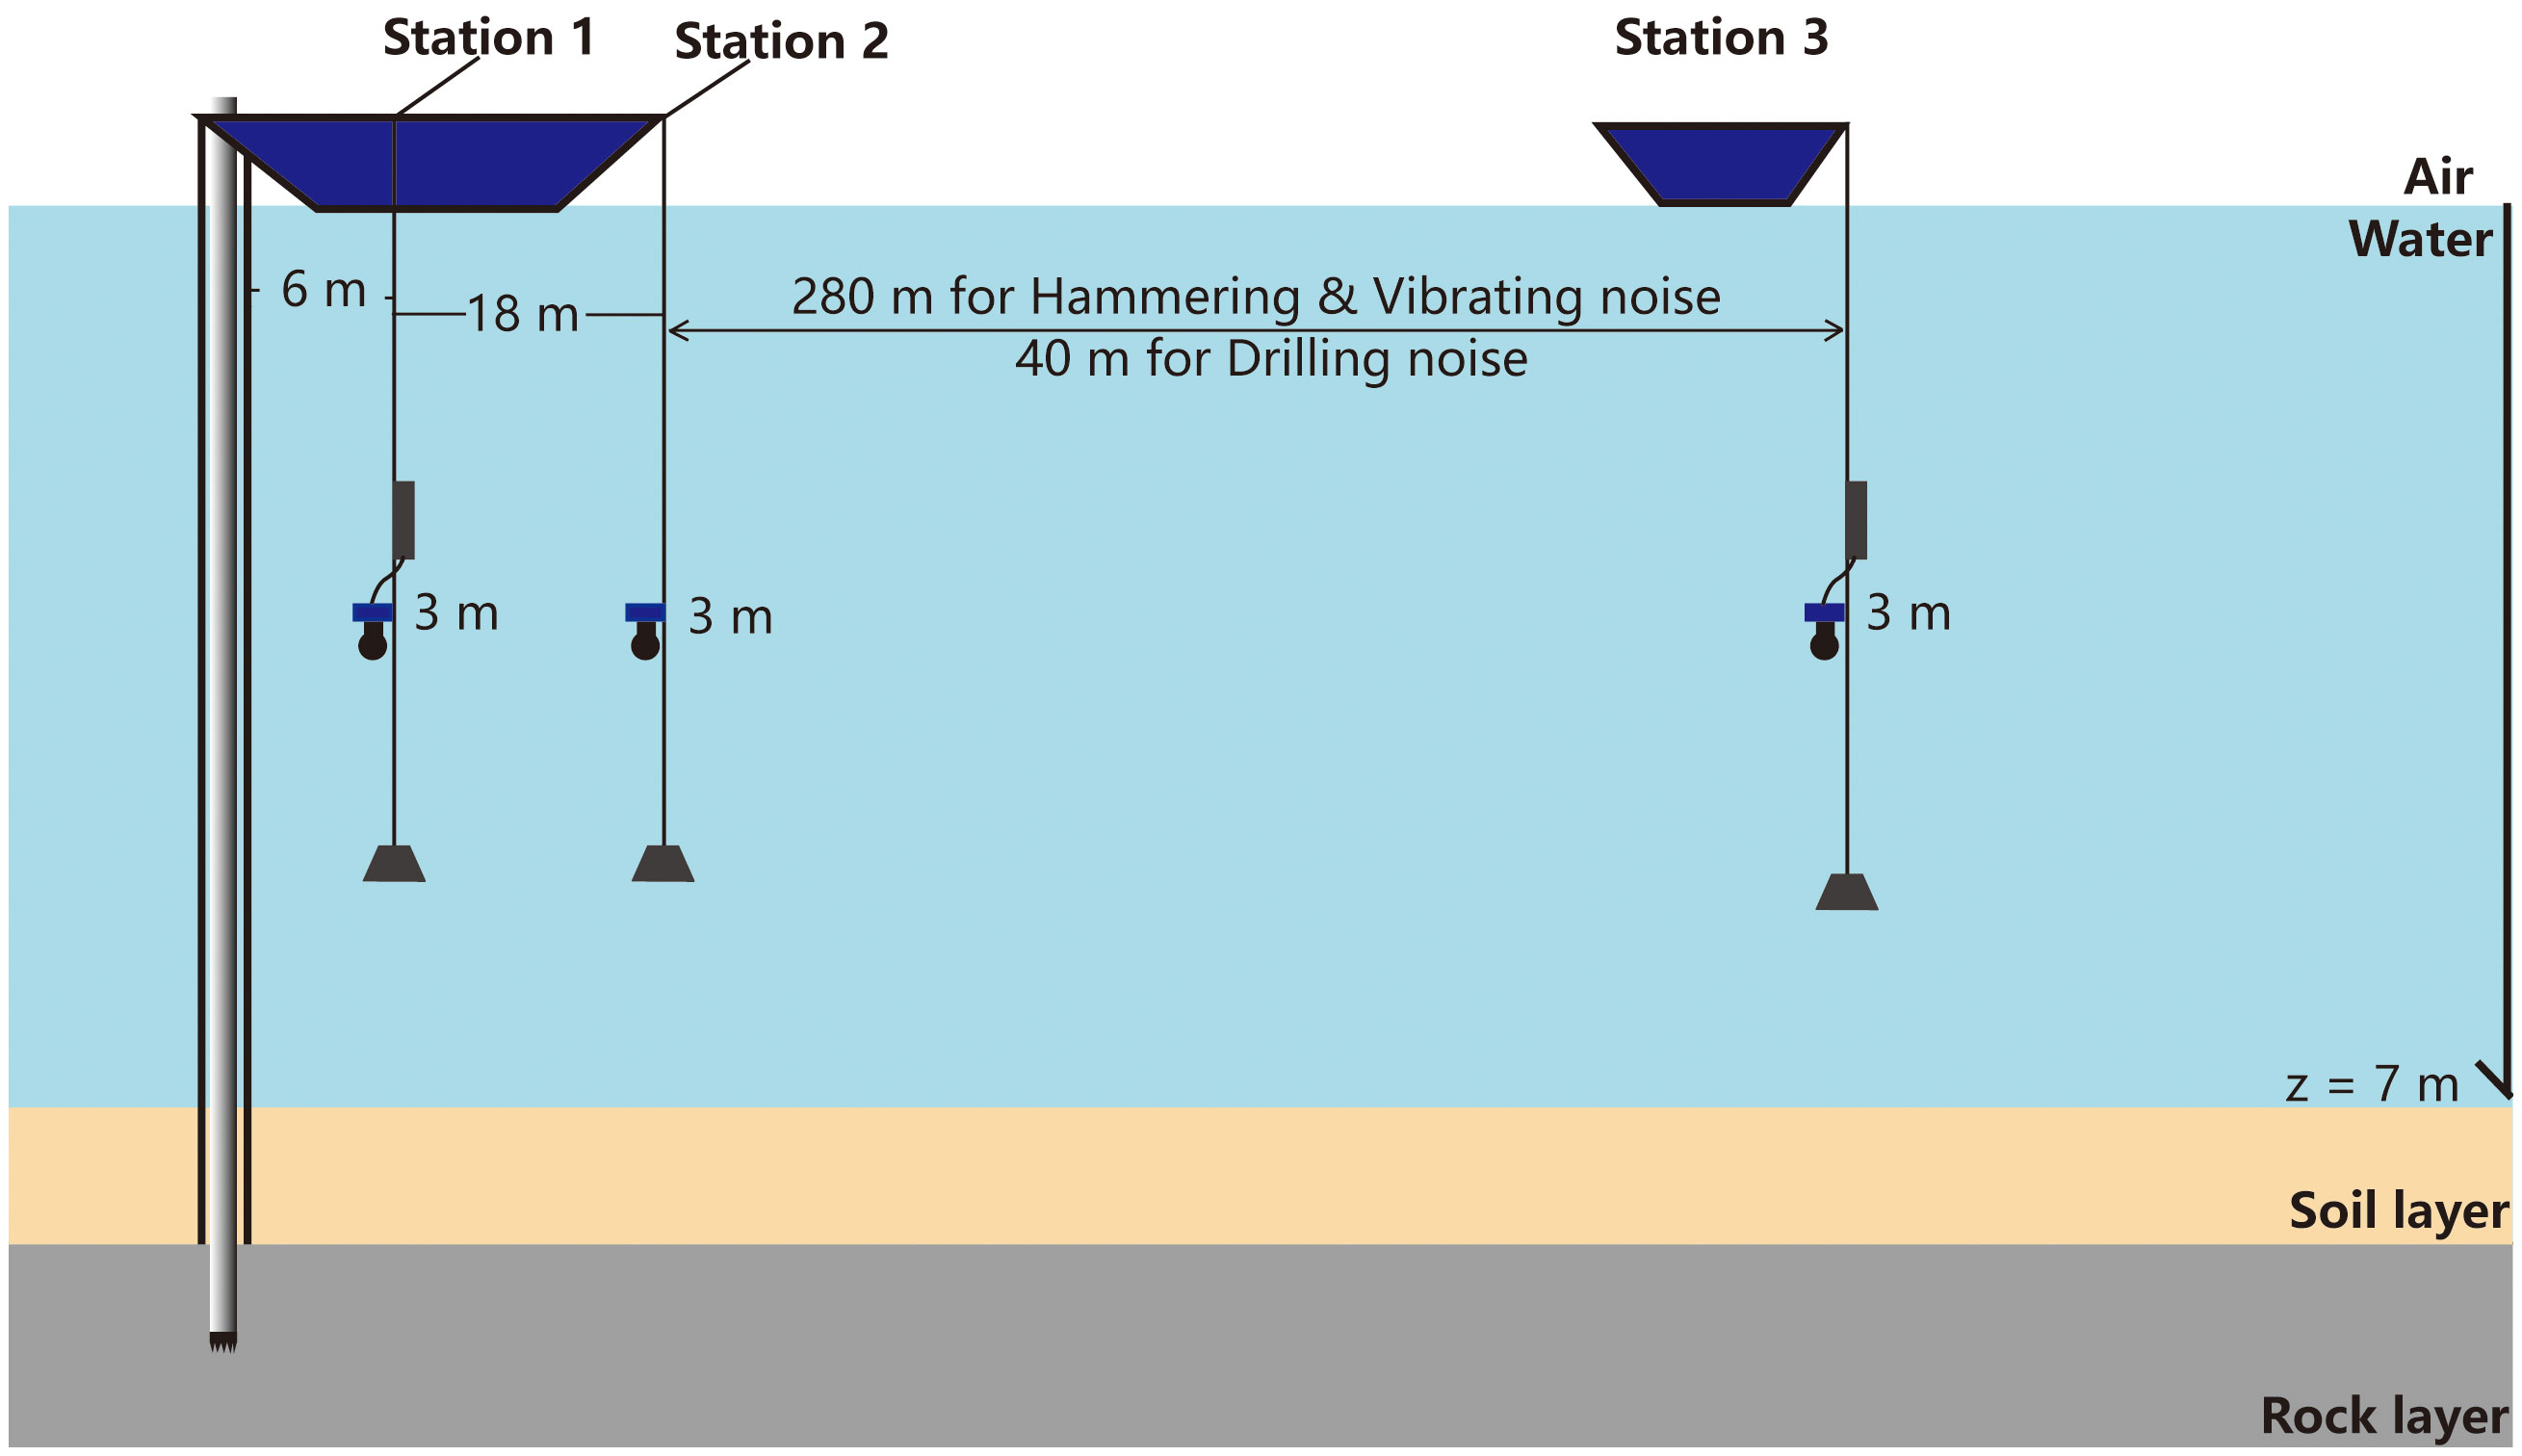
Figure 2 Schematic diagram of the measurement configuration for underwater noises during OED (distances shown are not to scale).
2.3 Data analysis
The raw measured data (bin files) were converted into sound pressure time-series (time waveforms) in Pa and then analyzed using the custom written MATLAB (MathWorks Inc., Natick, MA, version R2022a) scripts.
In the first step, spectrum diagrams and spectrograms in sound pressure power spectral density (PSD) level (unit: dB re 1 μPa2/Hz) of OED noises were plotted. Spectrum diagrams can provide information on the distribution of noise energy in frequency, and were generated with Welch’s method of segment averaging (Welch, 1967), using 65,536 sample hamming windows with 80% overlap. Spectrograms can provide information on the distribution of noise energy in frequency and time, and were generated using a short-time Fourier transform size of 65,536 and a window size of 65,536 with 80% overlap.
In the second step, the root-mean-square and zero-to-peak sound pressure level (SPLrms and SPLzp) in dB re 1µPa, and the sound exposure level (SELs) in dB re 1µPa2·s were calculated over 1-second-long segments of the sound pressure time-series (for hammering noise, the 0.5 s data before and after each pulse were selected as the 1-second segments). SPLrms, SPLzp and SELs were all recommended as the key metrics for analyzing and managing underwater soundscapes (Robinson et al., 2014), and SPLrms is defined as follows (Madsen, 2005):
where p(t) is the instantaneous sound pressure in Pa (Urick, 1983). T is the duration that comprises 95% of the acoustic energy. pref is the reference sound pressure, which equals 1 μPa .
SPLzp provides the peak energy information of the noise (Hawkins et al., 2014; Merchant et al., 2015), and is defined as follows (ISO, 2017):
SELs reflects the energy exposure level of a single signal (impulsive sound) or signal in unit time (non-impulsive sound), and is defined as follows (ISO, 2017):
where T equals 1 s, tref is the reference time and equals 1 s.
The statistics including means, standard deviations (SD), and ranges (minimum–maximum values) of the three metrics were then calculated, and note that the means were calculated in Pa and then converted to dB.
In the third and final step, source levels (SLs) in the three metrics were calculated. The propagation of underwater acoustic signals in marine environments is complex, especially in shallow water where OWFs are commonly located. Urick (1983) gives an equation to simplify the solution of SLs:
where RSLs are the received sound levels of each statistic at measurement stations, and TLs are the transmission losses in dB, which can be defined by the equation:
where r is the propagation range in m. A is a distance-dependent factor, and it equaled 20 (spherical spreading) to estimate the SLs (r = 1 m) based on the RSLs at measurement station 1 (r = 6 m). 𝛼 is the frequency-depended absorption coefficient in dB/m, and it was ignored in this paper as the dominant frequencies of OED noises are lower than 10 kHz (Fisher and Simmons, 1977).
2.4 Impact assessment
This paper further evaluated the potential hearing damage and behavior alteration of OED noises on marine mammals. Hearing damage, also called noise-induced threshold shift (Finneran and Jenkins, 2012; Finneran, 2015), can be divided into temporary threshold shift (TTS) and permanent threshold shift (PTS). TTS means the animals’ hearing thresholds return to normal when the noise exposure disappears, while PTS means the hearing thresholds remain elevated eventually (Southall, 2021). This paper assessed the PTS and TTS risk of OED noises with reference to the marine mammal noise exposure criteria (hereinafter referred to as the criteria) developed by Southall et al. (2019). The criteria divide marine mammals into six hearing groups: Low- (LF), High- (HF), and Very High- (VHF) frequency cetaceans, sirenians (SI), and otariid (OW) and phocid (PW) pinnipeds in water. OW group (sea lions, walruses, and polar bears) was not analyzed in this paper as relatively few conflicts have been reported between these animals and OWFs.
The criteria take the auditory weighted cumulative sound exposure level (SELw) in dB re 1µPa2s as the main assessment metric. SELw is an important indicator for evaluating the overall energy exposure level of underwater noise on marine organisms (Martin et al., 2019), and can be expressed as follows:
where fs is the sampling frequency in Hz, and to measure the SELw for all marine mammal hearing groups, the fs should be 64 kHz or higher. (f) is the mean PSD level of each 1-second-long segment data. Td is the total exposure time (or called cumulative time) of underwater noises in s. Waud(f) is the auditory weighting function in dB/Hz, which aim to emphasize the frequencies where the animals are more sensitive and de-emphasize the frequencies where the animals are less sensitive, and it is expressed as follows (National Marine Fisheries Service, 2018):
where f is the frequency in Hz. The values of gain parameter C in dB, cut-off frequencies f1 and f2 in kHz, and frequency exponents 𝛼 and b all vary with the hearing groups. Eq. (6) reduces to the unweighted cumulative SEL (SELuw) when Waud (f) = 1.
The criteria establish different PTS and TTS risk thresholds for different hearing groups and noise types (impulsive sound and non-impulsive sound). This paper calculated the SELw for the five hearing groups, then evaluated the PTS and TTS risk of OED noises at three measurement stations referring to the corresponding thresholds. The potential ranges of PTS and TTS risk were estimated by calculating the distance from the source to the point where SELw attenuated to the thresholds.
To date no criteria have established behavior thresholds for different hearing groups to different underwater noises (Southall, 2021). Given the hearing capability of marine mammals’ receiving system (hearing audiogram) is normally slightly higher than the background noise level, a simple method to assess the range of behavior alteration is turning to estimate the distance that the noise propagates from the source to the point where its energy attenuates to the background noise level (assume the animal responds to the noise once received). For instance, Wang et al. (2014) estimated the impact range of vibration piling noise on Sousa chinensis by this method. This paper combined Eq. (5) and the RSLs in SPLrms at each measurement station to calculate the TLs, then estimated the distances between the source and the points where the RSLs attenuated to the background noise level, that are, the behavior reaction ranges of marine mammals to OED noises.
3 Results
After excluding the data with high background noise interference, a total of 8.2 GB noise data was acquired. Figure 3 illustrates the time waveforms, spectrum diagrams, and spectrograms of hammering noise, vibrating noise, and drilling noise that measured at station 1. It can be seen from Figures 3A1–C1 that hammering noise consists of a series of strikes with broadband and short duration, and is a typical impulsive sound (Hamernik and Hsueh, 1991). Figures 3A2–C2, and Figures 3A3–C3 illustrate that vibrating noise and drilling noise are continuous and the noise levels vary little with time, which are the typical characteristics of non-impulsive sound. It can be seen from Figures 3B1–B3 that the intensity of hammering noise is the highest among the three noise types, which is about 60 dB above the background level. In contrast, the intensity of vibrating and drilling noise is low and close to the background level. Besides, Figures 3C1–C3 illustrate that vibrating noise has two significant single-frequency components at 41 Hz and 124 Hz, and drilling noise has a significant single-frequency component at 45 Hz. Hammering noise and vibrating noise both have a high narrow-band component at the center frequency of 14 Hz with the bandwidth of 10 Hz.
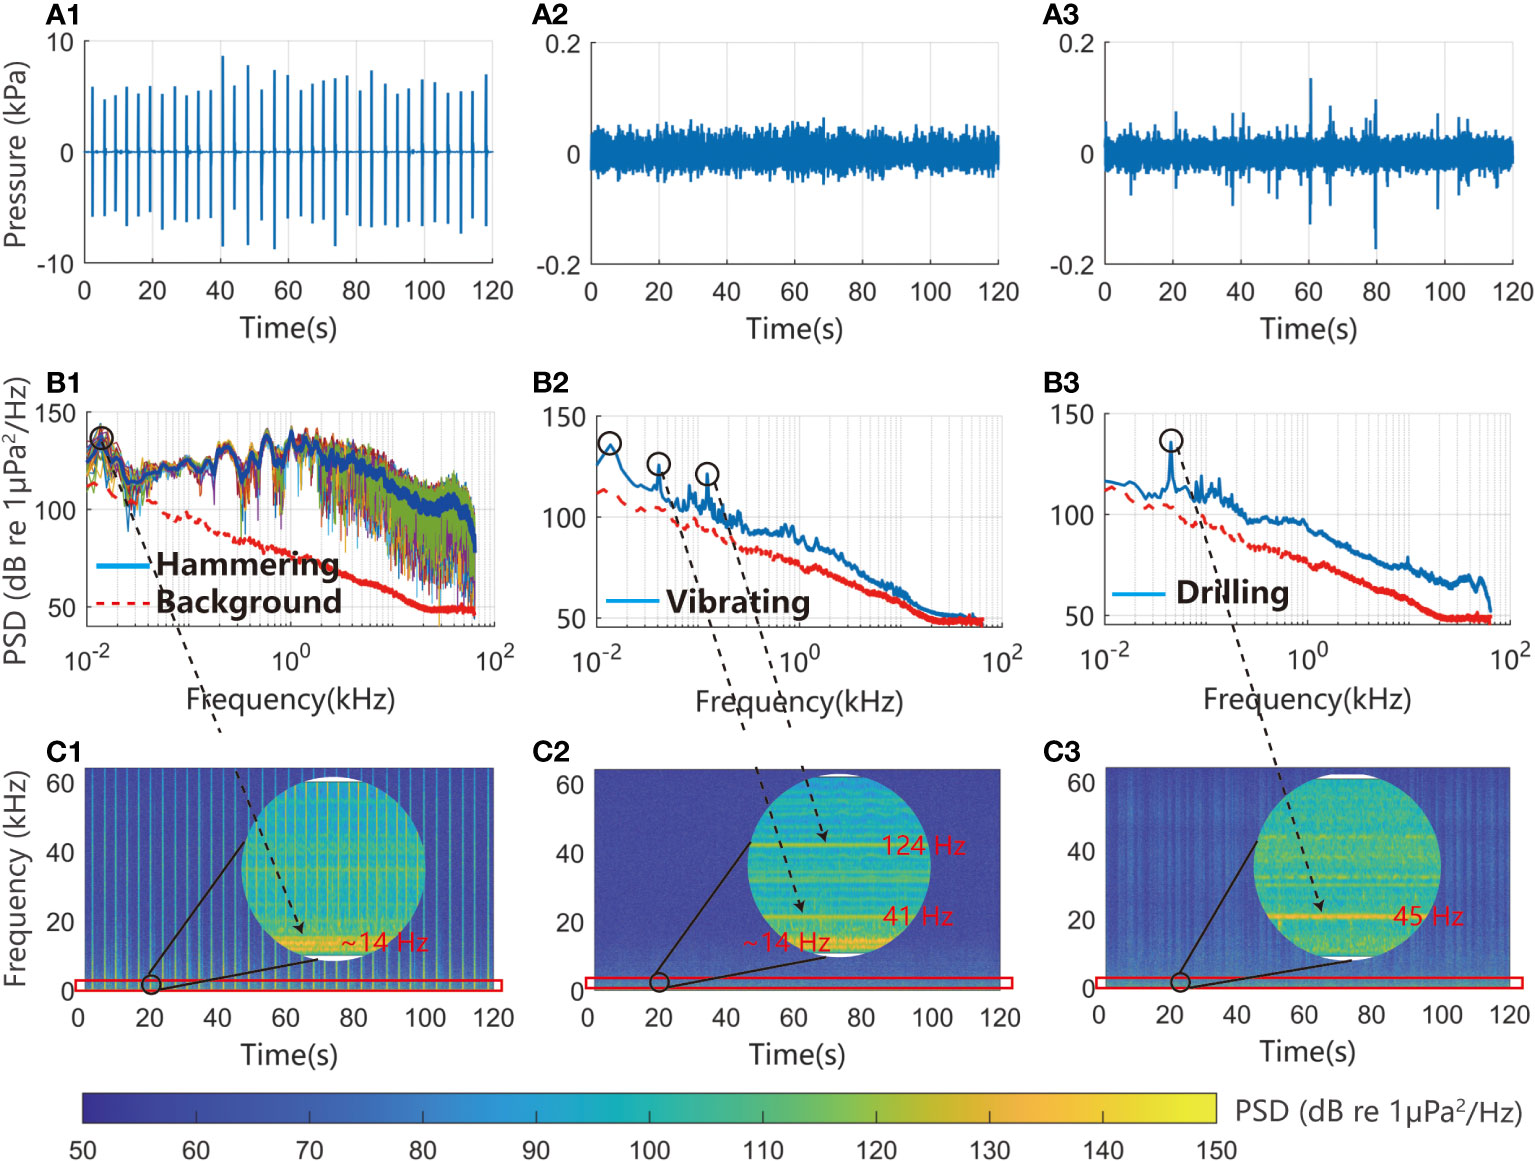
Figure 3 The time waveforms (A1-A3), spectrum diagrams (B1-B3), and spectrograms (C1-C3) of hammering noise, vibrating noise and drilling noise measured at the station 1 during OED. The spectrum diagrams in sound pressure power spectral density (PSD) level were generated with Welch’s method (Welch, 1967), using 65,536 sample hamming windows with 80% overlap. The spectrograms in PSD level were generated using short-time Fourier transform (hamming window, window size: 65,536, overlap: 80%). The colored, thin lines in (B1) are single strikes of hammering noise, and the blue, thick line is the average. The circles in (C1-C3) are the local enlargements of spectrograms.
Table 1 illustrates the source levels (SLs) in the metrics of SPLzp, SPLrms, and SELs of the three noise types during OED, and the background noise in the table was measured at station 1. It can be seen from the Table that the intensity of hammering noise is the highest, followed by vibrating noise, and drilling noise is the lowest.
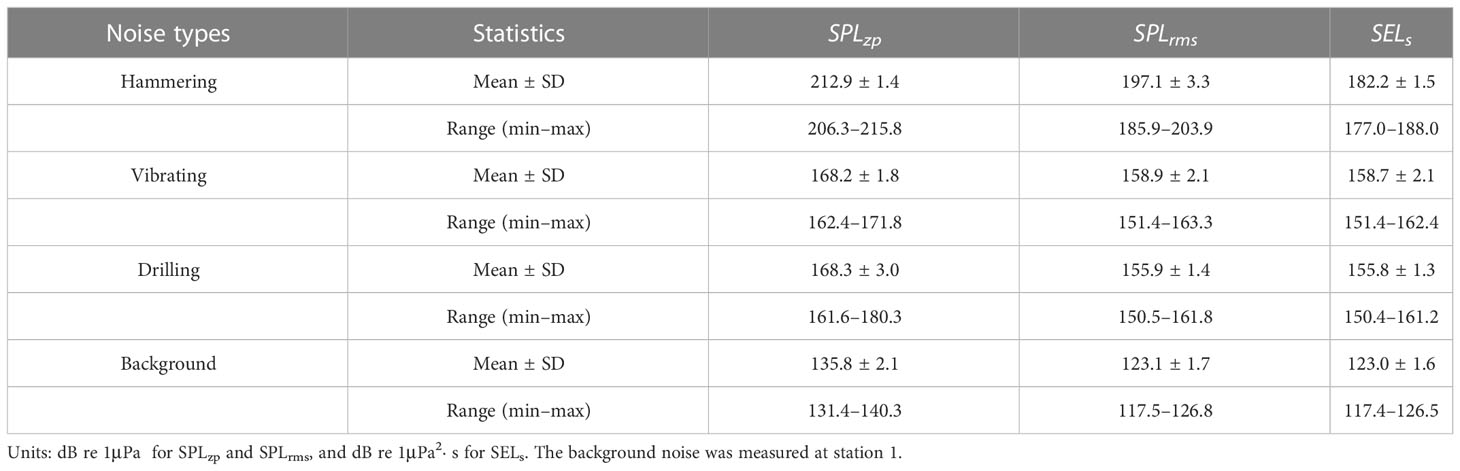
Table 1 Source levels of hammering noise, vibrating noise, and drilling noise during OED.
4 Discussions
4.1 Noise characterization
Hammering noise was generated during hammering down the casing. Since a large amount of gravitational potential energy (approximately 3000–4000 J) of the heavy hammer was instantaneously released on casings, hammering noise exhibits the significant characteristics of short duration and broadband, and is a typical impulsive sound (Figures 3A1–C1). Besides, repeated hammer strikes cause hammering noise appears in the form of pulse trains. The dominant frequency of hammering noise is below 10 kHz (take the PSD level of 100 dB re 1μPa2/Hz at station 1 as the threshold), and its peak energy appears at 1 kHz with the PSD level of 140 dB re 1μPa2/Hz. The intensity of hammering noise is the highest among the three kinds of noises, with the SLs of 197.1 dB re 1μPa rms @ 1 m and 212.9 dB re 1μPa peak @ 1 m (Table 1). Hammering noise strongly resembles the noise of offshore impact piling during OWFs construction phase, and the diameter and material of pile (pipe) are the main factors affecting the noise levels (Reinhall and Dahl, 2011; Zampolli et al., 2013; Lippert and von Estorff, 2014). The pile (pipe) used in offshore impact piling is in various diameters, usually 0.3–2.0 m (Lippert et al., 2016), and in various materials, such as concrete, steel shell, and steel core (Guan and Miner, 2020), so the noise levels vary substantially with pile parameters. In contrast, the casing used in OED is usually steel pipe with a small and relatively fixed diameter, and the intensity of hammering noise normally does not change significantly due to casing parameters.
Vibrating noise was generated during vibrating down the casing. Because the vibration energy was released smoothly from the vibrator to casings, vibrating noise, as one of the products of the energy conversion, is a typical non-impulsive sound. The intensity of vibrating noise is low, with an SL of 158.9 dB re 1μPa rms @ 1 m (Table 1). Both vibrating noise and hammering noise have a strong narrow-band component at the center frequency of 14 Hz with the bandwidth of 10 Hz (Figures 2C1, 2C2). Considering the generation processes of the two noise types, the narrow-band component may be the low-frequency vibration generated by the interaction between the casing and seabed when driving down casing. In addition, vibrating noise has two strong single-frequency components of 41 Hz and 124 Hz, which may be the resonance signals of casings that driven by vibrator and related to the inherent frequencies of casings. The noise of vibrating down piles during the OWFs construction phase is similar to vibrating noise, but the vibratory hammers used in vibrating down piles are generally heavier and oscillate at a much higher rate (Guan and Miner, 2020), which results in a higher noise level. For instance, the SPLrms of a typical noise during vibratory pile driving of a 1 m diameter steel pile is 175 dB re 1μPa @ 10 m (Buehler et al., 2015).
Drilling noise was generated during the drilling bit grinding the soil and rock layer, which is a non-impulsive sound. The noise came primarily from inside the seabed, and its energy would be greatly attenuated as it transmitted from the soil and rock layer into water. Besides, casings on the outside of drill rod acted as a sound barrier and further impeded the noise propagation. The SL of drilling noise is 155.9 dB re 1μPa rms @ 1 m (Table 1), and the peak energy appears at 45 Hz with a sound level of 136 dB re 1μPa2/Hz. Unlike the vibrating noise, drilling noise still has a high energy in the frequency band above 1 kHz (Figure 3B3), and there is a series of clear irregular stripes with broadband on the spectrogram of drilling noise (Figure 3C3), which is likely to be generated by the collision of drilling rod with the inner wall of casing during rotation. The measured SPLrms of drilling noises on the jack-up platforms are 142–145 dB re 1μPa @ 1 m (Erbe and McPherson, 2017) and 120 dB re 1μPa @ 41 m (Todd et al., 2020), which are lower than the value of 155.9 dB re 1μPa rms @ 1 m measured in this study. The difference in the noise levels may be related to the platforms, the anchored vessel in this paper coupled well with the water and led to a good leakage of the equipment noise on the vessel into the water, while the jack-up platforms are well above the water line.
Figure 4 illustrates the spectrum diagrams of hammering noise, vibrating noise, and drilling noise that measured at the three measurement stations. It can be seen from the figure that the energy of hammering noise decay significantly with the distance, and the decay rate is low in the frequency band below 40 Hz and high in the frequency band above 1 kHz. The energy decay rate of vibrating noise with distance is lower than that of hammering noise, but as the low SLs, the energy of vibrating noise in the frequency band above 50 Hz would be closed to the background level before reaching station 3 (280 m from the source). Unlike hammering noise and vibrating noise, the energy decay rate in the frequency band below 200 Hz of drilling noise is significantly higher than that in the frequency band above 200 Hz (Figure 4C), which may be related to the noise sources and the propagation paths. Drilling noise has two sources: one was inside of seabed and transmitted through the soil (rock) layer to the water, and another was on the casing and transmitted directly into the water. The first source was in the low-frequency band and occupied the primary energy, and the second source was broadband with low energy, but its decay rate was lower than that of the first source. Besides, the decreased water depth (8.5 m depth during hammering down casings decreased to 6 m during borehole drilling because of the tide) was also expected to contribute to the difference in decay rate of the two frequency bands. Lower frequency acoustic signal with longer wavelength in relation to the water depth cannot propagate efficiently in shallower water, because of the “low-frequency” cut-off (Etter, 2018; Guan and Miner, 2020).
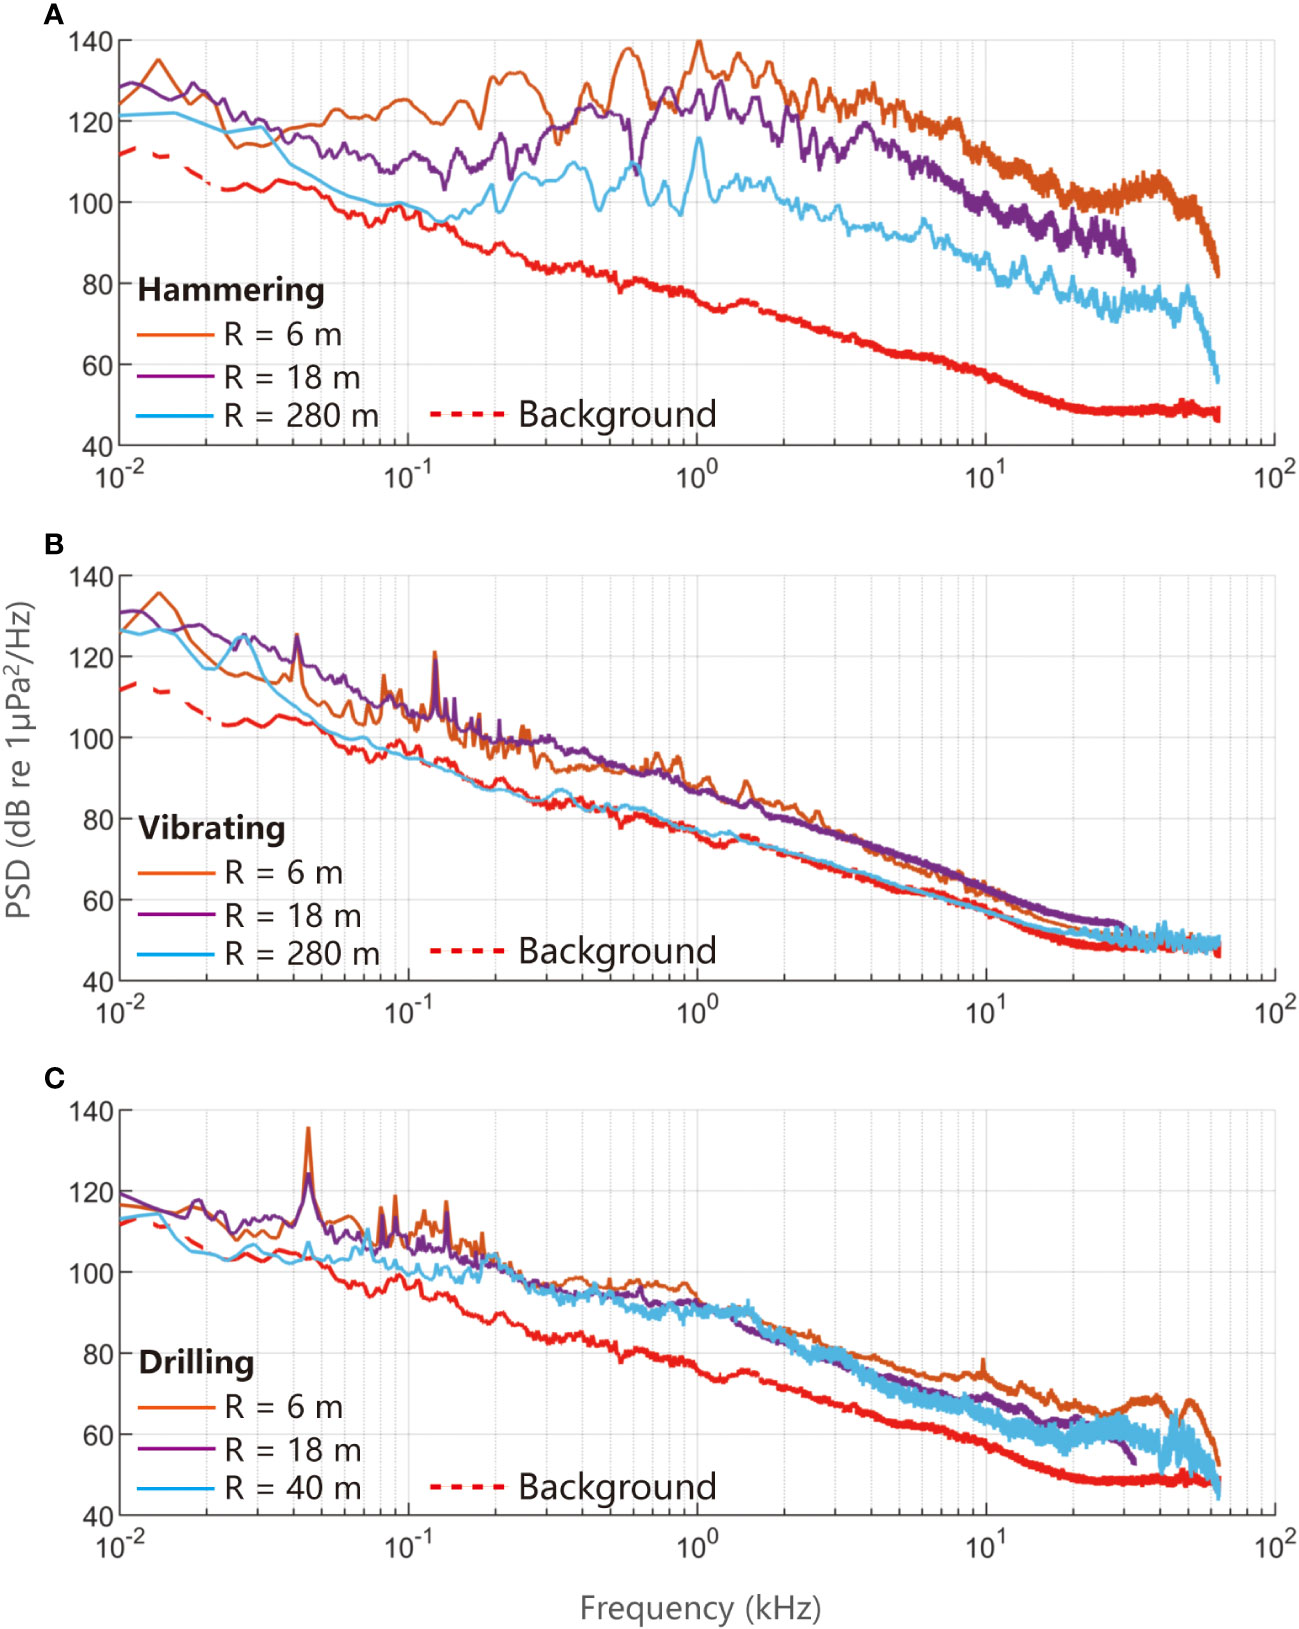
Figure 4 Spectrum diagrams of hammering noise (A), vibrating noise (B), and drilling noise (C) that measured at the station 1 (6 m from the source, R = 6 m), station 2 (R = 18 m) and station 3 (R = 280 m for hammering and vibrating noise, R = 40 m for drilling noise) during OED. The spectrum diagrams in sound pressure power spectral density (PSD) level were generated with Welch’s method (Welch, 1967), using 65,536 sample hamming windows with 80% overlap.
4.2 Impacts on marine mammals
Table 2 illustrates the auditory weighted cumulative SEL for the five hearing groups (e.g., SELw,LF refers to the weighted cumulative SEL for the LF group), and the cumulative times (Td in Eq. (6)) of hammering noise, vibrating noise, and drilling noise were 600 s, 1800 s, and 72,000 s according to the field operation. TLs between the three measurement stations in the table were calculated based on the unweighted cumulative SEL (SELuw) at each station, and the TL equations (Eq. (5)) for hammering noise and drilling noise from the station 2 to station 3 were modelled to TL1(r) = 9.1lg(r) and TL2(r) = 9.5lg(r), respectively.
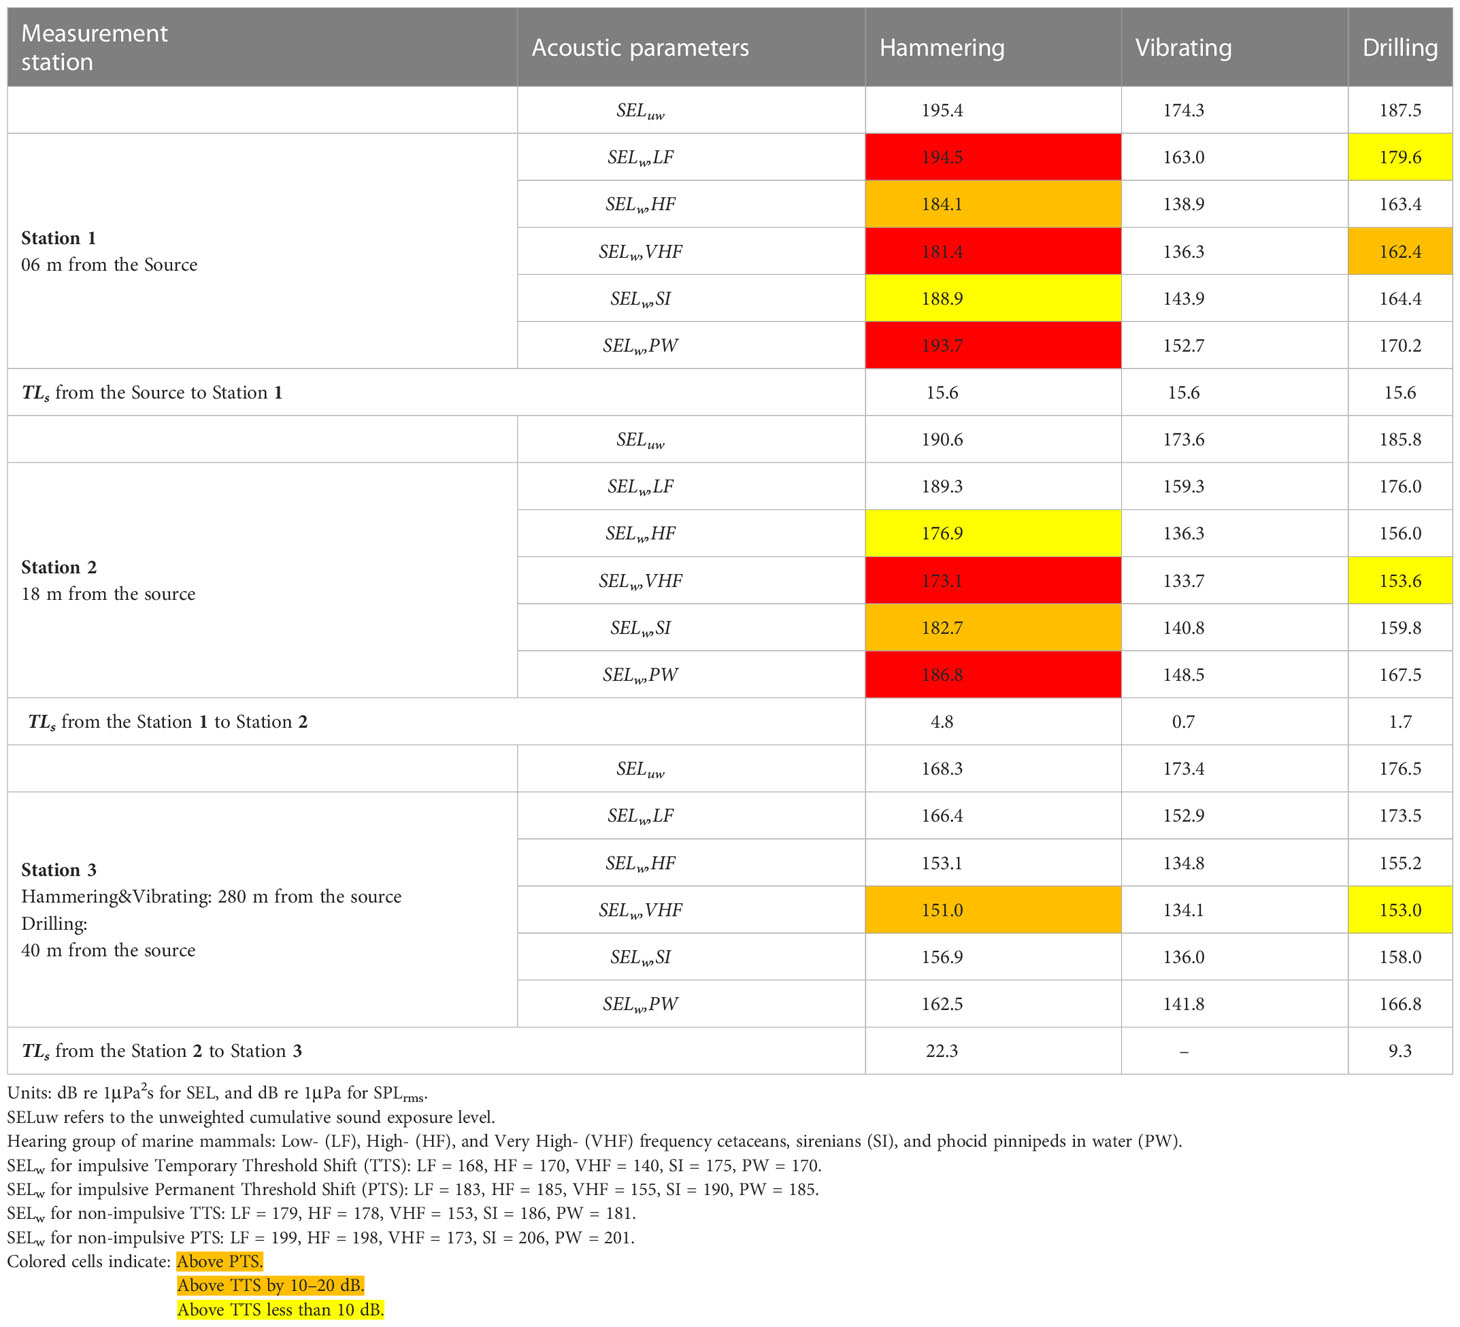
Table 2 The SELw of hammering noise, vibrating noise, and drilling noise that measured at the three stations during OED.
It can be seen from Table 2 that hammering noise has a high hearing damage risk to marine mammals, and there is still a TTS risk to the VHF group at station 3. Based on the TL1 equation and the thresholds of PTS and TTS risk, the hearing damage range of hammering noise to marine mammals (VHF group) was estimated to be up to a radius of 300 m from the source. Vibrating noise has low hearing damage risk, and its SELw at station 1 is already lower than the thresholds of PTS and TTS risk for each hearing group. Though the SL of drilling noise is lower than vibrating noise (Table 1), the cumulative time of 72,000 s resulted in a high SELw, and the maximum damage distance of drilling noise to marine mammals (VHF group) was estimated to be 40 m from the source.
The potential ranges of behavior alteration of OED noises on marine mammals exceeds that of hearing damage. Based on the SPLrms of the three kinds of noises and background noise (Table 1), hammering noise was estimated to be detected by marine mammals up to 1.9 km from the source, and drilling noise was estimated to be detected at a distance of 170 m. The risk of vibrating noise was ignored because its noise energy was likely to approach the ambient level before reaching station 3 (40 m from the source). Comprehensive analysis of the potential risk of hearing damage and behavior alteration, it is recommended to set up a warning zone with a radius of 1.9 km from the source to observe and avoid the presence of marine mammals during OED.
5 Conclusion
This study provides the first detailed analysis of underwater noises during OED on standard vessels, which are frequently generated in OWFs geotechnical surveys. The results indicate that OED noises mainly include three types: hammering noise, vibrating noise, and drilling noise. Hammering noise is a high-intensity impulsive sound with the source level (SL) of 197.1 dB re 1μPa rms @ 1 m, and its dominant frequency is below 10 kHz and peak energy appears at 1 kHz with the PSD level of 140 dB re 1μPa2/Hz; Vibrating noise is a low-intensity non-impulsive sound with the SL of 158.9 dB re 1μPa rms @ 1 m. The noise has a significant single-frequency component at 41 Hz and 124 Hz, and has a same narrow-band signal with 14 Hz center frequency and 10 Hz bandwidth as hammering noise. Drilling noise is the lowest among the three noise types, with the SL of 155.9 dB re 1μPa rms @ 1 m and a significant single-frequency component at 45 Hz. The impact assessment of OED noises on marine mammals demonstrates that the potential range of hearing damage can reach a 300 m radius from the source, and the range of behavioral alteration is up to 1.9 km. Therefore, setting up a warning zone with a radius of 1.9 km during OED is recommended.
This study makes up for the lacking research on OWFs geotechnical survey noise, and improves the understanding of underwater noises and their ecological impacts during the whole OWFs’ lifecycle. However, further research on noise levels and propagation characteristics during OED in different vessel size and different environmental conditions (e.g., water depth and bedrock type) are needed to better understand OED noises characteristics and their impacts on marine life, including important fish species.
Data availability statement
The raw data supporting the conclusions of this article will be made available by the authors, without undue reservation.
Author contributions
LH: Conceptualization, investigation, data curation, formal analysis, writing – original draft, software, methodology and visualization. XX: Conceptualization, writing – review and editing, funding acquisition, methodology, project administration, and supervision. LY: Methodology. SH, XZ, and YZ: Investigation. All authors contributed to the article and approved the submitted version.
Funding
This work was supported by the National Natural Science Foundation of China (Grant number 41976178).
Acknowledgments
The authors are grateful to Fanggui Xiao, Chenhui Wang and Zhen Li for their help with the acoustic recordings in the measurement trials.
Conflict of interest
The authors declare that the research was conducted in the absence of any commercial or financial relationships that could be construed as a potential conflict of interest.
Publisher’s note
All claims expressed in this article are solely those of the authors and do not necessarily represent those of their affiliated organizations, or those of the publisher, the editors and the reviewers. Any product that may be evaluated in this article, or claim that may be made by its manufacturer, is not guaranteed or endorsed by the publisher.
References
Bald J., Hernández C., Uriarte A., Castillo J., Ruiz P., Ortega N. (2015). Acoustic characterization of submarine cable installation in the Biscay marine energy platform (BIMEP). Bilbao Mar. Energy Week. 27, 20–24. Available at: https://tethys.pnnl.gov/sites/default/files/publications/Bald-et-al-2015c.pdf
Branstetter B. K., Bowman V. F., Houser D. S., Tormey M., Banks P., Finneran J. J., et al. (2018). Effects of vibratory pile driver noise on echolocation and vigilance in bottlenose dolphins (Tursiops truncatus). J. Acoust. Soc. Am. 143, 429–439. doi: 10.1121/1.5021555
Buehler D., Oestman R., Reyff J., Pommerenck K., Mitchell B. (2015). Technical guidance for assessment and mitigation of the hydroacoustic effects of pile driving on fish (Sacramento, CA: California Department of Transportation), 4–21. California Department of Transportation (Caltrans) Report No. CTHWANP-RT-15-306.01.01.
Díaz H., Soares C. G. (2020). Review of the current status, technology and future trends of offshore wind farms. Ocean Eng. 209, 107381. doi: 10.1016/j.oceaneng.2020.107381
Erbe C., McPherson C. (2017). Underwater noise from geotechnical drilling and standard penetration testing. J. Acoust. Soc. Am. 142, EL281–EL285. doi: 10.1121/1.5003328
Finneran J. J. (2015). Noise-induced hearing loss in marine mammals: A review of temporary threshold shift studies from 1996 to 2015. J. Acoust. Soc. Am. 138, 1702–1726. doi: 10.1121/1.4927418
Finneran J., Jenkins A. (2012). Criteria and thresholds for US navy acoustic and explosive effects analysis (Space and Naval Warfare Systems Center Pacific San Diego, CA). Available at: https://apps.dtic.mil/sti/citations/ADA561707
Fisher F., Simmons V. (1977). Sound absorption in sea water. J. Acoust. Soc. Am. 62, 558–564. doi: 10.1121/1.381574
Fowler A. M., Jørgensen A. M., Svendsen J. C., Macreadie P. I., Jones D. O., Boon A. R., et al. (2018). Environmental benefits of leaving offshore infrastructure in the ocean. Front. Ecol. Environ. 16, 571–578. doi: 10.1002/fee.1827
Fugro Marine GeoServices, Inc (2017). Geophysical and geotechnical investigation methodology assessment for siting renewable energy facilities on the Atlantic OCS (Fugro Marine GeoServices, Inc). OCS Study BOEM 2017-049. Available at: https://tethys.pnnl.gov/publications/geophysical-geotechnical-investigation-methodology-assessment-siting-renewable-energy
Guan S., Miner R. (2020). Underwater noise characterization of down-the-hole pile driving activities off biorka island, Alaska. Mar. pollut. Bull. 160, 111664. doi: 10.1016/j.marpolbul.2020.111664
Hall R., João E., Knapp C. W. (2020). Environmental impacts of decommiss-ioning: Onshore versus offshore wind farms. Environ. Impact. Asses. 83, 106404. doi: 10.1016/j.eiar.2020.106404
Hall R., Topham E., João E. (2022). Environmental impact assessment for the decommissioning of offshore wind farms. Renewable Sustain. Energy Rev. 165, 112580. doi: 10.1016/j.eiar.2020.106404
Hamernik R. P., Hsueh K. D. (1991). Impulse noise: some definitions, physical acoustics and other considerations. J. Acoust. Soc. Am. 90, 189–196. doi: 10.1121/1.401287
Haver S. M., Gedamke J., Hatch L. T., Dziak R. P., Van Parijs S., McKenna M. F., et al. (2018). Monitoring long-term soundscape trends in US waters: the NMFS/NPS ocean noise reference station network. Mar. Policy. 90, 6–13. doi: 10.1016/j.marpol.2018.01.023
Hawkins A., Popper A., Fay R., Mann D., Bartol S., Carlson T., et al. (2014). Sound exposure guidelines for fishes and Sea turtles: A technical report (Cham, Switzerland: Springer and ASA Press).
Herbert-Read J. E., Kremer L., Bruintjes R., Radford A. N., Ioannou C. C. (2017). Anthropogenic noise pollution from pile-driving disrupts the structure and dynamics of fish shoals. Proc. R. Soc B 284, 20171627. doi: 10.1098/rspb.2017.1627
ISO (2017). Underwater acoustics–terminology (Switzerland: International Organization for Standardization Geneva).
Jiménez-Arranz G., Banda N., Cook S., Wyatt R. (2020). “Review on existing data on underwater sounds produced by the oil and gas industry,” in JIP topic - sound source characterisation and propagation (Joint Industry Programme (JIP) on E&P Sound and Marine Life). Available at: https://gisserver.intertek.com/JIP/DMS/ProjectReports/Cat1/JIP-Proj1.4.2_Review_on_Noise_from_Industrial_Sources.pdf
Ketten D., Lien J., Todd S. (1993). Blast injury in humpback whale ears: Evidence and implications. J. Acoust. Soc. Am. 94, 1849–1850. doi: 10.1121/1.407688
Kyhn L. A., Sveegaard S., Tougaard J. (2014). Underwater noise emissions from a drillship in the Arctic. Mar. pollut. Bull. 86, 424–433. doi: 10.1016/j.marpolbul.2014.06.037
Lippert S., Nijhof M., Lippert T., Wilkes D., Gavrilov A., Heitmann K., et al. (2016). COMPILE–a generic benchmark case for predictions of marine pile-driving noise. IEEE J. Oceanic Eng. 41, 1061–1071. doi: 10.1109/JOE.2016.2524738
Lippert T., von Estorff O. (2014). The significance of parameter uncertainties for the prediction of offshore pile driving noise. J. Acoust. Soc. Am. 136, 2463–2471. doi: 10.1121/1.4896458
Madsen P. T. (2005). Marine mammals and noise: Problems with root mean square sound pressure levels for transients. J. Acoust. Soc. Am. 117, 3952–3957. doi: 10.1121/1.1921508
Martin S. B., Morris C., Bröker K., O'Neill C. (2019). Sound exposure level as a metric for analyzing and managing underwater soundscapes. J. Acoust. Soc. Am. 146, 135–149. doi: 10.1121/1.5113578
Maynard M. L., Schneider J. (2010). Geotechnics for developing offshore renewable energy in the US. 1st ed (CRC Press), 611–616. Frontiers in Offshore Geotechnics II. Available at: https://www.taylorfrancis.com/chapters/edit/10.1201/b10132-83/geotechnics-developing-offshore-renewable-energy-us-landon-maynard-schneider
Merchant N. D., Fristrup K. M., Johnson M. P., Tyack P. L., Witt M. J., Blondel P., et al. (2015). Measuring acoustic habitats. Methods Ecol. Evol. 6, 257–265. doi: 10.1111/2041-210X.12330
Mooney T. A., Andersson M. H., Stanley J. (2020). Acoustic impacts of offshore wind energy on fishery resources. Oceanography. 33, 82–95. Available at: https://www.jstor.org/stable/26965752
National Marine Fisheries Service (2018). 2018 revisions to: Technical guidance for assessing the effects of anthropogenic sound on marine mammal hearing (Version 2.0) Vol. 167 (Silver Spring, MD: National Marine Fisheries Service). NOAA Tech. Memo. NMFS-OPR-59. Available at: https://www.fisheries.noaa.gov/resource/document/technical-guidance-assessing-effects-anthropogenic-sound-marine-mammal-hearing
Nedwell J., Brooker A., Barham R. (2012). Assesment of underwater noise during the installation of export power cables at the Beatrice offshore wind farm. Subacoustech Environ. Rep. NE318R0106. Available at: https://marine.gov.scot/datafiles/lot/bowl/ES/ES%20Volume%204%20-%20Annexs/7B%20OfTW%20Underwater%20Noise/Annex%207B%20OfTW%20Underwater%20Noise.pdf
Nedwell J., Howell D. (2004). A review of offshore windfarm related underwater noise sources. Cowrie Rep. 544, 1–57.
Nedwell J., Langworthy J., Howell D. (2003). Assessment of sub-sea acoustic noise and vibration from offshore wind turbines and its impact on marine wildlife; initial measurements of underwater noise during construction of offshore windfarms, and comparison with background noise. Subacoustech Rep. ref: 544R0423 published by COWRIE 725. Available at: http://users.ece.utexas.edu/~ling/2A_EU1.pdf
Pangerc T., Theobald P. D., Wang L. S., Robinson S. P., Lepper P. A. (2016). Measurement and characterisation of radiated underwater sound from a 3.6 MW monopile wind turbine. J. Acoust. Soc. Am. 140, 2913–2922. doi: 10.1121/1.4964824
Popper A. N., Hice-Dunton L., Jenkins E., Higgs D. M., Krebs J., Mooney A., et al. (2022). Offshore wind energy development: Research priorities for sound and vibration effects on fishes and aquatic invertebrates. J. Acoust. Soc. Am. 151, 205–215. doi: 10.1121/10.0009237
Reinhall P. G., Dahl P. H. (2011). Underwater Mach wave radiation from impact pile driving: Theory and observation. J. Acoust. Soc. Am. 130, 1209–1216. doi: 10.1121/1.3614540
Richardson W. J., Greene C. R. Jr., Malme C. I., Thomson D. H. (2013). Marine mammals and noise (San Diego: Academic Press).
Robinson S. P., Lepper P. A., Hazelwood R. A. (2014). Good practice guide for underwater noise measurement (Technical report, National Measurement Office, Marine Scotland, The Crown Estate). doi: 10.25607/OBP-21
Shonberg A., Harte M., Aghakouchak A., Brown C., Andrade M. P., Liingaard M. (2017). “Suction bucket jackets for offshore wind turbines: applications from in situ observations,” in Proc. TC209 Workshop, 19th International Conference on Soil Mechanics and Geotechnical Engineering, Seoul, South Korea. p65–p77. Available at: https://scholar.google.com/scholar_lookup?title=Suction%20bucket%20jackets%20for%20offshore%20wind%20turbines%3A%20applications%20from%20in%20situ%20observations&author=A.%20Shonberg&publication_year=2017
Southall B. L. (2021). Evolutions in marine mammal noise exposure criteria. Acoustics Today 17, 52–60. doi: 10.1121/AT.2021.17.2.52
Southall B. L., Finneran J. J., Reichmuth C., Nachtigall P. E., Ketten D. R., Bowles A. E., et al. (2019). Marine mammal noise exposure criteria: Updated scientific recommendations for residual hearing effects. Aquat. Mamm. 45, 125–232. doi: 10.1578/AM.45.2.2019.125
Thomsen F., Lüdemann K., Kafemann R., Piper W. (2006). Effects of offshore wind farm noise on marine mammals and fish (Newbury, UK: Biola, Hamburg, Germany on behalf of COWRIE Ltd.), 62pp.
Todd V. L., Williamson L. D., Jiang J., Cox S. E., Todd I. B., Ruffert M. (2020). Proximate underwater soundscape of a north Sea offshore petroleum exploration jack-up drilling rig in the dogger bank. J. Acoust. Soc. Am. 148, 3971–3979. doi: 10.1121/10.0002958
Urick R. J. (1983). Principles of underwater sound. 3rd ed (Peninsula Publising Los Atlos, California: Academic Press), 23–24. Available at: https://books.google.co.jp/books/about/Principles_of_Underwater_Sound.html?id=MBBgQgAACAAJ&redir_esc=y
Wang Z., Wu Y., Duan G., Cao H., Liu J., Wang K., et al. (2014). Assessing the underwater acoustics of the world's largest vibration hammer (OCTA-KONG) and its potential effects on the indo-pacific humpbacked dolphin (Sousa chinensis). PloS One 9, e110590. doi: 10.1371/journal.pone.0110590
Wartzok D., Ketten D. R. (1999). “Marine mammal sensory systems,” in Biology of marine mammals. Eds. Reynolds J. E. II, Rommel S. A. (Washington, DC: Smithsonian Institute Press), 117–175.
Welch P. (1967). The use of fast Fourier transform for the estimation of power spectra: a method based on time averaging over short, modified periodograms. IEEE Trans. Audio Electroacoust. 15, 70–73. doi: 10.1109/TAU.1967.1161901
Yang C.-M., Liu Z.-W., Lü L.-G., Yang G.-B., Huang L.-F., Jiang Y. (2018). Observation and comparison of tower vibration and underwater noise from offshore operational wind turbines in the East China Sea bridge of shanghai. J. Acoust. Soc. Am. 144, EL522–EL527. doi: 10.1121/1.5082983
Keywords: offshore wind farms, geotechnical survey, offshore exploratory drilling, underwater noise, marine mammals
Citation: Huang L-F, Xu X-M, Yang L-L, Huang S-Q, Zhang X-H and Zhou Y-L (2023) Underwater noise characteristics of offshore exploratory drilling and its impact on marine mammals. Front. Mar. Sci. 10:1097701. doi: 10.3389/fmars.2023.1097701
Received: 14 November 2022; Accepted: 09 January 2023;
Published: 02 February 2023.
Edited by:
Lian-Gang Lü, First Institute of Oceanography (FIO), ChinaReviewed by:
Xianyan Wang, Third Institute of Oceanography, ChinaChao Sun, Northwestern Polytechnical University, China
Copyright © 2023 Huang, Xu, Yang, Huang, Zhang and Zhou. This is an open-access article distributed under the terms of the Creative Commons Attribution License (CC BY). The use, distribution or reproduction in other forums is permitted, provided the original author(s) and the copyright owner(s) are credited and that the original publication in this journal is cited, in accordance with accepted academic practice. No use, distribution or reproduction is permitted which does not comply with these terms.
*Correspondence: Xiao-Mei Xu, eG14dUB4bXUuZWR1LmNu