 Yuanxing Xu
 Yan Sun
 Guangjun Xu
 Dazhao Liu1,4*
- 1College of Electronic and Information Engineering, Guangdong Ocean University, Zhanjiang, China
- 2College of Chemistry and Environment, Guangdong Ocean University, Zhanjiang, China
- 3Southern Marine Science and Engineering Guangdong Laboratory (Zhuhai), Zhuhai, China
- 4Guangdong Engineering Technology Research Center for Ocean Remote Sensing and Information Technology, Zhanjiang, China
A particle tracking model for the Lingdingyang Bay of the Pearl River Estuary (PRE) was established based on the Delft3D model. The model was initialized with remote sensing images to simulate the red tide drift-diffusion process in this sea area in the autumn of 2020 and analyze its response to tides, winds and runoffs. The results show that this red tide occurred in the central sea area of the Lingdingyang Bay. The red tide drifted south with the ebb tide and north with flood tide. The red tide spread northward to the waters near Humen and southward to the western waters of Zhuhai. Through the control variable experiments, it is found that the red tide drift-diffusion process was mainly affected by tide and wind, with minimal influence from runoff. The tide expanded the scope of red tide diffusion, and the wind further changed the distribution of red tide. Under the influence of the northeast wind, the red tide gathered on both sides of Lingdingyang Bay. Comparison with the red tide drift-diffusion process in the sea area near Shenzhen Airport shows that the red tide near Neilingding Island easily diffused toward surrounding waters.
1 Introduction
Red tide is a marine ecological anomaly where some microalgae, protozoans, or bacteria proliferate explosively or accumulate to a particular level under certain environmental conditions, resulting in water color changes or causing harm to other marine organisms (Liu et al., 2013; Zohdi and Abbaspour, 2019). Red tide outbreak is characterized by sudden and quick development. It is hard to timely and accurately monitor a red tide outbreak using traditional red tide monitoring methods, such as ship-based sea investigation and onshore artificial observation.
Satellite remote sensing characterizes all-day, all-weather and global observation. It gives us high-frequency, regular, long-term, near-real-time, and rapid access to multi-scale and multi-element information about the global ocean. Independent of geographical location and artificial conditions, satellite remote sensing has been widely used to analyze the temporal and spatial distribution of red tides. Chen et al. (2021) studied the occurrence and extinction characteristics of mixed dinoflagellate red tide in the sea area near Dongtou and Nanji Islands, southern Zhejiang, based on field investigation and the satellite Aqua data from Moderate Resolution Imaging Spectro Radiometer (MODIS). To carry out red tide monitoring, Li et al. (2020a) obtained total suspended matter concentration and red tide index through an inversion method based on remote sensing reflectance data from the Geo-stationary Ocean Color Imager (GOCI) data. Liu et al. (2022) used the high spatial resolution broad band optical satellite data from Chinese satellites GF-1 Wide Field of View (WFV), Haiyang 1D (HY-1D) Coastal Zone Imager (CZI), Sentinel-2 Multi-Spectral Instrument (MSI) and Landsat 8 Operational Land Imager (OLI) to detect fine-scale red tide. In addition, Unmanned Aerial Vehicle (UAV) images can also be used for red tide identification (Cheng et al., 2020; Li et al., 2022).
Satellite remote sensing has an evident advantage in red tide monitoring. However, as a tool that periodically obtains marine element information, satellite remote sensing cannot reflect the quick dynamic change process of the elements. In addition, optical sensors are limited by cloud-covered areas or bad weather, which will lead to the loss of some data. All of these are not conducive for red tide research. However, numerical simulation can make up for the deficiency of satellite remote sensing and field measured data, and fully reproduce the distribution of algae in waters, which is conducive to further explaining the physical processes and mechanisms related to red tide. More and more researchers have used physical models or coupled physical-ecosystem models to simulate the distribution of algae in different water environments indirectly or directly, analyzing their outbreak and maintenance mechanism, drift and diffusion, source and driving force in coastal oceans, bays, estuaries, lakes and other waters. Many researchers used particle tracking models to simulate the movement of red tide in coastal waters. Kuang et al. (2016) and Qin et al. (2017) tracked the red tide drift-diffusion using Fractional Brownian Motion (FBM) particle tracking method. Without considering the process of algae generation and extinction, Soto et al. (2018) and Nogueira et al. (2022) used Lagrangian particle tracking model to explore the bloom dynamics in coastal water. Zhang et al. (2021) used the Lagrangian particle tracking model combined with the biological characteristics to analyze the distribution of alien phytoplankton.
Some researchers established hydrodynamic models to study red tide. Qu et al. (2019) established a hydrodynamic model to simulate the freshwater path of the Yangtze River and explored the hydrodynamic mechanism of summer red tide outbreak in the waters near the Yangtze River Estuary. Weisberg et al. (2019) explained the source and transport mechanism of the red tide on the West Florida continental shelf in 2018 by combining the measured data and the circulation numerical model. Based on the remote sensing image of red tide, Zhao and Ghedira (2014) used the results of the Hybrid Coordinate Ocean Model (HYCOM) and retrieval of sea surface temperature data from remote sensing to prove that the Arabian gulf red tide broke out offshore in 2008-2009 and was transported to the nearshore through the bottom Ekman layer advection.
The coupled bio-physical models were used to study the germination, initiation, and development of red tide. Considering the physiological processes and physical activities of algae such as growth, death and their movement, Li et al. (2009) established a bio-physical model based on in-situ observations and Regional Ocean Modeling System (ROMS), to reproduce the hydrodynamics and the temporal and spatial distributions of cell concentration. Hayashi and Yanagi (2008) used an ecological model to analyze the changes in material cycle in the Yodo River Estuary of Japan and clarify the reasons for the changes in red tide species.
According to the Guangdong Marine Disasters Bulletin (Department of Natural Resources of Guangdong Province, 2013-2020), 16 red tide events occurred in the PRE sea area during 2013−2020, including seven events occurring in the Zhuhai sea area and nine occurring in the Shenzhen sea area. The main marine organisms causing the red tides included Noctiluca scientillans (4 events), Akashiwo sanguinea (3 events), Heterosigma akashiwo (4 events), Cochlodinium geminatum (4 events), and Skeletonema costatum (1 event), among which Heterosigma akashiwo and Cochlodinium geminatum are poisonous species. In addition, the Heterosigma akashiwo red tides occurred in spring and the Cochlodinium geminatum red tides in autumn. The outbreak of red tide is regional and seasonal, and the species of red tide algae are diverse. Red tide disasters statistics from the Guangdong Marine Disasters Bulletin 2020 show that in 2020, red tide occurred six times in total in the coastal waters of Guangdong Province, including four times in total recorded in the sea areas of the PRE. Both times the red tide impact areas were smaller compared to the previous five years. It is essential to pay more attention to red tide disasters and develop adequate red tide monitoring technologies for the Guangdong-Hong Kong-Macao Great Bay Area construction. In recent years, the red tide research in the PRE mainly focuses on the large-scale temporal and spatial distribution and the analysis of water environment characteristics during the red tide, lacking high-precision dynamic research (Lu and Gan, 2015; Li et al., 2019; Tian et al., 2020). Therefore, this paper establishes a red tide drift-diffusion model based on the remote sensing images obtained by the HY-1C and HY-1D satellites. The Cochlodinium geminatum red tide outbreak in the PRE in the autumn of 2020 is used as a case to analyze the temporal and spatial distribution characteristics of the red tide process, and explore its response to the environment, thus providing a solid reference for monitoring and forecasting red tides.
2 Data and methods
2.1 Study area
This study is conducted over the Lingdingyang Bay of the PRE, located in the middle and south of Guangdong Province and the north of the South China Sea. The estuary area is about 1900 km². The length from the estuary to the open shelf is about 60 km and the width is 10-60 km. Its bathymetry is complicated, and is characterized by two channels and three shoals. The runoff from the Pearl River, with large seasonal variations, flows into the Lingdingyang Bay through four estuaries at Humen, Jiaomen, Hongqili and Hengmen (Figure 1). The flood season from April to September accounts for 80% of the annual runoff. The tides at the PRE are irregular semi-diurnal tides, with a mean tidal range of less than 2 m and a maximum tidal range of up to 3 m. The PRE is located in a subtropical monsoon climate region, where the summer southwest monsoon occurs from May to August and the winter northeast monsoon occurs from October to March. April and September are transition months. The transition process from winter to summer monsoon is rapid, while the transition from summer to winter monsoon is slow.
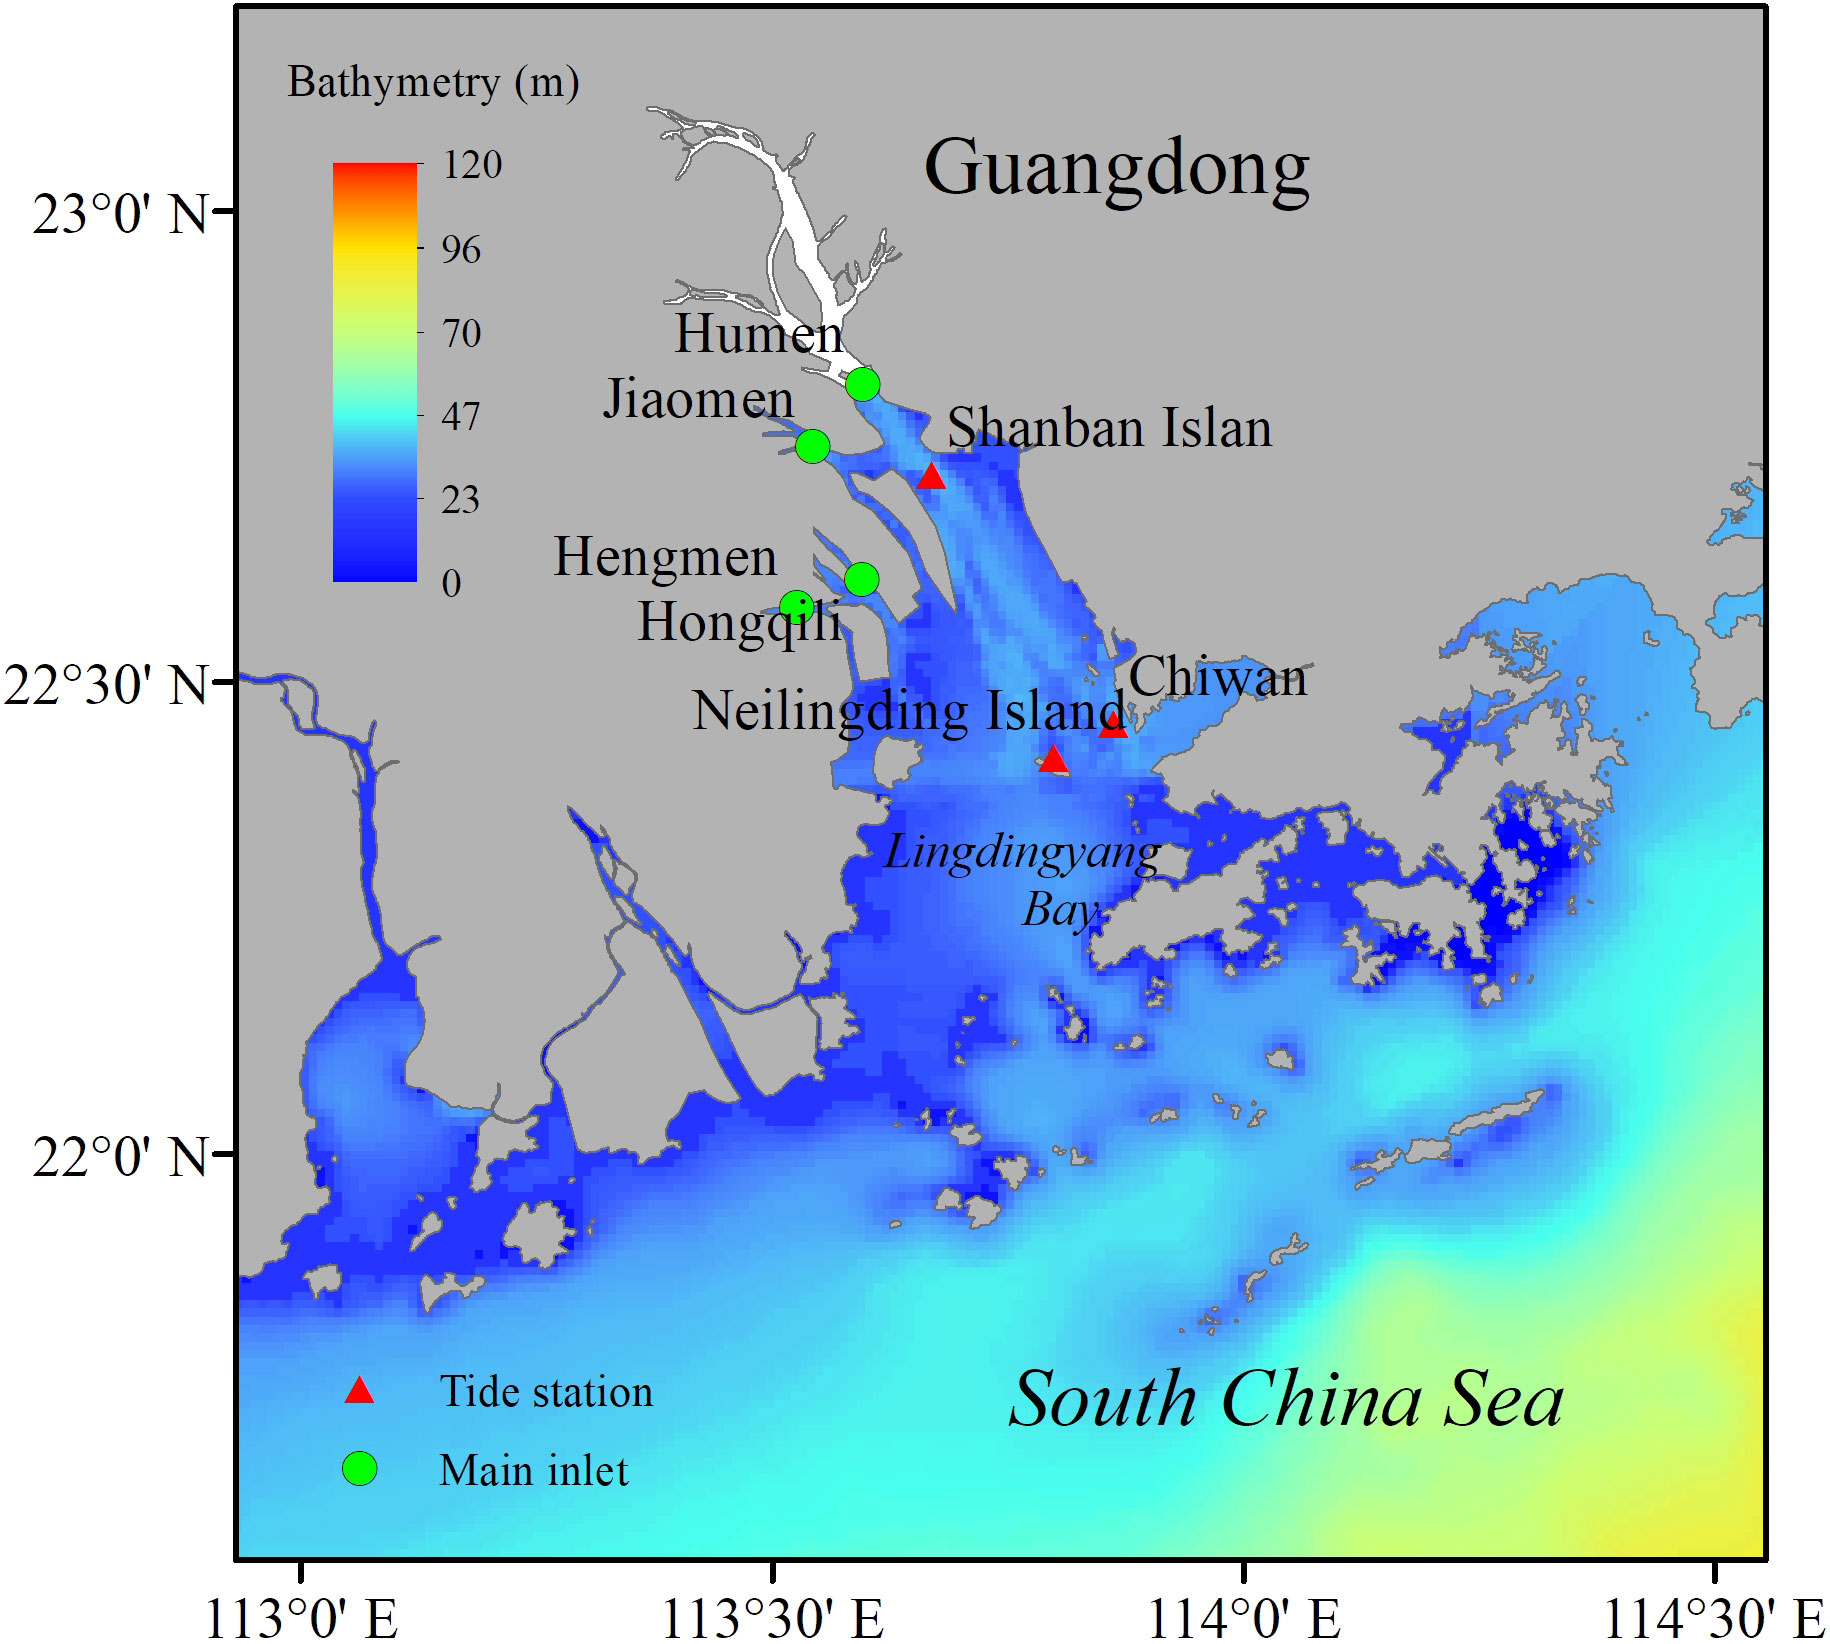
Figure 1 Study area and its bathymetric features.
With the construction of the Guangdong-Hong Kong-Macao Great Bay Area, the rapid development of industry and the continuous increase of population, pollutants from various sources enter the waters of the PRE through runoff, direct coastal discharge and atmospheric dry and wet deposition, which makes the water quality of the estuary deteriorate and water eutrophication. According to the 2020 offshore water quality monitoring information of Guangdong (Department of Ecology and Environment of Guangdong Province, http://gdee.gd.gov.cn/), dissolved inorganic nitrogen (DIN) and reactive phosphate exceeded the standard in most waters of the PRE in spring, summer and autumn, providing certain material conditions for the outbreak of red tide.
2.2 Remote sensing and processing
The coastal zone imagers (CZI) carried by Haiyang-1 C/D satellites (HY-1C/HY-1D) can identify red tides well. Since their launch, the satellites have detected red tides in areas such as the Liaodong Bay of the Bohai Sea, the Tianjin Binhai New Area of the East China Sea, and the Shenzhen sea area of the PRE (Liu et al., 2020). These satellites have become powerful tools for marine ecological environment monitoring. We use the HY-1C/HY-1D Rayleigh-corrected products to identify the red tide.
2.3 Numerical simulation
The Delft3D modeling system developed by Deltares, including Delft3D-FLOW (the hydrodynamic module), Delft3D-WAVE (the wave module), D-Water Quality (the far-field water quality module), D-WAQ PART (the mid-field water quality and particle tracking module), Delft3D-ECO (the ecological modeling module) and Delft3D-SED (the cohesive and non-cohesive sediment transport module), is capable of simulating flows, sediment transports, waves, water quality, morphological developments and ecology in coastal waters, rivers, estuaries and lakes (Deltares, 2018a).
Hydrodynamic flow is simulated with the FLOW module, which solves the unsteady shallow water equations in two (depth-averaged) or three dimensions (Deltares, 2018a). Many studies have shown that Delft3D has been shown to be robust and accurate in predicting near-shore flows (Chu, 2019; Seiler et al., 2020; Lapietra et al., 2022). D-WAQ PART is a random walk particle tracking model suitable for research application in a moderate scale range (200-15000m). It calculates the dynamic concentration distribution by tracking the paths of thousands of particles over time (Deltares, 2018b). The model can simulate salts, petroleum, temperature, and other conservative or simple decaying substances (Bigdeli et al., 2022; Li et al., 2022). In our research, simulation experiments of the hydrodynamic environment in the Lingdingyang Bay sea area of the PRE are carried out with the Delft3D-FLOW and the simulation of red tide drift-diffusion is conducted by coupling the D-WAQ PART.
2.4 Model establishment
2.4.1 Hydrodynamic numerical model
Three-dimensional tidal current models for the Lingdingyang Bay sea area of the PRE are established with nested. The outer domain covers the PRE and some waters outside the PRE (20.5°-23° N and 112.5°-115.5° E), with grids of 9225 and grid resolution of 700-5700 m (Figure 2A). The nested domain covers the Lingdingyang Bay (22°10′-22°50′ N and 113°30′-114° E), with grids of 31009 and resolution of 200-500 m (Figure 2B). The bathymetry data is obtained from ETOPO1. In addition, the water depth data of Lingdingyang Bay is corrected with the high-accuracy electronic nautical chart drawn by the China Navy Hydrographic Office. The tidal forcing is added to the open boundaries and imposed on the elevation and the barotropic velocities in the outer domain. It is derived from the harmonic constants of 8 main tidal components (M2, N2, S2, K2, K1, P1, O1, Q1) provided in the global tide model established by the Oregon State University (Egbert and Erofeeva, 2002). The river discharge boundaries include the estuaries at Humen, Jiaomen, Hongqili, and Hengmen. Owing to the lack of observed data at each outlet, the daily discharge data recorded at the Sanshui, Makou and Boluo gauge stations (https://zjhy.mot.gov.cn/zhuhangsj/) can be used to obtain appropriate river discharge boundaries. The total runoff data of each station in wet season: Humen accounts for 12.1%, Jiaomen accounts for 14%, Hongqili accounts for 13.2%, Hengmen accounts for 16.2%, and Modaomen accounts for 29.6% (Zhang and Li, 2010). However, because the river discharge boundaries in the model are located in the tidal reach, they are greatly affected by the tide in the dry season. The boundary flow rate at the cross-section of every outlet during dry season is replaced with the product of tidal current speed and cross-section area according to the model setting situations (Table 1). The nested interpolated values on the open boundary of the nested domain are from the water level data of the outer domain. The wind speed and direction are based on the daily meteorological data of Hong Kong International Airport released by the Hong Kong Observatory (https://www.hko.gov.hk/sc/index.html). Referring to relevant literature and calibration, the manning coefficient (0.016-0.02) is used as the roughness coefficient to calculate the bottom roughness. The eddy viscosity coefficient is set to 10 m²/s and 1 m²/s in the outer domain and nested domain, respectively (Deltares, 2008). The time step is 10 and 5 minutes in the outer domain and nested domain, respectively. A cold start is used for the model and the simulation period is from September 1, 2020 to December 1, 2020.
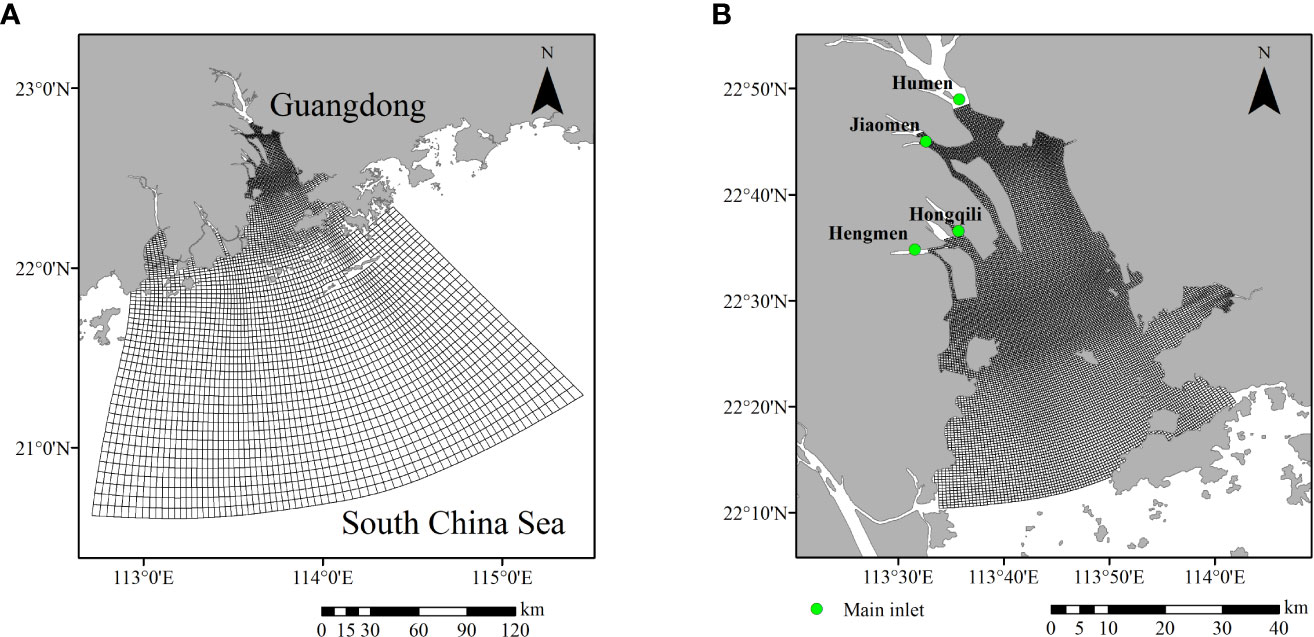
Figure 2 Model grids of (A) the PRE and some open waters; and (B) Lingdingyang Bay.
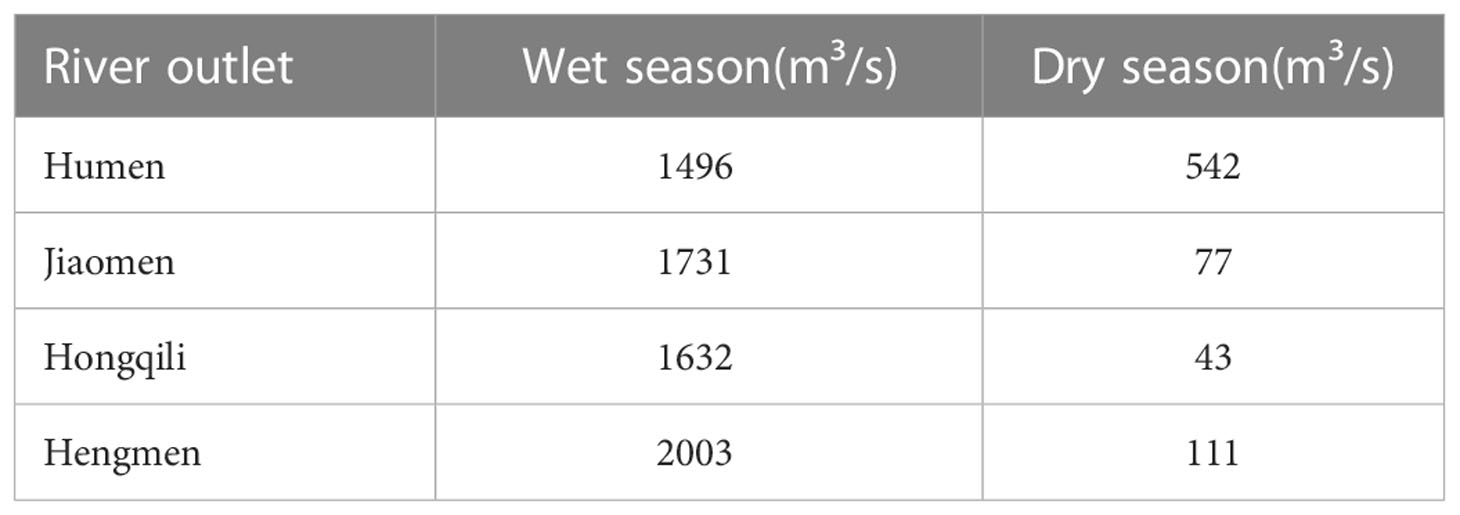
Table 1 Discharge at the eight outlets.
The runoff of the Pearl River decreases greatly in the dry season, and most of the water columns in the PRE are fully mixed (Lu and Gan, 2015). There is almost no salinity stratification in most areas, which results in weak barotropic flow. Therefore, the baroclinic effect driven by salinity is not considered in the models (Wang, 2014).
2.4.2 Particle tracking model
The particle drift-diffusion process is simulated with the PART particle tracking module, based on hydrodynamics simulation in the FLOW module, with the red tide drift-diffusion regarded as surface-layer water mass point motion (Li et al., 2022). The locations of particle release in the model (Figure 3B) are determined according to the red tide distribution captured by the HY-1C satellite (Figure 3A). Zone 1: sea area near Shenzhen Airport at the PRE; and Zone 2: sea area near the northwest of the Neilingding Island. Fifty-two instantaneous release points are set to represent red tides, with each point releasing 10,000 particles. The instantaneous release time is October 26, 2020, 04:00 (UTC+8:00). The simulation period is from October 25, 2020 to November 6, 2020. In this study, control variable experiments are used to compare the red tide drift-diffusion situations under different dynamic conditions (Table 2).
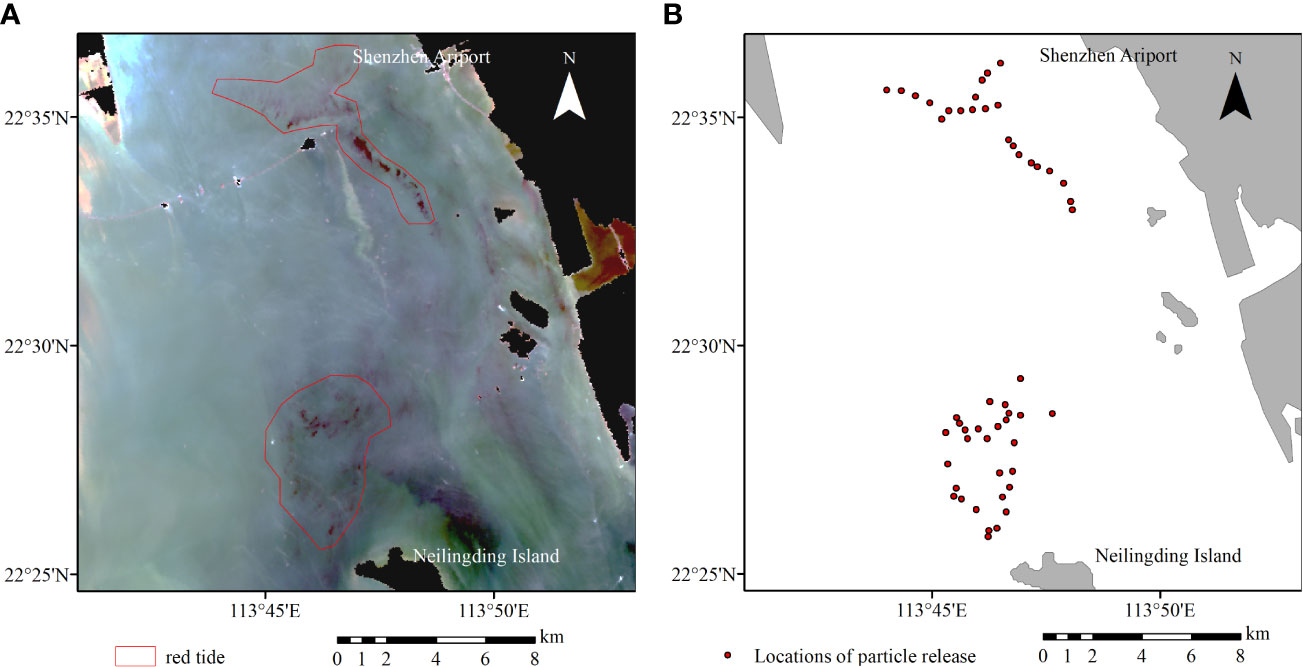
Figure 3 (A) True color composite image from the HY-1C satellite on 26 October, 2020. The red lines delineate areas where red tides occurred; (B) Locations of particle release in the model on 26 October, 2020. 10,000 particles are released at each point to represent the cloud particles of red tides.
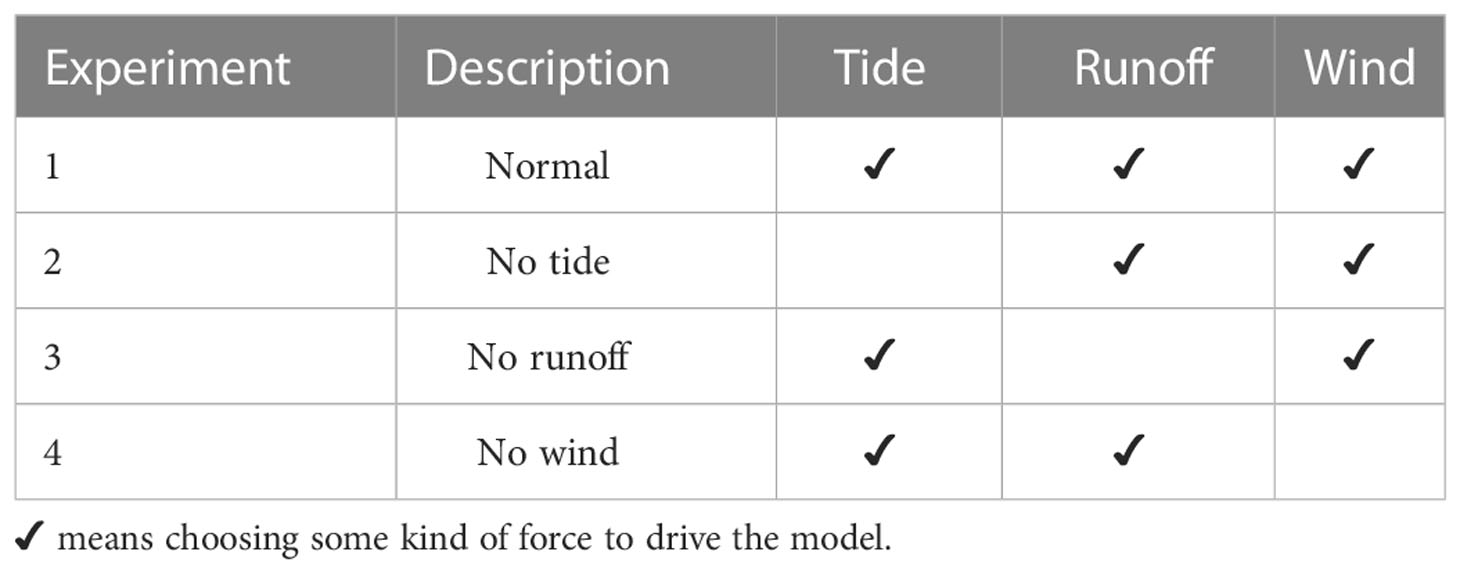
Table 2 List of experiments.
3 Results
3.1 Model validation
3.1.1 Hydrodynamic simulation validation
This paper uses the water level provided by the Guangzhou Port Authority (https://gwj.gz.gov.cn/) to validate the model’s accuracy. The tide stations are located on Shanban Island, Neilingding Island, and Chiwan. As shown in Figure 4, the simulation results accurately reproduce the tide level variation of the PRE. The mean absolute error (MAE) and the root mean square error (RMSE) between the measurements and the simulations were computed for all three tide stations, to evaluate the goodness of fit of the numerical model. The MAE of water level of Shanban Island is 0.21 m and the RMSE is 0.23 m. The MAE of water level of Neilingding Island is 0.16 m and the RMSE is 0.19 m. The MAE of water level of Chiwan is 0.17 m and the RMSE is 0.21 m. The error is acceptable. In addition, the statistical method proposed by Willmott (1981) was adopted to evaluate the model simulation results. Model skill was calculated as follows:
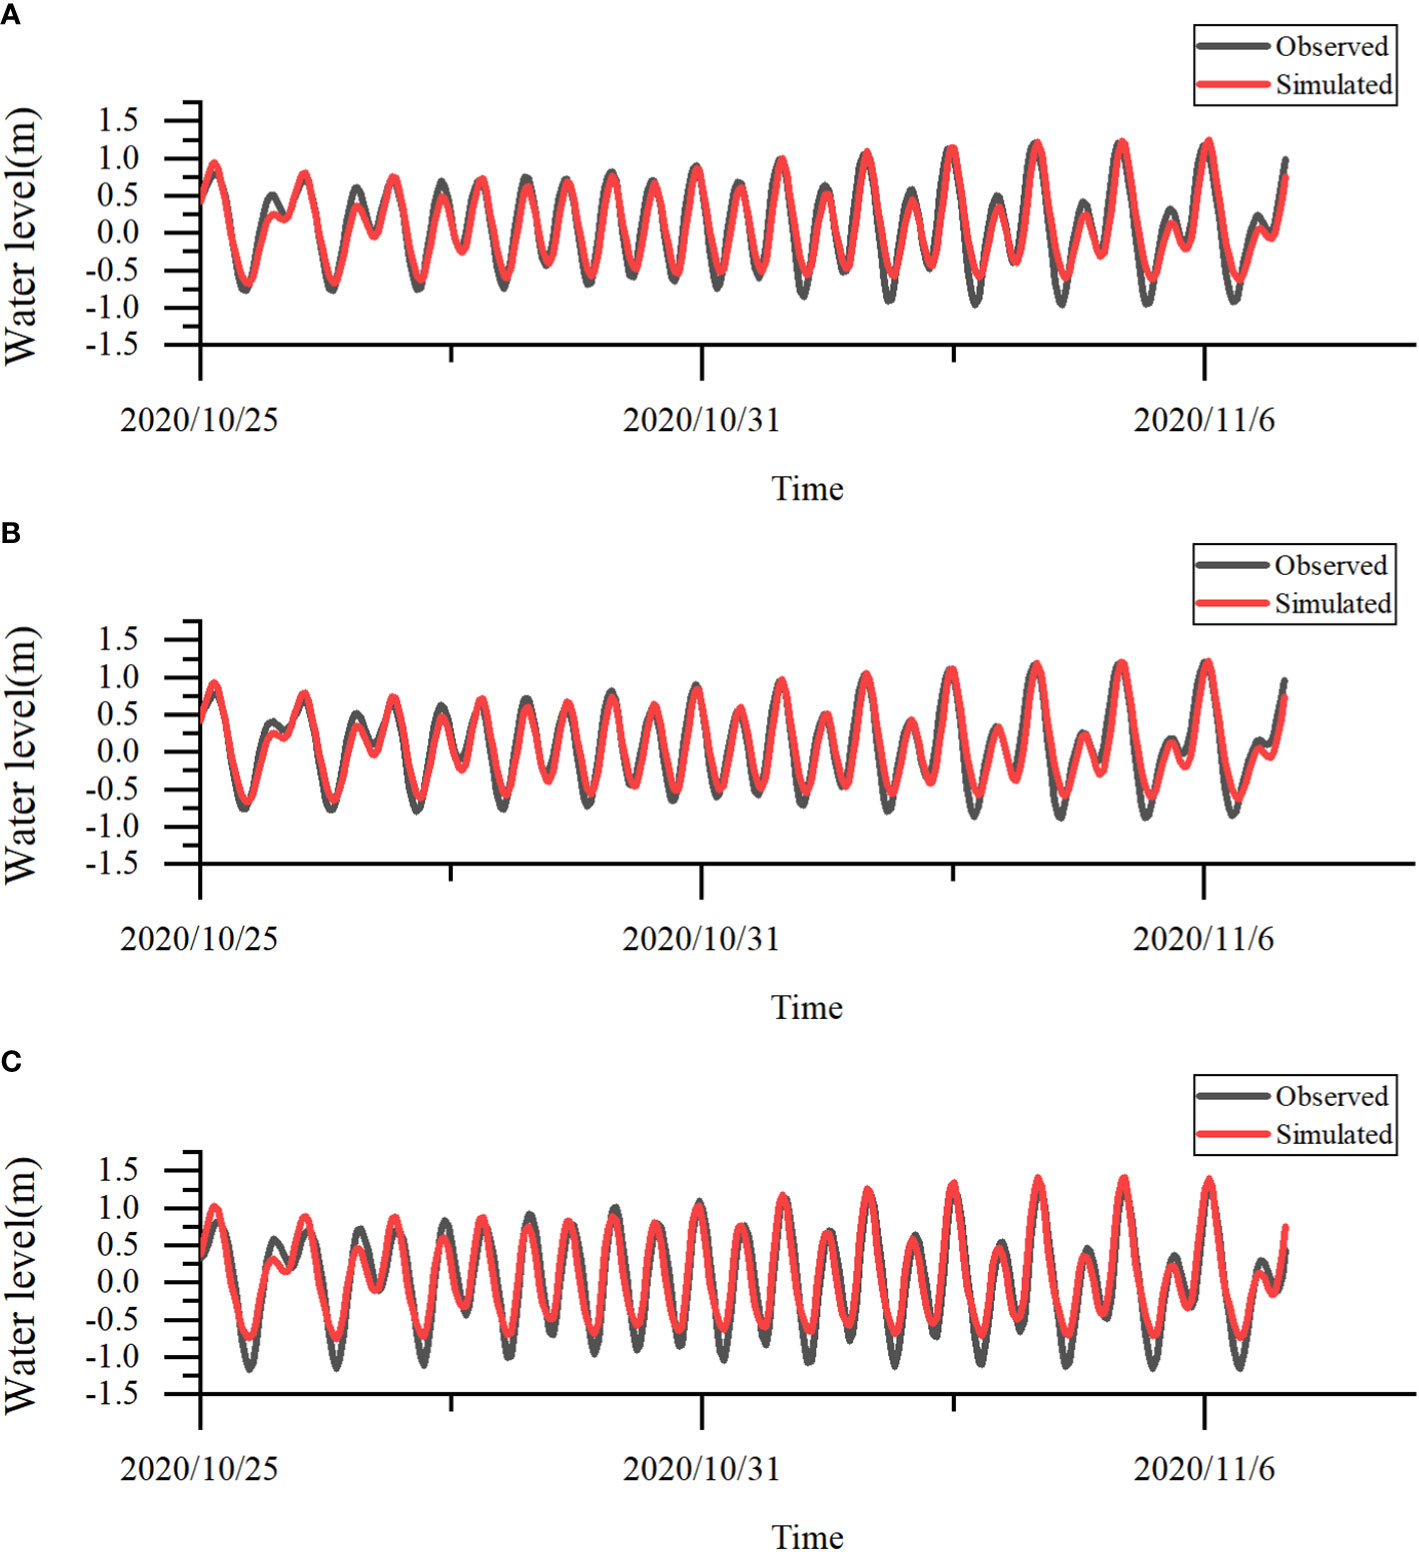
Figure 4 Water level validation at (A) Shanban Island; (B) Neilingding Island; and (C) Chiwan.
The skill value represents the deviation between the measured value and the calculated value. The range of skill value is between 0 and 1. When skill is 1, the calculated value is completely consistent with the measured value. When skill is greater than 0.65, the calculated result of the model is excellent. When skill is between 0.65 and 0.5, the calculated result of the model is very good. When skill is between 0.5 and 0.2, the calculated result of the model is good. When skill is less than 0.2, the calculated result of the model is poor. The skill decreased toward zero as model diverged from observations. In general, the hydrodynamic model can be used for particle diffusion analysis (Table 3).

Table 3 Skill scores from comparison of model with observations.
3.1.2 Comparison between particle drift-diffusion distribution and satellite observation
Figure 5A is true color composite image from the HY-1C satellites. The red lines show the red tide distribution (reddish-brown ribbons). The red tide drifted and diffused to the north and middle of Lingdingyang Bay at 3:25 on November 1. To assess the particle tracking model, the particle diffusion results at the corresponding time is extracted from the model. As shown in Figure 5A, the red tide distribution area contains 568 grids, while the simulation results show that the high concentration particles are mainly concentrated in the red tide distribution area, including 544 grids (Figure 5B). It can be seen that the simulated particle distribution is consistent with the observed red tide distribution. This also indicates that the model’s flow field simulation is good. That is, the particle tracking model established relatively accurately simulates the red tide drift-diffusion process in Lingdingyang Bay in the autumn of 2020.
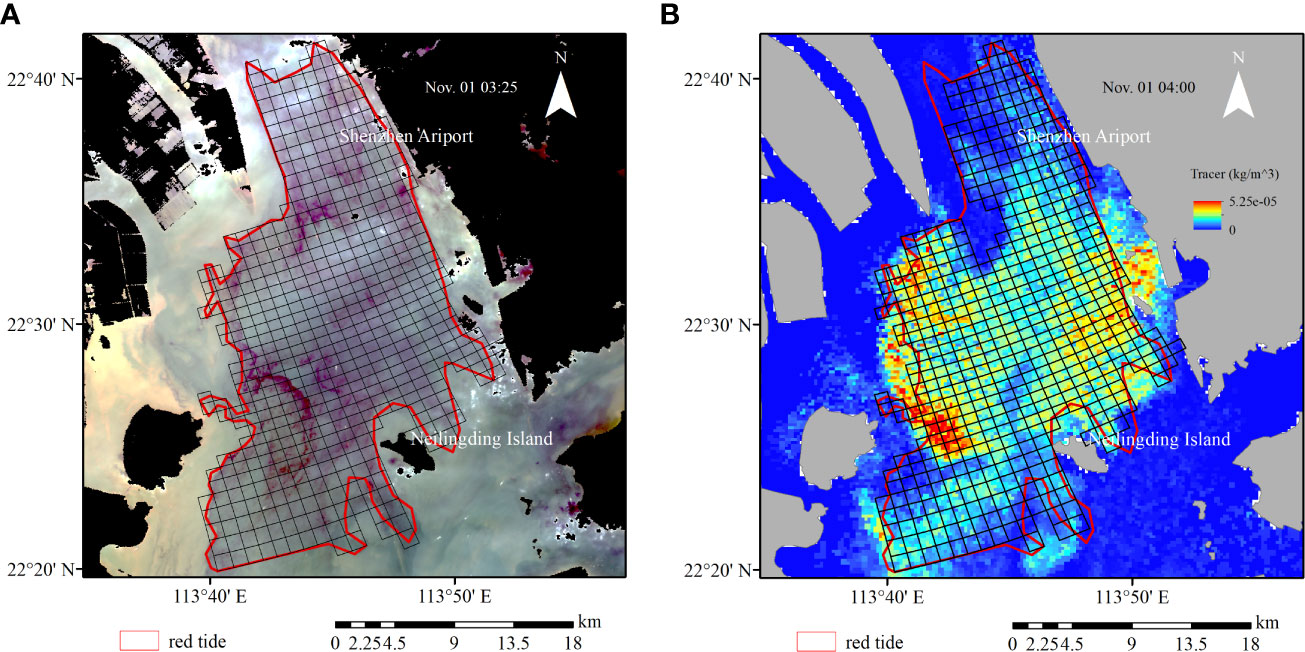
Figure 5 (A) True color composite image from the HY-1C satellite on 1 November. (B) Particle diffusion results on November 1.
3.2 Red tide drift-diffusion process
The features of red tide drift-diffusion are analyzed by extracting the particles cloud distribution at different time points within one tidal period, coupled with water level variation during red tide (Figure 6) from the particle tracking model.

Figure 6 Water level variations during red tide.
Based on the remote sensing data, the instantaneous particle release time for the model was October 26, 2020, 04:00. The red tide started when Lingdingyang Bay was in a flood tide stage. During ebb tide (October 26, 6:00-14:00), the red tide moved southward. The red tide in the sea area near Shenzhen Airport moved southward to the sea area near the west of the Dachan Bay mouth. The red tide in the sea area near the northwest of Neilingding Island moved southward to the sea area near the west of the island, and part of the red tide moved to the sea area 11.3 km away from the island (Figures 7A, B). In the flood tide stage (October 26, 14:00-21:00), the red tide moved northward. The red tide in the sea area near Shenzhen Airport drifted away from the sea area west of the Dachan Bay mouth. The red tide in the sea area near the west and south of Neilingding Island moved northward to the sea area northwest of the island (Figure 7C).
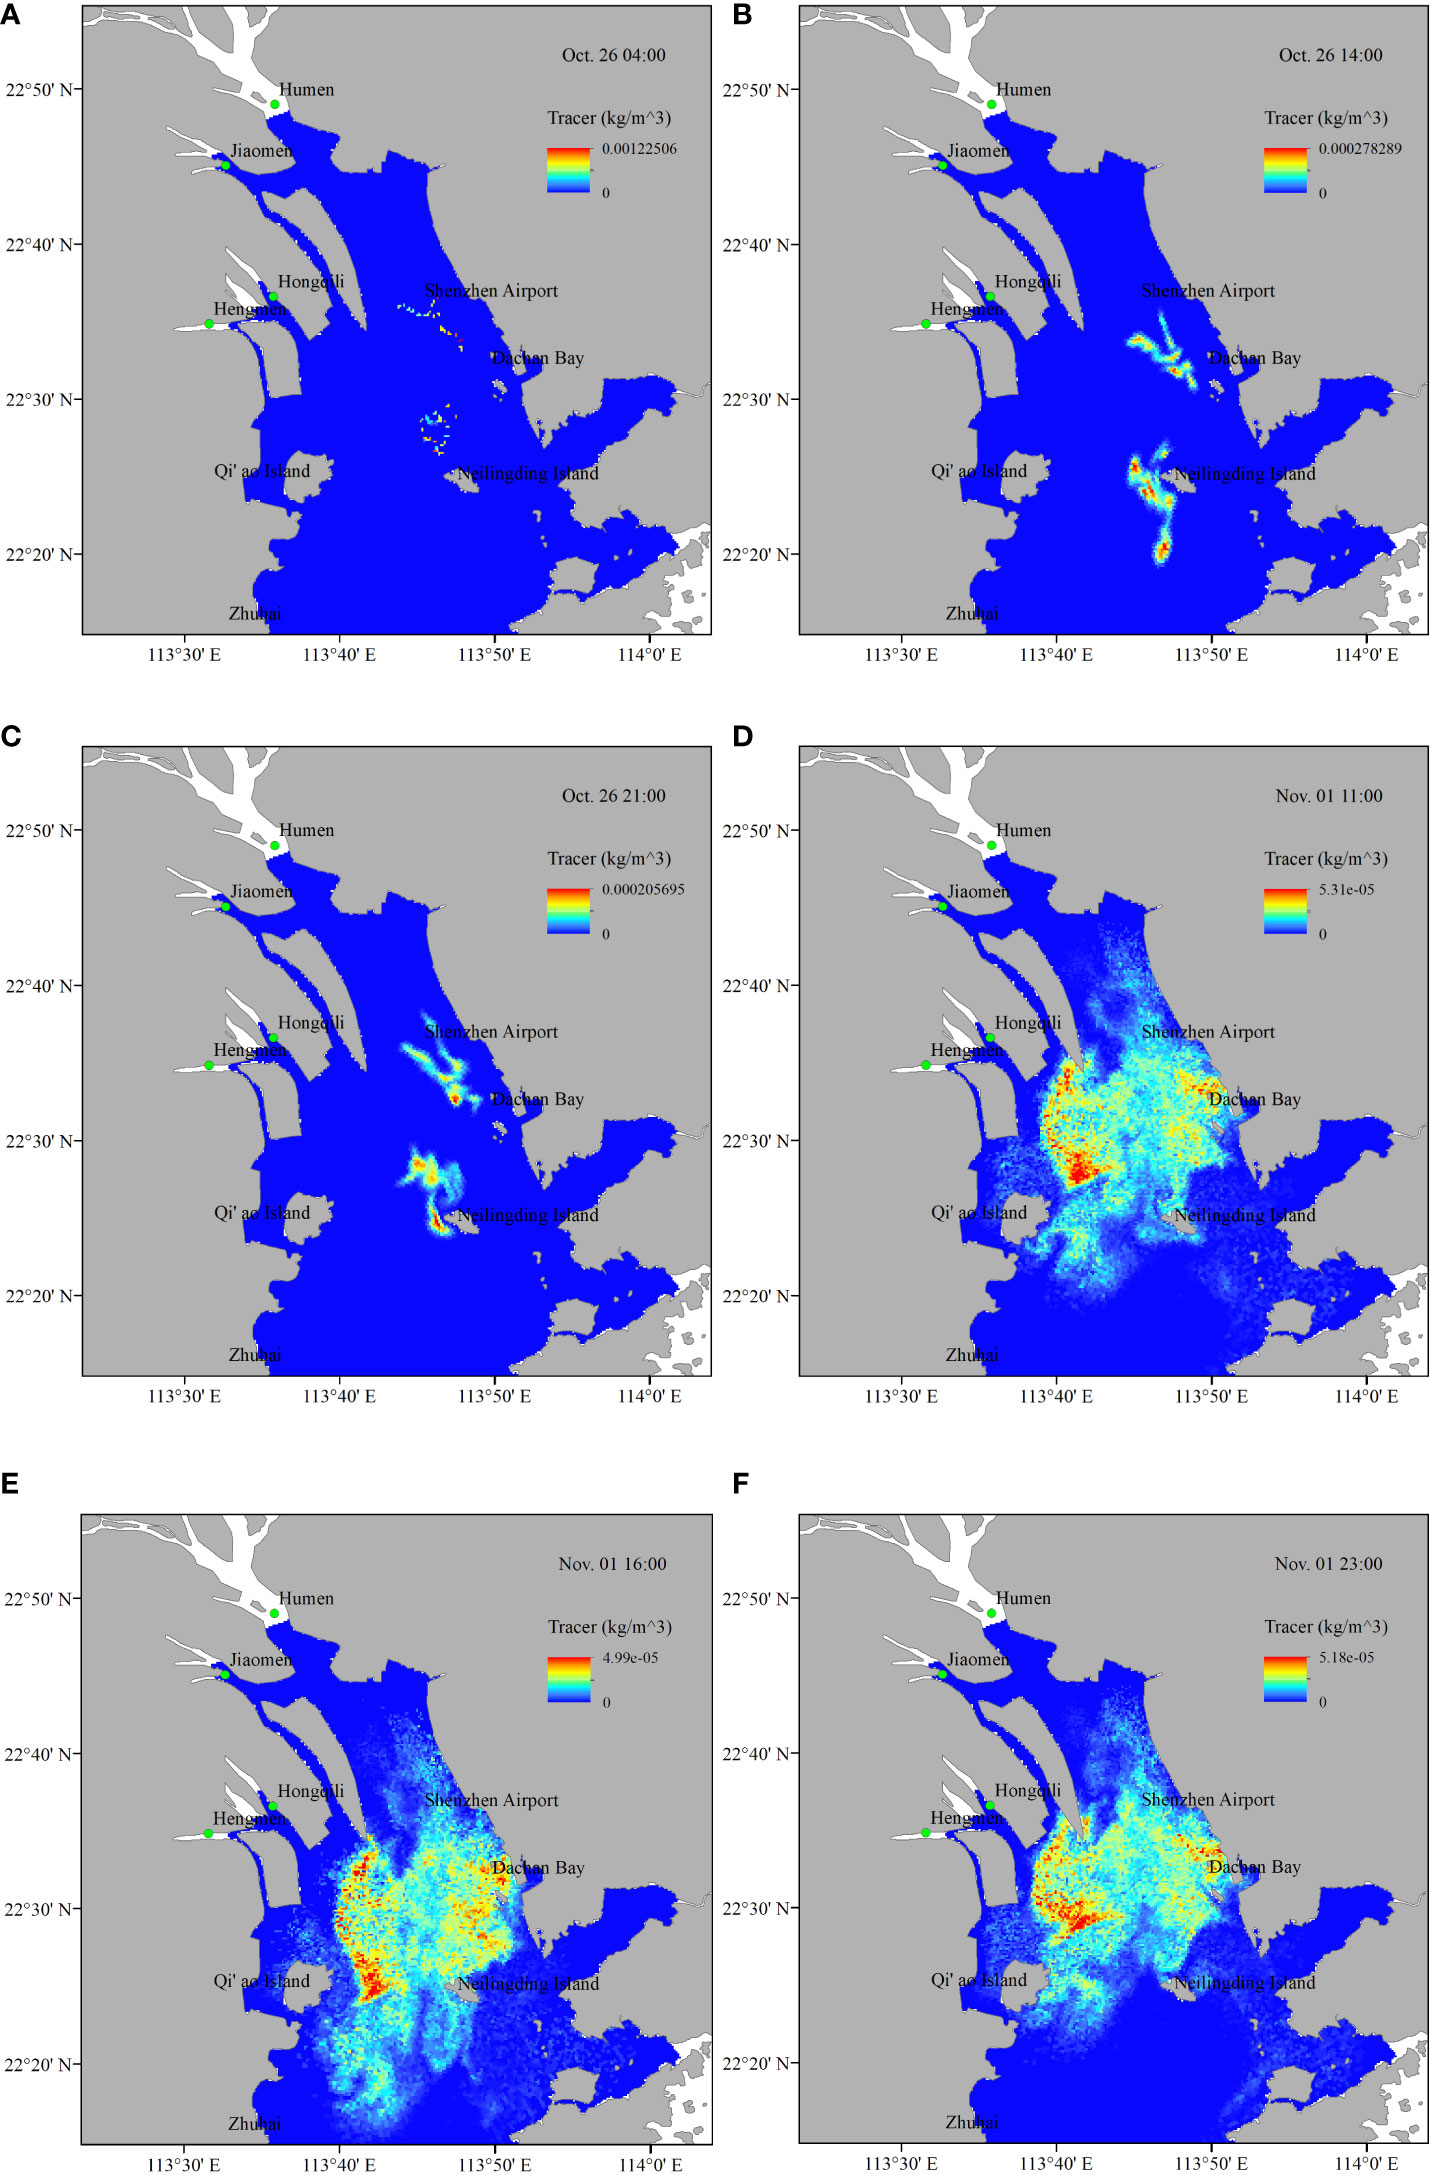
Figure 7 Particles cloud distribution results on (A) October 26, 04:00; (B) October 26, 14:00; (C) October 26, 21:00; (D) November 1, 11:00; (E) November 1, 16:00; and (F) November 1, 23:00.
From the particles cloud distribution (Figures 7D-F) at flood and ebb tides on November 1, it can be seen that the red tide moved southward and northward under the effects of tides. Comparison with the particles cloud distribution on October 26 shows that the red tide in different zones merged into a large patch which was concentrated in the middle of Lingdingyang Bay. The red tide moved northward to the junction of Jiaomen and Humen and moved southward to the sea area near Zhuhai.
3.3 Red tide drift-diffusion control variable experiments
It can be seen from the distribution of particles cloud during a whole tidal period (Figures 7A-C), that the red tide moved north during flood tide and moved south during ebb tide. To discuss the influence of tides on the drift-diffusion of red tide, the distribution of particles cloud without tidal forcing was simulated by experiment 2. Compared with the no tide situation, it can be seen that under the influence of current, particles were distributed in a large area in the middle and south of Lingdingyang Bay (positive value) (Figure 8A). To better illustrate the spatial movement of the particles, the centers of mass of the concentration field in both experiment 1 results and experiment 2 results were derived to represent the movement of the patchy distribution of particles. Without tidal current, the particles moved northward and concentrated in the sea area north of Neilingding Island.
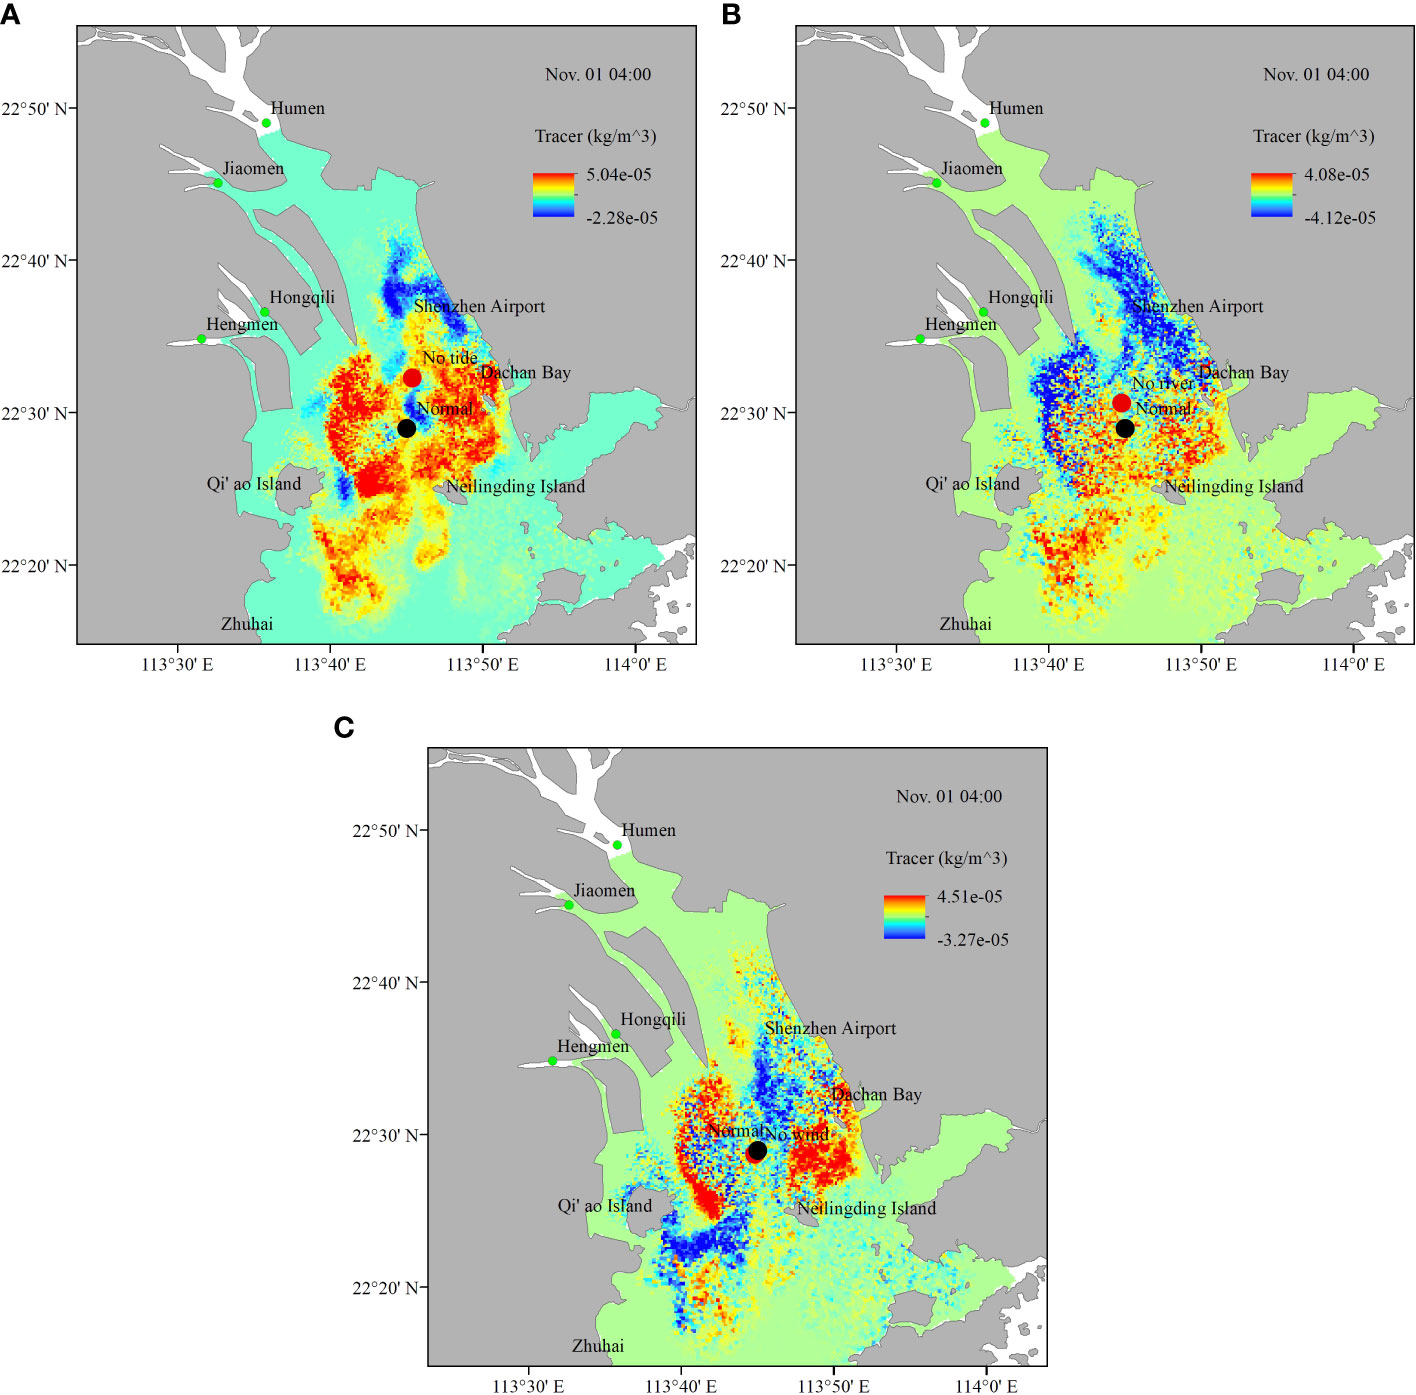
Figure 8 The relative differences in the particles cloud distribution between the experiments. (A) Experiment 1 (Normal) and 2 (No tide); (B) Experiment 1 (Normal) and 3 (No runoff); (C) Experiment 1 (Normal) and 4 (No wind).
Although the runoff into the sea decreases greatly in the dry season, its impact on the flow field of Lingdingyang Bay can’t be ignored. To further explore the influence of runoff on the red tide drift-diffusion process, we simulated the red tide diffusion without runoff input. It can be found that the center of mass shifted northward when there was no runoff input. More particles spread northward to Humen (negative value)(Figure 8B).
The PRE is located in the subtropical monsoon region, which is obviously affected by the monsoon. This study explores the impact of winds on the drift-diffusion of red tide through experiment 4. Comparing the red tide distribution from no wind, it can be seen that high concentration particles gathered on both sides of Lingdingyang Bay (positive value) (Figure 8C).
4 Discussion
4.1 Influence of environments on red tide drift-diffusion process
The flow fields of the flood tide and ebb tide in Lingdingyang Bay during red tide are extracted respectively, and the influence of tidal current on the drift-diffusion of red tide is analyzed. On the whole, the tidal current flowed northward from open waters to the estuary during flood tide. The tidal current mainly flowed northward along the deep trough in the Lingdingyang Bay and a part of the tidal current moved northeastward along Lantau Island into the sea area near Hong Kong Island. A part of the northward moving tidal current flowed northwestward along Qi’ao Island, and another part moved northeastward along Neilingding Island (Figure 9A). During ebb tide, the direction of the tidal current was opposite to that during flood tide. When the tidal current flowed through Qi’ao Island and Neilingding Island, part of the tidal current moved southwestward along Qi’ao Island and then flowed southward. Another part of the tidal current moved southeastward along Neilingding Island and then flowed southward (Figure 9B), owing to the effects of the shape and topography of the islands. The simulated tidal current agrees with previous researchers’ results (Ding et al., 2015; Fang and Liu, 2020; Wang, 2020). The tidal current resulted in a south-north reciprocating motion of the red tide (Figure 7). The tidal current near Qi’ao Island and Neilingding Island included an east-west component in addition to the south-north component, so the red tide northwest of Neilingding Island would move to the surrounding sea areas with flood and ebb tides. It can be seen from the flow speed distribution that the flow speed south of Neilingding Island was greater than that north of the island. Therefore, this red tide had little impact on the upstream area.
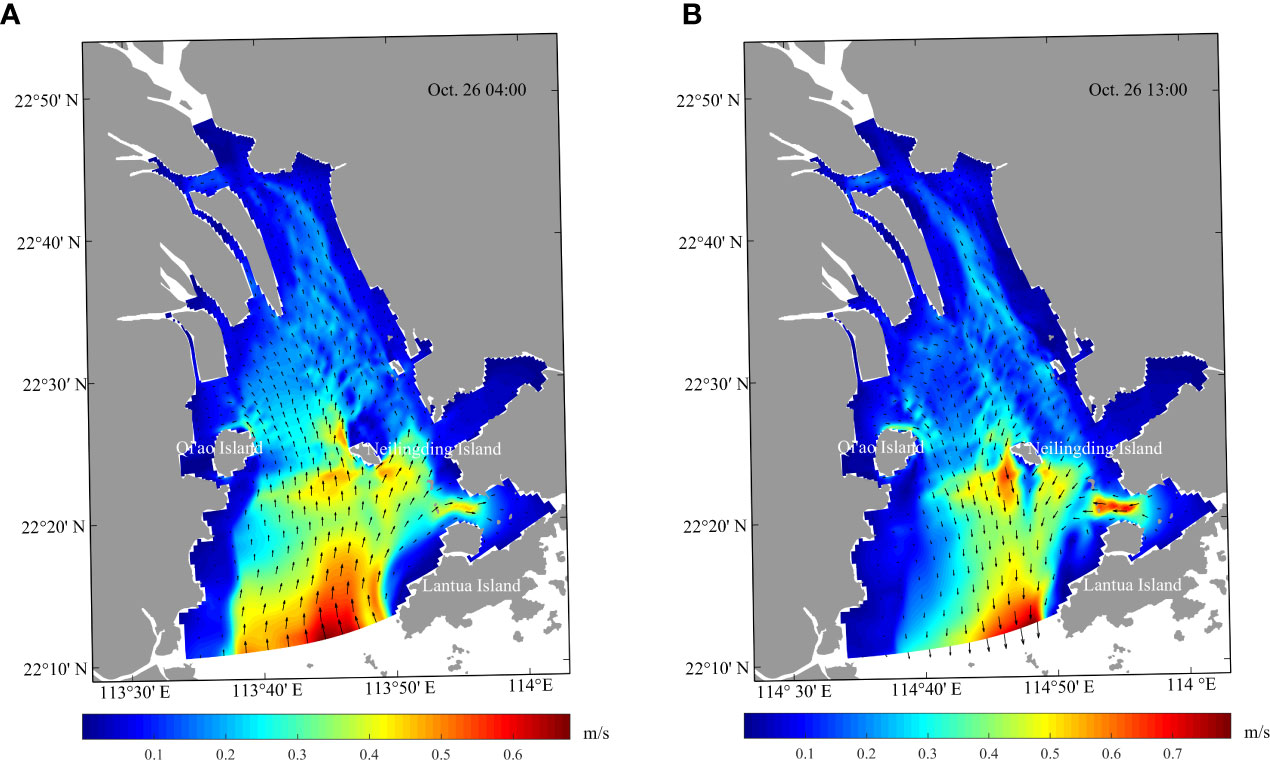
Figure 9 Simulated flow fields during (A) flood tide; and (B) ebb tide.
From October to November, Lingdingyang Bay is dominated by northeast wind, followed by easterly wind and northerly wind (Figure 10A). The wind-driven current in Lingdingyang Bay during the red tide period is obtained through model. As shown in Figure 10B, there is northeast wind-driven current in the west coast. When the wind-driven current flows through Qi’ao Island, it turns northwest and then northeast. In the deep trough area in the middle of Lingdingyang, the wind driven current is mainly northward, and then turns to northwest near the coast of Shenzhen. Relevant research shows that wind forcing is an important factor in transporting algae cells onshore (Li et al., 2020b). Our research also show that the red tide keeps aggregating along the coast under the influence of the northeast wind. High concentration particles are mainly located along the coast of Shenzhen and the central and western coast of Lingdingyang Bay (Figure 8C).
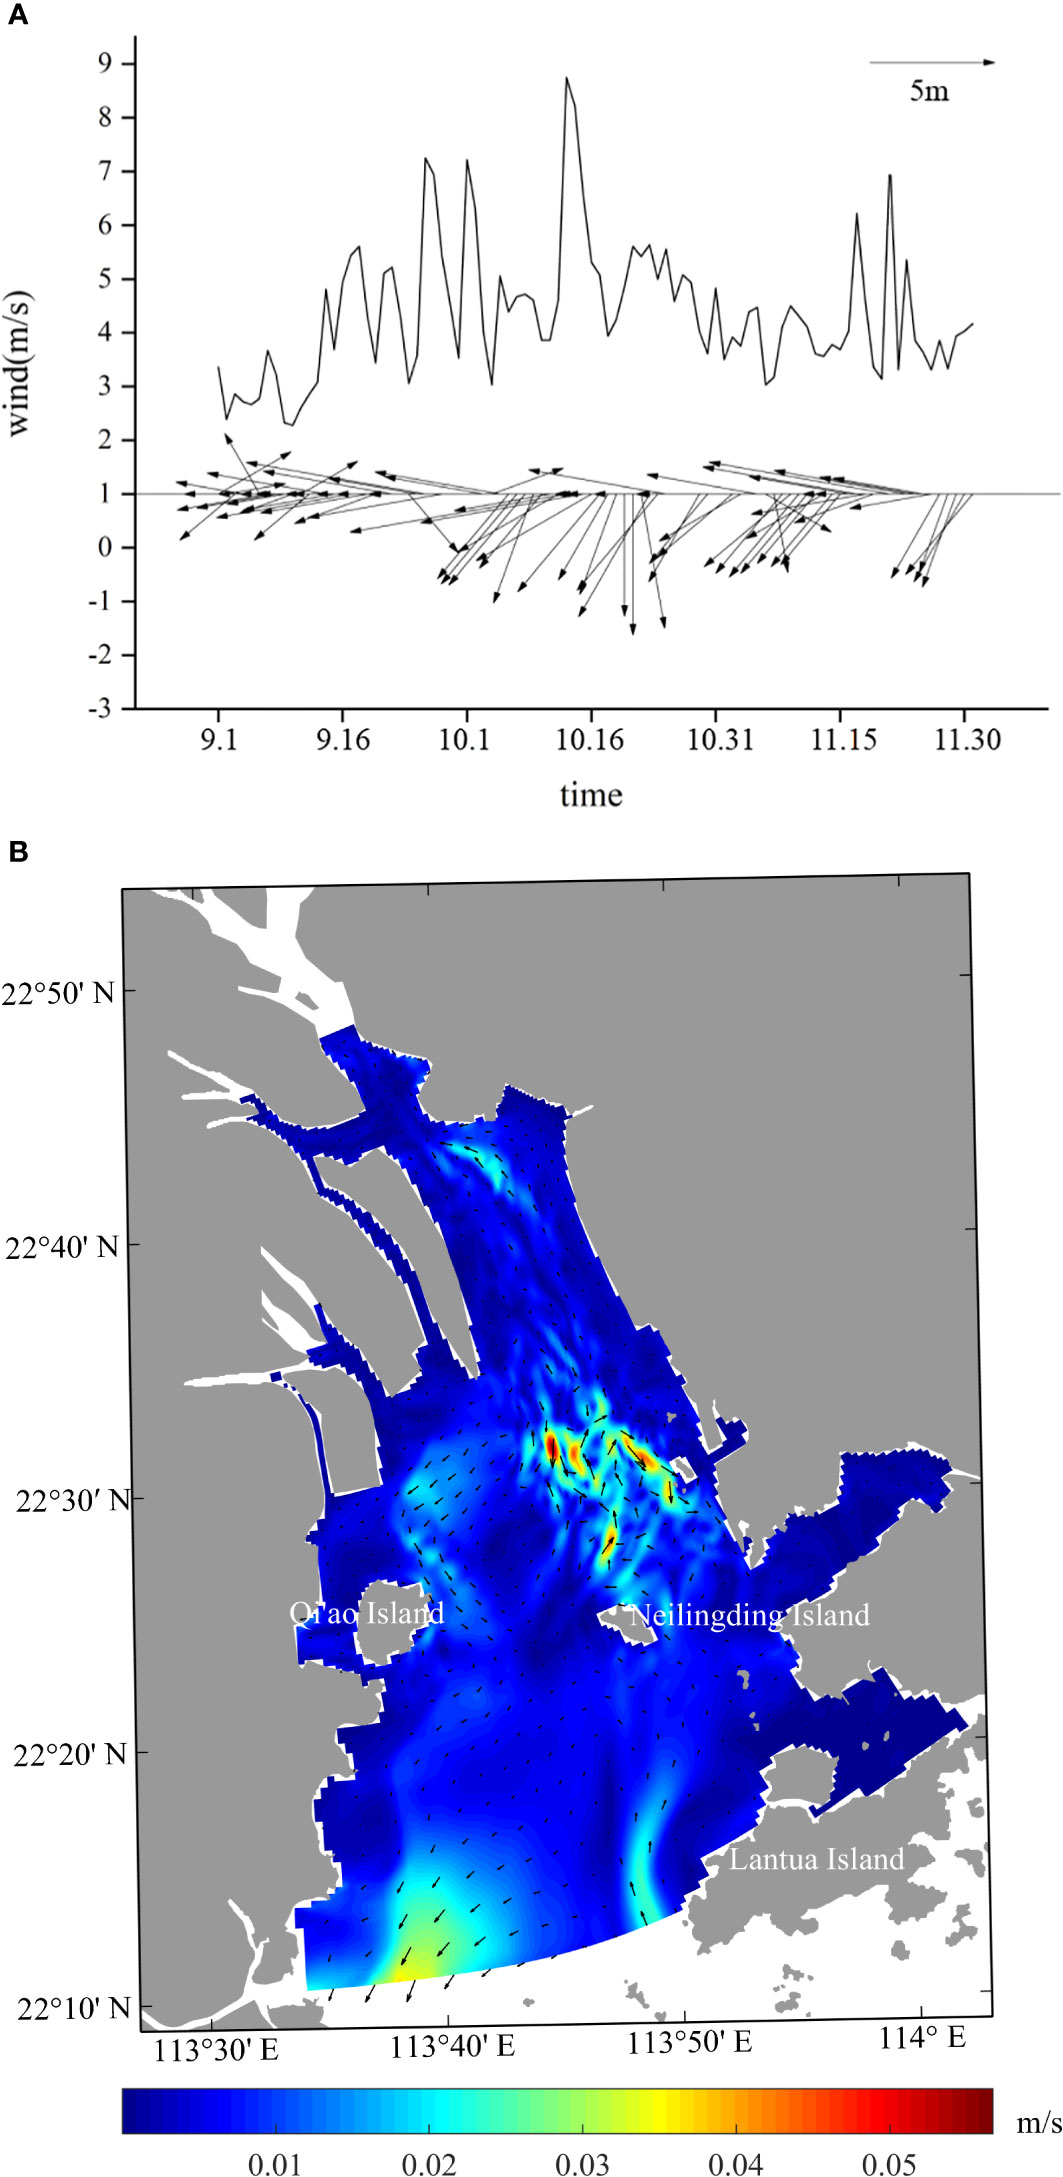
Figure 10 (A) Wind condition from Hong Kong International Airport meteorological station over the PRE; (B) Wind-induced current.
The runoff-induced residual current at Lingdingyang Bay caused by runoff was calculated by the model. It can be seen that there was relatively weak southward run-off-induced residual current, and the velocity was the strongest at the four outlets and deep trough (Figure 11). The runoff at the PRE flows southward from the estuary to open waters, and it hinders the northward tidal current from the open waters during the flood tide stage. So, the runoff limits the northward drift of red tide.
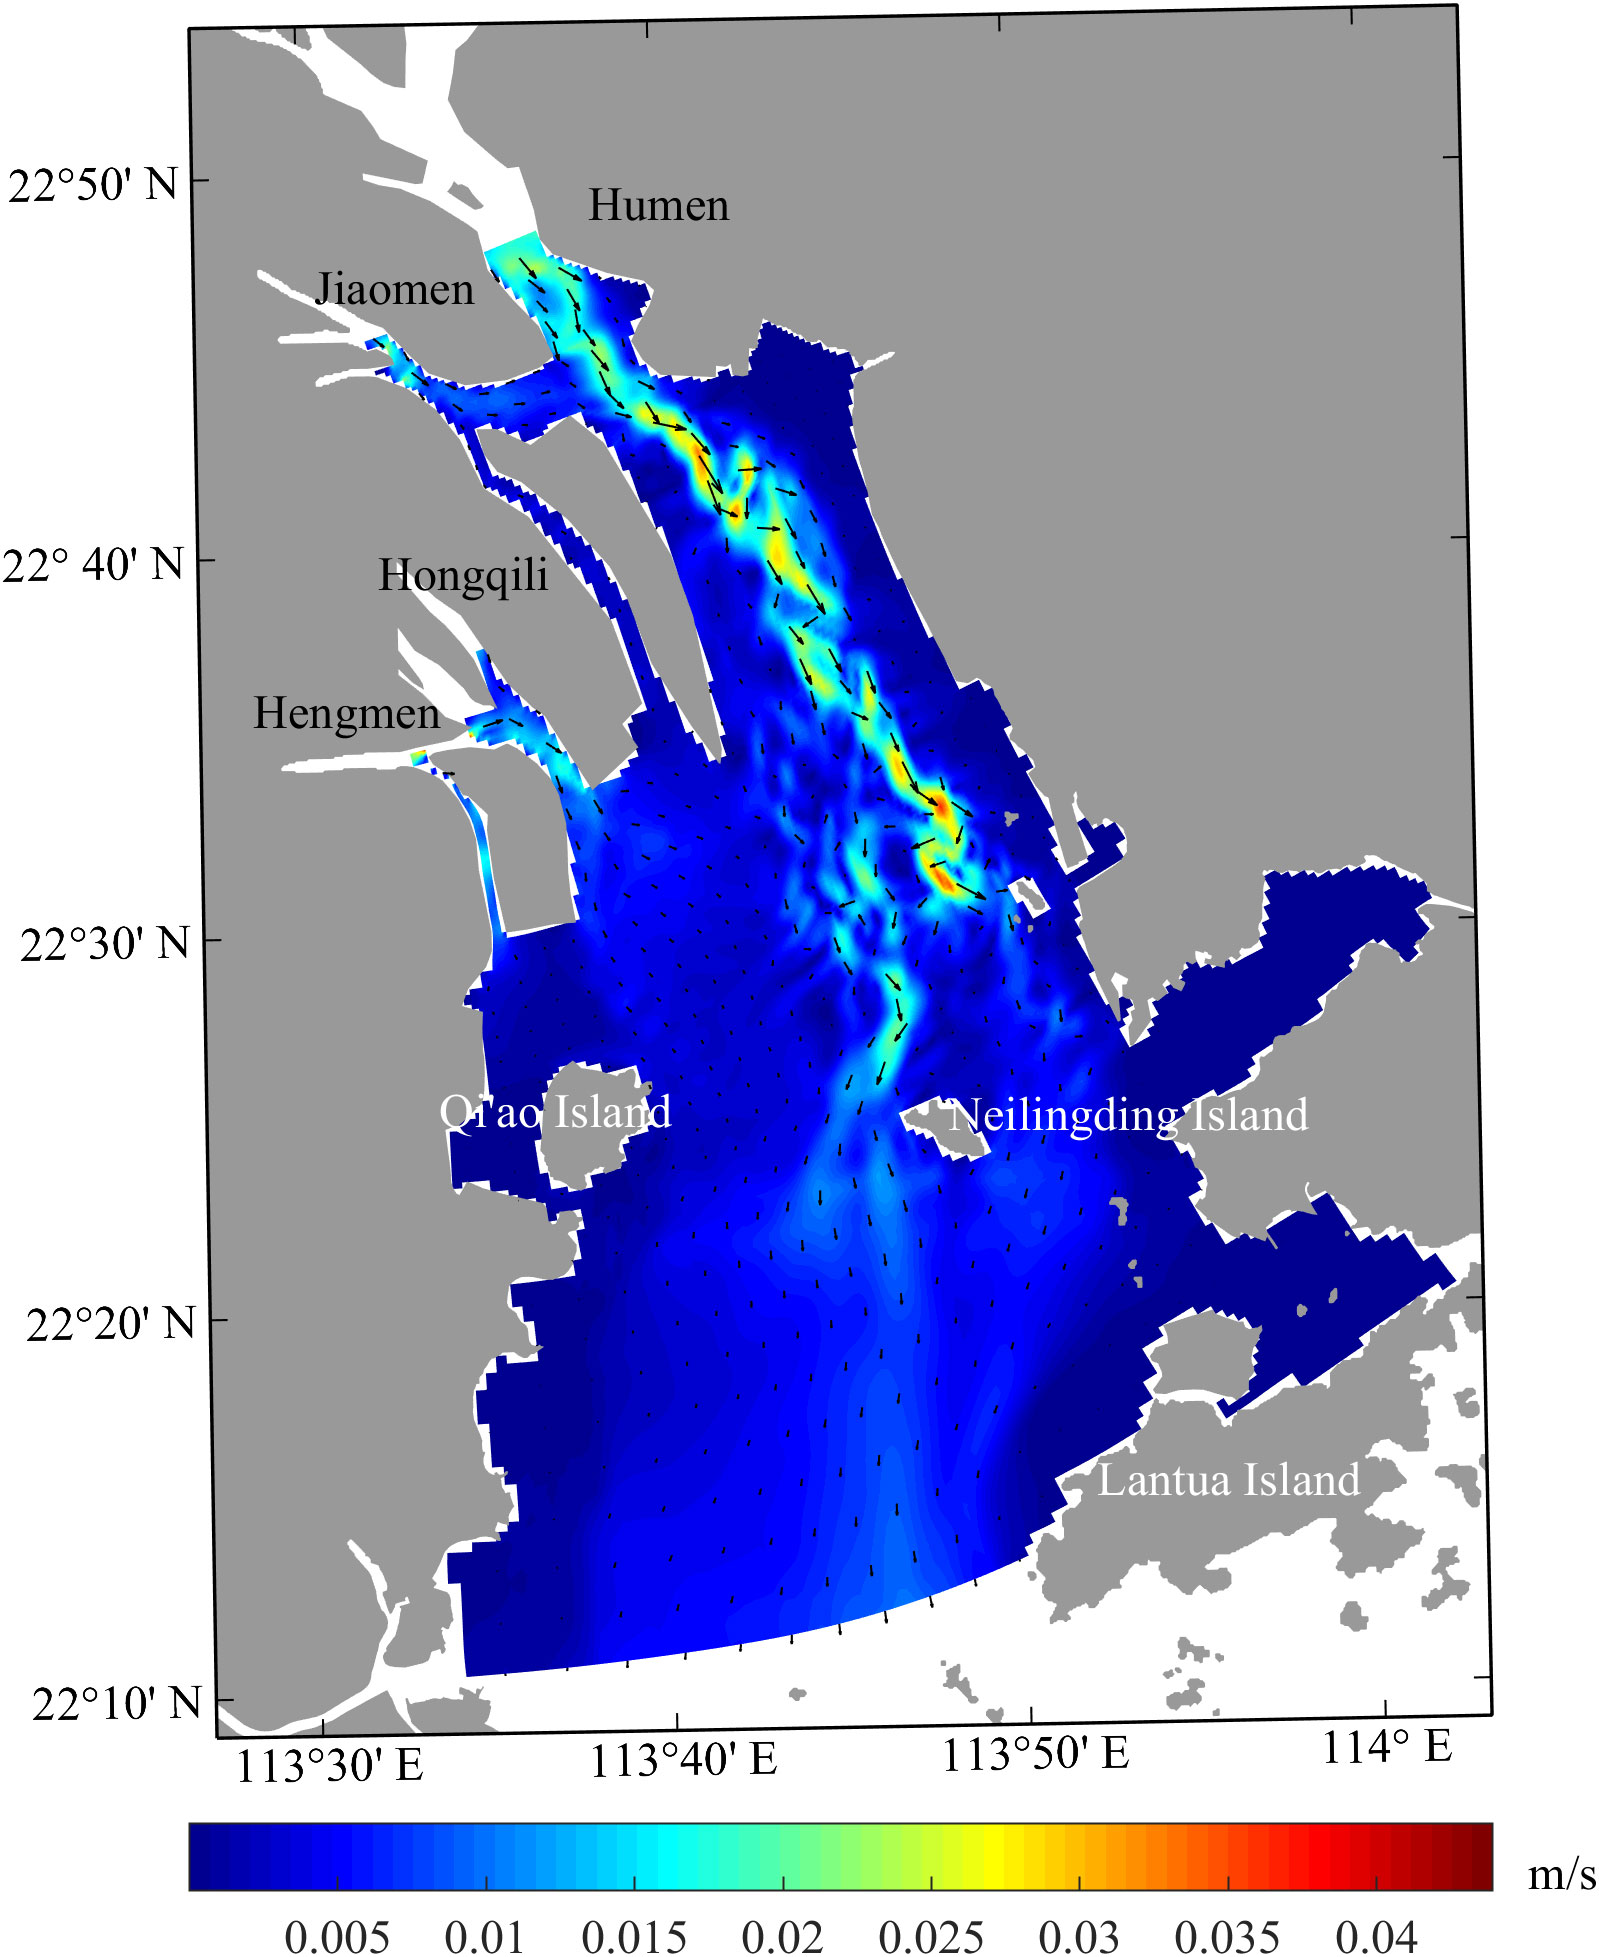
Figure 11 Runoff-induced residual current.
Moreover, two experiments were conducted to explore the regional differences in red tide drift-diffusion. The simulations show that the red tide in the sea area near Shenzhen Airport mainly moved northward for a short distance (Figure 12A), whereas the red tide near Neilingding Island moved to the surrounding waters and drifted northeastward, merging with the red tide in the sea area near Shenzhen Airport (Figure 12B). This indicates that the influence range of the red tide outbreak near Neilingding Island is larger than that of the red tide outbreak in the sea area near Shenzhen Airport. In terms of particles concentration, in the process of particles drift-diffusion in the sea area near Neilingding Island, the particles moved westward obviously, while in the process of particles drift-diffusion in the sea area near Shenzhen airport, the particles moved eastward.
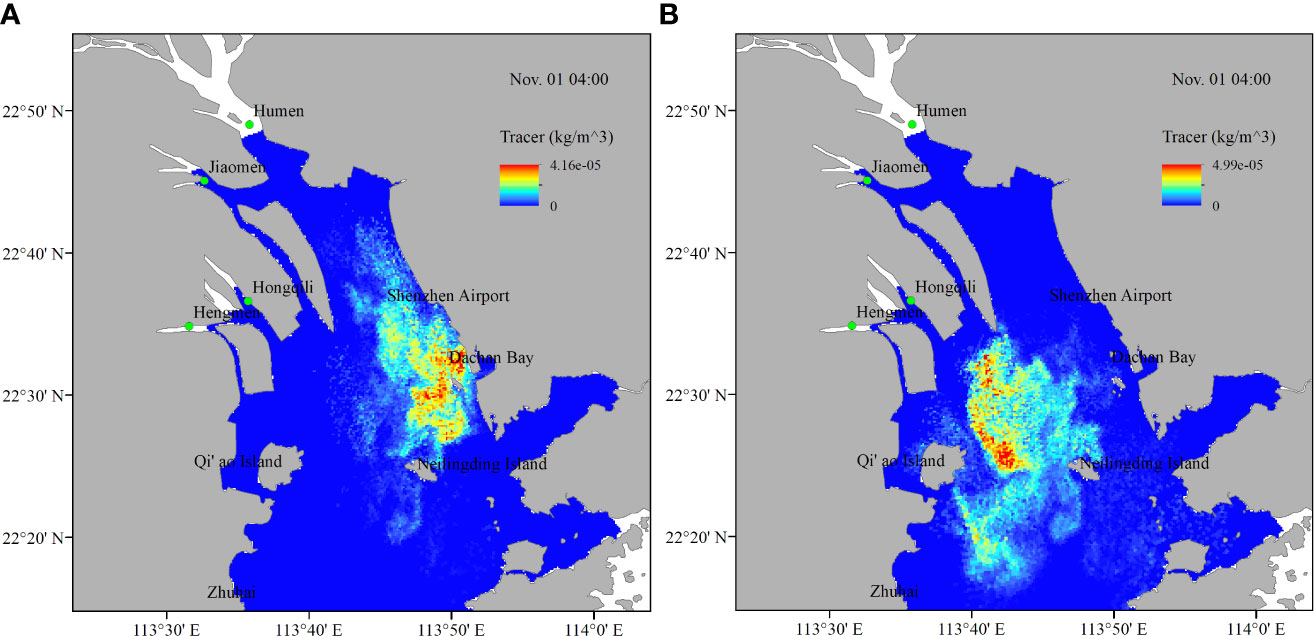
Figure 12 (A) Particles cloud distribution in sea area near Shenzhen Airport and (B) sea area near Neilingding Island.
Neilingding Island is located in the middle of Lingdingyang Bay, close to the downstream of the estuary. It can be seen from the flow fields that the sea area here was greatly affected by the tidal current, and the velocity was relatively strong, so the red tide had a large north-south drift-diffusion distance. In the sea area near Shenzhen Airport, the tidal current was relatively small, so the north-south drift-diffusion distance of the red tide was small (Figures 9A, B).
In the process of particles drift-diffusion in the sea area near Neilingding Island, the particles moved significantly to the west, because the sea area was mainly affected by northeast wind-induced current (Figure 10B). Owing to the northwest wind-driven current and runoff, in the process of particles drift-diffusion in the sea area near Shenzhen Airport, the particles moved southward.
4.2 Uncertainties of the model
4.2.1 The differences between the data and the hydrodynamic numerical model results
Due to the irregular shape and highly dynamic water environment of the Pearl River Estuary coastline, it is very complicated to accurately simulate its hydrodynamics (Deltares, 2008). From the verification results, it can be seen that the closer the distance to the inner estuary, the greater the error. (Shanbanzhou Island > Chiwan > Nelingding Island)
There are differences between the location of the model station and the location of the tidal level station. The model reference coordinate system is Cartesian and the tide station is spherical.
The astronomical tidal component is used as the outer sea boundary condition rather than the measured water level, which is conducive to the use of prediction simulation, but the accuracy of simulation in the past period will be reduced (Deltares, 2008).
In addition, the model system errors (Hu, 2010) and the model parameter correction errors, such as roughness, may also lead to differences between simulated water level and observed data.
4.2.2 The differences between the data and the particle tracking model results
Due to the errors in hydrodynamic simulation, the particle simulation has errors. What’s more, the red tide process is uncertain. The growth and death of red tide are not considered in the model. In fact, the red tide carries out complex physiological processes in a changing environment. Environmental factors such as light, nutrients, temperature, salinity, etc. will affect the red tide. The ignored physiological process of red tide results in the difference between the model results and the observation. In addition, the remote sensing observation is also uncertain. The red tide distribution data comes from remote sensing images. It is difficult to distinguish red tide in turbid water and cloud-covered areas.
4.3 Application of the model
Many scholars have successfully applied numerical simulation to the study of large-scale algal blooms. Based on the establishment of hydrodynamic model, through understanding the characteristics of different algae, a perfect physical and biological coupling algae model is gradually established to simulate its source, growth, movement, extinction and other processes. Based on the particle tracking models applied to large sea areas or harbors, such as the growth and drift model of the Yellow Sea green tide (Gao et al., 2021), the migration and diffusion model of the Qinhuangdao red tide (Kuang et al., 2016), the diffusion model of alien phytoplankton in the Bohai Bay (Zhang et al., 2021), and the Alexandrium catenella red tide in the Gulf of Maine (Li et al., 2020b), this study also used the particle tracking model to study the small-scale red tide that occurred in the PRE on the basis of ignoring the biological process. The model can well reproduce the development process of the red tide in the PRE, and can make up for the shortage of remote sensing data and measured data. Through the control variable experiments, we can more intuitively understand the effect of environmental factors on red tide. Red tide drifts and diffuses under the combined action of tide, wind and runoff. However, more complex water quality and ecological models are needed to study the accurate red tide process, including considering the effects of light, temperature, salinity and nutrients on the growth and death of algae (Zhou et al., 2021), and the vertical movement of algae (Qi et al., 2017).
5 Conclusions
The coupled Delft3D-FLOW particle tracking model for the Lingdingyang Bay sea area of the PRE can accurately simulate the red tide drift-diffusion process outbreak in the sea area near Shenzhen Airport and northeast of Neilingding Island in the autumn of 2020. Only the hydrodynamic process was considered in the model, without the red tide-related ecological process involved. So, the initial outbreak and extinction stage could not be simulated. However, through the combination of remote sensing data and numerical model, the existing simulation results have relatively accurately described the dynamic distribution of the red tide, which is conducive to further explaining the physical processes and mechanisms related to the drift-diffusion of the red tide.
The drivers influencing the red tide drift-diffusion were analyzed through multiple control variable experiments. The red tide drift-diffusion process was mainly influenced by tidal current and with minimal influence from runoff. What’s more, the northeast wind makes the red tide aggregate along the coast.
Comparison with the red tide drift-diffusion process in the sea area near Shenzhen Airport shows that the red tide near Neilingding Island easily diffused toward surrounding waters, because of the strong tidal current, weak runoff in this vast sea area.
Data availability statement
The raw data supporting the conclusions of this article will be made available by the authors, without undue reservation.
Author contributions
YX: data analysis, writing and editing. YX and YS: figure plotting. DL and GX: conceptualization, methodology and reviewing. All authors contributed to the article and approved the submitted version.
Funding
This research is supported by the project supported by Southern Marine Science and Engineering Guangdong Laboratory (Zhuhai) (SML2020SP007), the Guangdong Basic and Applied Basic Research Foundation (2019A1515110840), and the Research Startup Foundation of Guangdong Ocean University (R20009).
Acknowledgments
The authors are thankful to the National Satellite Marine Application Center for making available the HY-1C/HY-1D satellite data and for the data support. The data can be downloaded at https://osdds.nsoas.org.cn.
Conflict of interest
The authors declare that the research was conducted in the absence of any commercial or financial relationships that could be construed as a potential conflict of interest.
Publisher’s note
All claims expressed in this article are solely those of the authors and do not necessarily represent those of their affiliated organizations, or those of the publisher, the editors and the reviewers. Any product that may be evaluated in this article, or claim that may be made by its manufacturer, is not guaranteed or endorsed by the publisher.
References
Bigdeli M., Mohammadian A., Pilechi A., Taheri M. (2022). Lagrangian Modeling of marine microplastics fate and transport: The state of the science. J. Mar. Sci. Eng. 10 (4), 481. doi: 10.3390/jmse10040481
Cheng K., Chan S., Lee J. (2020). Remote sensing of coastal algal blooms using unmanned aerial vehicles (UAVs). Mar. pollut. Bull. 152, 110889. doi: 10.1016/j.marpolbul.2020.110889
Chen L., Yang M., Xu Y., Shen A. ,. E. (2021). Occurrence of Prorocentrum donghaiense dominated bloom based on the field investigation and MODIS image study. J. Appl. Oceanography 40 (3), 447–462. doi: 10.3969/J.ISSN.2095-4972.2021.03.010
Chu A. (2019). Analysis and modelling of morphodynamics of the Yangtze estuary (Deltares, The Netherlands: Master's thesis, Delft University of Technology). doi: 10.4233/uuid:068a1257-dfc2-4389-964e-f665aa5cb213
Deltares (2008). Pearl river delta water quality model final report (Environmental Protection Department of the Hong Kong Special Administrative Region: Deltares, The Netherlands).
Deltares (2018a). Delft3D-FLOW simulation of multi-dimensional hydrodynamic flows and transport phenomena, including sediments user manual, version 3.15 (Deltares: The Netherlands).
Deltares (2018b). Delft3D-PART simulation of mid-field water quality and oil spills, using particle tracking user manual, version 2.15 (Deltares: The Netherlands).
Department of Natural Resources of Guangdong Province (2013-2020). Guangdong marine disasters bulletin (Guangzhou, China:Department of Natural Resources of Guangdong Province).
Ding R., Chen X., Qu N. (2015). Three-dimensional high-resolution numerical study of the tide and circulation in the pearl river estuary and its adjacent waters part 1: Model building and analysis. Periodical Ocean Univ. China: Natural Sci. Edition 45 (11), 1–9. doi: 10.16441/j.cnki.hdxb.20150064
Egbert G. D., Erofeeva S. Y. (2002). Efficient inverse modeling of barotropic ocean tides. Atmos. Ocean. Technol. 19 (2), 183–204. doi: 10.1175/1520-0426(2002)019<0183:EIMOBO>2.0.CO;2
Fang S., Liu J. (2020). A method of defining main tidal dynamic section and its applications in the lingdingyang estuary. Eng. J. Wuhan Univ. 53 (11), 950–957. doi: 10.14188/j.1671-8844.2020-11-002
Gao L., Fan De., Song De., Zong Y., Bi N., Chi W. (2021). Numerical simulation of the migration path during the growth period of ulva prolifera in the sea near northern jiangsu and the thermohaline environment. Haiyang Xuebao. 43 (8), 1–16. doi: 10.12284/hyxb2021056
Hayashi M., Yanagi T. (2008). Analysis of change of red tide species in yodo river estuary by the numerical ecosystem model. Mar. pollut. Bull. 57 (1-5), 103–107. doi: 10.1016/j.marpolbul.2008.04.015
Hu X. (2010). Numerical study of saltwater intrusion in modaomen of pearl estuary (Beijing, China: Master's thesis, Tsinghua University)
Kuang C., Xie H., Su P., Gu J., Mao X. (2016). Tracking migration and diffusion of red tides in qinhuangdao coastal water based on FBM method. China Environ. Sci. 36 (8), 2505–2515. doi: 10.3969/j.issn.1000-6923.2016.08.033
Lapietra I., Lisco S., Mastronuzzi G., Milli S., Pierri. C., Sabatier F., et al. (2022). Morpho-sedimentary dynamics of torre guaceto beach (Southern Adriatic Sea, Italy). J. Earth Syst. Sci. 131, 64. doi: 10.1007/s12040-022-01811-6
Li Y., He R., Mcgillicuddy D. J., Anderson D. M., Keafer B. A. (2009). Investigation of the 2006 alexandrium fundyense bloom in the gulf of Maine: In-situ observations and numerical modeling. Cont. Shelf. Res. 29 (17), 2069–2082. doi: 10.1016/j.csr.2009.07.012
Li Y., Li R., Chang L. (2020a). Red tide monitoring along the coast of zhejiang province based on GOCI data. Ecol. Environ. Sci. 29 (8), 1617–1624. doi: 10.16258/j.cnki.1674-5906.2020.08.013
Li L., Lu S., Cen J. (2019). Spatio-temporal variations of harmful algal blooms along the coast of guangdong, southern China during 1980-2016. J. Oceanol. Limnol. 37 (2), 535–551. doi: 10.1007/s00343-019-8088-y
Li C., Odermatt D., Bouffard D., Wüest A., Kohn T. (2022). Coupling remote sensing and particle tracking to estimate trajectories in large water bodies. Int. J. Appl. Earth Obs. Geoinf. 110, 102809. doi: 10.1016/j.jag.2022.102809
Li J., Xing Q., Zheng X., Li L., Wang L. (2022). Noctiluca scintillans red tide extraction method based on UAV images and deep learning. J. Comput. Applications. 42(9), 2969–2974. doi: 10.11772/j.issn.1001-9081.2021071197
Li Y., Stumpf R. P., Mcgillicuddy D. J., He R. (2020b). Dynamics of an intense Alexandrium catenella red tide in the gulf of Maine: satellite observations and numerical modeling. Harmful Algae. 99, 101927. doi: 10.1016/j.hal.2020.101927
Liu R., Xiao Y., Ma Y., Cui T., An J. (2022). Red tide detection based on high spatial resolution broad band optical satellite data. ISPRS J. Photogramm. Remote Sens. 184, 131–147. doi: 10.1016/j.isprsjprs.2021.12.009
Liu J., Zeng T., Liang C., Zou Y., Ye X., Ding J., et al. (2020). Application of HY-1C satellite in monitoring of natural disasters. Satellite Appl. 6, 26–34. doi: 10.3969/j.issn.1674-9030.2020.06.008
Liu L., Zhou J., Zheng B., Cai K., Tang J. (2013). Temporal and spatial distribution of red tide outbreaks in the Yangtze river estuary and adjacent waters, China. Mar. pollut. Bull. 72 (1), 213–221. doi: 10.1016/j.marpolbul.2013.04.002
Li J., Xing Q., Zheng X., Li L., Wang L. (2021). Noctiluca scintillans red tide extraction method based on UAV images and deep learning. J. Comput. Applications. 42 (9), 2969–2974. doi: 10.11772/j.issn.1001-9081.2021071197
Lu Z., Gan J. (2015). Controls of seasonal variability of phytoplankton blooms in the pearl river estuary. Deep-Sea Res. Pt. II. 117, 86–96. doi: 10.1016/j.dsr2.2013.12.011
Nogueira E., Bravo I., Montero P., Diaz-Tapia P., Calvo S., Ben-Gigirey B., et al. (2022). HABs in coastal upwelling systems: Insights from an exceptional red tide of the toxigenic dinoflagellate. Alexandrium minutum. Ecol. Indic. 137, 108790. doi: 10.1016/j.ecolind.2022.108790
Qi L., Hu C., Barnes B. B., Lee Z. (2017). VIIRS captures phytoplankton vertical migration in the NE gulf of Mexico. Harmful Algae. 66, 40–60. doi: 10.1016/j.hal.2017.04.012
Qin R., Lin L., Kuang C., Su T., Mao X. (2017). A GIS-based software for forecasting pollutant drift on coastal water surfaces using fractional Brownian motion: A case study on red tide drift. Environ. Modell. Software 92, 252–260. doi: 10.1016/j.envsoft.2017.03.003
Qu D., Yu H., Sun Y., Zhao Y., Wei Q., Yu H., et al. (2019). Numerical study on the summertime patches of red tide in the adjacent sea of the changjiang (Yangtze) river estuary, China. Mar. pollut. Bull. 143, 242–255. doi: 10.1016/j.marpolbul.2019.04.027
Seiler L., Figueira R. C. L., Schettini C. A. F., Siegle E. (2020). Three-dimensional hydrodynamic modeling of the santos-são Vicente-bertioga estuarine system, Brazil. Reg. Stud. Mar. Sci. 37, 101348. doi: 10.1016/j.marpolbul.2019.04.027
Soto I. M., Cambazoglu M. K., Boyette A. D., Broussard K., Sheehan D., Howden S. D., et al. (2018). Advection of karenia brevis blooms from the Florida panhandle towards Mississippi coastal waters. Harmful Algae. 72, 46–64. doi: 10.1016/j.hal.2017.12.008
Tian Y., Li T., Hu S., Xie X., Liu S. (2020). Temporal and spatial characteristics of harmful algal blooms in guangdong coastal area. Mar. Environ. Science. 39 (1), 1–8. doi: 10.13634/j.cnki.mes.2020.01.001
Wang B. (2014). Analysis on the estuarine circulation and its dynamic mechanism in the lingdingyang bay. Chin. J. Hydrodynamics. 29 (5), 608–617. doi: 10.3969/j.issn1000-4874.2014.05.013
Wang G. (2020). Study on the characteristics of tidal current and material transportation in the pearl river estuary (Guangzhou, China: Master's thesis, South China University of Technology).
Weisberg R. H., Liu Y., Lembke C., Hu C., Hubbard K., Garrett M. (2019). The coastal ocean circulation influence on the 2018 West Florida shelf K.brevis red tide bloom. J. Geophys. Res-Oceans. 124 (4), 2501–2512. doi: 10.1029/2018JC014887
Willmott C. ,. J. (1981). On the validation of models. Phys. Geogr. 2 (2), 184–194. doi: 10.1080/02723646.1981.10642213
Zhang H., Li S. (2010). Effects of physical and biochemical processes on the dissolved oxygen budget for the pearl river estuary during summer. J. Mar. Syst. 79 (1-2), 65–88. doi: 10.1016/j.jmarsys.2009.07.002
Zhang B., Pu A., Jia P., Xu C., Wang Q., Tang W. (2021). Numerical simulation on the diffusion of alien phytoplankton in bohai bay. Front. Ecol. Evol. 572. doi: 10.3389/fevo.2021.719844
Zhao J., Ghedira H. (2014). Monitoring red tide with satellite imagery and numerical models: A case study in the Arabian gulf. Mar. pollut. Bull. 79 (1-2), 305–313. doi: 10.1016/j.oceaneng.2021.109639
Zhou F., Ge J., Liu D., Ding P. (2021). A Lagrangian-based floating macroalgal growth and drift model (FMGDM v1.0): Application in the green tides of the yellow Sea. Copernicus GmbH. doi: 10.5194/GMD-2021-20
Keywords: red tide, drift-diffusion process, Lingdingyang Bay, Delft3D, particle tracking
Citation: Xu Y, Sun Y, Xu G and Liu D (2023) Simulation of red tide drift-diffusion process in the Pearl River Estuary and its response to the environment. Front. Mar. Sci. 10:1096896. doi: 10.3389/fmars.2023.1096896
Received: 12 November 2022; Accepted: 27 January 2023;
Published: 09 February 2023.
Edited by:
Lin Hui, Ministry of Natural Resources, ChinaReviewed by:
Yang Ding, Ocean University of China, ChinaMarta Rodrigues, National Laboratory for Civil Engineering, Portugal
Copyright © 2023 Xu, Sun, Xu and Liu. This is an open-access article distributed under the terms of the Creative Commons Attribution License (CC BY). The use, distribution or reproduction in other forums is permitted, provided the original author(s) and the copyright owner(s) are credited and that the original publication in this journal is cited, in accordance with accepted academic practice. No use, distribution or reproduction is permitted which does not comply with these terms.
*Correspondence: Guangjun Xu, Z2p4dV9nZG91QHllYWgubmV0; Dazhao Liu, bGxkZHpAMTYzLmNvbQ==