 Chengyi Yuan
 Xiaodi Kuang2*
95% of researchers rate our articles as excellent or good
Learn more about the work of our research integrity team to safeguard the quality of each article we publish.
Find out more
ORIGINAL RESEARCH article
Front. Mar. Sci. , 15 March 2023
Sec. Coastal Ocean Processes
Volume 10 - 2023 | https://doi.org/10.3389/fmars.2023.1095792
In most coastal oceans, the impacts of global warming on season duration and timing of seasonal transitions remain unknown. To mirror the reality of the ongoing climate change, the summer and winter seasons are redefined using the local water temperature thresholds in the Bohai Sea. Then the phase variations of these seasons are quantified using the duration and transition timing indices, including the duration (DUR), onset (ONS), and withdrawal (WIT) indices derived from the OSTIA SST dataset at a very high resolution (0.05°). During the last four decades (1982–2019), secular trends of summer indices extracted by the ensemble empirical mode decomposition (EEMD) method reveal that the summer DUR has an accumulated increase of about 17 days (4.5 days decade-1), which is primarily induced by the phase advance of the summer ONS by about 16 days (4.2 days decade-1). Spatial features of the duration and timing indices demonstrate that the lengthening of summer DUR and the phase advance of summer ONS have significantly enhanced in the shallow regions, due to the limited thermal inertia and the shorter period of the ocean’s memory. In contrast, the secular trend of winter DUR exhibits an accumulated shortening of about 18 days (4.8 days decade-1), which is induced by a moderately delayed winter ONS of 6 days (1.6 days decade-1) and a significantly advanced winter WIT of 12 days (3.2 days decade-1). The potential linkage between the phase variations in the oceanic seasonal cycle and those of the atmospheric forcing was investigated by analyzing both the interannual variability and the secular trend. Over the analysis period, the secular trend of an earlier summer ONS is related to a total reduction of cloud cover by 30% of its climatological mean and an increase of incoming solar radiation of 10 W m-2 month-1 in the late spring. Thus, our results highlight the influence of cloud cover in addition to wind speed on the temporal variations of season transition timing.
Sea surface temperature (SST) is an essential ocean variable for quantifying and understanding the ongoing climatic change. Seasonal cycle accounts for more than 90% of the total SST variance and thus has been regarded as the dominant variability of SST over midlatitudes (Dwyer et al., 2012). On a global scale, Thomson (1995) and Mann and Park (1996) proposed that anthropogenic climate change not only alters the amplitude of the seasonal cycle represented by the surface temperature, but also the phase of the season transitions. Although ecological consequences of the phenological mismatch in marine ecosystem, such as declined species recruitment and biodiversity loss, have been widely reported (Bertram et al., 2001; Asch et al., 2019; Staudinger et al., 2019; Visser and Gienapp, 2019; Laurel et al., 2021; Wilson et al., 2021), very few studies addressed the phase variations of the seasonal cycle of seawater temperature (Thomas et al., 2017; Alexander et al., 2018).
The Bohai Sea is a continental shelf sea with an average water depth of 18 m off the Northwest Pacific. With a total area of 77,000 km2, the Bohai Sea is semi-enclosed by one of the most urbanized areas of China involving several largest and densely-populated cities. Due to the limited heat capacity and environmental carrying capacity, the physical environment and ecosystem of the Bohai Sea are sensitive and vulnerable to the global and regional climate change as well as the high-intensity human activities (Bian et al., 2016; Chen et al., 2019; Song and Duan, 2019; Wang et al., 2019). During 1970–2015, the significant warming of seawater temperature in the Bohai Sea caused an increased prevalence of harmful algal blooms at a rate of 40% decade-1, with an earlier timing by 5.5 days decade-1 (Xiao et al., 2019). Since the seawater temperature determines the decomposition rate of organic matter, the onset and duration of the summer season also have potential influence on the frequency and intensity of seasonal hypoxia (Zhai et al., 2019). However, the temporal variations of the timing and duration of the seasons during recent decades are completely unclear at the regional scale.
Therefore, more investigation on the phase variations of the season transitions is urgently needed for the Bohai Sea. As an appropriate variable representing the season transitions, SST has been well measured and documented, especially over the satellite era (Merchant et al., 2019; Minnett et al., 2019). And when the water column is mixed seasonally, the changes in SST can be further transmitted to deeper waters (Alexander et al., 2018). Many recent studies have revealed that the SST time series and the associated length time series of the seasons are non-linear and non-stationary under dramatic climate change (Park et al., 2018; Xu et al., 2021; Wang et al., 2021a). In various climate change applications, the ensemble empirical mode decomposition (EEMD) method has been an objective and insightful means in revealing the secular trends from the non-stationary time series, including the timing and length time series of each season over drylands of the Northern Hemisphere midlatitudes (Wu et al., 2011; Franzke, 2012; Song et al., 2020; Wang et al., 2021a). Thus, we conducted the EEMD method to extract the secular trends of the lengths and timing time series of the summer and winter seasons in the Bohai Sea for further investigation on the phase variations of the seasonal cycle.
In this study, we provide the first quantitative assessment of the observed changes in both the lengths and timing of the summer and winter seasons in the Bohai Sea during the last four decades. Furthermore, the potential linkage between the phase variations in the oceanic seasonal cycle and those of the atmospheric forcing will be investigated by analyzing both the interannual variability and the secular trend.
Daily mean SST during 1982–2019 was obtained from the operational sea surface temperature and sea ice analysis (OSTIA, Donlon et al., 2012; Good et al., 2020) dataset developed by the U.K. Meteorological Office and distributed through the Copernicus Marine Environment Monitoring Service (CMEMS). The OSTIA dataset has a very high spatial resolution of 0.05° thus provides the advantage to resolve the coastal ocean processes in the marginal seas (Minnett et al., 2019). In this study, the OSTIA SST data has been assessed using in-situ observations measured at fixed coastal stations operated and maintained by the State Oceanic Administration of China.
Daily mean fields of wind velocity, air temperature, total cloud cover (TCC), surface heat flux components including solar radiation, longwave radiation, latent and sensible heat fluxes during the same analysis period were obtained from the European Centre for Medium-Range Weather Forecast (ECMWF) reanalysis dataset ERA5 at 0.25° of horizontal resolution. The dataset for marine heatwaves (MHWs) intensities was obtained from the database Science Data Bank (Zhang et al., 2022; http://www.scidb.cn/en/s/nqauYn). The daily intensities of MHWs are calculated based on the difference between the National Oceanic and Atmospheric Administration Optimum Interpolation SST and its 30-year climatological mean at 0.25° grid.
The Bohai Sea (Figure 1) can be divided into three coastal bays named Laizhou Bay, Bohai Bay and Liaodong Bay, a shallow basin named the Central Bohai Sea and the Bohai Strait. At Laizhou Bay, the most area of Bohai Bay and the head of Liaodong Bay, water depth is less than 18 m, which is the averaged water depth of the entire Bohai Sea. Then the water depth gradually deepens from these coastal bays to the Central Bohai Sea and the Bohai Strait. The in-situ observation stations of Beihuangcheng (BHC), Qinghuangdao (QHD) and Bayuquan (BYQ) (shown in Figure 1) provide the longest running oceanographic time series in the study areas.
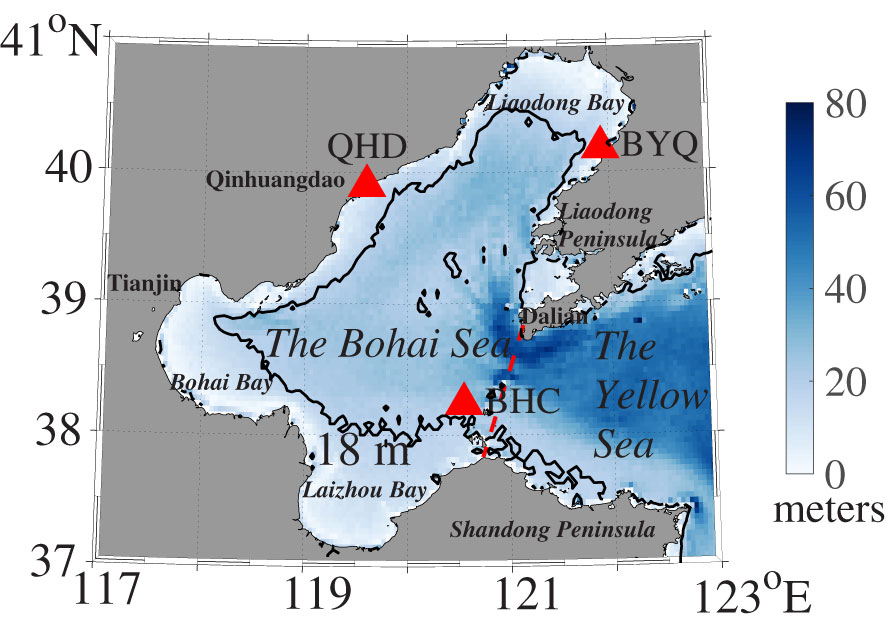
Figure 1 Area map and bathymetry in the Bohai Sea. Red triangles denote the long-term oceanographic stations used in the seawater temperature validation including Beihuangcheng (BHC), Qinhuangdao (QHD) and Bayuquan (BYQ); Black contour denotes the isobath of 18 m; Red dash line denotes the boundary of the Bohai Sea and the Yellow Sea.
The Taylor diagram (Taylor, 2001) can provide a graphical representation of how close the OSTIA SST matches the in-situ SST observation in the Bohai Sea during the satellite era. Figures 2A–C show that the correlations between the OSTIA and the in-situ observed SSTs are between 0.95 and 0.99 at the stations of BHC, QHD and BYQ, which indicate the OSTIA SST time series can closely reflect the temporal variability derived from the in-situ observations. The in-situ observed SST has been stored as the 10-day average record. Due to the differences in sampling intervals, the remote sensing SST has more fluctuations which caused the RMS deviations. As a reference, Figure 2D shows the total number of in-situ observation records in each year for all the oceanographic stations. The most consecutive missing records occurred during 1985–1990 at the stations of BHC and QHD.
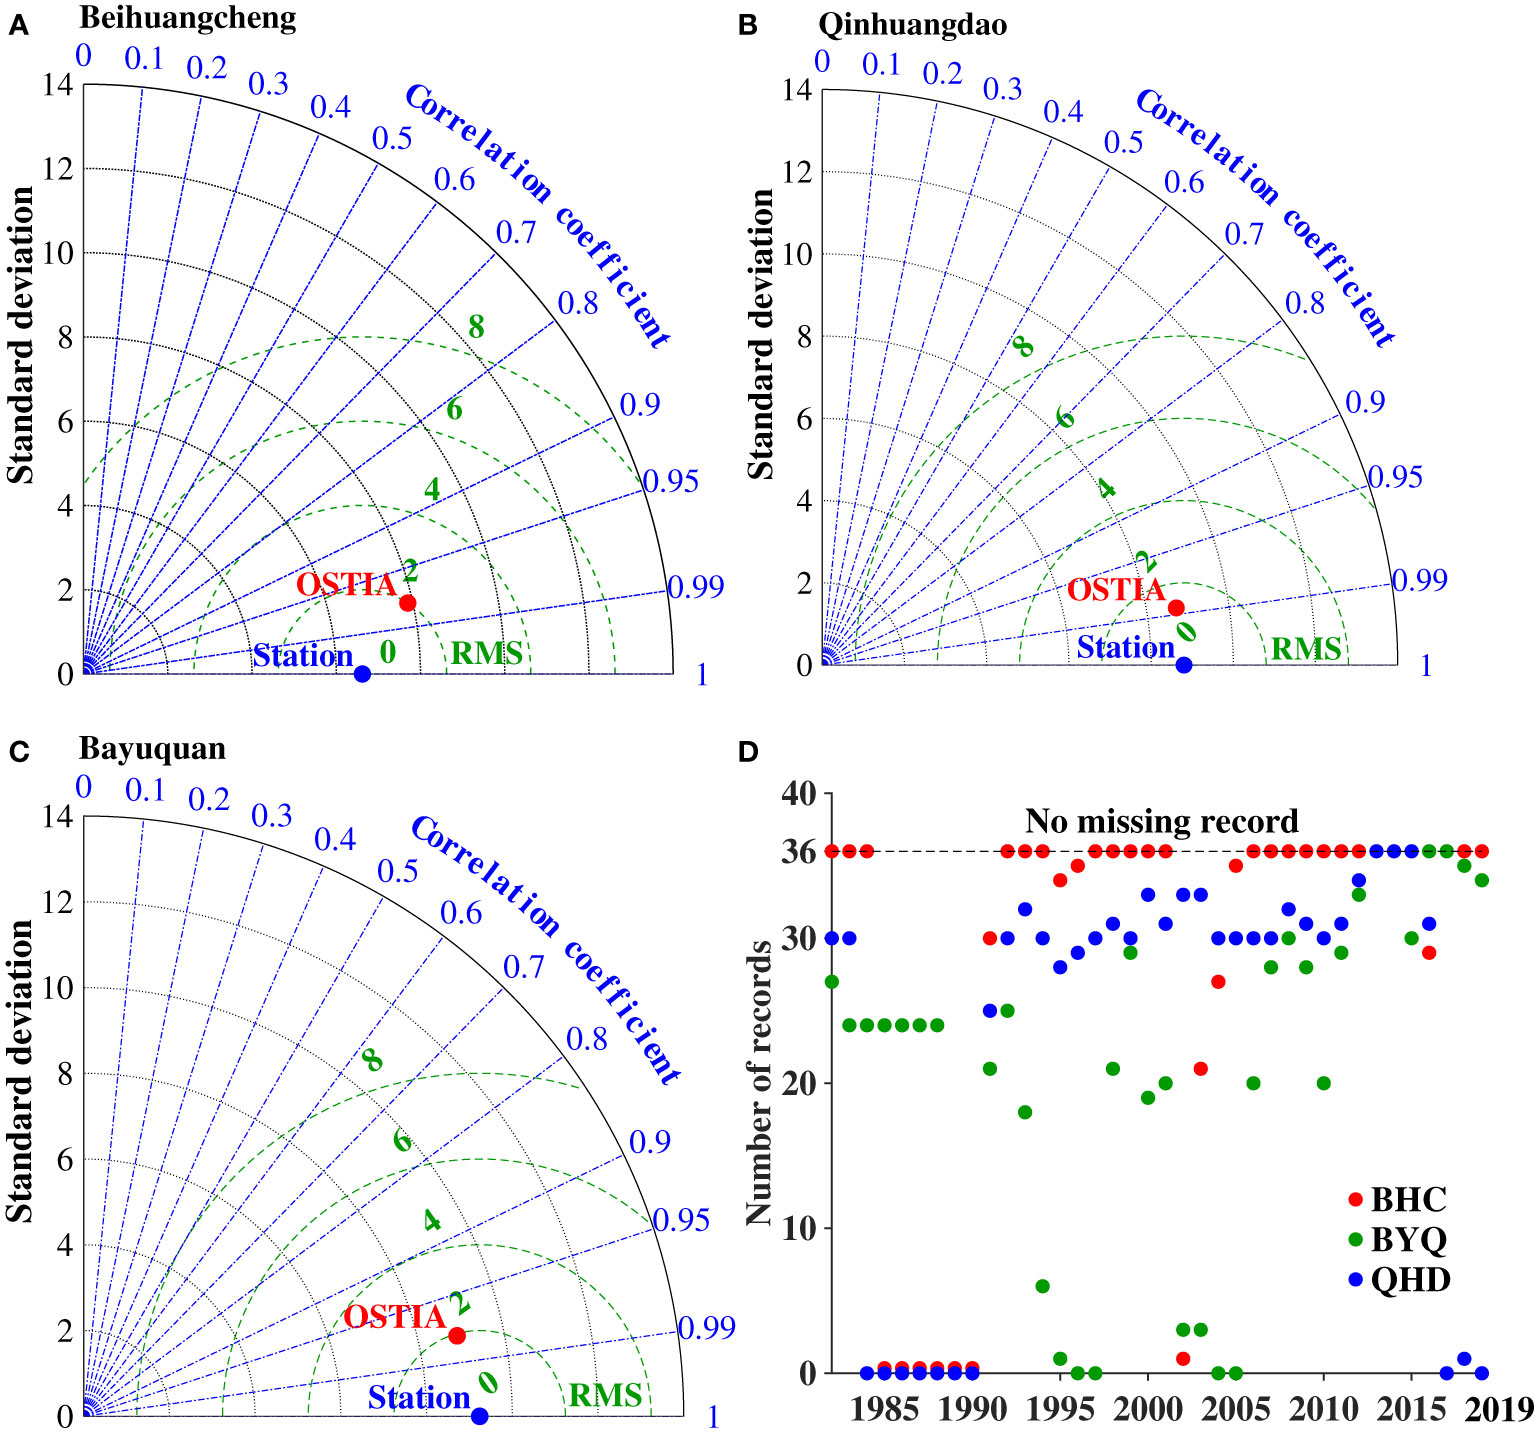
Figure 2 Taylor diagrams for the OSTIA SST time series compared with those of the in-situ observed SST at the oceanographic stations of (A) Beihuangcheng, (B) Qinhuangdao, and (C) Bayuquan. (D) illustrates the total number of observation records at each station during 1982–2019. In (D), dashed line denotes the record number of 36 and means there are no missing record for a certain year.
Traditionally, both the meteorological and oceanographic seasons divide the year into four three-month periods. In the meteorological seasons, as being the warmest quarter of the year, summer is defined as June, July, and August; And as being the coldest quarter, winter is defined as December, January, and February at midlatitudes (Trenberth, 1983). The oceanographic seasons correspondingly postpone the meteorological seasons by one month due to its higher heat capacity and larger thermal inertia. However, the traditional definition of oceanographic seasons with fixed length and onset date does not fully agree with the recent observed climate extremes (e.g., marine heatwaves) and the detected phase variations in the seasonal hydrological cycle (Klein Tank and Können 2003; Thomas et al., 2017). Thus, the oceanographic seasons in the coastal oceans are redefined using the local SST to provide a more appropriate and objective perspective under climate change.
In this article, we use the local seawater temperature criteria to redefine the summer and winter seasons in the Bohai Sea. The local temperature thresholds for the summer and winter seasons are defined as the 75th and 25th percentile temperature values obtained from the climatological annual cycle of the daily water temperature averaged over the period of 1982–2019, which indicate the warmest and coldest quarters in each year, respectively. Applying the method of Christidis et al. (2007) and Park et al. (2018), summer onset (ONS) and withdrawal (WIT) are defined as the calendar dates when the local SST starts to exceed and decreases to below the corresponding threshold, respectively; Winter timing indices are defined following the same logic. And summer/winter duration (DUR) is defined as the number of calendar days from ONS to WIT. To avoid any ambiguity, the winter of 1982 refers to 1982/83 winter in this study.
As an important parameter in this season redivision algorithm, the temperature threshold is calculated on the basis of local temperature throughout the whole year during 1982–2019. It is noted that the winter temperature under the sea ice has been relaxed to –1.8°C at a complicated timescale related to the ice concentration as described in section 2.4 in Good et al. (2020). Thus, we perform the sensitivity tests on the threshold values to verify the rationality of redivision method and threshold setting. First, we compare the summer season indices including ONS, WIT and DUR calculated using the original threshold of 75th percentile with those using the thresholds of the original value minus/plus 0.5°C and 1.0°C, respectively. These parallel tests clearly reveal that both the interannual variations and secular trends of the summer season indices calculated with the slightly different thresholds are substantially similar in the Bohai Sea, although their actual values are somewhat different (see Figure S1 in the supplemental material). Therefore, the phase variations of the summer season indices are insensitive to the threshold changes in the magnitude that can be induced by sea ice. Further, we compare the summer season indices calculated using the original threshold of 75th percentile with those using different percentile thresholds of the 70th and 80th percentiles; Parallel tests for the winter season are performed using the thresholds of 20th, 25th and 30th percentiles, respectively. The temporal variability of both the summer and winter season indices does not show significant difference in the sensitivity tests with different thresholds (see Figures S2 and Figure S3 in the supplemental material). Thus, the applied threshold criteria are reasonable in this study and consistent with the idea that summer/winter is the warmest/coldest quarter of the year.
The ensemble empirical mode decomposition (EEMD) method can decompose the original non-stationary time series into a set of oscillatory components at different time scales and a secular trend better reflecting the underlying physics (Wu et al., 2011; Ji et al., 2014; Wang et al., 2021a). Over the Bohai Sea, time series of DUR, ONS and WIT of the summer and winter seasons are non-stationary of which statistical properties changing through time (Figures 3B–G). Therefore, we applied EEMD method to decompose the length and timing indices time series of the above two seasons to extract the oscillatory components as well as the secular trends over the last four decades. The oscillatory components, also known as the intrinsic mode functions, whose amplitude and frequency can vary over time, thus provided a more accurate time-frequency representation than the sine and cosine components in the traditional Fourier Transform (Stallone et al., 2020). And the EEMD secular trends were used in further attribution analysis of the phase variations in the seasonal cycle of water temperature.
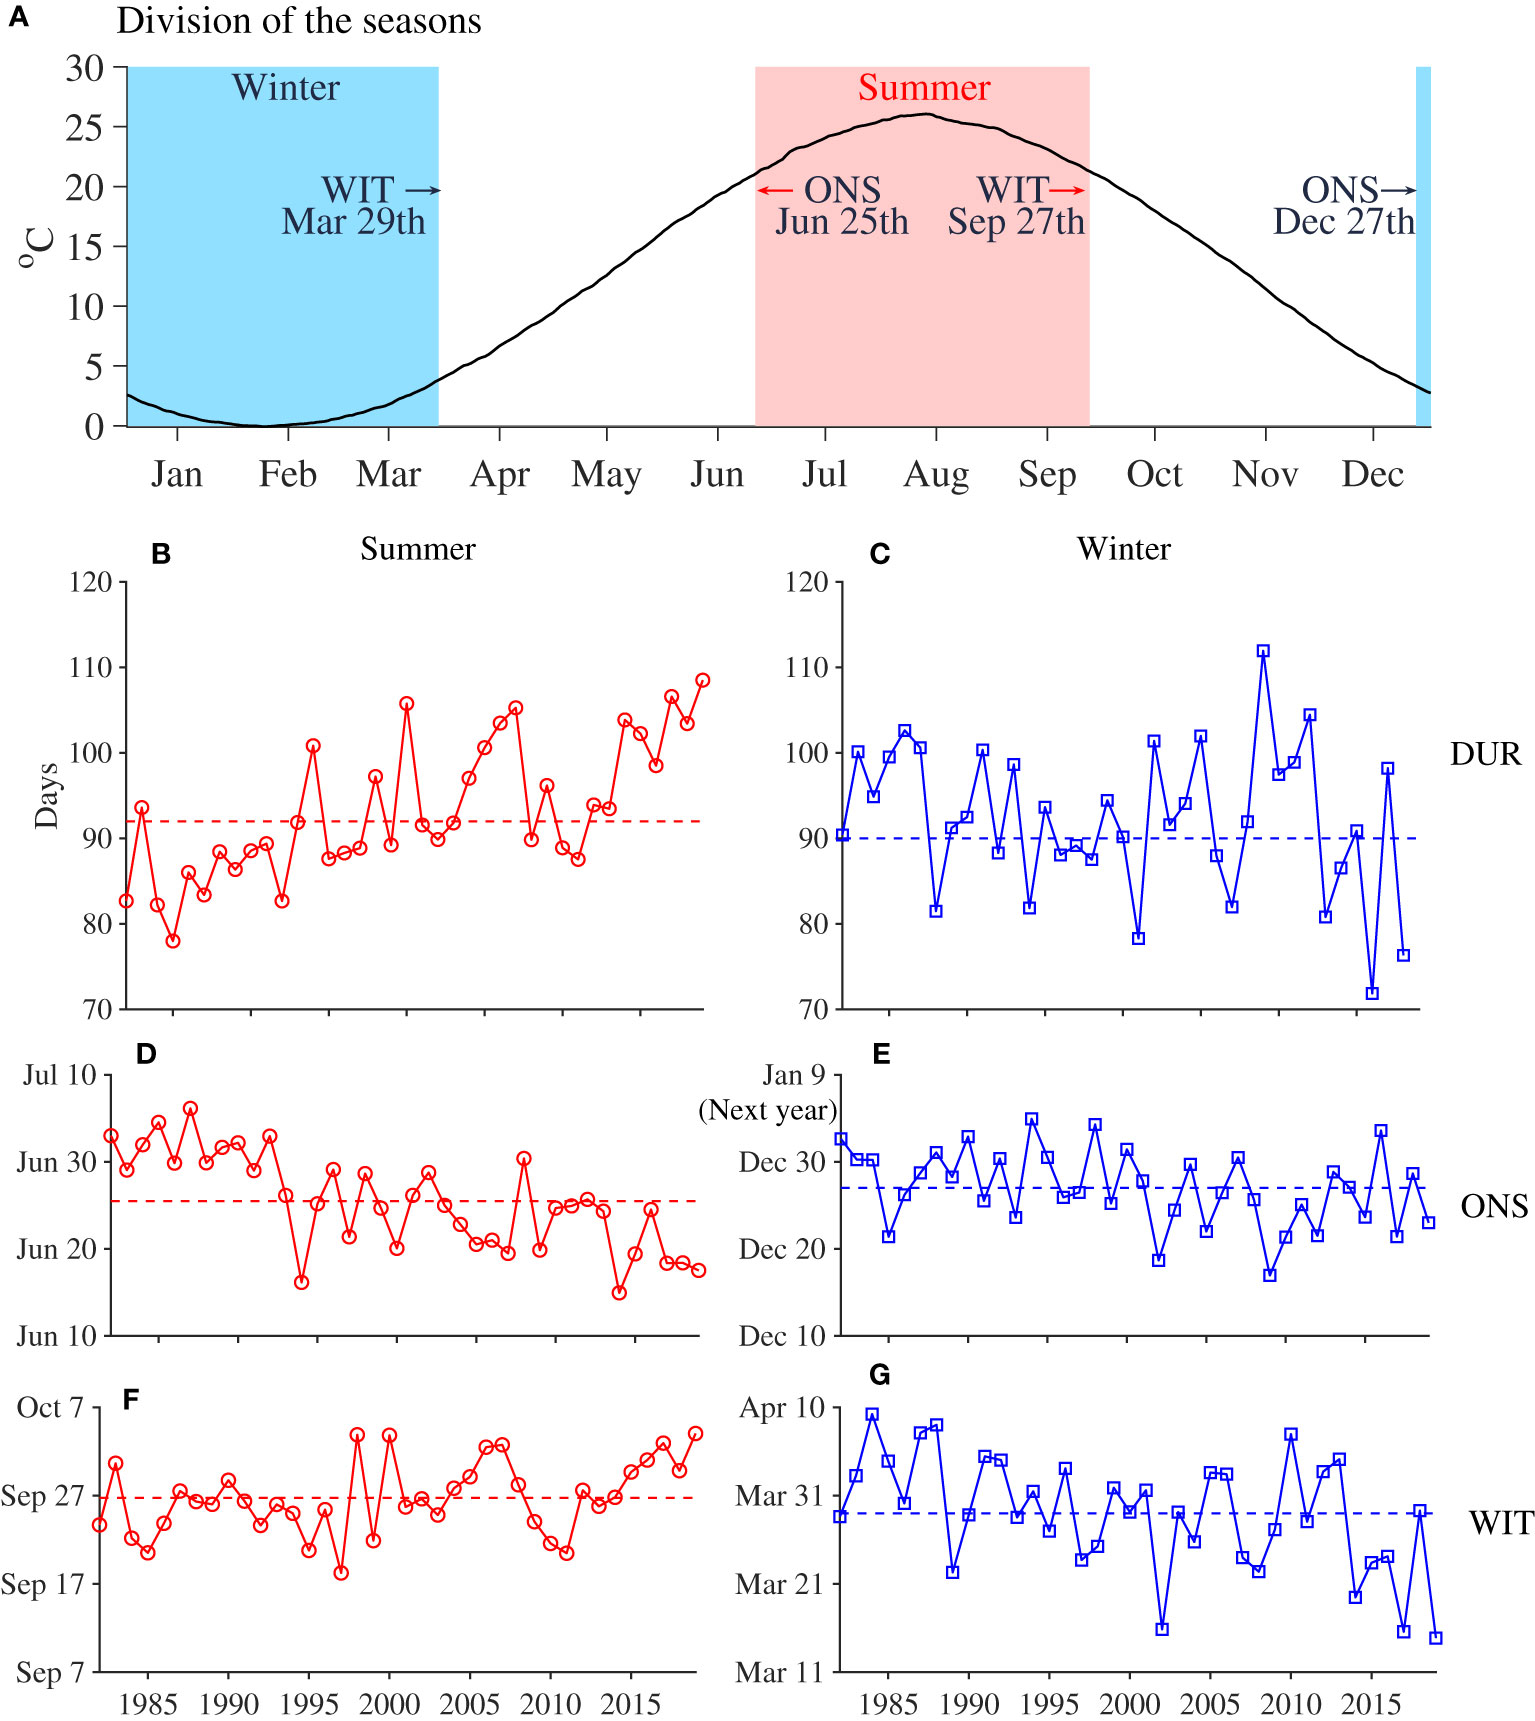
Figure 3 (A) Redivision of the summer (shaded in red) and winter (shaded in blue) seasons in the Bohai Sea based on the annual cycle of the daily climatological SST averaged over the period of 1982–2019. By implementing this redivision method, (B–G) show the time series of the length and timing indices including duration (DUR), onset (ONS), and withdrawal (WIT) averaged over the Bohai Sea for the summer (left panel) and winter (right panel) seasons, respectively.
From the spatial perspective, EEMD is a completely local method, for the decomposition of time series at one grid is independent of the data characteristics at other grids (Ji et al., 2014). Thus, spatial structures of the secular trends of ONS/WIT timing indices extracted by EEMD were obtained to investigate how the local water depth influences the phase of water temperature cycle in the Bohai Sea. In EEMD calculation, the added noise series has an amplitude of 0.2 times the standard deviation of the corresponding data and the ensemble number is set to 100 (Ji et al., 2014; Gaci, 2016).
In this section, we first present climatology of the redefined summer and winter seasons, spatial structures of the summer/winter ONS and WIT in the Bohai Sea, and interannual variability and secular trends of the summer/winter DUR, ONS and WIT during 1982–2019. Subsequently, to investigate the possible role of physical drivers on the observed phase variations of the summer and winter seasons, we examined the potential relationship between the associated length and timing indices and the atmospheric variables, including the net heat flux, all the heat flux components (solar and longwave radiation, latent and sensible heat flux), zonal and meridional wind components, wind speed and cloud cover.
In this study, the summer and winter seasons during 1982–2019 are redefined using local water temperature thresholds in the Bohai Sea. As summer criteria, 75th percentiles of SST ranged from 18.9°C in the Bohai Strait to 23.4°C at the top area of Laizhou Bay; Corresponding winter criteria of 25th percentiles of SST ranged from 1.2°C at the top area of Liaodong Bay to 5.5°C in the Bohai Strait. The localized temperature thresholds can provide more reasonable criteria for the season division. Based on these criteria, time series of the length and timing indices, including DUR, ONS and WIT were calculated for the summer and winter seasons, respectively.
The climatological length and timing indices are averaged over the entire Bohai Sea and illustrated in Table 1 and Figure 3A. On average, the summer season started on 25 June and ended on 27 September, while the winter season started on 27 December and ended on 29 March. As shown in Figure 4, spatial distributions of climatological ONS and WIT for both the summer and winter seasons showed clear dependency on the water depths. Top areas of Laizhou Bay, Bohai Bay and Liaodong Bay, where water depths are less than 18 m, exhibit earlier ONS and WIT of about 10 days compared with those averaged over the Bohai Sea for the summer and winter seasons; On the contrary, the Bohai Strait with the deepest water depth shows the latest seasonal transitions with more than 10 days compared with the Bohai averages. These spatial features of timing indices indicate that the significant difference in thermal inertia determined by the local water depth can highly influence the timing of seasonal transition in the Bohai Sea.
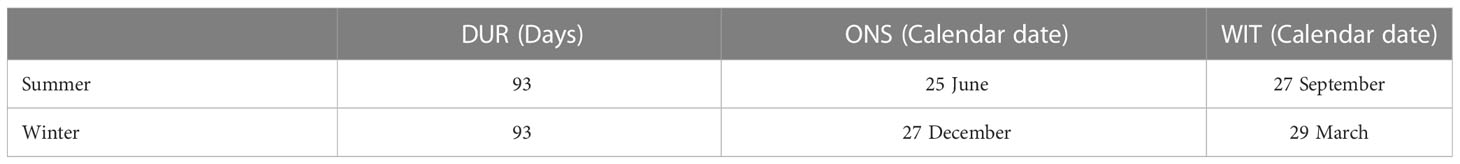
Table 1 Climatological length and timing indices in the Bohai Sea including duration (DUR), onset (ONS) and withdrawal (WIT) averaged over the period of 1982–2019 for the summer and winter seasons, respectively.
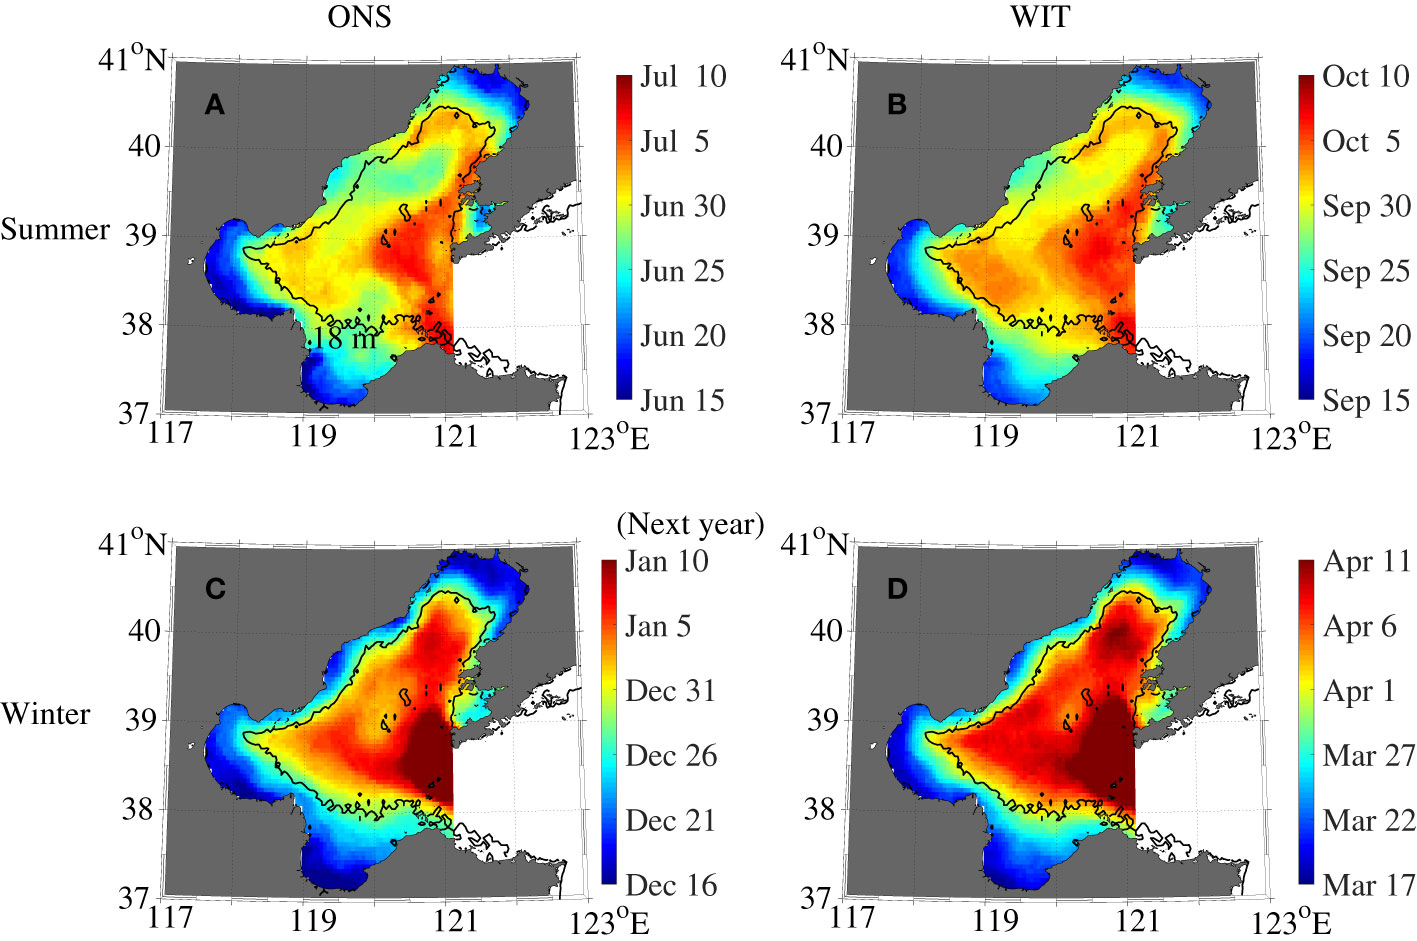
Figure 4 Spatial patterns of (A, C) ONS and (B, D) WIT climatology averaged over 1982–2019 for the summer (upper panel) and winter (lower panel) seasons in the Bohai Sea. Black contour denotes the isobath of 18 m.
Over the analysis period, time series of the length and timing indices for the summer and winter seasons exhibits significant inter-annual fluctuations (Figures 3B–G). For the summer season, the longest and shortest duration of 108 days and 78 days occurred in 2019 and 1985, respectively; For the winter season, the longest and shortest duration of 112 days and 72 days occurred in 2009 and 2016, respectively. During the last four decades, DUR time series for the summer and winter seasons exhibits significant lengthening and shortening trends, respectively. Since the traditional statistical method is not appropriate to extract the secular trends from these non-stationary time series, EEMD method will be applied to quantify the secular trends more accurately in the next session.
First, we conducted the EEMD method on the time series of the summer/winter length and timing indices and investigated the temporal characteristics of their secular trends during the period of last four decades. Figure 5 shows EEMD decompositions of the summer indices averaged over the entire Bohai Sea and those of the winter indices averaged over the ice-free areas as illustrated in the right panel of Figure 6. For the summer season, the secular trend of DUR exhibits a continuous lengthening during 1982–2019, with an accumulated length increase of about 17 days over 38 years (4.5 days decade-1). In line with the global warming, the summer ONS and WIT has shown monotonic advance and delay in their secular trends, respectively. Compared with the slightly delayed summer WIT, the summer ONS advanced by about 16 days (4.2 days decade-1) contributes significantly more to the lengthening of the summer season during the last four decades. In contrast, the secular trend of winter DUR exhibits an accumulated shortening of about 18 days during 1982–2018 (4.8 days decade-1), which is induced by a moderately delayed winter ONS of 6 days as well as a significantly advanced winter WIT of 12 days (lower panel in Figure 5). Hence, the secular trends derived from the EEMD analysis clearly demonstrate an extension of summer, a contraction of winter, and thus the significant phase variations in the seasonal cycle of SST in the Bohai Sea.

Figure 5 EEMD decompositions of the length and timing indices time series of (A, D) DUR, (B, E) ONS, and (C, F) WIT averaged over the Bohai Sea for the summer (upper panel) and winter (lower panel) seasons during the last four decades, respectively. The black curves (C1, C4) denote the oscillatory components; The red curves (R) denote the secular trends of the time series.
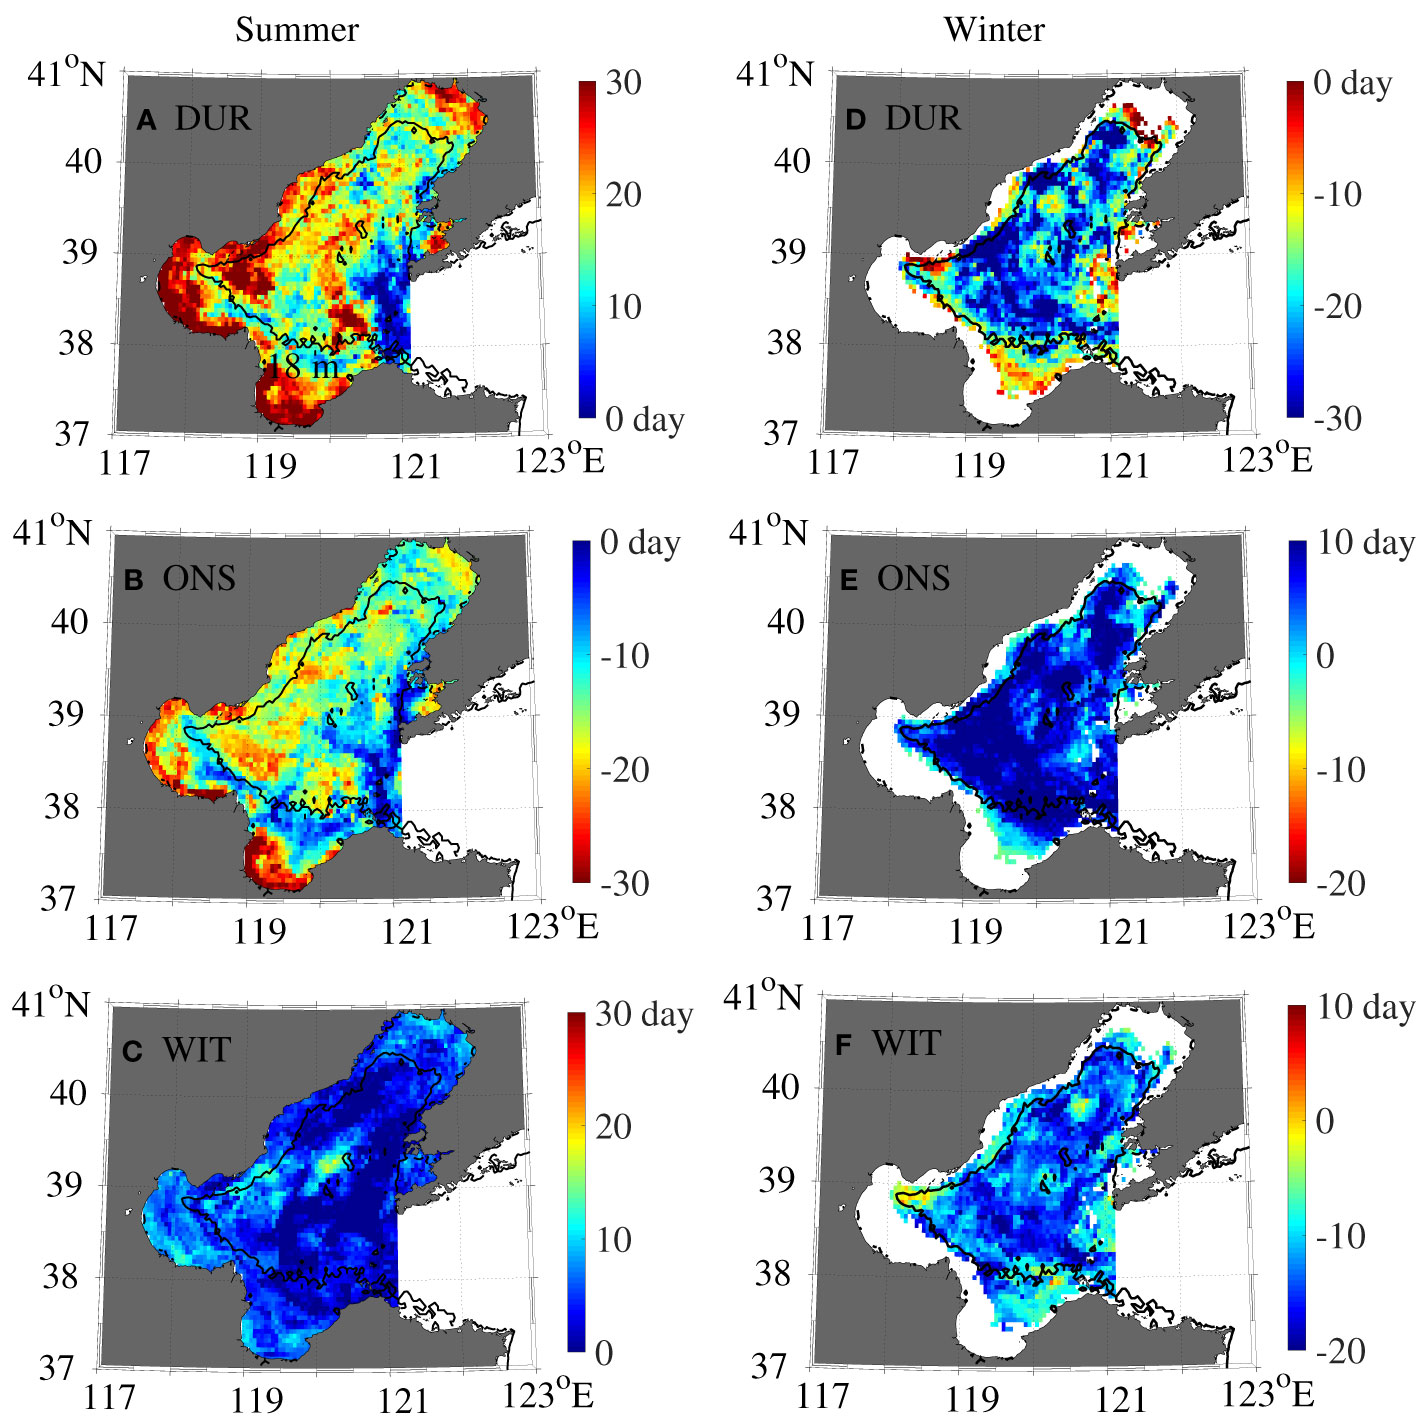
Figure 6 Spatial structures of the accumulated variations derived from the secular trends of the (A, D) DUR, (B, E) ONS, and (C, F) WIT for the summer (left panel) and winter (right panel) seasons during the last four decades, respectively. The spatial structures involving winter indices are only shown in the regions without sea ice. Black contour is the same as Figure 4.
Second, we further investigated the spatial features of accumulated variations of the summer/winter length and timing indices over the last four decades at each grid point in the Bohai Sea by means of the spatial locality of EEMD method. Figure 6 illustrates spatial structures of the accumulated variations of DUR, ONS and WIT are derived from the corresponding secular trends grid by grid. For summer, the spatial patterns suggest that the long-term variation of summer DUR is basically consistent with that of the summer ONS. The top areas of Liaodong, Bohai and Laizhou bays exhibit the strongest lengthening trends (by 30 days) of the summer DUR and also the most significant advance (exceeding 20 days) of the summer ONS, whereas the Bohai Strait area shows no significant variation in the summer length and timing indices, due to the lateral heat transport with the northern Yellow Sea (left panel in Figure 6). Previous studies found that the thermal inertia of a water column on the continental shelf is linearly proportional to its local water depth (Huang et al., 1999; Xie et al., 2002; Bian et al., 2016). Thus, both the lengthening of summer DUR and the advance of summer ONS tends to be more significant in the shallow (< 18 m) regions, due to the smaller magnitude of the ocean’s heat capacity and the shorter period of ocean’s memory.
Since the SST in OSTIA dataset has been deliberately relaxed towards –1.8° C in the sea ice covered regions (Good et al., 2020), our analysis for the winter season mainly focuses on the ice-free regions of the Bohai Sea. During 1982–2018, the shortened winter DUR (by 20–30 days), delayed winter ONS (by 0–10 days) and earlier winter WIT (by 10–20 days) can be found in the deep and ice-free regions of the Bohai Sea, with the water depths spanning 18–86 m (right panel in Figure 6). In general, the secular trends of the season durations and their transition timing have the same positive/negative signs in the Bohai Sea, which indicates their common connections with the atmospheric forcing.
By definition, the timing of summer ONS is closely related to the water temperature rising process in late spring, which is primarily influenced by the heat gain due to the incoming solar radiation. During the last four decades, time series of the late spring solar radiation is obtained by accumulating the incoming solar radiation within a month prior to the summer ONS in each year. Figure 7A illustrates that time series of the late spring solar radiation is significantly correlated with that of the summer ONS over most of the Bohai Sea. The negative correlation (spatially-averaged r = –0.65) indicates that the larger late spring solar radiation leads to an earlier summer ONS. Furthermore, the cloud cover is regarded as an important regulator of the amount of incoming solar radiation that reaches the sea surface (Hughes, 1984; He et al., 2019; Gao et al., 2020; Kejna et al., 2021); And the cooling action of local cloud predominates over the entire Bohai and Yellow Seas (Yuan, 2011; Yao et al., 2020). Figure 7B shows that the significant positive correlations (r ranging from 0.5 to 0.8) between time series of the one-month accumulated TCC in late spring and that of the summer ONS exhibits in large areas of the Bohai Sea. Meanwhile, the spatial pattern of correlation coefficients between the late spring TCC and summer ONS is very similar to that of the coefficients between the late spring solar radiation and summer ONS (Figures 7A, B). Hence, it suggests that the reduced TCC amount in late spring could induce an increased solar radiation at the sea surface, thus enhancing the SST rising process and causing an earlier summer ONS.
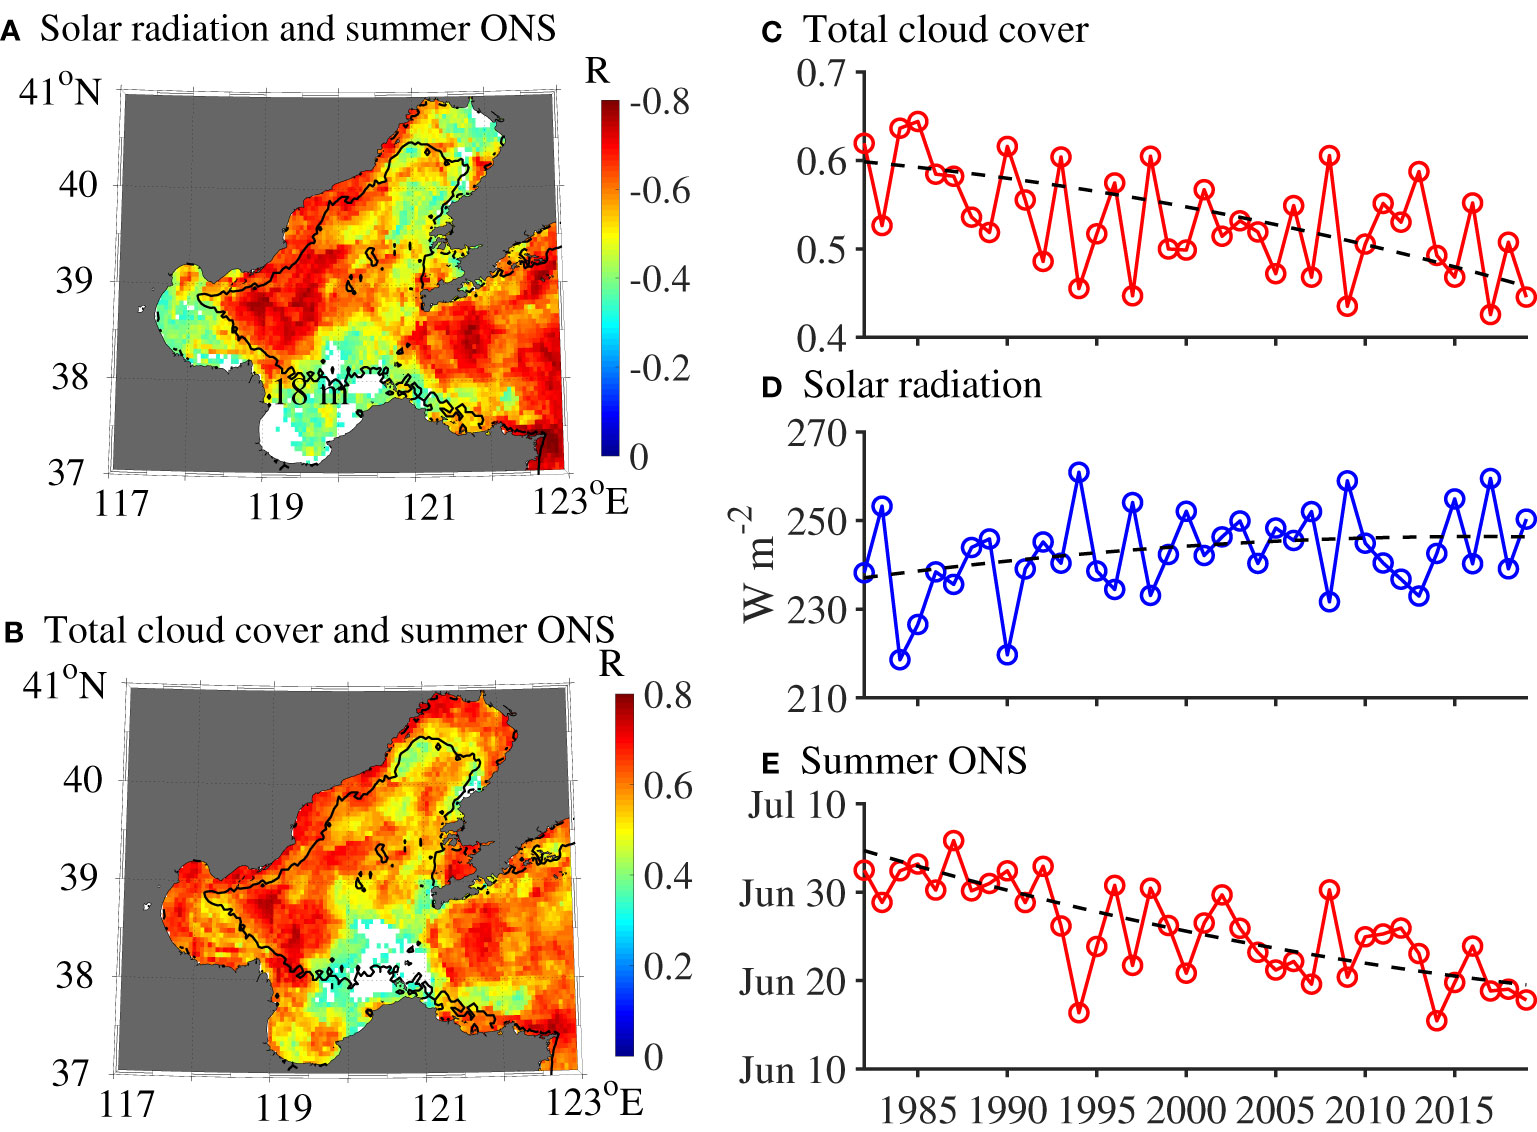
Figure 7 Correlation coefficients in the Bohai Sea between time series of (A) the late spring solar radiation and the summer ONS, (B) the late spring total cloud cover (TCC) and the summer ONS. Only significant correlations at the confidence level of 95% are shown in the figures. Black contour is the same as Figure 4. Spatially averaged time series of (C) the late spring TCC, (D) the late spring solar radiation and (E) the summer ONS during the 1982–2019. Black dash line denotes the secular trend derived from the EEMD decomposition.
We further explored the statistical relationship between the temporal evolution of the late spring cloud cover and that of the summer ONS over the entire Bohai Sea. During 1982–2019, time series of the late spring TCC has a negative correlation r = –0.87 with that of the incoming solar radiation at the sea surface and a positive correlation r = 0.73 with that of the summer ONS, respectively (right panel in Figure 7). From the perspective of long-term variations, the amount of late spring TCC over the Bohai Sea clearly shows a significant decreasing trend of 0.16 over the recent 38 years, which approximately accounts for 30% of the climatological mean TCC of 0.53 (Figure 7C). This decreasing trend of TCC is also confirmed by other reanalysis and ground station datasets (Zong et al., 2013). The dramatic loss of late spring TCC caused a long-term increase of 10 W m-2 month-1 in the magnitude of incoming solar radiation during the same period and further induced a phase advance of 16 days in the summer ONS (Figures 7D, E). In conclusion, the timing of summer ONS is most likely determined by the late spring cloud cover during the last four decades.
Changes in surface wind speed can potentially influence the SST decreasing process in late fall and the corresponded winter ONS through the sea surface heat fluxes. The significant positive correlations (r ranging from 0.6 to 0.8) between the time series of the winter ONS and that of the turbulent heat fluxes accumulated within two months prior to the winter ONS are found over the entire ice-free regions of the Bohai Sea (Figure 8A). These significant correlations suggest that the temporal variations of winter ONS are possibly controlled by that of the surface cooling process influenced by the turbulent heat fluxes. The negative correlations (r ranging from –0.8 to –0.5) further indicated that lower wind speed in late fall favors the weakened surface cooling, which results in a delayed winter ONS (Figure 8B).
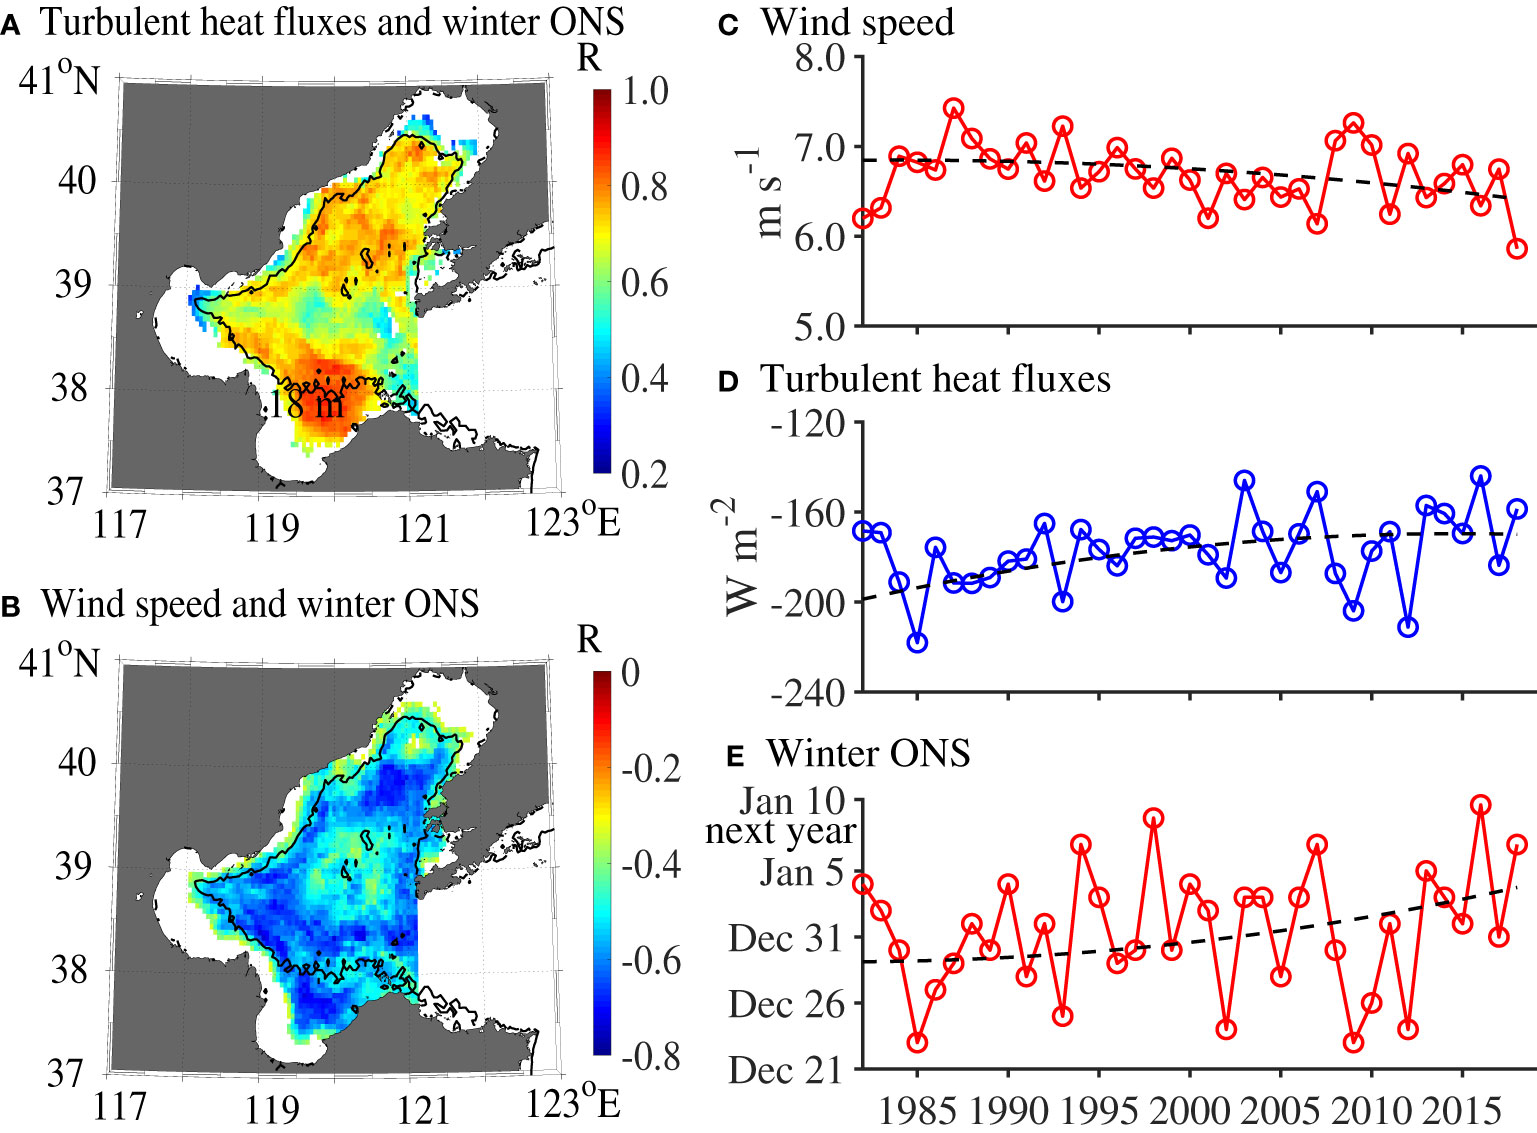
Figure 8 Correlation coefficients between time series of (A) the late fall turbulent heat fluxes and the winter ONS, (B) the late fall wind speed and the winter ONS. Only significant correlations at the confidence level of 95% are shown in the ice-free regions of the Bohai Sea. Black contour is the same as Figure 4. Spatially averaged time series of (C) the late fall wind speed, (D) the late fall turbulent heat fluxes and (E) the winter ONS during 1982–2018. Black dash line is the same as Figure 7.
We then investigated the statistical relationship between the temporal evolution of the wind speed and that of the winter ONS over the ice-free region of the Bohai Sea. As illustrated in Figures 8C–E, correlation analysis revealed that the time series of late fall wind speed is negatively correlated with both of the turbulent heat fluxes (r = –0.68) and winter ONS (r = –0.67), respectively. And the secular trends suggested that the weakened late fall wind speed has caused a decrease of 15 W m-2 month-1 in the magnitude of turbulent heat fluxes during the same period. In summary, both the correlation analysis and the secular trends derived from the EEMD analysis support that the weakened local wind speed in late fall could result in the decreased surface heat loss and the gradually postponed winter ONS.
Timing of the winter/summer WIT is determined by temperature rising/decreasing process over the period of the late winter/summer, which are influenced by the heat gain/loss at sea surface. By analyzing the time series of total heat flux and its associated components including solar radiation, longwave radiation and turbulent heat fluxes (including latent and sensible heat fluxes), we find that the temporal variation of turbulent heat fluxes is more responsible for that of the surface heat gain/loss. Thus, correlations between the time series of turbulent heat flux and the winter/summer WIT are investigated over the Bohai Sea. In Figure 9A, time series of the turbulent heat fluxes in late winter shows a moderate correlation (r = –0.66) with that of the winter WIT. Negative correlation indicates that the greater magnitude turbulent heat fluxes favors to a slower temperature rising process and a delayed winter WIT. In Figure 9B, the turbulent heat fluxes were further related to the wind speed over the same period, thus time series of the late winter wind speed shows a moderate correlation (r = 0.45) with that of the winter WIT. Thus, larger wind speed in the late winter favors to a delayed winter WIT. Similarly, temporal variation of the summer WIT is determined by the surface heat loss, which is closely related to the turbulent heat fluxes and wind speed in late summer. As illustrated in Figures 9C, D, the summer WIT is moderately correlated with both the turbulent heat fluxes (r = 0.57) and the wind speed (r = –0.55) accumulated over the late summer. Thus, larger wind speed in the late summer favors to a faster temperature decreasing and an earlier summer WIT.
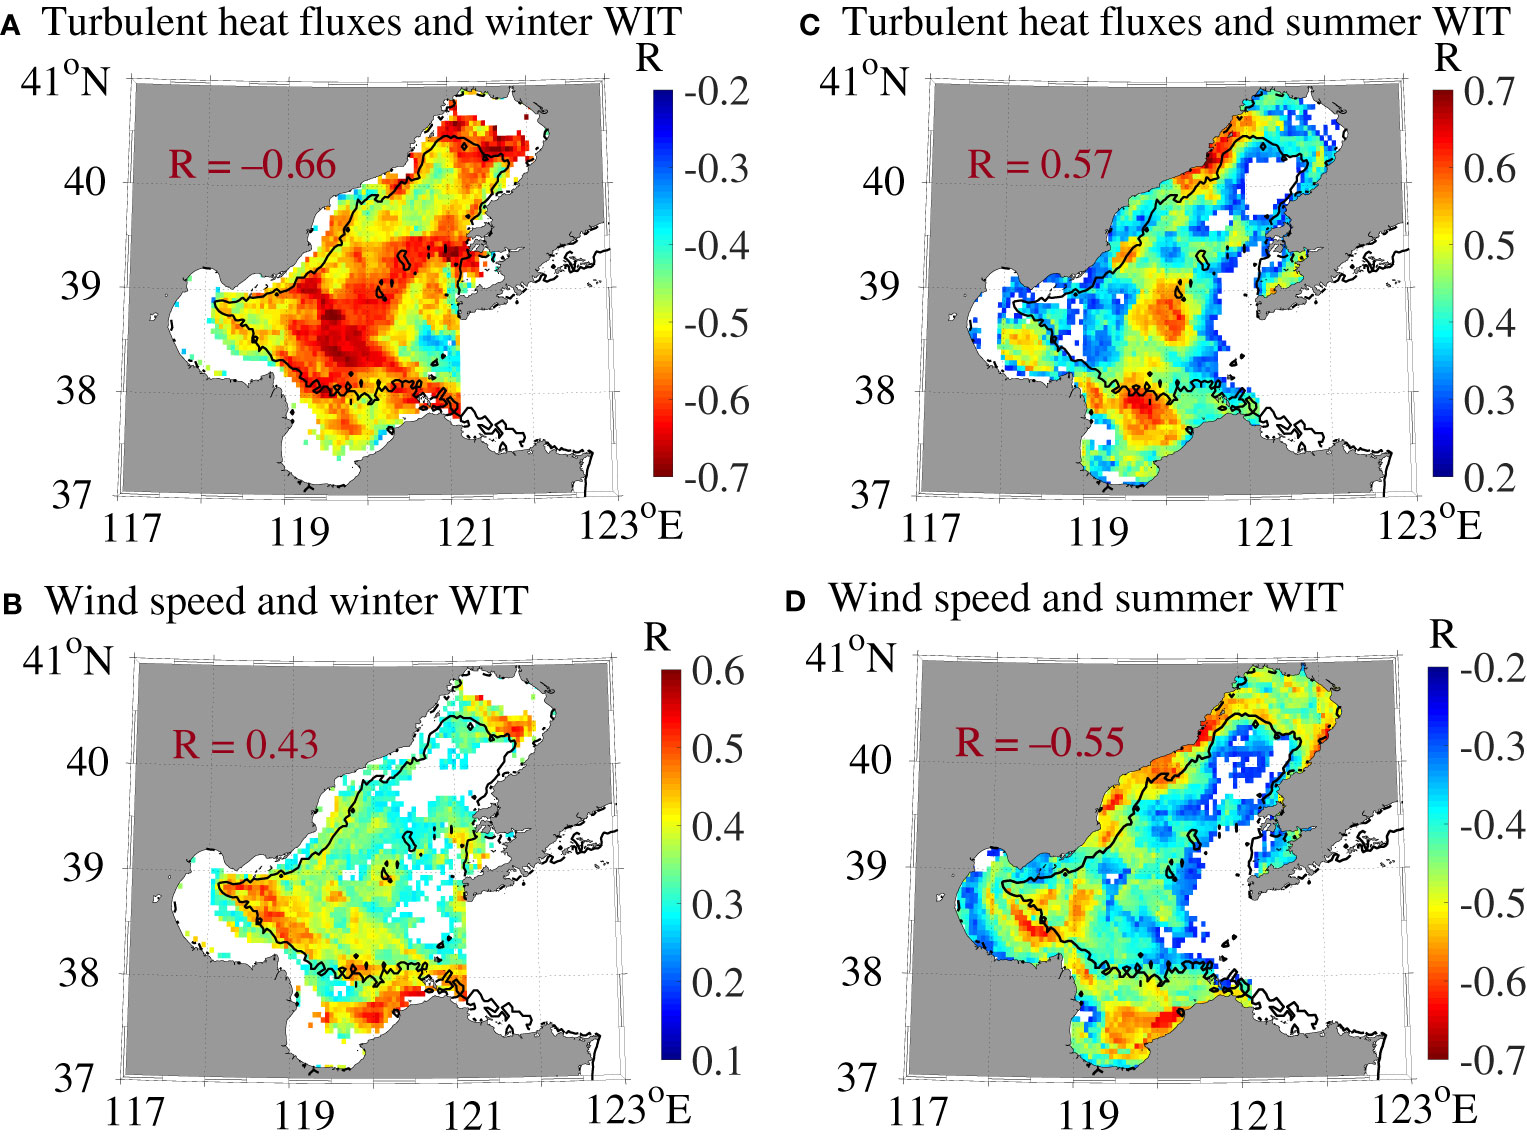
Figure 9 Correlation coefficients between time series of (A) the late winter turbulent heat fluxes and the winter WIT, (B) the late winter wind speed and the winter WIT during the last four decades. (C) is the same as (A) and (D) is the same as (B), except for the summer season. In these figures, only significant correlations at the confidence level of 95% are shown. Red number denotes the correlation coefficient between the spatially-averaged time series; Black contour is the same as Figure 4.
From the perspective of the secular trend, the long-term variation of summer WIT during the last four decades is very limited (Figure 5C); Whereas the long-term variation of winter WIT shows a significant advance of 12 days (Figure 5F), induced by the total decrease of 21 W m-2 month-1 in the magnitude of the late winter turbulent heat fluxes during the analysis period of this research.
In the traditional meteorological/oceanographic seasons, there are four seasons, which encompass three months each and generally match the past climatological temperature patterns at midlatitudes. During the past few decades, the significant increase of the frequency and severity of ocean extreme events including MHW has been revealed and confirmed by both the long-term observations and the climate model simulations (Sen Gupta et al., 2020; Li and Donner, 2022). However, the fixed-length summer season does not show any linkage to the occurrence and intensity of MHW. Thus, a more reasonable definition of the seasons is needed to mirror the reality of recent climate change more closely.
In this study, we provide a temperature-based redivision of the summer and winter seasons. To further explore the potential relationship between this climatic summer season and the MHWs, time series of the summer DUR and accumulated MHW intensity during 1982–2019 are illustrated in Figure 10. Here the accumulated MHW intensity is defined as the accumulated sum of daily intensity during all the MHW periods in each year, which represents the overall SST anomalies and heat stress from the extreme warm events. In the Bohai Sea, the accumulated MHW intensity has a moderate correlation (r = 0.58) with the summer DUR; Meanwhile, secular trend of the accumulated MHW intensity has a very high correlation (r = 0.94) with that of the summer DUR. It is indicated that the MHW intensity and the associated heat stress were significantly stronger in a lengthened climatic summer season.

Figure 10 Time series of (A) the annually accumulated marine heatwave (MHW) intensity (unit: °C·day) and (B) the summer DUR (unit: days) averaged over the Bohai Sea during 1982–2019. Black curve represents the secular trend derived from the EEMD decomposition. Red number denotes the correlation coefficient between the original time series of the accumulated MHW intensity and that of the summer DUR; Black number denotes the correlation coefficient between the time series of corresponded secular trends.
Therefore, the temperature-based definition of the seasons can better reflect the climatic extreme events. And the research on the increased and enhanced MHWs should be conducted with full consideration of the ongoing and future oceanic summer expansion, which is also suggested by Wang et al. (2021b) and Park et al. (2022) in the heatwave study for the land areas.
During the past few decades, global warming leads to the significant summer expansion and winter contraction across the Northern Hemisphere midlatitudes; However, the magnitudes of length variations are not uniform on the spatial scale. Park et al. (2018) suggested that the summer season had lengthened from 12 to 36 days during 1953–2012 (2.0–6.0 days decades-1) over the continental Eurasia; Wang et al. (2021a) reported that the lengthening/shortening rate (5.1/2.3 days decades-1) of the summer/winter season was particularly enhanced in drylands, where the regional warming was greater than the global average. In this study, the secular trends of summer and winter lengths in the Bohai Sea were generally consistent with those hemispheric-scale trends. It is revealed that the regional lengthening rate of summer (4.5 days decades-1) was close to that in the land area experiencing rapid warming, whereas the shortening rate of winter (4.8 days decades-1) was approximately twice the land value.
Previous temperature and heat content budgets for the Bohai Sea indicate that their spatiotemporal variations are primarily controlled by the local air-sea heat flux and the associated atmospheric forcing, which can be further linked to large-scale climate variability. Hence, local phase variations of season transitions derived from the water temperature cycle are correspondingly attributed to the atmospheric factors including cloud cover and wind speed. During late spring, cloud formation and its vertical structures are highly related to the onset and northward advance of the East Asian Summer Monsoon, which is modulated by the Pacific and Indian Ocean SST, the snow cover on the Tibetan Plateau and the location of Western Pacific Subtropical High (Sun et al., 2019; Gao et al., 2020). During late fall, wind speed is primarily related to the East Asian Winter Monsoon, which is influenced by the East Asian Trough, Aleutian Low, North Pacific Oscillation and ENSO. In further quantitative research, global climate models can be important tools for the investigation on the linkage between the phase variations of the seasons in the coastal ocean and the large-scale climate variability under global warming.
Understanding the phase variations of the summer and winter seasons is critical to achieving effective marine conservation and making appropriate adaption policies for the coastal ocean regions. In the Bohai Sea, both the duration and timing of the climatic summer and winter seasons have changed substantially during the last four decades (1982–2019). Using the EEMD method, secular trends of summer/winter DUR reveal that the summer season has lengthened by17 days (4.5 days decade-1) over the entire Bohai Sea, whereas the winter season has shortened by 18 days (4.8 days decade-1) in the ice-free regions.
In the Bohai Sea, the lengthening of summer DUR is primarily induced by the significant advance of summer ONS (4.2 days decade-1), rather than the very slight delay of summer WIT. Both the secular trend and inter-annual variations of the summer ONS are highly influenced by those of the late spring solar radiation and heat gain at the sea surface, which are significantly determined by the amount of cloud cover over the same period. In the ice-free regions, the temporal variations of winter ONS/WIT are significantly influenced by those of the late fall/winter turbulent heat fluxes at the sea surface, which are related to the magnitudes of local wind speed over the same period. Therefore, the atmosphere circulation can modulate the duration and transition timing of the climatic summer and winter seasons in the coastal oceans through various thermal and dynamic processes.
The original contributions presented in the study are included in the article/Supplementary Material. Further inquiries can be directed to the corresponding authors.
CY and XK contributed substantially to the design of this study, the analysis of the observation data, interpreting the results and writing the manuscript. JX, RL, and CW assisted in analyzing the data and contributed to the discussion of the results. All authors contributed to the article and approved the submitted version.
This work was funded by Natural Science Foundation of China (No. 41606028) and the Tianjin Science and Technology Program (No. 14JCQNJ09900 and 19JCYBJC22000).
We would like to thank National Marine Environmental Forecasting Center for providing the seawater temperature observations at the long-term oceanographic stations in the Bohai Sea.
The authors declare that the research was conducted in the absence of any commercial or financial relationships that could be construed as a potential conflict of interest.
All claims expressed in this article are solely those of the authors and do not necessarily represent those of their affiliated organizations, or those of the publisher, the editors and the reviewers. Any product that may be evaluated in this article, or claim that may be made by its manufacturer, is not guaranteed or endorsed by the publisher.
The Supplementary Material for this article can be found online at: https://www.frontiersin.org/articles/10.3389/fmars.2023.1095792/full#supplementary-material
Alexander M. A., Scott J. D., Friedland K. D., Mills K. E., Nye J. A., Pershing A. J., et al. (2018). Projected sea surface temperatures over the 21st century: Changes in the mean, variability and extremes for large marine ecosystem regions of northern oceans. Elem. Sci. Anth. 6, 9. doi: 10.1525/elementa.191
Asch R. G., Stock C. A., Sarmiento J. L. (2019). Climate change impacts on mismatches between phytoplankton blooms and fish spawning phenology. Glob. Change Biol. 25 (8), 2544–2559. doi: 10.1111/gcb.14650
Bertram D. F., Mackas D. L., McKinnell S. M. (2001). The seasonal cycle revisited: interannual variation and ecosystem consequences. Prog. Oceanogr. 49 (2001), 283–307. doi: 10.1016/S0079-6611(01)00027-1
Bian C. W., Jiang W. S., Pohlmann T., Sündermann J. (2016). Hydrography-physical description of the bohai Sea. J. Coast. Res. 74 (sp1), 1–12. doi: 10.2112/SI74-001.1
Chen Y. L., Shan X. J., Wang N., Jin X. S., Guan L. S., Gorfine H., et al. (2019). Assessment of fish vulnerability to climate change in the Yellow Sea and Bohai Sea. Mar. Freshw. Res. 71 (7), 729–736. doi: 10.1071/MF19101
Christidis N., Stott P. A., Brown S., Karoly D. J., Caesar J. (2007). Human contribution to the lengthening of the growing season during 1950-99. J. Climate 20 (21), 5441–5454. doi: 10.1175/2007JCLI1568.1
Donlon C. J., Martin M., Stark J., Roberts-Jones J., Fiedler E., Wimmer W. (2012). The operational sea surface temperature and sea ice analysis (OSTIA) system. Remote Sens. Environ. 116 (15), 140–158. doi: 10.1016/j.rse.2010.10.017
Dwyer J. G., Biasutti M., Sobel A. H. (2012). Projected changes in the seasonal cycle of surface temperature. J. Climate 25 (18), 6359–6374. doi: 10.1175/JCLI-D-11-00741.1
Franzke C. (2012). Nonlinear trends, long-range dependence, and climate noise properties of surface temperature. J. Climate 25 (12), 4172–4183. doi: 10.1175/JCLI-D-11-00293.1
Gaci S. (2016). A new ensemble empirical mode decomposition (EEMD) denoising method for seismic signals. Energy Proc. 97 (2016), 84–91. doi: 10.1016/j.egypro.2016.10.026
Gao G. D., Marin M., Feng M., Yin B. S., Yang D. Z., Feng X. R., et al. (2020). Drivers of marine heatwaves in the East China Sea and the South Yellow Sea in three consecutive summers during 2016-2018. J. Geophys. Res. -Oceans 125, e2020JC016518. doi: 10.1029/2020JC016518
Good S., Fiedler E., Mao C., Martin M. J., Maycock A., Reid R., et al. (2020). The current configuration of the OSTIA system for operational production of foundation sea surface temperature and ice concentration analyses. Remote Sens. 12, 720. doi: 10.3390/rs12040720
He M., Hu Y. X., Chen N., Wang D. H., Huang J. P., Stamnes K. (2019). High cloud coverage over melted areas dominates the impact of clouds on the albedo feedback in the Arctic. Sci. Rep. 9 (1), 9529. doi: 10.1038/s41598-019-44155-w
Huang D. J., Su J. L., Backhaus J. O. (1999). Modelling the seasonal thermal stratification and baroclinic circulation in the bohai Sea. Cont. Shelf. Res. 19 (11), 1485–1505. doi: 10.1016/S0278-4343(99)00026-6
Hughes N. A. (1984). Global cloud climatologies: A historical review. J. Appl. Meteorol. Clim. 23 (5), 724–751. doi: 10.1175/1520-0450(1984)023<0724:GCCAHR>2.0.CO;2
Ji F., Wu Z. H., Huang J. P., Chassignet E. P. (2014). Evolution of land surface air temperature trend. Nat. Clim. Change 4, 462–466. doi: 10.1038/NCLIMATE2223
Kejna M., Uscka-Kowalkowska J., Kejna P. (2021). The influence of cloudiness and atmospheric circulation on radiation balance and its components. Theor. Appl. Climatol. 144, 823–838. doi: 10.1007/s00704-021-03570-8
Klein Tank A. M. G., Können G. P. (2003). Trends in indices of daily temperature and precipitation extremes in europe 1946–99. J. Climate 16 (22), 3665–3680. doi: 10.1175/520-0442(2003)016<3665:TIIODT>2.0.CO;2
Laurel B. J., Hunsicker M. E., Ciannelli L., Hurst T. P., Duffy-Anderson J., O’Malley R., et al. (2021). Regional warming exacerbates match/mismatch vulnerability for cod larvae in Alaska. Prog. Oceanogr. 193, 102555. doi: 10.1016/j.pocean.2021.102555
Li X. R., Donner S. D. (2022). Lengthening of warm periods increased the intensity of warm-season marine heatwaves over the past 4 decades. Clim. Dyn 59, 2643–2654. doi: 10.1007/s00382-022-06227-y
Mann M. E., Park J. (1996). Greenhouse warming and changes in the seasonal cycle of temperature: Model versus observations. Geophys. Res. Lett. 23 (10), 1111–1114. doi: 10.1029/96GL01066
Merchant C. J., Embury O., Bulgin C. E., Block T., Corlett G. K., Fiedler E., et al. (2019). Satellite-based time-series of sea-surface temperature since 1981 for climate applications. Sci. Data. 6, 223. doi: 10.1038/s41597-019-0236-x
Minnett P. J., Alvera-Azcárate A., Chin T., Corlett G., Gentemann C., Karagali I., et al. (2019). Half a century of satellite remote sensing of sea-surface temperature. Remote Sens. Environ. 233, 111366. doi: 10.1016/j.rse.2019.111366
Park B. J., Kim Y. H., Min S. K., Lim E. P. (2018). Anthropogenic and natural contributions to the lengthening of the summer seasons in the northern hemisphere. J. Climate 31 (17), 6803–6819. doi: 10.1175/JCLI-D-17-0643.1
Park B. J., Min S. K., Weller E. (2022). Lengthening of summer season over the northern hemisphere under 1.5 o c and 2.0 o c global warming. Environ. Res. Lett. 17 (1), 014012. doi: 10.1088/1748-9326/ac3f64
Sen Gupta A., Thomsen M., Benthuysen J. A., Hobday A. J., Oliver E., Alexander L. V., et al. (2020). Drivers and impacts of the most extreme marine heatwave events. Sci. Rep. 10, 19359. doi: 10.1038/s41598-020-75445-3
Song J. M., Duan L. Q. (2019). “Chapter 17 - the bohai Sea,” in World seas: An environmental evaluation, 2nd ed. Ed. Sheppard C. (Cambridge: Academic Press), 377–394. doi: 10.1016/B978-0-08-100853-9.00024-5
Song X. D., Song Y., Chen Y. Y. (2020). Secular trend of global drought since 1950. Environ. Res. Lett. 15, 094073. doi: 10.1088/1748-9326/aba20d
Stallone A., Cicone A., Materassi M. (2020). New insights and best practices for the successful use of empirical mode decomposition, iterative filtering and derived algorithms. Nat. Sci. Rep. 10, 15161. doi: 10.1038/NCLIMATE2223
Staudinger M. D., Mills K. E., Stamieszkin K., Record N. R., Hudak C. A., Allyn A., et al. (2019). It’s about time: A synthesis of changing phenology in the gulf of Maine ecosystem. Fish. Oceanogr. 28 (5), 532–566. doi: 10.1111/fog.12429
Sun G. R., Li Y. Y., Lu J. (2019). Cloud vertical structures associated with northward advance of the East Asian summer monsoon. Atmos. Res. 20 (6), 317–325. doi: 10.1002/asl.903
Taylor K. E. (2001). Summarizing multiple aspects of model performance in a single diagram. J. Geophys. Res. -Oceans 106 (D7), 7183–7192. doi: 10.1029/2000JD900719
Thomas A. C., Pershing A. J., Friedland K. D., Nye J. A., Mills K. E., Alexander M. A., et al. (2017). Seasonal trends and phenology shifts in sea surface temperature on the north American northeastern continental shelf. Elem. Sci. Anth. 5 (10), 48. doi: 10.1525/elementa.240
Thomson D. J. (1995). The seasons, global temperature, and precession. Sci. 268 (5207), 59–68. doi: 10.1126/science.268.5207.59
Trenberth K. E. (1983). What are the seasons? Bull. Amer. Meteor. Soc 64 (11), 1276–1277. doi: 10.1175/1520-0477(1983)064<1276:WATS>2.0.CO;2
Visser M. E., Gienapp P. (2019). Evolutionary and demographic consequences of phenological mismatches. Nat. Ecol. Evol. 3 (6), 879–885. doi: 10.1038/s41559-019-0880-8
Wang J. M., Guan X. D., Guan Y. P., Zhu K. W., Shi R., Kong X. N., et al. (2021a). Changes in lengths of the four seasons over the drylands in the northern hemisphere midlatitudes. J. Climate 34 (20), 8181–8189. doi: 10.1175/JCLI-D-20-0774.1
Wang J. M., Guan Y. P., Wu L. X., Guan X. D., Cai W. J., Huang J. P., et al. (2021b). Changing lengths of the four seasons by global warming. Geophys. Res. Lett. 48 (6), e2020GL091753. doi: 10.1029/2020GL091753
Wang Q. Y., Li Y., Li Q. Q., Liu Y. W., Wang Y. N. (2019). Changes in means and extreme events of sea surface temperature in the East China seas based on satellite data from 1982–2017. Atmos. 10 (3), 140. doi: 10.3390/atmos10030140
Wilson S. M., Buehrens T. W., Fisher J. L., Wilson K., Moore J. W. (2021). Phenological mismatch, carryover effects, and marine survival in a wild steelhead trout Oncorhynchus mykiss population. Prog. Oceanogr. 193, 102533. doi: 10.1016/j.pocean.2021.102533
Wu Z. H., Huang N. E., Wallace J. M., Smoliak B. V., Chen X. Y. (2011). On the time-varying trend in global-mean surface temperature. Clim. Dyn. 37, 759–773. doi: 10.1007/s00382-011-1128-8
Xiao X., Agusti S., Pan Y. R., Yu Y., Li K., Wu J. P., et al. (2019). Warming amplifies the frequency of harmful algal blooms with eutrophication in Chinese coastal waters. Environ. Sci. Technol. 53 (22), 13031–13041. doi: 10.1021/acs.est.9b03726
Xie X. P., Hafner J., Tanimoto Y., Liu W. T., Tokinaga H., Xu H. M. (2002). Bathymetric effect on the winter sea surface temperature and climate of the Yellow and East China Seas. Geophys. Res. Lett. 29 (24), 2228. doi: 10.1029/2002GL015884
Xu Z. H., Ji F., Feng T. C., Gao Y., He Y. L., Chang F. (2021). Long-term evolution of global sea surface temperature trend. Int. J. Climatol. 41 (9), 4494–4508. doi: 10.1002/joc.7082
Yao Y. L., Wang J. J., Yin J. J., Zou X. Q. (2020). Marine heatwaves in china’s marginal seas and adjacent offshore waters: past, present and future. J. Geophys. Res. -Oceans 125 (3), e2019JC015801. doi: 10.1029/2019JC015801
Yuan C. Y. (2011). Forcing mechanisms of seasonal to decadal variations of oceanic temperature and circulation in the Yellow Sea. ph. d. dissertation (Qingdao: Ocean University of China), 97.
Zhai W. D., Zhao H. D., Su J. L., Liu P. F., Li Y. W., Zhang N. (2019). Emergence of summertime hypoxia and concurrent carbonate mineral suppression in the central bohai Sea, China. J. Geophys. Res. -Biogeo. 124, 2768–2785. doi: 10.1029/2019JG005120
Zhang X. J., Zheng F., Zhu J., Chen X. R. (2022). Observed frequent occurrences of marine heatwaves in most ocean regions during the last two decades. Adv. Atmos. Sci 39, 1579–1587. doi: 10.1007/s00376-022-1291-3
Keywords: phase variation, seasonal cycle, sea surface temperature (SST), secular trend, ensemble empirical mode decomposition (EEMD), cloud cover, Bohai Sea
Citation: Yuan C, Kuang X, Xu J, Li R and Wang C (2023) Phase variations of the summer and winter seasons in the Bohai Sea during the last four decades. Front. Mar. Sci. 10:1095792. doi: 10.3389/fmars.2023.1095792
Received: 11 November 2022; Accepted: 27 February 2023;
Published: 15 March 2023.
Edited by:
Wei-Bo Chen, National Science and Technology Center for Disaster Reduction (NCDR), TaiwanReviewed by:
Dehai Song, Ocean University of China, ChinaCopyright © 2023 Yuan, Kuang, Xu, Li and Wang. This is an open-access article distributed under the terms of the Creative Commons Attribution License (CC BY). The use, distribution or reproduction in other forums is permitted, provided the original author(s) and the copyright owner(s) are credited and that the original publication in this journal is cited, in accordance with accepted academic practice. No use, distribution or reproduction is permitted which does not comply with these terms.
*Correspondence: Chengyi Yuan, Y3l5dWFuQHR1c3QuZWR1LmNu; Xiaodi Kuang, a3Vhbmd4ZEBubWVmYy5jbg==
Disclaimer: All claims expressed in this article are solely those of the authors and do not necessarily represent those of their affiliated organizations, or those of the publisher, the editors and the reviewers. Any product that may be evaluated in this article or claim that may be made by its manufacturer is not guaranteed or endorsed by the publisher.
Research integrity at Frontiers
Learn more about the work of our research integrity team to safeguard the quality of each article we publish.