 Yéssica Vanessa Contreras-Pacheco
 Sharon Z. Herzka
 Gerardo Vallejo-Espinosa
 Juan Carlos Herguera
94% of researchers rate our articles as excellent or good
Learn more about the work of our research integrity team to safeguard the quality of each article we publish.
Find out more
ORIGINAL RESEARCH article
Front. Mar. Sci., 27 February 2023
Sec. Marine Pollution
Volume 10 - 2023 | https://doi.org/10.3389/fmars.2023.1095212
This article is part of the Research TopicNovel Insights into the Circulation, Biogeochemistry, and Ecosystem Function of the Gulf of Mexico: A Perspective from Mexican Waters in Support of Oil Spill PreparednessView all 17 articles
Ocean eddies play a major role in lateral and vertical mixing processes of particulate organic carbon (POC), as well as in the transport of heat, salinity, and biogeochemical tracers. In the open waters of the Gulf of Mexico (GoM), however, there are limited observations to characterize how these mesoscale structures affect the spatial distribution of POC in the upper water column, which is important for organic matter cycling and export. We present the distribution patterns of POC relative to mesoscale features throughout the water column in the deep-water region of the GoM during three oceanographic cruises held during the summer months of 2015, 2016, and 2017. Samples were collected under well-stratified upper ocean conditions, which allowed us to assess the spatial and temporal distribution of POC as a function of non-steric sea surface height, density, apparent oxygen utilization, and chlorophyll fluorescence. We further explored the variability of integrated surface layer POC concentrations at stations located within the cores and the edges of cyclonic and anticyclonic eddies, and those collected outside these structures. Although our results indicate mesoscale eddies modulate several important physical and biogeochemical variables and POC concentrations in the upper ocean, these features do not fully explain the spatial distribution of POC concentrations throughout the deep-water region of the GoM. Relatively lower POC concentrations were observed in the border of the cyclonic and the center of the anticyclonic eddies, in contrast to the relatively higher POC concentrations at the center of the cyclonic and the border of anticyclonic eddies. We observed high variability in POC concentration variability outside mesoscale structures, which may be attributed to other processes such as upwelling over the shelves, and the contribution by rivers during the summer especially in the northern and southern GoM.
The reservoir of particulate organic carbon (POC) in the ocean, while considerably smaller than the dissolved organic carbon (DOC) pool (with an approximate POC : DOC ratio of 1:38, Denman et al., 2007), is an essential constituent of sequestered carbon, in addition to the dissolved and particulate inorganic carbon pools (Sarmiento and Gruber, 2006). POC sinks through the water column across isopycnals, scavenging other particles and transporting carbon and associated elements to deep waters, where some of them are remineralized or resuspended, and a minor fraction is eventually sequestered in the sediments (Eppley and Peterson, 1979; Stramska, 2009).
The POC in oceanic regions consists mainly of living organisms and marine snow, which is an aggregate of phytoplankton and small zooplankton fragments, fecal pellets, and other particles also known as organic aggregates, which includes non-living material and uncharacterized components from biological, mineral, and anthropogenic sources (Riley, 1963; Knauer et al., 1979; Dunbar and Berger, 1981; Hedges et al., 2000; Lutz et al., 2002; Stramski et al., 2008; Kharbush et al., 2020). Near active natural oil seeps or oil spills, POC can incorporate “dead carbon” or hydrocarbon-derived carbon, in a process that has been described as Marine Oil Snow Sedimentation and Flocculent Accumulation. This process has been shown to be an important pathway for the distribution and destination of spilled oil, which in the Gulf of Mexico accounts for up to 14% of the total oil released as a result of the Deepwater Horizon oil spill in 2010 (Daly et al., 2016).
Particulate organic carbon concentration in the euphotic layer is thought to reflect primary production, a process during which photosynthesis fuels the formation of organic carbon from dissolved inorganic carbon and nutrients, thereby decreasing the partial pressure of carbon dioxide in surface waters (Stramska, 2009). Many of these processes are sensitive to fluctuations in temperature, light availability, ocean circulation, vertical mixing, and nutrient inputs into the surface ocean’s euphotic layer (Dawson et al., 2018; Frenger et al., 2018; Dobashi et al., 2022).
In oligotrophic regions, the mixed layer is generally considered as a quasi-homogeneous with little to no variability in density and is usually depleted in nutrients due to uptake by primary producers (Falkowski et al., 1992; Velásquez-Aristizábal et al., 2022). The deepening of this layer allows for subsurface mixing of nutrients toward the surface, fueling biological productivity and consequently increasing POC concentrations (Gardner et al., 1999). These changes can be further driven by vertical mixing from the isopycnal displacement by anticyclonic and cyclonic eddies, especially under strongly stratified upper ocean conditions during summer (Gaube et al., 2014; Gaube et al., 2019).
Mesoscale processes are responsible for the mixing and transport of heat, salt, and biogeochemical tracers across the global oceans and may act as a moderating factor in global climate change (Faghmous et al., 2015). Thus, understanding ocean eddy dynamics and their role in influencing various oceanographic and biological phenomena is of keen scientific interest (Falkowski, 1998; Faghmous et al., 2015). The productivity enhancing effects of eddies is particularly important in low-nutrient environments, where mesoscale processes can regulate the net upward flux of limiting nutrients as a result of the undulation of nutrient isosurfaces: where the shoaling of isopycnal surfaces tends to bring nutrients into the euphotic zone thereby enhancing productivity, whereas their deepening leads to a lack of change or even a decrease in primary productivity (Gruber et al., 2011).
Remotely sensed sea surface heights (SSH) yield important information on the spatial distribution and intensity of ocean eddies and is strongly related to circulation patterns in the ocean, lending insight into nutrient transport crucial to the understanding of the spatial variability of biological production (Gruber et al., 2011). The measurements performed with various in situ and remote sensing platforms provide an effective tool for studying biogeochemical constituents of oceanic waters like chlorophyll-a, particulate inorganic carbon, and particulate organic carbon (Stramski et al., 2008; Ocean Biology Processing Group, G. M, 2022).
The GoM is a semi-enclosed sea linked to the Atlantic Ocean through the Florida Straits and to the Caribbean Sea through the Yucatan Channel (Oey et al., 2005). The deep-water region of the GoM is characteristic for its oligotrophic and nutrient-limited surface waters, which are relatively isolated from coastal eutrophic waters (Martínez-López and Zavala-Hidalgo, 2009; Pasqueron de Fommervault et al., 2017). The Loop Current (LC) brings warm water into the GoM, which leads to high stratification in its area of influence, especially during the summer. Higher intrusion of the LC into the GoM is observed more frequently during the summer, which along with the upper ocean warming, influences the circulation in the interior of the gulf (Sturges and Leben, 2000). In the GoM, positive SSH anomalies are indicative of anticyclonic eddies that are characterized by a deep, warm water layer (Müller-Karger et al., 2015; Dobashi et al., 2022).
The LC and detached LC eddies transport Caribbean Subtropical Underwater into the GoM, which is clearly distinguishable from the GoM common water (Vidal et al., 1992). This common water is formed by vertical convective mixing during the winter season, or by the mixing induced by the collision of detached LC eddies against the western GoM boundary (Schmitz et al., 2005). These mesoscale features drive hydrodynamic processes throughout the central GoM that fuel mixing processes and affect biological productivity patterns (Pérez-Brunius et al., 2012; Müller-Karger et al., 2015; Cervantes-Díaz et al., 2022).
The most energetic mesoscale events are the detachment of large anticyclonic eddies from the LC that drift to the west (Sturges and Leben, 2000), which are dynamically linked with cyclonic and anticyclonic eddies in the Gulf’s interior (Jouanno et al., 2016). The periods between detachments are highly variable (ranging between 0.5 and 18.5 months), implying that there are some years with no eddy detachments from the LC, while during other years these can happen up to three times per year (Sturges and Leben, 2000; Leben, 2005; Vukovich, 2007; Vukovich, 2012; Delgado et al., 2019).
In addition to the quasi periodic shedding of LC eddies, other processes and structures influence the productivity in the southern Bay of Campeche, like the semi-permanent cyclonic eddy in the southern Gulf (Pérez-Brunius et al., 2012), the confluence of seasonal along-shelf currents (Martínez-López and Zavala-Hidalgo, 2009), and upwelling processes along the eastern margin of the Bay of Campeche and off the northeast shelf of the Yucatan Peninsula (Zavala-Hidalgo et al., 2006).
The mixed layer depth’s (MLD) seasonal cycle is driven by the surface ocean cooling during winter months, fueled by northern winds that lead to the erosion of the stratification of its surface waters and a deepening of the mixed layer (Müller-Karger et al., 1991). This wintertime convection of the MLD due to strong winter winds or “nortes” ends during the late spring, when the warming cycle of the surface waters begins; the MLD becomes shallower throughout the summer into the early fall, when the stratification of the upper layers is strongest (Müller-Karger et al., 1991; Martínez-López and Zavala-Hidalgo, 2009). These cycles of winter mixing and summer stratification are thought to be the main controlling factors of the surface chlorophyll-a concentration in GoM (Müller-Karger et al., 2015).
Modeling efforts suggest the higher integrated content of chlorophyll-a (Chl-a) over 350 m occurs in winter whereas lower ocean concentrations happen in summer, while April-May and October-November are transitional periods (Damien et al., 2018). In addition, float data show that mesoscale activity is most likely the main source of variability for the Chl-a concentration in the deep-water region of the GoM, with higher concentrations observed in cyclones compared to anticyclones (Pasqueron de Fommervault et al., 2017; Linacre et al., 2019).
Additionally, cyclonic and anticyclonic eddies drive vertical mixing through the modulation of nutrient transport to the euphotic zone, thereby exerting influence on Chl-a concentrations in the euphotic layer (McGillicuddy, 2016; Honda et al., 2018) as well as POC concentrations (McGillicuddy, 2016). Still, there are limited field observations available to characterize how mesoscale physical processes may affect the POC of the deep-water region of the GoM (Müller-Karger et al., 2015).
POC in the GoM has been mostly studied over the continental shelf, particularly in the north and northeast. The transport of freshwater plumes and filaments from the Mississippi and the Atchafalaya Rivers advect higher nutrient concentration waters to the northern shelf region, especially to the continental shelves of Louisiana and Texas (Biggs, 1992; Trefry et al., 1994; Goñi et al., 1997; Bianchi et al., 1997; Wang et al., 2004). However, the role of mesoscale structures on POC concentrations in the GOM’s deep-water region, especially in the southern gulf and the Bay of Campeche, known for its relatively higher productivity within the gulf (Martínez-Lopez and Zavala-Hidalgo, 2009; Linacre et al., 2015), has yet to be examined. Hence, our study aims to understand the role of mesoscale eddies on POC concentrations in the upper layer of the southern GoM´s deep-water region.
For the sampling, 319 discrete seawater samples were collected during three cruises covering the deep-water region of the southern GoM on board the R/V Justo Sierra using Niskin bottles mounted on a rosette (Table 1). At each station, continuous profiles of temperature, pressure, conductivity, and chlorophyll fluorescence were measured with a Sea-Bird® 9 plus CTD and sensors. In Figure 1, we present a map of the stations and the bathymetry of the deep-water region of GoM. All stations were > 1000 m depth; casts at some stations were done to 1000 m regardless of depth (hereafter referred to as shallow cast stations), and some to about 40 m off the bottom (deep cast stations).
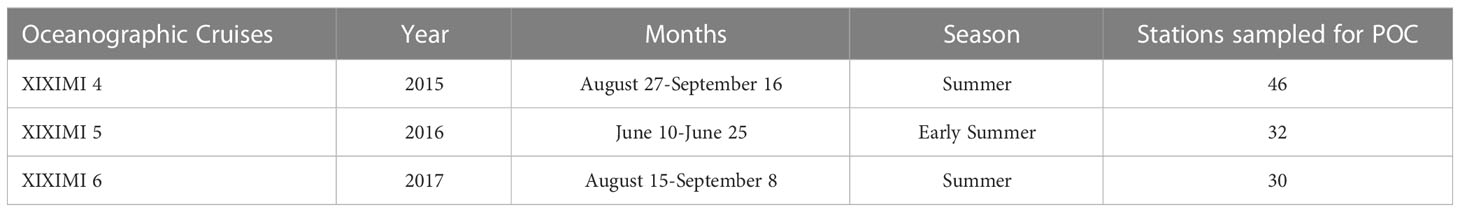
Table 1 Oceanographic cruise sampling dates for particulate organic carbon (POC) in the oceanic Gulf of Mexico.
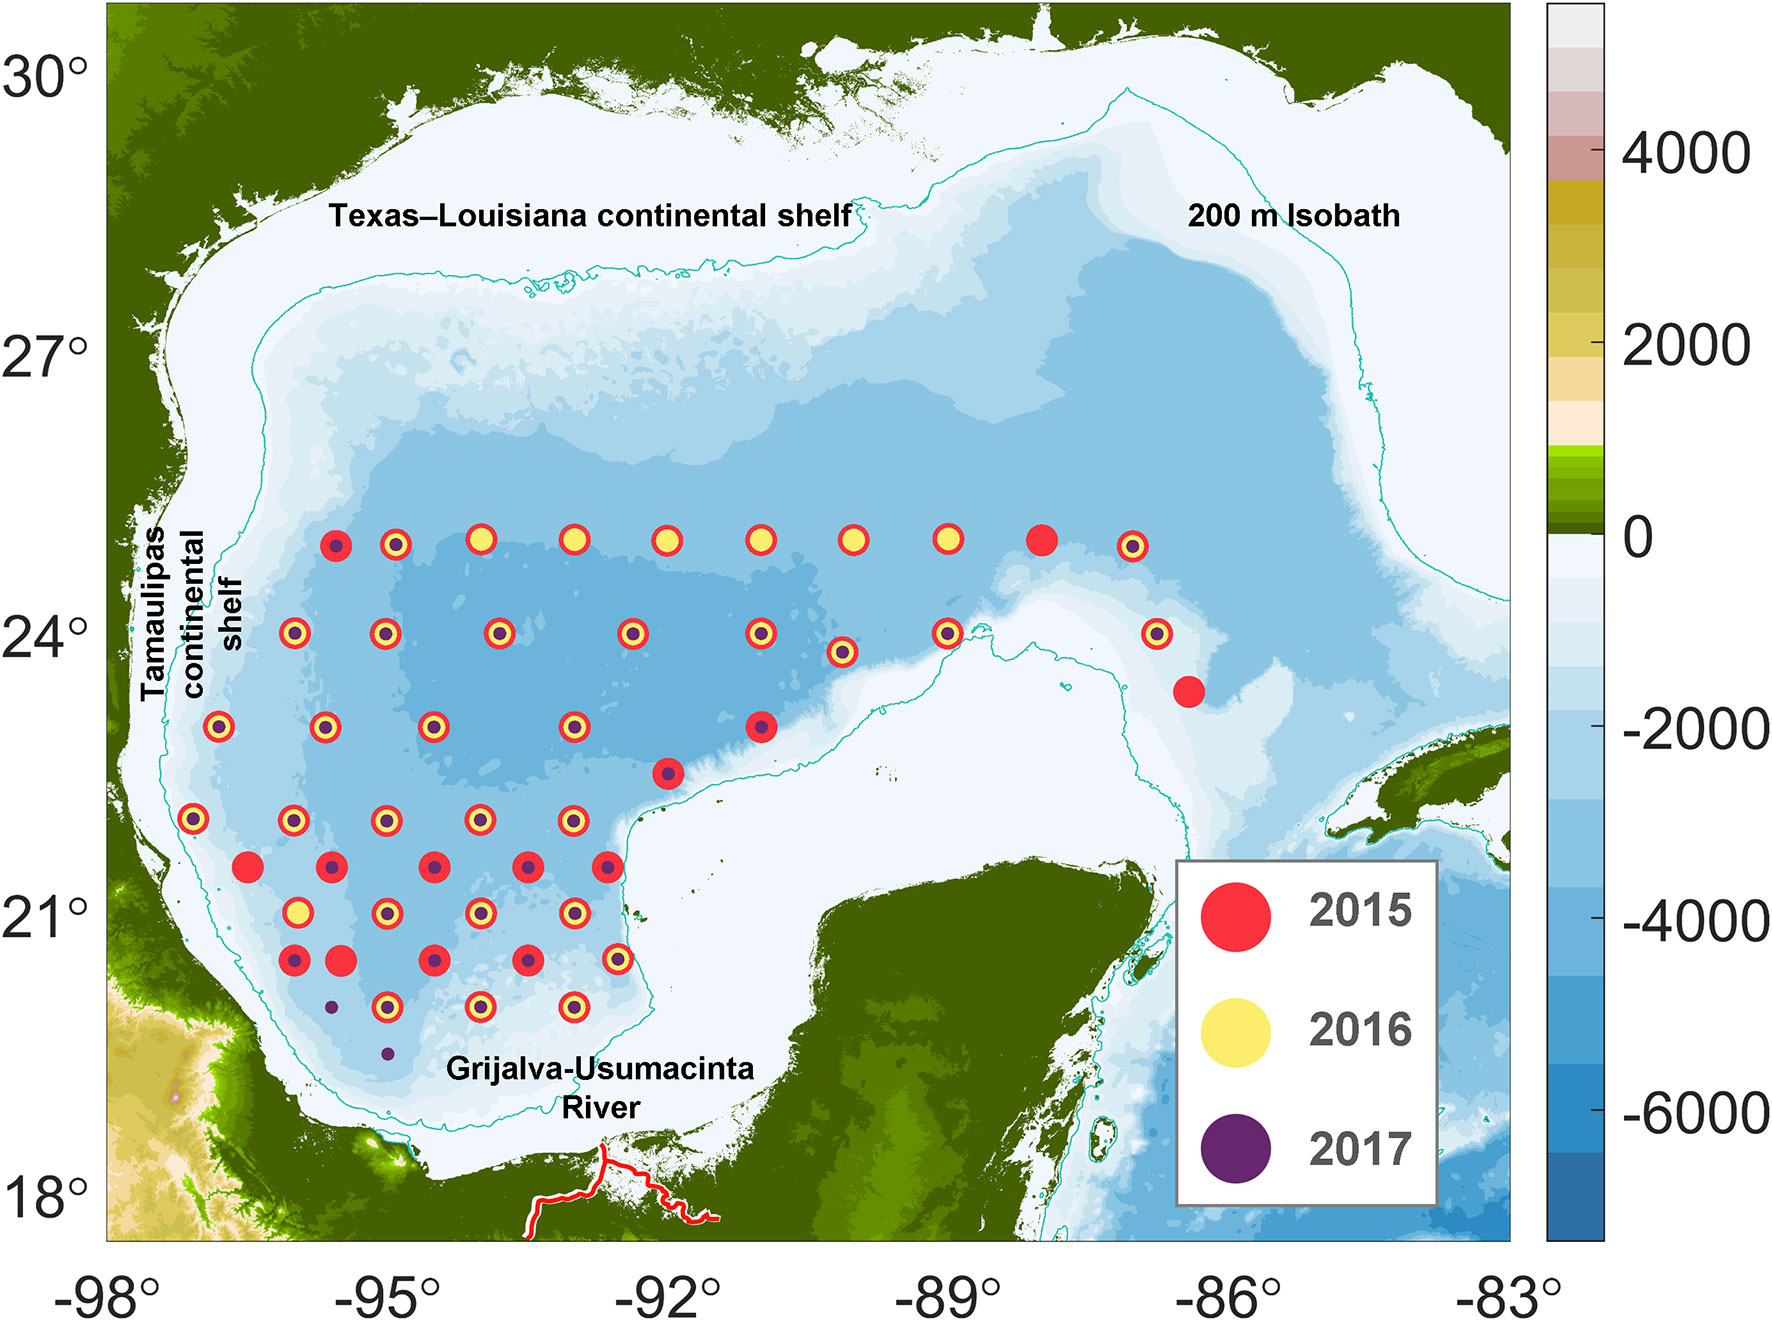
Figure 1 Sampling stations covered in the 2015, 2016, and 2017 XIXIMI cruises. Red circles represent stations sampled during 2015, yellow circles stations sampled in 2016 and purple circles the stations sampled in 2017. The blue line represents the 200m isobath, and the red line the Grijalva-Usumacinta River System.
Given the low concentration of POC in the oligotrophic waters of the GoM, it was necessary to pool water samples collected at different depths of the water column for analysis (Supplementary Table 1 and Supplementary Figure 1). At the shallow cast stations (<1000 m), the samples comprised depth filtrations of seawater from three discrete depths ranging from 10-50, 75-250, and 300-1000 m (i.e., samples were pooled, and data were obtained for these three broad layers). For the deep cast stations, samples were pooled from 10 m to the depth of maximum fluorescence, between 150-800 m, and from 1000 m to a few meters above the seafloor, the sampling strategy was agreed among all the different participating groups from the beginning of the CIGoM’s project. The basic rationale behind the pooling of several depths was the need to filter large volumes of water to obtain the necessary amount of carbon for the analysis. Discrete sampling depths were generally consistent, except for the targeted sampling during each cast of the chlorophyll maximum and oxygen minimum (identified based on the CTD profiles). For visualization purposes, POC values are plotted at the average depth of all the discrete samples collected within any given layer.
POC sampling and processing followed the Joint Global Ocean Flux Study methodology of Knap et al. (1996) with some modifications. Specifically, the seawater was filtered through a pre-combusted (500°C for 4 hours) Whatman® glass microfiber filter (GF/F) with a diameter of 45 mm and 0.7 µm pore size. Typically, between 7.5 L and 60 L of water was filtered to get a minimum weight per determination of 100 μg for POC. Filtered samples were placed in aluminum foil cleaned with ethanol and Kimwipes®, stored frozen during the cruise and transported to the laboratory for processing. In the laboratory, the samples were freeze-dried and then treated by vaporization with chlorohydric acid (1M) in a desiccator bell to remove the particulate inorganic carbon. Filters were then scraped with an X-Acto® knife to obtain the POC sample, while minimizing the glass fiber from the filters, and encapsulated in tin capsules.
The concentrations were determined on a Costech® CHN analyzer at the Stable Isotope Laboratory at CICESE and are reported as µmol/L. The international references used for POC were USGS 40 and IAEA-CH-6. POC concentrations were corrected for blanks (unused filters that had the same treatment as the rest) and calibrated using different weighted samples of sulfanilamide, the detection limit of this method is 4.16 µmolC (50 μgC); during the measurement period the standard deviation of the references was below 0.06 µgC.
POC data were not generated for surface layer during our cruises because water samples were used for other analyses. Hence, we used the satellite-derived surface concentrations to complement the POC stations profiles(https://oceancolor.gsfc.nasa.gov/data/aqua/). We obtained daily estimates of POC concentration (mg m-3) and Chl-a surface concentrations (mg m-3) from the Moderate-Resolution Imaging Spectroradiometer (MODIS-Aqua Satellite) Level 3 mapped product with a spatial resolution of 0.04° (~ 4.4 Km) for 2015, 2016 and 2017 (NASA Goddard Space Flight Center, et al., 2018). Because of the lack of data at some stations locations due to clouds, sun glint, low light levels, etc., we filled the gaps using the average value of the nearest data points by considering radial increments of 0.04° around the location, up to a fourth iteration when needed (for a maximum radius of 0.16° around a station). If surface POC concentrations were unavailable within maximum, the station was eliminated from further analysis.
The surface POC concentration is based on an empirical relationship between in situ measurements of POC and blue-to-green band ratios of remote sensing reflectance. The algorithms have yielded good performance over vast areas of the oceans, including different hyper oligotrophic and oligotrophic provinces with a determination coefficient between 0.7 to 0.9 (Stramski et al., 2008).
Daily SSH data were obtained from AVISO (https://www.aviso.altimetry.fr/en/home.html) using a gridded mesh with a spatial resolution of 0.25° (~ 27.8 Km) for 2015, 2016 and 2017. The non-steric SSH (SSHns) were calculated by subtracting the average SSH value for the GoM data (Domínguez-Guadarrama and Pérez-Brunius, 2017).
The in situ density profiles were calculated from conservative temperature, absolute salinity and pressure profiles using GSW Oceanographic Toolbox from The International Thermodynamic Equation of Seawater (TEOS-10) (McDougall and Barker, 2011).
Apparent oxygen utilization (AOU) profiles were calculated as the difference between oxygen gas solubility and the measured oxygen concentration in water using TEOS-10 (McDougall and Barker, 2011).
In the absence of direct turbulent dissipation measurements, the MLD is commonly derived from oceanic profile data using threshold, integral, least squares regression, or other proxies (Thomson and Fine, 2003). In our case the MLD was defined as the depth of the maximum Brunt- Väisälä Frequency, calculated from absolute salinity, conservative temperature, pressure, and latitude using TEOS-10 (McDougall and Barker, 2011).
The maximum fluorescence depth (MFD) was defined as the highest fluorescence value obtained from the vertical profile of each station.
Quantitative estimates of integrated POC in the surface layer vary depending on the choice of the depth to which the integration is made (Stramska, 2009). We used three different depths to estimate integrated POC: (1) to a constant depth of 100 m (POC100), (2) within the mixed layer at each station, with a boundary defined by the Brunt Väisällä frequency since it provides a link between the physical structure of the water column and the depth of mixing, and (3) to the depth of the fluorescence maximum, as indicative of the depth with the highest chlorophyll fluorescence (Supplementary Material- POC data). This was done to evaluate which criteria better explained the spatial patterns of POC in terms of the physical and biological variables used in this study. To examine the main controls on the POC concentration in the upper layer of the GoM, POC data for each station were interpolated with a Piecewise Cubic Hermite Interpolating Polynomial method with a 1 m resolution (Supplementary Figure 2), which preserves the shape of the data and respects monotonicity (Fritsch and Carlson, 1980).
To find out how the SSHns may influence the concentrations of POC in the water column, we correlated the surface POC concentrations against the SSHns.
We generated two data sets of SSHns:
● Daily sea surface height, which corresponds to SSHns for the day when the samples were taken.
● Monthly sea surface height, which corresponds to the average of the SSHns during the period of the cruise.
Kelly et al. (2021) examined the contributions and mechanisms of the carbon budgets in the GoM and concluded that lateral transport of organic matter is substantial in oligotrophic ocean regions of the northeastern Gulf in the vicinity of the Loop Current and may be crucial to multiple trophic levels in the GoM. To explore the possibility of a lateral transport between the production and formation of POC, we also correlated POC concentrations with SSHns considered a radius of 0.25 degrees around the stations (daily and monthly SSH (0.25°)).
We also correlated the surface POC concentration of each cruise vs. the surface Chl-a concentrations, MFD, and MLD, to evaluate whether there was a spatial relationship.
Mesoscale structures are mainly generated by ocean large-scale circulation instabilities due to wind or topographic obstacles, creating variability around the ocean´s mean state, and it helps us to understand the role of mesoscale structures on ocean dynamics (including POC production and export) and to discriminate the effect of eddies from other processes (Mason et al., 2014; Pegliasco et al., 2022).
To understand the relationship between mesoscale features and POC concentrations we used “The altimetric Mesoscale Eddy Trajectories Atlas (META3.2 DT allsat) products, processed by CNES/CLS in the DUACS system and distributed by AVISO+ (https://aviso.altimetry.fr)”. The algorithm used for these products is derived from Mason et al. (2014) and further described in Pegliasco et al. (2022).
This method follows four steps: filtering, detection, estimation of eddy characteristics, and tracking. For further description about the algorithm check the manual ¨Mesoscale Eddy Trajectory Atlas Product Handboook¨ (Aviso+ Altimetry, 2022).
After we downloaded the altimetric mesoscale eddy trajectories dataset, we filtered it by date, longitude, and latitude. We used this to identify daily mesoscale structures within the GoM during the three cruises, obtaining a map for each day of the cruise, in total 21, 15, and 25 maps were obtained for 2015, 2016 and 2017 respectively (Table 1). Figure 2 presents an example of the approach followed in our selection of centers and borders in cyclones and anticyclones. To aid in the understanding of the results obtained from eddy identification, we also examined geostrophic flows (downloaded from https://cds.climate.copernicus.eu/#!/home).
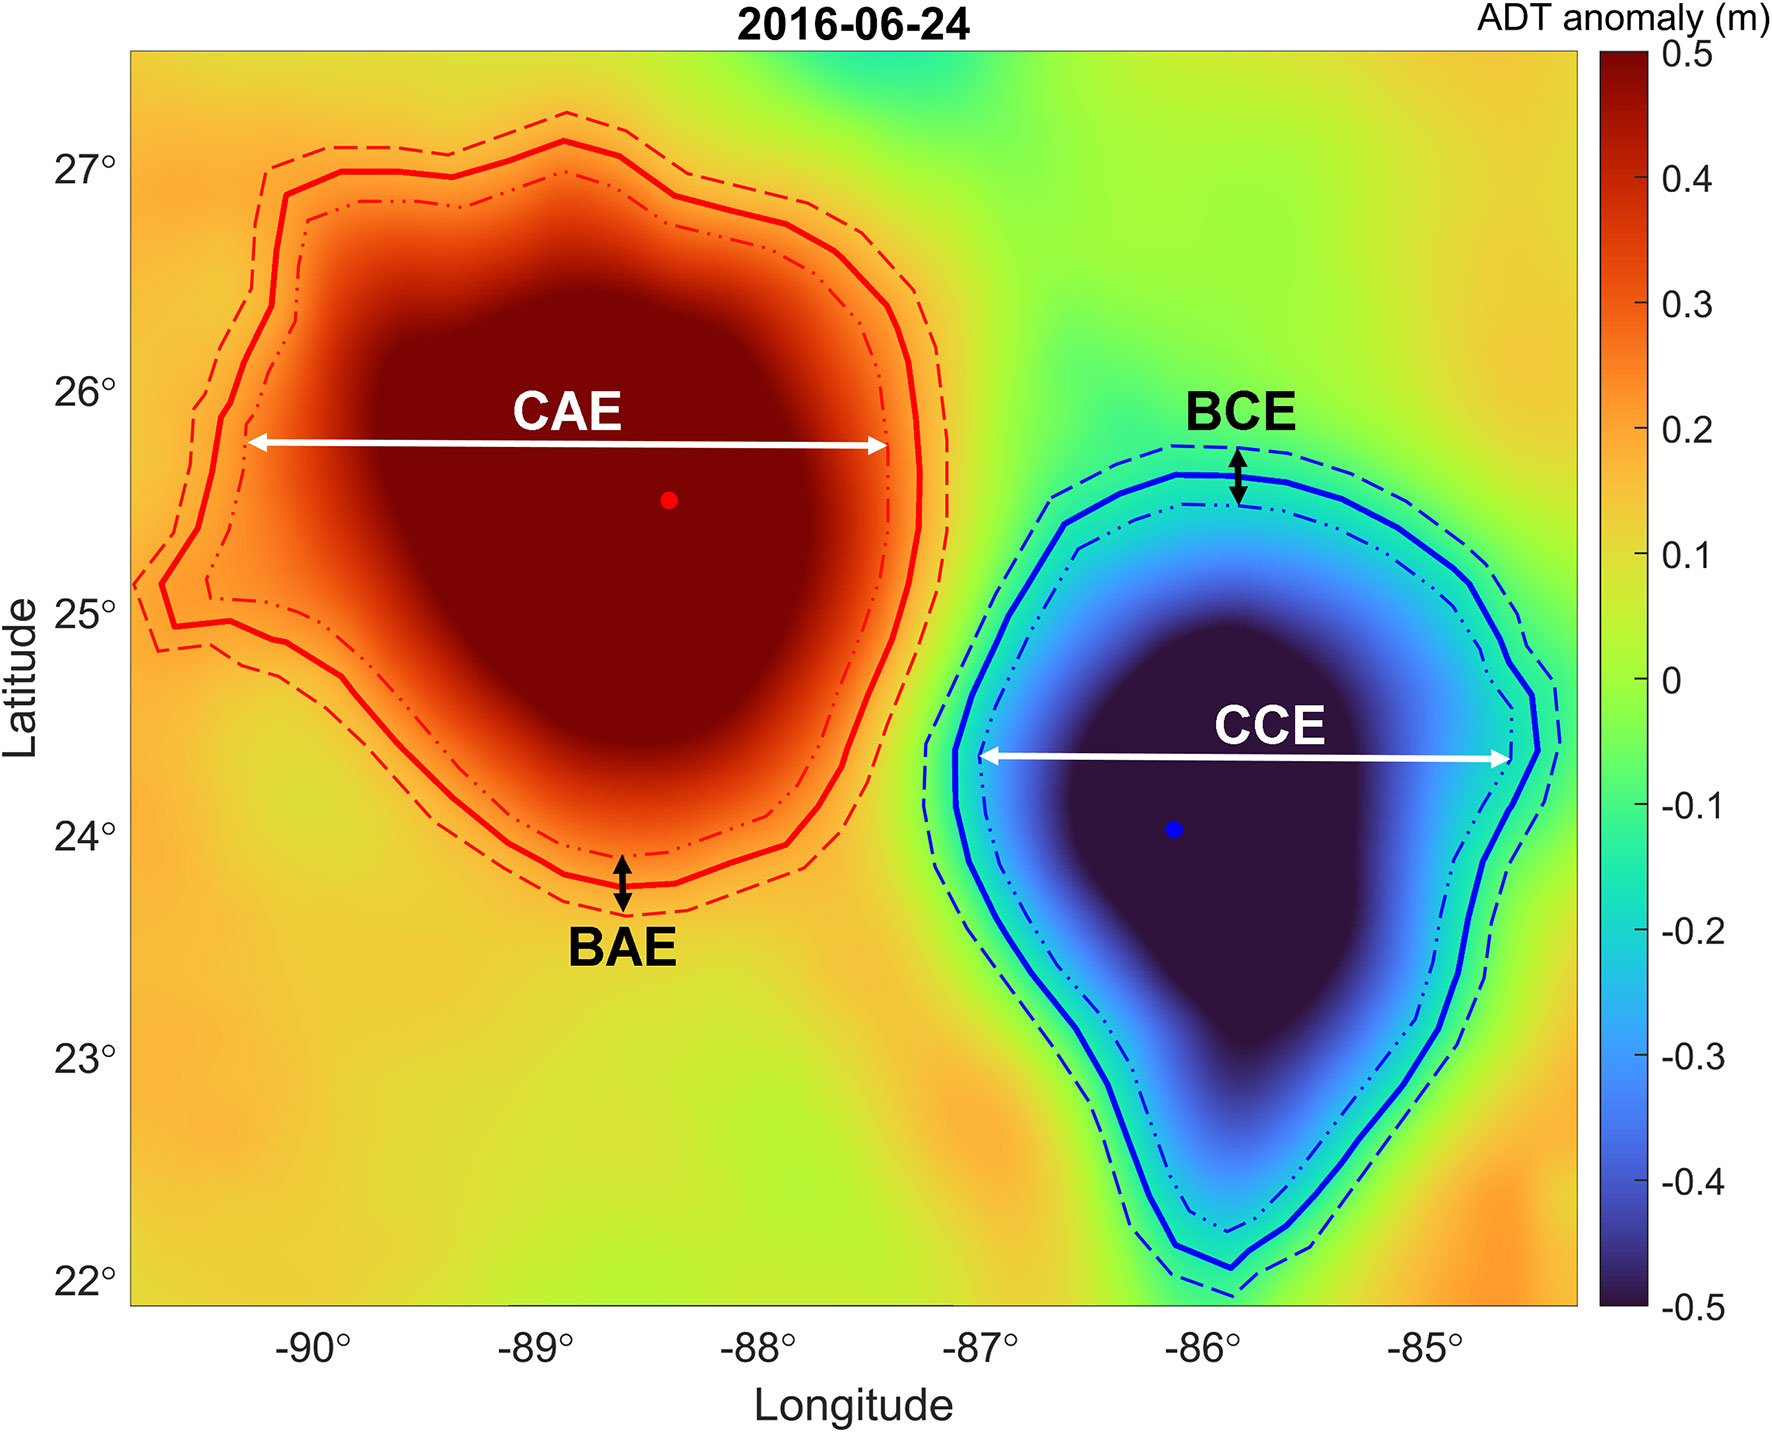
Figure 2 Absolute dynamic topography anomaly map depicting cyclonic and anticyclonic mesoscale structures observed on June 24, 2016. The blue/red line and dot represents the cyclone/anticyclone contour and center; data extracted from the altimetric Mesoscale Eddy Trajectories Atlas at AVISO+. The areas delimited by the dotted lines represent the border and center classification zone for the sampling stations that were in mesoscale structures.
We classified eddies based on their rotational direction in the Northern Hemisphere, as either cyclonic (counterclockwise) or anticyclonic (clockwise). The results from the Mesoscale Eddy Trajectories Atlas allow us to visually determine whether our sampling stations were located near the center of a structure or near the border (within a radius less than ~0.08° from the contour). We classified stations based on whether they were located near the center of a cyclonic eddy (CCE), near the border of a cyclonic eddy (BCE), near the center of an anticyclonic eddy (CAE), or near the border of an anticyclonic eddy (BAE). Stations that fell outside these features were classified as no eddy (NE). We grouped the stations according to their categories and made composite vertical profiles of fluorescence, density, AOU and POC using pooled data for the three cruises.
A two-sided Wilcoxon rank sum test (equivalent to a Mann-Whitney U-test) was used to compare the medians of MLD and MFD between years. A Kruskal-Wallis analysis was used to test for differences in the MLD and MFD between cruises and in surface POC concentrations and integrated POC100 in each category of mesoscale feature (α =0.05).
Principal component analysis (PCA) was applied to examine associations between the oceanographic variables and the POC concentrations among the station’s classifications. When two variables were highly correlated (Pearson’s correlation r>0.7), one was removed prior to PCA. The analysis included density at 10 m depth, MLD, MFD, SSHns, surface Chl-a, the fluorescence maximum, the depth at which the slope of the AOU changes towards positive values, surface salinity, sea surface temperature, the average temperature in the first 100 m and integrated POC100 concentration.
Figure 3 presents maps of non-steric SSH, sampled stations and the geostrophic velocities mapped from the average of time span of each cruise (Table 1). During 2015 and 2016, there were stronger mesoscale circulation features in the central GoM than during 2017. During the 2015 cruise, two large anticyclones were observed between 24° and 28°N; Olympus (1), recently released from the LC, and the remnant of Nautilus (2) formed in May 2015 (www.horizonmarine.com; Figure 3). During this cruise we further observed the lowest SSHns values in the Bay of Campeche region. In 2016, a large anticyclone called Poseidon (3) had been recently detached from the LC, and the rest of the GoM presented higher SSHns values than during the 2015 cruise. In 2017, the LC showed a high level of intrusion into the GoM, but there were no large anticyclones within the gulf, and the SSHns were generally higher than during the 2016 cruise but lower than in 2015.
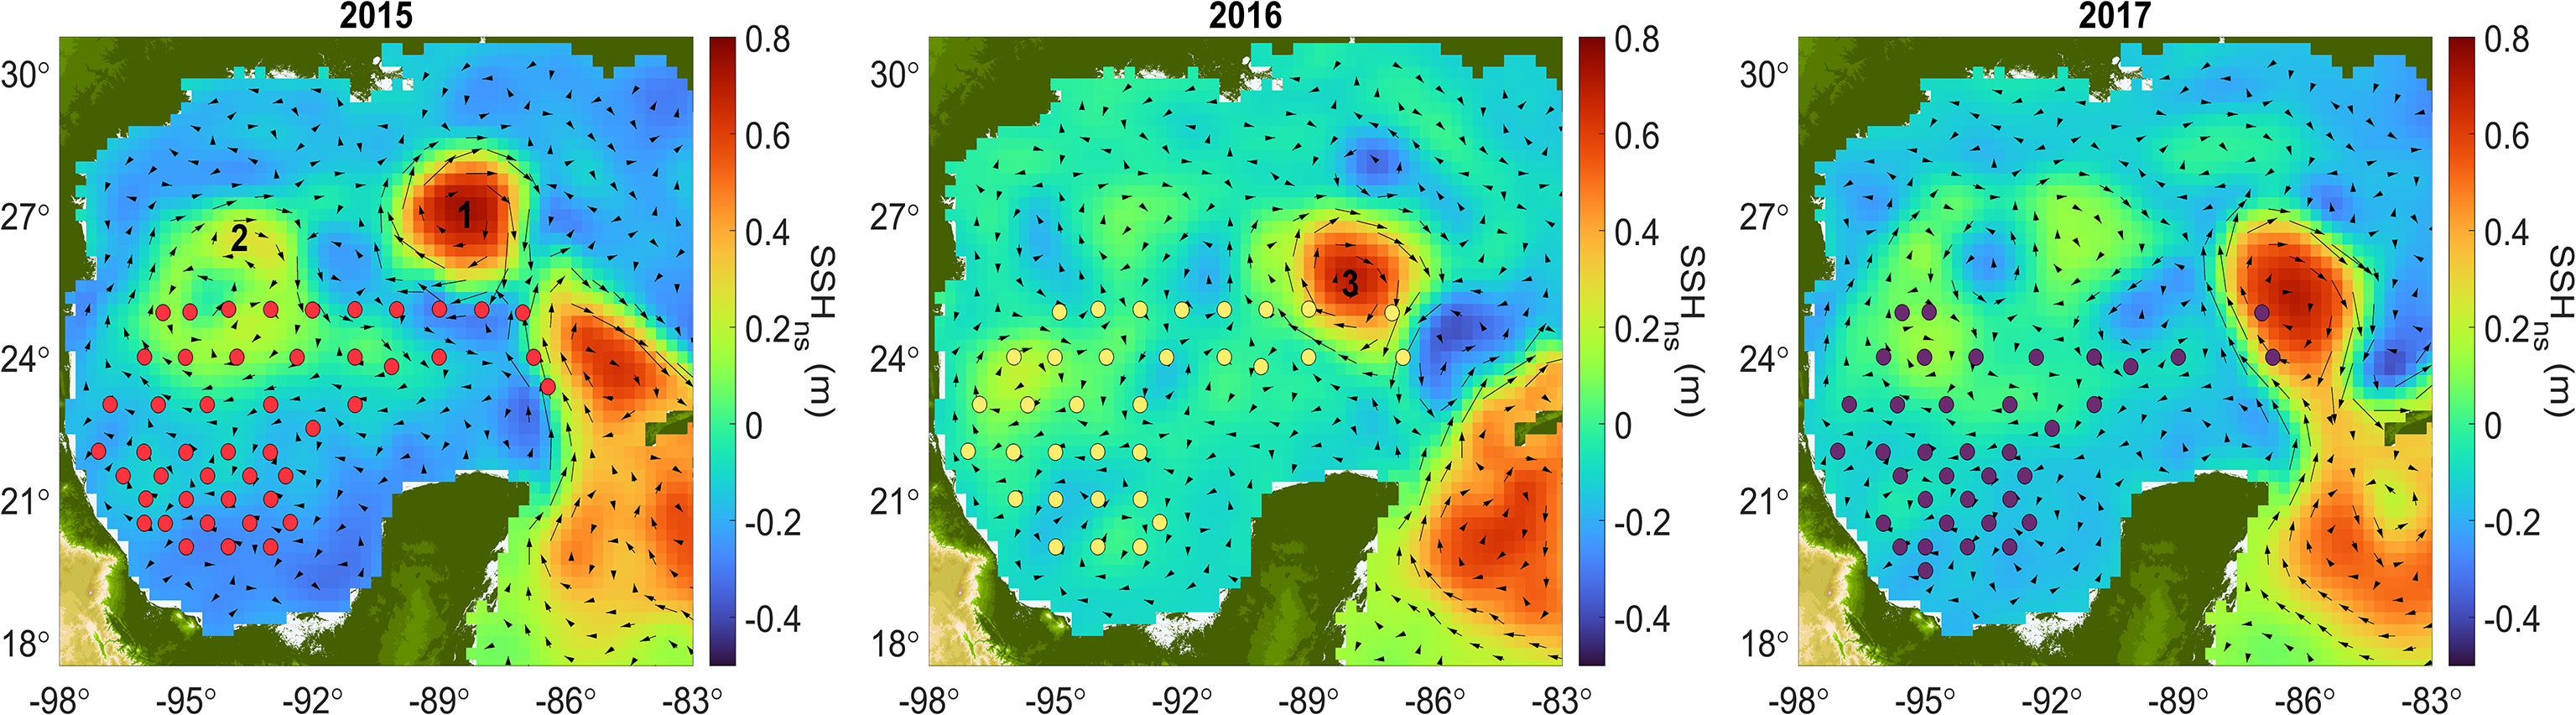
Figure 3 Mean non-steric sea surface height (SSHns) for the GoM during 2015, 2016, and 2017 cruises. Arrows represents geostrophic velocities. 1: Olympus. 2: Nautilus remnants. 3: Poseidon. Circles represent stations sampled during each cruise.
A Kruskal-Wallis test indicated that the median MLD differed between years (p<<0.001). The MLD maps presented in Figure 4 indicate that during 2015 the MLD was deeper in the northwestern part of the study area (~58 m), while the shallowest depths (~20 m) were in the east. MLDs were markedly shallower during the 2016 cruise (Figure 4-middle panel) with an overall mean of 27 m. During that cruise, the Bay of Campeche showed the shallowest MLD, around ~15 m. During 2017, the MLD was deeper than in 2016 (Figure 4-right panel) with a mean of 35 ± 9 m and with the deepest values toward the center of the GoM.
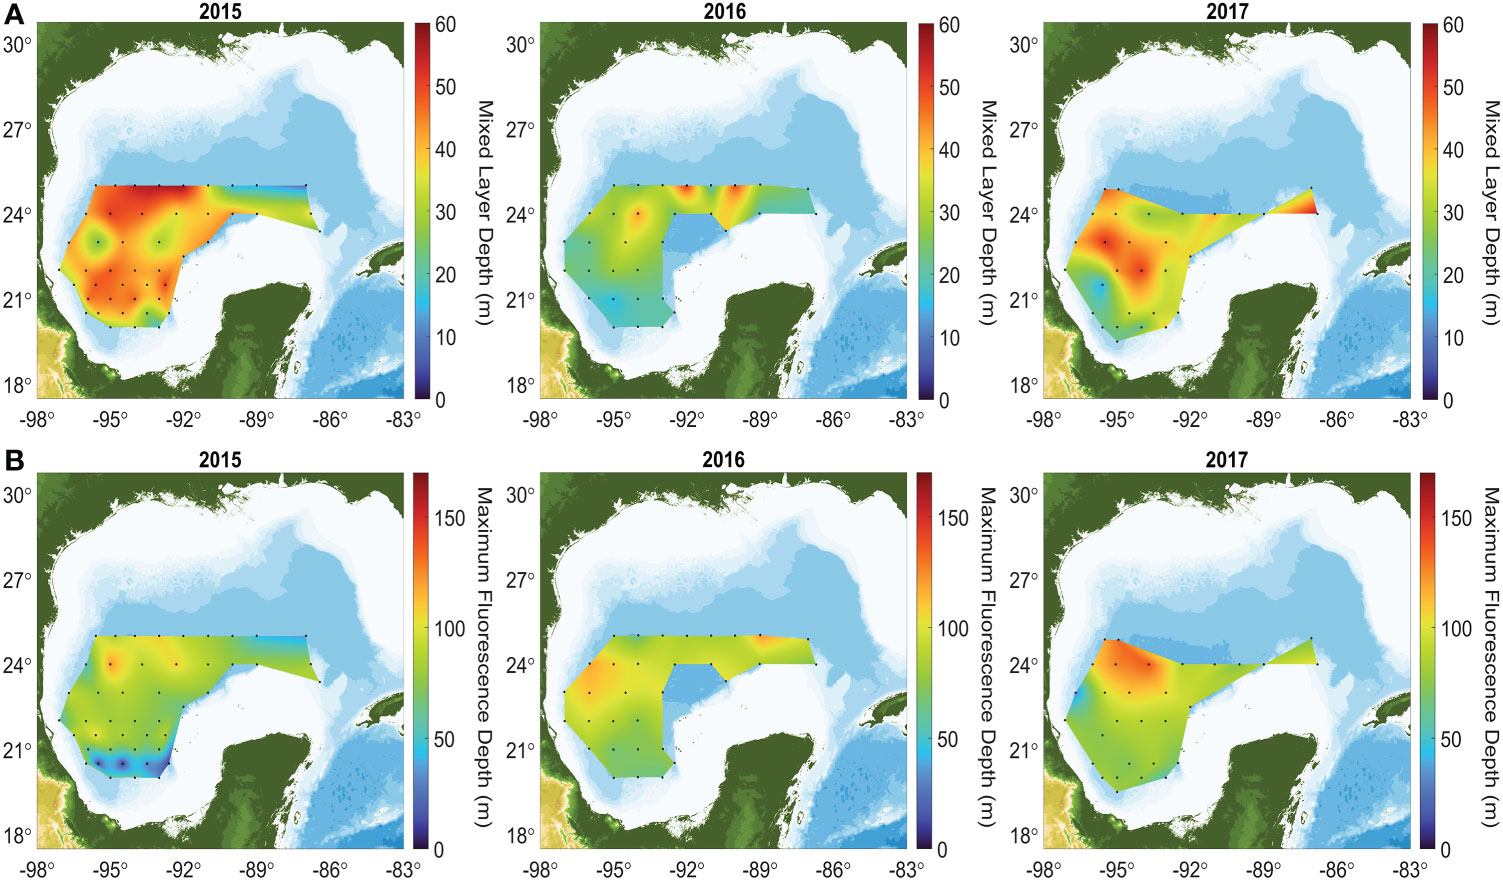
Figure 4 Mixed layer depth (MLD - A, top panels) and maximum fluorescence depth (MFD - B, bottom panels) in the GoM during 2015, 2016, and 2017 cruises.
The median MFD differed significantly between years, as indicated by the Kruskal-Wallis test (p = 0.012). The MFD maps in Figure 4B (cruise´s average is in Table 2) show that the highest values were consistently located over the central gulf (abyssal region) during the three cruises, with a mean depth during 2015 of 73 ± 24 m, of 88 ± 15 m during 2016, and 86 ± 21 m during 2017.
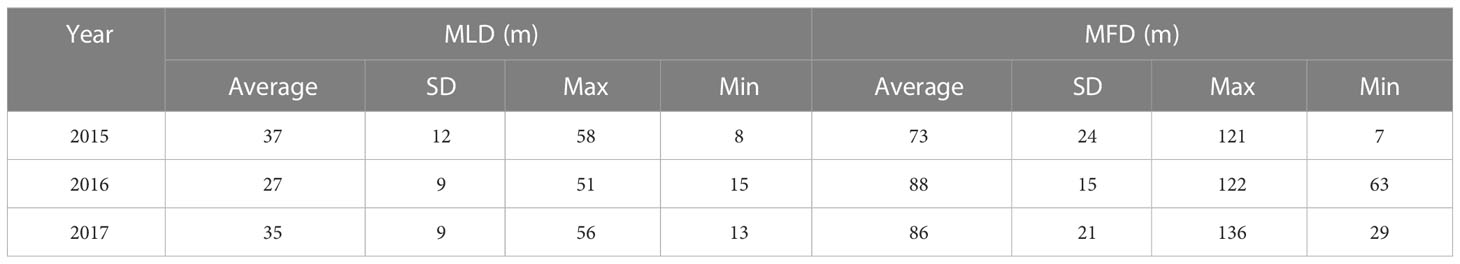
Table 2 Mixed layer depth and maximum fluorescence depth during three cruises covering the southern Gulf of Mexico’s deep-water region.
In Figure 5, POC profiles show a pattern consistent with the well-known exponential decay with depth in the water column (Suess, 1980), with higher concentrations at the surface (between 2 to 7 µmol L-1) and decreasing with depth to values less than 1 µmol L-1 below 700m. The sinking velocity of POC aggregates is mainly determined by their size, internal microstructure (porosity and heterogeneous composition), density and the amounts of biogenic calcium carbonate and opal structures that act as ballast minerals (Iversen and Ploug, 2010; Armstrong et al., 2002; De La Rocha and Passow, 2007). In addition, POC’s sinking velocity and flux is hypothesized to be modulated by microbial remineralization and by zooplankton grazing (Guidi et al., 2009).
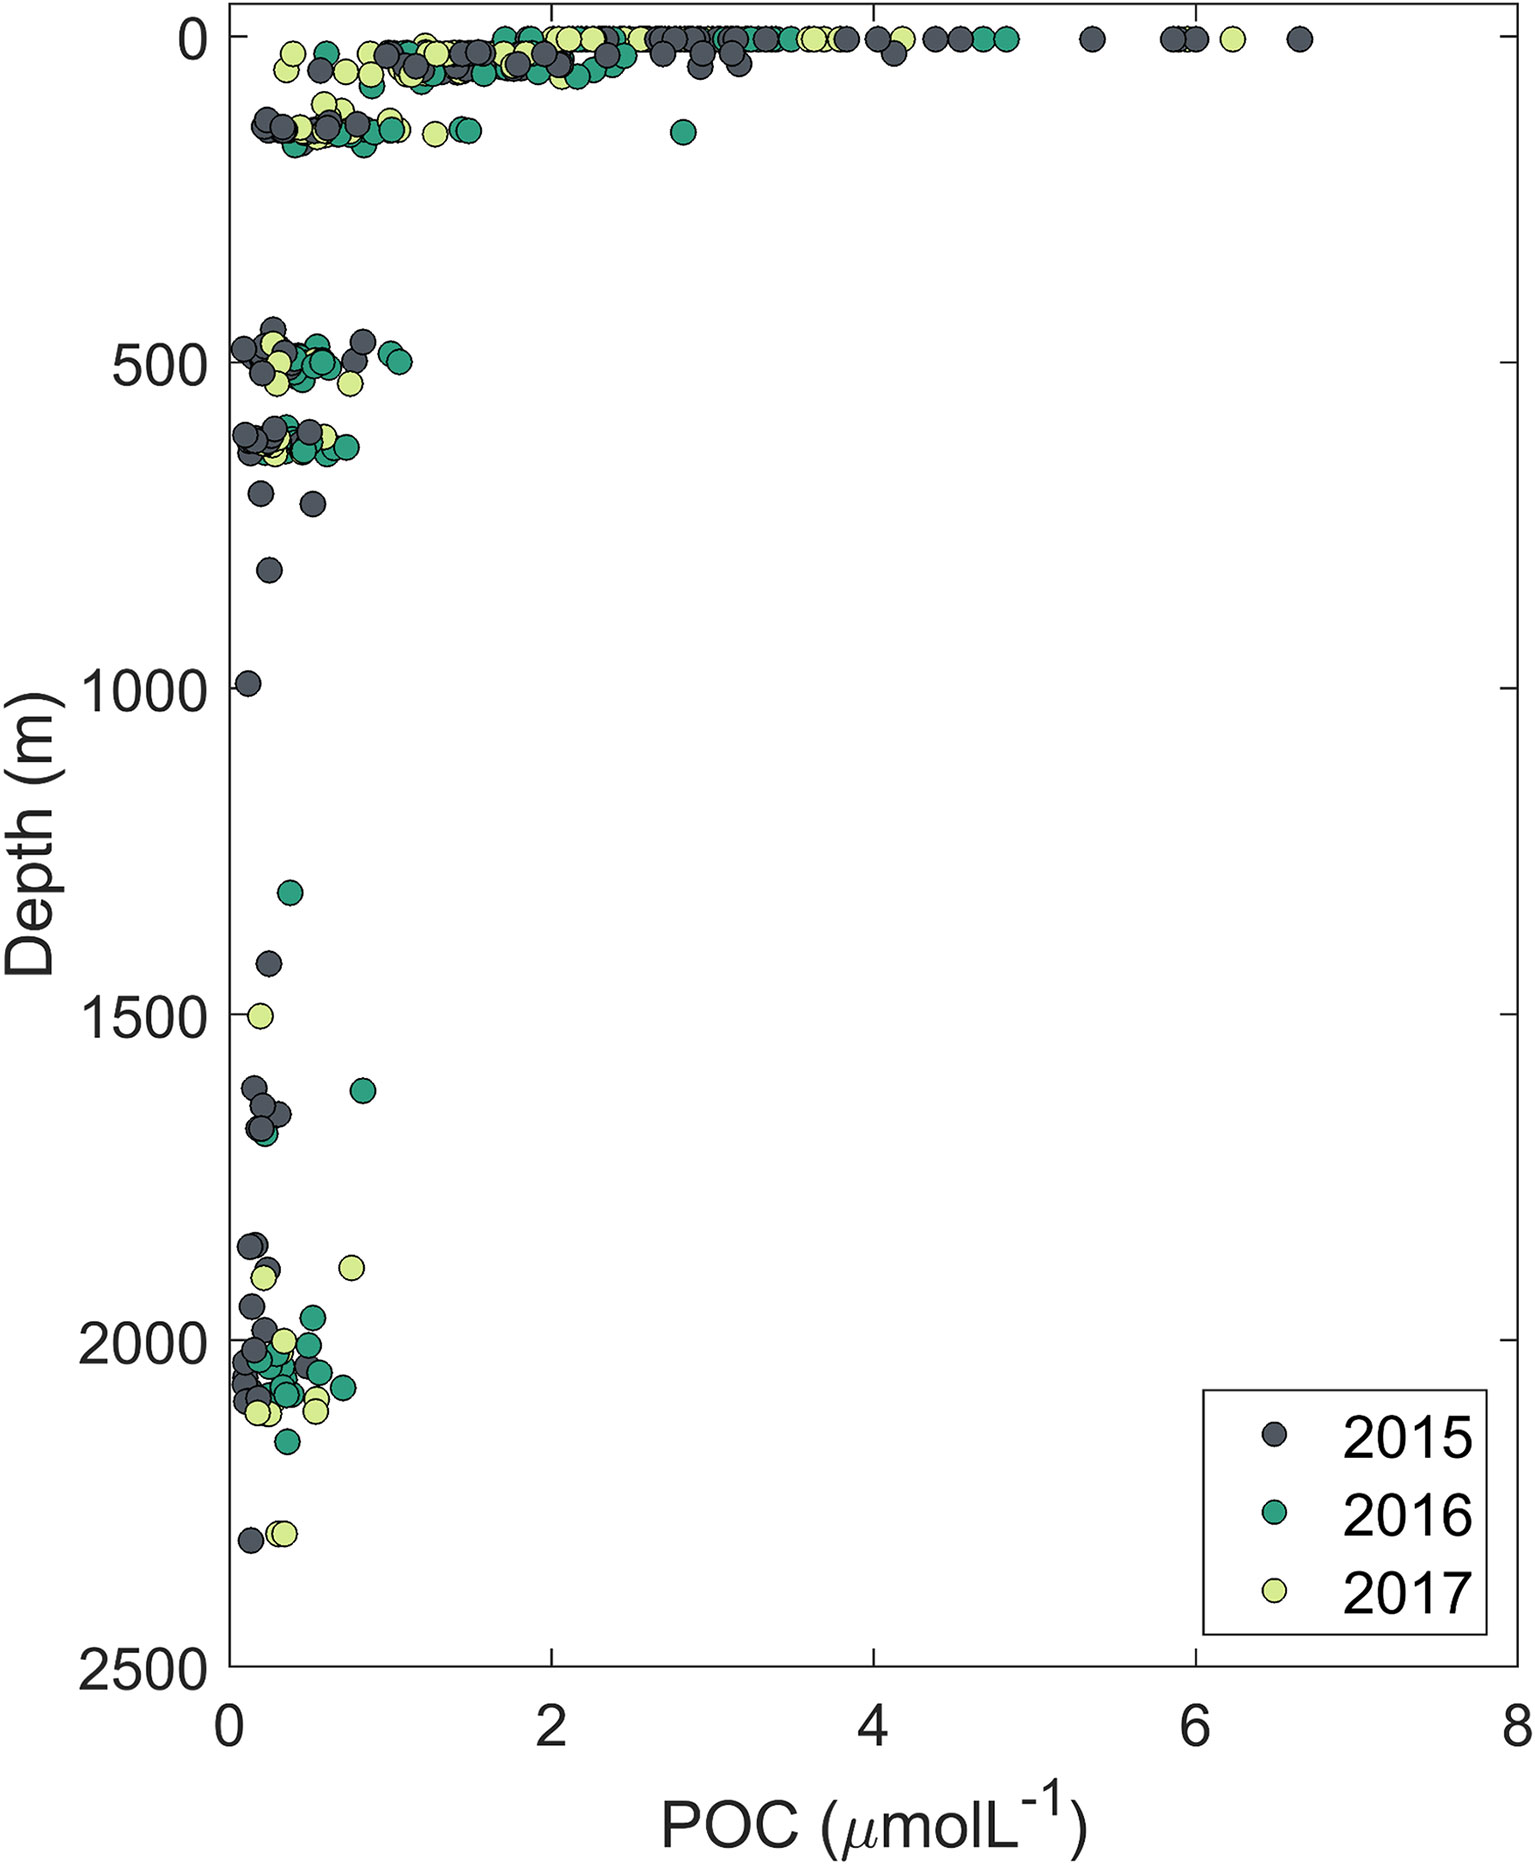
Figure 5 Surface and subsurface particulate organic carbon (POC) concentrations at different depths in the GoM for 2015, 2016, and 2017 cruises. POC concentrations at depths below the surface reflect the mean of the three discrete water sampling depths from which water samples were pooled.
To understand the control of the surface ocean conditions on POC concentrations in the GoM, we considered different integrated depths sampled during the 2015, 2016, and 2017 cruises; the maps are shown in Figure 6 and Supplementary Figure 3, and the average, standard deviations and coefficients of variation are in Table 3 and Supplementary Table 2.
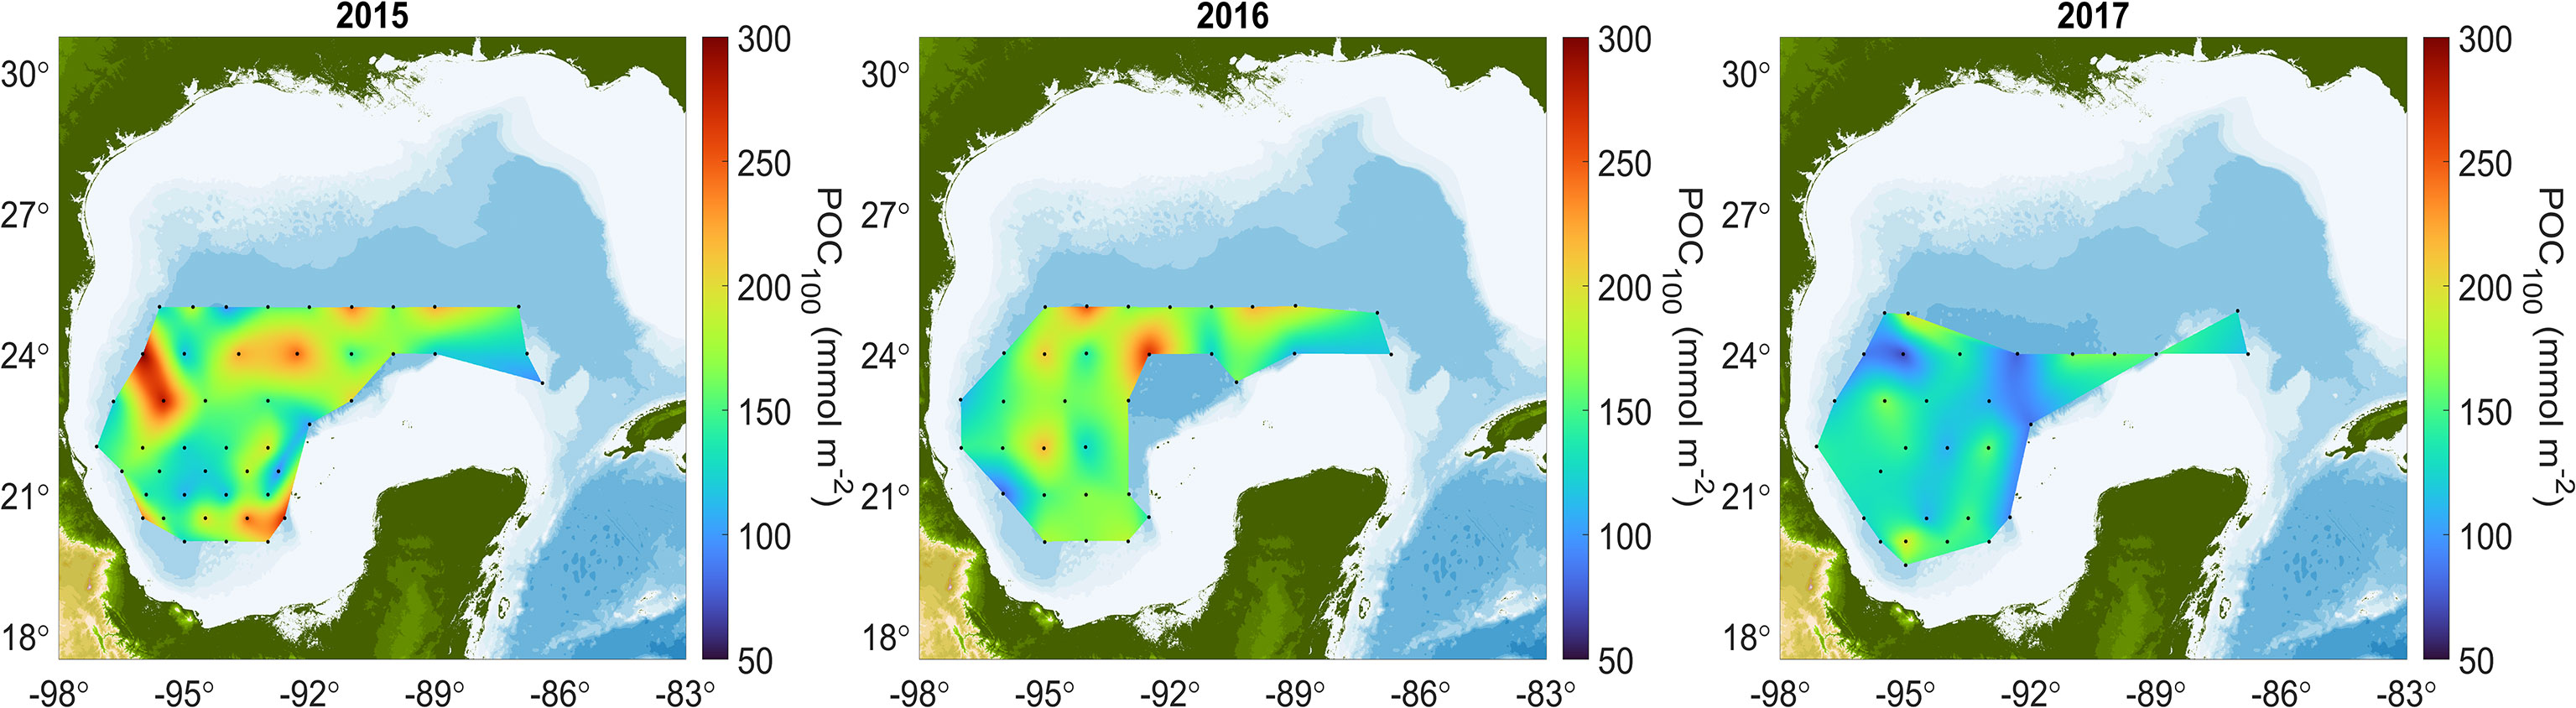
Figure 6 Integrated particulate organic carbon concentrations for the first 100 m (POC100).
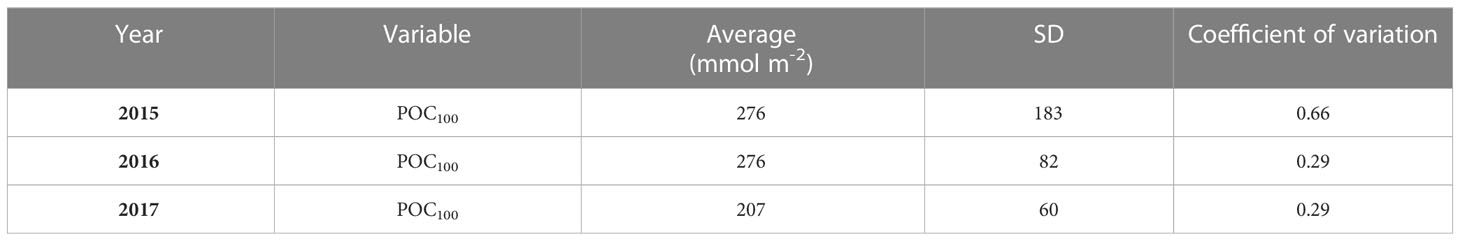
Table 3 Integrated POC100 during three cruises covering the southern Gulf of Mexico’s deep-water region.
In Figure 6, integrated POC100 showed mean values of 276 mmol m-2 during 2015 and 2016, and lower mean values during 2017 (207 mmol m-2). The Kruskal-Wallis test indicated the medians in the integrated POC100, between 2015, 2016 and 2017 were significantly different (p = 0.003). The integrated POC100 during 2015 showed a spread of values between 125 – 200 mmol m-2 throughout the GoM, with highest values (300 mmol m-2) at two stations located in the western region, and the lowest between 21°–22° N. During 2016, the spatial distribution of POC100 showed similar spatial patterns to 2015, with values between 150 - 250 mmol m-2, and lowest values in the Bay of Campeche. In contrast, during 2017 all integrated measures of POC were mostly lower than during the previous two years. POC100 showed values between 60 and 150 mmol m-2 in the central GoM stations.
The interpolated POC, density, fluorescence, and AOU profiles for the stations in each category (CCE, CAE, BCE, BAE, and NE) were pooled across years to examine the influence of mesoscale structures; means and standard deviations were calculated to provide a visual representation of the variability (Figure 7, and Supplementary Table 3).
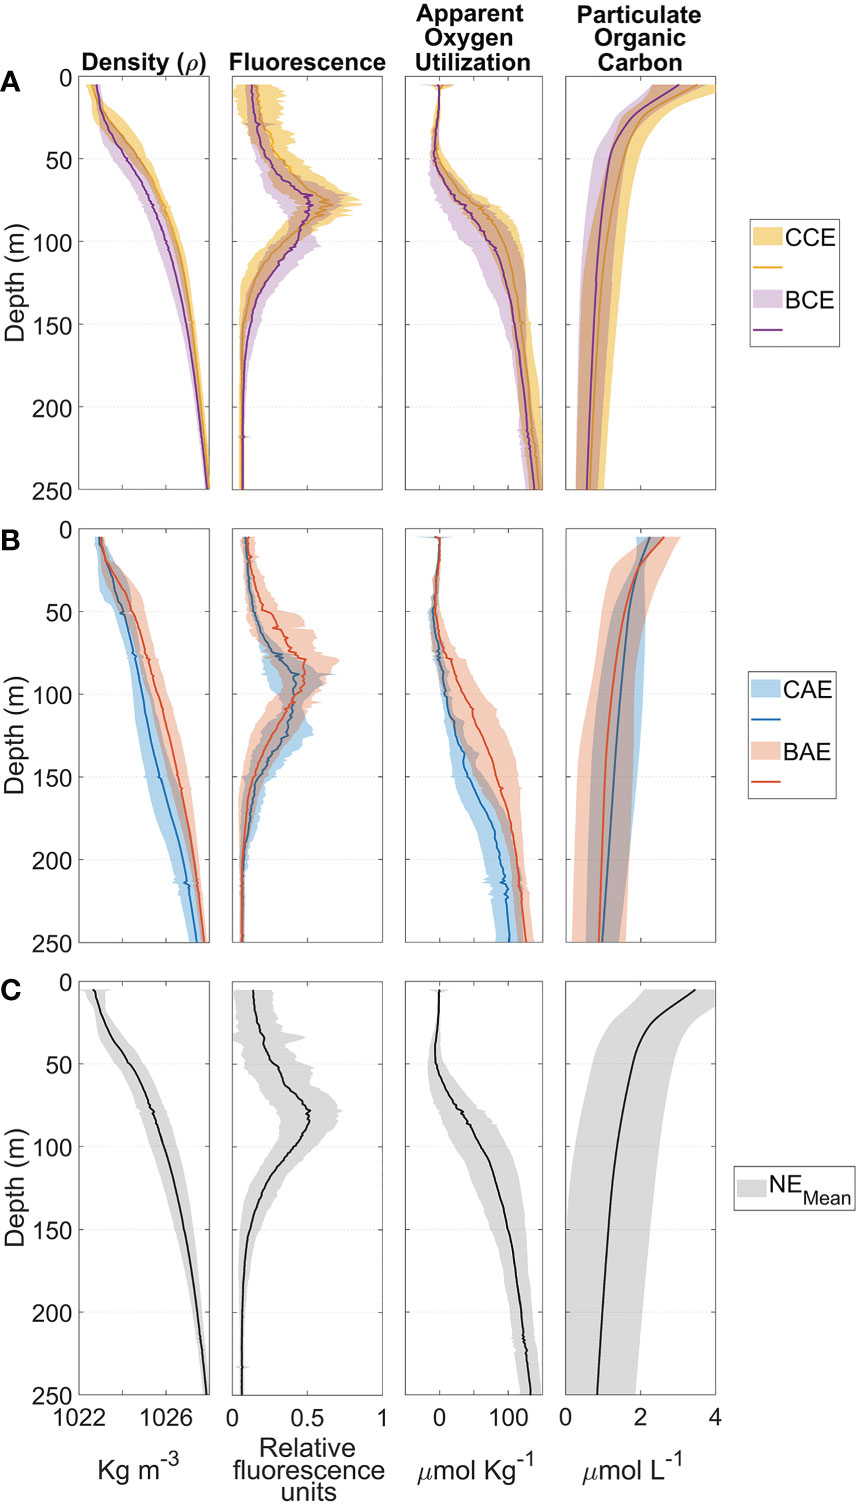
Figure 7 Mean and standard deviation profiles of density, fluorescence, apparent oxygen utilization and particulate organic carbon for stations that fell near the center of a cyclonic eddy (CCE - yellow, A, top panel), near the border of a cyclonic eddy (BCE - purple, A, top panel), near the center of an anticyclonic eddy (CAE - blue, B, middle panel), near the border of an anticyclonic eddy (BAE - B, orange, middle panel) and the stations free of eddy influence (NE - black, C, bottom panel) during the 2015, 2016 and 2017 GoM cruises.
The CCE (yellow) density profile presented the shallowest MLD, with a shallow pycnocline at ~20 m (Figure 7A - top panel). The MFD was located close to 75 m, with increasing AOU’s values below ~50 m. POC showed mean concentration of ~3.6 µmol L-1 near the surface, decreasing to 0.7 µmol L-1 at 250 m depth. Profiles from BCE stations (purple) showed well-stratified waters, with a relatively deeper mixed layer depth ~35 m, and deeper MFD than stations near the center of cyclonic eddies (~75 m depth with a secondary peak at about 100m). The AOU profiles were similar at CCE and BCE stations, showing negative or close to 0 values from the surface to ~60 m. Below this depth, consumption and recycling of organic carbon was more important than production by primary productivity, as indicated by increasingly positive AOU values.
Mean POC concentrations were higher at stations near the center of cyclonic eddies (CCE) than near their borders (BCE). CCE stations showed the shallowest of the density profiles, which is consistent with the shallowest pycnocline near the core of cyclonic eddies. Regarding the fluorescence profiles (CCE and BCE), showed a similar maximum fluorescence depth (~75m), however, consistently higher fluorescence values were observed at all depths at stations near the CCE than in the BCE, suggesting higher chlorophyll concentrations throughout the water column. As for AOU, profiles from the CCE showed changes in the slope to positive values at shallower depths than stations in BCE (Figure 7A - top panel).
The stations located near the core of anticyclones (CAE, blue) showed a weak pycnocline and a MFD between 80 m to 125 m. The AOU profiles showed changes towards positive values at ~100 m. In contrast, for BAE stations (orange), the pycnocline was located at ~25 m, while the MFD was found at ~80 m; the AOU profile showed a balance between consumption and production values for the first 50 m. The average POC average on the surface was ~2.8 µmol L-1(Figure 7B - middle panel).
Near-surface POC concentrations at CAE stations were slightly lower (between ~1.9 and ~2.3 µmol L-1) than stations near BAE (between ~2.1 and ~3 µmol L-1) up to ~40 m depth (among ~0.8 and ~2.1 µmol L-1); below that depth POC values were very similar (with values ranging between ~0.1 and ~1.7 µmol L-1). Comparison of CAE and BAE density profiles indicated a higher density at a given depth below ~30 m, indicative of a deepening of the isopycnals at the core of the anticyclonic eddies. CAE had lower fluorescence values down to 100 m, and a deeper fluorescence maximum than BAE stations. The AOU profiles for CAE show the change in slope to positive values almost 25 m deeper than BAE (Figure 7B - middle panel).
The mean profiles of density, fluorescence, AOU and POC for NE stations are in Figure 7C. The pycnocline is observed in the first upper ~25 m implying a relatively shallow mixed layer, and a relatively deep fluorescence maximum at ~80 m. The AOU profile indicates a close balance between production and consumption for the first 50 m, below which respiration begins to dominate as AOU increases. The POC concentrations show an overall average value of ~3.7 µmol L-1, although showing a high variability (Figure 7C - bottom panel).
A Kruskal-Wallis test was applied to the median integrated POC100 (Supplementary Table 4) between the four different structures (CCE, BCE, CAE, and BAE), and there was no difference (p=0.131). Another Kruskal-Wallis test was applied for the medians of surface POC (5m) between the four different structures (CCE, BCE, CAE, and BAE) and results show that the means in the surface POC were different (p=0.023).
There were weak negative and non-significant Pearson correlation coefficients between integrated POC concentrations and SSHns (r= -0.10 to -0.22), even when SSH was estimated over a broader area around each station (daily SSH and daily SSH (0.25°) as well as monthly SSH and monthly SSH (0.25°)) in Supplementary Tables 5, 6.
The correlation between integrated POC and the MLD, MFD and Chl-a are shown in Table 4 (Supplementary Table 7). Only for the 2015 cruise showed significant correlations between the POC100 and MLD, MFD and Chl-a. The statistically significant negative correlations most likely result from higher (lower) POC integrated values associated with shallower (deeper) mixed layer depths and a shoaling (deepening) of the maximum fluorescence depth.
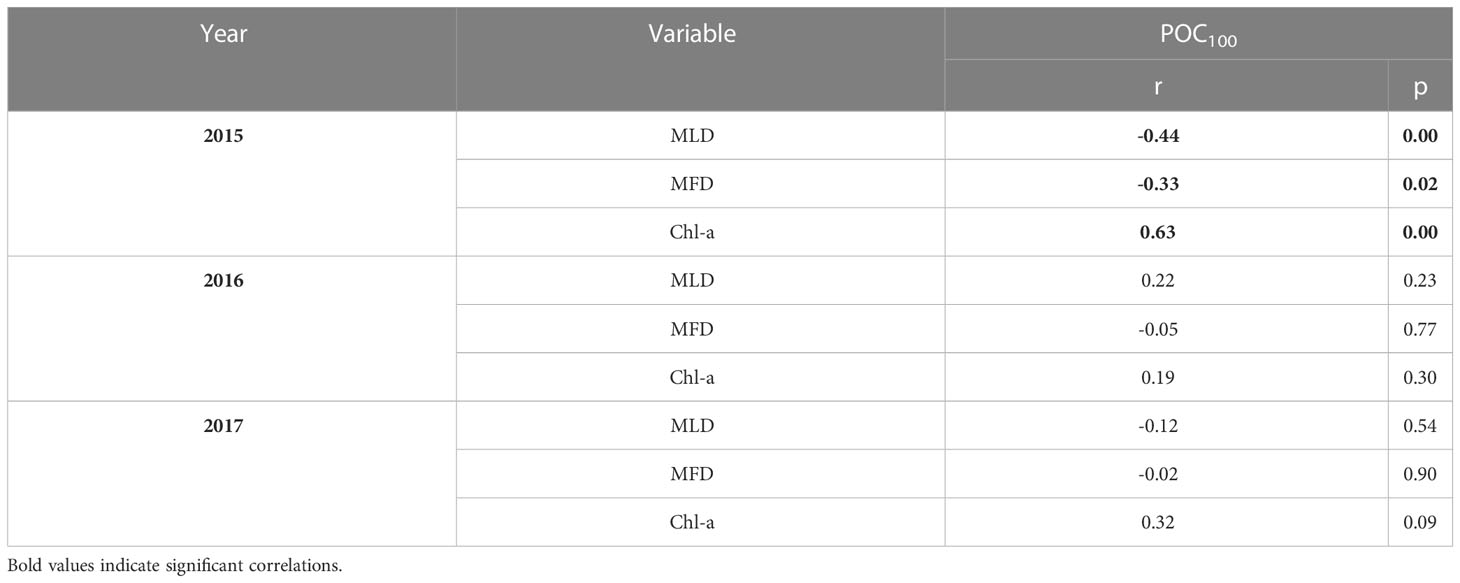
Table 4 Correlation analysis between POC100 vs. mixed layer depth, maximum fluorescence depth, and surface Chl-a concentrations.
The correlations between SSHns and MLD, MFD and Chl-a are shown in Table 5. Satellite-derived SSHns and MLD show statistically significant positive correlations during 2015 and 2017. There were also significant positive correlations between SSHns and. MFD for 2015 and 2016; when SSHns was negative (positive), the maximum fluorescence depth was found at a shallower (deeper) depth. Negative SSHns values are associated with divergence in cyclonic structures, which leads to a shallower MLD and MFD, while positive SSHns values are associated to convergence and anticyclonic structures with the opposite pattern in the MLD and MFD.

Table 5 Correlations between non-steric sea surface heights, maximum fluorescence depth, mixed layer depth and surface Chl-a concentrations.
Surface Chl-a vs. MFD and MLD consistently showed negative and statistically significant correlations for the three cruises. The negative correlation coefficients imply a deeper (shallower) maximum fluorescence depth associated with lower (higher) concentrations of a Chl-a (Table 5).
The PCA indicated that components 1 and 2 explained 52.1% of the variability (Component 1 = 33.2% and Component 2 = 18.9%; Figure 8). The eigenvector results are presented in Supplementary Table 8.
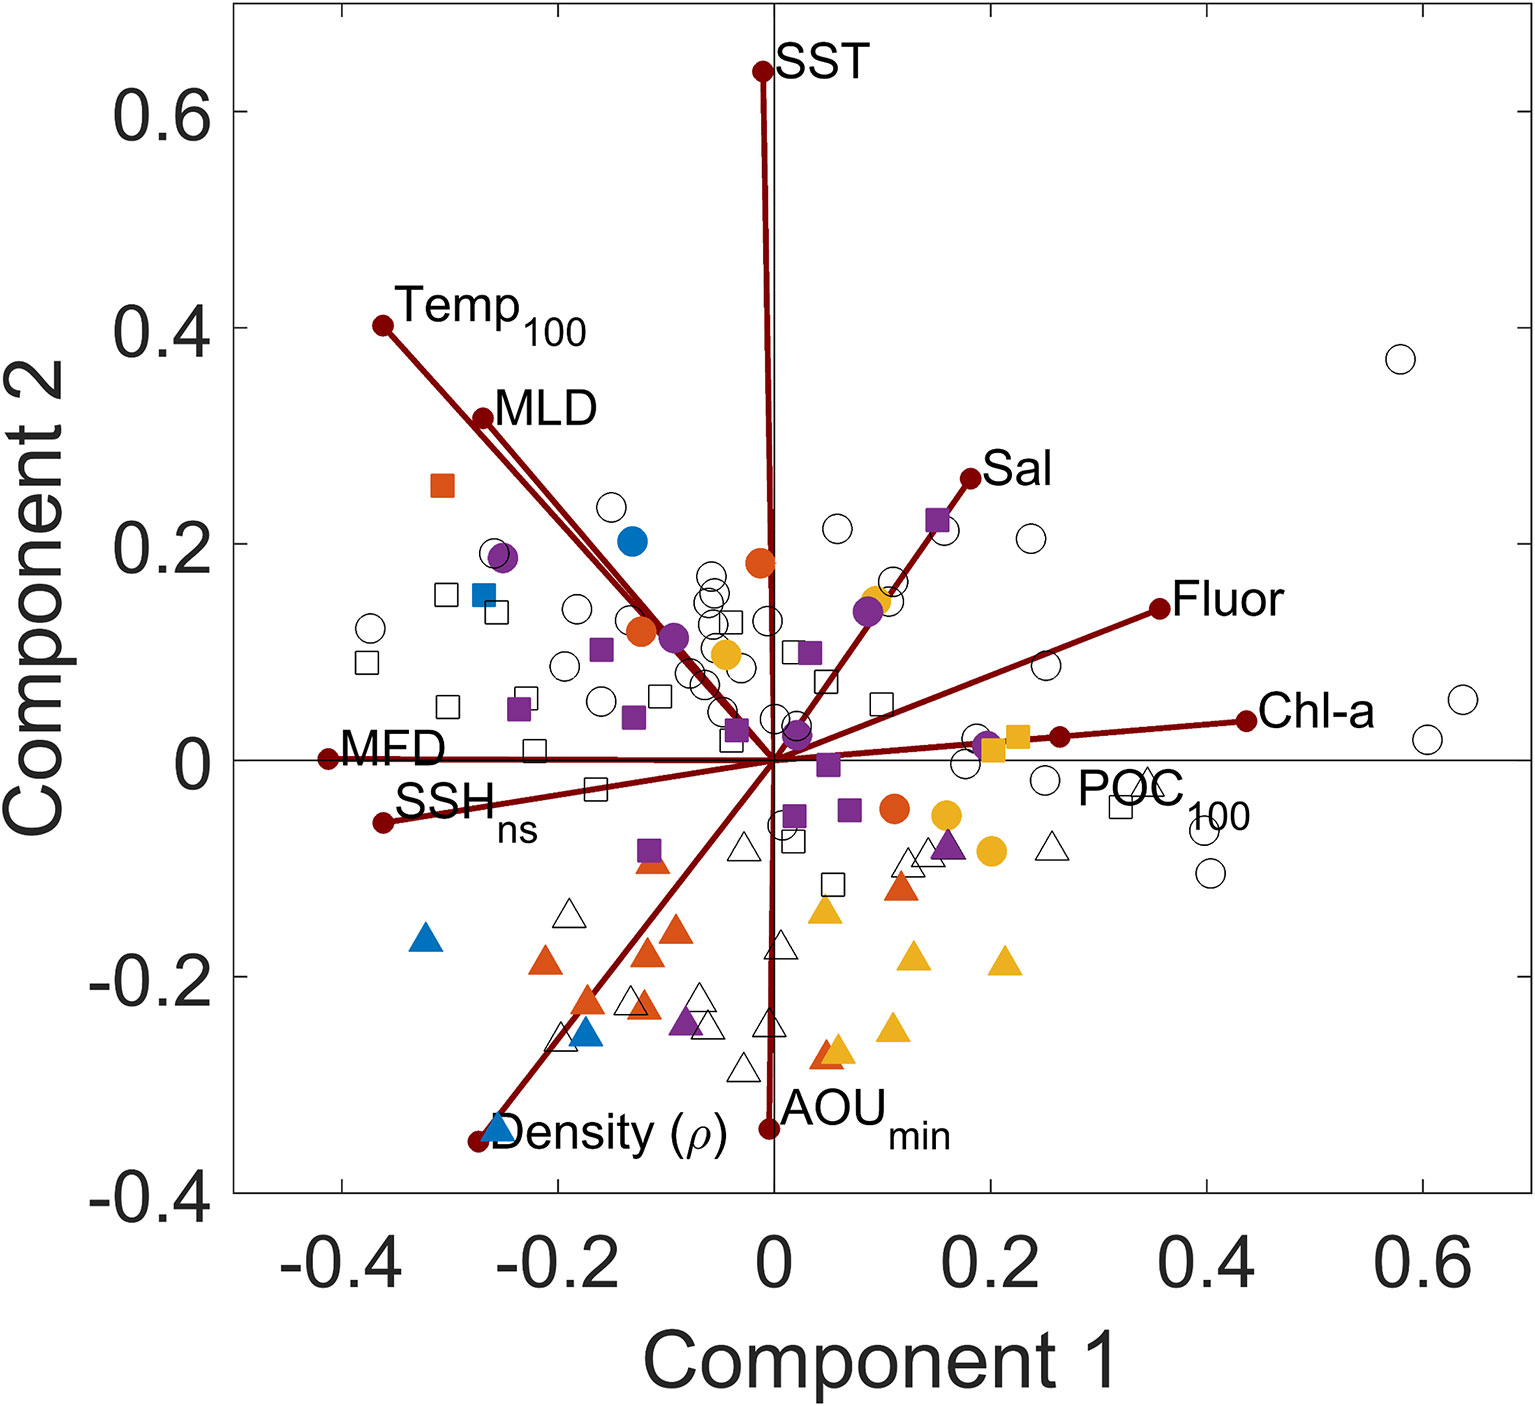
Figure 8 Principal component analysis of oceanographic variables and integrated POC100 estimates. The color indicates the classification of the mesoscale structures; stations near the center of cyclonic eddies are in yellow, near the border of cyclonic eddies in purple, near the center of anticyclonic eddies in blue, and near the border of anticyclonic eddies in orange. Colorless symbols indicate stations outside of eddies. The stations sampled in 2015 are indicated in circles, 2016 in triangles and 2017 in squares.
The PCA results grouped stations based on their locations at the centers and edges of mesoscale structures, showing the largest separation between stations at the CCE and CAE, and an overlap between BCE and BAE. The CCE stations (yellow) were positively correlated with Chl-a, Fluorescence, salinity and POC100, and negatively correlated with the average temperature at 100m, MLD, MFD, SSHns and to a lesser extent the density. CAE stations (blue) were negatively correlated with Sal, Fluor, Chl-a and POC100, and positively correlated with average temperature at 100m, MLD, MFD, SSHns and density.
Chl-a, fluorescence, integrated POC100 and salinity cluster in the positive region of component 1 while MFD, average temperature at 100m, SSHns density and MLD are grouped in the negative region. Most of the stations sampled during 2015 (circles) were correlated with sea surface temperature, MLD, salinity, and fluorescence. In contrast, during 2016 (triangles) the stations were correlated with the average temperature at 100m, density and the depth where the AOU changes towards positive values. The stations sampled in 2017 (squares) fell all over the multivariate space.
The mechanisms that control POC concentrations in the ocean differ depending on the region and the season (Dobashi et al., 2022). Sources of organic carbon in the GoM can include terrestrial and marine sources (Bianchi et al., 1997). The contribution of terrestrial organic carbon from terrestrial sources, including estuaries, is particularly important in coastal and shelf waters and constitutes an important component of global organic carbon (Hedges, 1992). Specifically, river inputs play a significant role in the distribution of POC (Meybeck, 1982). The Mississippi-Atchafalaya River and the Grijalva-Usumacinta River Systems are the largest sources of freshwater inflow to the northern and southern GoM, respectively (Kemp et al., 2016). The Mississippi- Atchafalaya River System has been shown to influence the distribution of POC and plays an important role in the organic carbon transport to the shelf and northern oceanic region (Trefry et al., 1994; Rosenheim et al., 2013), while in the southern Gulf the Usumacinta-Grijalva River System is the main source of POC (Cuevas-Lara et al., 2021). In addition, POC fluxes are further influenced by mineral ballast, such as calcium carbonate, the concentrations of which are closely related to POC concentrations (Klaas and Archer, 2002).
The concentration profiles in the GoM’s deep-water region showed values that range between 2 and 7µM in the upper layer during the summer season. These concentrations are comparable with the values (4.48 ± 5.22 µM) previously reported for samples obtained under oligotrophic conditions in South and North Pacific Gyres in 2004 and 2012 (Stramski et al., 2022; Table 6). Also, POC concentrations in the Equatorial Pacific Ocean collected between 30°N-15°S and 180-160°W in 2012 range between 0.75 and 8.8 µM; the smallest values were from oligotrophic regions, and the highest for the high-nutrient Equatorial Pacific region (Graff et al., 2015).
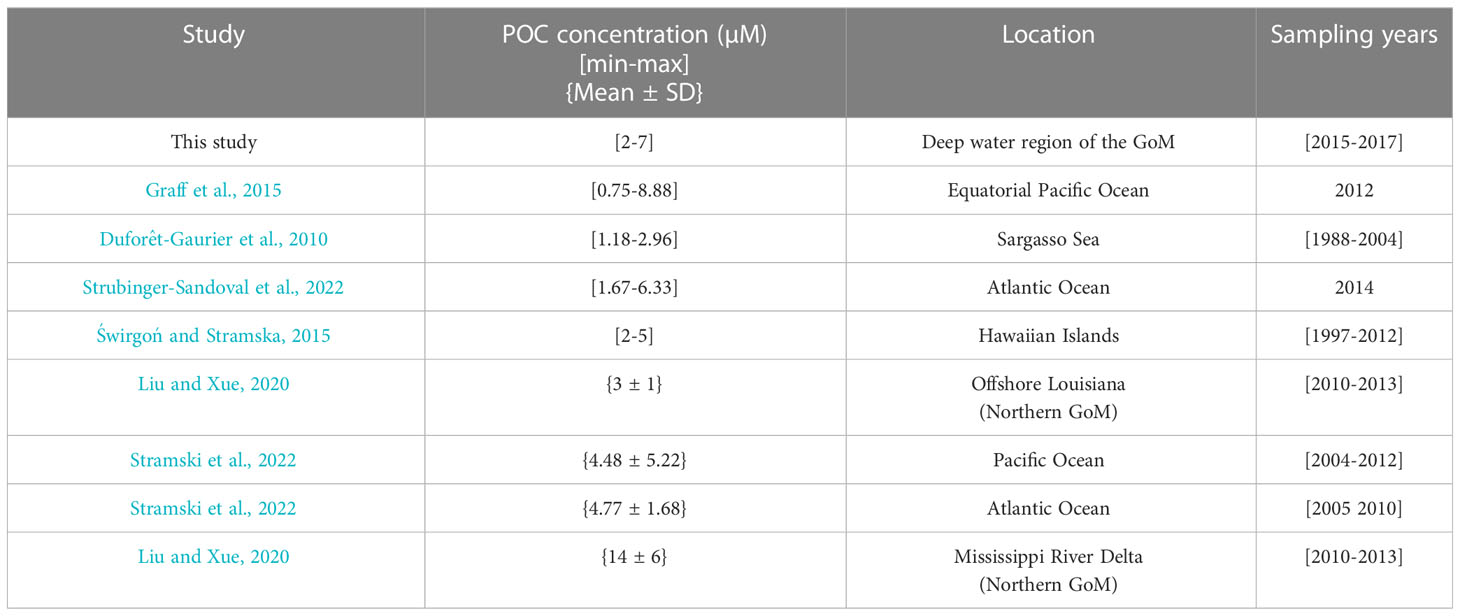
Table 6 Particulate organic carbon concentrations from different study areas.
Stramski et al. (2022) sampled different oceanographic conditions ranging from oligotrophic environments like the South Atlantic Gyre to higher productivity regions of the Atlantic Ocean. They report concentrations of 4.77 ± 1.68 µM along north-to-south transects covered in 2005 and 2010. In another study, POC concentrations ranging between 1.67 and 6.33 µM were reported from samples collected in the North Atlantic Drift, North Atlantic Subtropical Gyre, North Atlantic Tropical Gyre, Western Tropical Atlantic, the South Atlantic Gyre, and the South Subtropical Convergence during 2014 (Strubinger-Sandoval et al., 2022).
Reports from comparable oligotrophic regions like the Sargasso Sea showed POC concentrations between 1.18 and 2.96 µM from 1988 to 2004 (Duforêt-Gaurier et al., 2010; Table 6), while the Hawaii Ocean time-series showed a range between 2 and 5 µM (Świrgoń and Stramska, 2015). In the southern deep-water region of the GoM, we found POC concentrations that are comparable with those reported for the northern open waters of GoM by Liu and Xue (2020), who measured concentrations of 3 ± 1 µM in May between 2010 and 2013 along the coast of Louisiana in the north GoM. However, they also reported much higher concentrations in the surface waters influenced by the plumes near the Mississippi River Delta (values around 14 ± 6 µM). These high concentrations were attributed to the discharge of the Mississippi and Atchafalaya Rivers.
Hence, POC concentrations in the southern deep-water region of the GoM fall within the range observed in oligotrophic regions like the Sargasso Sea, and the subtropical gyres in the Atlantic and Pacific oceans during the summer season. An analysis of the global distribution of integrated POC100 from 1995 to 2012 showed a range of values from ~20 to ~900 mmol m-2 (Balch et al., 2018). The comparison of global estimates with our results is consistent with the oligotrophic nature of the southern deep-water region of GoM during the summer season.
POC concentrations in the water column showed the consistent well-known exponential decay with depth, with relatively high variability in the euphotic layer and decreasing concentrations below 700 m (<1 µM). To understand the mechanisms that could control this upper layer variability in the southern region of GoM, POC concentrations were integrated over different depths (100 m, MLD, MFD) and correlated with different variables. Integrated POC within the mixed layer depth and the fluorescence maximum depth did not show significant correlations with any of the oceanographic variables for any of the 3 years (Supplementary Table 7).
However, when integrating over the euphotic layer (with depths of ~100m; Linacre et al., 2019; Kelly et al., 2021; Stukel et al., 2021; Stukel et al., 2022) our results showed a negative correlation with the MFD and the MLD and a positive one with the surface Chl-a concentration for the 2015 cruise. The POC100 showed similar average integrated concentrations of ~276 mmol m-2 for 2015 and 2016, although the variability was much higher in 2015 than in 2016. In contrast, during the 2017 cruise, POC100 was lower, with a mean value of 207 mmol m-2. Differences in POC100 between years were significant due to the high variability between stations. These data suggest that MFD and MLD may occasionally play a role in modulating POC concentrations in the upper water column although it is not a consistent control over time and that there may be other mechanisms contributing to this intermittent relationship.
It is important to mention that although the three cruises took place during the summer season (Table 1), the level of mesoscale activity differed (Figure 3). During 2015 and 2016 mesoscale activity was higher in the central GoM than in 2017. The observed significant correlations between POC100 and the MLD, MFD and surface Chl-a concentrations for the 2015 cruise may be related to the two large anticyclones that were present in the central deep-water region; these were the remnants of Nautilus eddy and the recently released Olympus eddy (Figure 3). Thus, the higher variability in integrated POC concentrations found for 2015 (Table 3), may be attributed to an intensification of mixing processes associated with the edges of the anticyclonic eddies and consequently with the vertical transport of nutrients fueling the POC production in the euphotic layer. According to the results from the algorithm of AVISO, the average number of anticyclones during the cruise in 2015 was 6.7, in 2016 it was 5.4 and in 2017 was 4.7. Hence, the number of mesoscale structures may be another contributing control to the variability of integrated POC100, especially during the summer season characteristic for strongly stratified upper ocean conditions.
Large and highly energetic mesoscale eddies exert a strong influence on the biogeochemical variables of the upper water column (Gaube et al., 2019). Eddies are associated with vertical mixing, which affects nutrient transport and the Chl-a concentration in the euphotic layer (McGillicuddy, 2016), and our results in Figure 7 show that the POC upper layer concentrations may be modulated by their location within cyclonic and anticyclonic eddies. However, although we observed significant differences in the medians considering the first 5 m of the water column, we did not find significant differences in the integrated POC100 medians.
Higher POC concentrations, associated with the shoaling of density profiles and the deep fluorescence maximum are consistently observed at stations near the CCE than at stations near the BCE. These features are consistent with a shallowing (deepening) of the pycnocline near the core (border) of cyclonic eddies. Cyclonic eddies show an anti-clockwise flow of currents with negative SSHns at its center and counterclockwise geostrophic velocities, a shallower thermocline and a conspicuous shoaling of isopycnals bringing colder, nutrient-rich subsurface waters closer to the euphotic zone at its center (Biggs et al., 1988; Seki et al., 2001), all of them enhancing phytoplankton productivity, higher chlorophyll and POC concentrations in the euphotic layer (Bidigare et al., 2003; McGillicuddy et al., 2003; Bakun, 2006).
The BCE shows consistently lower POC concentrations than stations in the CCE, with close to ~0.5 µmol L-1 difference in their mean values (Figure 7). The Chl-a concentrations at the center of a cyclonic eddy are consistently higher than at the borders, most likely as a result of the shoaling of the pycnocline allowing nutrients to reach the euphotic layer and thus fuel the phytoplankton productivity at depth (Gaube et al., 2014; McGillicuddy, 2016). Honda et al. (2018) have shown how cyclonic eddies may affect the POC flux in the oligotrophic region of the subtropical North Pacific Ocean through the shoaling of the pycnocline driven by the passage of cyclonic eddies over the observation area, resulting in increased Chl-a in the subsurface layer and enhanced POC flux to the deep-sea region. This flux is positively related to the concentration of POC in the water column (Roca- Martí et al., 2021).
In contrast, anticyclonic eddies with clockwise geostrophic velocities (arrows) are convergence zones favoring the piling up of relatively warmer and lower density water masses at their core (Supplementary Figure 4), producing positive SSHns as seen in Figure 3. Anticyclonic eddies are generally considered nutrient-depleted relative to cyclonic eddies (Biggs et al., 1988; Seki et al., 2001). However, the POC fluxes observed in anticyclones in the eastern tropical North Atlantic show the opposite behavior, with larger fluxes comparable to those observed in mesotrophic or eutrophic regions (Fiedler et al., 2016; Fischer et al., 2016). Here, stations at the CAE mostly showed lower POC average concentrations by ~0.4 µmol L-1 (Figure 7) than at those in the BAE. In addition, near the core of the anticyclones there was lower density gradient with depth, lower fluorescence and a deeper MFD. A characteristic transect through an anticyclonic eddy shows a deepening (shallowing) of the pycnocline and MFD near the core (border) of these mesoscale features.
Previous work reported differences in cyclonic and anticyclonic eddies within the GoM. Lee-Sánchez et al. (2022) analyzed vertical nutrient profiles for two cruises, one in the winter (February-March) of 2013 and the other in the beginning of summer (June) of 2016. Their results showed that mesoscale eddies play a strong modulating role in the vertical distribution of nitrate and nitrite, particularly in the first 250 m. In the cores of recently detached Loop Current eddies, the nitracline reached maximum depths, and there were lower nutrient concentrations in the euphotic layer. Data from ARGO measurements in the GoM showed that the depth and the magnitude of the DFM or deep chlorophyll maximum are also strongly controlled by the mesoscale variability, showing consistently lower chlorophyll concentration in anticyclones (Pasqueron de Fommervault et al., 2017 and Damien et al., 2021). Based on a biogeochemical model, primary productivity in the Loop Current Eddies is higher than the average rates in the surrounding open waters of the GoM. This anomalous behavior is explained by the mixed layer response during winter convective mixing, which reaches deeper into nutrient-rich waters due to the very low-density gradient with depth in the the anticyclonic eddy. Although we didn’t observe this process, since our data was always collected in the summer season, we coincide with their observation of the strong influence exerted by the mesoscale activity in the surface ocean chlorophyll concentration and more specifically within Loop Current Eddies (Damien et al., 2021).
All these observations show how mesoscale structures do exert some influence in the concentrations of POC in the upper layer. However, correlations of POC concentrations versus SSHns, which in principle is related to the mesoscale structures, didn’t show a significant relationship. To explore this apparent lack of correlation we calculated the Pearson correlation coefficient between satellite POC concentrations and SSHns in every coordinate of the data mesh of the GoM, considering the average of 8 days for the three summer months of 2015, 2016 and 2017. The relationship is presented in Figure 9, and a clear negative relationship between the POC concentrations in the surface ocean and SSHns was observed over a broad region in the central abyssal region, especially during 2015 and 2016. This is most likely related to the east-west trajectories of large, detached eddies from the LC. These negative correlations show lower POC concentrations associated with higher SSHns, implying the importance of these mesoscale structures in controlling POC concentrations in the euphotic layer of the deep-water region of the GoM.
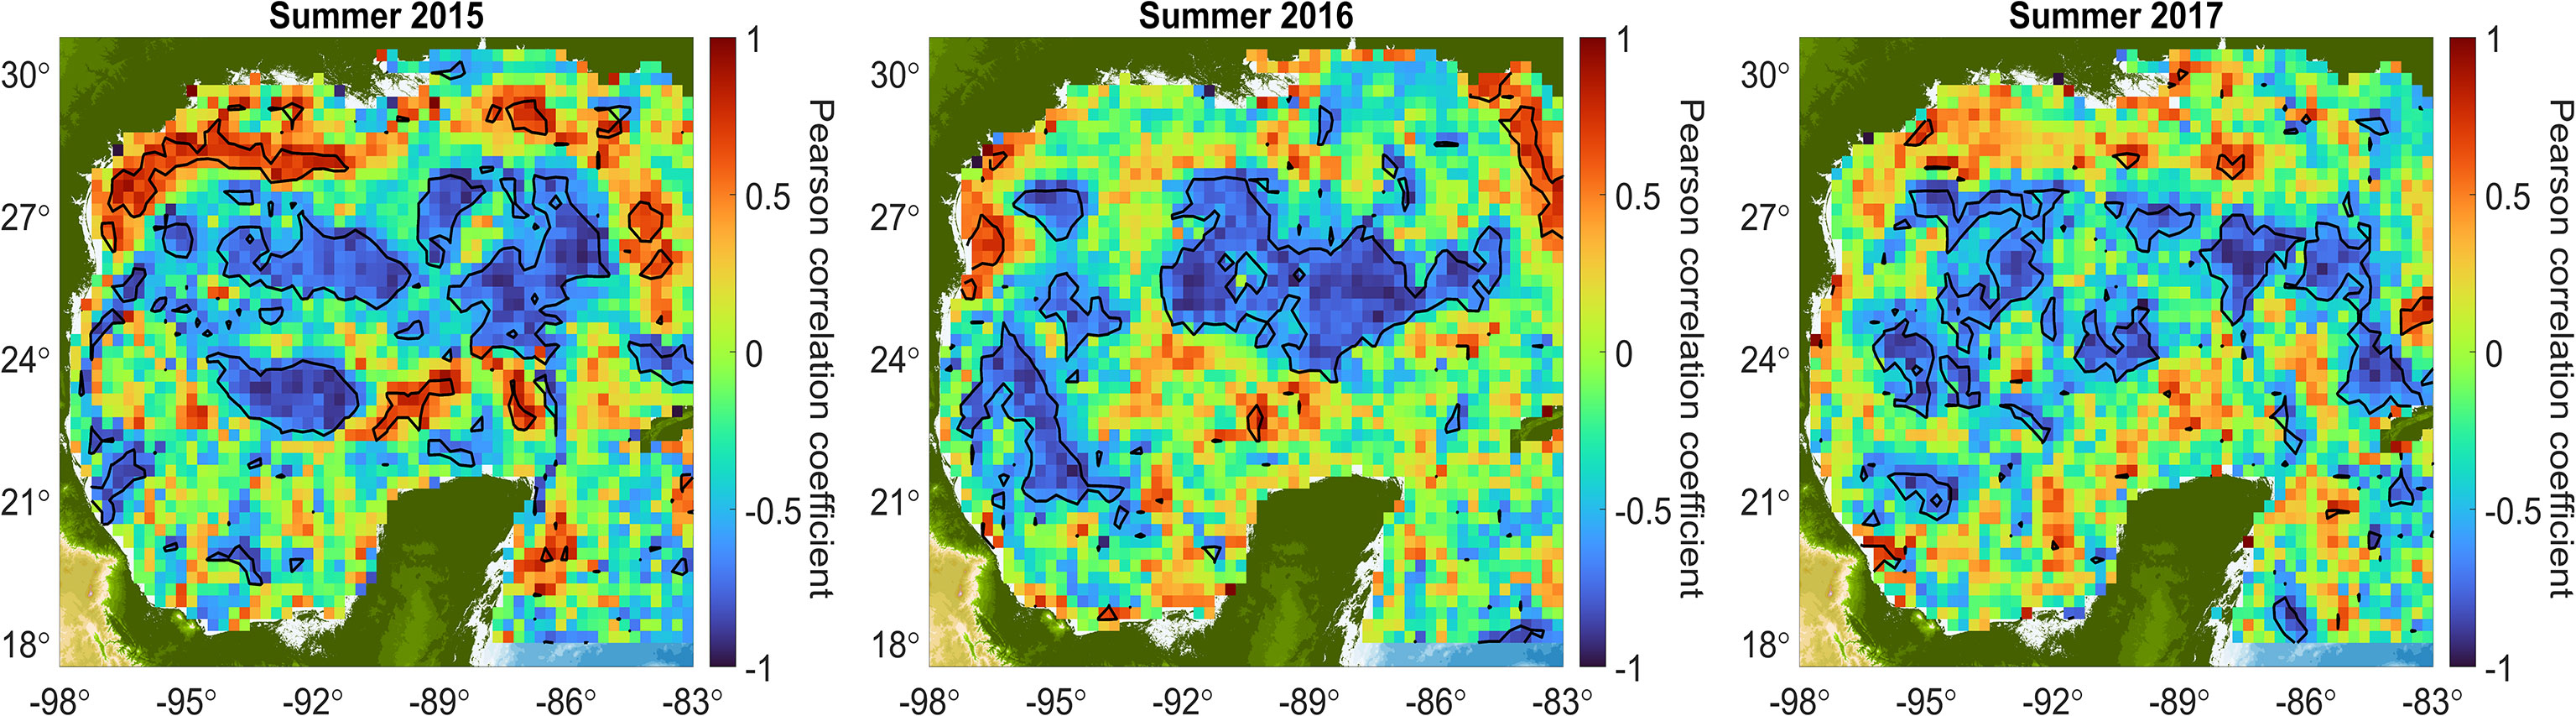
Figure 9 Spatial correlation maps for the summers of 2015, 2016, and 2017 between surface POC and SSHns, both derived from satellite data. Pearson’s correlation coefficients are shown in colors, with hot colors indicating positive correlation and cold colors negative correlation. The black contours represent a confidence level of 95%.
Although our observations show how the POC concentrations may be modulated by mesoscale dynamics in the southern deep-water region of the GoM, it is important to mention that other processes deserve further studies to explain the observed variability. For instance, primary production is associated with seasonal high freshwater inputs, including those from the Tamaulipas shelf in the west, the Mississippi-Atchafalaya River System in the north, and the outflows of the Grijalva-Usumacinta River System in the south (Figure 1). In addition, further studies should be focused on the possible effects of increasing the stability of the upper water column due to rising sea surface temperatures in the interior of the GoM, and how this warming affects mixing in mesoscale features, and consequently primary production and upper layer POC concentrations to better understand the biological carbon pump in the GoM.
The datasets presented in this study can be found in online repositories. The names of the repository/repositories and accession number(s) can be found below: https://zenodo.org/record/7302327.
YC: Formal analysis, methodology, visualization, data curation, investigation, conceptualization, writing – original draft preparation. SH: Project administration, funding acquisition, writing-review and editing, manuscript improvement. GV: Data analysis, manuscript improvement. JH: Conceptualization, supervision, investigation, methodology, data curation, resources, project administration, funding acquisition, writing-review and editing, manuscript improvement. All authors contributed to the article and approved the submitted version.
Research funded by the National Council of Science and Technology of Mexico - Mexican Ministry of Energy - Hydrocarbon Trust, project 201441. This is a contribution of the Gulf of Mexico Research Consortium (CIGoM). We acknowledge PEMEX’s specific request to the Hydrocarbon Fund to address the environmental effects of oil spills in the Gulf of Mexico. Y.V. Contreras-Pacheco was supported by a CONACyT PhD fellowship.
We thank Bertha Acosta, Aideé Egremy Valdez, María Reyna Barradas Arguelles, Doreny Bobadilla, Axel Rosas, Renata Goulart for their help in the collection and laboratory work. We thank the crew of the R/V Justo Sierra for their support. We also thank Helmut Maske Ruchab, María Asunción Lago Lestón, Patrick Rafter and Misael Díaz Asencio for providing valuable opinions, comments and suggestions that helped improve this work. The altimeter products were produced by Ssalto/Duacs and distributed by Aviso, with support from Cnes (http://www.aviso.altimetry.fr/duacs/). This study has been conducted using E.U. Copernicus Marine Service Information.
The authors declare that the research was conducted in the absence of any commercial or financial relationships that could be construed as a potential conflict of interest.
All claims expressed in this article are solely those of the authors and do not necessarily represent those of their affiliated organizations, or those of the publisher, the editors and the reviewers. Any product that may be evaluated in this article, or claim that may be made by its manufacturer, is not guaranteed or endorsed by the publisher.
The Supplementary Material for this article can be found online at: https://www.frontiersin.org/articles/10.3389/fmars.2023.1095212/full#supplementary-material
AOU, apparent oxygen utilization; BAE, border of an anticyclonic eddy; BCE, border of a cyclonic eddy; CAE, center of an anticyclonic eddy; CCE, center of a cyclonic eddy; Chl-a, chlorophyll-a; DOC, dissolved organic carbon; GoM, Gulf of Mexico; LC, loop current; MFD, maximum fluorescence depth; MLD, mixed layer depth; NE, stations classified as no eddy; PCA, principal component analysis; POC, particulate organic carbon; POC100, integrated POC concentration at 100 m depth; SSH, sea surface height; SSHns, non-steric sea surface height.
Armstrong R. A., Lee C., Hedges J. I., Honjo S., Wakeham S. G. (2002). A new, mechanistic model for organic carbon fluxes in the ocean based on the quantitative association of POC with ballast minerals. Deep-Sea Res. Pt. II 49, 219–236. doi: 10.1016/s0967-0645(01)00101-1
Aviso+ Altimetry (2022). Mesoscale eddy trajectory atlas product. handbook (Ramonville St Agne, France: Aviso+). doi: 10.24400/527896/a01-2022.005.220209
Bakun A. (2006). Fronts and eddies as key structures in the habitat of marine fish larvae: opportunity, adaptive response and competitive advantage. Sci. Mar. 70, 105–122. doi: 10.3989/scimar.2006.70s2105
Balch W. M., Bowler B. C., Drapeau D. T., Lubelczyk L. C., Lyczkowski. E. (2018). Vertical distributions of coccolithophores, PIC, POC, biogenic silica, and chlorophyll a throughout the global ocean. Glob. Biogeochem. Cycles 32, 2–17. doi: 10.1002/2016GB005614
Bianchi T. S., Lambert C. D., Santschi P. H., Guo L. (1997). Sources and transport of land-derived particulate and dissolved organic matter in the gulf of Mexico (Texas shelf/slope): The use of ligninphenols and loliolides as biomarkers. Org. Geochem. 27, 65–78. doi: 10.1016/s0146-6380(97)00040-5
Bidigare R. R., Benitez-Nelson C., Leonard C. L., Quay P. D., Parson M. L., Foley D. G., et al. (2003). Influence of a cyclonic eddy on microheterotroph biomass and carbon export in the lee of Hawaii. Geophys. Res. Lett. 30 (6). doi: 10.1029/2002GL016393
Biggs D. C. (1992). Nutrients, plankton, and productivity in a warm-core ring in the western gulf of Mexico. J. @ Geophys. Res. 97, 2143–2154. doi: 10.1029/90jc02020
Biggs D. C., Berkowitz S. P., Altabet M. A., Bidigare R. R., DeMaster D. J., Dunbar R. B., et al. (1988). A cooperative study of upper-ocean particulate fluxes in the weddell Sea. Proc. Ocean Drilling Program. Initial Rep. 113, 77–86. doi: 10.2973/odp.proc.ir.113.105.1988
Cervantes-Díaz G. Y., Hernández-Ayón J. M., Zirino A., Herzka S. Z., Camacho-Ibar V., Norzagaray O., et al. (2022). Understanding upper water mass dynamics in the gulf of Mexico by linking physical and biogeochemical features. J. Mar. Syst. 225, 103647. doi: 10.1016/j.jmarsys.2021.103647
Cuevas-Lara D., Alcocer J., Cortés-Guzmán D., Soria-Reinoso I. F., García-Oliva F., Sánchez-Carrillo S., et al. (2021). Particulate organic carbon in the tropical usumacinta river southeast Mexico: Concentration, flux and sources. Water 13, 1–21. doi: 10.3390/w13111561
Daly K. L., Passow U., Chanton J., Hollander D. (2016). Assessing the impacts of oil-associated marine snow formation and sedimentation during and after the deepwater horizon oil spill. Anthropocene 13, 18–33. doi: 10.1016/j.ancene.2016.01.006
Damien P., Pasqueron de Fommervault O., Sheinbaum J., Jouanno J., Camacho-Ibar V. F., Duteil O. (2018). Partitioning of the open waters of the gulf of Mexico based on the seasonal and interannual variability of chlorophyll concentration. J. Geophys. Res. Oceans 123, 2592–2614. doi: 10.1002/2017JC013456
Damien P., Sheinbaum J., Pasqueron de Fommervault O., Jouanno J., Linacre L., Duteil O. (2021). Do loop current eddies stimulate productivity in the gulf of Mexico? Biogeosciences 18, 4281–4303. doi: 10.5194/bg-18-4281-2021
Dawson H. R. S., Strutton P. G., Gaube P. (2018). The unusual surface chlorophyll signatures of southern ocean eddies. J. Geophys. Res. 123, 6053–6069. doi: 10.1029/2017jc013628
De La Rocha C. L., Passow U. (2007). Factors influencing the sinking of POC and the efficiency of the biological carbon pump. Deep-Sea Res. Pt. II 54, 639–658. doi: 10.1016/j.dsr2.2007.01.004
Delgado J. A., Sudre J., Tanahara S., Montes I., Hernández-Ayón J. M., Zirino A. (2019). Effect of Caribbean water incursion into the gulf of Mexico derived from absolute dynamic topography, satellite data, and remotely - sensed chlorophyll-a. Ocean Sci. 15, 1561–1578. doi: 10.5194/os-2019-58
Denman K. L., Brasseur G., Chidthaisong A., Ciais P., Cox P. M., Dickinson R. E., et al. (2007). “Coupling between changes in the climate system and biogeochemistry,” in Climate change 2007: The physical science basis. Eds. Solomon S., Qin D., Manning M., Chen Z., Marquis M., Averyt K. B., Tignor M., Miller H. L. (United Kingdom and New York, NY, USA: Cambridge University Press), 501–568.
Dobashi R., Ueno H., Matsudera N., Fujita I., Fujiki T., Honda M. C., et al. (2022). Impact of mesoscale eddies on particulate organic carbon flux in the western subarctic north pacific. J. Oceanogr. 78, 1–14. doi: 10.1007/s10872-021-00620-7
Domínguez-Guadarrama A., Pérez-Brunius P. (2017). CIGoM altimetry derived products from AVISO Ssalto/DUACS (Ensenada, Baja California, México: CIGoM), L4, V1.0, GridSeries, [dataset] CICESE.
Duforêt-Gaurier L., L. H., Dessailly D., Nordkvist K., Alvain S. (2010). Estimates of particulate organic carbon over the euphotic depth from in situ measurements. application to satellite data over the global ocean. Deep-Sea Res. Pt. I, 351–367. doi: 10.1016/j.dsr.2009.12.007
Dunbar R. B., Berger W. H. (1981). Fecal pellet flux to modern bottom sediment of Santa Barbara basin (California) based on sediment trapping. Geol. Soc Am. Bull. 92, 212–218. doi: 10.1130/0016-7606(1981)92%3C212:FPFTMB%3E2.0.CO;2
Eppley R. W., Peterson B. (1979). Particulate organic matter flux and planktonic new production in the deep ocean. Nature 282, 677–680. doi: 10.1038/282677a0
Faghmous J. H., Frenger I., Yao Y., Warmka R., Lindell A., Kumar V. (2015). A daily global mesoscale ocean eddy dataset from satellite altimetry. Sci. Data 2, 1–16. doi: 10.1038/sdata.2015.28
Falkowski P. G. (1998). Biogeochemical controls and feedbacks on ocean primary production (200-206: Science). doi: 10.1126/science.281.5374.200
Falkowski P. G., Greene R. M., Geider R. J. (1992). Physiological limitations on phytoplankton productivity in the ocean. Oceanography 5, 84–91. doi: 10.5670/oceanog.1992.14
Fiedler B., Grundle D. ,. S., Schütte F., Karstensen J., Löscher C. R., Hauss H., et al. (2016). Oxygen utilization and downward carbon flux in an oxygen-depleted eddy in the eastern tropical north Atlantic. Biogeosciences 13, 5633–5647. doi: 10.5194/bg-13-5633-2016
Fischer G., Karstensen J., Romero O., Baumann K.-H., Donner B., Hefter J., et al. (2016). Bathypelagic particle flux signatures from a suboxic eddy in the oligotrophic tropical north Atlantic: production, sedimentation and preservation. Biogeosciences 13, 3203–3223. doi: 10.5194/bg-13-3203-2016
Frenger I., Münnich M., Gruber N. (2018). Imprint of southern ocean mesoscale eddies on chlorophyll. Biogeosciences 15, 4781–4798. doi: 10.5194/bg-15-4781-2018
Fritsch F., Carlson R. (1980). Monotone piecewise cubic interpolation. SIAM J. Numerical Anal. 17, 238–246. doi: 10.1137/0717021
Gardner W. D., Gundersen J. S., Richardson M. J., Walsh I. D. (1999). The role of seasonal and diel changes in mixed-layer depth on carbon and chlorophyll distributions in the Arabian Sea. Deep-Sea Res. Pt. II: Top. Stud. Oceanogr. 46, 1833–1858. doi: 10.1016/S0967-0645(99)00046-6
Gaube P., McGillicuddy D. J. Jr., Chelton D. B., Behrenfeld M. J., Strutton P. G. (2014). Regional variations in the influence of mesoscale eddies on near-surface chlorophyll. J. Geophys. Res. Oceans 119, 8195–8220. doi: 10.1002/2014jc010111
Gaube P., McGillicuddy D. J. Jr, Moulin A. J. (2019). Mesoscale eddies modulated mixed layer depth globally. Geophys. Res. Lett. 46, 1505–1512. doi: 10.1029/2018GL080006
Goñi M. A., Ruttenberg K. C., Eglinton T. I. (1997). Sources and contribution of terrigenous organic carbon to surface sediments in the gulf of Mexico. Nature 389, 275–278. doi: 10.1038/38477
Graff J. R., Westberry T. K., Milligan A. J., Brown M. B., Dall’Olmo G., van Dongen-Vogels V., et al. (2015). Analytical phytoplankton carbon measurements spanning diverse ecosystems. Deep-Sea Res. Pt. I Oceanogr. Res. Pap. 102, 16–25. doi: 10.1016/j.dsr.2015.04.006
Gruber N., Lachkar Z., Frenzel H., Marchesiello P., Münnich M., McWilliams J. C., et al. (2011). Eddy-induced reduction of biological production eastern boundary upwelling systems. Nat. Geosci. 4, 787–792. doi: 10.1038/NGEO1273
Guidi L., Stemmann L., Jackson G. A., Ibanez F., Claustre H., Legendre L., et al. (2009). Effects of phytoplankton community on production, size and export of large aggregates: A world-ocean analysis. Limnol. Oceanogr. 54, 1951–1963. doi: 10.4319/lo.2009.54.6.1951
Hedges J. I. (1992). Global biogeochemical cycles: progress and problems. Mar. Chem. 39, 67–93. doi: 10.1016/0304-4203(92)90096-s
Hedges J. I., Eglinton G., Hatcher P. G., Kirchman D. L., Arnosti C., Derenne S., et al. (2000). The molecularly-uncharacterized component of nonliving organic matter in natural environments. Org. Geochem. 31, 945–958. doi: 10.1016/s0146-6380(00)00096-6
Honda M. C., Sasai Y., Siswanto E., Kuwano-Yoshida A., Aiki H., Cronin M. F. (2018). Impact of cyclonic eddies and typhoons on biogeochemistry in the oligotrophic ocean based on biogeochemical/physical/meteorological time-series at station KEO. Prog. Earth Planet. Sci. 5, 1–16. doi: 10.1186/s40645-018-0196-3
Iversen M. H., Ploug H. (2010). Ballast minerals and the sinking carbon flux in the ocean: carbon-specific respiration rates and sinking velocity of marine snow aggregates. Biogeosciences 7, 2613–2624. doi: 10.5194/bg-7-2613-2010
Jouanno J., Ochoa J., Pallàs-Sanz E., Sheinbaum J., Andrade-Canto F., Candela J., et al. (2016). Loop current frontal eddies: Formation along the campeche bank and impact of coastally trapped waves. J. Phys. Oceanogr. 46, 3339–3363. doi: 10.1175/JPO-D-16-0052.1
Kelly T. B., Knapp A. N., Landry M. R., Selph K. E., Shropshire T. A., Thomas R. K., et al. (2021). Lateral advection supports nitrogen export in the oligotrophic open-ocean gulf of Mexico. Nat. Commun. 12, 1–7. doi: 10.1038/s41467-021-23678-9
Kemp G., Day J., Yáñez-Arancibia A., Peyronnin N. (2016). Can continental shelf river plumes in the northern and southern gulf of Mexico promote ecological resilience in a time of climate change? Water 8, 1–18. doi: 10.3390/w8030083
Kharbush J. J., Close H. G., Van Mooy B. A., Arnosti C., Smittenberg R. H., Le Moigne F. A., et al. (2020). Particulate organic carbon deconstructed: molecular and chemical composition of particulate organic carbon in the ocean. Front. Mar. Sci. 7. doi: 10.3389/fmars.2020.00518
Klaas C., Archer D. E. (2002). Association of sinking organic matter with various types of mineral ballast in the deep sea: Implications for the rain ratio. Glob. Biogeochem. Cycles 16, 63-1–63-14. doi: 10.1029/2001gb001765
Knap A., Michaels A., Close A., Ducklow H., Dickson A. (1996). Protocols for the joint global ocean flux study (JGOFS) core measurements. UNESCO, 123–125.
Knauer G. A., Martin J. H., Bruland K. W. (1979). Fluxes of particulate carbon, nitrogen, and phosphorus in the upper water column of the northeast pacific. Deep-Sea Res. Part A. Oceanogr. Res. Pap. 26, 97–108. doi: 10.1016/0198-0149(79)90089-X
Leben R. (2005). Altimeter-derived loop current metrics. Geophys. Monogr. Ser. 161, 181–201. doi: 10.1029/161gm15
Lee-Sánchez E., Camacho-Ibar V. F., Velásquez-Aristizábal J. A., Valencia-Gasti J. A., Samperio-Ramos G. (2022). Impacts of mesoscale eddies on the nitrate distribution in the deep-water region of the gulf of Mexico. J. Mar. Syst. 229, 103721. doi: 10.1016/j.jmarsys.2022.103721
Linacre L., Durazo R., Camacho-Ibar V. F., Selph K. E., Lara-Lara J. R., Mirabal-Gómez U., et al. (2019). Picoplankton carbon biomass assessments and distribution of prochlorococcus ecotypes linked to loop current eddies during summer in the southern gulf of Mexico. J. Geophys. Res. Oceans 124, 8342–8359. doi: 10.1029/2019JC015103
Linacre L., Lara-Lara R., Camacho-Ibar V. F., Herguera J. C., Bazán-Guzmán C., Ferreira-Bartrina V. (2015). Distribution pattern of picoplankton carbon biomass linked to mesoscale dynamics in the southern gulf of Mexico during winter conditions. Deep-Sea Res. I 106, 55–67. doi: 10.1016/j.dsr.2015.09.009
Liu Z., Xue J. (2020). The lability and sources of particulate organic matter in the northern gulf of Mexico hypoxic zone. J. Geophys. Res. Biogeosci. 125, 1–16. doi: 10.1029/2020JG005653
Lutz M., Dunbar R., Caldeira K. (2002). Regional variability in the vertical flux of particulate organic carbon in the ocean interior. Glob. Biogeochem. Cycles 16, 1–11. doi: 10.1029/2000GB001383
Martínez-López B., Zavala-Hidalgo J. (2009). Seasonal and interannual variability of cross-shelf transports of chlorophyll in the gulf of Mexico. J. Mar. Syst. 77, 1–20. doi: 10.1016/j.jmarsys.2008.10.002
Mason E., Pascual A., McWilliams J. C. (2014). A new sea surface height–based code for oceanic mesoscale eddy tracking. J. Atmos. Ocean. Technol. 31, 1181–1188. doi: 10.1175/JTECH-D-14-00019.1
McDougall T. J., Barker P. M. (2011). Getting started with TEOS-10 and the Gibbs seawater (GSW) oceanographic toolbox, SCOR/IAPSO WG127, 28, ISBN: ISBN 9780646556215.
McGillicuddy D. J. Jr. (2016). Mechanisms of physical-Biological-Biogeochemical interaction at the oceanic mesoscale. Ann. Rev. Mar. Sci. 8, 125–159. doi: 10.1146/annurev-marine-010814-015606
McGillicuddy D. J. Jr, Anderson L. A., Doney S. C., Maltrud M. E. (2003). Eddy-driven sources and sinks of nutrients in the upper ocean: Results from a 0.1 resolution model of the north Atlantic. Glob. Biogeochem. Cycles 17, 1035 doi: 10.1029/2002GL016393
Meybeck M. (1982). Carbon, nitrogen, and phosphorus transport by world rivers. Am. J. Sci. 4, 401–450. doi: 10.2475/ajs.282.4.401
Müller-Karger F. E., Smith J. P., Werner S., Chen R., Roffer M., Liu Y., et al. (2015). Natural variability of surface oceanographic conditions in the offshore gulf of Mexico. Prog. Oceanogr. 134, 54–76. doi: 10.1016/j.pocean.2014.12.007
Müller-Karger F. E., Walsh J. J., Evans R. H., Meyers M. B. (1991). On the seasonal phytoplankton concentration and sea surface temperature cycles of the gulf of Mexico as determined by satellites. J. Geophys. Res. Oceans 96, 12645–12665. doi: 10.1029/91jc00787
NASA Goddard Space Flight Center (2018). Ocean biology processing group, greenbelt, MD, USA, G. S. Maintained by NASA Ocean Biology Distributed Active Archive Center (OB.DAAC). doi: 10.5067/ORBVIEW-2/SEAWIFS/L2/OC/2018
Oey L. Y., Ezer T., Lee H. C. (2005). Loop current, rings and related circulation in the gulf of Mexico: A review of numerical models and future challenges. Circ. Gulf Mexico: Observations Models 161, 31–56. doi: 10.1029/161GM04
Pasqueron de Fommervault O., Perez-Brunius P., Damien P., Camacho-Ibar V. F., Sheinbaum J. (2017). Temporal variability of chlorophyll distribution in the gulf of Mexico optical data from profiling floats. Biogeosciences 4, 5647–5662. doi: 10.5194/bg-14-5647-2017
Pegliasco C., Busché C., Faugère Y. (2022). Mesoscale eddy trajectory atlas META3.2 delayed-time all satellites: version META3.2 DT allsat. doi: 10.24400/527896/A01-2022.005.210802
Pérez-Brunius P., García-Carrillo P., Dubranna J., Sheinbaum J., Candela J. (2012). Direct observations of the upper layer circulation in the southern gulf of Mexico. Deep-Sea Res. Pt. II Top. Stud. Oceanogr. 85, 182–194. doi: 10.1016/j.dsr2.2012.07.020
Riley G. A. (1963). Organic aggregates om seawater and the dynamics of their formation and utilization. Limnol. Oceanogr. 8, 372–381. doi: 10.4319/lo.1963.8.4.0372
Roca-Martí M., Puigcorbé V., Castrillejo M., Casacuberta N., Garcia-Orellana J., Cochran J. K., et al. (2021). Quantifying 210Po/210Pb disequilibrium in seawater: A comparison of two precipitation methods with differing results. Front. Mar. Sci. 8. doi: 10.3389/fmars.2021.684484
Rosenheim B. E., Roe K. M., Roberts B. J., Kolker A. S., Allison M. A., Johannesson K. H. (2013). River discharge influences on particulate organic carbon age structure in the Mississippi/Atchafalaya river system. Glob. Biogeochem. Cycles 27, 154–166. doi: 10.1002/gbc.20018
Sarmiento J. L., Gruber N. (2006). Ocean biogeochemical dynamics (41 William Street, Princeton, New Jersey: United Kingdom: Princeton University Press).
Schmitz W. J. Jr, Biggs D. C., Lugo-Fernandez A., Oey L. Y., Sturges W. (2005). A synopsis of the circulation in the gulf of Mexico and on its continental margins. Washington DC Am. Geophysical Union Geophysical Monograph Ser. 161, 11–29. doi: 10.1029/161gm03
Seki M. P., Polovina J. J., Brainard R. E., Bidigare R. R., Leonard C. L., Foley D. G. (2001). Biological enhancement at cyclonic eddies tracked with GEOS thermal imagery in Hawaiian waters. Geophys. Res. Lett. 28, 1583–1586. doi: 10.1029/2000GL012439
Stramska M. (2009). Particulate organic carbon in the global ocean derived from SeaWiFS ocean color. Deep-Sea Res. Pt. I: Oceanogr. Res. Pap. 56, 1459–1470. doi: 10.1016/j.dsr.2009.04.009
Stramski D., Joshi I., Reynolds R. A. (2022). Ocean color algorithms to estimate the concentration of particulate organic carbon in surface waters of the global ocean in support of a long-term data record from multiple satellite missions. Remote Sens. Environ. 269, 1–21. doi: 10.1016/j.rse.2021.112776
Stramski D., Reynolds R. A., Babin M., Kaczmarek S., Lewis M. R., Röttgers R., et al. (2008). Relationships between the surface concentration of particulate organic carbon and optical properties in the eastern south pacific and eastern Atlantic oceans. Biogeosciences 5, 171–201. doi: 10.5194/bg-5-171-2008
Strubinger-Sandoval P., Dall'Olmo G., Haines K., Rasse R., Ross J. (2022). Uncertainties of particulate organic carbon concentrations in the mesopelagic zone of the Atlantic ocean. Open Res. Europe 1, 1–43. doi: 10.12688/openreseurope.13395.3
Stukel M. R., Gerard T., Kelly T. B., Knapp A. N., Laiz-Carrión R., Lamkin J. T., et al. (2022). Plankton food webs in the oligotrophic gulf of Mexico spawning grounds of Atlantic bluefin tuna. J. Plankton Res. 44, 763–781. doi: 10.1093/plankt/fbab023
Stukel M. R., Kelly T. B., Landry M. R., Selph K. E., Swalethorp R. (2021). Sinking carbon, nitrogen, and pigment flux within and beneath the euphotic zone in the oligotrophic, open-ocean gulf of Mexico. J. Plankton Res. 44, 711–727. doi: 10.1093/plankt/fbab001
Sturges W., Leben R. (2000). Frequency of ring separations from the loop current in the gulf of Mexico: A revised estimate. J. Phys. Oceanogr. 30, 1814–1819. doi: 10.1175/1520-0485(2000)030<1814:FORSFT>2.0.CO;2
Suess E. (1980). Particulate organic flux in the oceans-surface productivity and oxygen utilization. Nature 288, 260–263. doi: 10.1038/288260a0
Świrgoń M., Stramska M. (2015). Comparison of in situ and satellite ocean color determinations of particulate organic carbon concentration in the global ocean. Oceanologia 57, 25–31. doi: 10.1016/j.oceano.2014.09.002
Thomson R. E., Fine I. V. (2003). Estimating mixed layer depth from oceanic profile data. J. Atmos. Ocean. Technol. 20, 319–329. doi: 10.1175/1520-0426(2003)020<0319:EMLDFO>2.0.CO;2
Trefry J. H., Metz S., Nelsen T. A., Trocine R. P., Eadie B. J. (1994). Transport of particulate organic carbon by the Mississippi river and its fate in the gulf of Mexico. Estuaries 17, 839–849. doi: 10.2307/1352752
Velásquez-Aristizábal J. A., Camacho-Ibar V. F., Durazo R., Valencia-Gasti J. A., Lee-Sánchez E., Trasviña-Castro A. (2022). Nitracentric/Hydrographic classification and prediction of nitrate profiles for oceanographic stations under the influence of mesoscale eddies in the gulf of Mexico. Front. Mar. Sci. 709. doi: 10.3389/fmars.2022.827574
Vidal V. M., Vidal F. V., Pérez-Molero J. M. (1992). Collision of a loop current anticyclonic ring against the continental shelf slope of the western gulf of Mexico. J. Geophys. Res. Oceans 97, 2155–2172. doi: 10.1029/91jc00486
Vukovich F. M. (2007). Climatology of ocean features in the gulf of Mexico using satellite remote sensing data. J. Phys. Oceanogr. 37, 689–707. doi: 10.1175/JPO2989.1
Vukovich F. M. (2012). Changes in the loop current´s eddy shedding in the period 2001-2010. Inte. J. Oceanogr. 2012, 1–18. doi: 10.1155/2012/439042
Wang X. C., Chen R. F., Gardner G. B. (2004). Sources and transport of dissolved and particulate organic carbon in the Mississippi river estuary and adjacent coastal waters of the northern gulf of Mexico. Mar. Chem. 89, 241–256. doi: 10.1016/j.marchem.2004.02.014
Keywords: Gulf of Mexico, POC (particulate organic carbon), mesoscale structures, ocean eddies, upper layer
Citation: Contreras-Pacheco YV, Herzka SZ, Vallejo-Espinosa G and Herguera JC (2023) Particulate organic carbon in the deep-water region of the Gulf of Mexico. Front. Mar. Sci. 10:1095212. doi: 10.3389/fmars.2023.1095212
Received: 10 November 2022; Accepted: 10 February 2023;
Published: 27 February 2023.
Edited by:
Ram Kumar, Central University of Bihar, IndiaReviewed by:
Siddhartha Mitra, East Carolina University, United StatesCopyright © 2023 Contreras-Pacheco, Herzka, Vallejo-Espinosa and Herguera. This is an open-access article distributed under the terms of the Creative Commons Attribution License (CC BY). The use, distribution or reproduction in other forums is permitted, provided the original author(s) and the copyright owner(s) are credited and that the original publication in this journal is cited, in accordance with accepted academic practice. No use, distribution or reproduction is permitted which does not comply with these terms.
*Correspondence: Juan Carlos Herguera, aGVyZ3VlcmFAY2ljZXNlLm14
Disclaimer: All claims expressed in this article are solely those of the authors and do not necessarily represent those of their affiliated organizations, or those of the publisher, the editors and the reviewers. Any product that may be evaluated in this article or claim that may be made by its manufacturer is not guaranteed or endorsed by the publisher.
Research integrity at Frontiers
Learn more about the work of our research integrity team to safeguard the quality of each article we publish.