 David Curbelo-Hernández
 Melchor González-Dávila
 J. Magdalena Santana-Casiano
95% of researchers rate our articles as excellent or good
Learn more about the work of our research integrity team to safeguard the quality of each article we publish.
Find out more
ORIGINAL RESEARCH article
Front. Mar. Sci. , 16 February 2023
Sec. Marine Biogeochemistry
Volume 10 - 2023 | https://doi.org/10.3389/fmars.2023.1094250
This article is part of the Research Topic The Changing Carbonate Systems in Coastal, Estuarine, Shelf Areas and Marginal Seas View all 7 articles
The CO2 system, anthropogenic carbon (Cant) inventory and air-sea CO2 fluxes (FCO2) were analysed in the archipelagic waters of the Macaronesian region. The (sub)surface data were collected during POS533 (February and March, 2019) in coastal areas leeward of Cape Verde (CV), Canary Islands (CA) and Madeira (MA) and through the vessel track. The CO2 variability was controlled by changes in temperature, biological activity and advection processes forced by spatial heterogeneities in the Canary Upwelling System, the mixed layer depth, the mesoscale activity and the circulation patterns. The surface fCO2,sw variability was driven by biological production and CO2-rich water injection in tropical waters and by temperature fluctuations in subtropical waters. The factors controlling the upper ocean changes in the total inorganic carbon normalized to a constant salinity (NCT) were assessed. The uptake and storage of anthropogenic carbon, calculated by using the TrOCA 2007 approach described, as an upper limit, > 60% (>90% above the MLD) of the NCT increase from preformed values. The organic carbon pump accounted 36.6-40.9% for tropical waters and lose importance for subtropical waters (7.5-11.6%), while the carbonate pump has a minimal contribution (<4.2%). The upper-ocean Cant inventory in coastal areas of CV (8,570 Km2), CA (7.960 Km2) and MA (1,250 Km2) was 7.57 x 10³, 9.26 x 10³ and 8.86 x 10³ µmol kg-1, respectively (0.51, 0.58 and 0.09 Tg C, respectively). In terms of FCO2, the CV, CA and MA behaved as a winter CO2 sink (-4.74, -3.90 and -8.34 mmol m-2d-1, respectively) while a strong outgassing was detected over the Cape Blanc filament (20-25 mmol m-2d-1). The total average FCO2 for the ocean area of the three archipelagos (371,250 Km2) was -28.27 Gg CO2 d-1. The POS533 data were compared and compilated with SOCAT and GLODAP data and a new set of equations was provided to calculate the fCO2,sw, Cant and FCO2 in the Macaronesian region based on physical and biogeochemical properties.
Graphical Abstract
The Eastern Boundaries Upwelling Systems, transitional areas to subtropical gyres waters and coastal regions play an important role in the global CO2 cycle because they have high nutrient inputs that lead to high primary production and high recycling/export rates of carbon (e. g. Huntsman and Barber, 1977; Schulz, 1982; Jewell, 1994). These regions are characterized by highly variable seawater properties but have received limited study and are poorly represented in global models. Thus, the field monitoring and development of new local and regional scale studies are required in these zones.
The Macaronesian region (Figure 1) in the eastern boundary of the North Atlantic (sub)tropical circulation is a key zone in terms of upper ocean CO2 distribution, natural and anthropogenic carbon inventory and air-sea exchange. This area is influenced by the Canary Upwelling System following the equatorward Canary Current (e. g. Wooster et al., 1976; Mittelstaedt, 1991; Van Camp et al., 1991; Cropper et al., 2014) and the intense mesoscale activity mainly driven by upwelling filaments and both coastal and island generated eddies (e. g. Barton et al., 2004; García-Muñoz et al., 2004; Sangrà et al., 2009). The Cape Verde Frontal Zone (CVFZ) extended from Cape Blanc (21.5-22.5°N) and crossing the Cape Verde archipelago also represents an important source of latitudinal heterogeneity in the CO2 distribution by separating the low-nutrient content and oxygen-rich subtropical waters from the nutrient-rich and oxygen-depleted tropical waters (Pelegrí and Peña-Izquierdo, 2015a), which is referred to as a subsurface oxygen minimum zone (OMZ) (Stramma et al., 2008a; Stramma et al., 2016).

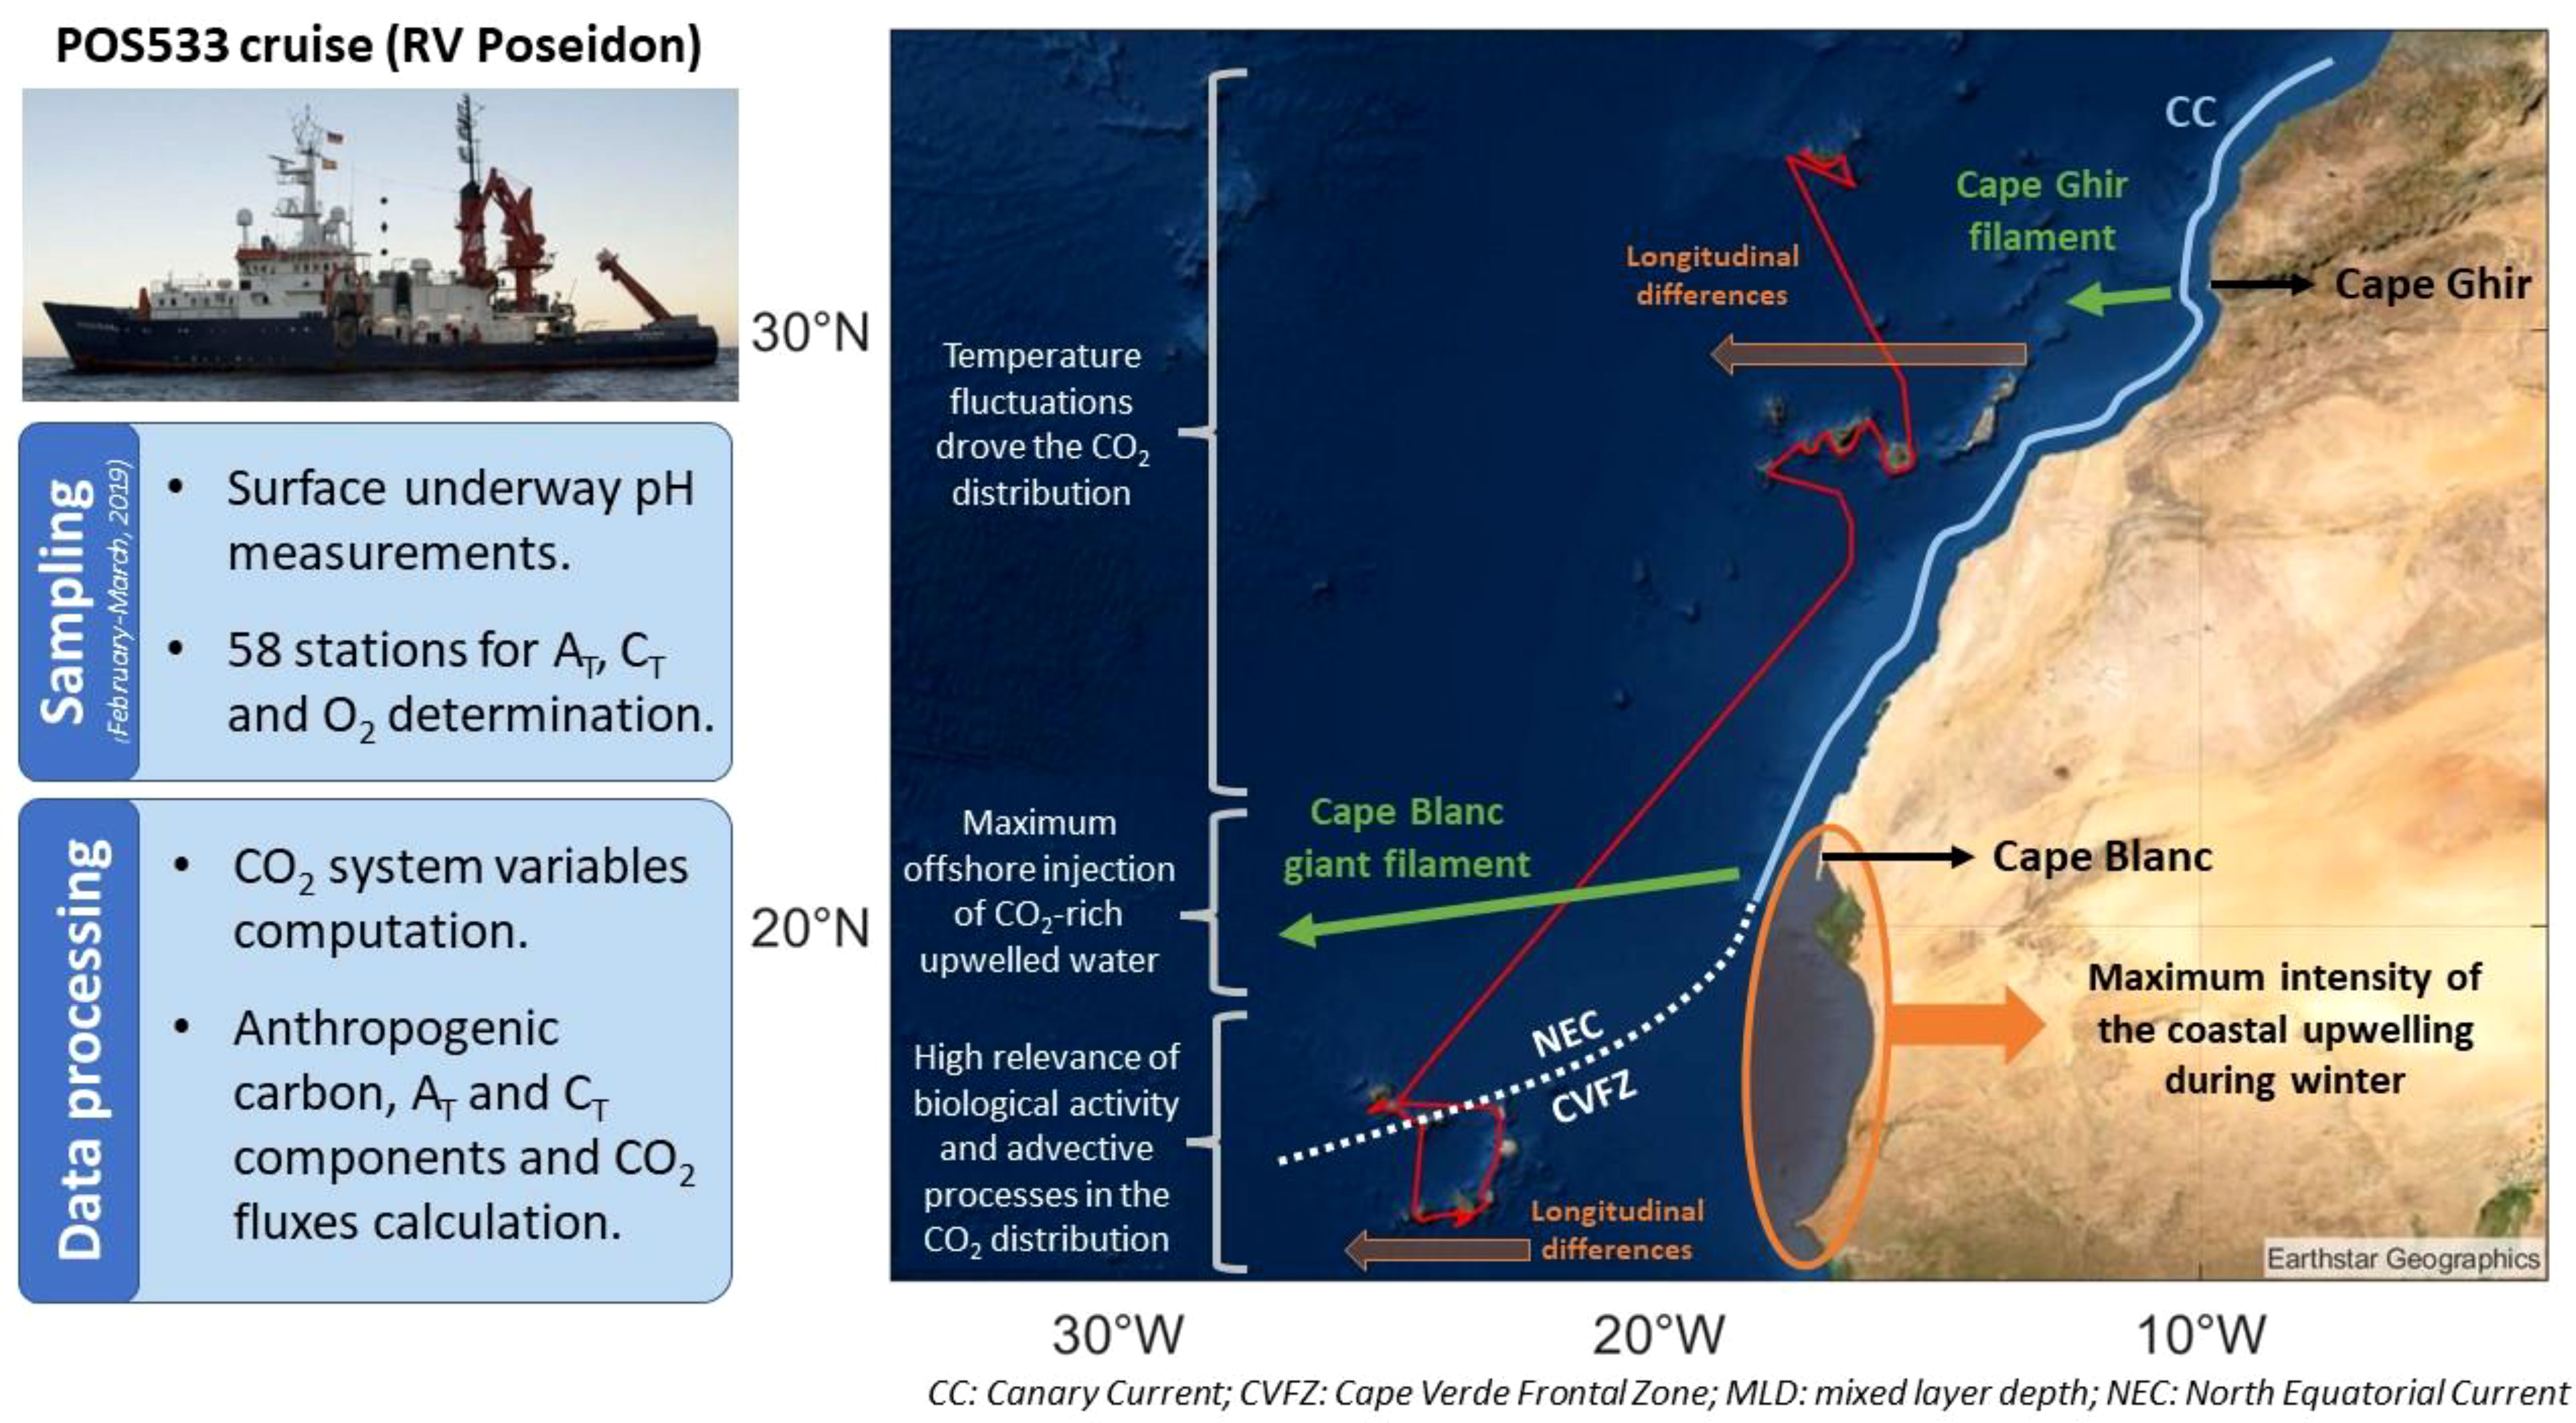
Figure 1 (A.1) SST map of the Macaronesian region in the Northeast Atlantic with the location of the Cape Verde (CV), Canary (CA) and Madeira (MA) archipelagos. (A.2) Vessel track and graphical description of the oceanographic characteristics of the Macaronesian region which have a relevant role in the distribution of the biogeochemical properties. The Canary Current (CC) path and its recirculation to the southwest at Cape Blanc latitude to become the North Equatorial Current (NEC) and form the Cape Verde Frontal Zone (CVFZ) is represented (widely explained in section 2). The location of the subregions of interest in Cape Verde (northern and southeastern zones; CV-N and CV-SE, respectively) and Canary Islands (western and eastern zones; CA-W and CA-E, respectilvey) are also shown. (B) Location of the stations along the vessel track in (1) Cape Verde, (2) Canary and (3) Madeira archipelagos.
The temporal variability of the CO2 system in the Eastern boundary of the North Atlantic subtropical gyre has been studied north of the Canary archipelago at the European Station of Oceanic Time Series (ESTOC) (González-Dávila et al., 2003, González-Dávila et al., 2010; Bates et al., 2014; Santana-Casiano et al., 2007), located in a windward and open-ocean area not affected by islands generated eddies and which normally does not receive upwelling filaments (Davenport et al., 1999; Davenport et al., 2002). The results obtained show the seasonality of fCO2 in the upper water-column, its interannual rate of increase linked with a decrease in pH and the net annual ocean CO2 sink behaviour explained by high ingassing rates during the cold months. In addition, the monitoring of physical and biogeochemical properties of the eastern tropical North Atlantic at the windward Cape Verde Ocean Observatory (CVOO) north of the Cape Verde archipelago has allowed the characterization of the oxygen-depleted eddies and its contribution to the formation of the shallow OMZ in the coastal transitional area (Fiedler et al., 2013; Karstensen et al., 2015; Fiedler et al., 2016; Schütte et al., 2016b; Pietri and Karstensen, 2018). The eddies also introduce spatio-temporal variability in the biological processes and carbon cycles (e. g. Benitez-Nelson, 2000; Fiedler et al., 2013; Romero et al., 2016).
Several studies based on data collected aboard volunteer observing ships and research vessels have evaluated the effect of coastal upwelling in the CO2 distribution and air-sea fluxes along the coastal transition region north of the Canary Islands (Pelegrí et al., 2005a; Padin et al., 2010; Curbelo-Hernández et al., 2021). This zone has been reported as an annual CO2 sink driven by lower sea surface temperatures (Pelegrí et al., 2005a; Curbelo-Hernández et al., 2021) and an enhanced biological CO2 uptake compared with the warmer and less biological productivity Mauritanian-Senegalese upwelling area (Lachkar and Gruber, 2013; Cropper et al., 2014) which acts as an annual CO2 source (González-Dávila et al., 2017). The evaluation of the island-generated eddies effect on the CO2 system south of the Canary Islands shows that these mesoscale features drive an enhancement of nutrient supply and increase the inorganic carbon in the upper layers (González-Dávila et al., 2006; Ucha et al., 2010). However, the CO2 distribution, anthropogenic carbon content and air-sea CO2 fluxes through the inter-islands, coastal and leeward regions of the Macaronesian archipelagos are poorly known.
The present study analyses the upper water-column CO2 system and air-sea fluxes in the Macaronesian region and quantifies the anthropogenic carbon inventory and its spatio-temporal changes based on data collected during the POS533 cruise. The vertical profiles have been performed mainly in the leeward coastal regions of the islands close to the 100 m isoline, and at the ESTOC and CVOO sites. The surface underway sampling through the vessel track allows the monitoring of CO2 properties over upwelling filaments and equatorward mesoscale eddies and through the inter-island routes. This study contributes to a better understanding of the CO2 cycle in coastal transitional regions of the (sub)tropical Northeast Atlantic.
The Macaronesian region (Figure 1) in the Northeast Atlantic is constituted by the Azores, Madeira, Canary and Cape Verde volcanic islands archipelagos, which are located at 100-750 km off the African coast in a coupling area between the Canary Upwelling System along the Northwest African coast and the oligotrophic open-ocean waters of the Northeast Atlantic subtropical gyre. The temperature-salinity relationship provided by Mehlmann et al. (2020) during POS533 identifies the water masses in the Cape Verde, Canary and Madeira archipelagos up to 4000 m depth as well as the mixed layer depths (MLDs), which were considered in this investigation. In the upper layers, a Surface Water mass (SW) up to ~250 m deep above the low saline South Atlantic Central Water (SACW) was found in Cape Verde, while surface waters around the Canary and Madeira archipelagos included the saltier Madeira Mode Water (MMW) above the Eastern North Atlantic Central Water (ENACW) and were influenced by Mediterranean Water (MW).
The circulation pattern in this region has been widely studied (e. g. Mittelstaedt, 1983; Pérez-Rodríguez et al., 2001; Stramma et al., 2005; Meunier et al., 2012). The Canary Upwelling System follows equatorward the Canary Current, transporting surface waters with low temperatures above the ENACW. It leaves the coast at the latitude of Cape Blanc (21.5-22.5°N) and flows southwestward to become the North Equatorial Current (NEC), while a poleward current transporting warmer surface waters above the SACW recirculates cyclonically into the open ocean between the Cape Verde Archipelago and Cape Blanc. Hence, cooler surface waters and the warmer, saltier and low-nutrient ENACW are separated from the warmer surface waters and the cooler, fresher and nutrient-rich SACW forming the CVFZ (e. g. Zenk et al., 1991; Pérez-Rodríguez et al., 2001; Meunier et al., 2012). The CVFZ crosses southwestward the Cape Verde archipelago and is characterized by a strong thermohaline and gradients of both nutrients and oxygen (Pelegrí et al., 2015). It is a permanent front strongly influenced by the seasonal meridional migration of the Intertropical Convergence Zone (ITCZ; Mayer and Weisberg, 1993; Stramma and Schott, 1999), which reaches its northeastmost position in summer and fall (Lázaro et al., 2005). The weak ocean ventilation and enhanced respiration in the Northeast tropical Atlantic deplete the oxygen content in both ENACW and SACW and result in an extended horizontal OMZ south of Cape Blanc, which is the strongest south and east of Cape Verde Islands in the depth range of 200-800 m (Karstensen et al., 2008; Stramma et al., 2008a; Stramma et al., 2016).
The heterogeneous interaction of the Canary Current with the complex morphology of the Northwest African coastline and continental slope results in substantial latitudinal variability in terms of intensity and seasonality of the upwelling, circulation, nutrients supplies, biological production and carbon distribution (e. g. Pelegrí et al., 2005a; Pelegrí et al., 2005b; Valdés and Déniz-González, 2015; Pelegrí and Peña-Izquierdo, 2015a; Pelegrí and Benazzouz, 2015b; Bonino et al., 2021). These spatial differences separate the permanent coastal upwelling between Cape Blanc and the Strait of Gibraltar from the seasonal upwelling south of Cape Blanc occurred only in winter and identifies the more intense upwelling throughout the year between Cape Ghir (30.7°N) and Beddouza (32.5°N) and south of Cape Yubi (27.9°N) (e. g. Wooster et al., 1976; Mittelstaedt, 1991; Van Camp et al., 1991; Cropper et al., 2014). The physical and biogeochemical seawater properties of the Macaronesian region are strongly linked with those of coastal upwelling due to the offshore transport hundreds of kilometres off the African coast, especially though the main upwelling filaments of Cape Ghir (Hagen et al., 1996; García-Muñoz et al., 2005; Pelegrí et al., 2005a; Pelegrí et al., 2005b; Laiz et al., 2012) and Cape Blanc (Bonino et al., 2021; Gabric et al., 1993; Pastor et al., 2008; Meunier et al., 2012; Ohde et al., 2015; Lovecchio et al., 2017). The surface horizontal advection by filaments is combined with the upwelling/downwelling of water in the core of cyclonic/anticyclonic eddies throughout The Canary Eddy Corridor and the small zonal corridors south of Madeira and near Cape Blanc (Barton et al., 2004; Sangrà et al., 2009; Cardoso et al., 2020). The coupling of these processes represents a source of spatio-temporal heterogeneity in the physical and biogeochemical properties in the tropical and subtropical Northeast Atlantic coastal transitional area.
The CO2 system was studied in the Macaronesian region based on data collected on board the RV Poseidon during the POS533 cruise (February 28 to March 19, 2019). Both surface underway measurements and depth seawater samples were taken during the cruise mainly downwind in the archipelagos of Cape Verde (CV), Canary (CA) and Madeira (MA) and through the latitudinal transects that connect them (Figure 1). A detailed cruise overview is given by Mehlmann et al. (2020) and Arnone et al. (2022).
The pH in total scale was underway monitored in surface waters along the vessel track by using a spectrophotometric pH sensor (SP101-SM) developed by the QUIMA group (IOCAG-ULPGC) and SensorLab (González-Dávila et al., 2014; González-Dávila et al., 2016) and based on the method described by Clayton and Byrne (1993). The SP101-SM pH sensor uses 4 wavelengths analysis for the m-cresol purple, includes auto-cleaning steps, performs a blank for pH calculation immediately after the dye injection and removes any dye effect in each pH reading (the accuracy concerning a TRIS seawater buffer was ±0.002 units). The spectrophotometric system was placed in the onboard lab and measured the pH of the seawater pumped from the main seawater intake of the vessel (at around 6 m depth) with a frequency of 5 minutes. The change in temperature between the seawater intake and the multiple seawater outlets in the onboard lab (0.3 ± 0.1°C) was considered to correct the total scale pH values to the in situ conditions (~0.015 ± 0.001 units °C-1). A SeaCat SBE21 thermosalinograph placed at the same location of the seawater immersed pump was used to monitor at the main intake the sea surface temperature (SST) and salinity (SSS) with an accuracy of 0.01 °C and 0.001, respectively. The surface underway fluorescence was monitored by a not-calibrated Wetlabs ECO fluorometer and is given as chlorophyll a (Chl-a) data in arbitrary units.
The characterization of the water column was carried out by selecting 58 sampling stations (Figure 1) ranging from the surface to around 250-300 meters deep. In the CV archipelago, 15 stations were selected leeward of the islands of Sao Antao, Sao Nicolau, Fogo, Santiago, Boa Vista and Sal. In the CA archipelago, 25 stations were selected around the islands of El Hierro, La Gomera, Tenerife and Gran Canaria, mainly on their lee side and followed eastward the coastlines. In the MA archipelago, 15 stations were selected leeward of Madeira at two sections and at the Ilhas Desertas. In addition, two windward stations were selected North of CV and CA at the CVOO and ESTOC sites, respectively.
Depth water sampling and in situ measurements were performed using a bottle rosette sampler containing twelve 10 L Niskin bottles with a CTD and additional sensors of pressure, temperature, salinity, dissolved oxygen and not-calibrated fluorescence data given as Chl-a (Mehlmann et al., 2020).
The Total Alkalinity (AT) and Total Inorganic Carbon (CT) in the water column were determined onboard from the depth water samples using a VINDTA 3C and following Mintrop et al. (2000). Samples were potentiometrically titrated with HCl to the carbonic acid endpoint for AT determination, while CT was coulometrically determined. Both AT and CT values were corrected using CRM bottles (batch #177, provided by A. Dickson at Scripps Institution of Oceanography), giving values with an accuracy of ±1.5 and ±1.0 µmol kg-1, respectively. They were normalized (NAT and NCT, where NX= X/S·36.4) to a constant salinity of 36.4, which is the average salinity of the upper layer (0-250 m depth) in the entire Macaronesian region.
The surface AT values was also calculated for the longitude and latitude of the surface underway data using the AT-SSS relationship obtained from the surface samples (Eq. 1, r2 = 0.94) (temperature was not found to improve the fitting). The average AT values calculated along the cruise tracks (2398.5 ± 20.0 µmol kg-1) agreed with those calculated according to the global relationship of AT with SSS and SST in surface waters of the Atlantic (sub)tropics (2401.6 ± 19.5 µmol kg-1) given by Lee et al. (2006).
The ocean values of CO2 fugacity (fCO2,sw) and pH were computed from the determined AT and CT. The surface values of fCO2,sw and CT throughout the cruise track were computed from the underway measured pH and determined AT. The Excel program CO2sys was used for computation, with the carbonic acid dissociation constants of Lueker et al. (2000), the HSO4- dissociation constant of Dickson (1990) and the value of [B]T determined by Lee et al. (2010). The relevance of thermal and non-thermal processes on the variability of the fCO2,sw and pH was evaluated in this study. The fCO2,sw and pH explained by non-thermal processes (mainly biological activity and horizontal/vertical advection) were studied by removing the temperature effect through a normalization of the fCO2,sw and pH to 21°C (fCO2,T21 and pHT21). The changes in fCO2,sw and pH due to thermal processes (ΔfCO2,thermal and ΔpHthermal) were assumed as the differences between the observed and normalized values (ΔfCO2,thermal = fCO2,sw - fCO2,T21 and ΔpHthermal = pH - pHT21).
Seawater samples for dissolved oxygen determination were collected in pre-calibrated glass wide-neck bottles (previously washed 3 times with the seawater sample) and avoiding bubbles formation. The temperature of the water was recorded during the sampling. The reagents 1 (MnCl +4H2O) and 2 (NaOH + NaI) were then added and thoroughly mixed with the seawater sample. The already mixed samples were kept in a dark box for 6 h to allow the precipitate to settle at the bottom of the bottles.
The WINKLER method introduced by Winkler (1888) and optimized by Carpenter (1965) and Carrit and Carpenter (1966) was used to determine the dissolved oxygen of the seawater samples. A Metrohm 888 Titrando operated with the software Tiamo and an amperometric electrode to determine the endpoint was used for the titration (Culberson and Huang, 1987). The reagent 3 (H2SO4) was added immediately before starting the titration to acidify the sample. Thiosulfate 0.01N was used as a titrant and a solution of KIO3 0.01N as a standard solution. All the reagents and solutions used during the cruise for DO determination were prepared following the procedures described by Dickson and Goyet (1994). Standardization of the thiosulphate was performed every two days. The possible impurities of the reagents were controlled by determining a blank every 2 days.
There are several indirect-based methods for the calculation of the excess of carbon due to anthropogenic input (Cant) explained in detail by Sabine and Tanhua (2010). The methods assumed that ocean circulation and the biological pump have operated in a steady state in terms of seasonal and interannual variability of the natural carbon cycle since preindustrial times (before 1750) and considered that Cant could be estimated by removing the contribution of the biological and physical pumps and the preindustrial CT from the determined CT.
In this study, the Cant was calculated by using the TrOCA back-calculation technique and the improved TrOCA 2007 approach (Touratier et al., 2007). The potential temperature (θ, °C) and the AT, CT and O2 concentrations (in µmol kg-1) were considered (Eq. 2). The changes in Cant due to differences in air-sea CO2 exchange rates and O2 content were reflected in the variation of this tracer. The TrOCA method provided overestimates Cant values by about a factor of 2, which were considered as upper limit values (Yool et al., 2010).
The general processes that control the vertical distribution of AT and CT were studied by applying the initial model proposed by Chen and Millero (1979) and previously used, in the Northeast Atlantic (González-Dávila et al., 2010) and the Pacific Subarctic (Andreev et al., 2009) (Eq. 3 and 4). This set of calculations provided the drivers of the observed AT and CT in the coastal waters of the three archipelagos. The model considers that the measured concentrations of AT and CT ( and ) result from the change in the preindustrial times values (referred as preformed values; and ) due to the organic matter production and remineralization involved in the organic carbon pump ( and ) and the formation and dissolution of carbonates processes involved in the carbonate pump ( and ). The anthropogenic carbon component ( Cant ) was also considered in the study of the vertical distribution of CT (Eq. 6). Both AT and CT values and their respective terms were normalized to the average upper water-column salinity of 36.4 (NAT and NCT).
The values were computed using the function given by Wanninkhof et al. (1999) and considered correct for the water masses in the North Atlantic by Pérez et al. (2002). This model was reported with an uncertainty of ±5.2 µmol kg-1 and taken into consideration the salinity and the concentration of NO3- and O2 (Eq. 5). The NO3- was spectrophotometrically determined (Grasshoff et al., 1999) with a QuAAtro auto-analyser (SEAL Analytical, UK) by Kastriot Qelaj (GEOMAR). The was estimated by using the apparent oxygen utilization (AOU) computed from the measured temperature, salinity and O2 and the stoichiometric coefficients for the change in nitrate (ΔN/ΔO2 = 16/170) given by Anderson and Sarmiento (1994) (Eq. 6). The was directly calculated from Eq. 3.
The change in CT due to the biological contribution through the organic carbon and carbonate pumps was taken into consideration. The was computed from the AOU and the stoichiometric coefficients for the change in carbon (ΔC/ΔO2 = 117/170) given by Anderson and Sarmiento (1994) (Eq. 7), while is half of the contribution estimated for according to Chen and Millero (1979) (Eq. 8). The was directly calculated from Eq. 4.
The air-sea CO2 fluxes (FCO2) were calculated from the surface underway data collected through the vessel tracks and using Eq. 9. The solubility (S), the difference between the surface seawater and low atmosphere fCO2 (ΔfCO2= fCO2,sw – fCO2,atm) and a conversion factor of 0.24 mmol m-2 d-1 were considered in the calculation to express the FCO2 results in mmol m-2 d-1. Negative fluxes indicate that the ocean behaves as an atmospheric CO2 sink, while positive ones indicate that it behaves as a source.
The parameterization of Wanninkhof (2014) was used in this study, with k being the gas transfer rate expressed in Eq. 10:
where w is the wind speed (m s-1) and Sc is the Schmidt number (kinematic viscosity of seawater, divided by the gas diffusion coefficient). The underway low atmospheric CO2 concentration and wind speed used for the calculation of FCO2 were collected on board the vessel and provided by Weiß et al. (2020) in the World Data Center PANGAEA®. The low atmospheric CO2 concentration was measured with a cavity ring-down spectrometer (CRDS, Picarro G2301-f) and a GEOMAR’s ‘Atmospheric Intake System’ (AIS). The wind speed was continuously monitored by an onboard meteorological station. Both underway measurement systems were installed at 7.5 m above the sea surface.
The distributions of temperature, salinity, fluorescence and CO2 system variables were analysed up to 250 m depth in the CV (Figure 2; Supplementary Figure 1), CA (Figure 3; Supplementary Figure 2) and MA (Figure 4; Supplementary Figure 3). Several differences were found in CV between the northern islands (Sao Antao, Sao Vicente, Sao Nicolau and Sal; CV-N hereinafter) and the southeastern islands (Fogo, Santiago, Maio and Boa Vista; CV-SE hereinafter) as well as in the CA between the Western most area (El Hierro, La Gomera and the West coast of Tenerife; CA-W hereinafter) and the Eastern most area (the East coast of Tenerife and Gran Canaria; CA-E hereinafter). The longitudinal surface changes in the physical properties and surface CO2 were analysed in each archipelago along the cruise tracks (Figure 5) and the latitudinal surface gradients from CV to MA were also considered (Supplementary Figure 4). The regional averages of the study variables from the surface to 180 m depth are shown in Table 1.
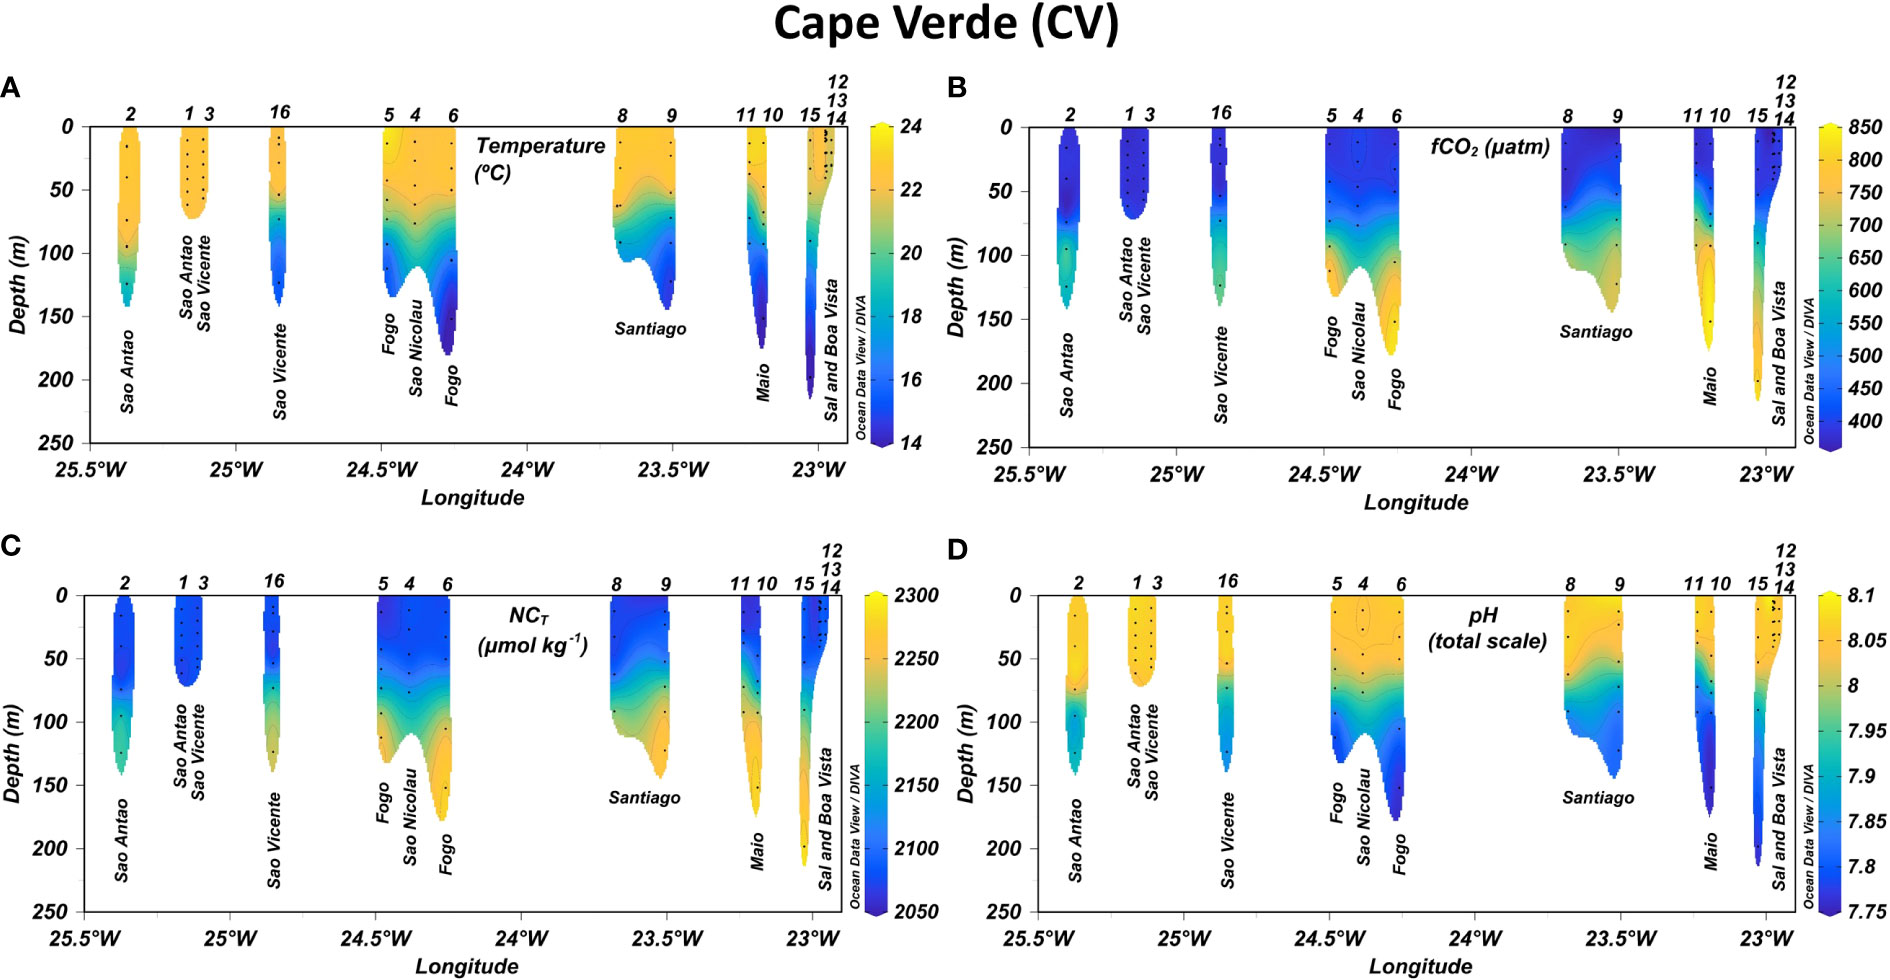
Figure 2 Longitudinal distribution of (A) temperature, (B) CO2 fugacity in seawater (fCO2,sw), (C) normalized total inorganic carbon (NCT) and (D) pH in the first 250 m depth leeward of Cape Verde archipelago. Isolines were added in plots every 1°C for temperature, 50 µatm for fCO2,sw, 25 µmol kg-1 for NCT and 0.05 units for pH.
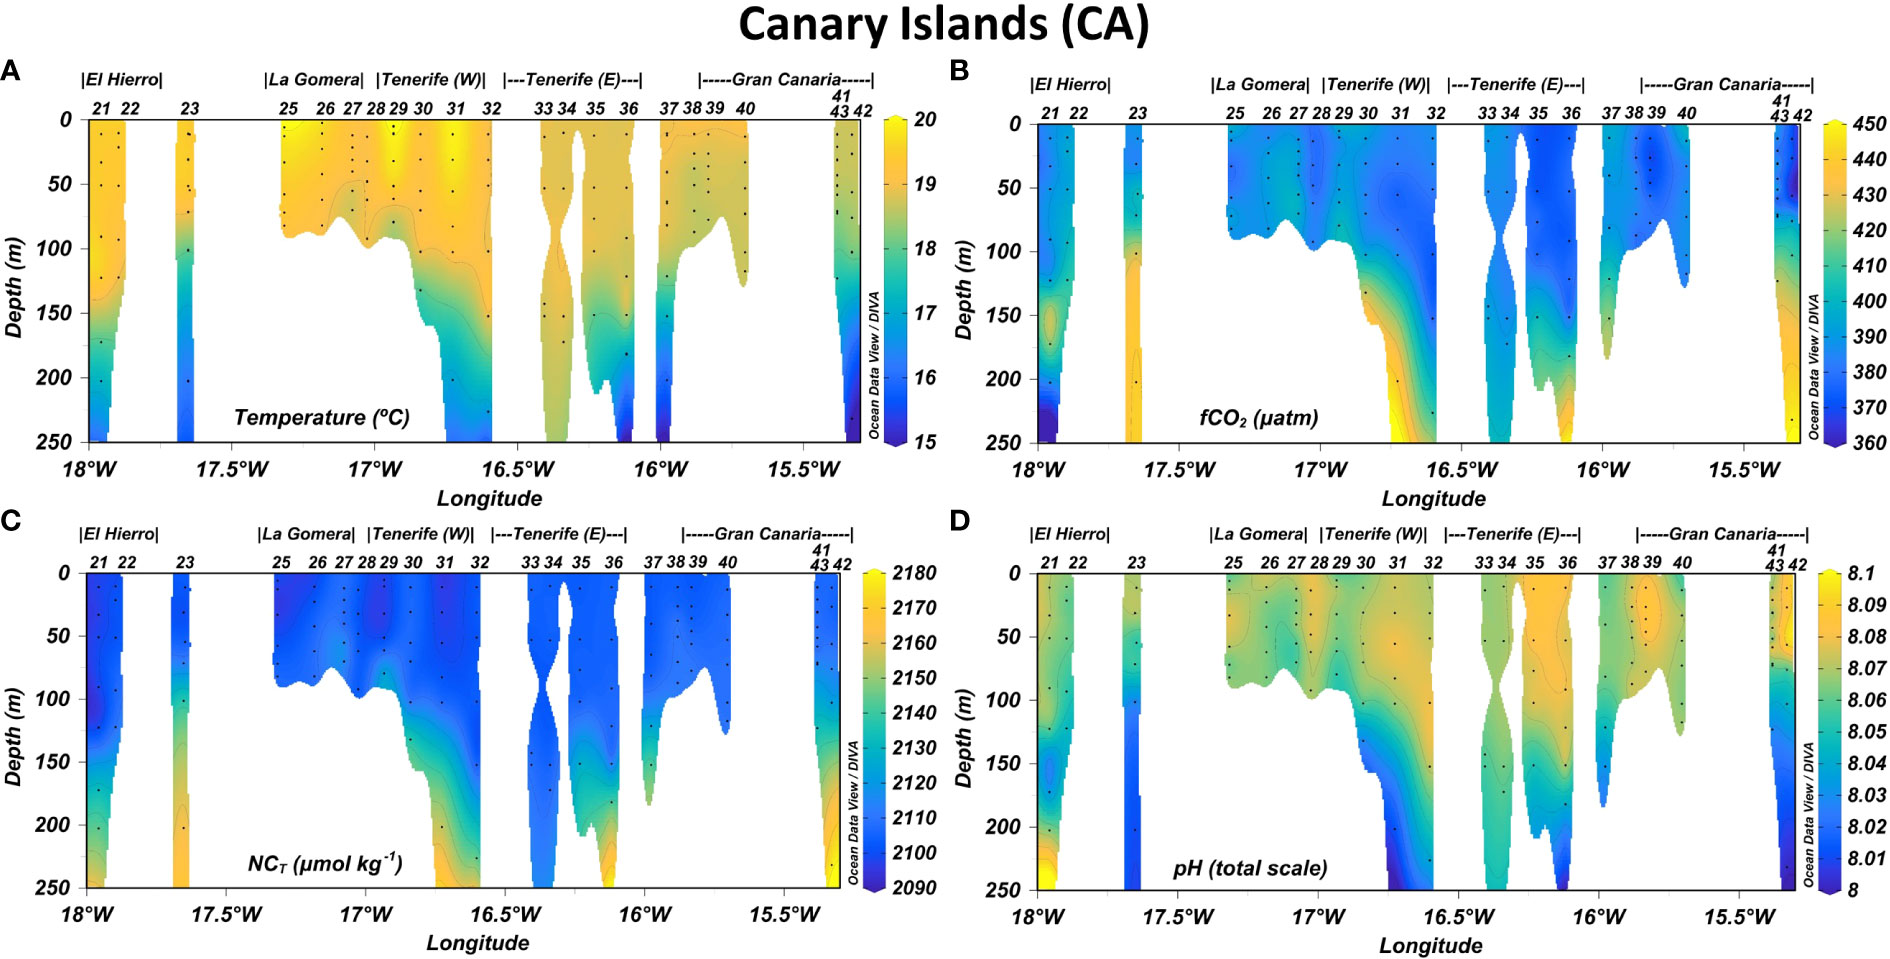
Figure 3 Longitudinal distribution of (A) temperature, (B) CO2 fugacity in seawater (fCO2,sw), (C) normalized total inorganic carbon (NCT) and (D) pH in the first 250 m depth leeward of Canary Islands. Isolines were added in plots every 1°C for temperature, 10 µatm for fCO2,sw, 10 µmol kg-1 for NCT and 0.01 units for pH.
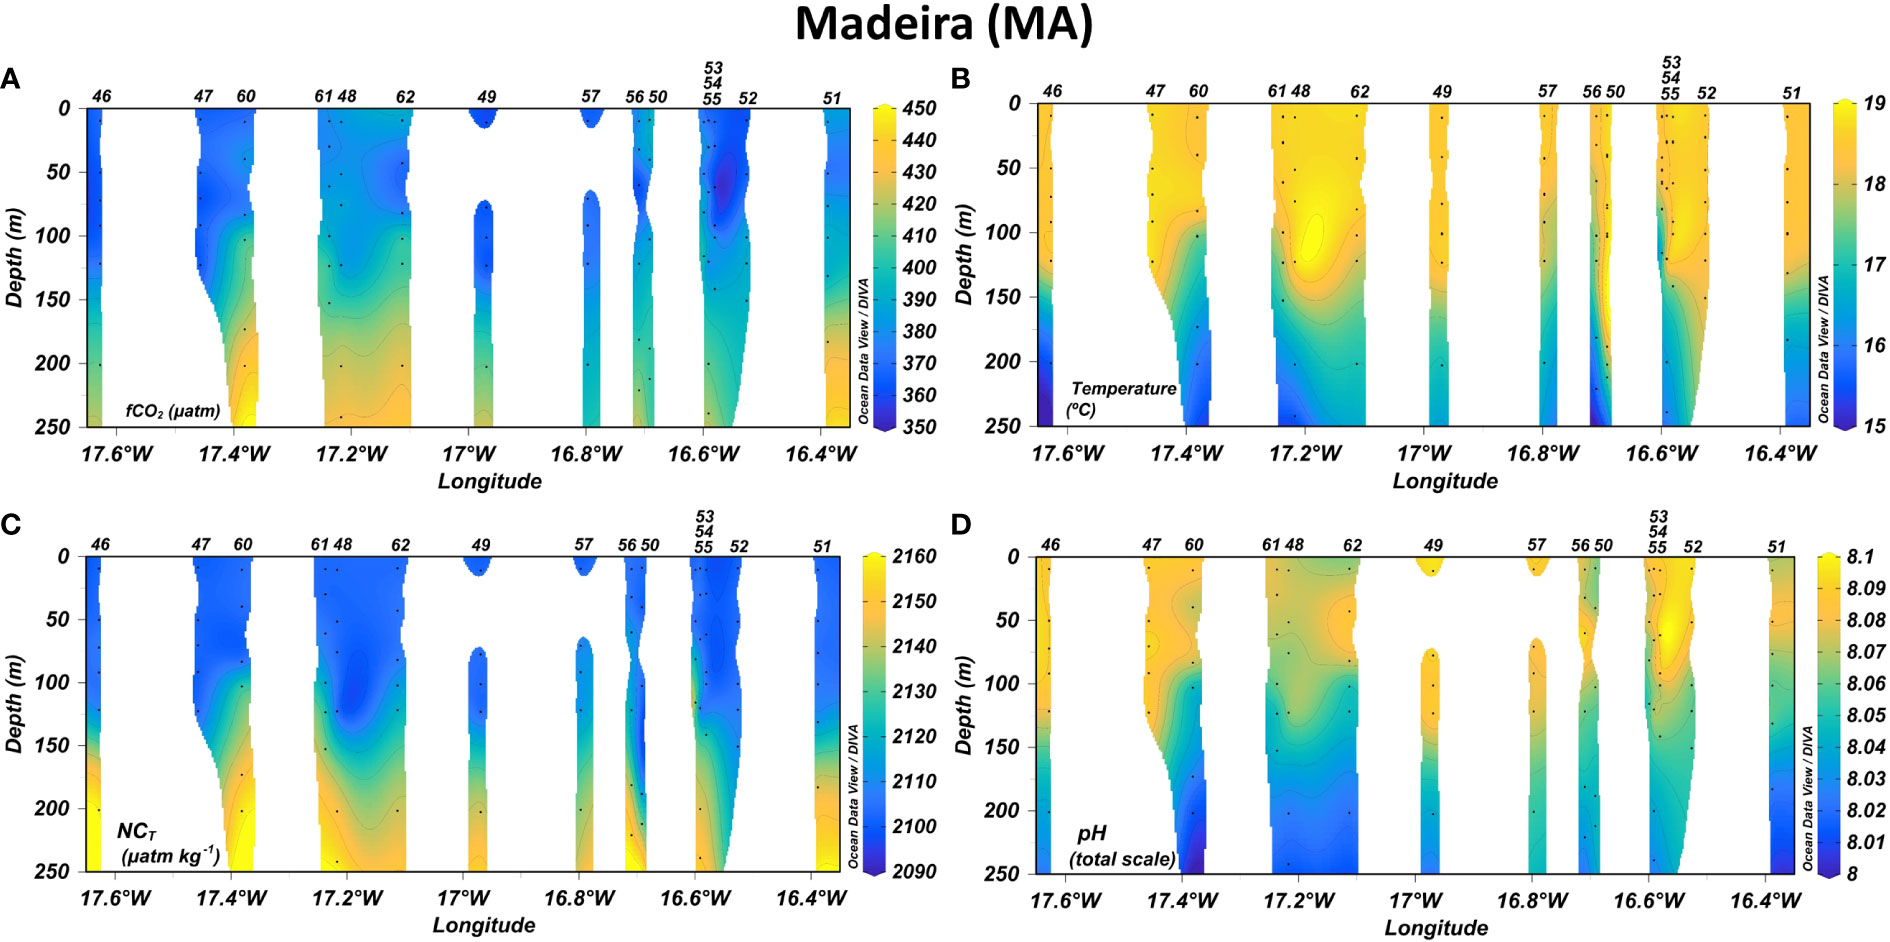
Figure 4 Longitudinal distribution of (A) temperature, (B) CO2 fugacity in seawater (fCO2,sw), (C) normalized total inorganic carbon (NCT) and (D) pH in the first 250 m depth leeward of Madeira. Isolines were added in plots every 1°C for temperature, 10 µatm for fCO2,sw, 10 µmol kg-1 for NCT and 0.01 units for pH.
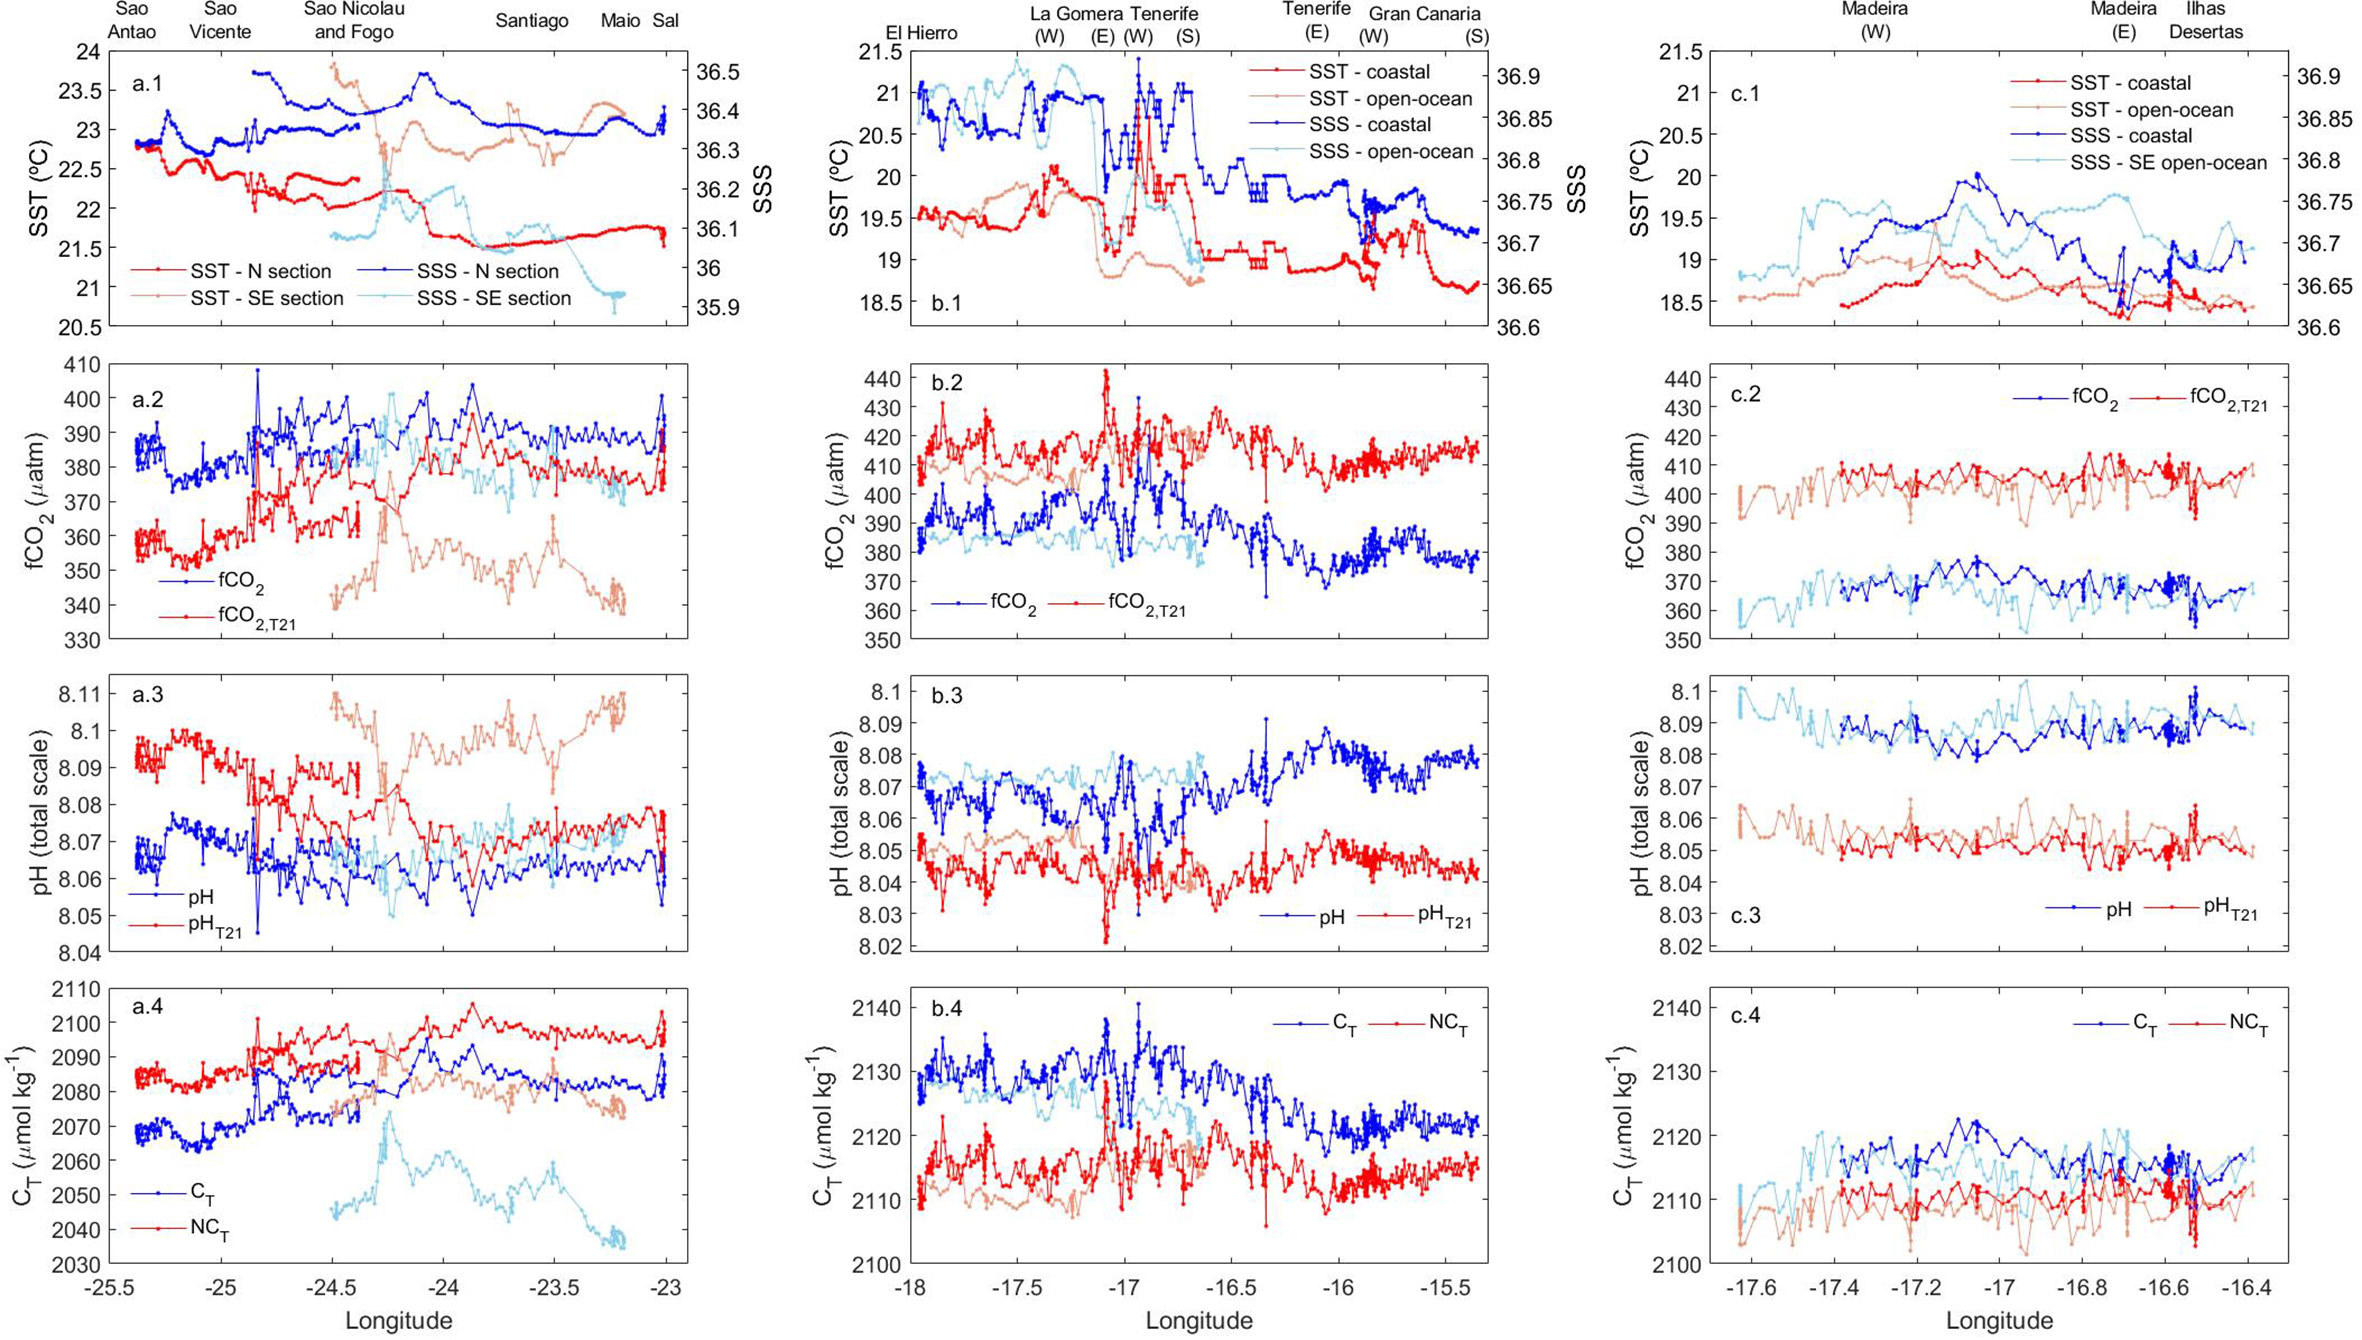
Figure 5 Longitudinal distribution of (1) SST (red) and SSS (blue), (2) fCO2,sw (blue) and fCO2,T21 (red), (3) pH (blue) and pHT21 (red) and (4) CT (blue) and NCT (red) along the vessel track in (A) the nothern and southeastern sections of Cape Verde (CV-N and CV-SE) and along the coastal and open-ocean sections in the (B) Canary (CA) and (C) Madeira (MA) archipelagos. In CV (A.1-4), the values for the CV-N section were plotted in dark blue and red, while for CV-SE were plotted in light blue and red. In CA, the open-ocean section goes from stations 18 to 21, while coastal section goes from stations 21 to 43. In MA, the open-ocean section goes from stations 46 to 51 and the coastal section from stations 52 to 62. In the plots for both archipelagos (B.1-4, C.1-4), the values for the coastal section were represented in dark blue and red while for the open-ocean section were represented in light blue and red.
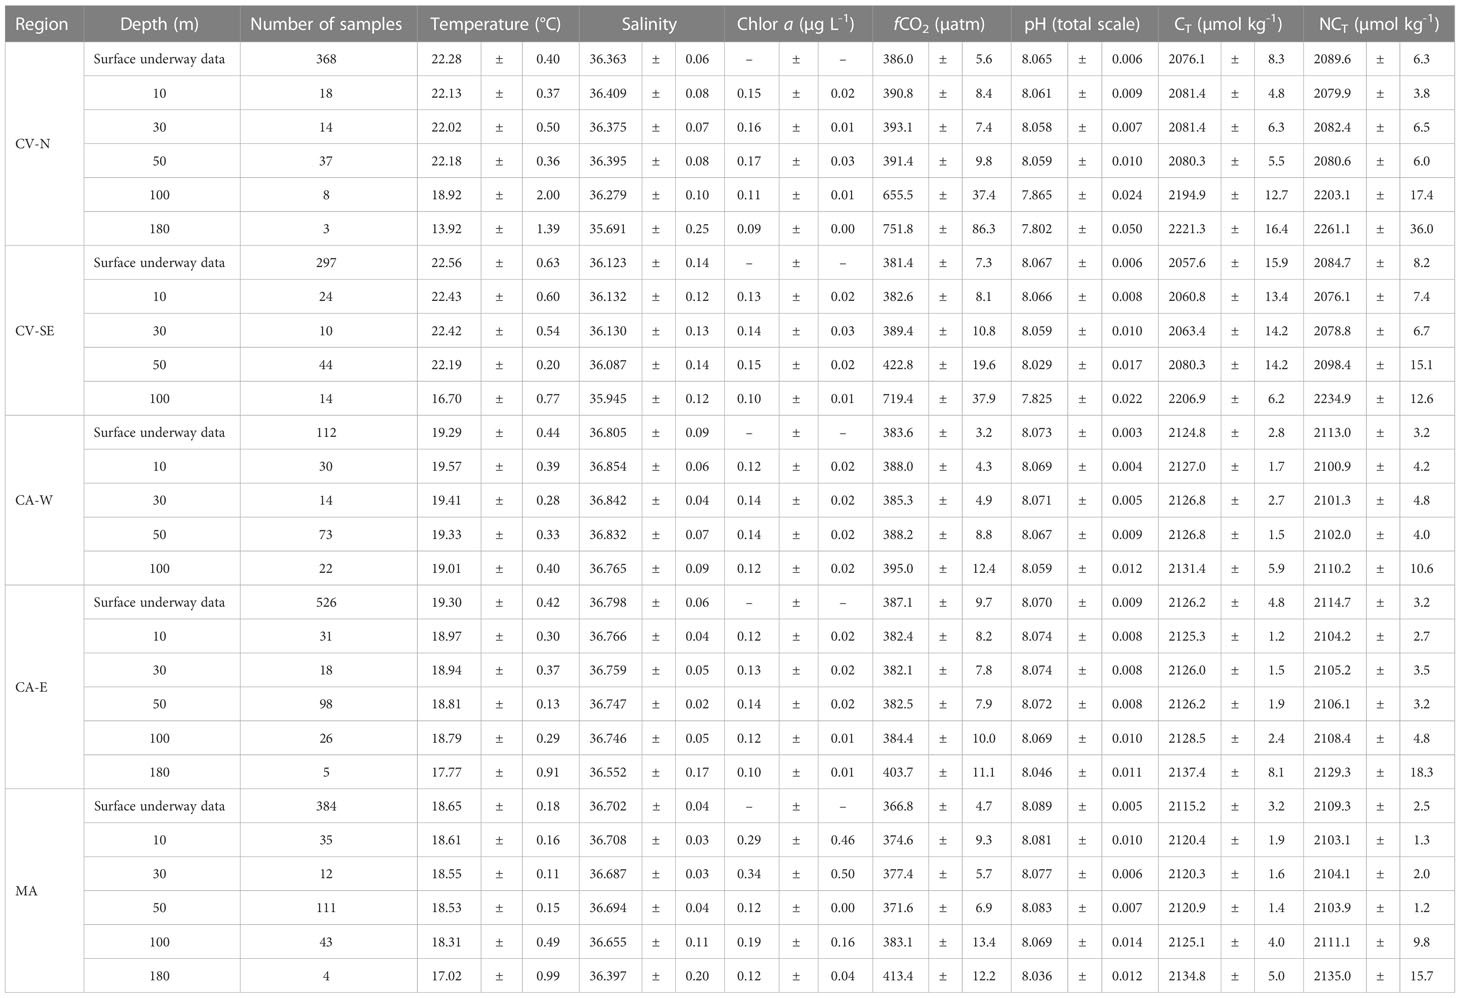
Table 1 Regional average of temperature, salinity, Chlorophyll a, fCO2,sw pH, CT and NCT in the nothern and southeastern section of Cape Verde (CV-N and CV-SE, respectively), in the western and eastern section of Canary Islands (CA-W and CA-E, respectively) and in the Madeira archipelago (MA) in surface waters and at 10, 30, 50, 100 and 180 m depth.
Latitudinal temperature differences were found in the upper water column up to 100 m depth, with maximum average values in the CV that decrease towards the North (Table 1). The average salinity values in the first 100 m depth were highest in CA (36.75-36.85) followed by MA (36.66-36.70) and CV (35.94-36.41). The surface fluorescence signals (data not shown) reported that Chl-a was maximum in CA-SE and ranged similar in CV-N, CA and MA, showing local differences along the coastal areas. An area with local minimum values of both SST (19.0-19.5°C) and SSS (36.0-36.2) and slightly higher surface fluorescence signals compared to adjacent waters was found at 21.5°N in the latitude of Cape Blanc along the CV-CA route (Supplementary Figure 4).
Decreasing West-to-East gradients of SST were observed in CV-N from Sao Antao (22.5-23.0°C) to Sal (21.5-22°C) and in CV-SE from Fogo (23.5-24°C) to Santiago (22.5-23.0°C) and Maio (23.0-23.5°C) (Figure 5A). The SSS also decreased toward the East in CV-N from Sao Vicente (~36.5) to Sal (36.3-36.4) and even more in CV-SE from the southeastern coast of Fogo (36.2-36.3) to Maio (~35.9) (Figure 5A.1). These longitudinal differences were also detected in CA (Figure 5B.1), with SST and SSS values decreasing from El Hierro, La Gomera and the southwestern coast of Tenerife (19.5-20.5°C and 36.8-37.0, respectively) to the southeastern coast of Tenerife and the entire coastal area of Gran Canaria (18.5-19.5°C and 36.6-36.8, respectively). A decrease in SST and SSS was detected through both the coastal and open-ocean transects in the downwind areas Southwest of La Gomera, Tenerife and Gran Canaria (Figure 5B.1). The physical properties in MA (Figure 5C.1) were similar to those of CA-E, with SST and SSS values of 18-19.5°C and 36.6-36.8 respectively. An eastward decrease was found from the South of Madeira at 17.1-17.2°W (19.0-19.5°C and 36.75-36.8, respectively) to the South of Ilhas Desertas (~18.5°C and 36.65-36.7, respectively) through both the coastal and open-ocean transects.
The temperature and salinity signals in CV were approximately constant above the MLD located at around 50-60 m depth, with a minimum average variation range of ±0.16 °C and ±0.02 respectively (Figure 2A; Supplementary Figure 1A, respectively). The MLD increased northward and the temperature and salinity values were approximately constant up to 70-100 m depth in CA (Figure 3A; Supplementary Figure 2A) and MA (Figure 4A; Supplementary Figure 3A), where the average variation range was ±0.27 and ±0.17 °C, respectively, for temperature and ±0.04 and ±0.03, respectively, for salinity. Below the MLD up to 250 m depth, a decrease in temperature and salinity of more than 4.0 °C and 0.4 units, respectively, were observed in the entire region. The fluorescence profiles (Supplementary Figures 1C–3C) reported a rapid decrease of Chl-a concentration in the first 50-100 m depth and reached the highest average values in CV, followed by CA and MA (Table 1).
The surface values of fCO2,sw (Figure 5; Supplementary Figure 4) ranged similarly in CV (366.5-409.5 µatm) and CA (364.6-410.0 µatm), while lower values were found in the cooler MA region (352.3 and 378.4 µatm). The surface pH values (given in total scale) changed with fCO2,sw by -0.001 units µatm-1 (r2> 0.96) in the entire region and ranged between 8.04 and 8.08-8.09 units in both CV and CA and between 8.08 and 8.10 units in MA. The maximum fCO2,sw and minimum pH surface values in the Macaronesian region were detected in a cold and saline filament crossed by the ship between 21.5 and 22.5 °N near Cape Blanc (~440.0-495.0 µatm and 7.95-8.00 units) (Supplementary Figures 4C, D) at a distance of 470 km away from the African coast.
In CV (Figures 5A2, 5A3), the surface fCO2,sw values were higher around CV-N (~375.0-400.0 µatm) and decreased with latitude from Sao Nicolau to Fogo and from Sal to Maio. Minimum surface values of fCO2,sw in CV were obtained in CV-SE leeward of Santiago, Maio and Boa Vista (~365.0-380.0 µatm), leading pH values between 8.07 and 8.08. In CA (Figures 5B2, B3), the surface fCO2,sw values were higher in CA-W coastal areas (~380-410 µatm), followed by the CA-W open-ocean waters and East coast of Tenerife (~380-390 µatm) and the CA-E area (~365.0-390.0 µatm). The surface fCO2,sw reached maximum values East of La Gomera (~405.0-410.0 µatm) and Southwest of Tenerife (~420.0-435.0 µatm) and decreased the pH to 8.035-8.040. Local decreases in the surface fCO2,sw and increases in pH were observed in the cooler and fresher downwind coastal and open-ocean waters southwest of La Gomera, Tenerife and Gran Canaria. The minimum surface values of fCO2,sw (~365-380 µatm) and maximum pH values (8.070-8.090 units) of the CA region were recorded along the inter-island transect between Tenerife and Gran Canaria. In MA (Figures 5C.2, C.3), the surface fCO2,sw values were higher to the South of Madeira through the more coastal transect (~370.0-380.0 µatm) followed by the Southwest of Madeira through the more open-ocean transect (~365.0-377.0 µatm), leading pH values of ~8.08. Outside the leeward area, the surface fCO2,sw values fell below 365.0 µatm and drove pH values between 8.09 and 8.10.
The surface fCO2,sw values decreased toward the East in CV-SE and CA following the West-to-East decrease of SST. The effect of SST over the changes in surface fCO2,sw was removed by normalizing the fCO2,sw to 21°C (fCO2,T21). The longitudinal change of fCO2,T21 was lower than those of fCO2,sw in CV-SE, while was minimal in CA. An inverse longitudinal gradient was detected in CV-N, with a westward decrease of surface fCO2,T21. These longitudinal differences were not observed in MA, where fCO2,T21 remained approximately constant through both the coastal and open-ocean transects (Figure 5).
Both fCO2,sw and pH surface values kept approximately constant up to 40-50 and 50-60 m depth in CV-SE and CV-N respectively (Figures 2B, D), 60-75 m depth in CA (Figures 3B, D) and 80-95 m depth in MA (Figures 4B, D). In CV, the fCO2,sw values at the base of the MLD (390-420 µatm) increased with depth and exceed 700 µatm around 80-150 m depth. Maximum fCO2,sw values at these depths were found to the south of Fogo (773.2 and 819.4 µatm) and Maio (842.3 µatm) and at CVOO (685.2 µatm), which coincided with the lowest oxygen values encountered throughout the region (<80 µmol kg-1) and drove the strongest decrease in pH values (from ~8.00-8.06 at the base of the MLD to 7.765-7.860). A weaker increase in fCO2,sw with depth was obtained in CA and MA, where lower fCO2,sw (~390-465 and ~380-440 µatm, respectively) and higher pH values (~7.99-8.06 and ~8.01-8.05, respectively) were obtained in deeper areas (150-250 m). Maximum fCO2,sw and minimum pH values of CA and MA (461.3 µatm and 7.996 units, respectively) were obtained at the ESTOC site at 150 m depth.
The surface distribution of CT was linked to the SSS, with a higher concentration towards the north of Cape Blanc (Supplementary Figure 4). Maximum CT surface values were obtained in coastal CA-W areas (~2120-2140 µmol kg-1) followed by CA-E (~2115-2130 µmol kg-1) and MA (~2105-2120 µmol kg-1), while the minimum values were found in CV (~2035-2095 µmol kg-1) and especially leeward of Sao Antao and Sao Vicente (~2060-2075 µmol kg-1) and throughout CV-SE (~2035-2075 µmol kg-1) (Figures 5A.4, B.4, C.4). The surface and upper water column CT were normalized (NCT) to constant salinities of 36.6 and 36.4, the average salinities of the Macaronesian region for surface and first 250 m depth, respectively, to remove the effect of evaporation/precipitation, the horizontal/vertical advection and the influence of different water masses.
The highest NCT surface values in the entire region were found around Cape Blanc (~2140-2165 µmol kg-1) (Supplementary Figure 4E), while a strong NCT depletion was observed south of Cape Blanc at CV (Figure 5A.4). Minima NCT surface values in CV were found southwest of Fogo and Maio (~2070-2080 µmol kg-1), while maxima were observed through the Boa Vista-Sal-Sao Vicente northeast most transects (~2085-2105 µmol kg-1). In CA (Figure 5B.4), the surface NCT-rich waters were found on the East coast of El Hierro (~2133-2136 µmol kg-1) and La Gomera (~2134-2139 µmol kg-1), in more open-ocean waters between both islands (~2130-2136 µmol kg-1) and at certain locations along the southwest and southeast coast of Tenerife (~2127-2142 µmol kg-1). The lowest NCT surface values were obtained across the most oceanic transect south of La Gomera and El Hierro (~2106-2113 µmol kg-1), in CA-E (~2105-2120 µmol kg-1) and north of Gran Canaria around the ESTOC site (~2105-2112 µmol kg-1). In MA, higher NCT surface concentrations were measured through the coastal transect compared with those of the open-ocean transect (Figure 5C.4). The maximum values were observed East of Madeira and along the West coast of Ilhas Desertas (~2113-2115 µmol kg-1).
The CT and NCT remained depleted in the most productive euphotic layer and increased toward the remineralized deep waters below the MLD (Table 1). The highest NCT values in the upper water column of the Macaronesian region were collected in CV-N (~2187-2246 µmol kg-1) and CV-SE (~2263-2281 µmol kg-1) around 125-150 m depth (Figure 2C). These NCT values were ~100-150 µmol kg-1 greater than the maximums of CA (~2127-2169 µmol kg-1; Figure 3C) and MA (2110-2160 µmol kg-1; Figure 4C) in deeper areas between 150 and 250 m depth.
The distribution of fCO2,sw and pH through the first 250 m depth was assessed in the Macaronesian region based on 3385 surface- (Figure 5; Supplementary Figure 4) and 334 upper-ocean data (Figures 2–4) collected during POS533. Their spatial variability was found to be strongly linked with differences in the intensity of the coastal upwelling along the African coast, the intense mesoscale activity acting in this region, the influence of different circulation patterns and water masses and the effect of trade winds (e. g. Pelegrí et al., 2005a; Pelegrí et al., 2005b; Valdés and Déniz-González, 2015; Pelegrí and Peña-Izquierdo, 2015a; Pelegrí and Benazzouz, 2015b; Bonino et al., 2021). These processes drove horizontal and vertical transports which modified the observed temperature, salinity and Chl-a patterns and biogeochemical cycles.
Minimal changes of surface fCO2,sw and pH with latitude given by linear relationships were observed between CV and CA (-0.4 µatm (r2 = 0.02) and 0.001 units (r2 = 0.15) per degree of latitude, respectively) despite the strong measured decrease of SST with latitude between both archipelagos (-0.33 °C per degree of latitude; r2 = 0.87) (Supplementary Figures 4C, D). The fCO2,sw increased with SST by 7.93 µatm °C-1 (r2 = 0.31) between Cape Blanc and the south of CA along a permanent upwelling area (22.5-28.0°N), while an inverse relationship of -6.04 µatm °C-1 (r2 = 0.23) was encountered between the north of CV and Cape Blanc along a winter upwelling area (17.0-21.0°N). The highest decrease of fCO2,sw with SST was observed at 21.5-22.5°N around Cape Blanc (-95.9 µatm °C-1; r2 = 0.58). Latitudinal gradients were stronger from CA to MA (-3.2 µatm (r2 = 0.49) and 0.003 units (r2 = 0.49) per degree of latitude, respectively), where the theoretical changes of fCO2,sw with SST were observed (14.26 µatm °C-1; r2 = 0.35) (Supplementary Figure 4). These findings agreed with previous studies along the African coastal transitional region through the latitudinal ranges of 10-28°N (González-Dávila et al., 2017) and 28-36°N (Curbelo-Hernández et al., 2021) and were explained by the seasonal and spatial variability of the Canary Upwelling System (Mittelstaedt, 1991; Cropper et al., 2014).
The maximum fCO2,sw and minimum pH values encountered around Cape Blanc at ~470 km away from the African coast (Supplementary Figures 4C, D) were explained by the highest-intense offshore transport of CO2-rich upwelled water not compensated by biological uptake (González-Dávila et al., 2017) through the cold and fresh Cape Blanc giant filament (21.5-22.5 °N) (e. g. Bonino et al., 2020; Gabric et al., 1993; Lovecchio et al., 2017). The low intensity of the permanent annual upwelling in winter north of Cape Blanc weakened the injection in the euphotic zone of CO2 and nutrient-rich water, which explained the increased relevance of SST fluctuations in the fCO2,sw changes from Cape Blanc to Madeira (Supplementary Figures 4A, C). The highest average changes of fCO2,sw and pH were explained by thermal processes in this area (-24.64 µatm and 0.023 units, respectively) compared with the area most influenced by non-thermal processes south of Cape Blanc (6.69 µatm and -0.007 units, respectively) (Supplementary Figure 4C). The less intense offshore transport through the Cape Ghir filament (Hagen et al., 1996; García-Muñoz et al., 2005; Pelegrí et al., 2005a; Pelegrí et al., 2005b; Laiz et al., 2012), together with the dominance of respiration over primary production which compensates the decrease in fCO2,sw drove by the cooling of the water at this time of the year (Curbelo-Hernández et al., 2021), explained a lower increase in surface fCO2,sw encountered at Cape Ghir latitude (30.7°N) at ~650 km away from the African coast (Supplementary Figures 4A, C).
The strong influence of the Canary Upwelling System through the easternmost parts of CV and CA introduced longitudinal differences in the surface distribution of fCO2,sw (Figures 5A.2, B.2) and pH (Figures 5A.3, B.3). The low fCO2,T21 values in CV-SE showed that the biological production actively reduced the excess of CO2 in the upwelled waters. The fCO2,sw and fCO2,T21 decreasing eastward with the SST and SSS indicated that both the enhancement of the biological activity and the cooling of the water due to the influence of the African coastal upwelling accounted for the formation of the longitudinal physical and biogeochemical gradient in CV-SE. The minimal longitudinal changes in fCO2,T21 and pHT21 in CA indicated that the West-to-East decrease of fCO2,sw and increase in pH was mainly controlled by the cooling of the upwelled waters around the closer islands to the African coast (Figures 5B.2, B.3). The weaker influence of the coastal upwelling in MA due to its greater distance from the African coast and the low intensity of the offshore transport by the Cape Ghir filament at this time of the year explains the minimal observed longitudinal changes of fCO2,sw and pH (Figures 5C.2, C.3).
Several differences in the surface distribution of fCO2,sw and pH were encountered between CV-N and CV-SE (Figures 5A.2, A.3) and explained by the influence of the CVFZ, which reaches its southernmost position in winter (Zenk et al., 1991; Pérez-Rodríguez et al., 2001). The high surface fCO2,sw values encountered in CV-N can be explained by the influence of cold but low-productive and CO2-rich surface waters transported by the NEC. Although the upwelling-driven eastward decrease of SST was observed in CV-N, the fCO2,sw and fCO2,T21 values were higher in the eastern part (Figures 5A.1, A.2). It indicated that the CO2 enrichment of these waters through the injection of deep and remineralized waters in the closest area to the coastal upwelling was the main factor controlling the fCO2,sw and pH distributions. In contrast, minimum fCO2,sw values in the easternmost part of CV-SE around Santiago, Maio and Boa Vista (Figure 5A.2) indicated that the CO2 enrichment was weaker and that the fCO2,sw distribution was controlled by the enhancement of the biological uptake in warmer but higher-productive surface water transported through the NECC and recirculated in the cyclonic Guinea Dome (Siedler et al., 1992; Faye et al., 2015).
The horizontal advection processes can be coupled with divergent/convergent movements of water in mesoscale eddies (Barton et al., 2004; Sangrà et al., 2009; Cardoso et al., 2020), which introduces local increases/decreases in surface fCO2,sw, as it was observed leeward of the islands (Figure 5) and through the CV-CA-MA track (Supplementary Figure 4). Higher surface fCO2,sw values compared with adjacent waters were encountered at 18.02°N (404.30 µatm), 18.37°N (417.70 µatm), 19.64°N (403.5 µatm) and 20.33°N (414.70 µatm) and coincided with lower signals of SST (21.65, 21.22, 20.67 and 19.87 °C, respectively) (Supplementary Figures 4A, C). The opposite occurred at 18.97°N (374.5 µatm and 21.55°C, respectively). These local changes were explained by the upwelling of cold and CO2-rich deep-water in the core of cyclonic eddies and downwelling of surface waters in anticyclonic eddies, which has been previously detected south of Cape Blanc (e. g. Schütte et al., 2016a; Karstensen et al., 2017; Cardoso et al., 2020). Mesoscale islands-generated eddies were most frequently observed from Cape Blanc to the southern part of CA through The Canary Eddy Corridor (Sangrà et al., 2009) and introduced stronger local differences in the physical and biogeochemical seawater properties which modified the fCO2,sw and pH through the CV-CA track (Supplementary Figure 4). The highest local increase in surface fCO2,sw occurred at 23.79°N (Supplementary Figure 4C) and coincided with a major low signal of SST and a high signal of Chl-a associated with a cyclonic eddy (Supplementary Figures 4A, B). The mesoscale variability and its effect on the local changes in surface fCO2,sw weakened through the CA-MA track, where cyclonic eddies detected by Couvelard et al. (2012) south of Madeira were only observed in minimal decreases in SST and SSS between 31.3 and 32.8°N (Supplementary Figures 4A, C).
The shallowest position of the MLD in the tropical CV area enhanced the vertical mixing processes and deep-water injection in surface layers, which contributed to change strongly the fCO2,sw and pH in the first 250 m depth (Figures 2B, D). These changes were lower in CA (Figures 3B, D) and MA (Figures 4B, D) due to the deepening of the MLD. Several heterogeneities in the upper-ocean distribution were found between the leeward coastal areas, the inter-island waters and the windward open-ocean waters. The trade winds drove intense vertical mixing processes and raised the MLD in the windward areas of each archipelago, while the suppression of the wind effect in the leeward areas weakened the vertical mixing and decreased the MLD. These differences were observed at inter-islands windward stations compared to CV and CA downwind stations (Figures 2, 3). The effect of trade winds cools the upper water column in the windward areas, while the leeward coast show higher temperature values. However, the increase in surface fCO2,sw with temperature in leeward coastal upper-ocean waters was compensated by the enhancement of biological production, as was observed with higher Chl-a values (data not shown).
The high spatial variability of fCO2,sw in the study area has a great influence on the distribution of ocean CO2 along the African coastal transitional zone and should be studied on a regional scale. Thus, the fCO2,sw data during POS533 were compared and compilated with 52328 surface fCO2,sw winter data in the Macaronesian region available in the Surface Ocean CO2 Atlas database (SOCAT v2022; Bakker et al., 2016) and 2120 fCO2,sw upper water-column data (first 250 m depth) in the Northeast Atlantic available in the GLODAP database (GLODAP v2022; Key et al., 2015; Olsen et al., 2016). The location of the sampled stations for SOCAT and GLODAP data is shown in Supplementary Figure 5.
The spatio-temporal changes in surface fCO2,sw were analysed in CV, CA, MA and for the entire Macaronesian region using POS533 and SOCAT data. These changes were also assessed from 10 to 100 m depth and compared with the changes observed between 100 and 250 m depth using POS533 and GLODAP data. Multiparametric regressions were applied to the compilated datasets (POS533+GLODAP datasets and POS533+SOCAT datasets) to analyse the distribution of fCO2,sw based on changes in the seawater physical properties (SST and SSS). The combination of the POS533 with the SOCAT and GLODAP datasets provided a set of equations statistically significant at the 95% level (ρ value< 0.05) that can be used to estimate the fCO2,sw in the upper layers of the entire region by considering temperature and salinity fluctuations and both temporal (seasonal and interannual) and longitudinal changes (Table 2). The interannual increase of surface fCO2,sw in CA (2.01 ± 0.01 µatm yr-1) and MA (2.11 ± 0.01 µatm yr-1) was similar to the observed rate at the ESTOC site (1.92 µatm yr-1; Bates et al., 2014). The highest interannual increase around CV (2.36 ± 0.02 µatm yr-1) coincided with those obtained at the subpolar Irminguer Sea sites (2.37 µatm yr-1; Bates et al., 2014), where vertical mixing processes were enhanced and contributed to the increased observed trend. The lower change of surface fCO2,sw with SST in CV compared to CA and MA (Table 2) was indicative of the relevance of thermal processes in the change of fCO2,sw north of Cape Blanc while non-thermal processes (mainly the horizontal and vertical advection of CO2-rich water) played a key role in the distribution of surface fCO2,sw south of Cape Blanc. This set of equations improved the understanding of the carbon cycle along the African coastal transition area in the Northeast Atlantic.
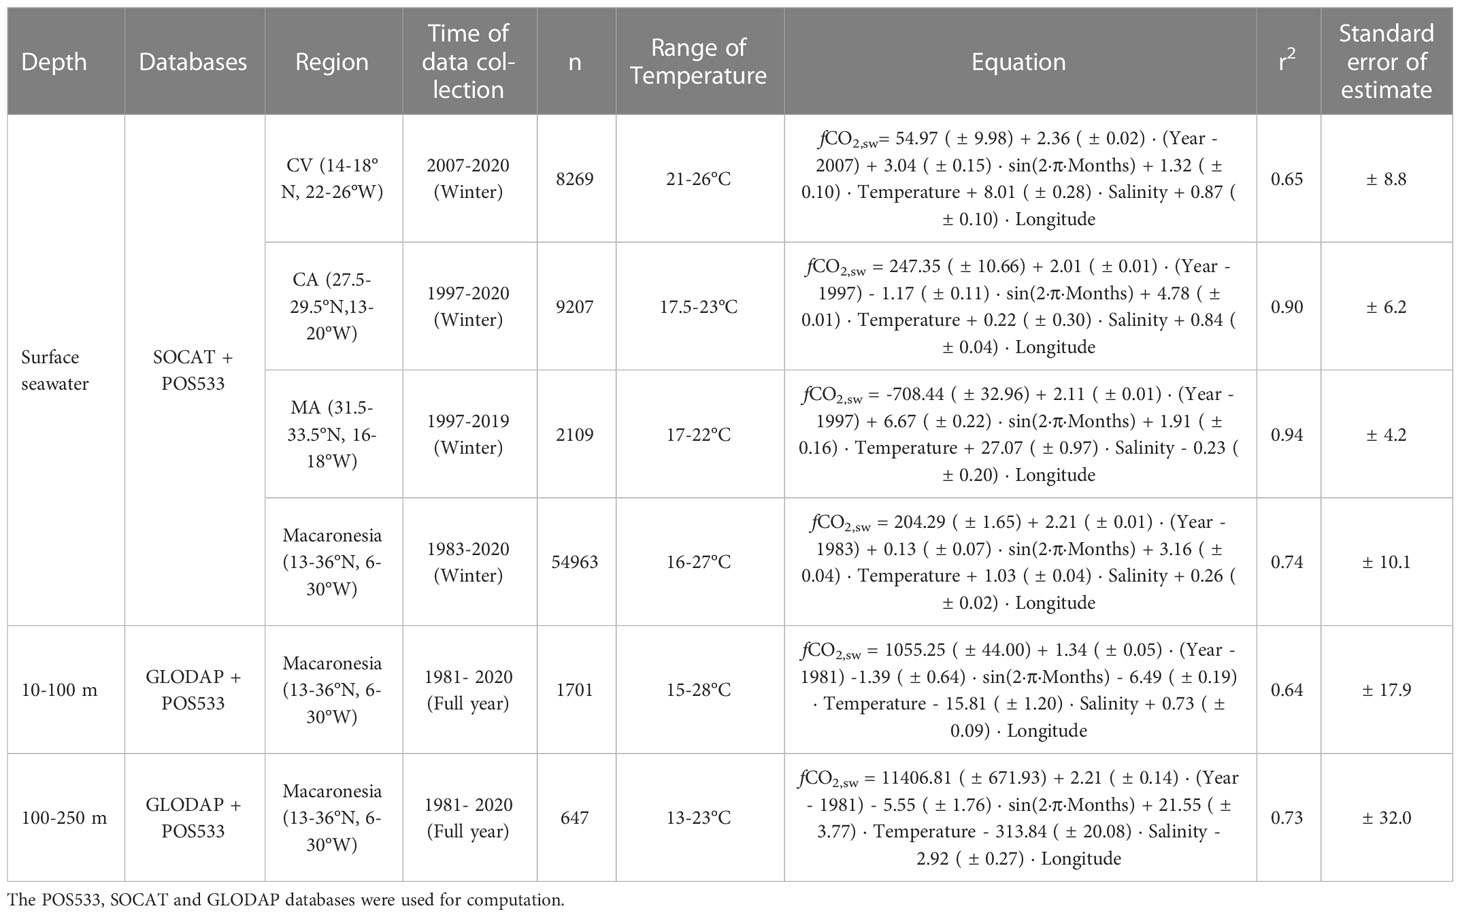
Table 2 Set of multiparametric regressions which described the spatio-temporal changes in upper ocean fCO2,sw based on fluctuations of the physical properties.
The shallow ocean CT content was studied leeward of each archipelago by considering the non-conservative factors controlling its vertical distribution. The variations of NCT from preformed NCT values (NCTpre) were explained by fluctuations in the organic carbon pump (biological production/respiration processes), the carbonate pump (carbonate dissolution/formation) and the uptake of anthropogenic carbon (Chen and Millero, 1979; Feely et al., 2002; Chou et al., 2007; Andreev et al., 2009) and were described at any given depth by Eq. 4. The results allow to quantify the relative contribution of each term involved in the temporal evolution of NCT from NCTpre values above and below the MLD (up to 250 m depth) (Figure 6; Table 3).

Figure 6 Upper ocean distribution (up to 250 m depth) of preformed NCT (NCTpre), its changes explained by the anthropogenic carbon (Cant) and both the organic and carbonate pumps (NCTorg and NCTcarb, respectively) and the determined NCT values in (A) CV-N, (B) CV-SE, (C) CA-W, (D) CA-E and (E) MA.
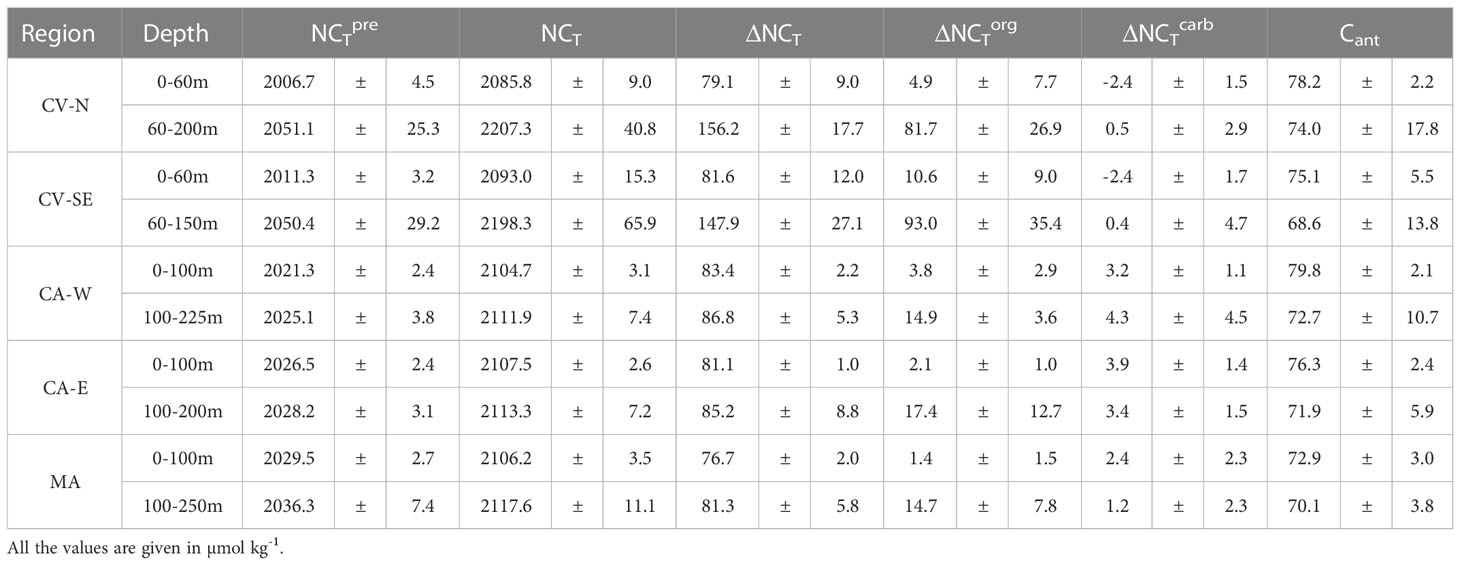
Table 3 Average content of calculated NCTpre and determined NCT above and below the MLD in CV-N, CV-SE, CA-W, CA-E and MA and relative contribution of the organic carbon pump (ΔNCTorg), carbonate pump (ΔNCTcarb) and Cant in the observed increase of NCT from NCTpre.
The increase in NCT from NCTpre above the MLD was around 75-90 µmol kg-1 throughout the region. The increment below the MLD was approximately twice in CV than in CA and MA (Table 3). The highest increase with depth of NCT below the MLD occurred in CV-N and CV-SE (1.4 ± 0.8 and 1.9 ± 1.3 µmol kg-1 m-1, respectively) and was explained by the maximum NCTpre values (2051.1 ± 25.3 and 2050.4 ± 29.2 µmol kg-1, respectively) and organic carbon pump contribution (52.3% and 57.43%, respectively) encountered throughout the study region. Minor changes of NCT with depth below the MLD were observed in CA-W (0.5 ± 0.3 µmol kg-1 m-1), CA-E (0.4 ± 0.2 µmol kg-1 m-1) and MA (0.4 ± 0.1 µmol kg-1 m-1) due to the lower NCTpre values (2025.1 ± 3.8, 2028.2 ± 3.1 and 2036.3 ± 7.4 µmol kg-1, respectively) and the weakened of the biological contribution (16.2%, 18.93% and 16.9%, respectively). These differences were mainly explained by spatial heterogeneities in the ventilation and remineralization rates through the Northeast Atlantic ITCZ. The longer residence time of tropical waters south of Cape Blanc originated in the South Atlantic compared with the well-ventilated subtropical waters that originated in the high-latitude of the North Atlantic enhanced remineralization (Pelegrí and Peña-Izquierdo, 2015a) and led a higher NCT increase in (sub)surface waters around CV compared with CA and MA. The high primary production through the coastal Mauritania-Senegalese upwelling at this time of the year and the upwelling of water in the Guinea Dome also accounted for the increase of remineralization rates south of Cape Blanc (Karstensen et al., 2008; Stramma et al., 2008b). This fact was observed in a slightly higher contribution of the organic carbon pump above the MLD in CV-N and CV-SE (6.11% and 12.75%, respectively) compared with CA-W, CA-E and MA (4.4%, 2.6% and 1.9%, respectively).
The change in NCT from NCTpre in the entire region was mainly controlled by the anthropogenic carbon input and storage, which increased the NCT content throughout the region around 72-80 and 68-74 µmol kg-1 above and below the MLD, respectively. The uptake of Cant in surface waters contributed more than 90% of the NCT change above the MLD. The Cant storage below the MLD account for 79.1% in CA-W, 78.2% in CA-E and 80.8% in MA of the NCT increase, while its contribution fell to 47.4% in CV-N and 42.35% in CV-SE. It is related to the weakening of mixed-down processes due to higher vertical stratification and the enhancement of remineralization processes in the ITCZ (Mayer and Weisberg, 1993; Stramma and Schott, 1999).
The relevance of the carbonate pump in the change of NCT through the upper layers was considerably lower in the entire region, coinciding with previous observations in the first 500 depths at the ESTOC site (González-Dávila et al., 2010). The dissolution of CaCO3 in (sub)surface waters increased the NCT by 3.7-4.8% and 1.4-3.1% in CA and MA, respectively. The decrease in CaCO3 solubility toward warm tropical waters (Feely et al., 2004) explained the minimal contribution of NCTcarb on the increase of NCT below the MLD in CV-N (0.3%) and CV-SE (0.2%). Negative ΔNCTcarb values above the MLD in CV (Table 3) indicated that the formation processes of CaCO3 exceed those of dissolution and accounted for the depletion of NCT by 2.9-3.0%.
The coastal regions and marginal seas have been found to store more Cant than the open oceans in proportion to their areas (Park et al., 2006; Olsen et al., 2010; Sabine and Tanhua, 2010; Schneider et al., 2010), but have been largely ignored in global ocean studies of the Cant storage due to the limited data available (Khatiwala et al., 2013). This study provides a new analysis of the vertical distribution and inventory of Cant in shallow coastal and inter-islands waters of the Macaronesian region (Figure 7A). The upper-ocean profiles of Cant were evaluated in CV, CA and MA by applying a smoothing spline with a smoothing parameter p=0.999 to the total of Cant values calculated from POS533 data in each archipelago (Figure 7A). The smoothing spline provided vertical profiles well-fitted to the calculated Cant values (r2>0.98) and with standard error of estimate of 0.12 µmol kg-1 for CV, 0.03 µmol kg-1 for CA and 0.06 µmol kg-1 for MA. The entry of Cant into the ocean through air-sea exchange and the large time scales of mixing processes explained the highest Cant values in near-surface waters and its decrement with depth (Sabine et al., 2004). The range of variation of Cant in the first 250 depths was lower in CA and MA (between 65 and 83 µmol kg-1) compared with CV (40-87 µmol kg-1). These differences in the upper water column distribution of Cant were related to differences in the exposition time of waters to the atmosphere and to the Revelle factor (Revelle and Suess, 1957; Takahashi et al., 1993), which value is inversely proportional to the capacity of oceans to uptake atmospheric CO2. The lower ventilation rates of the ocean interior in the tropical Northeast Atlantic (Karstensen et al., 2008; Stramma et al., 2008b) and slightly higher (in average) Revelle factors in CV-N and CV-SE (10.77 ± 1.76 and 11.06 ± 2.02, respectively) compared to CA-W, CA-E and MA (10.14 ± 0.23, 10.28 ± 0.42 and 10.34 ± 0.42, respectively) explained the strongest decrease of Cant with depth in CV (Figure 7A).
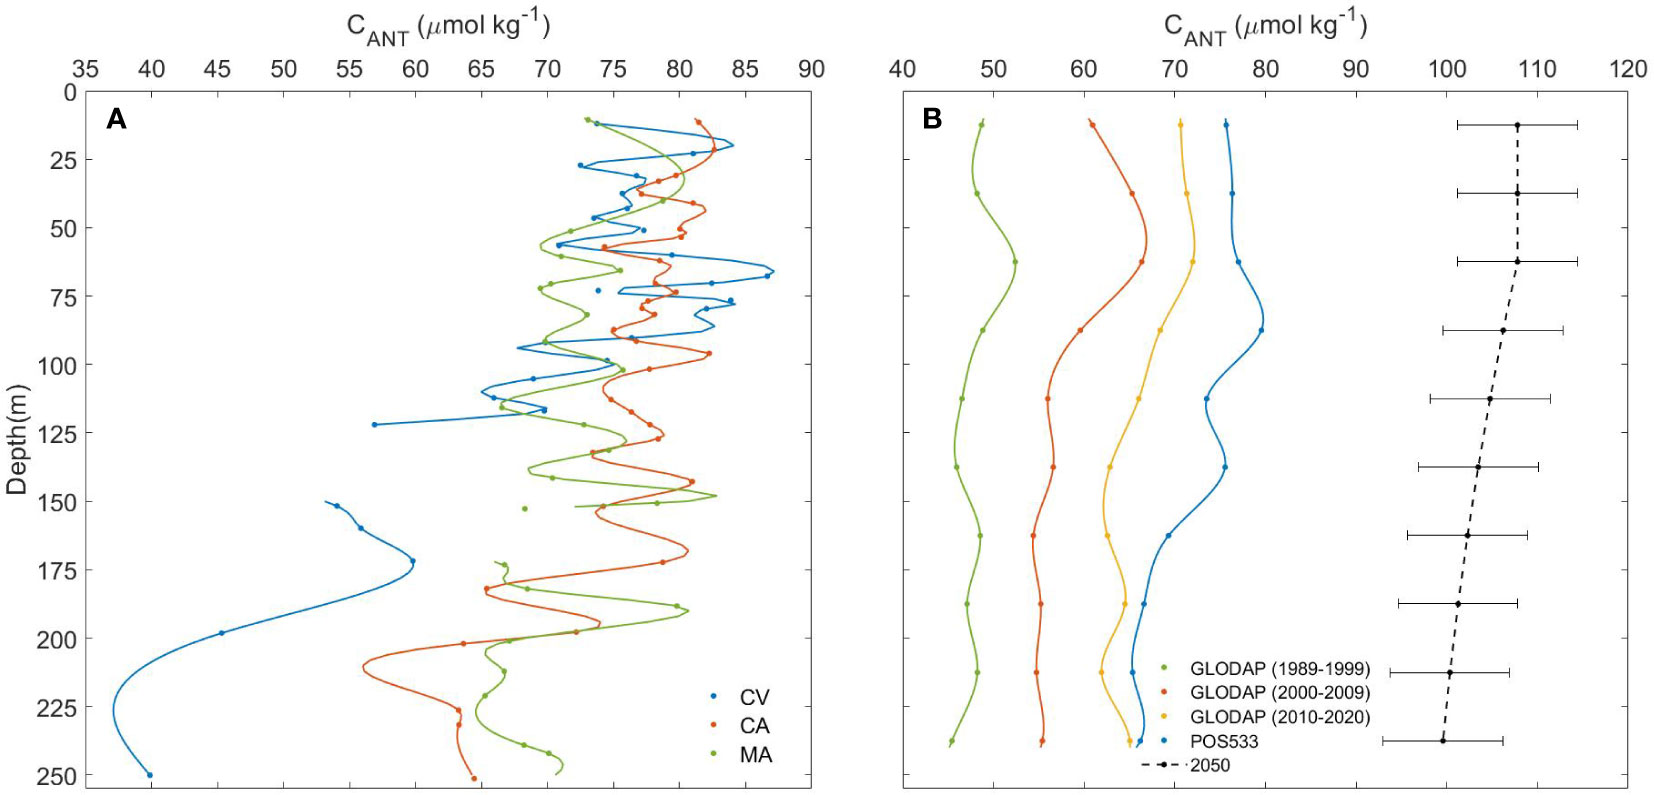
Figure 7 (A) Vertical upper-ocean profiles (10-250 m depth) of Cant in CV (blue), CA (orange) and MA (green) given by a smoothing spline (smoothing parameter: p=0.999) applied to the total of Cant values calculated from POS533 data in each archipelago. Due to the high quantity of Cant data at several depth levels, only average data per ±4 m depth were plotted as marker points. (B) Vertical upper-ocean distribution (10-250 m depth) of average Cant values in the entire Macaronesia region based on GLODAP data for the decades 1989-1999 (green), 2000-2009 (orange) and 2010-2020 (yellow). The vertical profiles of average Cant based on GLODAP data for these three decades were plotted together with average Cant values for the three archipelagos of study during POS533 (blue) for the three archipelagos. The GLODAP and POS533 datasets were compilated to estimate the Cant for the year 2050 (black dotted line) by using Eq. 11 with a standard error of estimate of 6.60 µmol kg-1. All the average Cant values, its standard deviation and the estimated values for the year 2050 at each level depth are shown in Supplementary Table 1.
The upper water-column inventory of Cant in the sampled stations was calculated by integrating its vertical distribution through the first 250 m depth. The Cant storage in the subsurface waters of CV, CA and MA was 7.57 x 10³, 9.26 x 10³ and 8.86 x 10³ µmol kg-1, respectively. The Cant storage downwind of each archipelago was calculated by considering the leeward area that encloses all the stations of CV (8,570 Km2), CA (7,960 Km2) and MA (1,250 Km2) and the neutral density of 26.0 kg m-3 for (sub)surface waters (Sabine et al., 2004). The total amount of Cant stored in the upper water column leeward of CV, CA and MA was 0.51, 0.58 and 0.09 Tg C (1 Tg = 1012 g), respectively.
These results were compared with Cant values calculated from 9,870 GLODAP data available for the Macaronesian region during the period 1989-2020. The vertical distribution in subsurface waters of both POS533 and GLODAP Cant values was analysed by averaging the data every 25 m depth (Figure 7B). The GLODAP Cant values in the first 250 m depth of the Macaronesian region increased on average by 10.47 ± 3.38 µmol kg-1 from 1989-1999 to 2000-2009 and by 8.08 ± 1.68 µmol kg-1 from 2000-2009 to 2010-2020, which were in agreement with those of CT and Cant in the subtropical North Atlantic during the periods 1992-1998 (8.8 ± 0.5 and 8.0 ± 0.2 µmol kg-1, respectively) and 1998-2004 (8.6 ± 0.5 and 6.8 ± 0.3 µmol kg-1, respectively) (Brown et al., 2010) and in the ESTOC site between 1995 and 2004 (9.4 and 8.1 µmol kg-1 over a decade in surface and 200 m depth waters, respectively) (González-Dávila et al., 2010). It indicated that the physical and biological conditions could be assumed as constants and that the increase in CT in the Macaronesian region is mainly driven by the rate of Cant uptake by the ocean (González-Dávila et al., 2010).
The average Cant inventory in the first 250 m depth of the Macaronesian open-ocean waters based on GLODAP data was 5.78 x 10³ µmol kg-1 for 1989-1999, 7.03 x 10³ µmol kg-1 for 2000-2009 and 7.99 x 10³ µmol kg-1 for 2010-2020. A higher Cant inventory was encountered during POS533 around the CV, CA and MA archipelagos (8.74 x 10³ µmol kg-1), which proves the relevance of shallow coastal waters in Cant storing. The interannual change of Cant in the subsurface Macaronesian region was assessed at any given depth by compilating the POS533 (2019) and the GLODAP (1989-2020) databases and applying a multiparametric regression statistically significance at 95% level (ρ value< 0.05) with a standard error of estimate of 6.60 µmol kg-1 (Eq. 11; r2 = 0.68). An increase in Cant of ~57% is expected for the year 2050 (Figure 7B), with total storage between 10 and 250 m depth in the Macaronesian region of 1.25 x 10³ µmol kg-1.
An area in the subtropical Northeast Atlantic of 5.4 x 10³ km2 was considered to calculate the total amount of Cant in the first 250 m depth of the entire Macaronesian region. The Cant inventories in this parcel of water were 0.24 Pg C (1 Pg = 1015 g) for the period 1989-1999, 0.30 Pg C for the period 2000-2009 and 0.34 Pg C for the period 2010-2020. The Cant inventory estimated for the year 2050 was 0.53 Pg C.
The spatial distribution of FCO2 was analysed based on changes in the ΔfCO2, the wind speed and the solubility (linked with temperature) to evaluate the air-sea CO2 exchange in the Macaronesian region during winter (Figures 8, 9). The atmospheric CO2 uptake was found to dominate over outgassing processes at this time of the year, coinciding with the CO2 sink behaviour encountered in the Northeast Atlantic during the cold months (González-Dávila et al., 2003; Curbelo-Hernández et al., 2021).
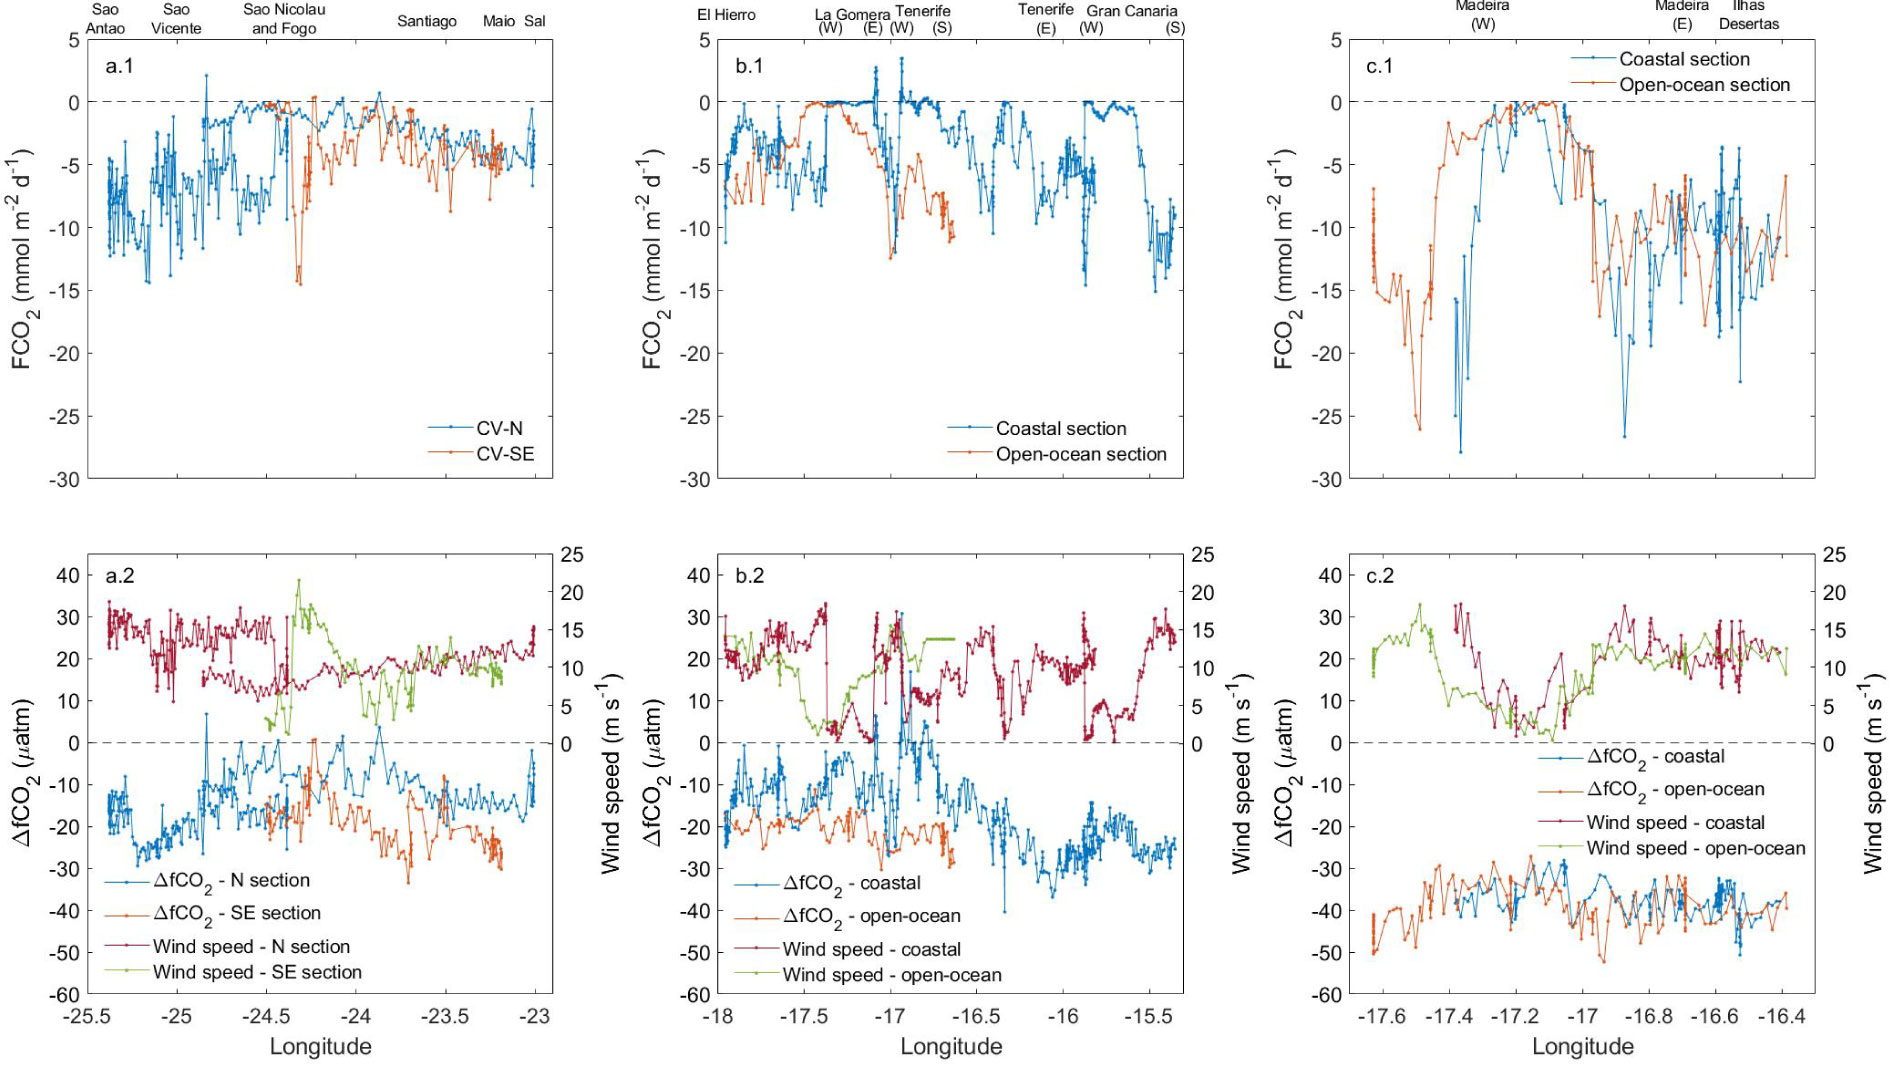
Figure 8 Longitudinal distribution of FCO2, ΔfCO2 and wind speed in (A) CV, (B) CA and (C) MA.
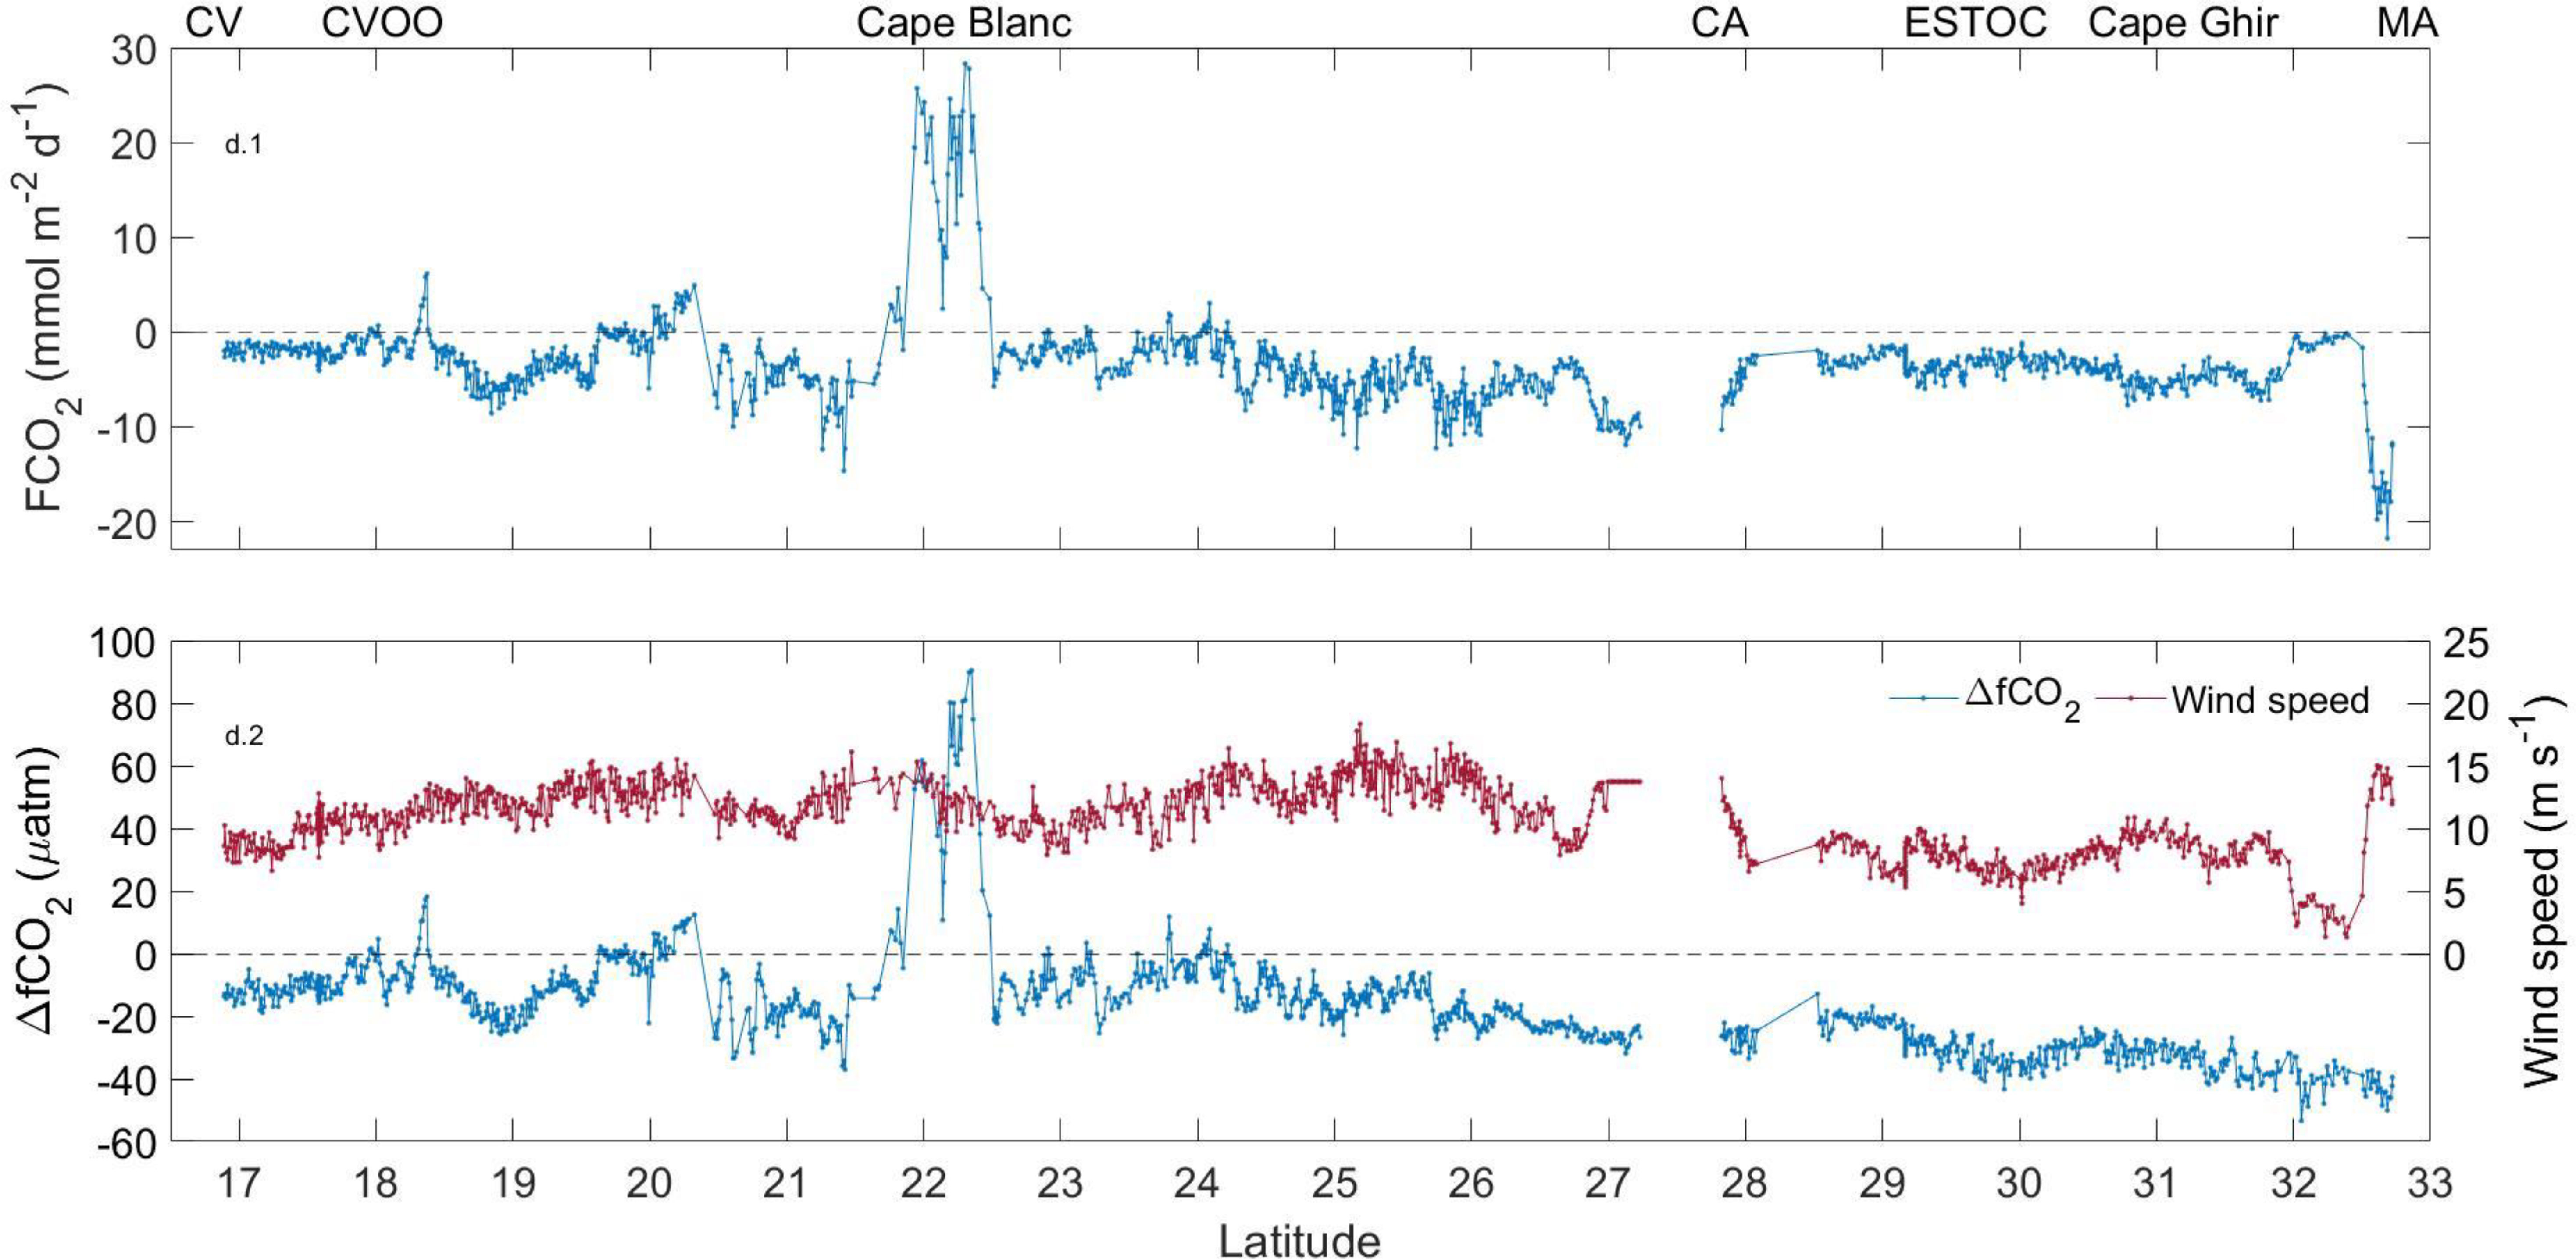
Figure 9 Latitudinal changes in FCO2, ΔfCO2 and wind speed along the CV-CA-MA transect.
The wind forcing has an important role in the variability of the surface physical and biogeochemical properties by controlling the spatio-temporal changes in the intensity of the African coastal upwelling and contributing to the formation of mesoscale eddies. The intense trade winds run the injection of cold deep-water in the surface layers favouring the solubility of the atmospheric CO2. It explained the high ingassing rates encountered in areas most exposed to wind stress between Sao Antao and Sao Vicente in CV-N, in inter-island waters of CA and southwest of Madeira (Figure 8), where the wind speed reached 15-20 m s-1. It shows the relevance of the climatology on the air-sea exchange. However, the wind speed is only directly involved in the CO2 gas transfer and influences the intensity of the ingassing/outgassing processes, while the formation of CO2 source/sink is controlled by changes in ΔfCO2 throughout the Macaronesian region (Figures 8, 9).
The average winter ingassing rate in MA (-8.34 mmol m-2d-1) was twice that of CV (-4.74 mmol m-2d-1) and CA (-3.90 mmol m-2d-1), which could be explained by its colder surface waters favouring CO2 solubility and by the lower influence of both the coastal upwelling and the arrival of CO2-rich surface filaments due to its furthest location from the African coast. However, the leeward side of the MA region showed the strongest spatial variability in the air-sea CO2 exchange (Figure 8C) due to the highly heterogeneous interaction between the atmosphere and the surface ocean in this area (Pullen et al., 2017), with FCO2 ranged between 0 and -28 mmol m-2d-1. These spatial differences were weaker south of CA (between 3 and -15 mmol m-2d-1; Figure 8B) and CV (between 0 and -15 mmol m-2d-1; Figure 8A), where the vertical movement of water in the core of the island-induced eddies influenced the changes of the ingassing/outgassing rates. The upwelling of deep CO2-rich water in cyclonic eddies decreases the absolute value of ΔfCO2 and weakened the ingassing, while the opposite occurs in anticyclonic eddies through the Canary Eddy Corridor (Sangrà et al., 2009) and downwind of Cape Verde (Cardoso et al., 2020). These deep-water rise movements caused surface fCO2,sw to exceed fCO2,atm (the ΔfCO2 became positive), which indicate in several locations between CV and Cape Blanc and south of CA that behaved as a CO2 source. The maximum outgassing was detected at the Cape Blanc latitude (20-25 mmol m-2d-1) (Figure 9) and was explained by the offshore transport of cold but high CO2-saturated waters through the giant Cape Blanc filament (Bonino et al., 2020; Gabric et al., 1993; Lovecchio et al., 2017).
The FCO2 coastal values during POS533 were compared with FCO2 calculated for the entire Macaronesian region (13-36°N, 6-30°W) by using winter SOCAT fCO2,sw data referred to 2019 (an interannual increase of 1.8 µatm per elapsed year was considered; Bates et al., 2014). The fCO2,atm data used in this calculation were collected at the Izaña Atmospheric Research Center (Tenerife, Canary Islands) and provided by the Agencia Estatal de Meteorología (AEMET). The satellite surface ocean 6-hourly and 0.25° grid wind speed data are derived from the Advanced Scatterometer (ASCAT) and provided by the IFREMER-CERSAT. The average FCO2 and ΔfCO2 through the monitored vessel track during POS533 were -4.40 mmol m-2 d-1 and -19.5 µatm, respectively. This ingassing rate was considerably higher than that obtained throughout the entire Macaronesian region based on SOCAT data (-0.53 mmol m-2 d-1 and -5.6 µatm, respectively). It is indicative of a stronger winter CO2 sink in island shelves compared to open-ocean areas in the Northeast Atlantic (Figures 8, 9). Similar behaviour was determined in previous studies of the air-sea exchange in other coastal regions and continental shelves (e. g. Borges et al., 2005; Borges et al., 2006; Cai et al., 2006; Chen and Borges, 2009; Laruelle et al., 2010; Cai, 2011; Chen et al., 2013; Laruelle et al., 2013; Laruelle et al., 2018). The POS533 and SOCAT databases were compilated to analyse the air-sea CO2 exchange in each archipelago and in the entire Macaronesian region. The total FCO2 data available was well-fitted (r2 = 0.76) to a multiparametric regression statistically significance at 95% level (ρ value< 0.05) given by Eq. 12 to assess the variability of the air-sea CO2 exchange and the different factors involved in it. The latitudinal and longitudinal distribution of FCO2 and the changes in the physical properties of the surface ocean (SST and SSS), in the climatology (wind speed) and in the ΔfCO2 were considered. This equation fits the winter air-sea exchange in the Macaronesian region and can be used to estimate the FCO2 with a standard error of estimate of 1.80 mmol m-2 d-1.
The winter average FCO2 for the ocean area of CV (186,000 Km2), CA (145,000 Km2) and MA (40,250 Km2) were -11.42, -12.40 and -4.45 Gg CO2 d-1 (1 Gg = 109 g), respectively. The entire ocean area of the Macaronesian region (4,190,000 Km2) acted as a CO2 sink during the cold months, with an average FCO2 of -107.30 Gg CO2 d-1. Thus, the winter ingassing rate of the archipelagic ocean waters of CV, CA and MA represented 26.4% of the atmospheric CO2 absorbed by the ocean in the Macaronesian region despite occupying only 8.9% of its total ocean area. These results highlighted the relevance of coastal regions and inter-island waters on atmospheric CO2 uptake as well as the importance of their incorporation in regional and global-scale biogeochemical studies. The assessment of the FCO2 in this study improved the knowledge of the air-sea exchange in the Northeast Atlantic.
The CO2 cycle was evaluated in (sub)surface coastal transitional, archipelagic and open-ocean waters of the Macaronesian region. The spatial heterogeneity in the intensity of the Canary Upwelling System and the southernmost position of the CVFZ in winter introduced latitudinal differences in the physical and biogeochemical properties. The non-thermal processes were found to have high relevance in tropical waters south of Cape Blanc, where the MLD reaches its shallowest position and the African coastal upwelling shows its maximum intensity at this time of the year. The biological uptake in this region decreased the high surface CO2 content expected in this warm area and controlled the fCO2,sw distribution. The opposite occurred north of Cape Blanc where the non-thermal processes do not compensate the northward decrease of fCO2,sw drove by the cooling of the surface water. The advective processes were found to have high relevance in the spatial distribution of CO2 through the area of maximum intensity of the coastal upwelling and represent an important source of local variability in the core of mesoscale eddies generated leeward of each archipelago. The strongest injection of deep CO2-rich and low-productive waters in surface layers near Cape Blanc and its offshore recirculation through the NEC explained the maximum surface fCO2,sw and minimum pH values in the entire Macaronesian region. The contribution of these horizontal and vertical transports were lower north of Cape Blanc due to the weakening in the intensity of the coastal upwelling and filaments (Supplementary Figure 4). The vertical mixing processes were also an important source of local variability in the core of mesoscale eddies generated leeward of each archipelago. The high spatial variability of fCO2,sw in the Macaronesian region was evaluated by compilating the POS533 collected data with the SOCAT and GLODAP databases. A new set of equations was provided in this study to describe the temporal and longitudinal variability of fCO2,sw based on temperature and salinity fluctuations (Table 2).
The input and storage of Cant in the (sub)surface archipelagic waters was the main driver of the average increase in NCT from NCTpre accounting for 60.0% in CV-N, 64.2% in CV-SE, 88.2% in CA-W, 84.7% in CA-E and 86.4% in MA. The contribution of the Cant uptake was higher than 90% above the MLD throughout leeward coastal areas of the three archipelagos and higher than 78% below the MLD in CA and MA. The lowest changes in NCT explained by Cant storing below the MLD were found in CV (42.3-47.4%), where the capacity of the ocean interior to sequestrate Cant was lower and the contribution of the organic carbon pump was higher (52.3-57.4%). The maximum average contribution of the organic carbon pump was encountered in CV-N and CV-SE (36.6 and 40.9%, respectively) and explained the high stratification and low ventilation of the tropical waters weakening the mixed down processes and enhancing remineralization. The average contribution of the organic carbon pump fell to 7.5-11.6% toward the low-stratified and well-ventilated subtropical waters around CA and MA. The role of the carbonate pump in the change of NCT was found to be minimal in the entire Macaronesian region (0.8-4.2% on average).
The Cant inventory in coastal waters leeward of the Macaronesian archipelagos was analysed for the first-time in this study and compared with Northeast Atlantic open-ocean data available in the GLODAP database. The important role of coastal areas in the Cant storing was shown in higher average Cant values obtained leeward of the islands based on POS533 data (8.74 x 10³ µmol kg-1) than in open-ocean waters based on GLODAP data between 2010 and 2020 (7.99 x 10³ µmol kg-1). The POS533 and GLODAP databases were compilated to consider the coastal areas in the calculation of the average upper-ocean Cant inventory in an area of 5.4 x 10³ km2 in the Macaronesian region (0.34 Pg C). The amount of Cant was described by a new polynomial equation which described its distribution as a function of time and depth changes and that can be used to estimate the Cant values between 10 and 250 m depth in the Macaronesia region with a standard error of estimate of 6.60 µmol kg-1.
The analysis of the air-sea CO2 exchange showed that the CO2 sink behaviour dominated the outgassing processes in the entire study region at this time of the year. The average FCO2 calculated for the monitored transect based on POS533 data (-4.40 mmol m-2 d-1) and for the entire Macaronesian region based on SOCAT data referred to 2019 (-0.53 mmol m-2 d-1) showed the higher-intense ingassing rate in island shelves compared to open-ocean areas and proved the need of include coastal regions in air-sea CO2 exchange evaluations. The winter average FCO2 calculated for the total ocean area of the three archipelagos (371,250 Km2) was -28.27 Gg CO2 d-1, which represented the 26.4% of the winter ingassing rate calculated for the ocean area of the Macaronesian region (4,190,000 Km2, -107.30 Gg CO2 d-1).
The analysis of the CO2 distribution, the Cant inventory and the air-sea CO2 exchange developed in this investigation allows a better understanding of the role in the climate change of archipelagic waters, coastal regions and island/continental shelves. The high relevance of these areas in the ingassing/outgassing processes, Cant uptake and storing and (sub)surface distribution of the CO2 system variables of the entire Macaronesian region were evaluated and highlighted the importance of developing new regional scale studies to include these areas in global models. The monitoring and assessment of the CO2 variability in these biogeochemical active and exposed to human-pressure areas, especially in ultraperipherical populated territories with large areas covered by the ocean such as the archipelagos of the Macaronesia, powerfully contributes to the achievement of the goals indicated in the most recent IPCC reports 2007 and 2021 (IPCC, 2007; 2021).
The datasets presented in this study can be found in online repositories. The names of the repository/repositories and accession number(s) can be found below: PANGAEA data repository (https://www.pangaea.de/).
Sampling and CO2 variables measurements were performed by MG-D and JMS-C during the POS533 cruise (AIMAC project). All authors contributed to the article and approved the submitted version.
This study received funding from the European Union’s Horizon 2020 research and innovation program under grant agreement N° 820989 (project COMFORT, our common future ocean in the Earth system–quantifying coupled cycles of carbon, oxygen, and nutrients for determining and achieving safe operating spaces with respect to tipping points). The European Commission and their executive agency are not responsible for any use that may be made of the information the work contains. The POS533 cruise was funded by the GEOMAR through the AIMAC project. This work also received partial funding from the European Union INTERREG V-A MAC 2014-2020 projects RES-COAST MAC3/3.5b/314 and PLANCLIMAC MAC2/3.5b/244. The participation of DC-H was funded by the PhD grant PIFULPGC-2020-2 ARTHUM-2.
We want to express our gratitude to Dr. Birgit Quack from GEOMAR for inviting us to participate in the AIMAC project. We are grateful to the RV Poseidon crew for the support during the cruise. Special thanks to Rui Caldeira, Cátia Acevedo, Claudio Cardoso, Ricardo Faria and Jesus Reis from the Oceanic Observatory of Madeira for the CTD-deployments and data and to Kastriot Qelaj for the nutrient analysis. We would like to thank the supporters, collaborators and many researchers responsible for the collection of data and quality control behind the Surface Ocean CO2 Atlas (SOCAT) and the Global Ocean Data Analysis Project (GLODAP). Both are international efforts, endorsed by the International Ocean Carbon Coordination Project (IOCCP), the Surface Ocean Lower Atmosphere Study (SOLAS) and the Integrated Marine Biosphere Research (IMBeR) program, to deliver a uniformly quality-controlled surface ocean CO2 database (SOCAT) and surface-to-bottom carbon variables database (GLODAP).
The authors declare that the research was conducted in the absence of any commercial or financial relationships that could be construed as a potential conflict of interest.
All claims expressed in this article are solely those of the authors and do not necessarily represent those of their affiliated organizations, or those of the publisher, the editors and the reviewers. Any product that may be evaluated in this article, or claim that may be made by its manufacturer, is not guaranteed or endorsed by the publisher.
The Supplementary Material for this article can be found online at: https://www.frontiersin.org/articles/10.3389/fmars.2023.1094250/full#supplementary-material
Anderson L. A., Sarmiento J. L. (1994). Redfield ratios of remineralization determined by nutrient data analysis. Global Biogeochemical Cycles. 8, 65–80. doi: 10.1029/93GB03318
Andreev A. G., Chen C. T. A., Watanabe S. (2009). Calculation methods and the distribution of anthropogenic variations of pH values in the pacific subarctic. Oceanology 49, 418–428. doi: 10.1134/S000143700903014X
Arnone V., González-Santana D., González-Dávila M., González A. G., Santana-Casiano J. M. (2022). Iron and copper complexation in macaronesian coastal waters. Mar. Chem. 240, 104087. doi: 10.1016/j.marchem.2022.104087
Bakker D. C. E., Pfeil B., Landa C. S., Metzl N., O'Brien K. M., Olsen A., et al. (2016). Surface ocean CO2 atlas (SOCAT). PANGAEA. doi: 10.1594/PANGAEA.849770
Barton E. D., Arístegui J., Tett P., Navarro-Pérez E. (2004). Variability in the canary islands area of filament-eddy exchanges. Prog. Oceanogr. 62, 71–94. doi: 10.1016/J.POCEAN.2004.07.003
Bates N. R., Astor Y. M., Church M. J., Currie K., Dore J. E., González-Dávila M., et al. (2014). A time-series view of changing surface ocean chemistry due to ocean uptake of anthropogenic CO2 and ocean acidification. Oceanography 27, 126–141. doi: 10.5670/oceanog.2014.16
Benitez-Nelson C. R. (2000). The biogeochemical cycling of phosphorus in marine systems. Earth-Science Rev. 51, 109–135. doi: 10.1016/S0012-8252(00)00018-0
Bonino G., Lovecchio E., Gruber N., Münnich M., Masina S., Iovino D. (2021). Drivers and impact of the seasonal variability of the organic carbon offshore transport in the canary upwelling system. Biogeosciences 18, 2429–2448. doi: 10.5194/BG-18-2429-2021
Borges A. V., Delille B., Frankignoulle M. (2005). Budgeting sinks and sources of CO2 in the coastal ocean: Diversity of ecosystem counts. Geophys. Res. Lett. 32, 1–4. doi: 10.1029/2005GL023053
Borges A. V., Schiettecatte L. S., Abril G., Delille B., Gazeau F. (2006). Carbon dioxide in European coastal waters. Estuar. Coast. Shelf Sci. 70, 375–387. doi: 10.1016/j.ecss.2006.05.046
Brown P. J., Bakker D. C. E., Schuster U., Watson A. J. (2010). Anthropogenic carbon accumulation in the subtropical north Atlantic. J. Geophys. Res. Ocean. 115, 1–20. doi: 10.1029/2008JC005043
Cai W. J. (2011). Estuarine and coastal ocean carbon paradox: CO2 sinks or sites of terrestrial carbon incineration? Ann. Rev. Mar. Sci. 3, 123–145. doi: 10.1146/annurev-marine-120709-142723
Cai W. J., Dai M., Wang Y. (2006). Air-sea exchange of carbon dioxide in ocean margins: A province-based synthesis. Geophys. Res. Lett. 33 (12). doi: 10.1029/2006GL026219
Cardoso C., Caldeira R. M. A., Relvas P., Stegner A. (2020). Islands as eddy transformation and generation hotspots: Cabo Verde case study. Prog. Oceanogr. 184, 102271. doi: 10.1016/j.pocean.2020.102271
Carpenter J. H. (1965). The accuracy of the winkler method for dissolved oxygen analysis. Limnol. Oceanogr. 10, 135–140. doi: 10.4319/lo.1965.10.1.0135
Carrit D. E., Carpenter J. H. (1966). Recommendation procedure for winkler analysis of seawater for dissolved oxygen. J. Mar. Res. 24, 313–318.
Chen C. T. A., Borges A. V. (2009). Reconciling opposing views on carbon cycling in the coastal ocean: Continental shelves as sinks and near-shore ecosystems as sources of atmospheric CO2. Deep. Res. Part II Top. Stud. Oceanogr. 56, 578–590. doi: 10.1016/j.dsr2.2009.01.001
Chen C. T. A., Huang T. H., Chen Y. C., Bai Y., He X., Kang Y. (2013). Air-sea exchanges of coin the world’s coastal seas. Biogeosciences 10, 6509–6544. doi: 10.5194/bg-10-6509-2013
Chen G. T., Millero F. J. (1979). Gradual increase of oceanic CO2. Nature. 277, 205–206. doi: 10.1038/277205A0
Chou W. C., Sheu D. D., Lee B. S., Tseng C. M., Chen C. T. A., Wang S. L., et al. (2007). Depth distributions of alkalinity, TCO2 and δ13CTCO2 at SEATS time-series site in the northern south China Sea. Deep. Res. Part II Top. Stud. Oceanogr. 54, 1469–1485. doi: 10.1016/j.dsr2.2007.05.002
Clayton T. D., Byrne R. H. (1993). Spectrophotometric seawater pH measurements: total hydrogen ion concentration scale calibration of m-cresol purple and at-sea results. Deep Sea Res. Part I Oceanogr. Res. Pap. 40, 2115–2129. doi: 10.1016/0967-0637(93)90048-8
Couvelard X., Caldeira R. M. A., Araújo I. B., Tomé R. (2012). Wind mediated vorticity-generation and eddy-confinement, leeward of the Madeira island: 2008 numerical case study. Dyn. Atmos. Ocean. 58, 128–149. doi: 10.1016/J.DYNATMOCE.2012.09.005
Cropper T. E., Hanna E., Bigg G. R. (2014). Spatial and temporal seasonal trends in coastal upwelling off Northwest africa 1981-2012. Deep. Res. Part I Oceanogr. Res. Pap. 86, 94–111. doi: 10.1016/j.dsr.2014.01.007
Culberson C. H., Huang S. (1987). Automated amperometric oxygen titration. Deep Sea Res. Part A. Oceanogr. Res. Pap. 34, 875–880. doi: 10.1016/0198-0149(87)90042-2
Curbelo-Hernández D., González-Dávila M., González A. G., González-Santana D., Santana-Casiano J. M. (2021). CO2 fluxes in the northeast Atlantic ocean based on measurements from a surface ocean observation platform. Sci. Total Environ. 775, 145804. doi: 10.1016/j.scitotenv.2021.145804
Davenport R., Neuer S., Helmke P., Perez-Marrero J., Llinas O. (2002). Primary productivity in the northern canary islands region as inferred from SeaWiFS imagery. Deep. Res. Part II Top. Stud. Oceanogr. 49, 3481–3496. doi: 10.1016/S0967-0645(02)00095-4
Davenport R., Neuer S., Hernandez-Guerra A., Rueda M. J., Llinas O., Fischer G., et al. (1999). Seasonal and interannual pigment concentration in the canary islands region from CZCS data and comparison with observations from the ESTOC. Int. J. Remote Sens. 20, 1419–1433. doi: 10.1080/014311699212803
Dickson A. G. (1990). Standard potential of the reaction: AgCl(s) + 12H2(g) = ag(s) + HCl(aq), and and the standard acidity constant of the ion HSO4- in synthetic sea water from 273.15 to 318.15 K. J. Chem. Thermodyn. 22, 113–127. doi: 10.1016/0021-9614(90)90074-Z
Dickson A. G., Goyet C. (1994). Handbook of methods for the analysis of the various parameters of the carbon dioxide system in sea water. version 2. (Oak Ridge, TN (United States): Oak Ridge National Lab. (ORNL)). doi: 10.2172/10107773
Faye S., Lazar A., Sow B. A., Gaye A. T. (2015). A model study of the seasonality of sea surface temperature and circulation in the Atlantic north-eastern tropical upwelling system. Front. Phys. 3. doi: 10.3389/FPHY.2015.00076/BIBTEX
Feely R. A., Sabine C. L., Lee K., Berelson W., Kleypas J., Fabry V. J., et al. (2004). Impact of anthropogenic CO2 on the CaCO3 system in the oceans. Science. 305 (5682), 362–366. doi: 10.1126/SCIENCE.1097329
Feely R. A., Sabine C. L., Lee K., Millero F. J., Lamb M. F., Greeley D., et al. (2002). In situ calcium carbonate dissolution in the pacific ocean. Global Biogeochem. Cycles 16, 91-1-91–12. doi: 10.1029/2002gb001866
Fiedler B., Fietzek P., Vieira N., Silva P., Bittig H. C., Körtzinger A. (2013). In situ CO2 and O2 measurements on a profiling float. J. Atmos. Ocean. Technol. 30, 112–126. doi: 10.1175/JTECH-D-12-00043.1
Fiedler B., Grundle D. S., Schütte F., Karstensen J., Löscher C. R., Hauss H., et al. (2016). Oxygen utilization and downward carbon flux in an oxygen-depleted eddy in the eastern tropical north Atlantic. Biogeosciences 13, 5633–5647. doi: 10.5194/bg-13-5633-2016
Gabric A. J., Garcia L., Van Camp L., Nykjaer L., Eifler W., Schrimpf W. (1993). Offshore export of shelf production in the cape blanc (Mauritania) giant filament as derived from coastal zone color scanner imagery. J. Geophys. Res. Ocean. 98, 4697–4712. doi: 10.1029/92JC01714
García-Muñoz M., Arístegui J., Montero M. F., Barton E. D. (2004). Distribution and transport of organic matter along a filament-eddy system in the canaries - NW Africa coastal transition zone region. Prog. Oceanogr. 62, 115–129. doi: 10.1016/j.pocean.2004.07.005
García-Muñoz M., Arístegui J., Pelegrí J. L., Antoranz A., Ojeda A., Torres M. (2005). Exchange of carbon by an upwelling filament off cape ghir (NW Africa). J. Mar. Syst. 54, 83–95. doi: 10.1016/J.JMARSYS.2004.07.005
González-Dávila M., Santana-Casiano J. M., De Armas D., Escánez J., Suarez-Tangil M. (2006). The influence of island generated eddies on the carbon dioxide system, south of the canary islands. Mar. Chem. 99, 177–190. doi: 10.1016/j.marchem.2005.11.004
González-Dávila M., Santana-Casiano J. M., Machín F. (2017). Changes in the partial pressure of carbon dioxide in the Mauritanian-cap vert upwelling region between 2005 and 2012. Biogeosciences 14, 3859–3871. doi: 10.5194/bg-14-3859-2017
González-Dávila M., Santana-Casiano J. M., Petihakis G., Ntoumas M., Suárez de Tangil M., Krasakopoulou E. (2016). Seasonal pH variability in the saronikos gulf: A year-study using a new photometric pH sensor. J. Mar. Syst. 162, 37–46. doi: 10.1016/j.jmarsys.2016.03.007
González-Dávila M., Santana-Casiano J. M., Prêcheur-Massieu H. (2014). New pH sensor for monitoring ocean acidification. Sea Technol. 55, 36–40.
González-Dávila M., Santana-Casiano J. M., Rueda M. J., Llinás O. (2010). The water column distribution of carbonate system variables at the ESTOC site from 1995 to 2004. Biogeosciences 7, 3067–3081. doi: 10.5194/bg-7-3067-2010
González-Dávila M., Santana-Casiano J. M., Rueda M.-J., Llinás O., González-Dávila E.-F. (2003). Seasonal and interannual variability of sea-surface carbon dioxide species at the European station for time series in the ocean at the canary islands (ESTOC) between 1996 and 2000. Global Biogeochem. Cycles 17, (3). doi: 10.1029/2002gb001993
Grasshoff K., Kremling K., Ehrhardt M. (1999). Methods of seawater analysis. 3rd ed. (Germany: Wiley). doi: 10.1002/9783527613984
Hagen E., Zülicke C., Feistel R. (1996). Near-surface structures coastal upwelling filament north west Africa watcr mass eddy in the cape ghir filament off Morocco. Oceanol. Acta 19, 577–598. Available at: https://archimer.ifremer.fr/doc/00096/20728/.
Huntsman S. A., Barber R. T. (1977). Primary production off northwest Africa: The relationship to wind and nutrient conditions. Deep. Res. 24, 25–33. doi: 10.1016/0146-6291(77)90538-0
Jewell P. W. (1994). Mass balance models of ekman transport and nutrient fluxes in coastal upwelling zones. Global Biogeochem. Cycles 8, 165–177. doi: 10.1029/94GB00097
Karstensen J., Fiedler B., Schütte F., Brandt P., Körtzinger A., Fischer G., et al. (2015). Open ocean dead zones in the tropical north Atlantic ocean. Biogeosciences 12, 2597–2605. doi: 10.5194/bg-12-2597-2015
Karstensen J., Schütte F., Pietri A., Krahmann G., Fiedler B., Grundle D., et al. (2017). Upwelling and isolation in oxygen-depleted anticyclonic modewater eddies and implications for nitrate cycling. Biogeosciences 14, 2167–2181. doi: 10.5194/BG-14-2167-2017
Karstensen J., Stramma L., Visbeck M. (2008). Oxygen minimum zones in the eastern tropical Atlantic and pacific oceans. Prog. Oceanogr. 77, 331–350. doi: 10.1016/J.POCEAN.2007.05.009
Key R. M., Olsen A., van Heuven S., Lauvset S. K., Velo A., Lin X., et al. (2015). “Global ocean data analysis project, version 2 (GLODAPv2), ORNL/CDIAC-162, NDP-093,” in Carbon dioxide information analysis center (Oak Ridge, Tennessee: Oak Ridge National Laboratory, US Department of Energy). doi: 10.3334/CDIAC/OTG.NDP093_GLODAPv2
Khatiwala S., Tanhua T., Mikaloff Fletcher S., Gerber M., Doney S. C., Graven H. D., et al. (2013). Global ocean storage of anthropogenic carbon. Biogeosciences 10, 2169–2191. doi: 10.5194/bg-10-2169-2013
Lachkar Z., Gruber N. (2013). Response of biological production and air–sea CO2 fluxes to upwelling intensification in the California and canary current systems. J. Mar. Syst. 109–110, 149–160. doi: 10.1016/J.JMARSYS.2012.04.003
Laiz I., Pelegrí J. L., Machín F., Sangrá P., Hernández-Guerra A., Marrero-Díaz A., et al. (2012). Eastern Boundary drainage of the north Atlantic subtropical gyre. Ocean Dyn. 62, 1287–1310. doi: 10.1007/s10236-012-0560-6
Laruelle G. G., Cai W. J., Hu X., Gruber N., Mackenzie F. T., Regnier P. (2018). Continental shelves as a variable but increasing global sink for atmospheric carbon dioxide. Nat. Commun. 9, 454. doi: 10.1038/s41467-017-02738-z
Laruelle G. G., Dürr H. H., Lauerwald R., Hartmann J., Slomp C. P., Goossens N., et al. (2013). Global multi-scale segmentation of continental and coastal waters from the watersheds to the continental margins. Hydrol. Earth Syst. Sci. 17, 2029–2051. doi: 10.5194/hess-17-2029-2013
Laruelle G. G., Dürr H. H., Slomp C. P., Borges A. V. (2010). Evaluation of sinks and sources of CO2 in the global coastal ocean using a spatially-explicit typology of estuaries and continental shelves. Geophys. Res. Lett. 37 (15). doi: 10.1029/2010GL043691
Lázaro C., Fernandes M. J., Santos A. M. P., Oliveira P. (2005). Seasonal and interannual variability of surface circulation in the cape Verde region from 8 years of merged T/P and ERS-2 altimeter data. Remote Sens. Environ. 98, 45–62. doi: 10.1016/J.RSE.2005.06.005
Lee K., Kim T. W., Byrne R. H., Millero F. J., Feely R. A., Liu Y. M. (2010). The universal ratio of boron to chlorinity for the north pacific and north Atlantic oceans. Geochim. Cosmochim. Acta 74, 1801–1811. doi: 10.1016/j.gca.2009.12.027
Lee K., Tong L. T., Millero F. J., Sabine C. L., Dickson A. G., Goyet C., et al. (2006). Global relationships of total alkalinity with salinity and temperature in surface waters of the world’s oceans. Geophys. Res. Lett. 33, 1–5. doi: 10.1029/2006GL027207
Lovecchio E., Gruber N., Münnich M., Lachkar Z. (2017). On the long-range offshore transport of organic carbon from the canary upwelling system to the open north Atlantic. Biogeosciences 14, 3337–3369. doi: 10.5194/bg-14-3337-2017
Lueker T. J., Dickson A. G., Keeling C. D. (2000). Ocean pCO2 calculated from dissolved inorganic carbon, alkalinity, and equations for K1 and K2: Validation based on laboratory measurements of CO2 in gas and seawater at equilibrium. Mar. Chem. 70, 105–119. doi: 10.1016/S0304-4203(00)00022-0
Mayer D. A., Weisberg R. H. (1993). A description of COADS surface meteorological fields and the implied sverdrup transports for the Atlantic ocean from 30°S to 60°N. J. Phys. Oceanogr. 23, 2201–2221. doi: 10.1175/1520-0485(1993)023
Mehlmann M., Quack B., Atlas E., Hepach H., Tegtmeier S. (2020). Natural and anthropogenic sources of bromoform and dibromomethane in the oceanographic and biogeochemical regime of the subtropical north East Atlantic. Environ. Sci. Process. Impacts 22, 679–707. doi: 10.1039/c9em00599d
Meunier T., Barton E. D., Barreiro B., Torres R. (2012). Upwelling filaments off cap blanc: Interaction of the NW African upwelling current and the cape Verde frontal zone eddy field? J. Geophys. Res. Ocean. 117, 8031. doi: 10.1029/2012JC007905
Mintrop L., Pérez F. F., González-Dávila M., Santana-Casiano J. M., Körtzinger A. (2000). Alkalinity determination by potentiometry: Intercalibration using three different methods. Cienc. Mar. 26, 23–37. doi: 10.7773/cm.v26i1.573
Mittelstaedt E. (1983). The upwelling area off Northwest Africa–a description of phenomena related to coastal upwelling. Prog. Oceanogr. 12, 307–331. doi: 10.1016/0079-6611(83)90012-5
Mittelstaedt E. (1991). The ocean boundary along the northwest African coast: Circulation and oceanographic properties at the sea surface. Prog. Oceanogr. 26, 307–355. doi: 10.1016/0079-6611(91)90011-A
Ohde T., Fiedler B., Körtzinger A. (2015). Spatio-temporal distribution and transport of particulate matter in the eastern tropical north Atlantic observed by argo floats. Deep. Res. Part I Oceanogr. Res. Pap. 102, 26–42. doi: 10.1016/J.DSR.2015.04.007
Olsen A., Key R. M., van Heuven S., Lauvset S. K., Antón V., Lin X., et al. (2016). The global ocean data analysis project, version 2 (GLODAPv2) – an internally consistent data product for the world ocean. Earth Syst. Sci. Data 8 (2), 297–323. doi: 10.5194/essd-8-297-2016
Olsen A., Omar A. M., Jeansson E., Anderson L. G., Bellerby R. G. J. (2010). Nordic Seas transit time distributions and anthropogenic CO2. J. Geophys. Res. Ocean. 115, 1–14. doi: 10.1029/2009JC005488
Padin X. A., Vazquez-Rodriguez M., Castaao M., Velo A., Alonso-Perez F., Gago J., et al. (2010). Air-Sea CO2 fluxes in the atlantic as measured during boreal spring and autumn. Biogeosciences 7, 1587–1606. doi: 10.5194/bg-7-1587-2010
Park G. H., Lee K., Tishchenko P., Min D. H., Warner M. J., Talley L. D., et al. (2006). Large Accumulation of anthropogenic CO2 in the East (Japan) Sea and its significant impact on carbonate chemistry. Global Biogeochem. Cycles 20, 1–13. doi: 10.1029/2005GB002676
Pastor M. V., Pelegrí J. L., Hernández-Guerra A., Font J., Salat J., Emelianov M. (2008). Water and nutrient fluxes off Northwest Africa. Cont. Shelf Res. 28, 915–936. doi: 10.1016/j.csr.2008.01.011
Pelegrí J. L., Arístegui J., Cana L., González-Dávila M., Hernández-Guerra A., Hernández-León S., et al. (2005a). Coupling between the open ocean and the coastal upwelling region off northwest Africa: Water recirculation and offshore pumping of organic matter. J. Mar. Syst. 54, 3–37. doi: 10.1016/j.jmarsys.2004.07.003
Pelegrí J. L., Benazzouz A. (2015b). “Coastal upwelling off north-West Africa,” in Oceanographic and biological features in the canary current Large marine ecosystem, vol. 115 . Eds. Valdés L., Déniz-González I. (Paris. IOC Technical Series: IOC-UNESCO), 93–103. Available at: http://hdl.handle.net/1834/9180.
Pelegrí J. L., Marrero-Díaz A., Ratsimandresy A., Antoranz A., Cisneros-Aguirre J., Gordo C., et al. (2005b). Hydrographic cruises off northwest Africa: The canary current and the cape ghir region. J. Mar. Systems. 55 (1-4), 39–63. doi: 10.1016/j.jmarsys.2004.07.001
Pelegrí J. L., Peña-Izquierdo J. (2015a). “Eastern Boundary currents off north-West Africa,” in Oceanographic and biological features in the canary current Large marine ecosystem, vol. 115 . Eds. Valdés L., Déniz-González I. (IOC-UNESCO, Paris: IOC Technical Series), 81–92. Available at: http://hdl.handle.net/1834/9179.
Pérez F. F., Álvarez M., Ríos A. F. (2002). Improvements on the back calculation technique for estimating anthropogenic CO2. Deep. Res. Part I Oceanogr. Res. Pap. 49, 859–875. doi: 10.1016/S0967-0637(02)00002-X
Pérez-Rodríguez P., Pelegrí J. L., Marrero-Díaz A. (2001). Dynamical characteristics of the cape Verde frontal zone. Sci. Mar. 65, 241–250. doi: 10.3989/scimar.2001.65s1241
Pietri A., Karstensen J. (2018). Dynamical characterization of a low oxygen submesoscale coherent vortex in the Eastern north Atlantic ocean. J. Geophys. Res. Ocean. 123, 2049–2065. doi: 10.1002/2017JC013177
Pullen J., Caldeira R., Doyle J. D., May P., Tomé R. (2017). Modeling the air-sea feedback system of Madeira island. J. Adv. Model. Earth Syst. 9, 1641–1664. doi: 10.1002/2016MS000861
Revelle R., Suess H. E. (1957). Carbon dioxide exchange between atmosphere and ocean and the question of an increase of atmospheric CO2 during the past decades. Tellus A: Dynamic Meteorology Oceanography. 9 (1), 18–27. doi: 10.3402/tellusa.v9i1.9075
Romero O. E., Fischer G., Karstensen J., Cermeño P. (2016). Eddies as trigger for diatom productivity in the open-ocean northeast Atlantic. Prog. Oceanogr. 147, 38–48. doi: 10.1016/j.pocean.2016.07.011
Sabine C. L., Feely R. A., Gruber N., Key R. M., Lee K., Bullister J. L., et al. (2004). The oceanic sink for anthropogenic CO2. Science. 305 (5682), 367–371. doi: 10.1126/science.1097403
Sabine C. L., Tanhua T. (2010). Estimation of anthropogenic CO2 inventories in the ocean. Ann. Rev. Mar. Sci. 2, 175–198. doi: 10.1146/annurev-marine-120308-080947
Sangrà P., Pascual A., Rodríguez-Santana Á., Machín F., Mason E., McWilliams J. C., et al. (2009). The canary eddy corridor: A major pathway for long-lived eddies in the subtropical north Atlantic. Deep. Res. Part I Oceanogr. Res. Pap. 56, 2100–2114. doi: 10.1016/j.dsr.2009.08.008
Santana-Casiano J. M., González-Dávila M., Rueda M.-J., Llinás O., González-Dávila E.-F. (2007). The interannual variability of oceanic CO2 parameters in the northeast Atlantic subtropical gyre at the ESTOC site. Global Biogeochem. Cycles 21 (1). doi: 10.1029/2006GB002788
Schneider A., Tanhua T., Krtzinger A., Wallace D. W. R. (2010). High anthropogenic carbon content in the eastern Mediterranean. J. Geophys. Res. Ocean. 115, 1–11. doi: 10.1029/2010JC006171
Schulz S. (1982). A comparison of primary production in upwelling regions off Northwest and southwest Africa. Cons. Int. Explor. Mer. 180, 202–204.
Schütte F., Brandt P., Karstensen J. (2016a). Occurrence and characteristics of mesoscale eddies in the tropical northeastern Atlantic ocean. Ocean Sci. 12, 663–685. doi: 10.5194/os-12-663-2016
Schütte F., Karstensen J., Krahmann G., Hauss H., Fiedler B., Brandt P., et al. (2016b). Characterization of “dead-zone” eddies in the eastern tropical north Atlantic. Biogeosciences 13, 5865–5881. doi: 10.5194/bg-13-5865-2016
Siedler G., Zangenberg N., Onken R., Morlière A. (1992). Seasonal changes in the tropical Atlantic circulation: Observation and simulation of the Guinea dome. J. Geophys. Res. Ocean. 97, 703–715. doi: 10.1029/91JC02501
Stramma L., Brandt P., Schafstall J., Schott F., Fischer J., Körtzinger A. (2008a). Oxygen minimum zone in the north Atlantic south and east of the cape Verde islands. J. Geophys. Res. Ocean. 113, 4014. doi: 10.1029/2007JC004369
Stramma L., Czeschel R., Tanhua T., Brandt P., Visbeck M., Giese B. S. (2016). The flow field of the upper hypoxic eastern tropical north Atlantic oxygen minimum zone. Ocean Sci. 12, 153–167. doi: 10.5194/OS-12-153-2016
Stramma L., Hüttl S., Schafstall J. (2005). Water masses and currents in the upper tropical northeast Atlantic off northwest Africa. J. Geophys. Res. Ocean. 110, 1–18. doi: 10.1029/2005JC002939
Stramma L., Johnson G. C., Sprintall J., Mohrholz V. (2008b). Expanding oxygen-minimum zones in the tropical oceans. Science 320 (5876), 655–658. doi: 10.1126/science.1153847
Stramma L., Schott F. (1999). The mean flow field of the tropical Atlantic ocean. Deep Sea Res. Part II Top. Stud. Oceanogr. 46, 279–303. doi: 10.1016/S0967-0645(98)00109-X
Takahashi T., Olafsson J., Goddard J. G., Chipman D. W., Sutherland S. C. (1993). Seasonal variation of CO2 and nutrients in the high-latitude surface oceans: A comparative study. Global Biogeochem. Cycles 7, 843–878. doi: 10.1029/93GB02263
Touratier F., Azouzi L., Goyet C. (2007). CFC-11, Δ14C and 3H tracers as a means to assess anthropogenic CO2 concentrations in the ocean. Tellus Ser. B Chem. Phys. Meteorol. 59, 318–325. doi: 10.1111/j.1600-0889.2006.00247.x
Ucha I. R., González-Dávila M., Santana-Casiano M., Rueda M. J., Llinás O. (2010). Carbonate system distribution south of the canay islands in spring 2000. Sci. Mar. 74, 33–46. doi: 10.3989/scimar.2010.74s1033
Valdés L., Déniz-González I. (2015). Oceanographic and biological features in the canary current Large marine ecosystem Vol. 383 (Paris IOC Techni: IOC-UNESCO).
Van Camp L., Nykjaer L., Mittelstaedt E., Schlittenhardt P. (1991). Upwelling and boundary circulation off Northwest Africa as depicted by infrared and visible satellite observations. Prog. Oceanogr. 26 (4), 357–402. doi: 10.1016/0079-6611(91)90012-B
Wanninkhof R. (2014). Relationship between wind speed and gas exchange over the ocean revisited. Limnol. Oceanogr. Methods 12, 351–362. doi: 10.4319/lom.2014.12.351
Wanninkhof R., Doney S. C., Peng T.-H., Bullister J. L., Lee K., Feely R. A. (1999). Comparison of methods to determine the anthropogenic CO2 invasion into the Atlantic ocean, (Tellus B: Chemical and Physical Meteorology). 51. 511–530. doi: 10.3402/tellusb.v51i2.16335
Weiß T., Greinert J., Quack B. (2020). Time series of atmospheric methane and carbon dioxide concentrations measured during POSEIDON cruise POS533 (PANGAEA: GEOMAR - Helmholtz Centre for Ocean Research Kiel). doi: 10.1594/PANGAEA.920842
Winkler L. W. (1888). Die bestimmung des im wasser gelösten sauerstoffes. Berichte der deutschen chemischen Gesellschaft. 21 (2), 2843–2854. doi: 10.1002/cber.188802102122
Wooster W. S., Bakun A., McLain D. R. (1976). Seasonal upwelling cycle along the Eastern boundary of the north Atlantic. J. Mar. Res. 34, 131–141. doi: 10.2/JQUERY.MIN.JS
Yool A., Oschlies A., Nurser A. J. G., Gruber N. (2010). A model-based assessment of the TrOCA approach for estimating anthropogenic carbon in the ocean. Biogeosciences. 7, 723–751. doi: 10.5194/bg-7-723-2010
Keywords: CO2 system, air-sea CO2 fluxes, anthropogenic carbon, coastal and shelf waters, Macaronesian region
Citation: Curbelo-Hernández D, González-Dávila M and Santana-Casiano J M (2023) The carbonate system and air-sea CO2 fluxes in coastal and open-ocean waters of the Macaronesia. Front. Mar. Sci. 10:1094250. doi: 10.3389/fmars.2023.1094250
Received: 09 November 2022; Accepted: 01 February 2023;
Published: 16 February 2023.
Edited by:
Michele Giani, National Institute of Oceanography and Experimental Geophysics, ItalyReviewed by:
Carolina Cantoni, Institute of Marine Science (CNR), ItalyCopyright © 2023 Curbelo-Hernández, González-Dávila and Santana-Casiano. This is an open-access article distributed under the terms of the Creative Commons Attribution License (CC BY). The use, distribution or reproduction in other forums is permitted, provided the original author(s) and the copyright owner(s) are credited and that the original publication in this journal is cited, in accordance with accepted academic practice. No use, distribution or reproduction is permitted which does not comply with these terms.
*Correspondence: Melchor González-Dávila, bWVsY2hvci5nb256YWxlekB1bHBnYy5lcw==
Disclaimer: All claims expressed in this article are solely those of the authors and do not necessarily represent those of their affiliated organizations, or those of the publisher, the editors and the reviewers. Any product that may be evaluated in this article or claim that may be made by its manufacturer is not guaranteed or endorsed by the publisher.
Research integrity at Frontiers
Learn more about the work of our research integrity team to safeguard the quality of each article we publish.