 Chenjie Wu
 Zhijun Xie
 Kewei Chen3
 Ce Shi
 Yangfang Ye
 Yu Xin
- 1Department of Information Science and Engineering, Ningbo University, Ningbo, China
- 2Zhejiang Engineering Research Center of Advanced Mass Spectrometry and Clinical Application, Ningbo, China
- 3Faculty of Mechanical Engineering and Mechanics, Ningbo University, Ningbo, China
- 4School of Marine Sciences, Ningbo University, Ningbo, China
- 5Key Laboratory of Applied Marine Biotechnology, Ningbo University, Chinese Ministry of Education, Ningbo, China
- 6School of Information Technology, Deakin University, Melbourne, VIC, Australia
Crabs, such as swimming crabs and mud crabs, are famous for their high nutritional value but are difficult to preserve. Thus, the traceability of crabs is vital for food safety. Existing deep-learning methods can be applied to identify individual crabs. However, there is no previous study that used abdomen images to identify individual crabs. In this paper, we provide a novel Part-based Deep Learning Network (PDN) to reliably identify an individual crab from its abdomen images captured under various conditions. In our PDN, we developed three non-overlapping and three overlapping partitions strategies of the abdomen image and further designed a part attention block. A swimming crab (Crab-201) dataset with the abdomen images of 201 swimming crabs and a more complex mud crab dataset (Crab-146) were collected to train and test the proposed PDN. Experimental results show that the proposed PDN using the overlapping partition strategy is better than the non-overlapping partition strategy. The edge texture of the abdomen has more identifiable features than the sulciform texture of the lower part of the abdomen. It also demonstrates that the proposed PDN_OS3, which emphasizes the edge texture of the abdomen with overlapping partition strategies, is more reliable and accurate than the counterpart methods to identify an individual crab.
1 Introduction
Both swimming crabs (Portunus trituberculatus) and mud crabs (Scylla paramamosain) are members of the family Portunidae. They are widely distributed in the waters of China, Japan, and Korea (Dai et al., 1986; Hamasaki et al., 2006), and are also considered critical economic crabs with high nutritional value in China (Yu et al., 2006; Sun and Wang, 2020). In 2019, the marine fishing production of swimming crabs was 458,380 tons, down 4.34 percent year on year (Yearbook, 2020). Recently, the pressure from a marine resources recession has increased, and the amount of marine fishing has decreased yearly. Strong market demand has promoted the development of aquaculture (Wu et al., 2010).
With the development of crab farming, various food safety problems continuously emerged. For example, the development of the industry caused heavy metal pollution of aquatic organisms, and crabs are the most severe aquatic products contaminated with heavy metal cadmium (Pandiyan et al., 2021; Yang et al., 2021). Crab meat is rich in histidine, which can produce and accumulate histamine over a long time even after the crab death (Lipp and Rose, 1997), and its excessive intake by humans can cause illness or poisoning (Feddern et al., 2019; Worm et al., 2019). Crabs raised in non-standard farms are likely to be contaminated with a large number of bacteria and have excessive heavy metal content. Unscrupulous merchants will sell crabs that have been dead for a long time as normal commodities; these crabs will bring serious safety problems.
Based on the above safety concerns, the traceability of aquatic products has become an issue. Crab traceability requires a unique identification for each crab. The identification technologies currently used for traceability include barcodes, QR codes, electronic tags, anti-counterfeit crab buckles, and RFID tags (Zhao et al., 2012; Xiao et al., 2017; Faggion et al., 2020). However, these identifiers can easily be moved or forged. It is much more reliable to obtain characteristic identification by computer vision (CV) technology processing images of crabs than by physical identification.
In recent years, there has been an increasing number of studies on applying CV technology to agriculture and aquaculture (Kumar et al., 2018; Shen et al., 2019; Yang et al., 2020; Andrew et al., 2021; Hu et al., 2021; Xi et al., 2021). CV can also be applied to the individual identification of crabs. Because of heredity and living habits, the surface of a crab’s shell has special textures and patterns, which, similar to human fingerprints, are individually unique and provide conditions for the individual identification of a crab. Li (2019) proposed an anti-counterfeiting algorithm for Eriocheir Sinensis based on local features images that analyzed images of the back of Eriocheir Sinensis for individual identification and traceability. Tai et al. (2021) used a Speeded Up Robust Features (SURF) algorithm to extract the back feature points of Eriocheir Sinensis and then used the bi-direction Fast Library for Approximate Nearest Neighbors (FLANN) algorithm to match the feature points saved in the database. Zhang et al. (2022) proposed an individual re-identification method based on Pyramidal Feature Fusion Model (PFFM) for swimming crabs.
The studies mentioned above used traditional CV or deep learning for the individual identification of crabs by using crabs’ back images. The method of using specialist equipment to photograph and traditional CV to process the images has poor robustness. Deep learning algorithms designed to analyze the backs of swimming crabs with distinguishing features are not ideal for crab species with inconspicuous back shell features. As shown in Figure 1, the mud crab (b) does not have the speckled features on its back shell that the swimming crab (a) has, while the abdomen of the mud crab (c) has textural features that are more obvious than the back shell features (b). Therefore, using crab abdomen images is more suitable than using crab back images for individual crab identification. However, there is no existing work for identifying individual crabs using abdomen images.
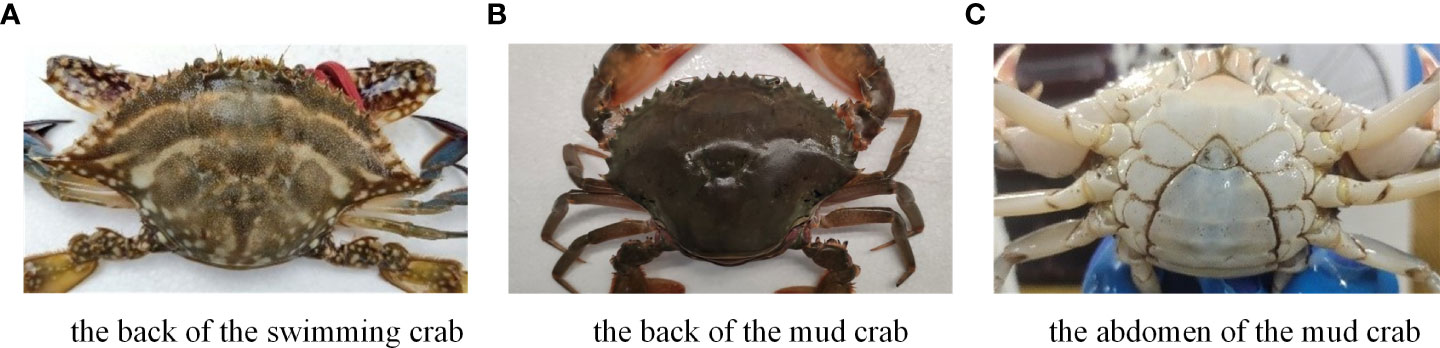
Figure 1 Differences between swimming crabs and mud crabs. (A) The back of the swimming crab. (B) The back of the mud crab. (C) The abdomen of the mud crab.
The proposed Part-based Deep Learning Network (PDN) algorithm uses crabs’ abdomen images as features and applies a deep learning algorithm based on local features to identify individual crabs. Our PDN algorithm is improved from a classical person re-identification (ReID) algorithm, and a Part-based Convolutional Baseline (PCB) (Sun et al., 2018). A person’s image can be divided into different parts (head, chest, abdomen, legs, etc.) from top to bottom. It is reasonable for the PCB algorithm and other part-based person ReID studies to perform a horizontal partition of a person’s image (Wang et al., 2018). As Sun et al. (2018) mentioned, the number of parts also affects the algorithm’s accuracy. Sun experimented and found that dividing the images into six parts was the most effective. The image partition strategy of the PCB algorithm determines the local features of the image, and different partition strategies will directly affect the effectiveness of the algorithm. After our experiments in subsection 2.3.4, we found that simply applying the PCB to the abdomen image of the crab’s abdomen (Figure 2) did not give good accuracy. Therefore, our PDN algorithm improves the partition strategy based on the features of the crab’s abdomen image and adds an attention strategy to strengthen its feature expression.
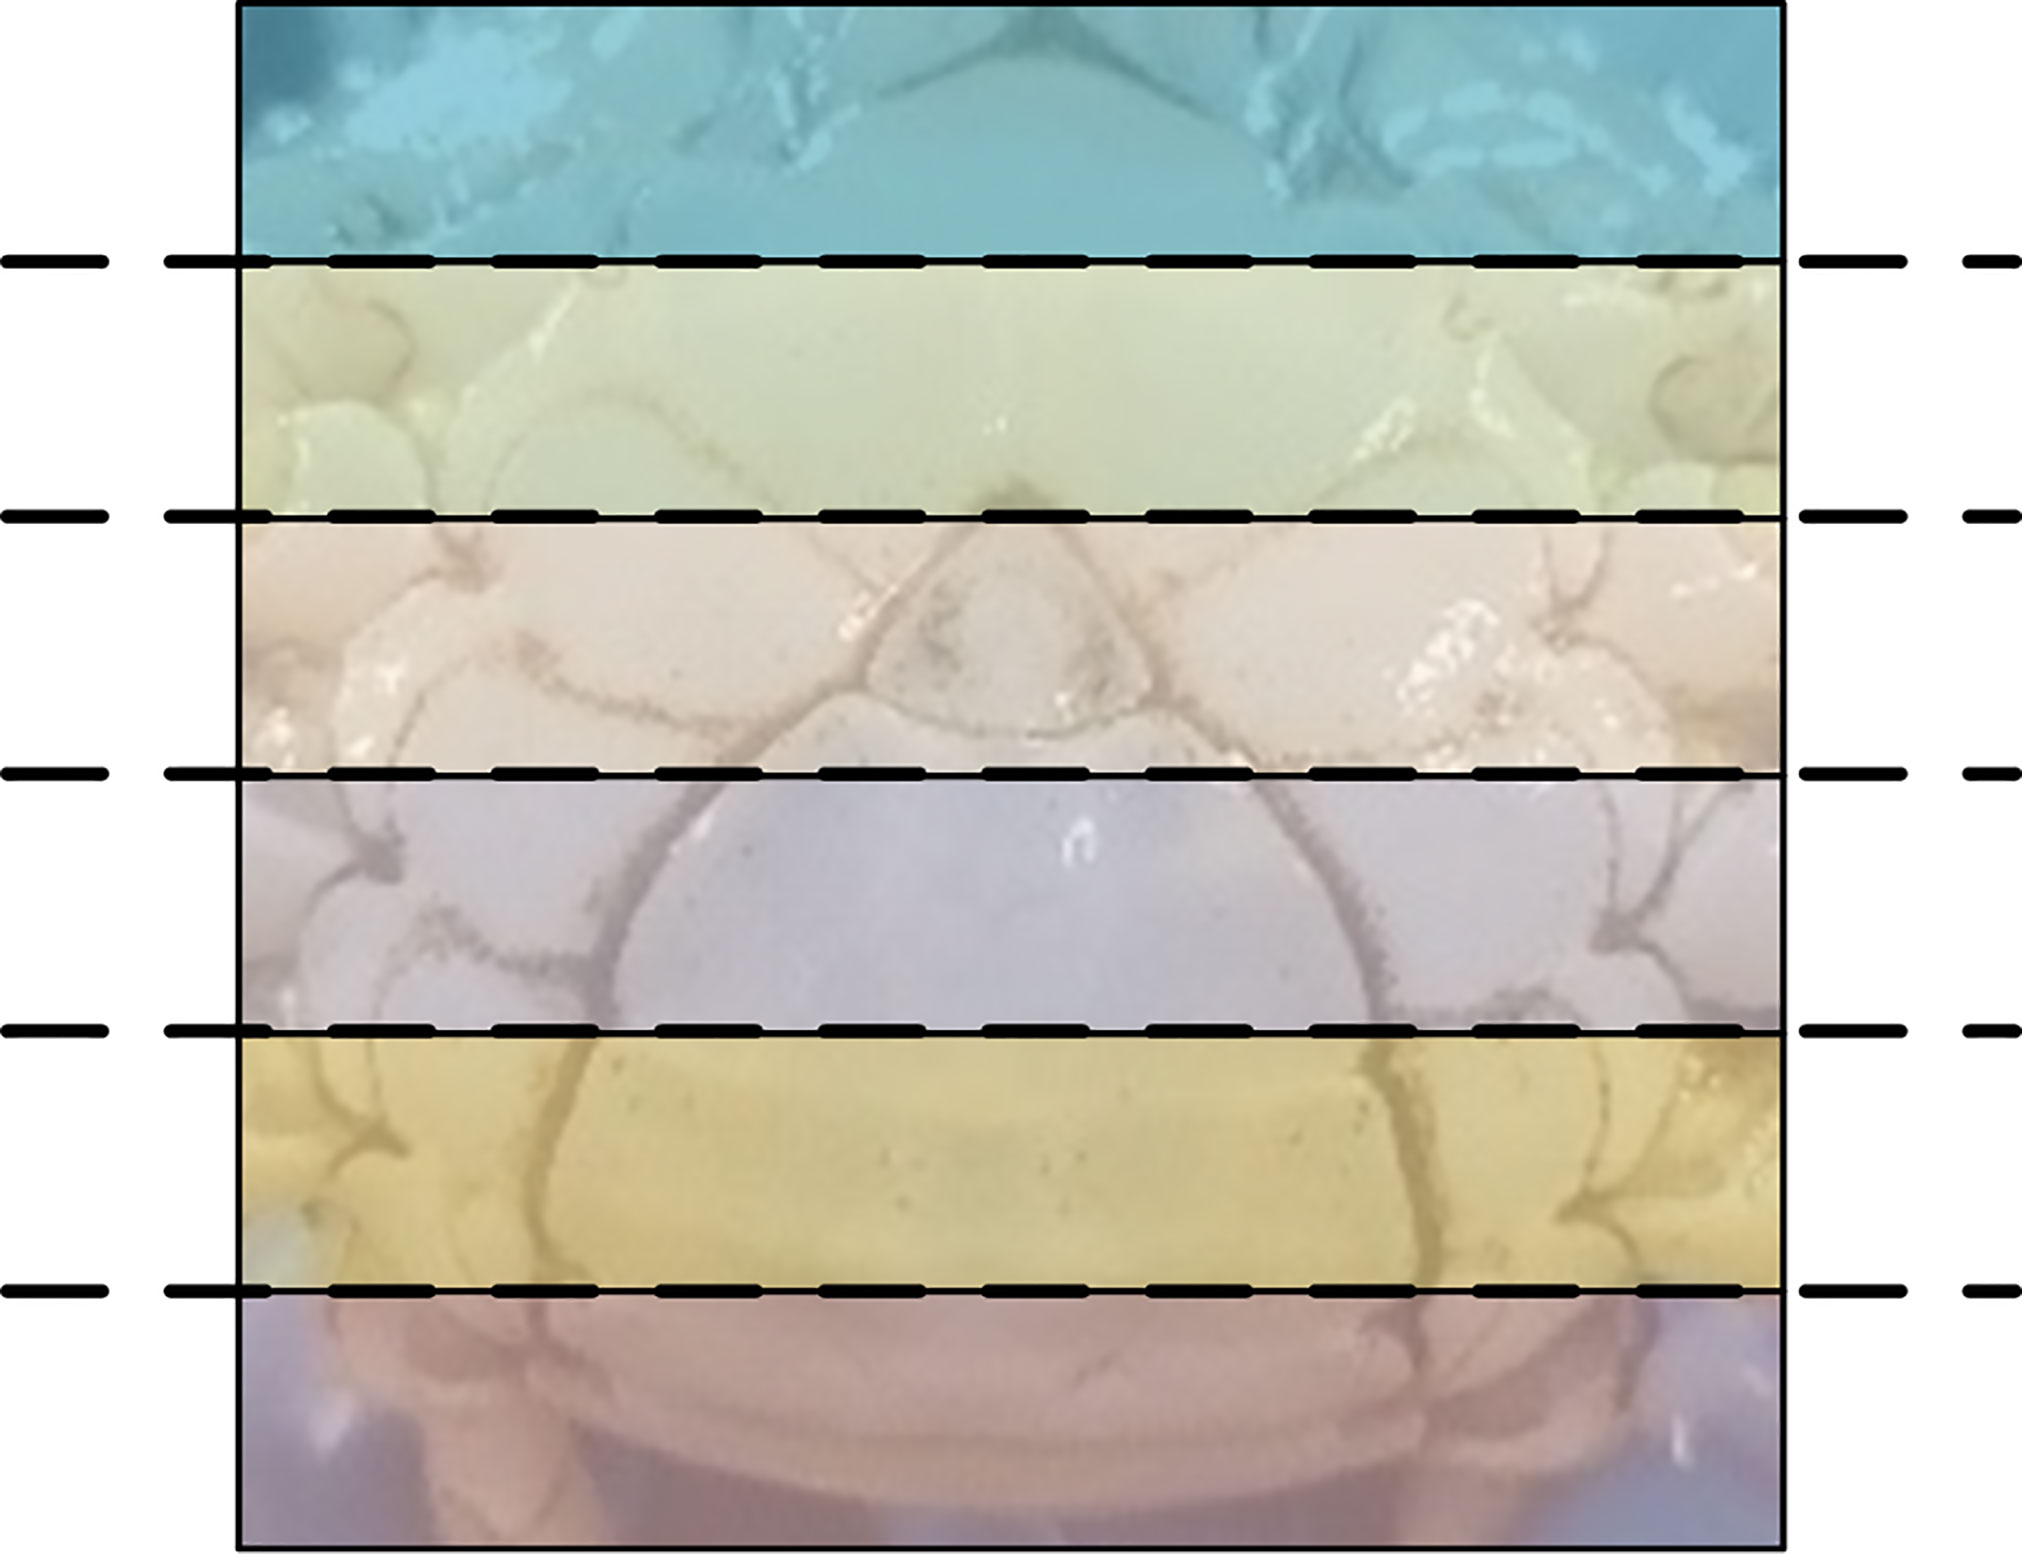
Figure 2 Division of a crab’s abdomen image into horizontal parts.
This paper focuses on the abdomen images of swimming/mud crabs, uses a deep learning algorithm based on local features to learn abdomen features, and forms its unique code for each crab. Thus, it realizes the accurate identification of individual crabs and provides an individual identification technique for the traceability systems of crabs.
The contributions of this paper are as follows.
(1) We provide a novel PDN method, in which a deep learning algorithm based on local features is used to extract representative features from crab abdomen images. It improves the PCB by using the partition strategy based on the features of the crab’s abdomen image and adding a Part Attention block (PA) to strengthen the feature representation.
(2) We further develop effective overlapping partition strategies to ensure that the representative feature of the key regions is preserved, particularly on the edges of the partitions.
(3) Two crab abdomen datasets (Crab-201 and Crab-146) were collected, and extensive experiments were conducted on both datasets. The experimental results demonstrate the accuracy and robustness of our proposed method with optimal overlapping partition strategies.
2 Materials and methods
2.1 Dataset
To verify the effectiveness of our proposed algorithm, we collected two datasets of crab abdomen images (the swimming crab dataset called Crab-201 and the complex mud crab dataset called Crab-146).
The raw data for the datasets were images and videos photographed by mobile phones. The original images or frames from the original video were fed into a trained YOLOv1 (Redmon et al., 2016) target detection algorithm, which can identify the abdomen of a crab to obtain the bounding boxes of the crab’s abdomen image. The images were cropped according to the bounding boxes.
Crab-201 All swimming crabs collected in Crab-201 were provided by a crab farm in Ningbo (Zhejiang, China), and were numbered after being photographed by mobile phone. Each swimming crab was photographed several times with different light intensities and different angles to simulate the varying effects under different conditions. We defined 12 conditions for the abdomen images of the swimming crabs; the conditions of an example crab are shown in Figure 3A. The 12 conditions were standard, grainy, clockwise rotation, low resolution, high resolution, low angle, contrarotation, lower-left part, upper-right part, dim light, over-exposed, and rotate with low angle. There were 2,412 images in the dataset Crab-201. Out of these, 1716 images of 143 crabs in the dataset were used as the training set, and the remaining 696 images of 58 swimming crabs were used as the test set. One image of each crab in the training set was randomly selected as the validation set. The validation set was used to verify the model, which can be continuously adjusted according to the situation to select the best model among them.
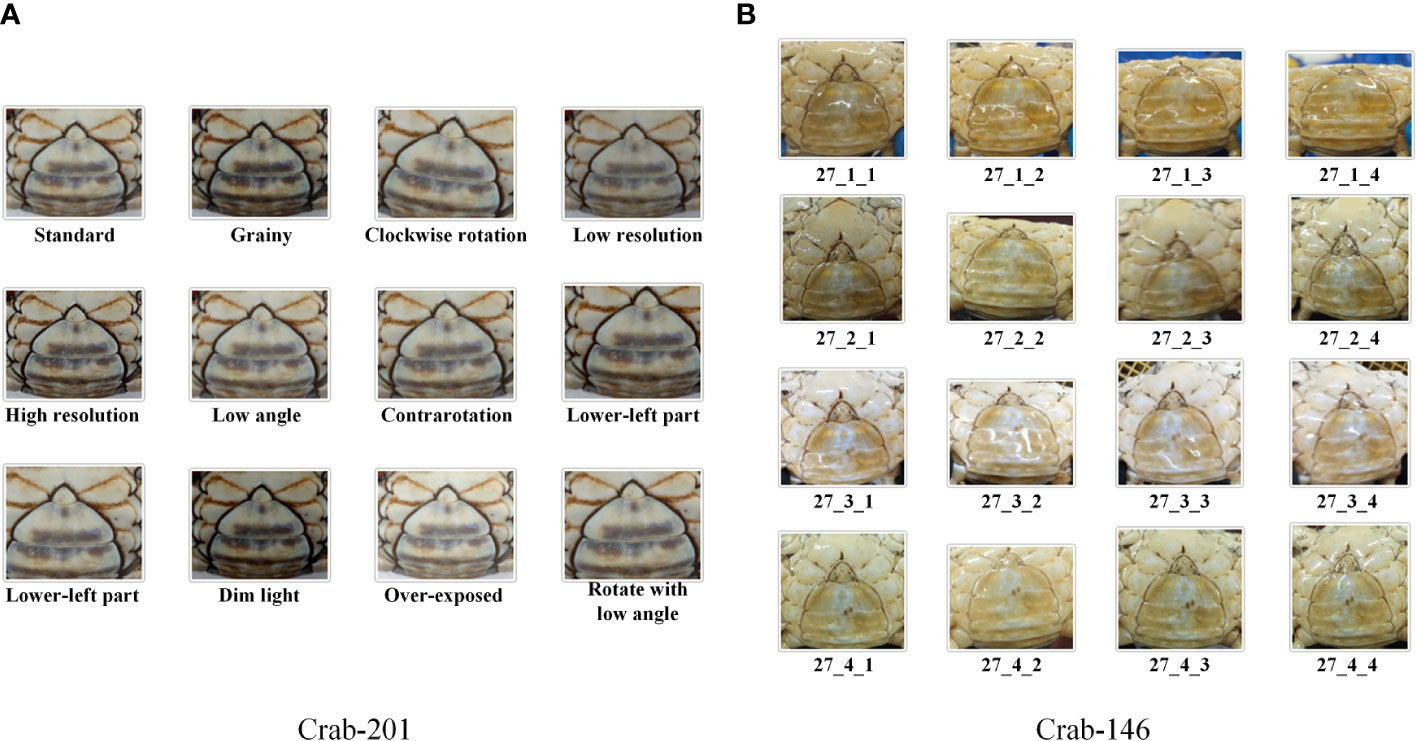
Figure 3 Demo images of the two crab abdomen datasets. (A) Crab-201. (B) Crab-146.
Modeled on the Person Re-identification dataset, the test set was divided into Query and Gallery, where Query was the image to be queried, and Gallery was the collection of images to be compared with Query. One image from each category (i.e., a crab) was randomly selected as the Query image, and the other images formed a subset of the Gallery. Therefore, there were 58 images in the Query queue and 638 images (58*11) in the Gallery.
Crab-146 was a more complex multi-device abdomen dataset of mud crabs (Scylla paramamosain). The mud crabs were collected from a crab farm (130 crabs) and a seafood market (16 crabs) in Ningbo (Zhejiang, China). The mud crab dataset was divided into a training set and a test set in the ratio of 3:1, in which the training set had 1,147 images with 97 categories and the test set had 681 images with 49 categories. Images of the 16 crabs from the seafood market were put into the test set. Images of one mud crab in the Crab-146 dataset are shown in Figure 3B. The image was named in reference to the person ReID dataset Market-1501 (Zheng et al., 2015). Using “27_4_1” as an example, “27” is the crab number, “4” is the camera number and “1” is the image number. Figure 3 also shows that the mud crab dataset is more complex compared to the swimming crab dataset because multiple devices were used to photograph the mud crabs at different times.
Similar to the Crab-201 dataset, the test set of the Crab-146 dataset consisted of a Query and a Gallery. The difference being that there was only one image of each id in the Gallery, and the remaining images were regarded as Query. Although this division method slightly reduced the difficulty of matching Query and Gallery each time, it greatly increased the number of Query. Images from the seafood market crabs were not collected at the same time or on the same device as other images. They were not involved in algorithm training, which made the test set able to also verify whether the algorithm was overfitting.
The image pixels of Crab-201 were between 385, 369 and 2418, 2131, and the image pixels of Crab-146 were between 210, 179 and 2959, 2591. The dataset was pre-processed as follows: After resizing the image to 3*256*256, the pixel values were divided by 225 and normalized to [0,1]. Then each channel was standardized in turn using the formula as follows:
where the mean= [0.485, 0.456, 0.406], std(Standard Deviation)= [0.229, 0.224, 0.225], and the above values were calculated from the Imagenet dataset (Deng et al., 2009).
2.2 The proposed Part-based Deep learning Network
In this subsection, we provide a Part-based Deep learning Network (PDN) that can effectively extract representative abdomen features of crabs for individual identification. In subsection 2.2.1, we introduce the classical Person ReID algorithm PCB. In subsection 2.2.2, we develop non-overlapping partition strategies and overlapping partition strategies for dividing the whole body of a crab. In subsection 2.2.3, we detail the proposed PDN algorithm using an attention mechanism to identify individual crabs.
2.2.1 The Part-based Convolutional Baseline
Person ReID is a popular CV task and most of the current animal individual identification algorithms are improved based on pedestrian reidentification algorithms. In the early person ReID, it takes the overall features of the image as the reidentification target, and then the target image is retrieved and matched by a hash algorithm. The limitations of this strategy are that the features of the reidentification target are greatly influenced by the image background and incur high feature errors. Also, the global features cannot fully capture the important local features and thus cannot accurately specify the reidentification target. Therefore, more studies consider local features extracted from key local regions to represent the features of the reidentified targets. The local feature-based ReID can tell the microscopic differences of the reidentified targets, and thus its reidentification effect is significantly better than that of the global feature-based algorithm. The target object partition is often adopted in the local feature-based ReID methods, and its representative algorithm is PCB, which has a simple workflow with high accuracy and efficiency.
Figure 4 shows the PCB workflow for extracting features from the abdomen images of crabs, where Backbone Network is used for original feature extraction from the image. PCB divides the original tensor T∈ℝ2048×16×16 , into p horizontal parts and averages all column vectors within the same part into a part-level column vector gi (i∈1,2,…,p) using traditional averaging pooling. Then, PCB uses a 1*1 kernel-sized convolutional layer to map gi to hi (i∈1,2,…,p) (part descriptor). Finally, hi is input into p classifiers, each consisting of a fully connected layer and a following Softmax function. Classifiers calculate the loss between the output prediction and the input identity (ID). In the training phase, the PCB calculates the cross-entropy loss for p-ID predictions and performs parameter optimization. In the testing phase, p pieces of hi are connected to form the final descriptor, H.
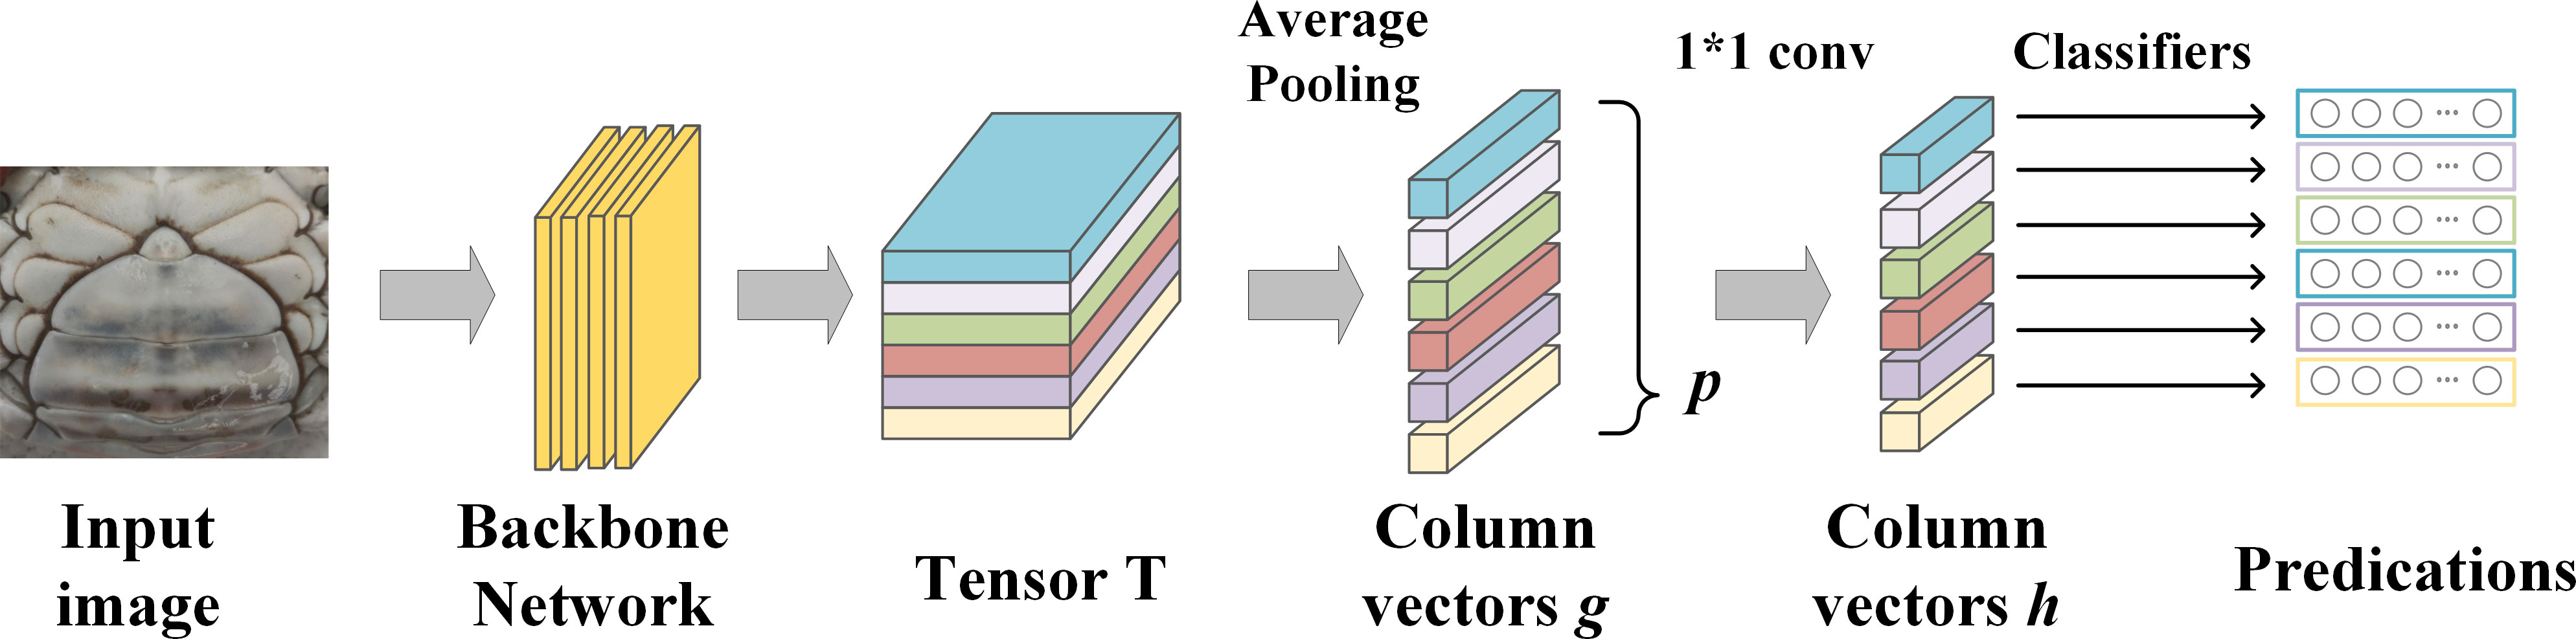
Figure 4 The workflow of PCB.
2.2.2 The Partition Strategies
The whole body of the crab is divided into cephalothorax, abdomen, and appendages. As shown in Figure 5A, the abdomen is located behind the abdomen surface of the cephalothorax armor, which is called the sternum, and is covered by it. For convenience, we called the image containing the abdomen and sternum in Figure 5B the abdomen image of the crab. The abdomen image of the crab adopted in this paper is shown in Figure 5B, including the sternum and abdomen, and the texture was divided into sulciform texture and edge texture.
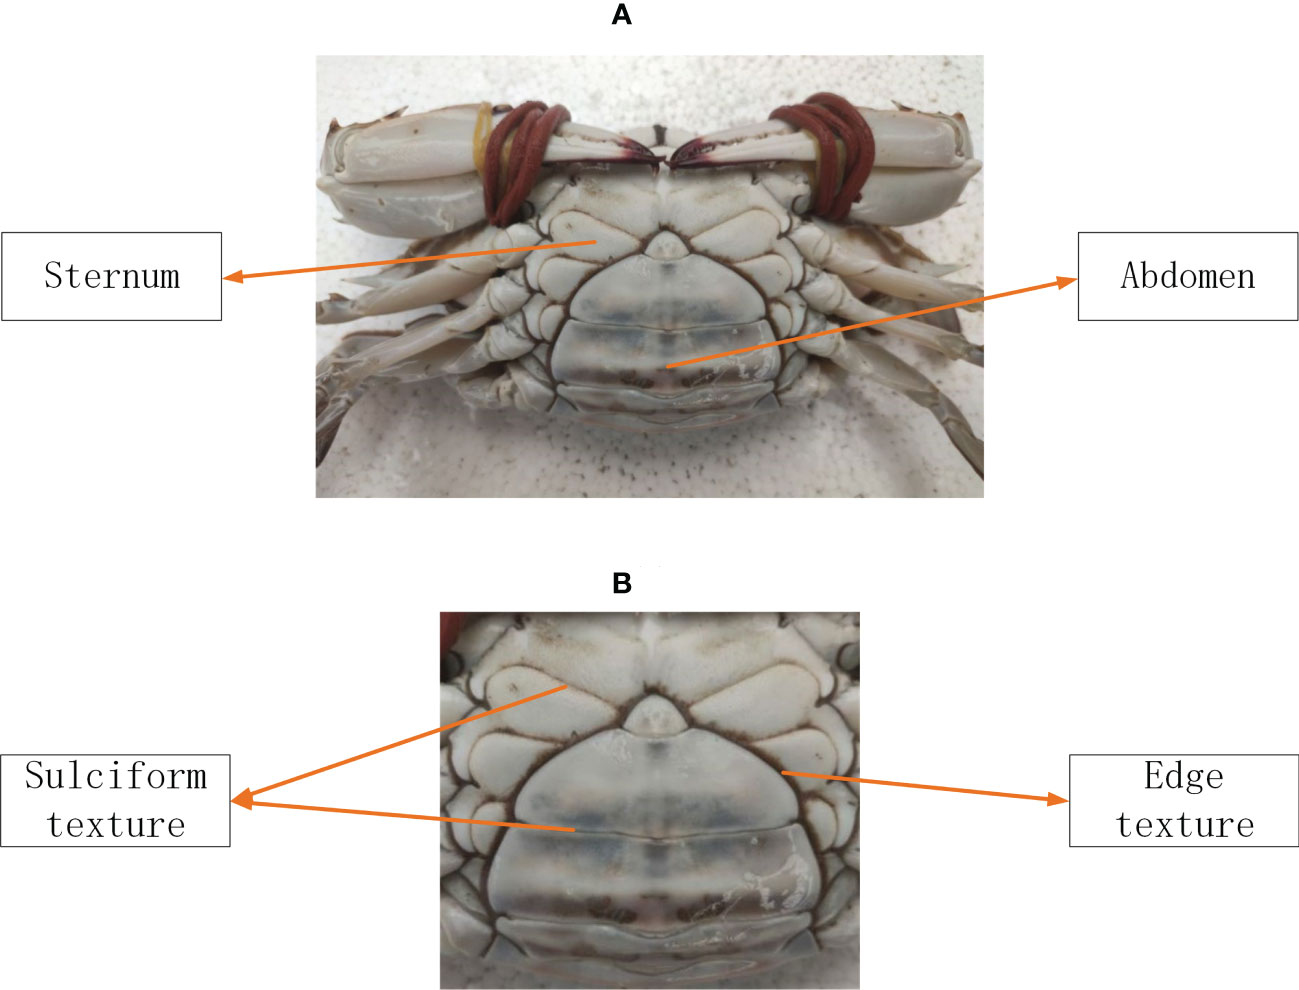
Figure 5 (A, B) The abdomen image of a swimming crab.
2.2.2.1 The non-overlapping partition strategies
Figure 5B shows that the abdominal edge texture is obvious and contains more characteristic information, and the sulciform texture of the sternum is more obvious than that of the abdomen and can also be regarded as an important feature. The sulciform texture in the middle and lower part of the abdomen is not obvious and contains relatively less characteristic information. In order to verify the correctness of the above observations and to improve the accuracy of the algorithm, we developed three different non-overlapping partition strategies (i.e., NOS1-3) and enhanced the feature extraction of the abdominal edge texture and sternal groove texture based on the PCB algorithm. Figure 6 shows the three non-overlapping partition strategies designed in this paper.
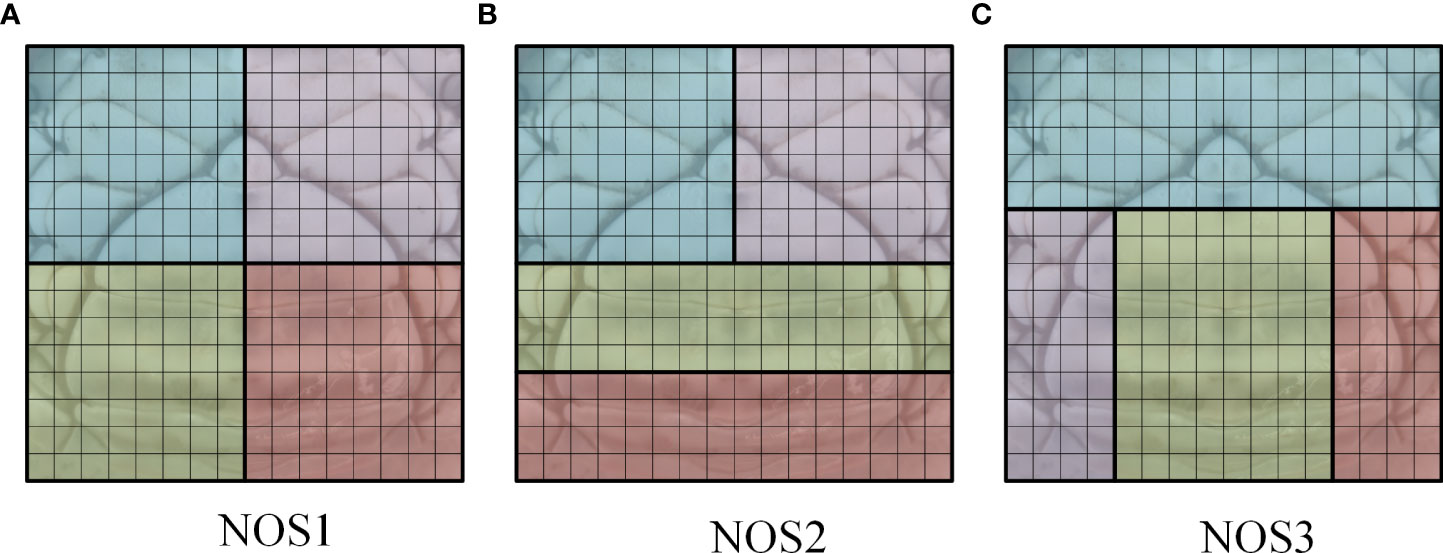
Figure 6 (A–C) Three non-overlapping partition strategies.
In Figure 6A, the tensor T∈ℝ2048×16×16 is divided into 2*2 parts. Since the abdomen of the crab is symmetrical from the left to the right, and the upper half texture features significantly differ from the lower half texture features, it is easier to maintain the abdomen texture features of the crab in the image processing using the grid partition compared to the horizontal partition strategy as shown in Figure 2. Strategy 2 in Figure 6B emphasizes the sulciform texture of the lower part of the abdomen of the crab. In Figure 6C, two parts are set on the left and right sides of the abdomen, and each part contains a more complete edge texture of the abdomen compared to Figures 6A, B, so that the image features can fully express the edge texture features. The overlapping partition strategies.
2.2.2.2 The overlapping partition strategies
In the non-overlapping partition strategies, the key region of the image was cut into multiple parts that are independent of each other, so, the complete features of the key region could not be extracted. We assumed that A in Figure 7A was a key region in the image and that if the non-overlapping partition method was applied, region A would be divided into two independent blocks, i.e., the left part and the right part. This produced the problem that neither of the two blocks could fully reflect the characteristics of region A; that is, we lacked the complete information of region A to capture the overall characteristics of the abdomen images of crabs. To overcome this limitation, we designed the overlapping partition strategies as shown in Figure 7B in this paper. In Figure 7B, region A is at the edge of the right part, and the right part cannot contain the complete information of region A, while region A is inside the left part, and the left part contains the complete information of region A. Similarly, the left part cannot contain the complete information of region B, while the right part contains it. Therefore, the overlapping partition method could ensure that any region in the image is inside the part, and thus avoided the loss of key information due to the partition of key regions; this enhanced the extraction of representative characteristics of individual crabs. Corresponding to the non-overlapping partition strategies in Figure 6, we designed the overlapping partition strategies for the abdomen texture of crabs, as shown in Figure 8. Specifically, we extended the edges of all the parts divided by the non-overlapping strategy illustrated in Figure 6 by one row outwards, which was a simple and efficient way to achieve overlapping partition without excessive regulations. Figure 8A shows the overlapping partition strategy corresponding to Figure 6A, dividing the crab abdomen image equally into 2*2 parts; Figure 8B shows the overlapping partition corresponding to Figure 6B, emphasizing the sulciform texture of the lower part of the abdomen of the crab; while Figure 8C shows the overlapping partitioning corresponding to Figure 6C, emphasizing the edge texture of the abdomen.
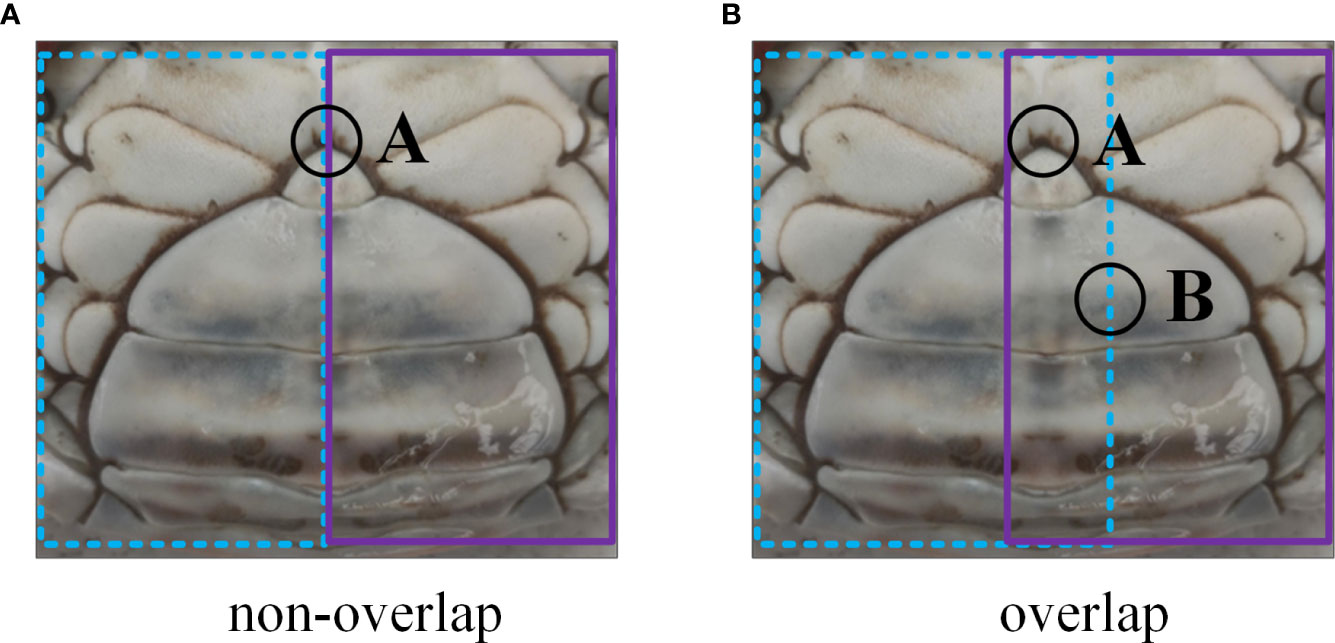
Figure 7 Difference between an overlapping and a non-overlapping partition. (A) non-overlap partition. (B) overlap partition.
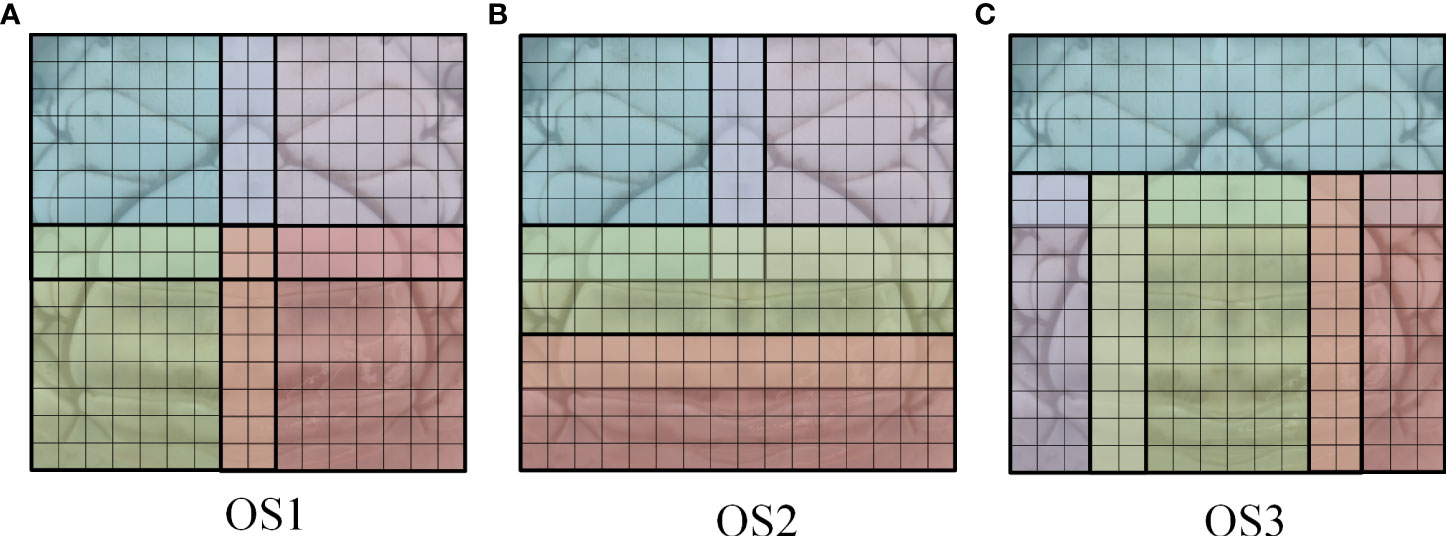
Figure 8 (A–C) Three overlapping partition strategies.
Therefore, through the comparison of these three non-overlapping partition strategies and three overlapping partition strategies it was possible to explore the effect of emphasizing or not different textures and overlapping partitions on the effectiveness of the algorithm.
2.2.2.3 The attention mechanism and the architecture of PDN
Inspired by the human visual attention mechanism, we provided an attention mechanism in which different parts of the input data or feature map that have different focus intensities were given their attention weights to weigh different spatial regions. In the proposed overlapping and non-overlapping partition strategies, the amount of feature information of the texture in each part was different, therefore, it was necessary to focus on the part with high feature information for identifying individual crabs. The Part Attention (PA) block of PDN is shown in the upper right region in Figure 9. For hi (i∈1,2,…,p ) in the column vector h, the vector hi is input to a fully connected layer FC1i and a sigmoid layer to output an attention weight αi, which is multiplied by the corresponding vector hi to obtain the weighted vector ni. Unlike other spatial attention mechanism methods (shown in Figure 10A), which generate weights for feature map vectors (e.g., RGA-S (Zhang et al., 2020)), our PA block generates weights at the part-level (shown in Figure 10B), which significantly reduces the number of parameters in the algorithm.
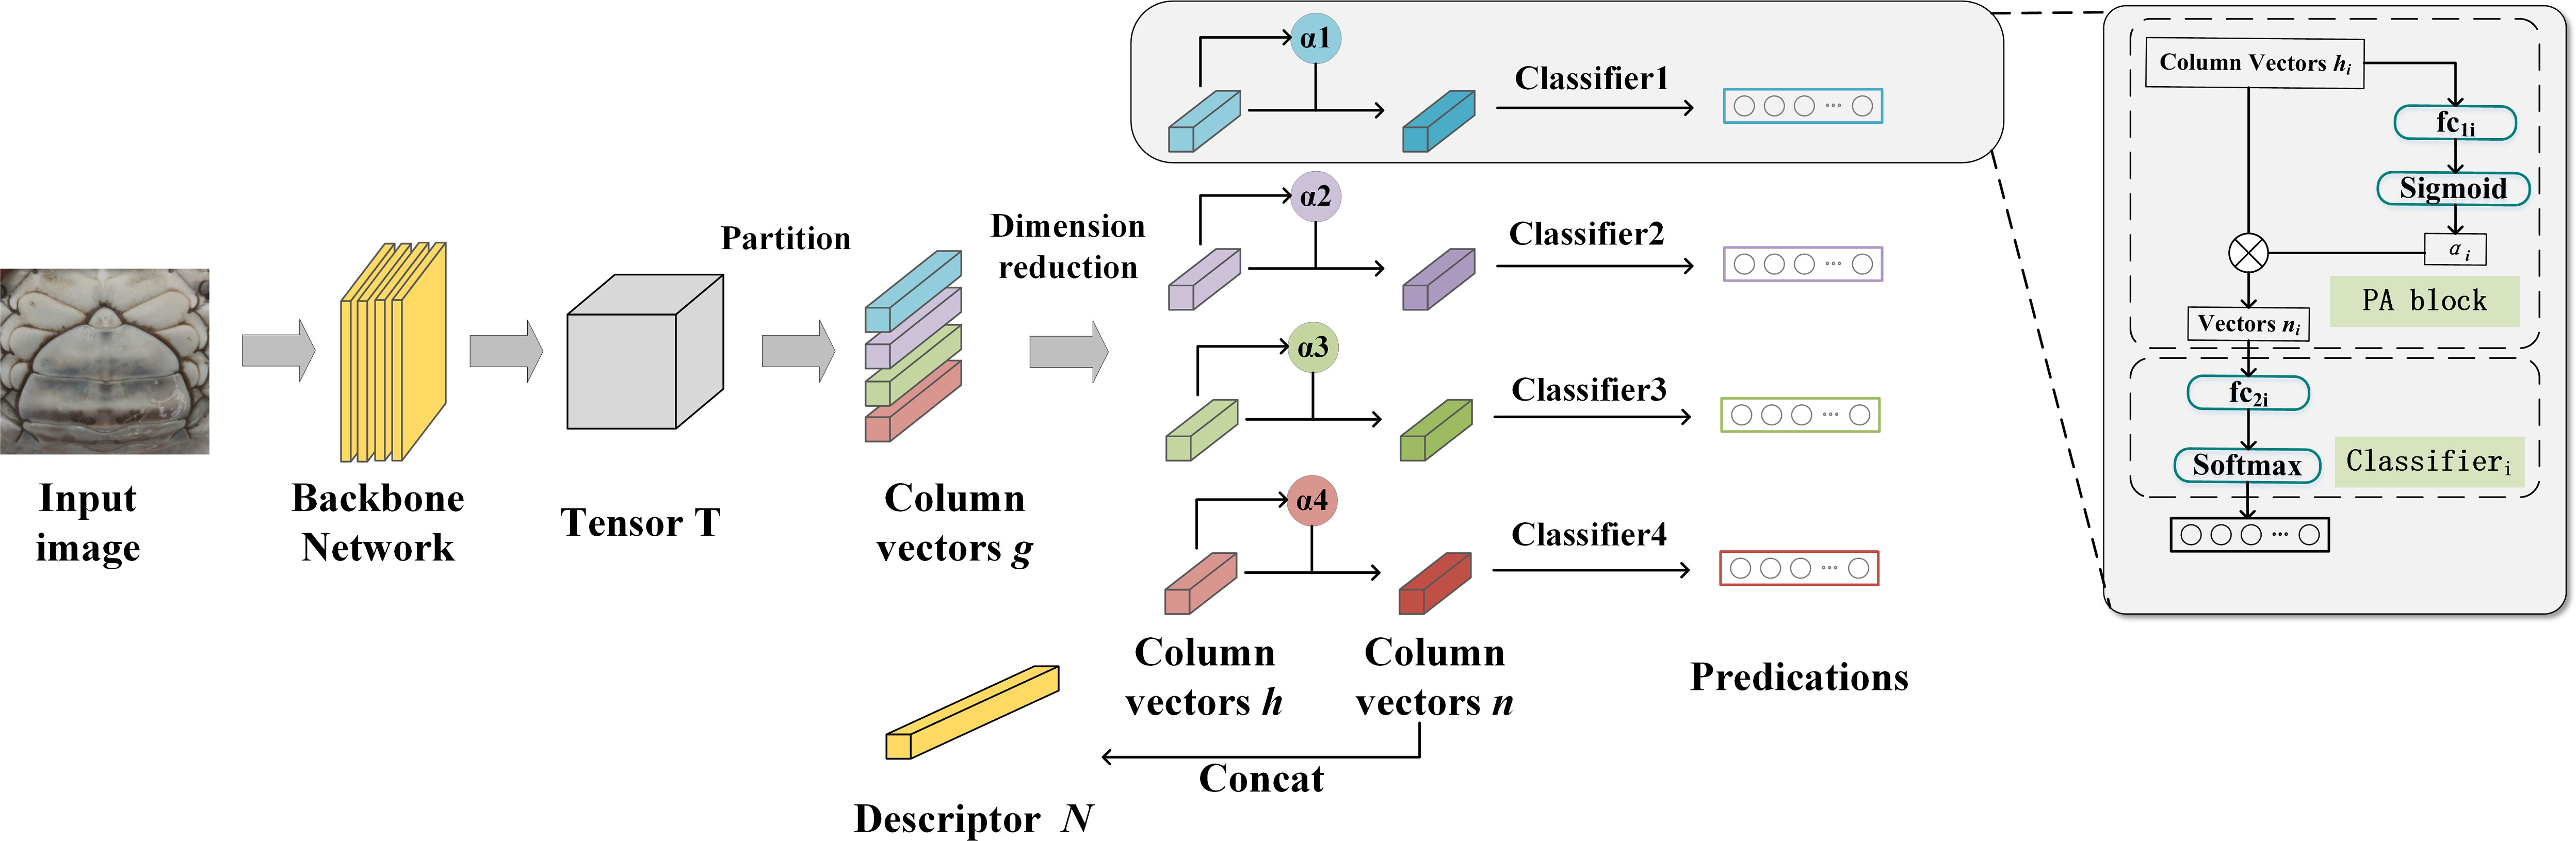
Figure 9 The architecture of the PDN.
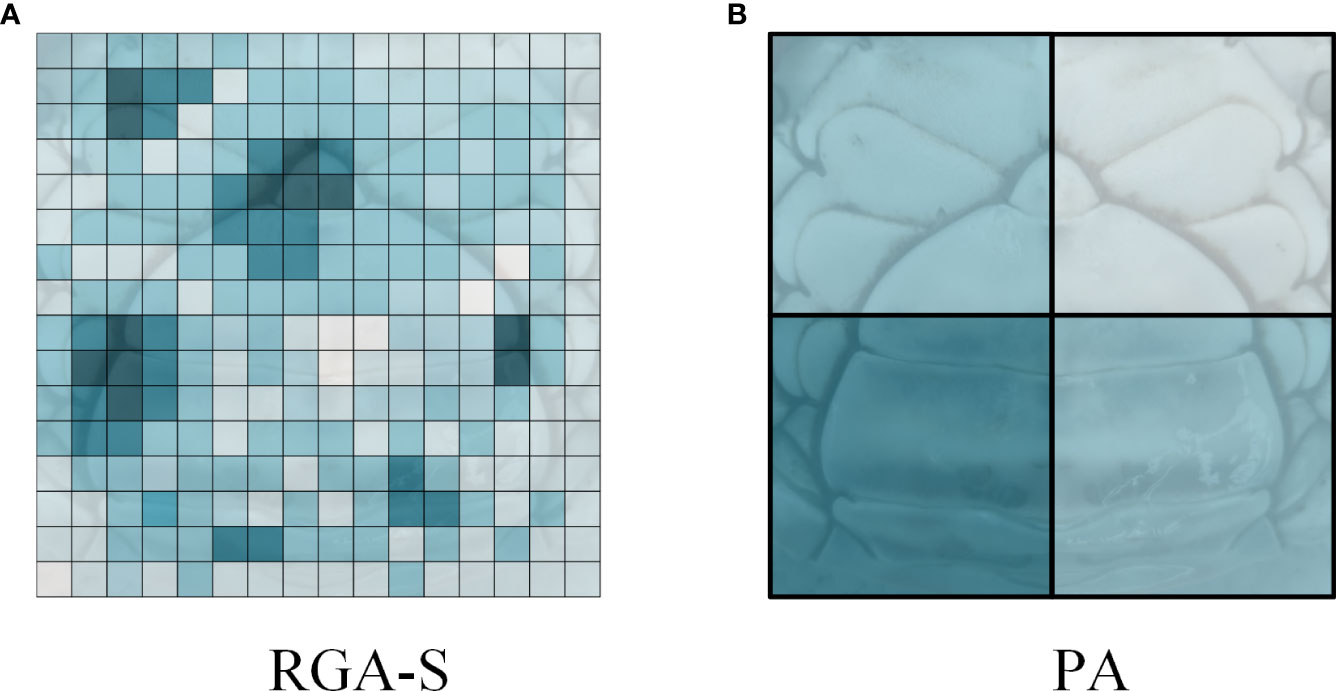
Figure 10 Visualization of attention mechanisms. (A) visualization of RGA-S (B) visualization of our part attention (PA) block.
Figure 9 shows the architecture of the PDN. The input image is resized to a size of 256*256, which was inputted into a backbone network (we used the ResNet50 (He et al., 2016) as the backbone) to obtain tensor T∈ℝ2048×16×16 . Then tensor T was divided into p parts by our partition strategy, in this paper p = 4. Each part was fed into an average pooling layer to obtain column vector gi (i∈1,2,…,p ). Then, using a 1*1 convolutional layer of 1024 filters (with stride=1, padding=0) to reduce dimension from 2048 to 1024, we obtained vector hi, then hi was fed into the Part Attention block to obtain the weighted vector ni. In the inference phase, p pieces of ni concatenated to obtain the final descriptor N.
In the training phase, vector ni was fed into a Classifier, which outputted the predication of the size of the training set categories through a fully connected layer FC1 and a Softmax layer. Then we calculated the cross-entropy loss of and the ground truth label y: .
To further learn the discriminative features of the crab abdomen image, we also used circle loss (Sun et al., 2020) to reduce the similarity between vector ni of different categories and increase the similarity between vector ni of the same category. The similarity Si is the cosine similarity of two vectors ni of different images, as shown in Equation (2), where the ni1 and ni2 are the vector ni of two different images. The similarity between vectors ni of the same category was called , and the similarity between different ids was called .
The circle loss used in this paper was as follows:
The two hyperparameters γ and m were set to 32 and 0.25, respectively.
The two aforementioned losses were then combined to obtain the final loss:
We adopted the SGDM (Stochastic Gradient Descent with momentum) optimizer to train all models for 60 epochs with a learning rate of 5 × 10⁻², a weight decay of 5 × 10⁻⁴, and a momentum of 0.9. The batch size was set to 32.
3 Experiments and result
3.1 Experimental setup
The experiments of this paper were conducted on a computer with GPU (OS: Ubuntu 18.04, GPU: NVIDIA GeForce RTX 3090, CUDA: CUDA-11.1), and all algorithms were implemented using Python 3.7.10 and Pytorch 1.8.1.
In this experiment, six partition strategies were implemented for dividing the crabs’ abdomen images, including three non-overlapping partition algorithms (PDN_NOS1, PDN_NOS2, and PDN_NOS3), as shown in Figure 6, and three overlapping partition algorithms (PDN_OS1, PDN_OS2, and PDN_OS3), as shown in Figure 8. PDN_NOS1 and PDN_OS1 were uniformly divided, PDN_NOS2 and PDN_OS2 emphasized the sulciform texture of the lower half of the abdomen, and PDN_NOS3 and PDN_OS3 emphasized the edge texture of the abdomen.
In the experiments, we studied the distribution of same-id similarity and different-id similarity obtained by the six partition strategies using Crab-201 in Section 3.2 and evaluated the Precision-recall curve of the six partition strategies under different confidence levels in Section 3.3. We also compared the Rank-1 (average accuracy rate) and mAP (mean average precision) of the optimal partition strategy with other algorithms on Crab-146 and visualized the classification ability of the algorithms in Section 3.4.
3.2 Study of descriptor distinguishability
The feature encoding descriptor was the basis for individual identification. A good algorithm can generate discriminative descriptors and thus distinguish individual crabs. So, we evaluated the distinguishability of the final descriptor H of the crabs to prove the identification effect of our PDN algorithm.
In this experiment, we compared the similarity between descriptors H of the same ID extracted by the algorithms. In the test phase, the higher the similarity of descriptors between the same ID in different conditions and the lower the similarity of descriptors between different ids, the more reliable the algorithm was.
Similar to Equation (2), the similarity between different descriptors H was calculated as follows:
Where the H1 and H2 are the descriptor H of two different images. The similarity between descriptor H of the same category is called Sp, and the similarity between different ids is called Sn.
Figure 11 shows the distribution of similarity between descriptors H extracted by six partition strategies algorithms from the test set images, the pink dots represent Sp and the blue dots represent Sn, Figure 11 also shows the boxplot of the distribution of the dots.
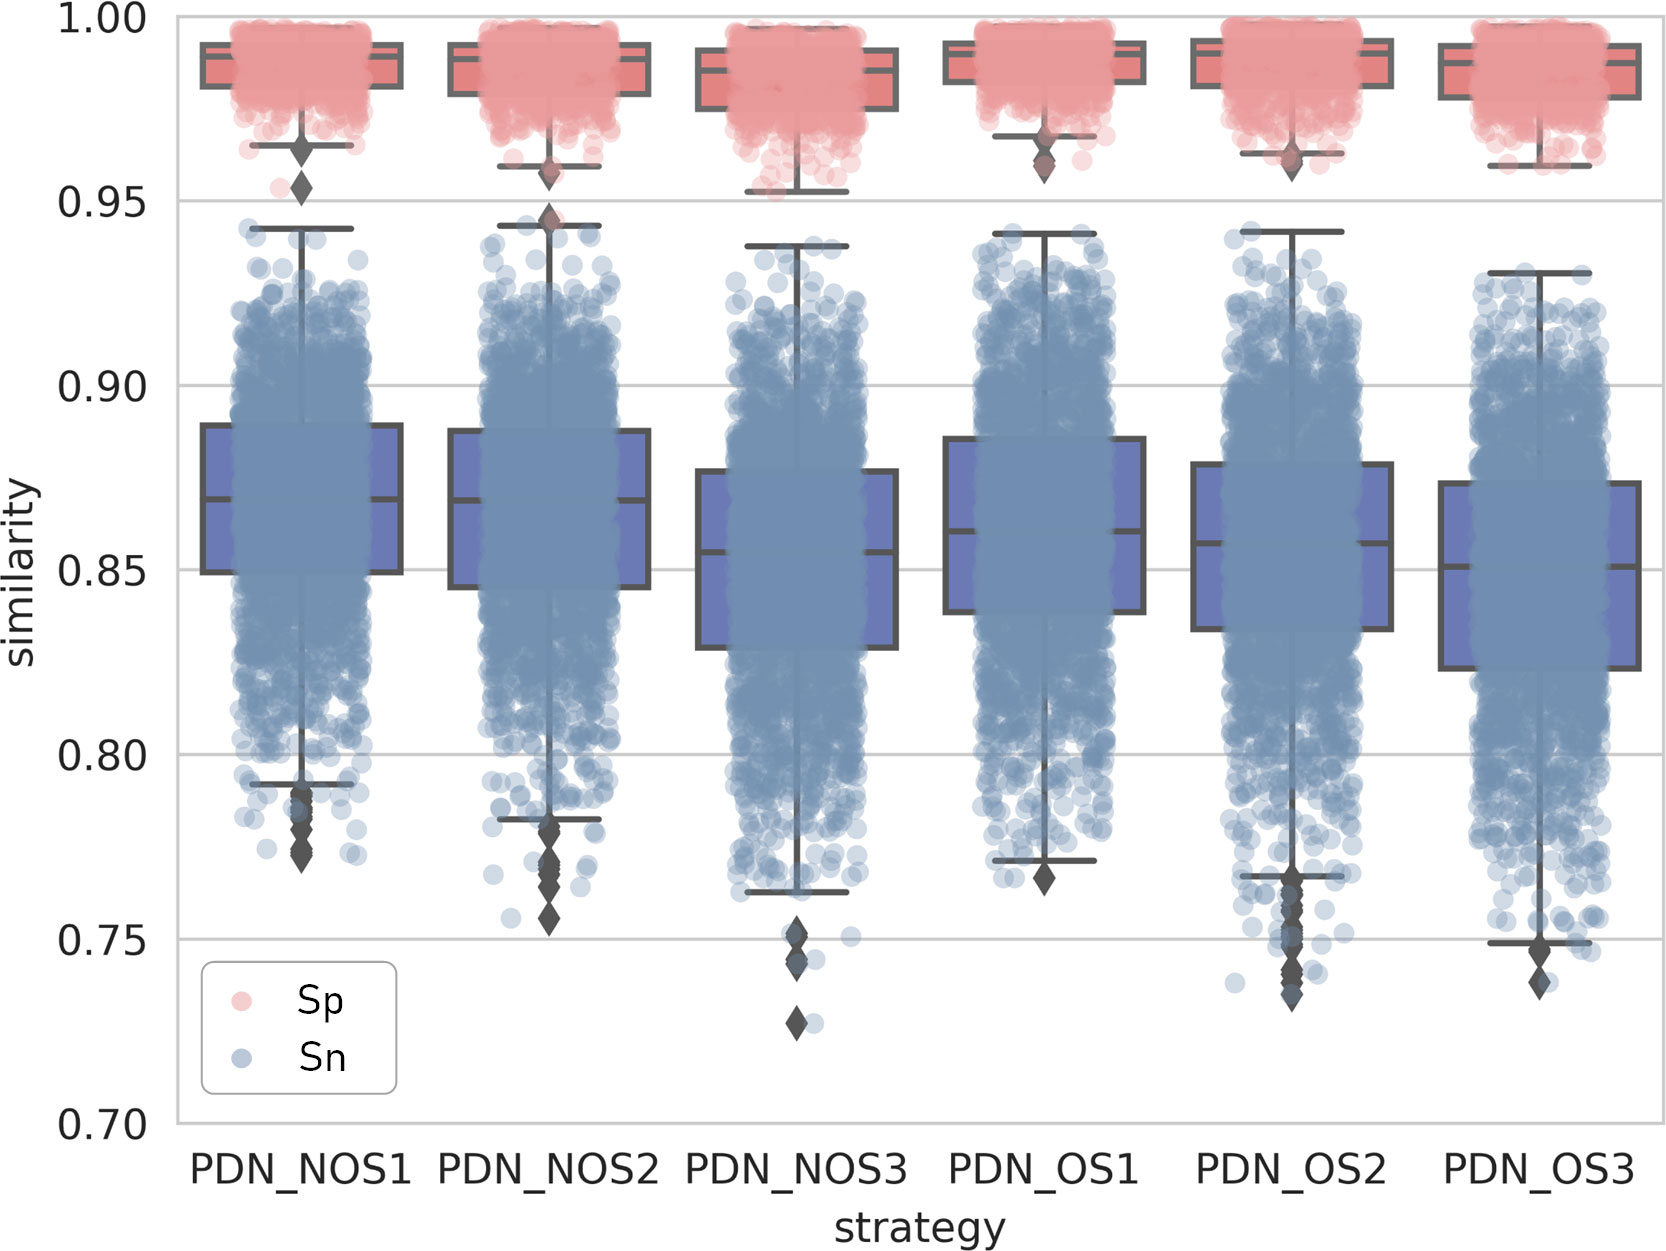
Figure 11 The distribution of Sp and Sn of six partition strategies.
The Sp needs to be distinguished from the Sn by a certain distance. The overall trend in Figure 11 was that the overlapping strategy had a larger difference between the lower quartile of the similarity with the same ID and the upper quartile of the similarity with different IDs compared to the non-overlapping strategy (i.e., the overlapping partition algorithm had a greater differentiation distance for the same ID and different ID descriptors). It could be seen from Figure 11 that the differentiation distance of strategy 2 was the smallest whether it was an overlapping partition or a non-overlapping partition. In the overlapping partition algorithm, strategy 3(OS3) had the largest distinguishing distance, which means that the OS3 was more suitable for partitioning the abdomen of the crab. From the data above, we also concluded that the edge texture of the abdomen emphasized in strategy 3 had more identifiable features than the sulciform texture of the lower part of the abdomen of the crab emphasized in strategy 2.
3.3 Precision and Recall under different confidence levels
The algorithm was tested with different confidence levels/thresholds, and the Precision and Recall were calculated at different confidence levels. For each query, images in the gallery with similarity above the threshold were classified as positive and those below the threshold were classified as negative. Positive examples that were correctly classified were denoted as TP (true positive), negative examples that were correctly classified were denoted as TN (true negative); positive examples that were incorrectly classified as negative were denoted as FN (false negative) and negative examples that were incorrectly classified as positive were denoted as FP (false positive). The Precision and Recall rates were calculated as follows:
The Precision-recall curve was drawn with recall as the horizontal coordinate and precision as the vertical coordinate, and the results are shown in Figure 12. As can be seen from Figure 12, the performance of PDN_OS1 and PDN_OS2 was poor and the performance of PDN_OS3 was better compared to the other policies.

Figure 12 Precision-recall curve under different confidence levels.
3.4 Robustness
To verify the suitability of the algorithm for real-life extension and the generality of individual identification of different species of crabs, we used a more complex multi-device abdomen dataset of mud crabs (Crab-146) to train and test our model.
The algorithm evaluation metrics used in this experiment were the Rank-1 (average accuracy rate) and the mAP (mean average precision), which were originally used as algorithm evaluation metrics for person re-identification. Rank-1 represented the average accuracy rate of whether the image with the highest similarity to the query matched the query correctly. The mAP of an algorithm was the mean of the average precision scores for each query of the test set. The higher the score of Rank-1 and mAP, the more accurate the model was in its predictions. Given a set of Query as Q = {q1, q2,…,qi,…qN} and a set of Gallery as G = {g1, g2,…,gj,…gM}, we assumed that the number of times the ID corresponding to qi appeared in G was Kqi . The Query process for each query image was given as follows. The algorithm extracted the descriptor Hqi of qi, compared it with the descriptor Hgj of each image in G and calculated the similarity between descriptors Hqi and Hgj . Then, the Gallery was ranked in ascending order according to the similarity, the ranked gallery was noted as Gqi , the set consisting of images hit by qi was noted as , which was a subset of Gqi . We assumed that was ranked as in Gqi , and in , this process was repeated for all queries in Query, and the mAP was calculated by
In Crab-146, Kqi=1 . So, the mAP was calculated by:
In Table 1, we evaluate the PA block of PDN_OS3. Through the ablation experiment of the PA block, it can be seen that without the PA block, the rank1 and mAP of the proposed PDN_OS3 algorithm decreased by 4% and 2.9%, which shows that the part attention mechanism of this paper was beneficial for the individual identification of the crab abdomen. We also compare the performance of PDN_OS3 using the PA block and the PDN_OS3 using RGA-S (Zhang et al., 2020). RGA-S is a relation-aware global attention block for spatial attention with a higher number of parameters compared to the PA block. The rank1 and mAP of the PDN_OS3 using RGA-S decreased by 1.6% and 1.1%. Using the PA block as the attention block of the PDN_OS3 led to a better performance with a smaller number of parameters.
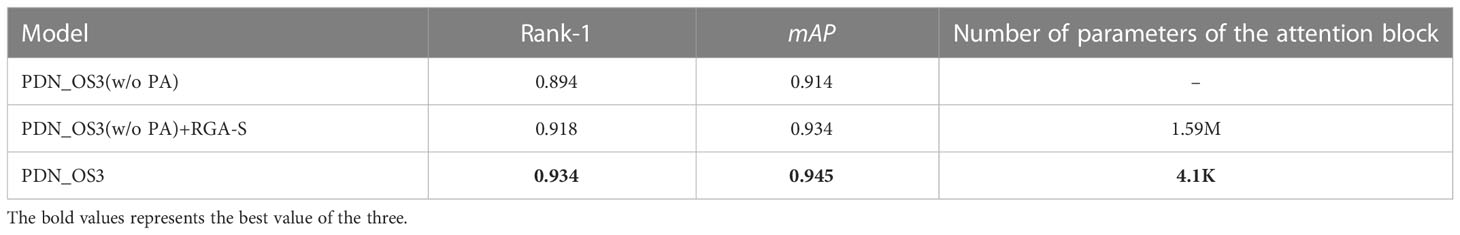
Table 1 Comparison of the attention blocks.
In Table 2, we compare the rank1 and mAP of our proposed PDN_OS3 with other counterpart algorithms. The i in PCB-i indicates that the image is divided horizontally into i parts. To generate the descriptors, we removed the final fully-connected layer from all the comparison algorithms, and the feature mAP output from the last convolutional layer was average pooled to obtain the descriptors. Without the parameter restriction of the fully connected layer, the input size of the algorithm can be changed as required. We uniformly resized the input size of all comparison algorithms to the same 256*256 as the PDN. Then the feature was fed into the average pooling layer after being output from the final convolution layer, where the output vector was the descriptor. In the training phase, the descriptors were fed into the classifier for classification, and the loss function was the final loss in section 3.1.
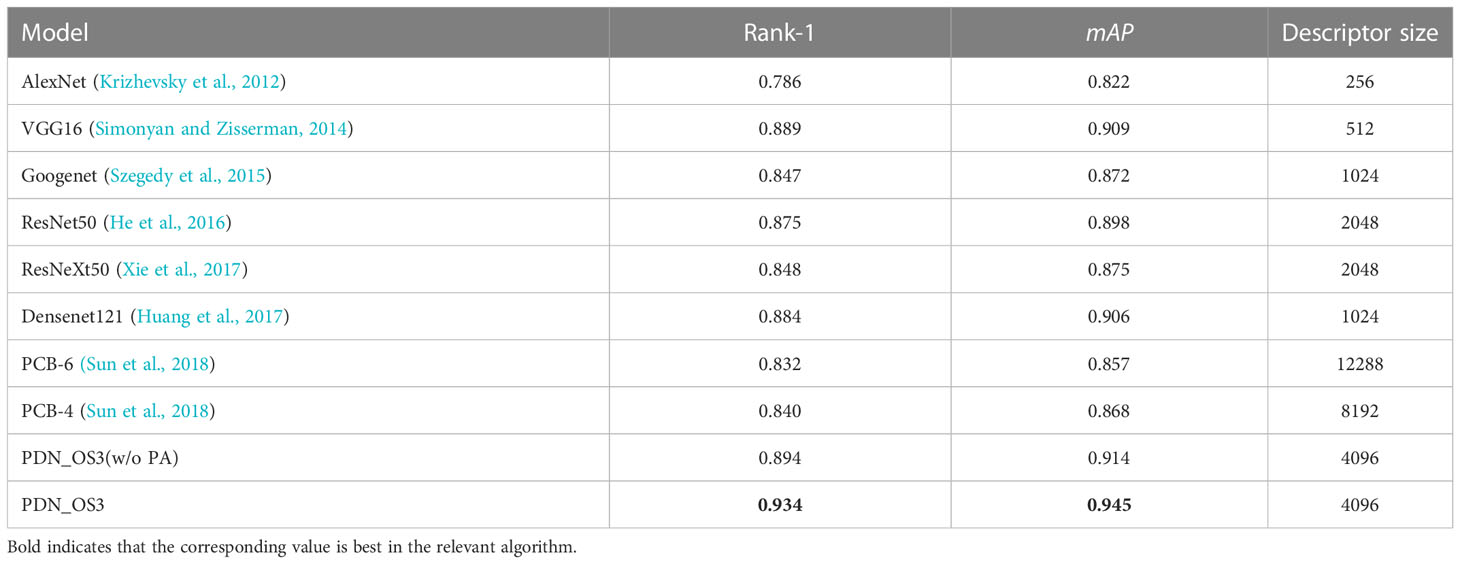
Table 2 Performance comparison on the Crab-146 dataset.
As shown in Table 2, the proposed PDN_OS3 achieved the best performance in mAP and Rank-1, which indicates that our method can capture more discriminative features than other methods. The results also show that descriptor size is not a significant factor in the effectiveness of the algorithm. In PCBs, finer partitions can, on the contrary, reduce the performance of the algorithm.
We further evaluated our proposed PDN method using the T-SNE (T-distributed Stochastic Neighbor Embedding) to visualize the test set descriptors extracted by the algorithm. T-SNE is essentially an embedding model that maps data from a high-dimensional space to a low-dimensional space while preserving the local characteristics of the data. Figure 13 visualizes the distribution of image descriptors from the test set extracted by PDN_OS1 and five counterparts (Googlenet, ResNet50, ResNeXt50, PCB-4, and PCB-6). Where points of the same color represent descriptors of the same id, the tighter the clustering of points of the same color represents a tighter intra-class distribution, and the greater the distance between points of different colors represents greater inter-class spacing. We can see from Figure 13 that PDN_OS3 generates descriptors with a greater gap between classes and closer intra-class distribution.
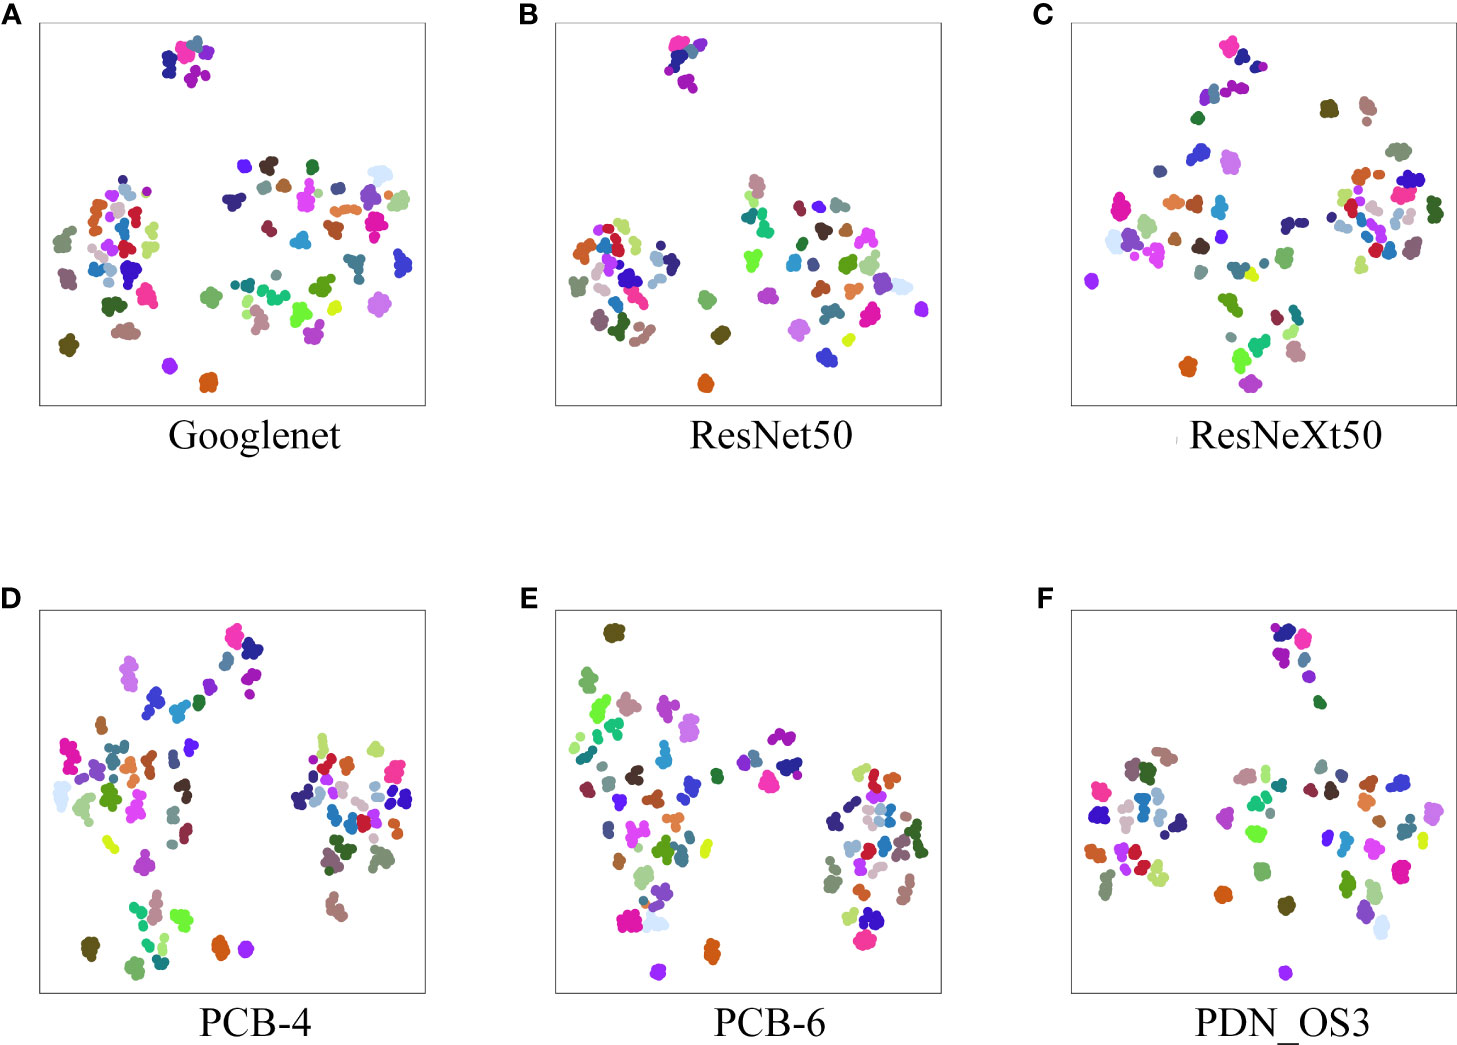
Figure 13 (A–F) Visualization of the classification ability of algorithms.
4 Discussion
This paper provided a reliable PDN method with six partition strategies to identify individual crabs from their abdomen images. The experiments on a swimming crab dataset (Crab-201) demonstrated that the proposed PDN algorithm can distinguish crabs’ abdomen images with different IDs. The overlapping partition strategy had a larger distinguishing distance and the overlapping partition strategy 3 (PDN_OS3) had the largest distinguishing distance, which means that the edge texture of the abdomen emphasized in the PDN_OS3 had the most identifiable features, and the PDN_OS3 was the most suitable for dividing the abdomen of the crab. Using the PA block as the attention block of the PDN_OS3 led to a better performance with a smaller number of parameters. In a more complex mud crab dataset (Crab-146), the PDN_OS3 also achieved a higher rank1 and mAP compared with five counterpart algorithms (PCB, AlexNet, VGG16, Googlenet, ResNet50, ResNeXt50, and Densenet121) and showed the best classification ability by separating different classes while ensuring the closest distribution intra-classes. In summary, the proposed PDN_OS3 algorithm achieved the best performance in individual identification using crabs’ abdomen images.
5 Conclusion
This paper proposes a new Part-based Deep Learning Network (PDN) to identify individual crabs from their abdomen images. In the PDN, we also develop six partition strategies (three non-overlapping strategies and three overlapping strategies) according to the abdomen texture features of crabs and demonstrate that the PDN_OS3 (strategy 3 using overlapping partition) achieves the best performance. Extensive experiments on two real-world farm crab datasets (the swimming crab dataset Crab-201 and the complex mud crab dataset Crab-146) demonstrate the accuracy and robustness of our PDN_OS3 algorithm for the identification of individual crabs. The experimental results show that the algorithm using overlapping partition strategies can distinguish different crabs’ abdomen images with a larger distinguishing distance, and the OS3 has the largest distinguishing distance. The edge texture of the abdomen emphasized in OS3 has the most identifiable features. The PDN_OS3 has the highest Rank1 and mAP compared with other algorithms and can achieve a distinction between the classes with the closest intra-class distribution. The results show that the PDN_OS3 is more suitable for the individual identification of crabs than the original PCB network. The four local descriptors h of the PDN_OS3 algorithm are connected to form a global descriptor H that can be used as the individual identity ID of the crab in the traceability system.
Data availability statement
The datasets presented in this study can be found in online repositories. The names of the repository/repositories and accession number(s) can be found below: https://github.com/bergi111/crabreid.
Author contributions
CW: Proposed research ideas, designed research protocols, performed experiments, drafted paper and completed final revision. ZX and KC: Revised the paper. SC and YY: Data collection, dataset production. YX: Proposed research ideas, dataset production, revised the paper. RZ: Revised the paper. GH: Revised the paper. All authors contributed to the article and approved the submitted version.
Funding
This work was supported by National Natural Science Foundation of China (Grant No. U20A20121); Ningbo public welfare project (Grant No. 202002N3109, 2022S094); Natural Science Foundation of Zhejiang Province (Grant No. LY21F020006); Science and Technology Innovation 2025 Major Project of Ningbo (Grant No. 2019B10125, 2019B10028, 2020Z016,2021Z031, 2022Z074); Ningbo Fenghua District industrial chain key core technology "unveiled the commander" project (Grant No. 202106206)
Conflict of interest
The authors declare that the research was conducted in the absence of any commercial or financial relationships that could be construed as a potential conflict of interest.
Publisher’s note
All claims expressed in this article are solely those of the authors and do not necessarily represent those of their affiliated organizations, or those of the publisher, the editors and the reviewers. Any product that may be evaluated in this article, or claim that may be made by its manufacturer, is not guaranteed or endorsed by the publisher.
References
Andrew W., Gao J., Mullan S., Campbell N., Dowsey A. W., Burghardt T. (2021). Visual identification of individual Holstein-friesian cattle via deep metric learning. Comput. Electron. Agric. 185, 106133. doi: 10.1016/j.compag.2021.106133
Dai A. Y., Yang S. L., Song Y. Z. (1986). Marine crabs in China Sea (Beijing: Marine Publishing Press).
Deng J., Dong W., Socher R., Li L. J., Kai L., Li F.-F. (2009). “ImageNet: A large-scale hierarchical image database,” 2009 IEEE Conference on Computer Vision and Pattern Recognition, Miami, FL, USA, IEEE, 2009, pp. 248–255, doi: 10.1109/CVPR.2009.5206848.
Faggion S., Sanchez P., Vandeputte M., Clota F., Vergnet A., Blanc M.-O., et al. (2020). Evaluation of a European sea bass (Dicentrarchus labrax l.) post-larval tagging method with ultra-small RFID tags. Aquaculture 520, 734945. doi: 10.1016/j.aquaculture.2020.734945
Feddern V., Mazzuco H., Fonseca F. N., De Lima G. J. M. M. (2019). A review on biogenic amines in food and feed: Toxicological aspects, impact on health and control measures. Anim. Production. Sci. 59 (4), 608–618. doi: 10.1071/AN18076
Hamasaki K., Fukunaga K., Kitada S. (2006). Batch fecundity of the swimming crab portunus trituberculatus (Brachyura: Portunidae). Aquaculture 253 (1-4), 359–365. doi: 10.1016/j.aquaculture.2005.08.002
He K., Zhang X., Ren S., Sun J. (2016). “Deep residual learning for image recognition,” in Proceedings of the IEEE conference on computer vision and pattern recognition. IEEE: Las Vegas, NV, USA
Hu X., Liu Y., Zhao Z., Liu J., Yang X., Sun C., et al. (2021). Real-time detection of uneaten feed pellets in underwater images for aquaculture using an improved YOLO-V4 network. Comput. Electron. Agric. 185, 106135. doi: 10.1016/j.compag.2021.106135
Huang G., Liu Z., van der Maaten L., Weinberger K. Q. (2017). “Densely connected convolutional networks,” in Proceedings of the IEEE conference on computer vision and pattern recognition. IEEE: Honolulu, HI, USA
Krizhevsky A., Sutskever I., Hinton G. E. (2017). Imagenet classification with deep convolutional neural networks. Commun. ACM 60, 84–90. doi: 10.1145/3065386
Kumar S., Pandey A., Satwik K. S. R., Kumar S., Singh S. K., Singh A. K., et al. (2018). Deep learning framework for recognition of cattle using muzzle point image pattern. Measurement 116, 1–17. doi: 10.1016/j.measurement.2017.10.064
Li H. (2019). Research of anti-counterfeiting algorithm of eriocheir sinensis based on local features of images (China: Anhui University of Technology).
Lipp E. K., Rose J. B. (1997). The role of seafood in foodborne diseases in the united states of America. Rev. Scientifique. Technique. 16 (2), 620–640. doi: 10.20506/rst.16.2.1048
Pandiyan J., Mahboob S., Govindarajan M., Al-Ghanim K. A., Ahmed Z., Al-Mulhm N., et al. (2021). An assessment of level of heavy metals pollution in the water, sediment and aquatic organisms: A perspective of tackling environmental threats for food security. Saudi. J. Biol. Sci. 28 (2), 1218–1225. doi: 10.1016/j.sjbs.2020.11.072
Redmon J., Divvala S., Girshick R., Farhadi A. (2016). “You only look once: Unified, real-time object detection,” in Proceedings of the IEEE conference on computer vision and pattern recognition. IEEE: Las Vegas, NV, USA
Shen W., Hu H., Dai B., Wei X., Sun J., Jiang L., et al. (2019). Individual identification of dairy cows based on convolutional neural networks. Multimedia. Tools Appl. 79, 14711–14724. doi: 10.1007/s11042-019-7344-7
Simonyan K., Zisserman A. (2014). Very deep convolutional networks for large-scale image recognition. arXiv. preprint. arXiv:1409.1556.
Sun C., Wang Y. (2020). Impacts of the sampling design on the abundance index estimation of portunus trituberculatus using bottom trawl. Acta Oceanol. Sin. 39 (6), 48–57. doi: 10.1007/s13131-020-1607-z
Sun Y., Cheng C., Zhang Y., Zhang C., Zheng L., Wang Z., et al. (2020). “Circle loss: A unified perspective of pair similarity optimization,” in Proceedings of the IEEE/CVF conference on computer vision and pattern recognition. IEEE: Seattle, WA, USA
Sun Y., Zheng L., Yang Y., Tian Q., Wang S. (2018). “Beyond part models: Person retrieval with refined part pooling (and a strong convolutional baseline),” in Proceedings of the European conference on computer vision (ECCV). Cham: Springer
Szegedy C., Liu W., Jia Y., Sermanet P., Reed S., Anguelov D., et al. (2015). “Going deeper with convolutions,” in Proceedings of the IEEE conference on computer vision and pattern recognition. Boston, MA: IEEE
Tai W., Li H., Zhang B., Wang C. (2021). Research on the feature recognition and algorithm of the carapace of eriocheir sinensis. Periodical. Ocean. Univ. China 51 (1), 138–146. doi: 10.16441/j.cnki.hdxb.20180416
Wang G., Yuan Y., Chen X., Li J., Zhou X. (2018). “Learning discriminative features with multiple granularities for person re-identification,” in Proceedings of the 26th ACM international conference on multimedia. Association for Computing Machinery: New York, NY, USA
Worm J., Falkenberg K., Olesen J. (2019). Histamine and migraine revisited: Mechanisms and possible drug targets. J. Headache. Pain 20 (1), 30. doi: 10.1186/s10194-019-0984-1
Wu X., Cheng Y., Zeng C., Wang C., Cui Z. (2010). Reproductive performance and offspring quality of the first and the second brood of female swimming crab, portunus trituberculatus. Aquaculture 303 (1-4), 94–100. doi: 10.1016/j.aquaculture.2010.03.006
Xiao X., Fu Z., Zhang Y., Peng Z., Zhang X. (2017). SMS-CQ: A quality and safety traceability system for aquatic products in cold-chain integrated WSN and QR code. J. Food Process. Eng. 40 (1), e12303. doi: 10.1111/jfpe.12303
Xie S., Girshick R., Dollár P., Tu Z., He K. (2017). “Aggregated residual transformations for deep neural networks,” in Proceedings of the IEEE conference on computer vision and pattern recognition. IEEE: Honolulu, HI, USA
Xi R., Wang S., Liu Y., Wang Z. (2021). “Individual identification method of leopard in multiple scenarios,” in 2021 the 4th international conference on image and graphics processing. Association for Computing Machinery: New York, NY, USA
Yang C., Zhang Z., Liu Y., Shan B., Yu W., Li H., et al. (2021). Heavy metal pollution and stable isotope ratios (δ13C and δ15N) in marine organisms from the northern beibu gulf, south China Sea. Mar. pollut. Bull. 166, 112230. doi: 10.1016/j.marpolbul.2021.112230
Yang X., Song Z., Liu J., Gao Q., Dong S., Zhou C. (2021). Deep learning for smart fish farming: applications, opportunities and challenges. Rev. Aquacult. 13, 66–90. doi: 10.1111/raq.12464
Yearbook C. F. S. (2020). China Fishery statistical yearbook Vol. 2020 (Beijing: China Agriculture Press), 24–34.
Yu C. G., Song H. T., Yao G. Z., Lv H. Q. (2006). Composition and distribution of economic crab species in the East China Sea. Oceanol. Limnol. Sin. 37 (1), 53–60. doi: 10.3321/j.issn:0029-814X.2006.01.009
Zhang K., Xin Y., Shi C., Xie Z., Ren Z. (2022). A pyramidal feature fusion model on swimming crab portunus trituberculatus re-identification. Front. Mar. Sci. 9. doi: 10.3389/fmars.2022.845112
Zhang Z., Lan C., Zeng W., Jin X., Chen Z. (2020). “Relation-aware global attention for person re-identification,” in Proceedings of the ieee/cvf conference on computer vision and pattern recognition. IEEE: Seattle, WA, USA
Zhao L., Xing B., Li W., Wu X., Yang X. (2012). Agricultural products quality and safety traceability system based on two-dimension barcode recognition of mobile phones. Nongye. Jixie. Xuebao/Transactions. Chin. Soc. Agric. Machinery. 43 (7), 124–129. doi: 10.6041/j.issn.1000-1298.2012.07.023
Keywords: crab, deep learning, individual identifcation, re-identification, local feature
Citation: Wu C, Xie Z, Chen K, Shi C, Ye Y, Xin Y, Zarei R and Huang G (2023) A Part-based Deep Learning Network for identifying individual crabs using abdomen images. Front. Mar. Sci. 10:1093542. doi: 10.3389/fmars.2023.1093542
Received: 10 November 2022; Accepted: 17 January 2023;
Published: 07 February 2023.
Edited by:
Simone Marini, National Research Council (CNR), ItalyReviewed by:
Marco Spoto, National Research Council (CNR), ItalyMattia Cavaiola, University of Genoa, Italy
Luciano Ortenzi, University of Tuscia, Italy
Copyright © 2023 Wu, Xie, Chen, Shi, Ye, Xin, Zarei and Huang. This is an open-access article distributed under the terms of the Creative Commons Attribution License (CC BY). The use, distribution or reproduction in other forums is permitted, provided the original author(s) and the copyright owner(s) are credited and that the original publication in this journal is cited, in accordance with accepted academic practice. No use, distribution or reproduction is permitted which does not comply with these terms.
*Correspondence: Zhijun Xie, eGllemhpanVuQG5idS5lZHUuY24=; Ce Shi, c2hpY2VAbmJ1LmVkdS5jbg==