 Marina Marrari1*
 Johel Chaves-Campos2Moisés Mug Villanueva1Damián Martínez-Fernández1Henry Marín Sandoval1Todd Staley Meier1
- 1Federación Costarricense de Pesca (FECOP), San José, Costa Rica
- 2Verto Education, Centro Agronómico Tropical de Investigación y Enseñanza, Turrialba, Costa Rica
Fishing tourism represents a vital industry in Costa Rica, generating over US$520 million and attracting 150,000 tourists every year. The main objective of this study is to examine trends and variability in local abundances of sailfish Istiophorus platypterus, the main sportfish in Pacific waters of Costa Rica, and quantify the influence of environmental and anthropogenic factors. We compiled and analyzed sailfish information collected from sportfishing operations. Sailfish abundances were examined in relation to environmental conditions and commercial fishing. Timeseries analyses showed significant declining trends in local abundances of sailfish in the southern and central Pacific of Costa Rica over the last decade. Bycatch records from the commercial purse seine fleet operating in Costa Rican waters also show a declining trend in sailfish numbers. On the other hand, commercial landings from the national longline fleet show a significant increase of 108%, on average, over the past decade. Different numerical models indicated that fishing pressure from the national fleet and also sea surface temperature with different time lags affect local abundances of sailfish. While other countries in Central and North America protect sailfish and other species of tourist interest, Costa Rica still allows the landing and sales of billfishes as seafood. The results presented in this study highlight the need to allow for the recovery of local abundances of sailfish and promote the development of the coastal communities that depend on marine tourism as their main source of income.
Introduction
Sailfish (Istiophorus platypterus) is an epipelagic billfish species of significant ecological and socioeconomic importance common in tropical and temperate waters of the Pacific, Atlantic and Indian Oceans (Nakamura, 1985; Prince et al., 2006; Mourato et al., 2014; Fitchett, 2015). In the eastern Pacific Ocean (EPO) it is distributed between Ecuador and the Gulf of California and is the most abundant istiophorid off Central America’s coast (Prince et al., 2006). It is caught as bycatch in purse-seine fisheries targeting tropical tunas, distant water tuna-targeting longline fleets from China, Taipei, Japan, Korea, and Costa Rica, smaller-vessel longline fleets targeting tuna and non-tuna species, particularly those operating off the coast of Central America, and artisanal fisheries in Mexico, Guatemala, Costa Rica, and Panama (Prince et al., 2006). Maximum catches have been reported along the coast of Central America (Ehrhardt and Fitchett, 2006), with highest abundances closer to the coast in response to changes in the oceanographic conditions.
Sailfish are also the main target of economically important catch-and-release recreational fisheries (Cerdenares-Ladrón de Guevara et al., 2012; Hinton and Maunder, 2014; Fitchett, 2015; Pohlot and Ehrhardt, 2018). In the last years Guatemala, Costa Rica, and Panama have been recognized as some of the world’s best fishing grounds (Ehrhardt and Fitchett, 2006; Pohlot and Ehrhardt, 2018), where recreational fishing contributes significantly to the local economy (Gentner, 2007). In Costa Rica, fishing tourism represents a well-developed industry with an estimated 150,000 tourists visiting every year mainly to fish (Cascante and Marín, 2019). It has been estimated that sportfishing generates more than US$520 million a year for the national economy and supports 33,000 jobs (FECOP, 2016; Cascante and Marín, 2019). Locally, families related to the sportfishing industry report a better quality of life and an income up to 45% higher than the average for local coastal communities (Cascante and Marín, 2019). Recreational fishing infrastructure is well developed compared to other countries in the region, with six functioning marinas and a few others at different stages of planning, numerous fishing lodges, and a current total of 623 registered boats for sports and tourist fishing (www.incopesca.go.cr).
Costa Rica’s Fishing and Aquaculture Law No. 8436 declares sailfish, marlins, and tarpon as species of tourist interest but does not give them significant protection from commercial exploitation. Existing regulations from the Fishing Authority partially regulate the commercial harvest of sailfish, with restrictions including a prohibition for the national longline fleet to actively target sailfish, a ban on the use of live bait within 30 miles from the coast, and a requirement to limit sailfish bycatch to 15% of the total landings for any commercial boat. In addition, any sailfish found alive in longlines is required to be released. However, these regulations are often not enforced and large volumes of sailfish are regularly landed and commercialized. There are about 350 Costa Rican fishing vessels targeting pelagic fish species with surface longline gear in the Pacific Ocean. Length of longline sets vary between 6 and 70 nautical miles and deploy between 200 to 2800 hooks in surface waters (Pacheco-Chávez et al., 2020). According to Villalobos-Rojas et al. (2014) and Dapp et al. (2013) sailfish are one of the most common bony fishes caught in Costa Rica’s longline fisheries. The Ministry of Agriculture conservatively estimated that 28,800 marlin and sailfish are killed annually as bycatch by the country’s commercial longline fleet (Holland et al., 1998). Nonetheless, these data could be underestimated because billfishes are landed without head and fins (Pacheco-Chávez et al., 2020), which can make identification difficult.
Considering the importance of sailfish to Costa Rica’s marine tourism and recent anecdotic observations by anglers of apparent decreased abundances, this study aims to 1) assess local abundances of sailfish using data from sportfishing operations, 2) examine the presence of trends and variability along the southern and central Pacific coast of Costa Rica, and 3) evaluate the effects of environmental and anthropogenic factors. The main hypothesis is that changes have occurred over the last decades in local abundances of sailfish in Pacific waters of Costa Rica, and that both natural and anthropogenic factors have a significant effect on these abundances.
Materials and methods
Study area
The study area included waters between 8.5°N and 10°N along Costa Rica’s Pacific coast, in one of the most important recreational fishing grounds in the world. The area includes the productive and highly biodiverse Golfo Dulce in the southern Pacific and the famous fishing grounds off Quepos and Herradura along the central Pacific coast (Figure 1). The Pacific Ocean along Central America is characterized by a dynamic coastal circulation, seasonal eddies and meanders, and warmer ocean temperatures than those in adjacent waters. It is a very productive region, mainly under the influence of seasonal shifts in the Intertropical Convergence Zone (ICZ), strong easterly winds during winter and spring, and intense seasonal coastal upwelling in some areas (Pennington et al., 2006). The main mode of variability is associated with the El Niño - La Niña phenomenon (Bakun et al., 1999). Other important oceanographic features include a permanent and shallow thermocline and the presence of the Costa Rica Dome in oceanic waters (reviewed in Sasai et al., 2012; Mora-Escalante et al., 2020). Chlorophyll concentrations are controlled mainly by the depth of the thermocline and the intensity of coastal upwelling, which in turn are influenced by seasonal winds. During winter and spring, a latitudinal shift in the ICZ leads to the intensification of the easterlies that blow through topographic features in the Papagayo and Panama gulf areas (Figure 1) pushing surface waters offshore and leading to coastal upwelling of cold nutrient-rich waters that stimulate phytoplankton growth (Figure 1). High abundances of zooplankton (Fernández-Álamo and Färber-Lorda, 2006) and upper trophic level organisms including fish often follow, making these areas attractive feeding grounds for larger pelagic species, such as sailfish and marlins.
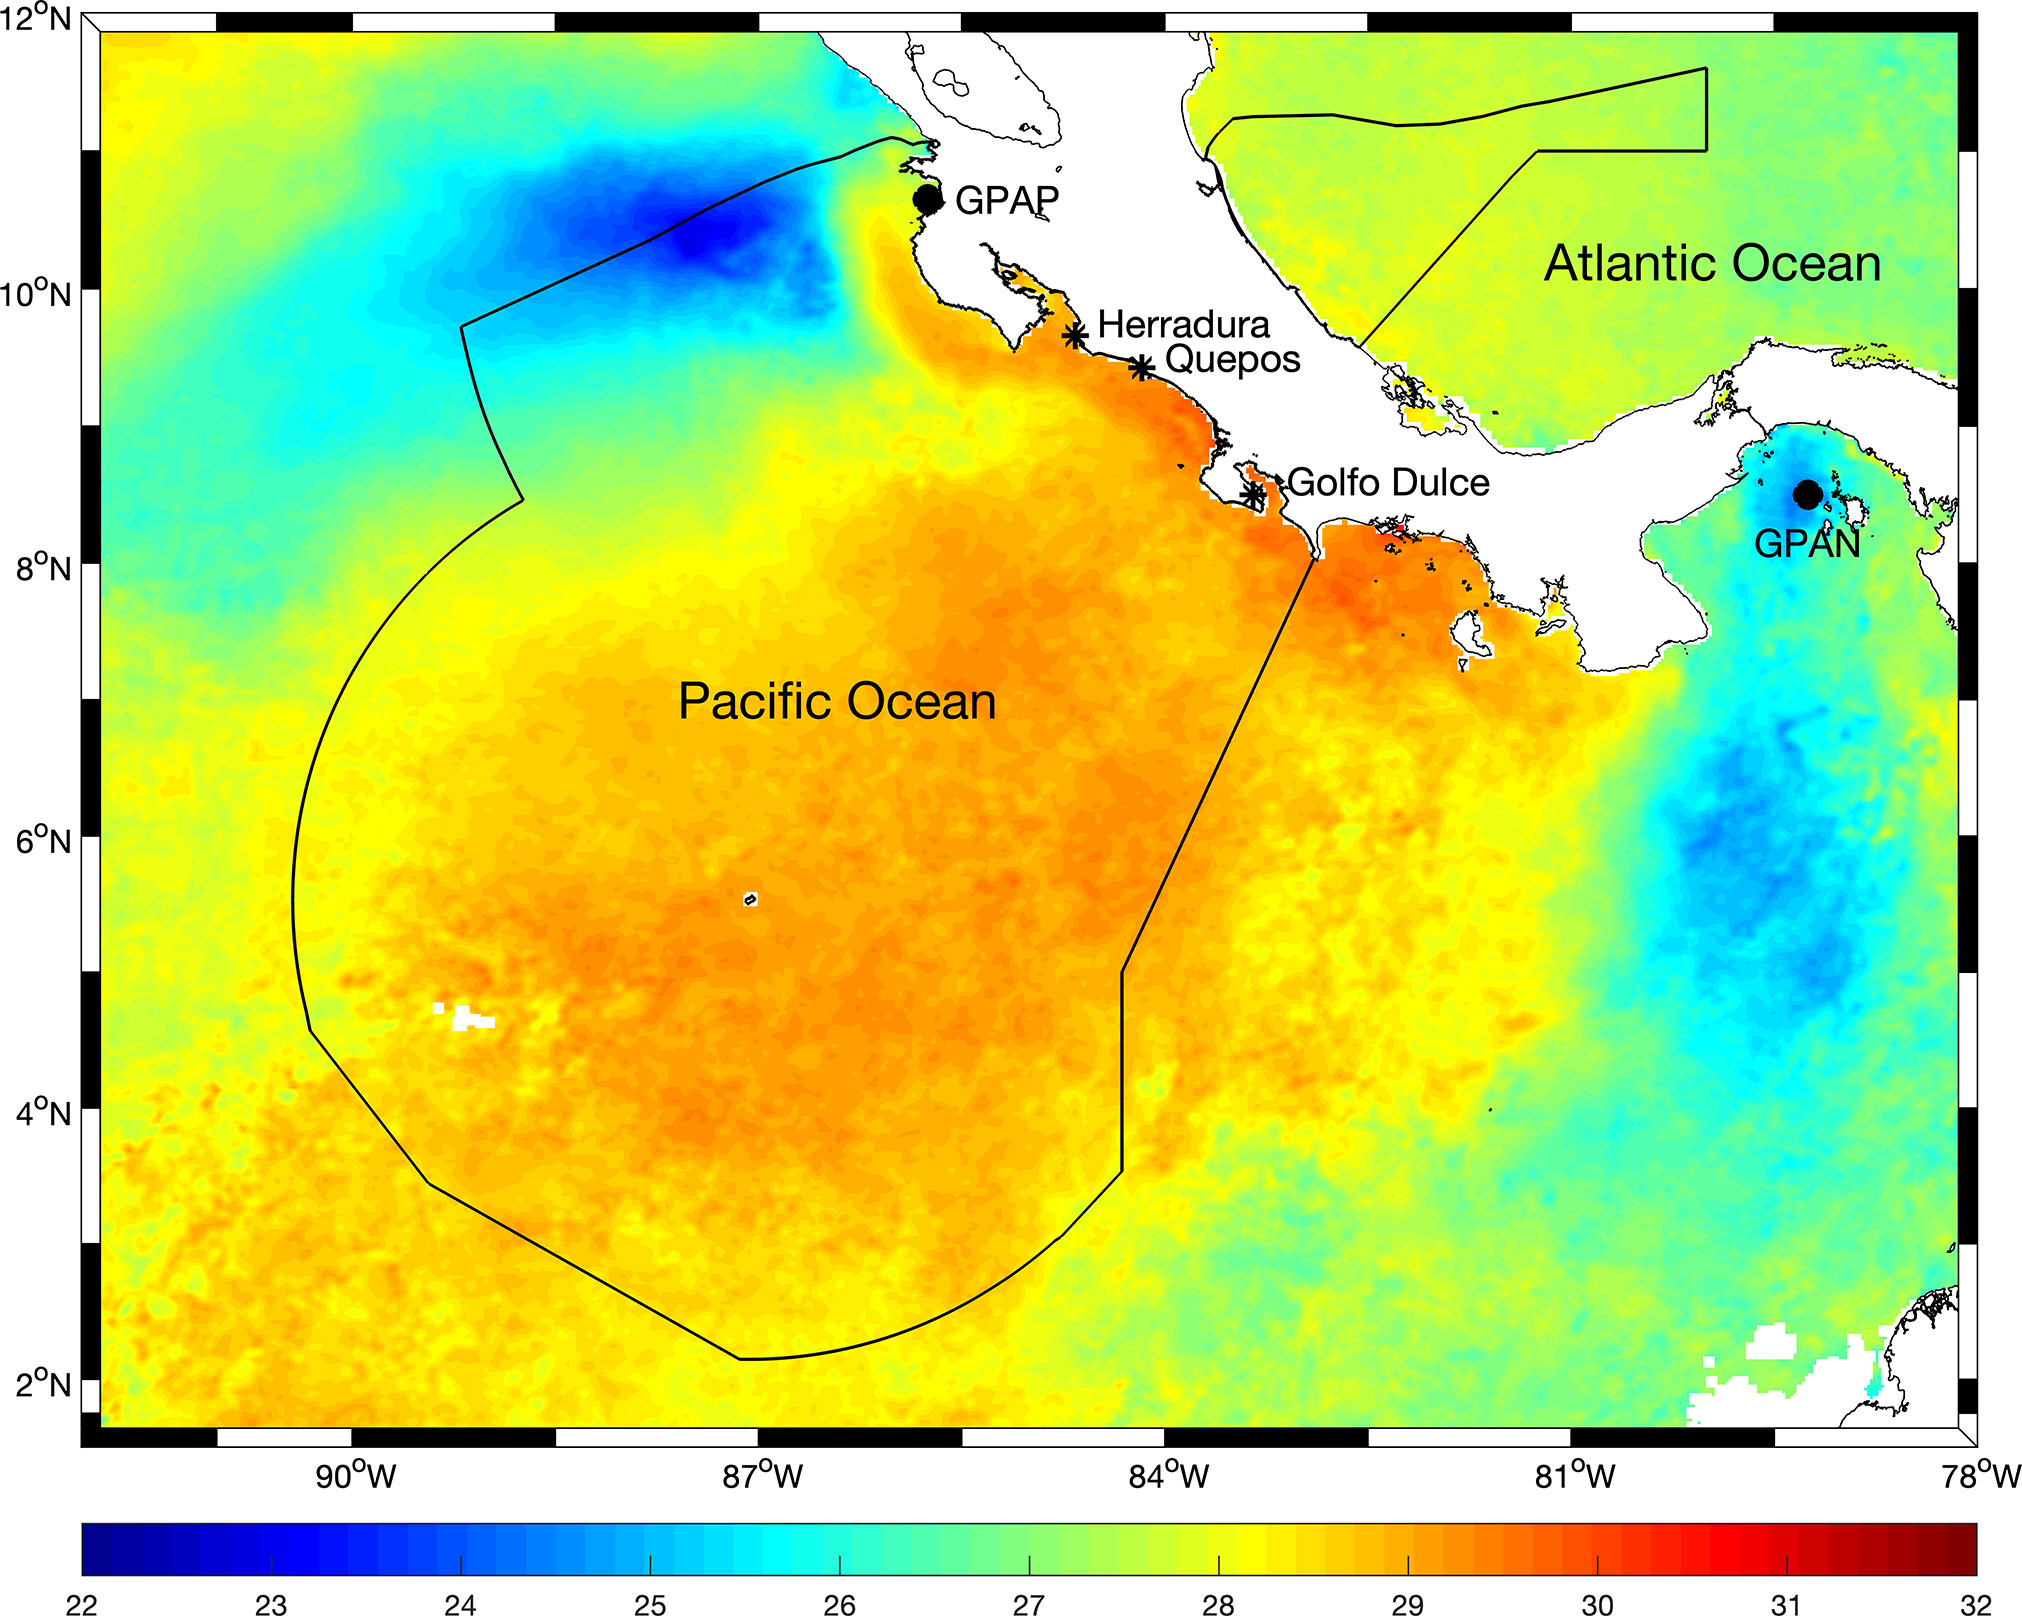
Figure 1 Study area and location of the departure sites for sportfishing operations, over example of the distribution of monthly mean sea surface temperature (in °C) during February 2022 (data from MODIS Aqua, 2 km/pixel). Sportfishing activities were considered to have occurred mainly in an area 25 nautical miles around each of the departure locations indicated with *. GPAP: Gulf of Papagayo, GPAN: Gulf of Panama. The black line indicates the limits of the Costa Rica Exclusive Economic Zone.
Data analysis
Fish data analyzed in this study were collected by members of the sportfishing community. Based on information provided by these members, it is assumed that data were obtained mostly in an area 25 nautical miles around the three departure locations indicated in Figure 1 (i.e., Golfo Dulce, Quepos, and Herradura). In situations where traditional survey data or other datasets collected for scientific purposes are not available, other sources of information can be useful to develop indices of fish abundance (e.g., Pohlot and Ehrhardt, 2018; Haulsee et al., 2022). Sailfish raises, bites and releases were obtained from records of fishing trips from 1) a fishing lodge in the southern Pacific with a fleet of over a dozen boats, 2) a marina in the central Pacific area that collects data from its charter fleet of multiple boats, 3) a private charter boat that routinely operates in the central Pacific off Herradura, and 4) a fishing club that keeps detailed records of its annual sailfish tournament in the central Pacific off Herradura. The information available is summarized in Table 1. The original dataset was standardized to create a consistent database following a number of steps indicated next. For charter boats in the southern Pacific and Quepos in the central Pacific, individual daily fishing records were available. Fishing trips were first classified as offshore, inshore or mixed according to the reported catch. Reports that included only billfish or yellowfin tuna were classified as “offshore”, while those including only coastal species such as roosterfish, jack or snapper were classified as “inshore”. Reports including a combination of inshore and offshore species were classified as mixed. Because inshore trips are done in very coastal waters where target species are others than billfish, these trips were excluded from all analyses. Mixed trips were also excluded because it was not possible to estimate the percentage of fishing effort in inshore versus offshore waters. Only full-day offshore trips were considered. For the charter boat that operates in the central Pacific, aggregated monthly catch data were provided so it was not possible to identify inshore/offshore/mixed trips and all sailfish raises reported were used.
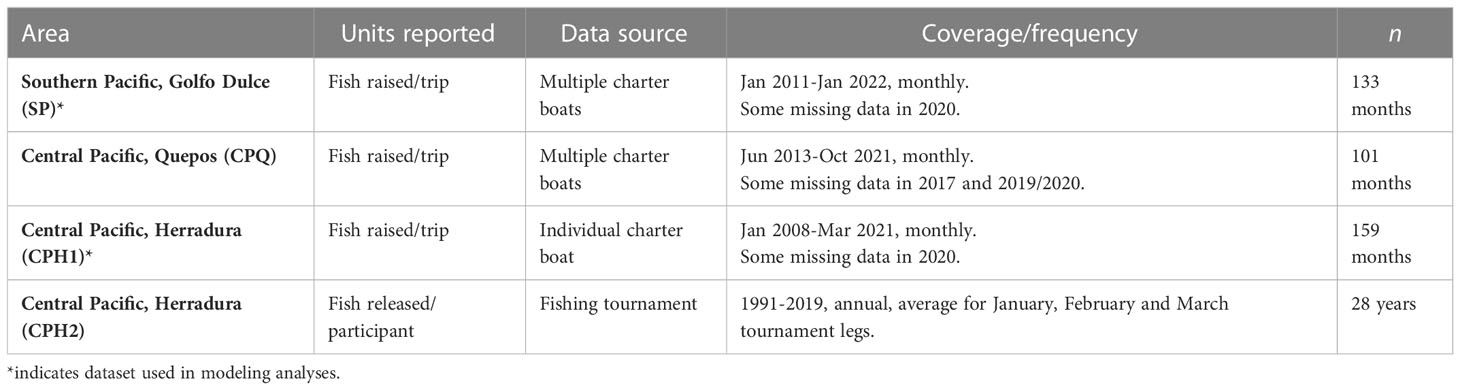
Table 1 Details on the datasets used in the different analyses.
An index of sailfish abundance, Asail, was estimated as the monthly mean number of fish raised per fishing trip for charter boats, and the mean number of sailfish released per participant for tournament data. For tournaments, a yearly mean value was calculated using data from the 3 legs of the tournament that take place during January, February and March of every year. Asail was estimated following:
where Li is the total numbers of sailfish raised (or released) during month or year i and ni is the total number of fishing trips (or tournament participants) during month or year i. When information on both fish raises and releases was available, the number of fish raised per trip was selected based on previous studies that showed that this variable may better reflect the true abundance of sailfish, and that both variables are highly correlated (Ehrhardt and Fitchett, 2006). It is to be noted that the different datasets vary in format, temporal coverage, and frequency so the timeseries developed are not intended to be compared between them. On the other hand, data from each individual source were collected in a systematic and consistent way and, thus, it is possible to analyze each independent timeseries individually, assess the variability at different temporal scales and examine the presence of trends. In an initial analysis, data for the months of peak fishing season in the southern and central Pacific areas (January-April) were considered and an annual peak-season mean abundances of sailfish was calculated at each location. Preliminary linear regression analyses were done on the four resulting timeseries to assess the presence of general trends.
After the initial exploratory analyses using annual peak-season averages for all the data sources available, only the longest most consistent timeseries with highest resolution (monthly), including southern Pacific (SP) and central Pacific Herradura (CPH1), were selected for the following analyses. This was done because tournament data include only annual values, while the central Pacific Quepos timeseries presented several missing records in multiple years and an overall shorter temporal coverage. For SP, individual (1 month) missing records occurred five times throughout the 10-year long timeseries. In this case, a linear interpolation was performed between the preceding and subsequent records to fill in the missing value. For both SP and CPH1, a period of 7 consecutive missing records occurred between April and October 2020 due to the complete cease in fishing activities that occurred in Costa Rica during the COVID-19 pandemic. In this case, each monthly value was filled in by averaging the Asail value for the same month during the previous and the following years (arithmetic mean of Asail 2019 and 2021 for each missing month in 2020). The performance of this method was assessed by comparing the trends obtained for the filled-in datasets versus the original datasets truncated in March 2020 before the missing data period.
Once both datasets were complete with no missing records, timeseries of monthly Asail were generated for SP and CPH1 in order to assess the temporal variability in the abundance of sailfish and the presence of trends. In addition, to evaluate the occurrence of deviations from average conditions, anomalies in the abundance of sailfish were calculated by subtracting the monthly climatological mean from each monthly abundance value. Monthly climatological means were calculated as the average Asail for a given month including all years in the study period. For example, the monthly climatology value for January in the southern Pacific was estimated as the mean of all January Asail values between 2011 and 2022 in that area (n=12).
Publicly available data on sailfish commercial landings reported by the national longline fleet were obtained from the Costa Rica Fishing and Aquaculture Institute, INCOPESCA (https://www.incopesca.go.cr/acerca_incopesca/transparencia_institucional/datos_abiertos.aspx) for the period January 2010 - December 2019 (n=120). Total monthly sailfish landings (in kilograms) were estimated for all national ports on the Pacific Ocean combined, and included the ports of Guanacaste, Puntarenas, Quepos, and Golfito.
In order to examine the occurrence of any deviations from average landing patterns, monthly anomalies in sailfish landings were calculated by subtracting the corresponding monthly climatological mean sailfish landings (in kilograms) from the monthly landing data reported. For example, the climatological mean sailfish landings for January was calculated as the mean of all values reported for January 2010-2019, and was then subtracted from all January values in the original timeseries.
Environmental data analyzed included monthly average sea surface temperature (SST, °C) and surface chlorophyll a concentration (CHL, mg/m3) (as a proxy for primary production) from MODIS onboard Aqua with a 2 km/pixel resolution. In order to assess the effects of SST and CHL on sailfish abundances, data for the period January 2010 – October 2021 were examined. Assuming that most sportfishing trips occur within 25 miles of the coast, SST and CHL data were extracted for an area approximately 50x50 km around the different sportfishing departure locations in the southern and central Pacific areas in order to assess environmental conditions in the main sportfishing grounds. Preliminary analysis showed that SST and CHL in the central Pacific area off Herradura were very similar to those off Quepos, but because Herradura is influenced by the Gulf of Nicoya area where significant land runoff occurs that may more strongly affect the satellite signal, the Quepos environmental conditions were selected as representative of the central Pacific. For SST, the monthly mean value for each area was calculated. Because the natural distribution of chlorophyll is log-normal (Campbell, 1995), the areal median was used for CHL. Data are distributed by NASA Goddard Space Flight Center.
To assess the effects of El Niño – La Niña on local oceanographic conditions and the abundance of sailfish, Oceanic Niño Index (ONI) data were obtained from https://origin.cpc.ncep.noaa.gov/products/analysis_monitoring/ensostuff/ONI_v5.php.
Two different numerical models were examined to model the monthly abundance of sailfish in the southern and central Pacific areas and evaluate the effects of environmental conditions and commercial fishing: a Seasonal Autoregressive Integrated Moving Average (ARIMA) model and a Linear Autoregressive (Linear_AR) model. ARIMA models incorporate both non-seasonal and seasonal factors and also error terms. These models represent a good tool to fit and forecast timeseries. A common notation is ARIMA(p,d,q)×(P,D,Q) S, where p is the non-seasonal autoregressive order, d is the non-seasonal differencing, q is the non-seasonal moving average order, P represents the seasonal autoregressive order, D is the seasonal differencing, Q is the seasonal moving average order, and S is the time span of repeating seasonal pattern (Hyndman and Athanasopoulos, 2018). Based on preliminary inspections of autocorrelations and partial autocorrelations (Hyndman and Athanasopoulos, 2018) a seasonal ARIMA(1,0,2)x(1,0,0),12 (months) was selected for this study. ARIMA models were fit using the R package Sarima (Boshnakov, 2017).
The Linear_AR is a linear model with autoregressive and moving average error structure. Specifically, autocorrelation-moving average correlation structure of order (p, q) was selected using the same notation mentioned above for ARIMA. This model was fit using the R package nlme (Pinheiro et al., 2021). Despite its simpler structure compared to ARIMA, this type of model allows the calculation of the percent variance explained by variables in the model (R package MuMIn; Barton, 2019), which is not possible with ARIMA models.
The two longest and most consistent timeseries, SP and CPH1, were included in the modelling analyses. Preliminary examinations showed that SST, CHL, and ONI were not independent and that SST had the strongest relationship with the abundance of sailfish; consequently, commercial landings and SST with different lags previously identified by cross-correlation analysis were selected as explanatory variables and included in the models. Sailfish abundance data were log-transformed prior to model run. To assess the performance of the models, the root mean squared error (RMSE) and the mean absolute error (MAE) were calculated for each timeseries following:
where n is the number of datapoints in a t is month and e is the difference between the true value and the estimated value.
In addition to sailfish abundance data from the recreational fishery and commercial landings from the national longline fleet, sailfish bycatch data from the international purse seine fleet, available for Costa Rican waters through the Inter-American Tropical Tuna Commission, IATTC, were analyzed. The presence of trends in the volume of sailfish caught per fishing set (in metric tons) within the Costa Rica Exclusive Economic Zone was examined for the period 1993-2019. The IATTC is the regional fisheries management organization (RFMO) responsible for the conservation and management of tuna and tuna-like species, associated species, and their ecosystems throughout the EPO. Through their onboard observer program, information on tuna and all bycatch species is collected. Using this information, we calculated the total volume of sailfish caught as bycatch every year during the study period (2010-2019) for fishing sets done within the Costa Rica EEZ only.
Finally, the distribution of apparent fishing effort for the Costa Rican advanced longline fleet (comprised by approximately 70 boats) was analyzed from public Vessel Monitoring System data (VMS) distributed by Global Fishing Watch through https://globalfishingwatch.org/. The spatial distribution of fishing effort over an entire year, reported as total hours of apparent fishing at each location by all longline boats from the advanced fleet flagged in Costa Rica was examined and the areas of most intense fishing were identified. Global Fishing Watch, a provider of open data for use in this article, is an international nonprofit organization dedicated to advancing ocean governance through increased transparency of human activity at sea. The views and opinions expressed in this article are those of the authors, which are not connected with or sponsored, endorsed or granted official status by Global Fishing Watch. By creating and publicly sharing map visualizations, data and analysis tools, Global Fishing Watch aims to enable scientific research and transform the way our ocean is managed.
Results
Analysis of the four independent timeseries of annual mean sailfish abundance estimated from sportfishing operations for peak season, Asail, showed that, although there is interannual variability, the abundance of sailfish has decreased over the last decade along the southern and central Pacific coast of Costa Rica (Figure 2). For the southern Pacific, the negative linear trend represents an average decrease in the peak season mean abundance of sailfish (January-April) of 70.56% since 2011 (Figure 2A), whereas in the central Pacific average decreases were 88.26% (Figure 2B and 42.04% (Figure 2C) for charter operations, and 46.41% for tournament releases (Figure 2D). Even when data have different formats, spatial and temporal coverage and sampling frequency, there is correlation between areas (Table 2) and consistency in the trends and variability observed, suggesting that the processes that control the abundance of sailfish in the area are not localized and impact a broader area, and that the data collected from different sources are consistent and representing well sailfish abundances.
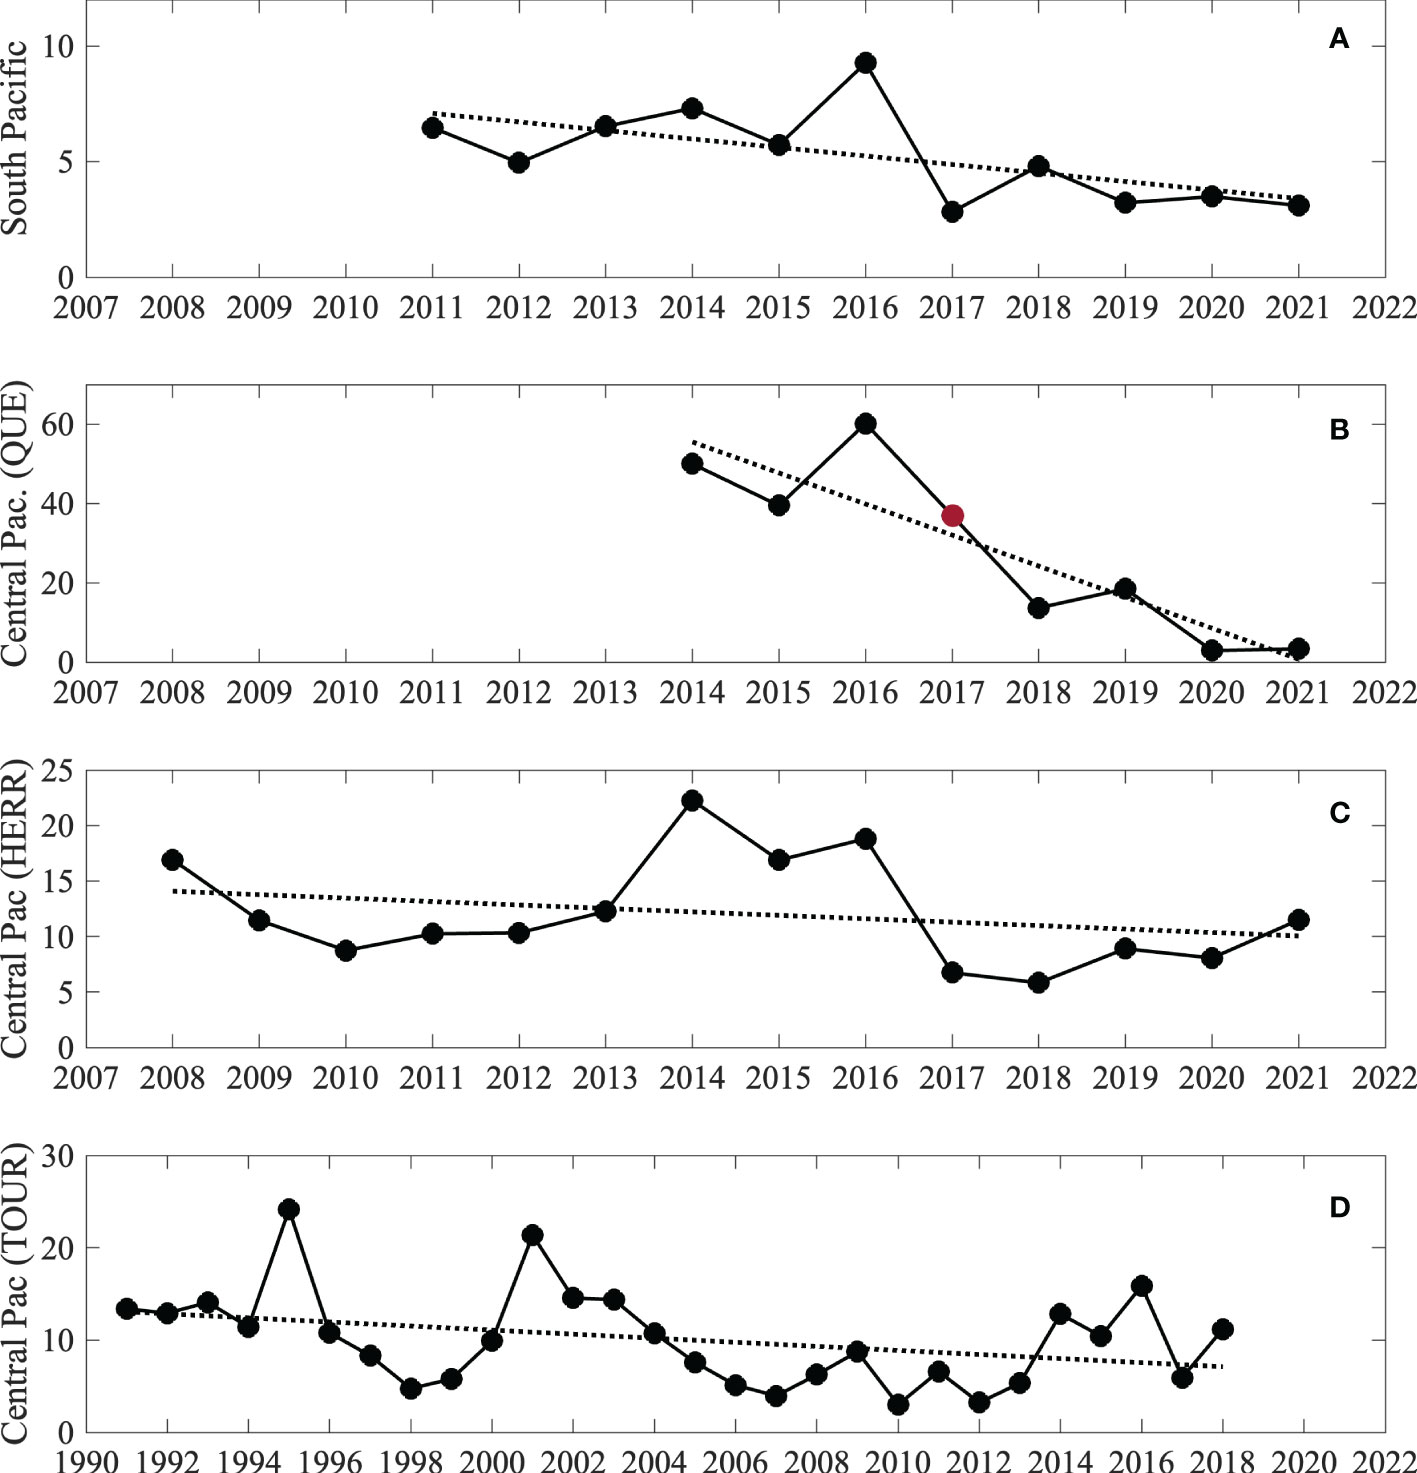
Figure 2 Timeseries of annual peak-season mean sailfish abundance, Asail, at different locations along the southern and central Pacific coast of Costa Rica. For (A–C) data correspond to the average monthly abundance calculated for the months of peak fishing season (January-April). Tournament data in (D) are the average of the 3 tournament legs that take place during January, February and March of each year. For (B), data for 2017 are not available, thus the value was linearly interpolated to estimate the trend (red circle).
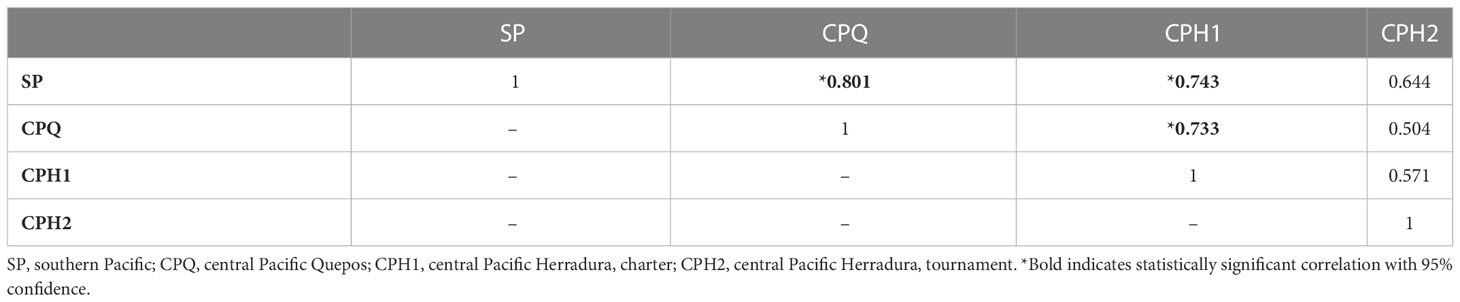
Table 2 Correlation matrix for sailfish abundance data from sportfishing operations in four different areas.
Considering the more detailed monthly timeseries data for the southern (SP) and central Pacific (SPH), linear trend analyses also indicated significant decreases in the availability of sailfish to recreational anglers (Figure 3, top). Average decreases were 75.50% between 2011 and 2022 for SP (p=8.42e-7, n=133) and 44.22% between 2008 and 2021 for CPH1 (p=0.0163, n=159). The trends estimated after filling in the missing values in April-October 2020 were similar to those calculated for both timeseries truncated in March 2020. For SP, the slope of the linear regression was -0.0256 for January 2011- January 2022 and -0.0258 for January 2011-March 2020, while for CPH1 slopes were -0.0242 for January 2008-March 2021 and -0.0258 for January 2008-March 2020.
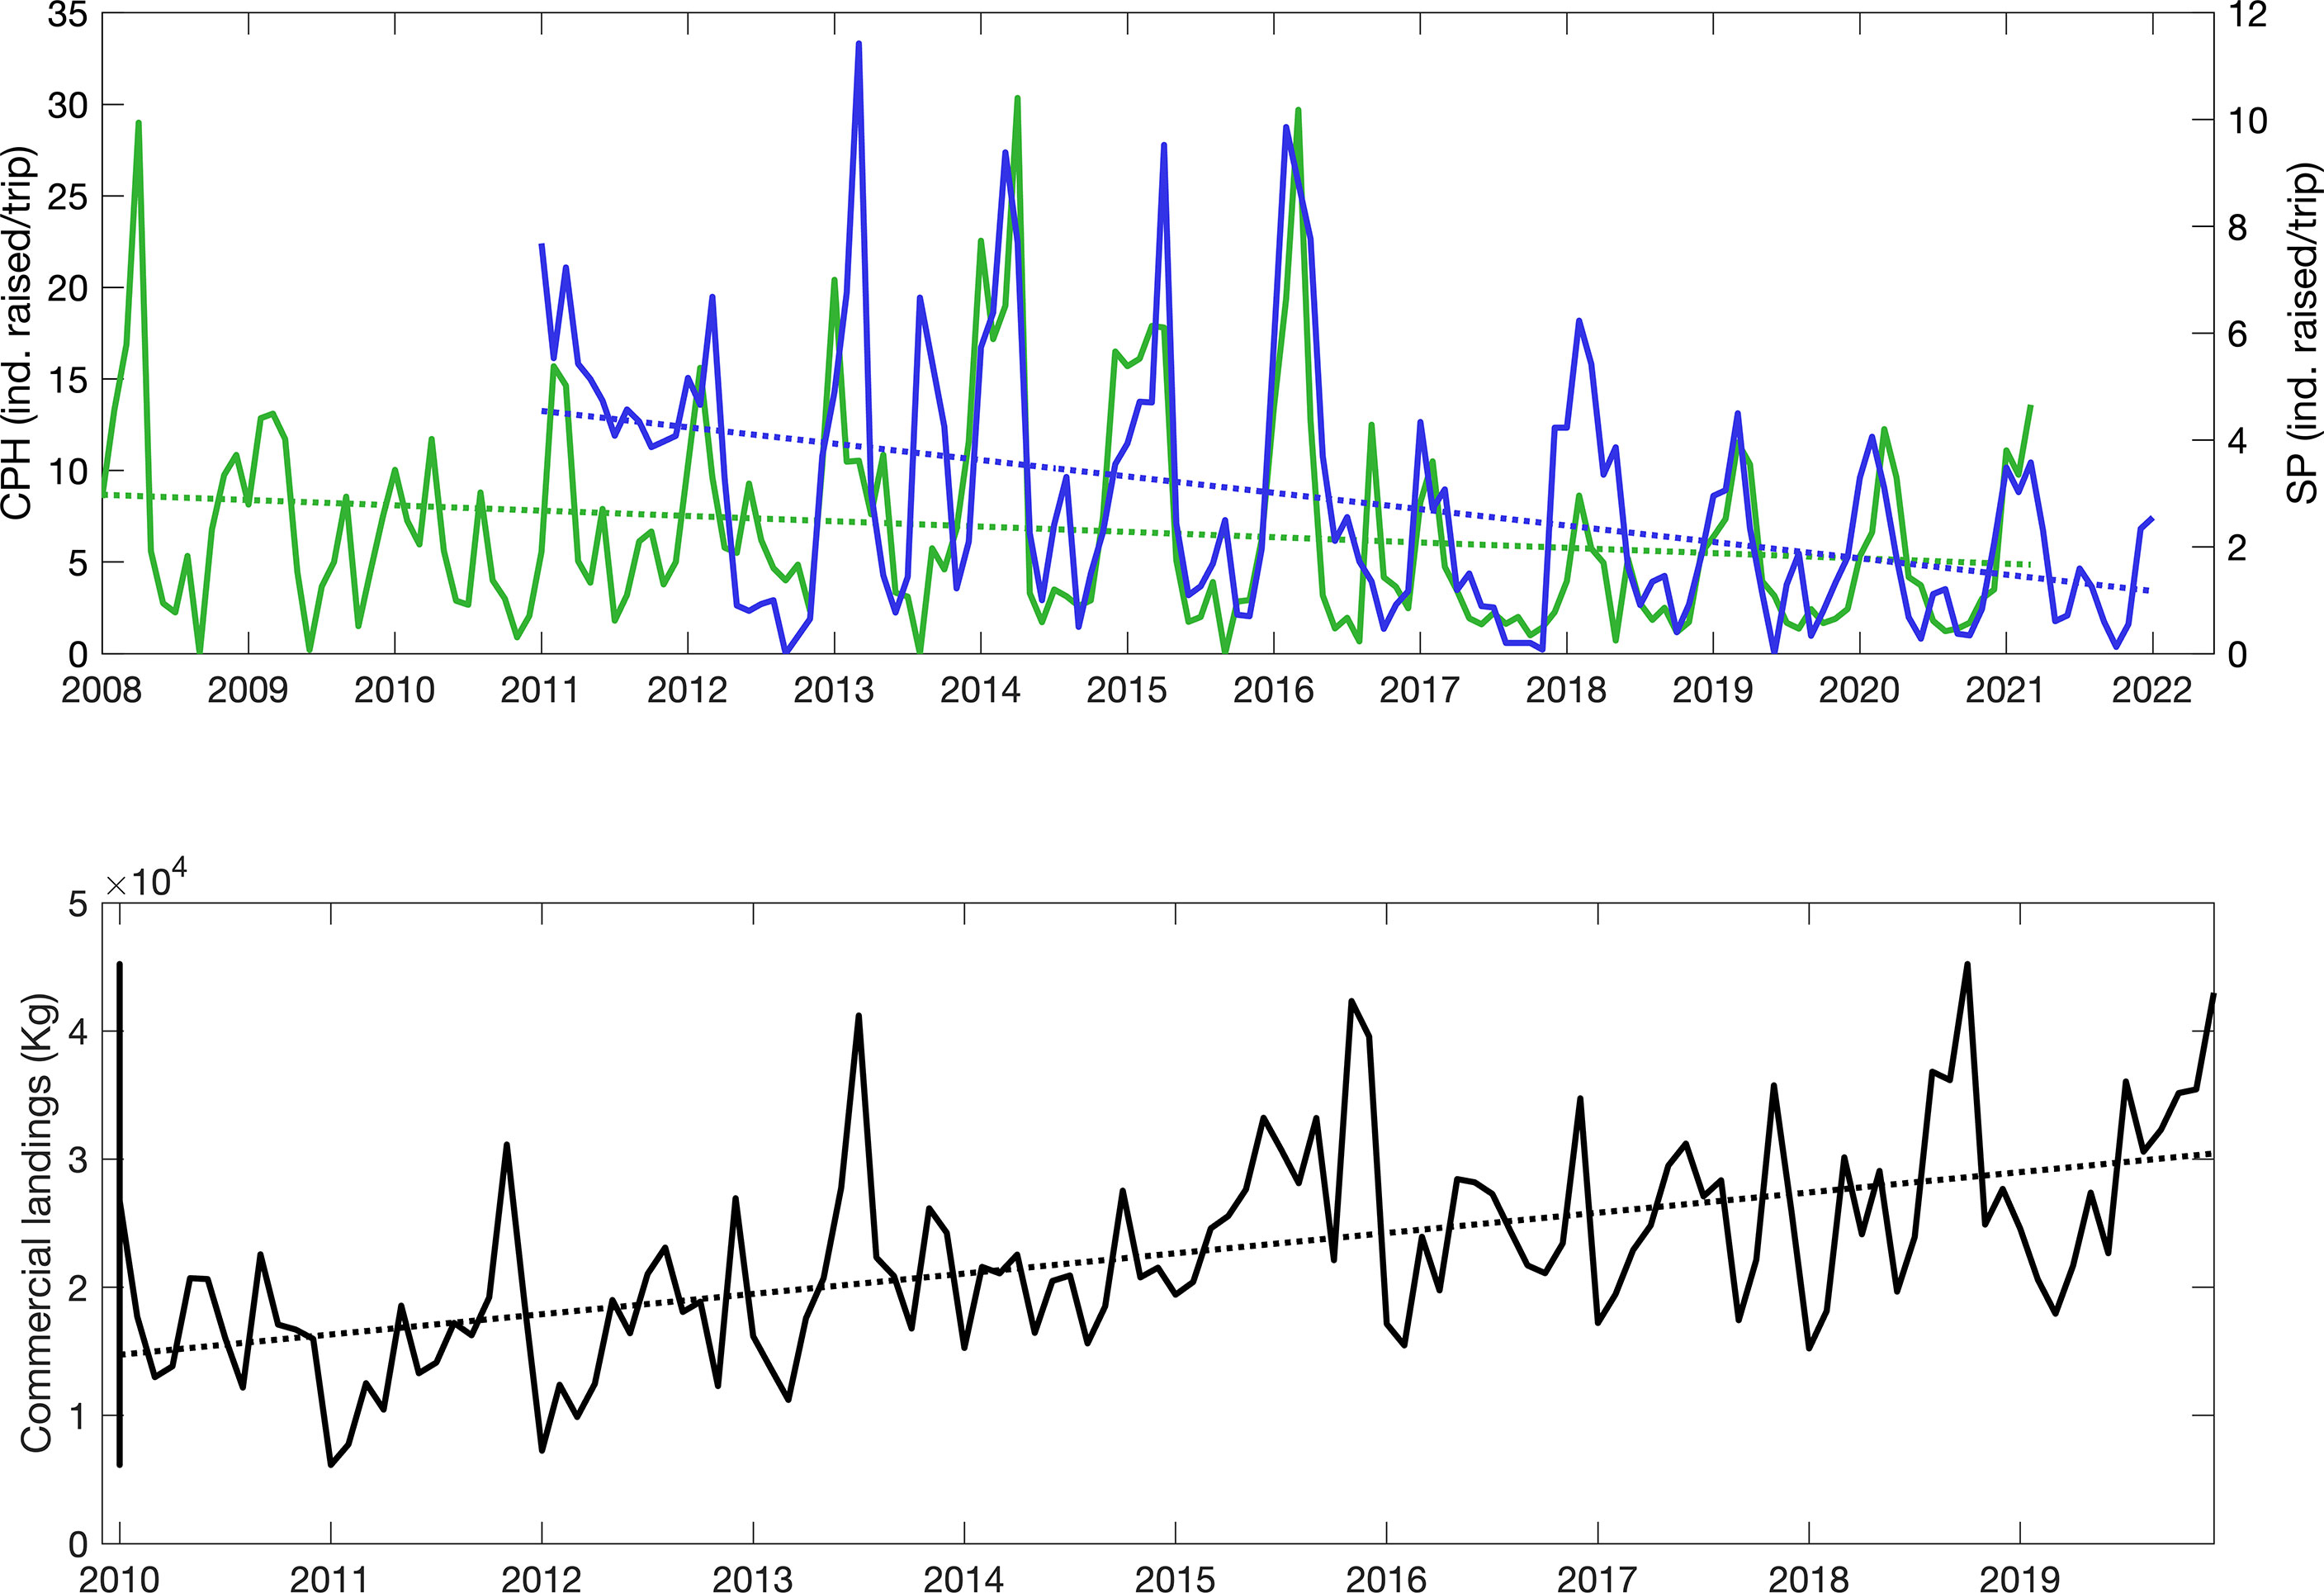
Figure 3 Top: Monthly abundance of sailfish, Asail, estimated from recreational fishing operations in the southern (SP, blue) and central (CPH1, green) Pacific areas. Values reported are average number of sailfish raised per fishing trip per month. Blue and green dotted lines represent the corresponding linear fit. Trendlines are y = -0.0256x + 4.5699 (n=133) for SP and y = -0.0242x + 8.702 (n=159) for CPH1. Bottom: Total monthly commercial sailfish landings (black, in kilograms) reported for all national ports on the Pacific coast of Costa Rica combined. Trendline is y = 132x + 14,601 (n=120), which represents an average total increase of 108.46% between 2010 and 2019.
In contrast to the declining sailfish abundances available to the sportfishing sector at the locations examined, the reported sailfish commercial landings for all national ports on the Pacific coast of Costa Rica have increased significantly since 2010, with an average rise in landings of 108% for the period 2010-2019 (p=2.41e-12, n=120) (Figure 3, bottom). Significant negative correlations were observed between commercial landings and sailfish abundance from sportfishing operations for both SP (R2= 0.478, p<0.0001, n=108) and CPH1 (R2= 0.349, p=0.0001, n=120) areas. A maximum reported value for commercial landings of 45,222 kg/month occurred in October 2018, followed by peaks of 42,979 kg/month in December 2019, 42,335 kg/month in November 2015, and 41,205 kg/month in July 2013. Minimum values of 6,134 and 7,248 kg/month were reported for January 2011 and January 2012, respectively.
Timeseries of monthly anomalies in sailfish commercial landings and sailfish abundances from sportfishing operations also show that, in general, periods of above-average commercial fishing are associated to lower-than-normal availability of sailfish to recreational anglers, and vice versa, particularly after 2015 when the diverging trends seem to amplify (Figure 4). This is true for both the southern and central Pacific areas analyzed. In the southern Pacific, above-average sailfish abundances were recorded during 2011, early 2013, 2014, 2015 and 2016, but availability was below normal thereafter. In the central Pacific, positive anomalies were observed in early 2014 and 2016, with below-average abundances consistently recorded thereafter.
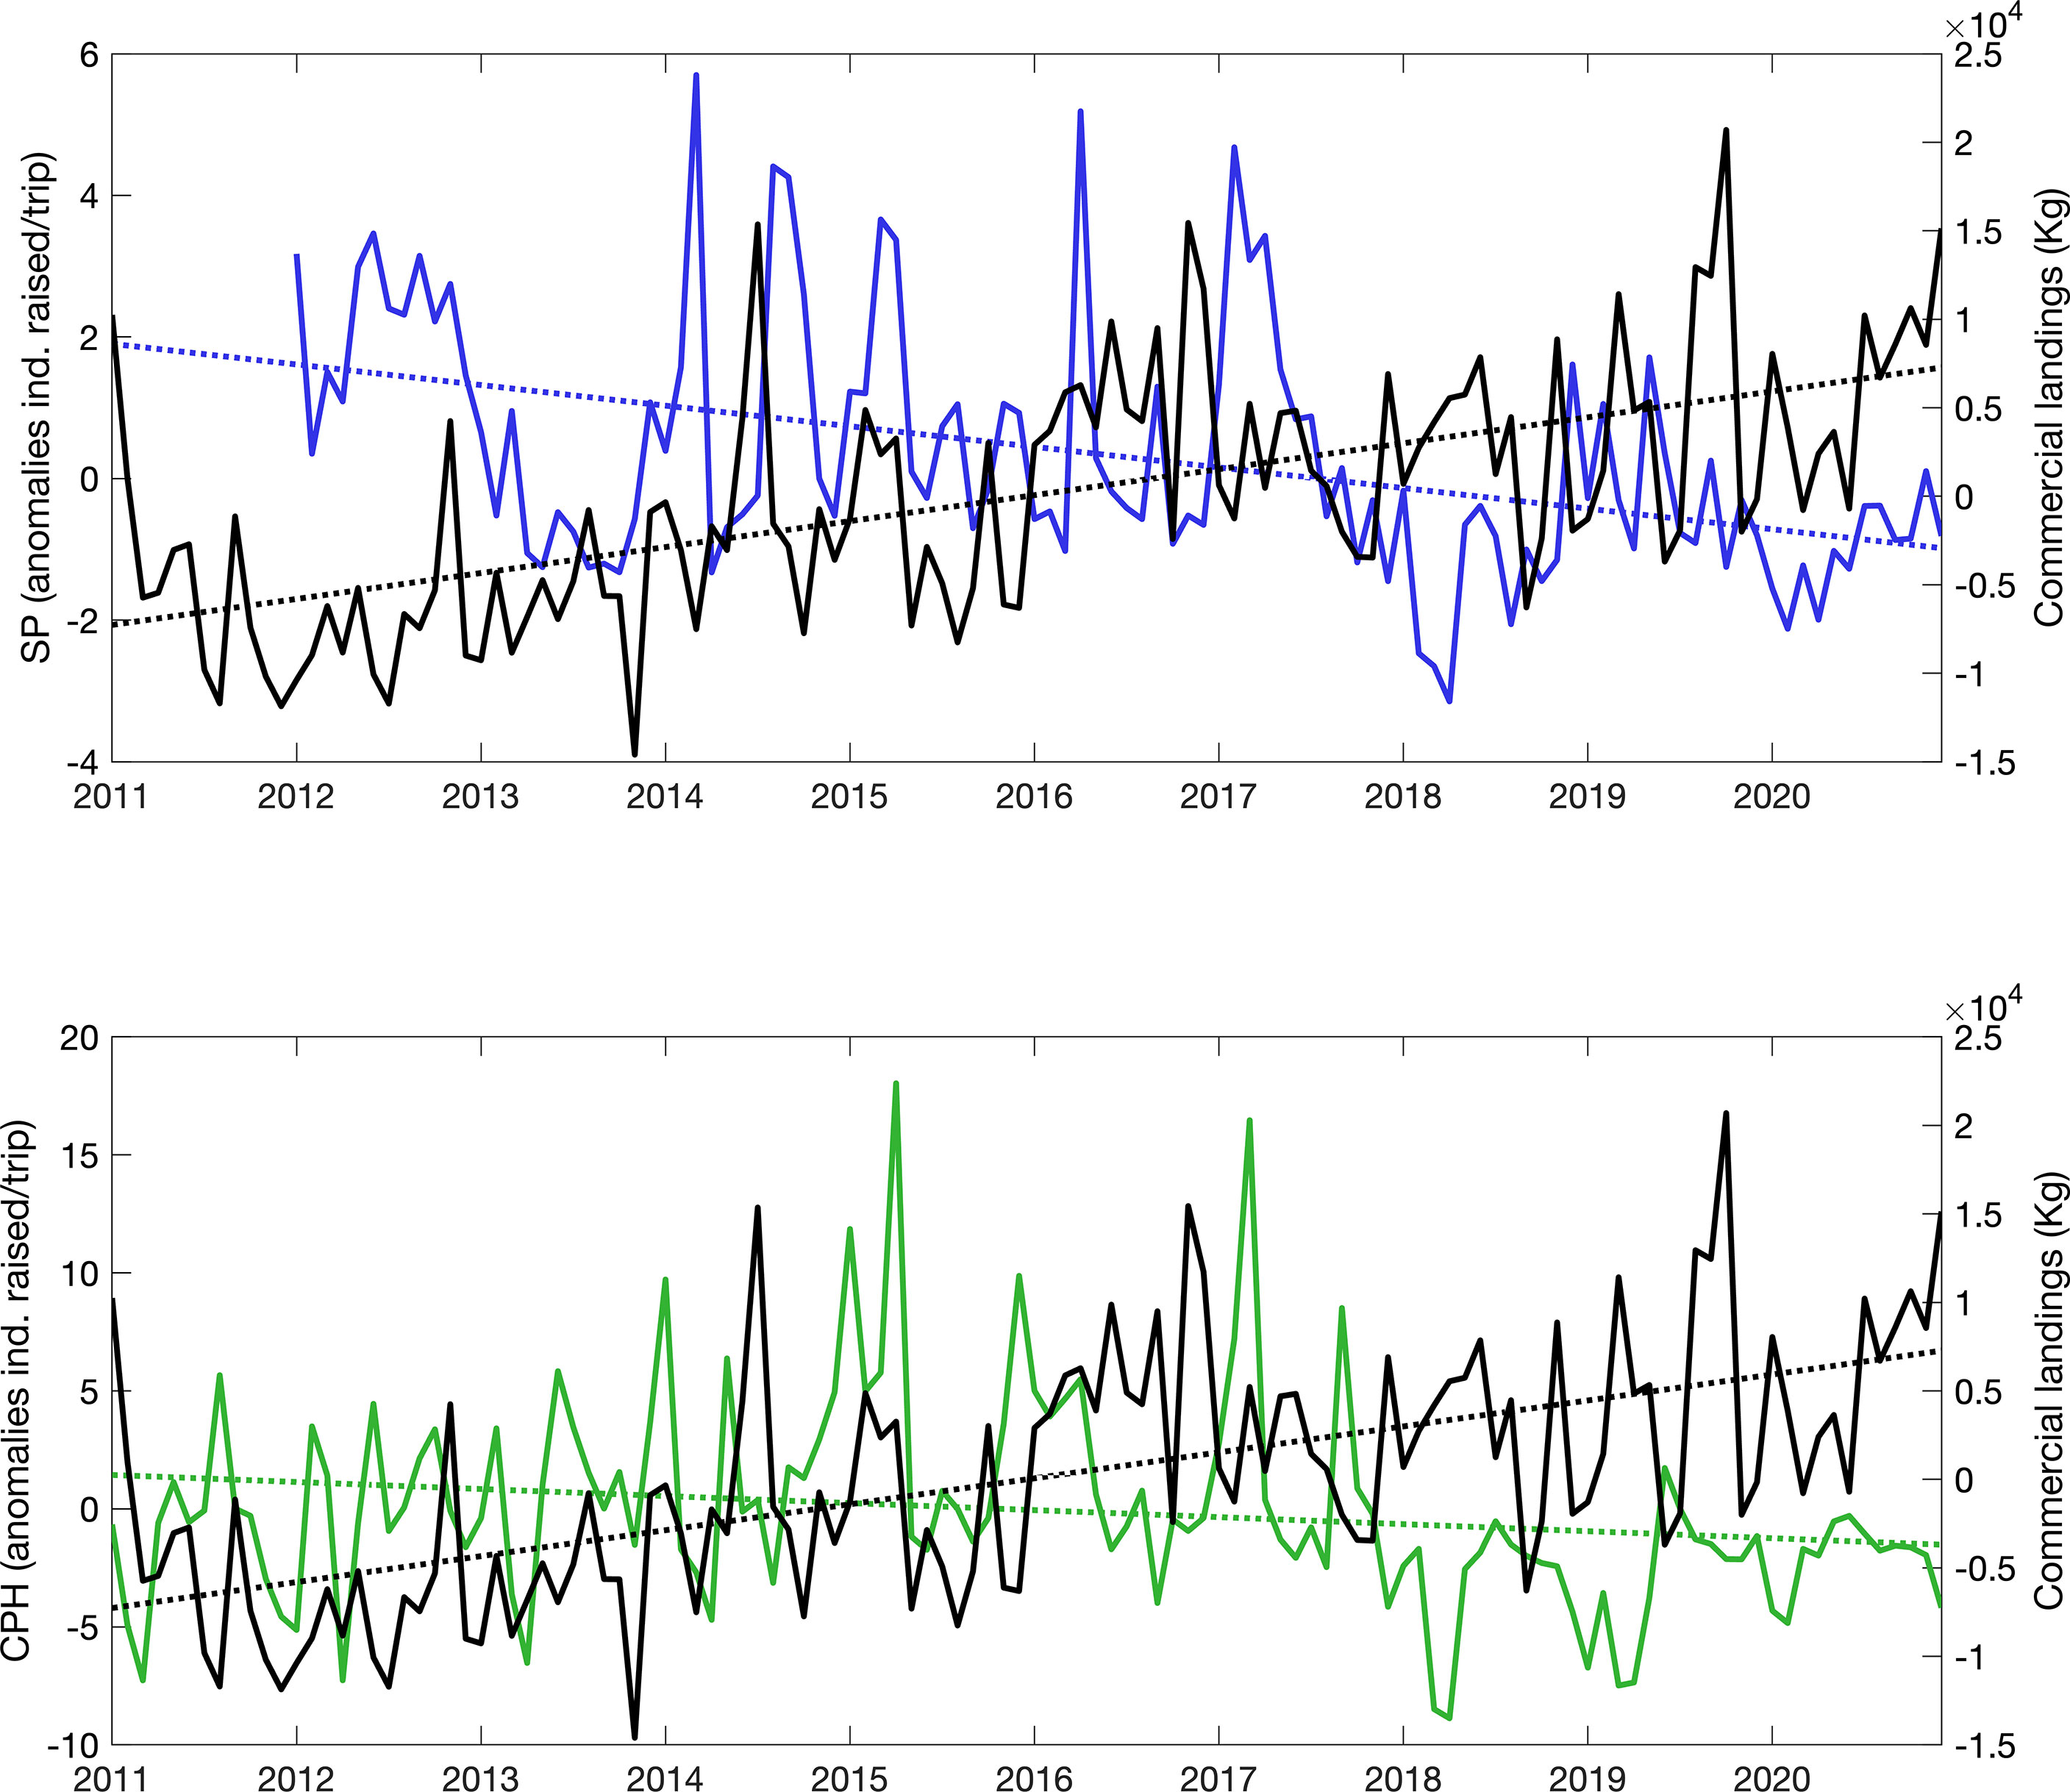
Figure 4 Timeseries of anomalies in monthly commercial landings of sailfish for all national Pacific ports combined (black, kilograms) and anomalies in the monthly mean abundance of sailfish recorded by sportfishing operations (ind. raised/trip) in the southern (SP, blue, upper panel) and central CPH1, green, lower panel) Pacific areas.
Environmental conditions and variability
Oceanographic conditions were generally very consistent between the 2 subareas studied. Monthly climatologies of sea surface temperature (SST) and surface chlorophyll concentrations (CHL) indicate that both variables are negatively correlated in the SP and CPH1 subareas (SP: R2= 0.7301, p=0.0004, n=12; R2= 0.5288, p=0.0074, n=12). Warmest temperatures normally occur during January-April, in coincidence with the lowest average chlorophyll concentrations. Coldest average temperatures are registered in October and November, when the highest chlorophyll concentration values are also recorded (Figure 5).
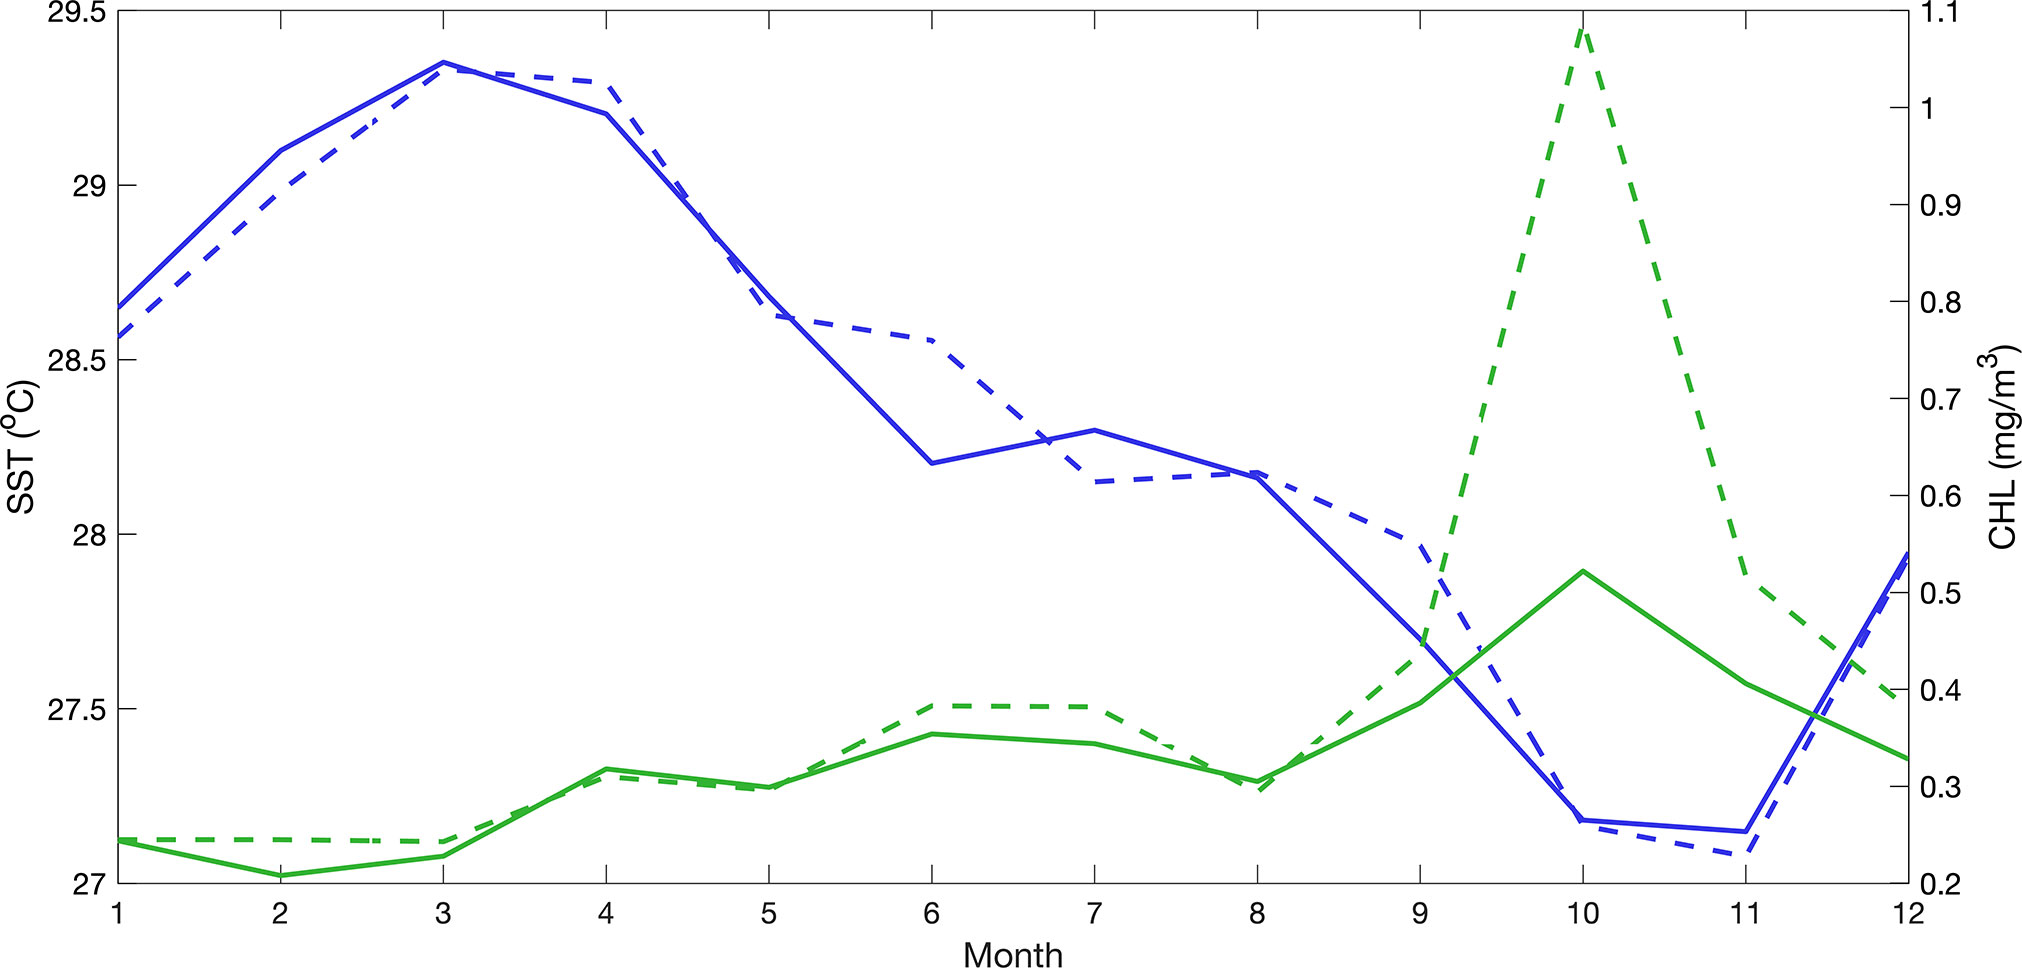
Figure 5 Monthly climatological mean sea surface temperature (SST, °C, blue) and median surface chlorophyll concentrations (CHL, mg/m3, green) in the southern (solid line) and central (broken line) Pacific subareas studied.
Timeseries of monthly SST (Figure 6, top) and CHL (Figure 6, center) revealed seasonal and interannual variability, as well as the presence of linear trends. In addition, conditions were very consistent between the subareas examined. Monthly mean SST ranged between 25.64°C and 30.07°C in the southern Pacific area and between 25.39°C and 30.13°C in the central Pacific. Monthly median CHL varied between 0.15 mg/m3 and 0.96 mg/m3 in the southern Pacific, with higher values recorded in the central Pacific area ranging between 0.14 mg/m3 and 4.46 mg/m3. Maximum CHL values occurred between October and December, with approximately 1 month lag behind minima SST values. A negative correlation between SST and CHL was observed for the both areas analyzed, with CHL maxima during the coldest months (SP: R2= 0.38, p=<0.0001, n=140; SPH: R2= 0.29, p=<0.0001, n=134). SST showed a positive linear trend in both areas, with average increases since 2010 of 0.49°C and 0.61°C for SP and CPH1, respectively, which represent an overall rise of 1.75% and 2.16% for each area. On the other hand, average CHL values showed a negative trend in both subareas, with declines since 2010 of 11.67% and 4.29% for SP and CPH1, respectively.
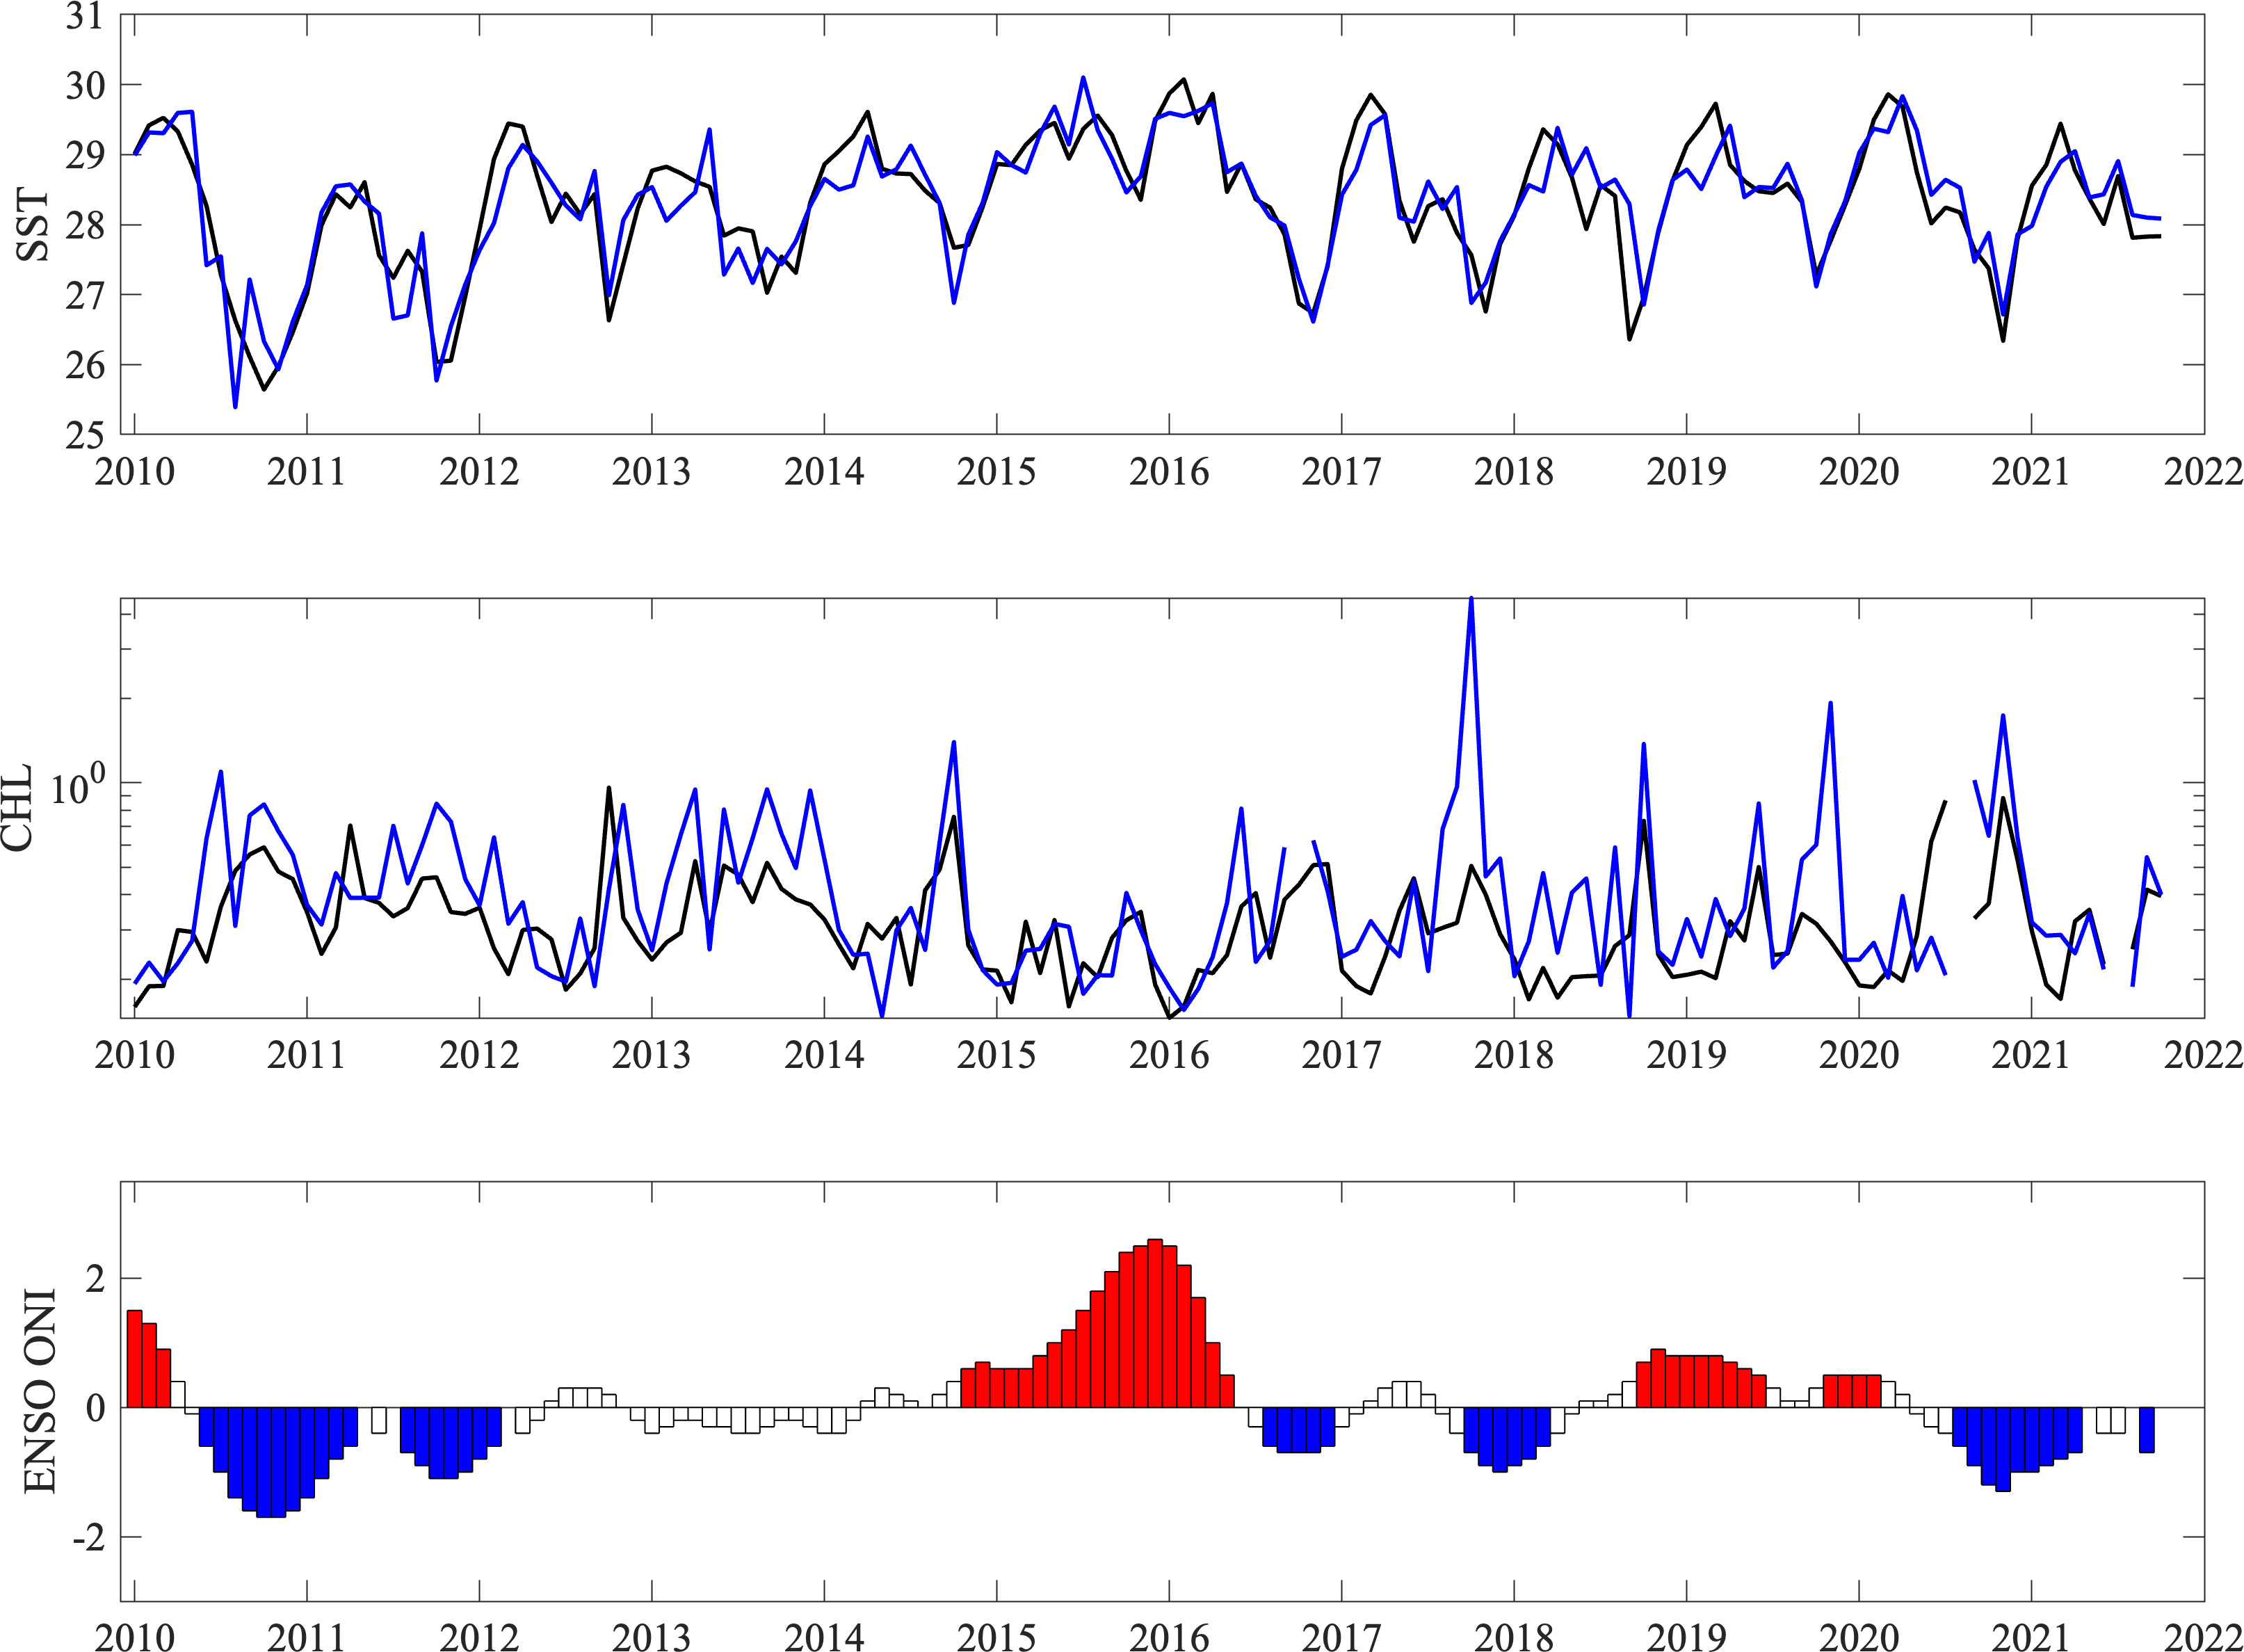
Figure 6 Timeseries of monthly mean (top) sea surface temperature (SST, °C) and (center) surface chlorophyll a concentration (CHL, mg/m3) in the southern (black) and central (blue) Pacific areas studied between 2010 and 2022 (bottom) ENSO ONI Index, with red periods indicating a warm El Niño phase and blue periods indicating a cold La Niña phase. White bars represent neutral conditions.
Timeseries of El Niño ONI Index indicated several moderate cold events during the study period, including between 2010-2011, the second half of 2016 and 2018, and in 2020-2021 (Figure 6, bottom). Warmer phase events occurred in 2014-2016 and 2018-2019, with the former being the most intense warm event on record during the last several decades and anomalies of up to 2.6°C in October 2015 and January 2016. The interannual variability in SST and CHL was strongly related to ENSO, which is known to dominate variability in the region.
Numerical models
The ARIMA model performed best at reproducing the negative trend as well as the seasonal pattern in sailfish abundances (Asail), with maxima between January and April, even though a few of the seasonal peaks were underestimated in the southern Pacific and overestimated in the central Pacific area (Figure 7). The model errors were relatively low (SP: RMSE = 1.03, MAE = 0.74; CPH1: RMSE = 3.97, MAE = 2.87).
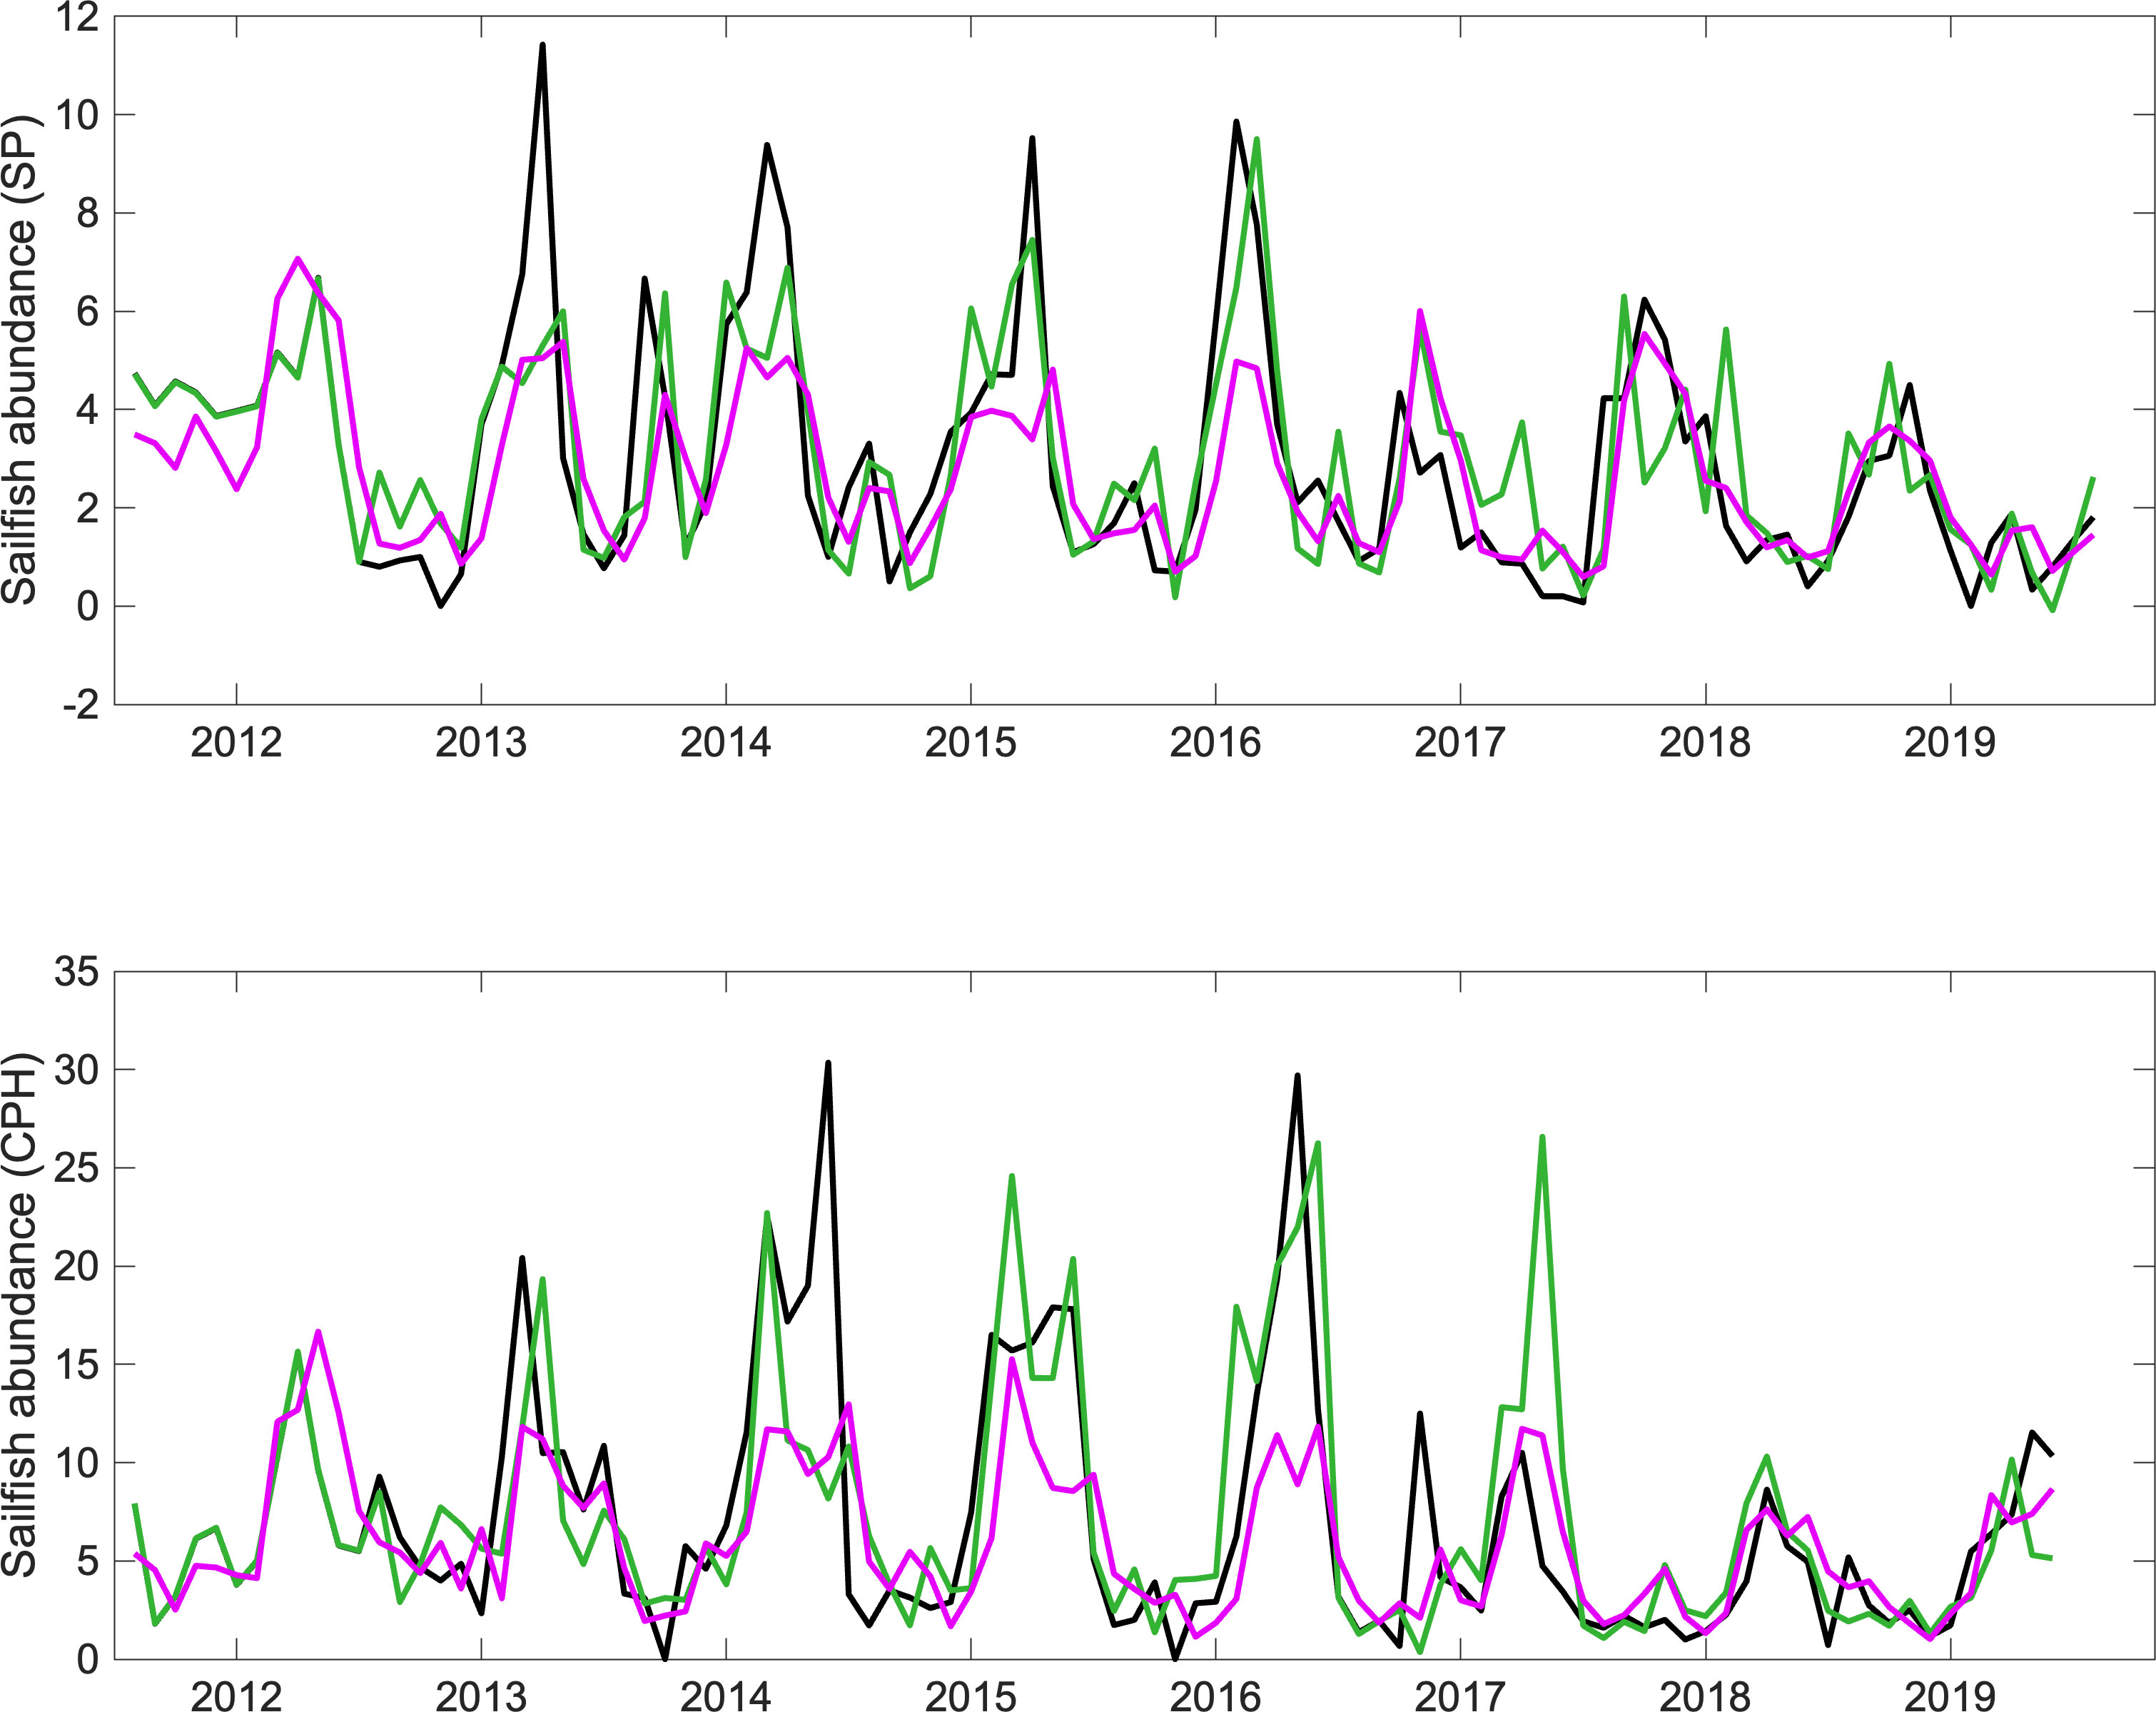
Figure 7 Timeseries of sailfish abundance (monthly mean individuals raised per trip) (black) from sportfishing data from the southern (top) and central (bottom) areas of the Pacific Ocean in Costa Rica, and modelled abundances from the ARIMA (green) and Linear_AR (magenta) models, with the effects of SST and commercial fishing pressure included.
As expected, the temporal components of the model contribute significantly to explain much of the variation in sailfish abundance over time (Table 3). After that yearly and monthly variation is accounted for, however, commercial fishing pressure and sea surface temperature remain significant predictors of sailfish abundances in both areas. Notably, commercial fishing negatively impacts sailfish abundance, whereas in the case of SST, there is a significant positive relationship with sailfish abundance at 0-lag in both subareas, while for the southern area there is also a negative relationship with SST with a lag of 3 months. Although ARIMA models are best at describing timeseries data, one drawback is that they do not allow the estimation of the percent variance explained by the model. The linear model with autoregressive error structure (Linear_AR) accounted for the interannual and seasonal variability in sailfish abundance well, but failed to capture the magnitude of the maxima and minima. Linear_AR explained 65% and 51% of the total variance in the timeseries for the southern and central Pacific areas, respectively (Figure 7). Considering that ARIMA performed overall better than Linear_AR, we can assume that the total variance accounted for by ARIMA is larger than 65% and 51% for the south and central Pacific, respectively.
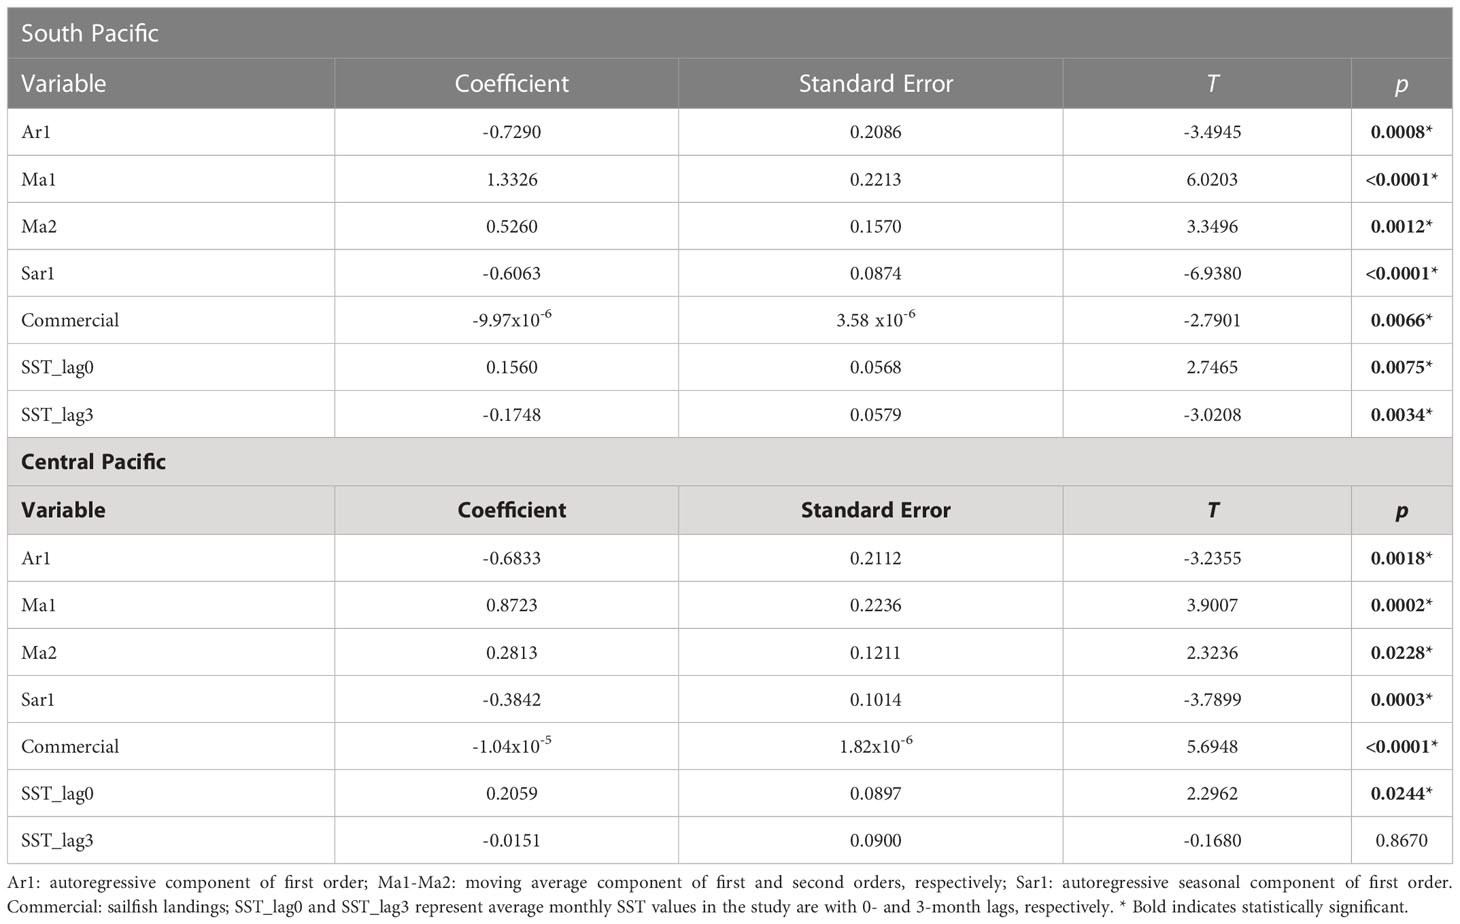
Table 3 Coefficients of the ARIMA model used.
In addition to the declining trends observed in sailfish availability to recreational anglers, bycatch data from the purse seine tuna fleet that operates in Costa Rican waters indicate a steady decline in the volume of sailfish caught since 2001, reaching the minimum value ever recorded in 2019 (Figure 8).
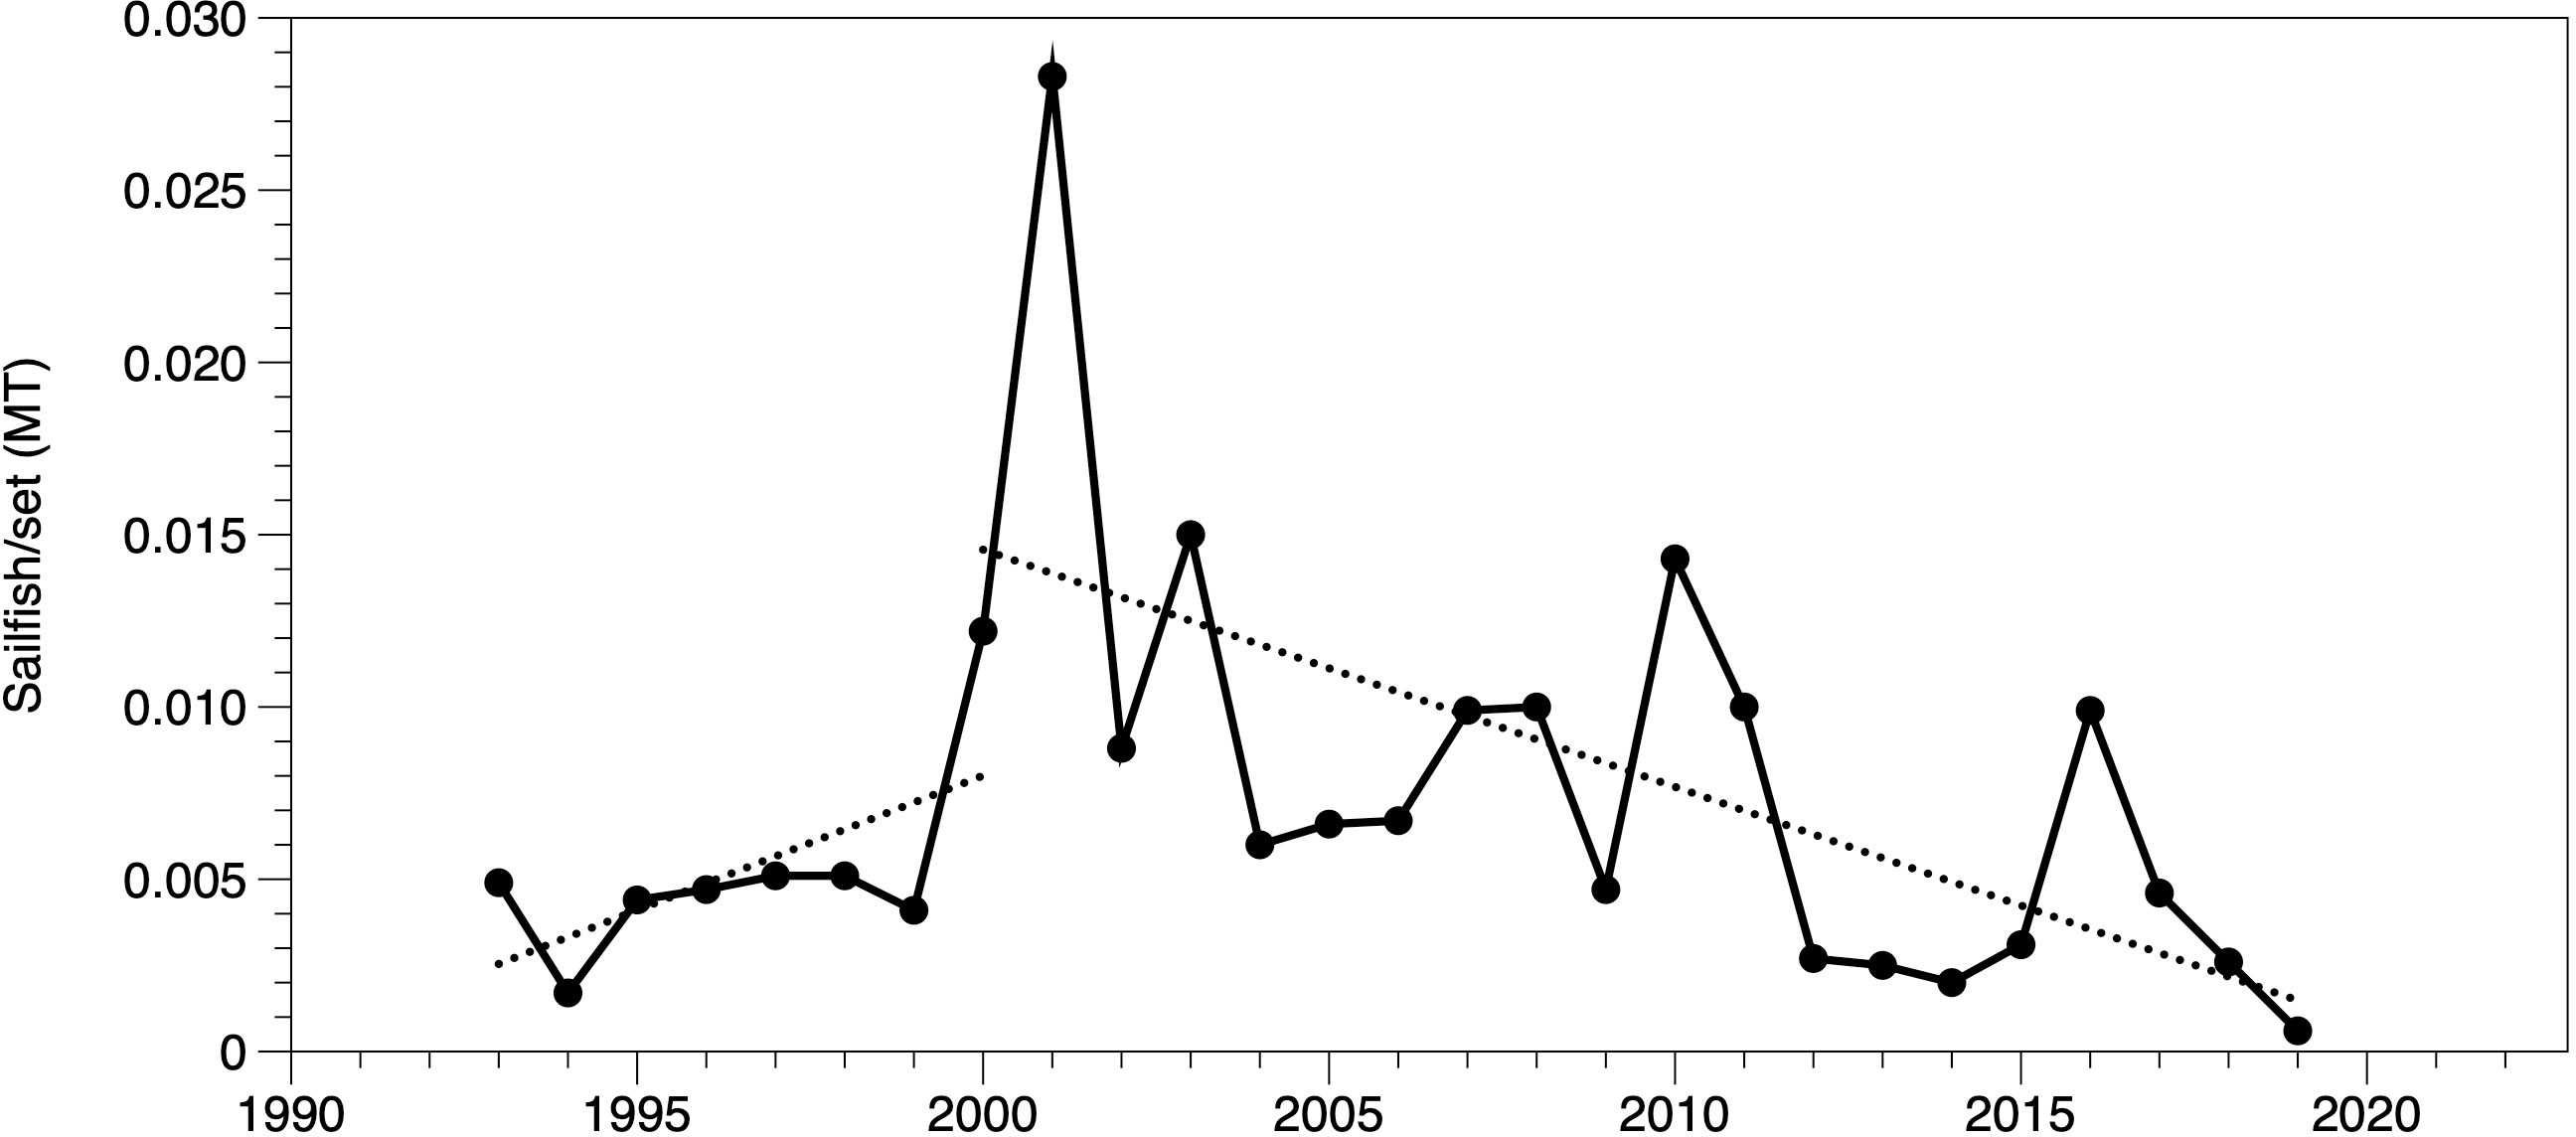
Figure 8 Bycatch of sailfish, in metric tons per fishing set, reported by the purse seine fleet for catches within the Costa Rica Exclusive Economic Zone only (data provided by IATTC). Dotted lines indicate the linear fit for periods 1993-2000 and 2000-2019.
Finally, the analysis of the distribution of apparent fishing effort by the Costa Rica longline fleet registered from VMS data shows a clear pattern with concentration of fishing effort in very coastal waters, with the highest values of 1416 hours of fishing in a single pixel (bright yellow) recorded approximately 30 miles off the coast (Figure 9). This band of highest effort extends between 30 and 60 miles from the coast along the central and southern Pacific. A second band of intermediate effort can be observed between 60 and 200 miles from the coast, with generally lower values occurring further offshore. Although most of the fishing effort concentrates within the Costa Rica EEZ, the fleet also operates in international waters, with fishing extending as far as 107°W.
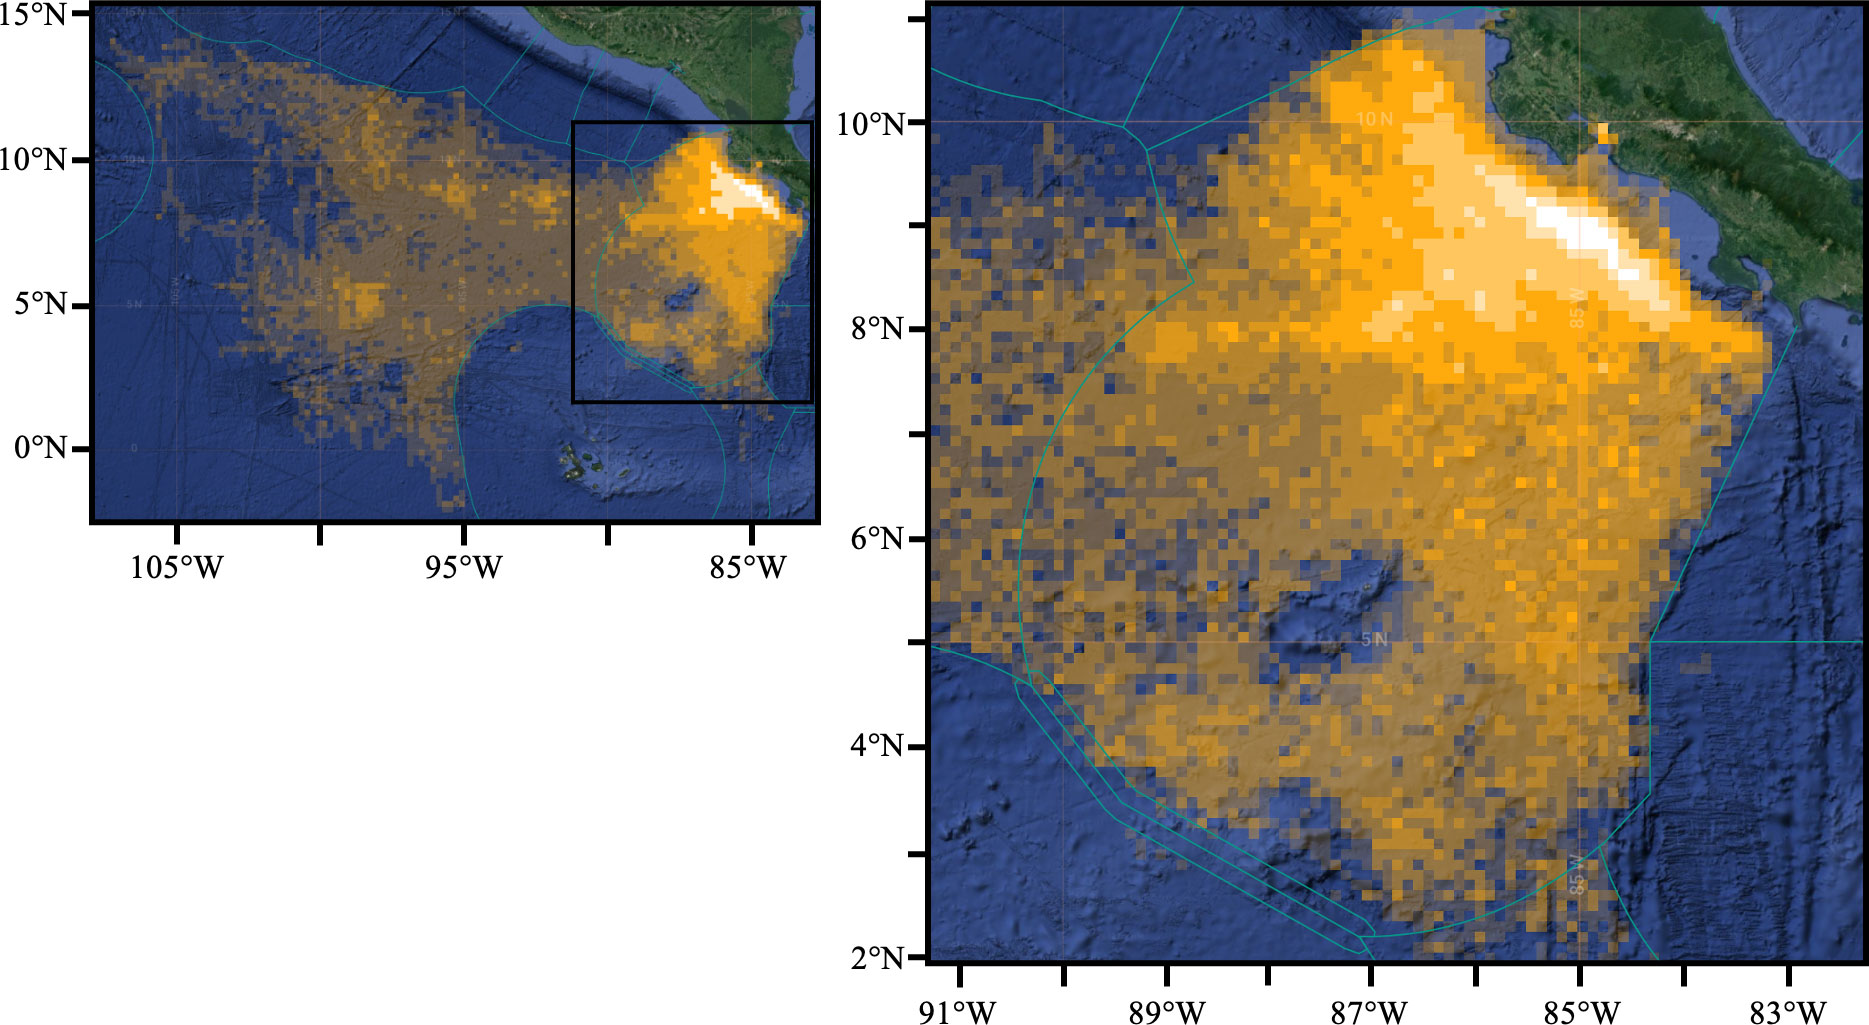
Figure 9 Distribution of cumulative apparent fishing effort (in total fishing hours) for the Costa Rica advanced longline fleet for the period October 1, 2021 – October 1, 2022 in the Eastern Tropical Pacific. The brighter yellow indicates higher fishing effort. Maximum values correspond to 1416 hours of fishing at a single location during the 12-month period. Green lines show the limits of Exclusive Economic Zones. Figure modified from https://globalfishingwatch.org/map/ with permission. The black insert on the left panel indicates the area included in the right panel.
Discussion
The Eastern Tropical Pacific (ETP) off Central America is recognized as one of the best fishing grounds on the planet, with high availability of billfish often recorded and some of the highest catch rates (Ehrhardt and Fitchett, 2006). This is especially true for sailfish and for years Costa Rica was recognized as one of the “Sailfish Capitals of the World” due to the high numbers of sailfish commonly caught and released (Nakamura, 1985; Ehrhardt and Fitchett, 2006); however, recent reports of apparent lower availability raised concern among the sportfishing community. While Costa Rica’s sportfishing infrastructure is well developed, fishing tourism strongly depends on the availability of target species for catch and release. It has been well documented that worldwide, and particularly in the Pacific, large pelagic fish populations are depleted (Myers and Worm, 2003). Worm et al. (2006) highlighted that this trend is of serious concern because it projects the global collapse of all taxa currently fished by the mid-21st century. Our study shows that sailfish abundances available to recreational anglers in Costa Rica during the last decades have declined along the southern and central Pacific coast, and that both environmental variability and commercial fishing have a significant impact on these abundances. Regional mortalities for sailfish are above estimates of natural mortality, which is an indication that the stock may be subjected to significant exploitation (Pohlot and Ehrhardt, 2018).
Data collected from sportfishing operations in the ETP have been previously used to study fish populations when traditional survey data are not available or to complement other datasets. Ehrhardt and Fitchett (2006) examined sailfish data from sportfishing operations in Guatemala and commercial landings from the Japanese longline fleet between 1994 and 2005 and observed a positive correlation between coastal sailfish abundances and prey availability. Highest concentrations of prey items occurred during the first and last trimesters of the year, coinciding with the onset of seasonal oceanographic processes that favor coastal upwelling and the vertical compression of the suitable habitat for sailfish. These oceanographic processes, in turn, relax and intensify with the different ENSO phases. The authors did not observe declining abundances of sailfish in coastal waters of Guatemala before 2005 but concluded that commercial fishing may be an important threat to sailfish populations in Central America and that regional management measures should be applied to guarantee the availability of sailfish. Pohlot and Ehrhardt (2018) highlight that the overexploitation due to available habitat compression should be the framework for billfish fisheries management regimes.
More recently, Haulsee et al. (2022) analyzed recreational fishing data to examine the relationship between sailfish and blue marlin and environmental conditions in the ETP. Their analyses examined some of the same data from the southern Pacific of Costa Rica as this study, as well as data from one fishing lodge in Guatemala and one in Panama. Their results first showed a relationship with sea surface temperature at different time lags in this area, and they suggested that fish may move away from the study area in response to changes in the ocean conditions that result from the different ENSO phases. In this region, warmer waters are often associated with a broader surface mixed layer with high oxygen concentrations and a deeper thermocline, which expands the suitable habitat for sailfish. Ehrhardt and Fitchett (2006) examined the dynamics of sailfish in the Pacific off Guatemala and observed a seasonal pattern negatively related to the mean sea level (MSL) in neighboring El Salvador, which in turn is related to the trade winds. They concluded that seasonal variability in catch per unit effort of sailfish is influenced by prey abundance, oceanographic conditions that enhance feeding, and the dynamics of the dissolved oxygen minimum zone and the thermocline. Our results coincided in showing a significant effect of sea surface temperature over local sailfish abundances, both for the southern and central Pacific areas, with highest sailfish numbers during warmer periods, which may be related to the affinity of this species for oxygenated surface waters (Prince and Goodyear, 2006). In addition to the preferences of sailfish for concurrent warmer waters, our study showed that abundances were also negatively correlated with SST with a 3-month lag, which could be the result of increased phytoplankton production following a cooler period. In tropical regions where vertical stratification is permanent and a shallow thermocline is persistently established, phytoplankton growth is often limited by nutrient availability in the surface layer. Once depleted, nutrients can be supplied from deep waters but the thermocline acts as a physical barrier and processes that bring nutrient-rich waters to the surface are needed in order to support phytoplankton growth. It has been shown that in the study region, nitrate concentrations are related to the depth of the thermocline (Behrenfeld et al., 2006; Kahru et al., 2007; Sasai et al., 2012). Cooler surface layers are often the result of increased upwelling of deeper nutrient-rich waters, which bring the nutricline closer to the surface promoting phytoplankton growth. This, in turn, may lead to higher abundances of zooplankton and small fish, increasing the availability of prey for large pelagic fish, such as sailfish.
The results presented in this study show a correspondence between La Niña periods, such as during 2010-2011, with colder surface waters in the subareas studied and maximum chlorophyll concentrations. On the other hand, warmer El Niño periods, such as during 2015-2016, were associated with warmer surface waters and lower chlorophyll concentrations. During warmer El Niño periods, the trade winds are reduced and surface waters in the ETP pile against the continent preventing the upwelling of nutrient rich deep waters to the surface. In contrast, during La Niña the trade winds are intensified, favoring increased coastal upwelling that promotes phytoplankton growth and attracting higher trophic level organisms, including zooplankton and fish. Although the upwelling that occurs in the Gulf of Panama and in the Gulf of Papagayo/southern Nicaragua area favors high phytoplankton abundances, it also brings low oxygen waters closer to the surface, compressing the surface layer. Billfishes are large migratory fish with a high metabolic demand and their suitable habitat is limited by the availability of dissolved oxygen, thus, they spend most of their time in the warmer shallow mixed layer above the thermocline (Goodyear et al., 2008; Hollihan et al., 2011; Pohlot and Ehrhardt, 2018). Seasonal upwelling processes that bring the thermocline closer to the surface with compression of the surface mixed layer reduce the preferred habitat for billfish and may also result in higher catchability (Prince and Goodyear, 2006). It has been reported that these fish may take advantage of the high production associated to upwelling areas by using the edges and frontal systems in the vicinity where productivity is still elevated, but tend to avoid or swim rapidly through the center of upwelling areas where oxygen concentrations are too low (Pohlot and Ehrhardt, 2018). A combination of increased prey production following cooler periods and suitable habitat conditions during warmer periods of reduced upwelling and higher concentrations of dissolved oxygen likely favors high abundances of sailfish in the area. In addition, monthly climatology data indicated that, on average, the warmest surface temperatures and the lowest chlorophyll concentrations occur between January and April in the study area, which coincides with the highest abundances of sailfish (Haulsee et al., 2022) and peak fishing season in the southern and central Pacific of Costa Rica. This further supports the preference of sailfish for warmer oxygen-rich surface waters in this region.
In addition to the effects of environmental conditions, commercial fishing had a significant negative impact on local sailfish abundances. The conflicting interests between commercial and recreational fishers regarding the use of billfish is not new and others have previously noted the need to establish precautionary fishing practices for billfish in the region (Ehrhardt and Fitchett, 2006). The IATTC, in charge of assessing and regulating commercial fishing of tuna and tuna-like species including sailfish, completed the last stock assessment for sailfish in 2013, almost a decade ago (Hinton and Maunder, 2014). At that time, it was not possible to determine the status of the stock in the EPO because the parameter estimates could not be derived from the model results. The report concluded that average annual reported catches during 2013‐2017 were about 740 tons, significantly less than the 1993‐2007 average of about 2100 tons, and that model results suggested significant levels of unreported catch. The authors recommended a precautionary approach with no increase in fishing effort directed at sailfish and close monitoring of catches until sufficient data are collected to conduct another assessment. In addition, the analysis of bycatch data reported by the foreign purse seine fleet showed declining trends in sailfish bycatch within Costa Rican waters since 2010. Haulsee et al. (2022) examined IATTC bycatch data for the entire ETP and suggested an inverse relationship between sailfish abundances and longline fishing pressure. Our analyses of commercial landings for national ports and purse seine bycatch data in Costa Rican waters coincide with this suggestion. Further evidence of declining numbers in local sailfish abundances include results from angler surveys that show a negative trend in the number of fish caught per angler per day since 2003 in Costa Rican waters (Heberer and Nasby-Lucas, 2021).
With the exception of Costa Rica, most countries along the Pacific coast of Central and North America including Panama, Nicaragua, Guatemala, Mexico, the United States and most recently El Salvador, have recognized the need to protect billfish due to the importance for tourism and local coastal communities, and, in consequence, have implemented different regulations to reduce the impact of commercial fishing. While Panama issued an Executive Decree in 1997 prohibiting any commercial fishing, sales, or exportation of billfish (Executive Decree N°33, Art 1), in 2004 Nicaragua and Guatemala established a ban on any commercial harvest or sales of sailfish in their respective fishing laws (Fishing and Aquaculture Law N°489, Art. 76 and General Fishing and Aquaculture Law, Decree 80-2002, and Agreement 223-2005, respectively). Mexico reserves billfish for recreational fishing within 50 miles from the coast (General Fishing and Aquaculture Law of 2007, Art. 68), and most recently, El Salvador banned any targeted fishing for billfish and implemented a full ban on any longline fishing within 75 nautical miles from the coast for larger vessels and 50 nautical miles for the smaller commercial fleet (CENDEPESCA Resolution 21-02). The United States Billfish Conservation Act was signed into law in 2012 and, except for two specific exemptions for Hawaii and the Pacific islands, prohibits any person from offering billfish or billfish products for sale or having possession with the intent of selling them. In Costa Rica, strict regulations are in place for recreational anglers, including a prohibition to remove fish from the water and an obligation to release any billfish caught, but despite being declared a species of tourist interest in the Fishing Law, commercial harvest and the sale of sailfish as seafood is still allowed. The sustainability of Indo-Pacific sailfish has not been successfully assessed in recent years due to a lack of reliable landing and fishing effort data (Hinton and Maunder, 2014; Fitchett, 2015). The implementation of protection measures to reverse the negative trend and allow local sailfish abundances to recover is important. In addition, we emphasize the need for an updated assessment of sailfish in the Eastern Tropical Pacific, as well as the development of a national program to collect accurate population data and contribute to a better understanding of the spatial and temporal dynamics of sailfish as well as the processes that control these patterns in the region.
Summary and conclusions
In this study, we analyzed newly compiled data on local abundances of sailfish along the central and southern Pacific coast of Costa Rica and developed numerical models to elucidate the effects of different environmental and anthropogenic variables on sailfish. Although the timeseries available are not long enough to allow the assessment of changes in sailfish abundances on a scale of several decades, the results from different independent data sources coincide in indicating that local abundances of sailfish have decreased significantly over the last 10-15 years, while commercial landings have increased steadily over the same time period. The analysis of the distribution of fishing effort by the national longline fleet shows that maximum effort occurs in very coastal waters where the recreational fishery also operates and sailfish abundances are known to be highest. Model results show that commercial fishing and sea surface temperature have significant effects on sailfish abundances along the southern and central Pacific in Costa Rica. We review regional regulations regarding billfish exploitation and suggest the implementation of measures to contribute to the recovery of local abundances of sailfish and the prosperity of local coastal communities that depend on recreational fishing tourism as their main source of income.
Data availability statement
The datasets presented in this article are not readily available because the data generated belongs to FECOP. Requests to access the datasets should be directed to MM,bW1hcnJhcmlAZmVjb3Aub3Jn.
Author contributions
MM led the data analyses and writing of this manuscript. JCC developed and implemented numerical models. MMV compiled and analyzed part of the fisheries data. DMF and MMV contributed to data analyses and manuscript writing. HM and TS contributed to developing database of sportfishing data, manuscript writing and review. HM also developed part of the sportfishing socioeconomic information described in this study. All authors contributed to the article and approved the submitted version.
Acknowledgments
We would like to thank the fishing lodges, marinas, fishing clubs, captains and mates who collected and shared the sailfish data used in this study. Sea surface temperature and chlorophyll concentration satellite data distributed by NASA Ocean Biology Processing Group. Oceanic Niño Index data distributed by NOAA. We also thank the Costa Rica Fisheries and Aquaculture Institute (INCOPESCA) for providing fisheries landing data and the Inter-American Tropical Tuna Commission for sharing sailfish bycatch information. Global Fishing Watch shared apparent fishing effort information. We thank the reviewers for their suggestions to improve this manuscript. Finally, we would like to acknowledge the collaborators and supporters of the Costa Rica Sporfishing Federation, FECOP, for their encouragement and contributions to our research.
Conflict of interest
The authors declare that the research was conducted in the absence of any commercial or financial relationships that could be construed as a potential conflict of interest.
Publisher’s note
All claims expressed in this article are solely those of the authors and do not necessarily represent those of their affiliated organizations, or those of the publisher, the editors and the reviewers. Any product that may be evaluated in this article, or claim that may be made by its manufacturer, is not guaranteed or endorsed by the publisher.
References
Bakun A., Csirke J., Lluch-Belda D., Steer-Ruiz R. (1999). The pacific central American coastal LME, en Large marine ecosystems of the pacific rim: Assessment, sustainability and management. Eds. Sherman K., Tang Q. (Blackwell Science Inc.), Cambridge, USA 268–280.
Barton K. (2019). “Mu-MIn: Multi-model inference,” in R package version 1.46.0. Available at: https://cran.r-project.org/web/packages/MuMIn/index.html.
Behrenfeld M. J., Worthington K., Sherrell R. M., Chavez F. P., Strutton P., McPhaden M., et al. (2006). Controls on tropical pacific ocean productivity revealed through nutrient stress diagnostics. Nature 442, 1025–1028. doi: 10.1038/nature05083
Boshnakov G. N. (2017). R package sarima: Simulation and prediction with seasonal ARIMA models (CRAN (Comprehensive R Archive Network). Available at: https://CRAN.R-project.org/package=sarima.
Campbell J. W. (1995). The lognormal distribution as a model for bio-optical variability in the sea. J. Geophysical Res. 100, 13237–13254. doi: 10.1029/95JC00458
Cascante A., Marín H. (2019). El Aporte macroeconómico y local de la pesca turística y deportiva en Costa Rica (San José, Costa Rica: FECOP).
Cerdenares-Ladrón de Guevara G., Morales-Bojórquez E., Ramos-Carrillo S., González-Medina G. (2012). Variation in relative abundance and mean size of the sailfish istiophorus platypterus caught by the artisanal fleet in the gulf of tehuantepec, Mexico. Cienc. Marinas 38 (3), 551–562. doi: 10.7773/cm.v38i3.2066
Dapp D., Arauz R., Spotila J. R., O'Connor M. P. (2013). Impact of Costa Rican longline fishery on its bycatch of sharks, stingrays, bony fish and olive ridley turtles (Lepidochelys olivacea). J. Exp. Mar. Biol. Ecol. 448, 228–239. doi: 10.1016/j.jembe.2013.07.014
Ehrhardt N. M., Fitchett M. D. (2006). On the seasonal dynamic characteristics of the sailfish, Istiophorus platypterus, in the Eastern pacific off central America. Bull. Mar. Sci. 79 (3), 589–606.
FECOP (2016). Estudio actualizado sobre el impacto del sector de pesca deportiva y turística en el entorno social, económico y cultural de Costa Rica (San José, Costa Rica).
Fernández-Álamo M. A., Färber-Lorda J. (2006). Zooplankton and the oceanography of the eastern tropical Pacific: A review. Progress in Oceanography, 69(2–4)318–359.
Fitchett M. D. (2015). Growth, mortality, and availability of eastern pacific sailfish (Ph.D. Dissertation, University of Miami Florida, USA), 205.
Gentner B. (2007). Economic analysis of international billfish markets. Gentner Consulting Group Maryland.
Goodyear C. P., Luo J., Prince E. D., et al. (2008). Vertical habitat use of Atlantic blue marlin (Makaira nigricans): insights into interaction with pelagic longline gear. Mar. Ecol. Prog. Ser. 365, 233–245. doi: 10.3354/meps07505
Haulsee D. E., Blondin H. E., Logan R. K., Crowder L. B. (2022). Where do the billfish go? using recreational catch data to relate local and basin scale environmental conditions to billfish occurrence in the Eastern tropical pacific. Fisheries Oceanography 31(2):135-148. doi: 10.1111/fog.12567
Heberer L., Nasby-Lucas N. (2021). The SWFSC 2020 Billfish Newsletter. SWFSC Cooperative Billfish Tagging Program, California, USA.
Hinton M. G., Maunder M. N. (2014). Status of sailfish in the Eastern pacific ocean in 2011 and outlook for the future. Inter Am. Trop. Tuna Commission. SAR-14-SFA. Mimeo, 251.
Holland S. M., Ditton R. B., Graefe A. R. (1998). An ecotourism perspective on billfish fisheries. J. Sustain. Tourism 6 (2), 97–116. doi: 10.1080/09669589808667305
Hollihan J. P., Luo J., Goodyear C. P., Orbesen E. S., Prince E. D. (2011). Vertical habitat use of sailfish (Istiophorus platypterus) in the Atlantic and eastern pacific, derived from pop-up satellite tag data. Fisheries Oceanography 20 (3), 192–205. doi: 10.1111/j.1365-2419.2011.00577.x
Hyndman R. J., Athanasopoulos G. (2018) Forecasting: principles and practice (Melbourne, Australia: OTexts). Available at: OTexts.com/fpp2 (Accessed August 21, 2022).
Kahru M., Fiedler P. C., Gille S. T., Manzano M., Mitchell B. G. (2007). Sea Level anomalies control phytoplankton biomass in the Costa Rica dome área. Geophysical Res. Lett. 34, L22601. doi: 10.1029/2007GL031631
Mora-Escalante R. E., Lizano O. G., Alfaro E. J., Rodríguez A. (2020). Distribución de temperatura y salinidad en campañas oceanográficas recientes en el pacífico tropical oriental de Costa Rica. Rev. Biología Trop. 68, 177–197. doi: 10.15517/rbt.v68iS1.41180
Mourato B. L., Hazin F., Bigelow K., Musyl M., Carvalho F., Hazin. H. (2014). Spatio-temporal trends of sailfish, istiophorus platypterus catch rates in relation to spawning ground and environmental factors in the equatorial and southwestern Atlantic ocean. Fisheries Oceanography 23 (1), 32–44. doi: 10.1111/fog.12040
Myers R. A., Worm B. (2003). Rapid worldwide depletion of predatory fish communities. Nature 423, 280–283. doi: 10.1038/nature01610
Nakamura I. (1985). FAO species catalogue., vol. 5. billfishes of the world. An annotated and illustrated catalogue of marlins, sailfishes, spearfishes and swordfishes known to date. FAO Fish. Synop 125 (5), 65. Rome, FAO.
Pacheco-Chávez B., Alfaro-Rodríguez J., Marín-Alpizar B., Carvajal-Rodríguez J. M., González-Rojas M. (2020). “Caracterización de la pesquería de palangre realizada por la flota costarricense comercial de mediana escala y avanzada dirigida a la captura de especies pelágicas en el océano pacífico de Costa Rica,” in Documento técnico no. 28 (Puntarenas, Costa Rica: Departamento de Investigación, INCOPESCA), 70.
Pennington J. T., Mahoney K. L., Kuwahara V. S., Kolber D. D., Calienes R., Chavez F. P. (2006). Primary production in the eastern tropical pacific: A review. Prog. Oceanography 69, 285–317. doi: 10.1016/j.pocean.2006.03.012
Pinheiro J., Bates D., DebRoy S., Sarkar D., R Core Team (2021) Nlme: Linear and nonlinear mixed effects models. Available at: https://CRAN.R-project.org/package=nlme.
Pohlot B. G., Ehrhardt N. (2018). An analysis of sailfish daily activity in the Eastern pacific ocean using satellite tagging and recreational fisheries data. ICES J. Mar. Sci. 75 (2), 871–879. doi: 10.1093/icesjms/fsx082
Prince E. D., Goodyear C. P. (2006). Hypoxia-based habitat compression of tropical pelagic fishes. Fisheries Oceanography 15 (6), 451–464. doi: 10.1111/j.1365-2419.2005.00393.x
Prince E. D., Holts D. B., Snodgrass D., Orbesen E. S., Luo J., Domeier M. L., et al. (2006). Transboundary movement of sailfish, istiophorus platypterus, off the pacific coast of central America. Bull. Mar. Sci. 79 (3), 827–838.
Sasai Y., Richards K. J., Ishida A., Sasaki H. (2012). Spatial and temporal variabilities of the chlorophyll distribution in the northeastern tropical pacific: The impact of physical processes on seasonal and interannual time scales. J. Mar. Syst. 96-97, 24–31. doi: 10.1016/j.jmarsys.2012.01.014
Villalobos-Rojas F., Herrera-Correal J., Garita-Alvarado C. A., Clarke T., Beita-Jiménez A. (2014). Actividades pesqueras dependientes de la ictiofauna en el pacífico norte de Costa Rica. Rev. Biología Trop. 62 (4), 119–137. doi: 10.15517/rbt.v62i4.20038
Keywords: sailfish, Istiophorus platypterus, sportfishing, Costa Rica, Central America, ARIMA, fishing tourism, fisheries
Citation: Marrari M, Chaves-Campos J, Mug Villanueva M, Martínez-Fernández D, Marín Sandoval H and Staley Meier T (2023) Trends and variability in local abundances of sailfish Istiophorus platypterus in Pacific waters of Costa Rica: Controls and effects on recreational fisheries. Front. Mar. Sci. 10:1088006. doi: 10.3389/fmars.2023.1088006
Received: 02 November 2022; Accepted: 10 January 2023;
Published: 23 January 2023.
Edited by:
Peter Goethals, Ghent University, BelgiumReviewed by:
Jorge Paramo, University of Magdalena, ColombiaWei-Chuan Chiang, Council of Agriculture, Taiwan
Copyright © 2023 Marrari, Chaves-Campos, Mug Villanueva, Martínez-Fernández, Marín Sandoval and Staley Meier. This is an open-access article distributed under the terms of the Creative Commons Attribution License (CC BY). The use, distribution or reproduction in other forums is permitted, provided the original author(s) and the copyright owner(s) are credited and that the original publication in this journal is cited, in accordance with accepted academic practice. No use, distribution or reproduction is permitted which does not comply with these terms.
*Correspondence: Marina Marrari, bW1hcnJhcmlAZmVjb3Aub3Jn