 Hang Lv
 Guifen Wang
 Wenlong Xu1,2
 Long Jiang
95% of researchers rate our articles as excellent or good
Learn more about the work of our research integrity team to safeguard the quality of each article we publish.
Find out more
ORIGINAL RESEARCH article
Front. Mar. Sci. , 06 February 2023
Sec. Ocean Observation
Volume 10 - 2023 | https://doi.org/10.3389/fmars.2023.1087604
This article is part of the Research Topic Colour and Light in the Ocean, volume II View all 27 articles
Seasonal patterns of marine net primary production (NPP) are crucial for understanding the marine ecosystem and biogeochemical cycles. Uncoupling of seasonal variations between NPP and phytoplankton chlorophyll-a over different areas has attracted much attention. In this study, following a review of previous studies, monthly climatological NPP data from 2003 to 2020, estimated using the Size-fractioned Phytoplankton Pigment Absorption (aph)-based NPP Model (SABPM), were selected to study the seasonal variability of NPP in the South China Sea (SCS). Results showed the spatial differences of NPP seasonality and its departures from climatology in extreme El Niño-Southern Oscillation (ENSO) and Indian Ocean Dipole (IOD) years. Cluster analysis for climatological monthly data identified significant differences of NPP seasonality in five typical regions. In coastal regions along the northern SCS and off eastern Vietnam, NPP exhibited the most obvious seasonal cycle with maximum (minimum) values in summer (winter), attributable mainly to river discharge and summer upwelling. In regions off northwestern Luzon and coast of southern SCS, NPP showed peaks in winter, which were related to strong mixing and upwelling. In northwestern SCS, NPP was high during May–September in phase with sea surface temperature and the primary controlling factors were found to be shallow nutricline depth and wind-driven mixing. Owing to the deep nutricline depth in the central basin, NPP exhibited little seasonal variability; only a weak signal was observed in spring in phase with photosynthetically active radiation. Local dynamics on regulating the nutrient supply and light availability contribute to these regional differences in NPP seasonality, which could also be affected by extreme climate events. The largest anomalies of the NPP seasonal cycle coincide with 2015/2016 ENSO and super IOD in 2020. During these events, enhanced (weakened) westerly winds caused fall (rise) of SLA and increase (decrease) of NPP in coastal regions along the northern SCS and that off eastern Vietnam. Overall, the aph-based model shows a new perspective to study the spatiotemporal variations of NPP in the SCS.
Net primary production (NPP), which plays a key role in the functioning of marine ecosystems, is influenced by complex physicochemical conditions in the water column that include temperature, biomass, light, and the concentrations of nutrients (Montes-Hugo et al., 2009; Oziel et al., 2019). Given the importance of NPP in air-sea CO2 exchange and global carbon cycle (Platt and Sathyendranath, 1988; Brewin et al., 2021), in evaluating future fisheries yields (Sarmiento and Gruber, 2002) as well as in regulating the climate (Reid et al., 2009), its apparent seasonal signal has received considerable attention from the scientific community.
Methods such as 14C incubation and oxygen evolution have provided compelling NPP datasets for nearly 70 years (Nielsen, 1952; Williams et al., 2004). The seasonality of NPP has gradually been explained at numerous typical stations in various areas. In the North Pacific Subtropical Gyre region, represented by the Hawaii Ocean Time Series station (Karl and Lukas, 1996), NPP is high in summer and low in winter. In the North Atlantic Subtropical Gyre region, represented by the Bermuda Atlantic Time Series Study (Lohrenz et al., 1992), NPP is higher in winter and early spring than in other seasons. At a subarctic station in the western Pacific, algal blooms can result in high NPP in spring and summer, while at subtropical stations, NPP generally shows higher values in winter owing to the influence of subtropical mode water (Matsumoto et al., 2016). In situ observations of NPP are often limited temporally and spatially, and thus often only reflect local dynamic effects. Fortunately, the development of remote sensing techniques has enabled monitoring of NPP and exploration of its influencing factors on large spatiotemporal scales. Seasonal variation in NPP vary substantially among different regions owing to the strong relationship between environmental variables and photosynthetic parameters (Kulk et al., 2020; Kulk et al., 2021). The seasonal pattern of NPP in the Mediterranean Sea is considered to be generally high in winter and low in summer, consistent with the algal biomass in the west and the influence of photosynthetically active radiation (PAR) in the east (Bosc et al., 2004). In the Red Sea, NPP is regionally distinct and regulated by environmental factors such as sea surface temperature (SST), mixed layer depth (MLD), and PAR (Li W et al., 2020). Nutrient supply has been shown to be the main regulator of NPP in eastern boundary upwelling regions (Messié and Chavez, 2015). NPP could also change in response to upwelling and nutrient availability during the transition of climate events (Behrenfeld et al., 2001).
Over the last 30 years, researchers have proposed a number of NPP remote sensing models, which can be summarized in three main strategies (Lee Z et al., 2015), including CHL-based approach (e.g., Behrenfeld and Falkowski, 1997b), carbon-based approach (e.g., Behrenfeld et al., 2005; Westberry et al., 2008) and phytoplankton absorption-based approach (e.g., Ma et al., 2014; Silsbe et al., 2016; Tao et al., 2017a). Currently, an inversion strategy for NPP that could be used in all seas has yet to be established. A series of model comparison exercises demonstrated that the same model has different accuracy in different regions (Campbell et al., 2002; Carr et al., 2006), and that some results could not simulate the variability of NPP accurately (Lee YJ et al., 2015; Lee and Marra, 2022). In particular, the ocean color chlorophyll-a (CHL) algorithm is challenged by optically complex Case-2 waters, which could affect the performance of NPP models (Saba et al., 2011). Therefore, testing and applying more reliable models could help to explore seasonal variations of NPP in local areas.
The South China Sea (SCS) is the largest tropical marginal sea in the northwest Pacific Ocean, covering an area of 3.5 million km2. The SCS is identified as a typical oligotrophic region where primary productivity is limited by nutrient availability (Tang et al., 1999). High values of CHL (> 2 mg m-3) generally occur near the coast, while offshore concentrations are lower (< 0.3 mg m-3) (Yu et al., 2019). Ecological processes in the SCS are strongly affected by atmospheric depositions driven by season monsoons (e.g., Lin et al., 2007), in addition to alterations driven by river discharge (Zhang et al., 2012; Zeng et al., 2022), coastal upwelling (Shaw et al., 1996; Jing et al., 2009; Yan et al., 2015), and Kuroshio invasion (Li L et al., 2020). During certain specific periods, NPP in the SCS responds to environmental events such as forest fires (Xiao et al., 2020) and climatic events such as ENSO (Liao et al., 2012).
Study on the seasonal variation in NPP in the SCS has attracted much attention in recent years. In situ NPP was found to be higher in winter than in summer and higher on the shelf than in the basin in the northern SCS (Chen and Chen, 2006). In areas near northwestern Luzon, the central coast of Vietnam, to the southeast of Hainan Island, and in northern parts of the Sunda Shelf, monsoon-driven upwelling might produce high CHL concentrations, which could further affect primary productivity (Liu et al., 2002; Ning et al., 2004). The limitations of in situ observations are now being broken by satellite remote sensing data, which can describe the patterns of NPP in SCS at high spatial and temporal resolution. As an established standard NPP model, the CHL-based Vertically Generalized Production Model (VGPM) has been widely used in studies on the SCS to determine the seasonal variation in NPP (Wang et al., 2008; Tan and Shi, 2009). On the basis of the VGPM, mean primary productivity in the entire SCS was shown to be highest in winter, decrease gradually in spring, start to rise in early summer, reach a smaller peak in August, and gradually increase back to winter conditions after autumn. Further subdivision of the SCS into typical regions reveals varying patterns in seasonal NPP (Wang et al., 2008; Tan and Shi, 2009). For example, NPP peaks in winter in the northwestern area of Luzon, while peaks occur in both winter and summer in the eastern area of Vietnam and in the Mekong River estuary. In the basin area, the magnitude of NPP variation is relatively weak. Overall, the seasonality of VGPM NPP in the SCS exhibits a favourable match with CHL, while being influenced by environmental factors such as SST (Shih et al., 2021).
However, the results of the VGPM might include large errors or even show contrasting variability in some areas of the SCS (Xie et al., 2020; Lee and Marra, 2022). For example, Xie et al. (2020) reversed the seasonal pattern in NPP in northern shelf waters of the SCS by replacing the CHL-based euphotic depth with that based on the inherent optical properties and by optimizing the model parameters using the nearest neighbor method. This result agreed with a series of field observations (Chen and Chen, 2006; Pan et al., 2015; Ye et al., 2015). Moreover, the influence of the selection of the remote sensing algorithm on the seasonal pattern of NPP cannot be ignored (Xu et al., 2016). There studies remind us to re-investigate the spatial variability of NPP seasonality and their influencing mechanisms in the SCS. Consequently, it is a critical step to choose a more suitable NPP estimation model in advance to reveal the seasonal variations in the various typical regions of the SCS.
In this study, four typical remote sensing models were evaluated in terms of their suitability for application to the SCS, and NPP calculated by the Size-fractioned Phytoplankton Pigment Absorption (aph)-based NPP Model (SABPM) was found to be most reliable for describing the seasonal cycle of NPP in the SCS. We performed cluster analysis on the reconstructed NPP by a data interpolating method (see Section 2.3 for details) and divided the SCS into five typical regions. For each region, we analyzed the seasonality of NPP, investigated the influence of environmental and dynamics factors, and examined how regional differences in NPP are driven by multiple processes. Moreover, the NPP seasonality exhibits departures from climatology in extreme ENSO and IOD years as mainly influenced by physical forcing in local area.
To obtain a more accurate continuous spatiotemporal distribution of NPP in the SCS, we considered four typical NPP products estimated from Moderate Resolution Imaging Spectroradiometer (MODIS) data with their separate algorithms: the VGPM (Behrenfeld and Falkowski, 1997b), carbon-based productivity model (CbPM, Behrenfeld et al., 2005; Westberry et al., 2008), SABPM (Tao et al., 2017a) and carbon, absorption, and fluorescence euphotic-resolving NPP model (CAFE; Silsbe et al., 2016). SABPM is an aph-based model developed by considering how the size of phytoplankton affects the quantitative production of phytoplankton photosynthesis (Tao et al., 2017a). The above-mentioned NPP products can be downloaded from the Oregon State Ocean Productivity website (http://sites.science.oregonstate.edu/) and the Global Change Research Data Publishing & Repository (http://www.geodoi.ac.cn/). The main equations and key input parameters for each of the four NPP models are shown in Table 1. The main parameters in each model are also shown in Table 2. This study mainly used monthly MODIS products obtained from the NASA ocean-color website (http://oceancolor.gsfc.nasa.gov/), including SST (Kilpatrick et al., 2015), CHL concentration (Hu et al., 2012), PAR (Frouin et al., 2012), and euphotic zone depth (Zeu, Lee et al., 2007). All of those products covered the period from January 2003 to December 2020 with the spatial resolution being 9 km.
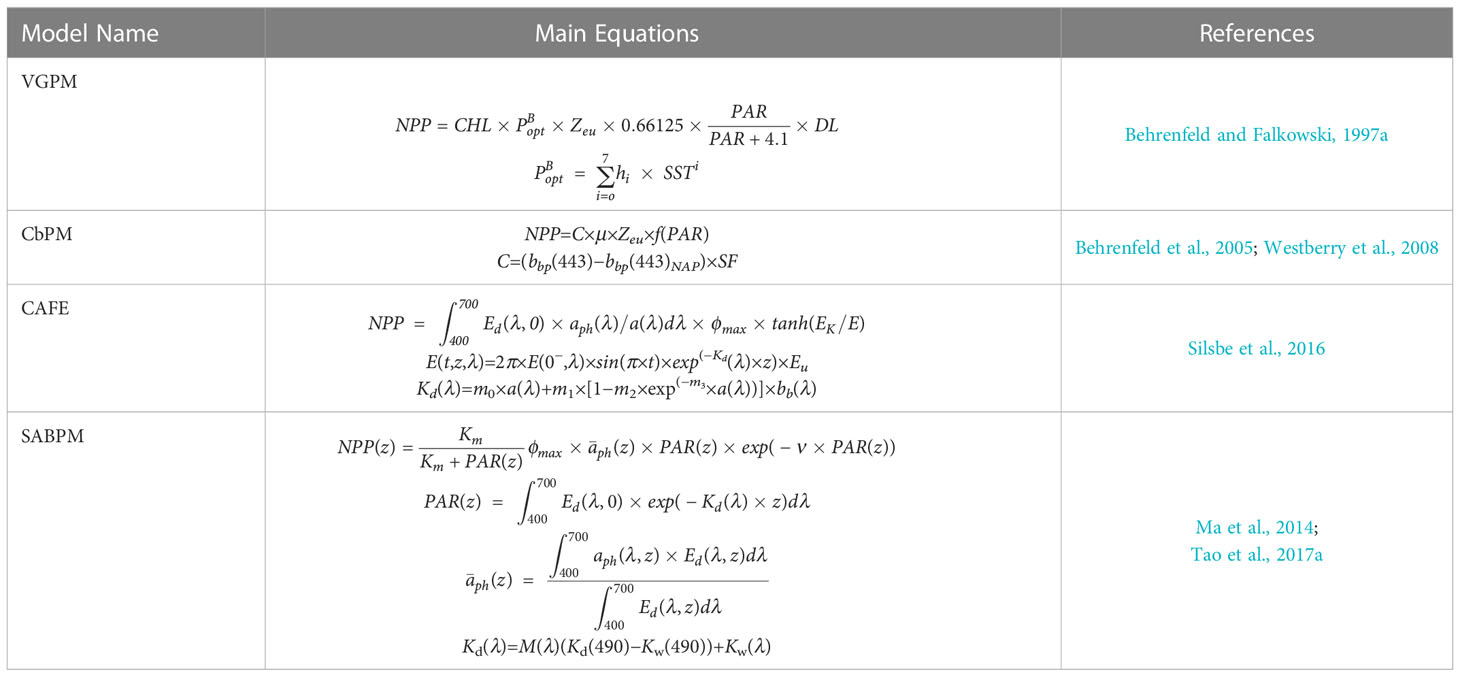
Table 1 The main equations of NPP models.
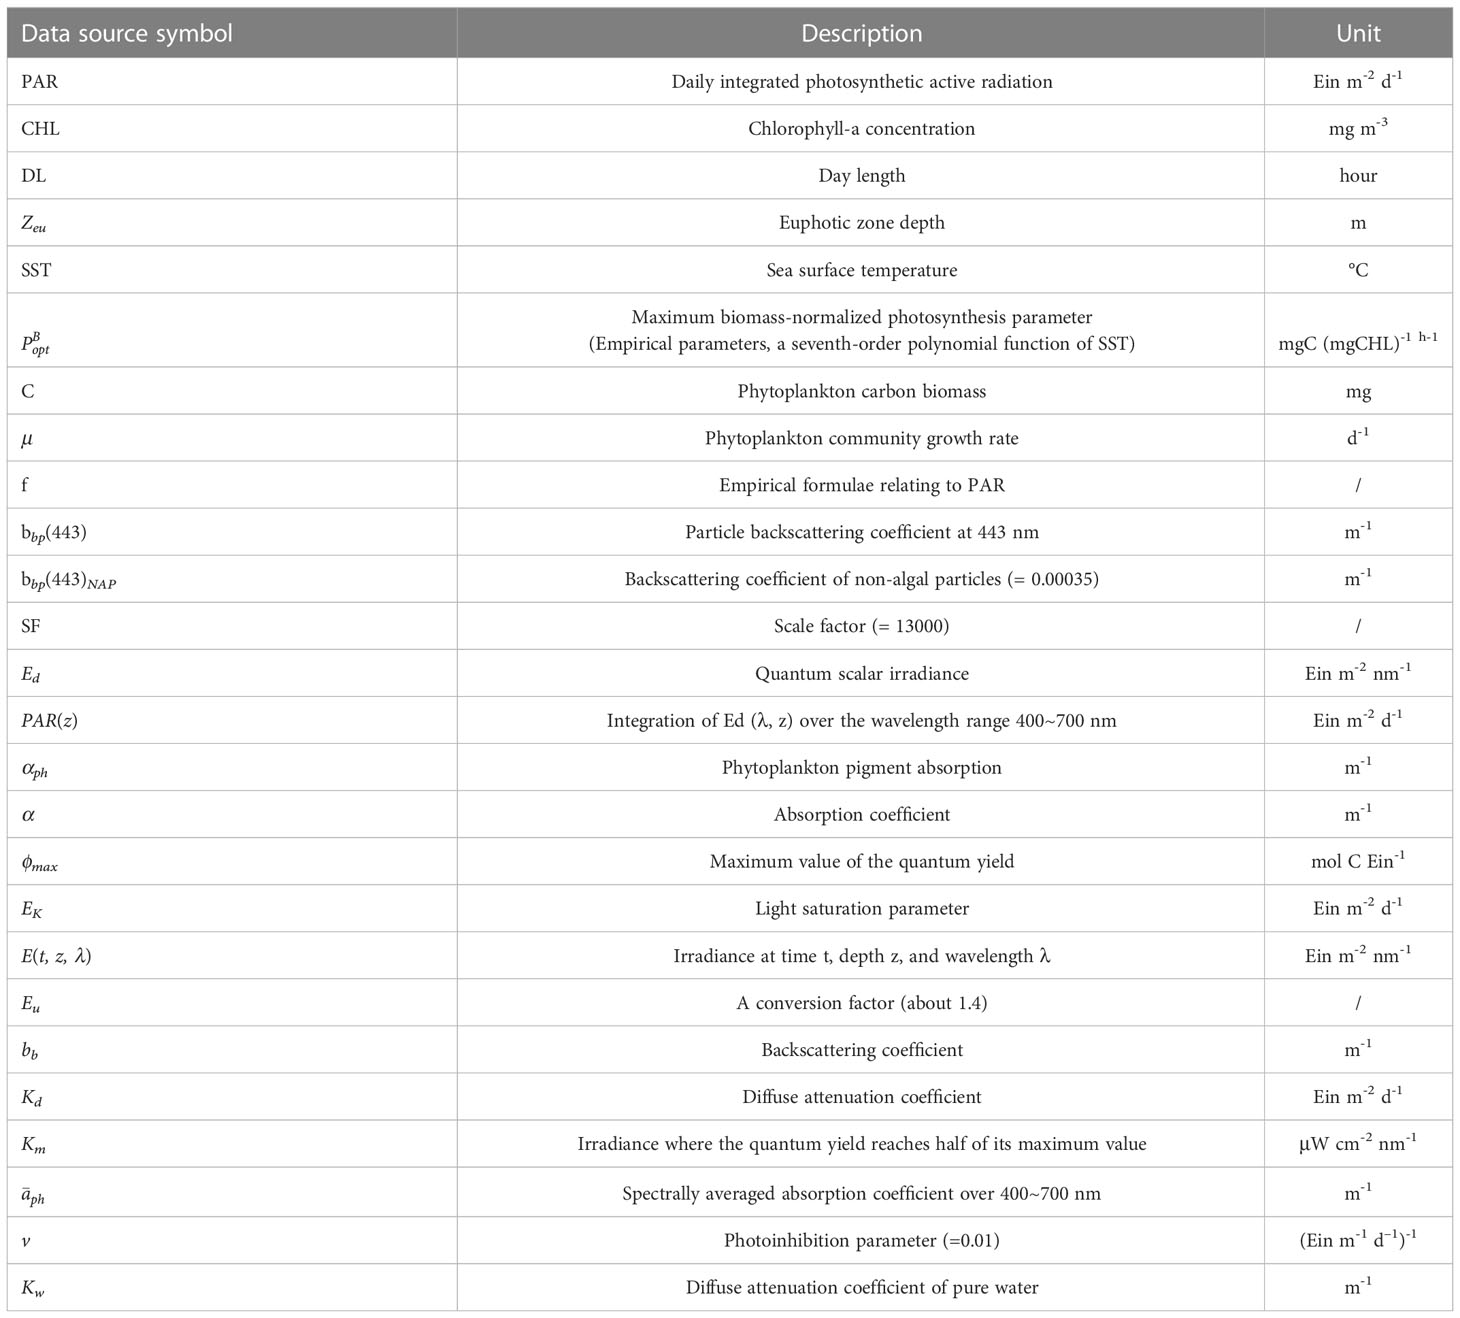
Table 2 List of Symbols.
To discuss the primary factors influencing NPP, a range of environmental dynamics parameters were also obtained: monthly sea level anomaly (SLA) calculated from sea surface height (the Copernicus Marine Environment Monitoring Service, https://resources.marine.copernicus.eu/, Ducet et al., 2000), MLD obtained from the Hybrid Coordinate Ocean Model (http://orca.science.oregonstate.edu/, Chassignet et al., 2007), and wind speed extracted from the 0.25° ERA-Interim reanalysis product (Dee et al., 2011), which is the latest global atmospheric reanalysis dataset developed by the European Centre for Medium-Range Weather Forecasts.
Wind stress (WS) and wind stress curl (WSC) were calculated as follows:
where u is the wind speed vector, τ is the WS (direction is the same as the direction of the wind speed vector), τx and τy are the eastward and northward components of WS, respectively, ρ is air density above the sea surface, and C is the drag coefficient for neutral stability conditions (Hellerman, 1965).
In those products, monthly averaged data were collated uniformly to 9 km using the optimal interpolation solution provided by MATLAB routines.
Data Interpolating Empirical Orthogonal Function (DINEOF) for filling data gaps is based on the Empirical Orthogonal Function (EOF), and it uses the dominant spatial patterns (EOF modes) extracted from a time series data to reconstruct missing data (Beckers and Rixen, 2003; Alvera-Azcárate et al., 2005). We implemented the DINEOF approach to fill the missing data in the SCS. Quantitative evaluation has shown that errors in DINEOF reconstructed data are usually within 2% (Liu and Wang, 2018; Liu and Wang, 2019). A cross-validation technique was applied in the DINEOF for the final reconstruction. The raw input data of SABPM included some areas of null values before the reconstruction (14% missing data), especially in spring. We use the DINEOF software in Fortran downloaded from the official website of DINEOF (http://modb.oce.ulg.ac.be/mediawiki/index.php/DINEOF).
The K-means algorithm is an iterative solution-based clustering analysis algorithm that can eliminate uncertainty generated by empirical choices in areas with large variations. This approach regroups pixels with seasonal cycle shapes, and then a single characteristic seasonal cycle is determined by calculating the center (average cycle) within each cluster that statistically represents the entire cluster. Drawing on previous approaches to analysis of surface CHL (Foukal and Thomas, 2014; Ardyna et al., 2017; Huang et al., 2022), we delineated ocean regions by performing a clustered k-means analysis on the DINEOF-reconstructed NPP products. The linkage algorithm was based on initial calculation of the cosine distance between the objects, which has the advantage of emphasizing mainly differences in the seasonal shape. Specifically, similar to Xu et al. (2020), a monthly climatological time series of the NPP was first created for each pixel of the SCS. The resulting climatological time series were normalized to a maximum value for each specific pixel. The normalized data were then subjected to k-means clustering, which considers statistics of the time series dataset and produces clusters that represent regions of similarity. One of the key challenges for the k-means algorithm is to determine the number of clusters in a dataset. Here, the optimal number of clusters was four, which was determined through use of a series of evaluation indicators in our dataset.
To describe the interannual stability of seasonal patterns of NPP in different regions, we calculated a similarity index (SI, Kirkpatrick et al., 2000) as follows:
where A is the monthly climatological mean of NPP, and Bi is the monthly mean NPP in year i. The similarity index is also consistent with the linkage algorithm to calculate the cosine distance for K-cluster analysis (Torrecilla et al., 2011).
With equation (4), the correlation coefficient r is calculated for the influencing factor of NPP, which exhibit enough dynamic range in each of regions. A 95% confidence test was performed in the calculation.
where X and Y are the two parameters for correlation, Cov (X, Y) is the covariance of X and Y, Var (X) is the variance of X and Var (Y) is the variance of Y.
Spatial distributions of climatological NPP calculated by the four models exhibit substantially different seasonality in the SCS (Figure 1). In summer, VGPM NPP is higher (~1100 mg C m-2 d-1) at shallow depths of 50 m with extensive low values (~260 mgC m-2 d-1) in other regions (Figure 1A). In winter, the area with high values becomes larger (<200 m) in comparison with that in summer, and an area with a medium value (~600 mgC m-2 d-1) appears between northwestern Luzon and the northern nearshore regions of the SCS (Figure 1B). In summer, CbPM NPP, CAFE NPP, and SABPM NPP exhibit similar spatial patterns (Figures 1C, E, G). The SCS could be divided into a high-value area shallower than approximately 200 m and a low-value area in deeper water, where the high-value area of CAFE NPP is smaller. In the high-value area, the regional averages of CbPM NPP, CAFE NPP, and SABPM NPP are 1029.3, 795.1, and 1109.9 mgC m-2 d-1, respectively; in the low-value area, the regional averages are 622.4, 591.2, and 640.4 mgC m-2 d-1, respectively. In winter, a low-value stripe (~200 mgC m-2 d-1) is evident near 200-m isobath in the northern SCS in CbPM NPP (Figure 1D), whereas this phenomenon is not found in SABPM NPP (Figure 1H). CAFE NPP is lower (376.6 mgC m-2 d-1) across the northern SCS in areas shallower than 200 m in winter (Figure 1F), which does not conform to the general rule that inshore NPP is higher than offshore NPP (Chavez et al., 2011). In northern and western parts of the SCS, the NPP estimated by CbPM, CAFE and SABPM is high in summer and low in winter, whereas the NPP estimated by VGPM shows the opposite pattern. To the northwest of Luzon, the results of each model reveal a seasonal cycle of high NPP in winter and low NPP in summer.
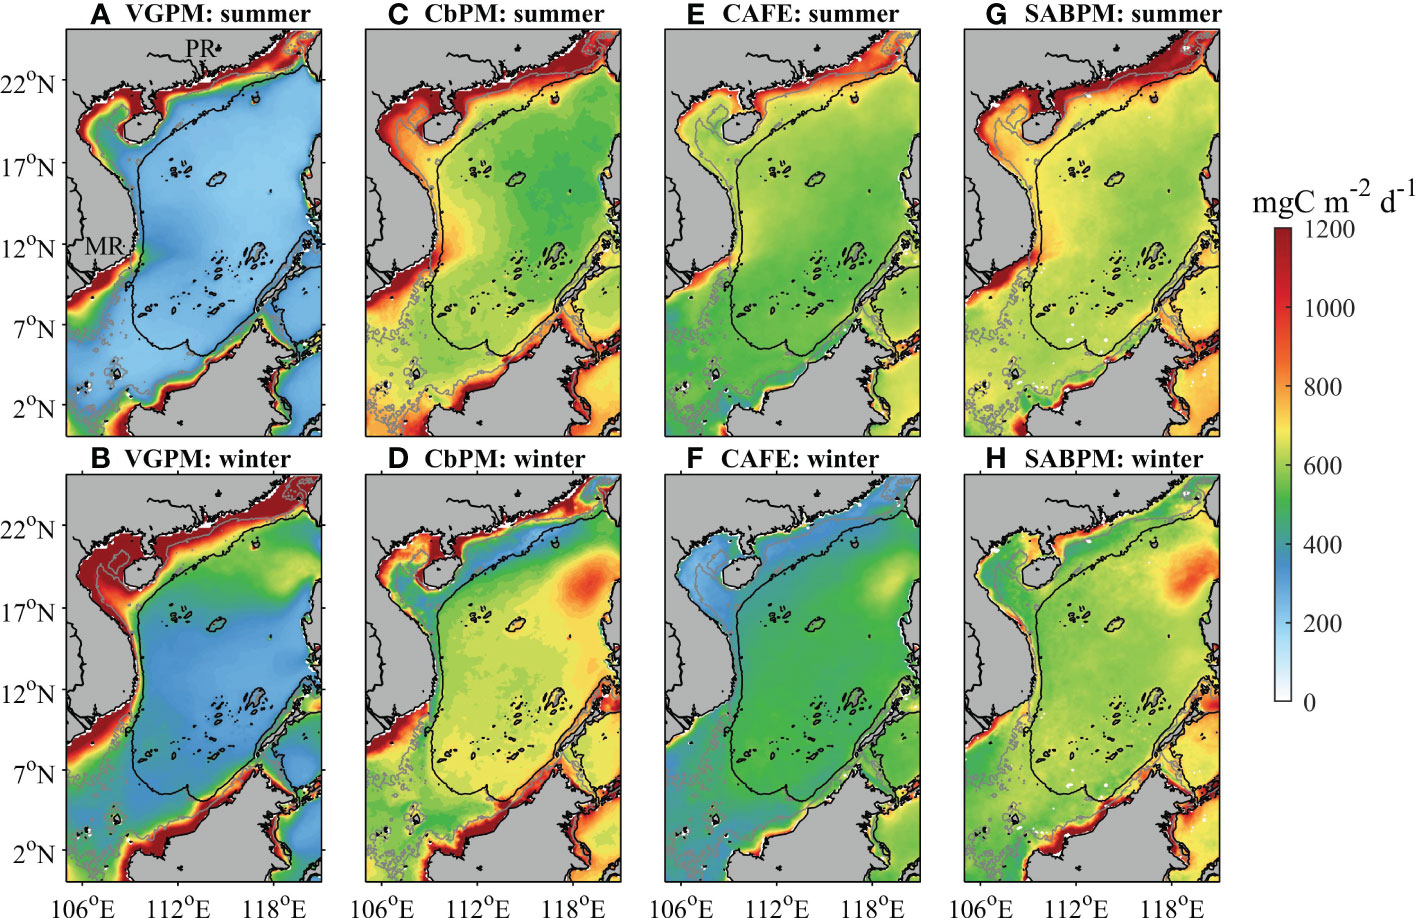
Figure 1 Climatological ocean NPP in summer and winter during 2002–2020 in the study area produced using four algorithms: (A, B) VGPM, (C, D) CbPM, (E, F) CAFE, and (G, H) SABPM. The grey lines are the 50 m isobaths and the black lines are the 200 m isobaths. The location of the Pearl River (PR) and the Mekong River (MR) is indicated in (A).
For comparison with in situ measurements obtained in the SCS (Xie et al., 2015; Bouman et al., 2018; Xie et al., 2020), we analyzed the averaged seasonal variation in NPP over two shelf areas in the SCS: water depth shallower than 50 m (Figure 2A) and water depth shallower than 200 m (Figure 2B). Estimates of NPP by VGPM show obviously larger values in winter than in summer, while the other models show the opposite variability. The peaks of seasonal climatological NPP (<50 m) estimated by VGPM, CbPM, SABPM, and CAFE are 1945.1, 1499.7, 1444.6, and 831.5 mgC m-2 d-1, respectively, and the troughs are 1214.6, 737.4, 614.2, and 346.9 mgC m-2 d-1, respectively. For shelf waters shallower than 200 m, the peaks of NPP values estimated by VGPM, CbPM, SABPM, and CAFE are 1213.2, 1094.0, 1146.8, and 987.9 mgC m-2 d-1, respectively, and the troughs are 698.2, 613.1, 564.2, and 354.0 mgC m-2 d-1, respectively. The magnitude and seasonal pattern of variations of SABPM NPP are most similar with those observed by Xie et al. (2020), which supports us choosing SABPM as the most suitable model, and these results could also be confirmed with observations obtained in the Taiwan Strait (Liu et al., 2007; Tseng et al., 2020).
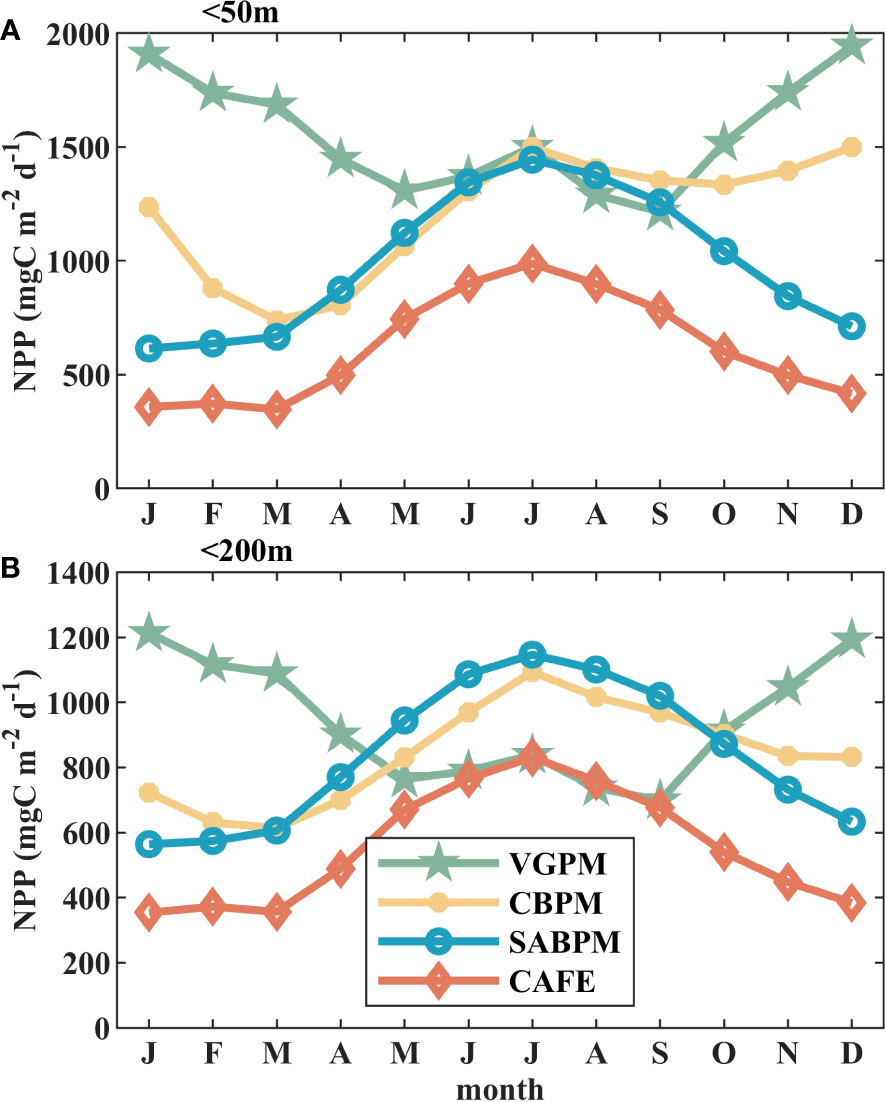
Figure 2 Monthly average variations of mean NPP calculated by the four algorithms in nearshore water: (A) less than 50 m and (B) less than 200 m.
The researchers conducted model sensitivity experiments by Monte Carlo methods, and the results revealed that VGPM and CbPM were strongly influenced by the accuracy of chlorophyll (Lee Z et al., 2015; Ma et al., 2014). Meanwhile the aph-based model which avoids the use of chlorophyll was found to be more accurate than other kinds of models (Tao et al., 2017b). This result is supported by previous studies comparing the application of NPP models in global ocean and regional areas, and the aph-based models always maintain good performances (Hirawake et al., 2012; Barnes et al., 2014; Ma et al., 2014; Silsbe et al., 2016; Tao et al., 2017b; Robinson et al., 2017; Wu et al., 2022). Given this strong generalization capability, extending an aph-based model such as SABPM to more unproven regions represent the most reliable approach at present.
Four regions were divided according to the cosine similarity of seasonal variation (Figure 3A). Owing to the geographical distance and potential for different influencing factors, we split yellow area into two parts, and further divided the SCS into five regions: the coastal ocean along the northern SCS (NC), coastal waters to the east of Vietnam (VE), area off northwestern Luzon and the southern SCS (LS), northwestern parts of the SCS (NW), and the central basin area (CB). Area NC & VE includes the shallow area (water depth of<200 m) in the north of the SCS, most of the Beibu Gulf, and the southern coast of Vietnam (10.2% of the SCS area). Area LS is the region near Luzon Island and the southern coast (5.3%). Areas NW (23.5%) and CB (61.0%) separate the remainder of the SCS from the southwest to the northeast. Area NW includes the western part of the SCS and the area around the 200-m isobath in the north, while area CB covers the remaining area including the basin. Figures 3B–E shows the seasonal variations of NPP in these regions (discussed further in section 3.3), and the data are normalized by the maximum value.
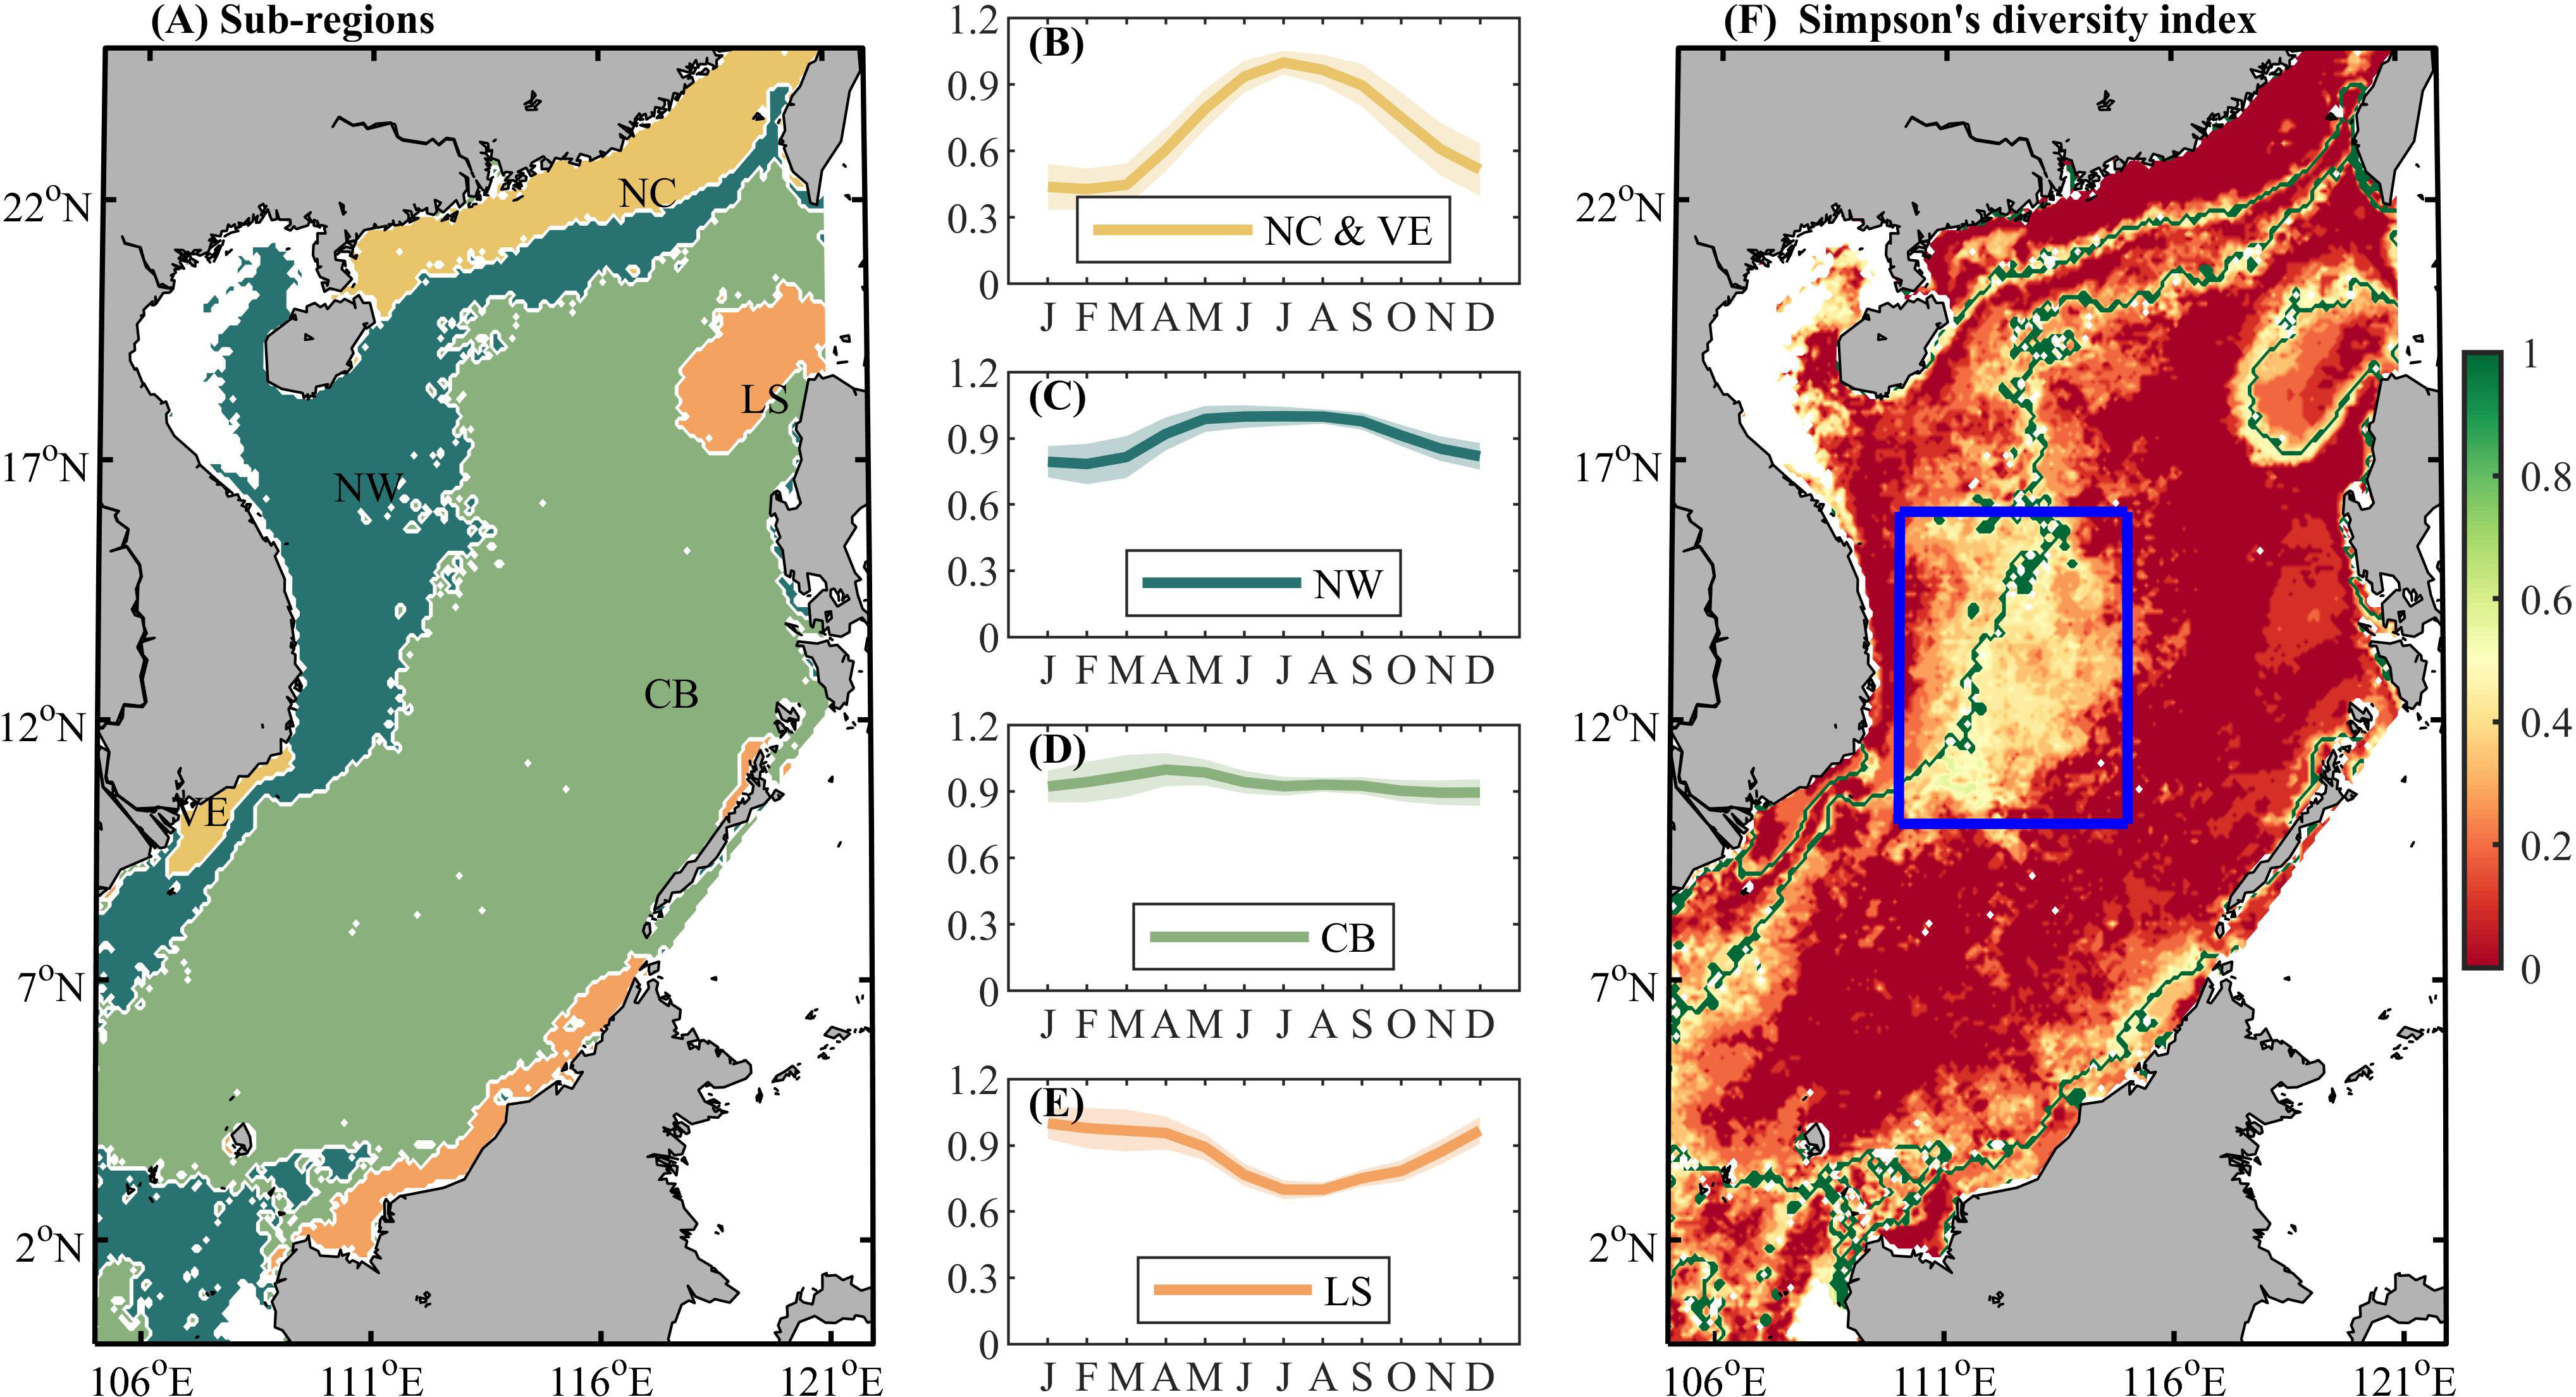
Figure 3 (A) Cluster-derived regions based on the climatological NPP seasonality during 2003–2021. (B–E) Temporal evolution of the centroid of four clusters obtained from k-means analysis. The colors of the curves correspond to those in (A). Light color shading in (B–E) indicates ± one standard deviation. (F) The Simpson diversity index for measuring the stability of NPP seasonality (the closer to 0 the more stable). Larger values indicate less variable seasonality. Borders of these regions are shown in green for reference. A low-value area is framed by the blue box.
A simplified form of Simpson’s diversity index was used to indicate the stability of seasonal variation (Simpson, 1949; Huang et al., 2022). In equation 5, S is the number of climatological clustering partitions (S = 4), N is the number of years in this study (N = 18), ni s the number of times that pixel has been clustered into region i by a single year. At this point a larger Simpson’s diversity index indicates that the pixel is divided into different partitions more often. As shown in Figure 3F, lower values of Simpson’s diversity index indicate less variable seasonality. The boundaries of the regions are plotted as green lines. The accuracy in relation to the Beibu Gulf is questionable owing to the serious amount of missing original NPP data (over 60% in winter), and this region is not considered in further discussion. Overall, the partition stability is high (average: 0.16, standard deviation: 0.16). A relatively less stable band exists from the southwest to the northeast as the boundary between regions NW and CB, and the widest part is in the central part of the SCS (Simpson index = 0.29 ± 0.16 in the blue box as shown in Figure 3F).
To quantify the difference between the SABPM NPP seasonality and the traditional results, the VGPM NPP is given simultaneously as a comparison. Figure 4 shows that the results of VGPM NPP correlate well with CHL and always have a seasonal cycle of high values in winter and low values in summer, except for region VE. However, uncoupling of seasonality variations between CHL and NPP in region NC has been investigated by Xie et al. (2020). They considered that the noncorresponding seasonal cycle is determined by river input. The seasonality of SABPM NPP is described as independent of CHL in regions NC and CB, and even negatively correlated in region NW. In region VE, the presence or absence of a winter peak is the main difference between CHL and SABPM NPP. On average, SABPM NPP is 170.9 and 312.9 mgC m-2 d-1 higher than VGPM NPP in regions NW and CB, respectively. This finding corresponds to the VGPM NPP being substantially lower than the field value measurements in the basin of the SCS (Tan and Shi, 2009; Huang et al., 2018); moreover, it suggests that, at least in parts of the SCS, NPP seasonality cannot be characterized simply by CHL.
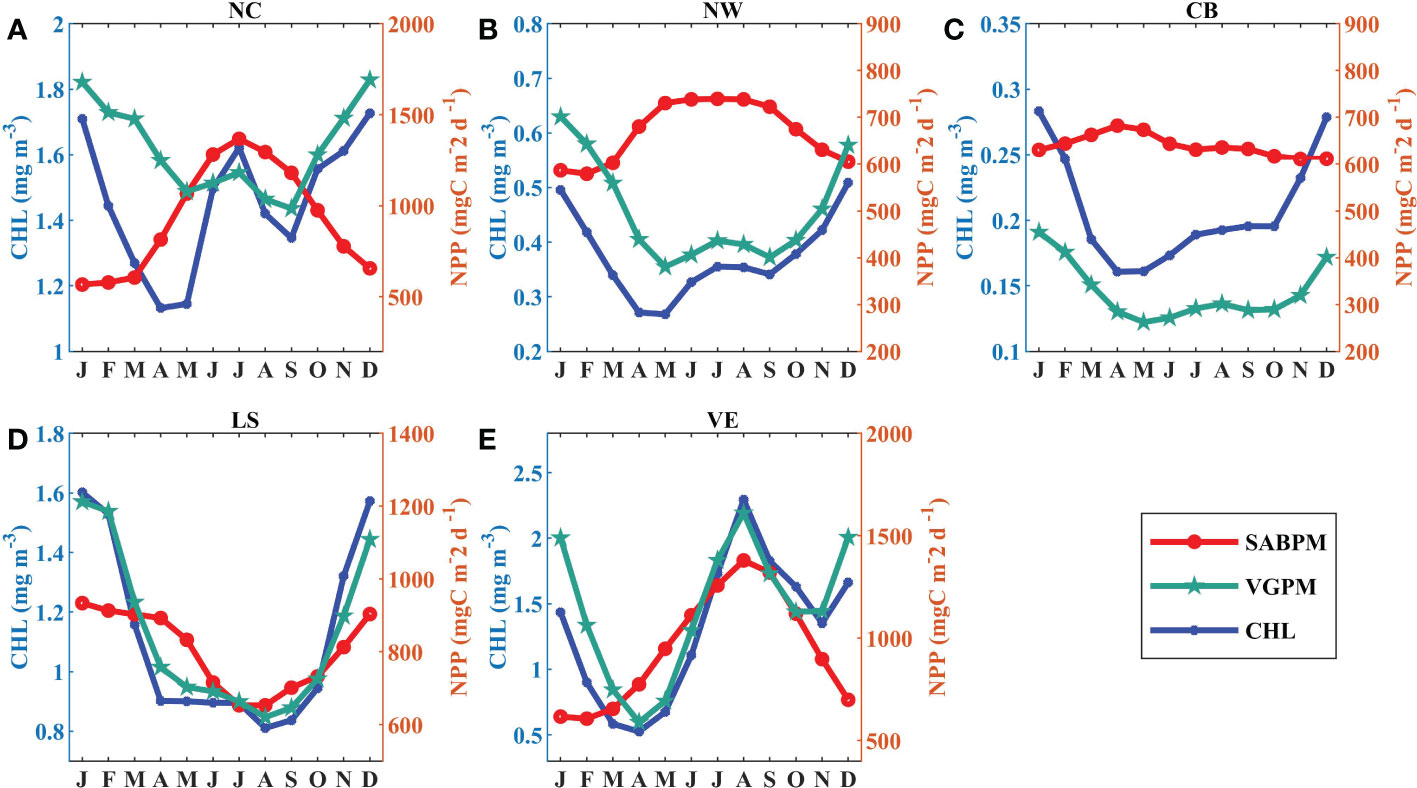
Figure 4 (A–E) Monthly average variations of mean NPP based on SABPM (red line), NPP based on VGPM (green line), and CHL (blue line) in the five regions shown in Figure 3A.
In comparison with VGPM NPP and CHL, SABPM NPP exhibits more seasonal variability in the SCS (Figure 4). In region NC, NPP is high in summer and low in winter, with a peak value in July (1367.5 mgC m-2 d-1). In region NW, NPP is higher during May–September with values in the range of 738.3–739.4 mgC m-2 d-1. In region CB, NPP does not exhibit evident seasonal variability (range: 611.0–682.3 mgC m-2 d-1), and there is only a weak signal in spring. In region LS, NPP is high in winter and low in summer with a peak value in January (933.7 mgC m-2 d-1). Region VE is similar to region NC with peak NPP in August (1379.3 mgC m-2 d-1).
In comparison with the seasonal clustering results for the surface CHL (Xu et al., 2020), there are relatively few typical subdivisions of the NPP in the deeper than 200 m region. Under the same clustering conditions, only northwestern Luzon was the common characteristic area, and the seasonality of surface CHL was far more complex (three more feature areas) in deeper water than the seasonality of NPP. This suggests that phytoplankton surface biomass and phytoplankton photosynthetic production capacity do not respond to the environment in exactly the same way. The role of environmental factors on NPP and the main driving processes of NPP in the SCS will be further discussed in this study.
Correlation coefficients between monthly climatological NPP values and the monthly climatological values of multiple parameters are shown in Figure 5, and the regional average correlation coefficients are listed in Table 3. Regions where the linear trend is not significant at the 95% confidence level are masked in Figure 5. PAR exhibits positive correlation with NPP in most of the SCS, except for region LS, region VE, and a small area in the central part. CHL does not directly characterize NPP in the SCS. The correlation coefficients are positive in the coastal waters adjacent to Pearl River estuary, region LS, and region VE and negative in region NW. The relationship between MLD and NPP shows negative correlation, which is most significant in central and northern parts of the SCS. The relationship between SST and NPP is significantly positive in northern and western nearshore areas of the SCS, but negative in region LS. In region LS, southwestern and southeastern areas of the SCS, and western nearshore parts, SLA is correlated negatively with NPP, while a small area with positive correlation exists in the central part of the SCS. Zeu is defined as 1% of the PAR depth, which has almost the opposite effect on NPP to that of CHL. Wind speed and its mixing effect are described by the 10-m zonal wind speed (U10). In regions NC, VE, and NW, U10 is correlated positively with NPP, indicating increase in NPP when the southwesterly wind strengthens. Conversely, in region LS, U10 is correlated negatively with NPP, indicating increase in NPP when the northeasterly wind strengthens. Positive correlation between WSC and NPP is found at various nearshore locations in the SCS, corresponding to the location of upwelling occurrence. In order to describe the main influences of NPP in each region, we ranked them by the averaged correlation coefficient and took the top three: SST, PAR, and U10 in region NC; U10, SST, and CHL in region LS; U10, WSC, and MLD in region VE; SST, U10, and MLD in region NW; PAR, MLD, and SLA in region CB.
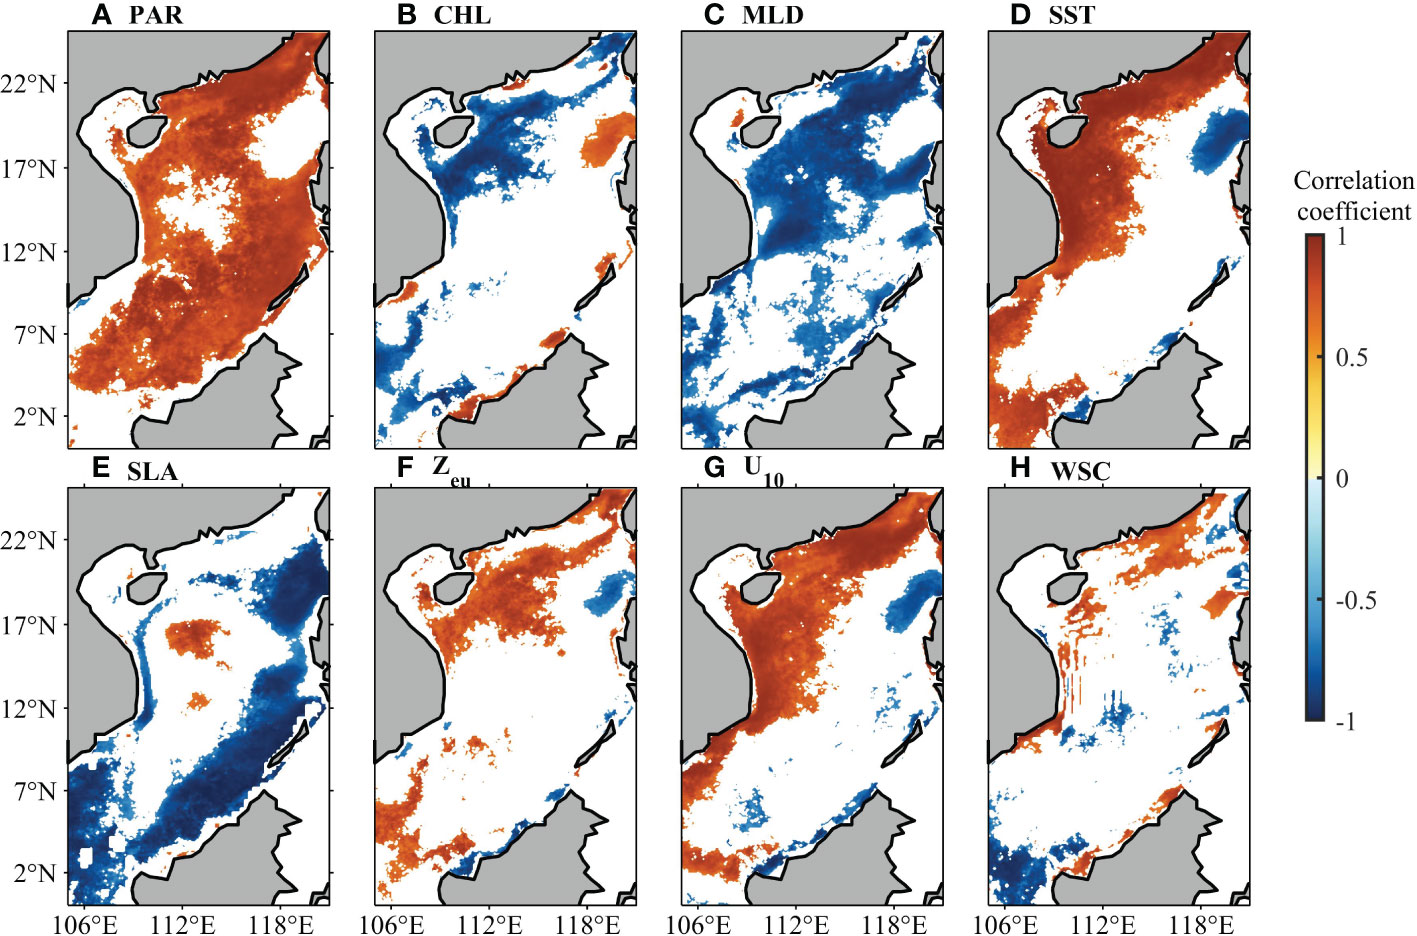
Figure 5 Correlation coefficients between monthly climatological NPP and (A) PAR, (B) CHL, (C) MLD, (D) SST, (E) SLA, (F) Zeu, (G) 10-m zonal wind speed (U10), and (H) WSC. Locations with nonsignificant correlations are plotted in white.
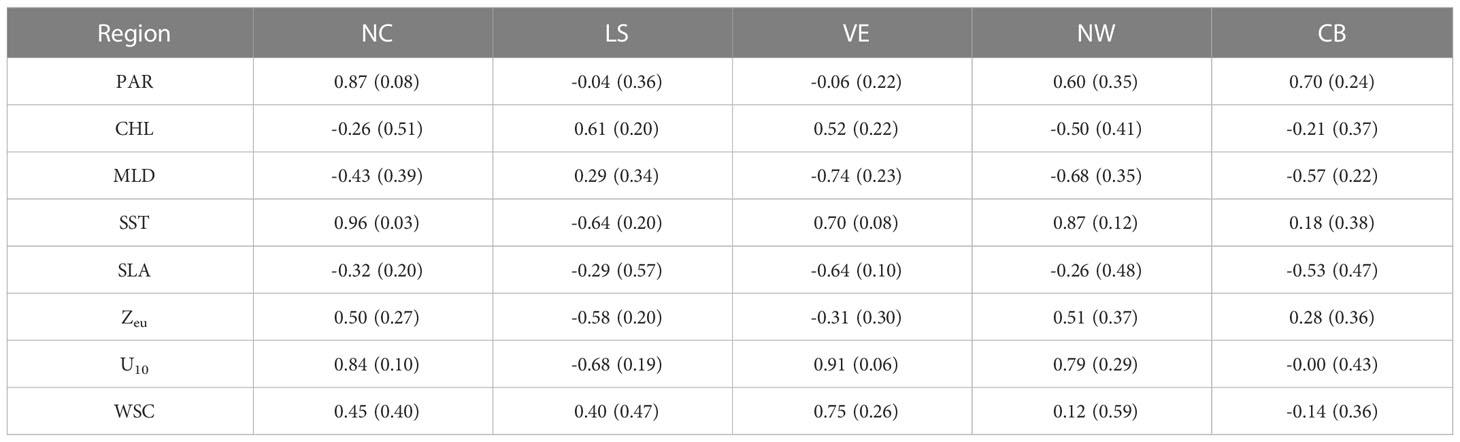
Table 3 Regional means of correlation coefficients with standard deviation shown in Figure 5.
Section 3.2 revealed the regional seasonality of NPP in the SCS; however, concerns over whether this division strategy has stability and whether there will be specific years that do not satisfy this division need further study. Figure 6 reveals the interannual differences in NPP seasonal clustering, where the years have similar seasonal cycle shapes and the separation of each partition is also relatively stable interannually. On average, the similarity index values for the regions ranged from 0.92 to 0.97. Some relatively obvious outliers are evident in 2016 and 2020. In 2016 (2020), NPP exhibits relatively strong intraregional seasonal variability in each of regions, with similarity index values of 0.90 (0.91), 0.92 (0.88), 0.89 (0.88), 0.94 (0.93), and 0.97 (0.95) in regions NC, LS, VE, NW, and CB, respectively. All regions except NC exhibit the lowest similarity index values in 2020, indicating that the seasonal variations in this year are significantly different from the climatic average. In these years, NPP is considered to be influenced by the local and remote forcing of large-scale climatic modes such as the El Niño–Southern Oscillation (ENSO)/Indian Ocean Dipole (IOD) (Kong et al., 2019; Kuo and Tseng, 2020).
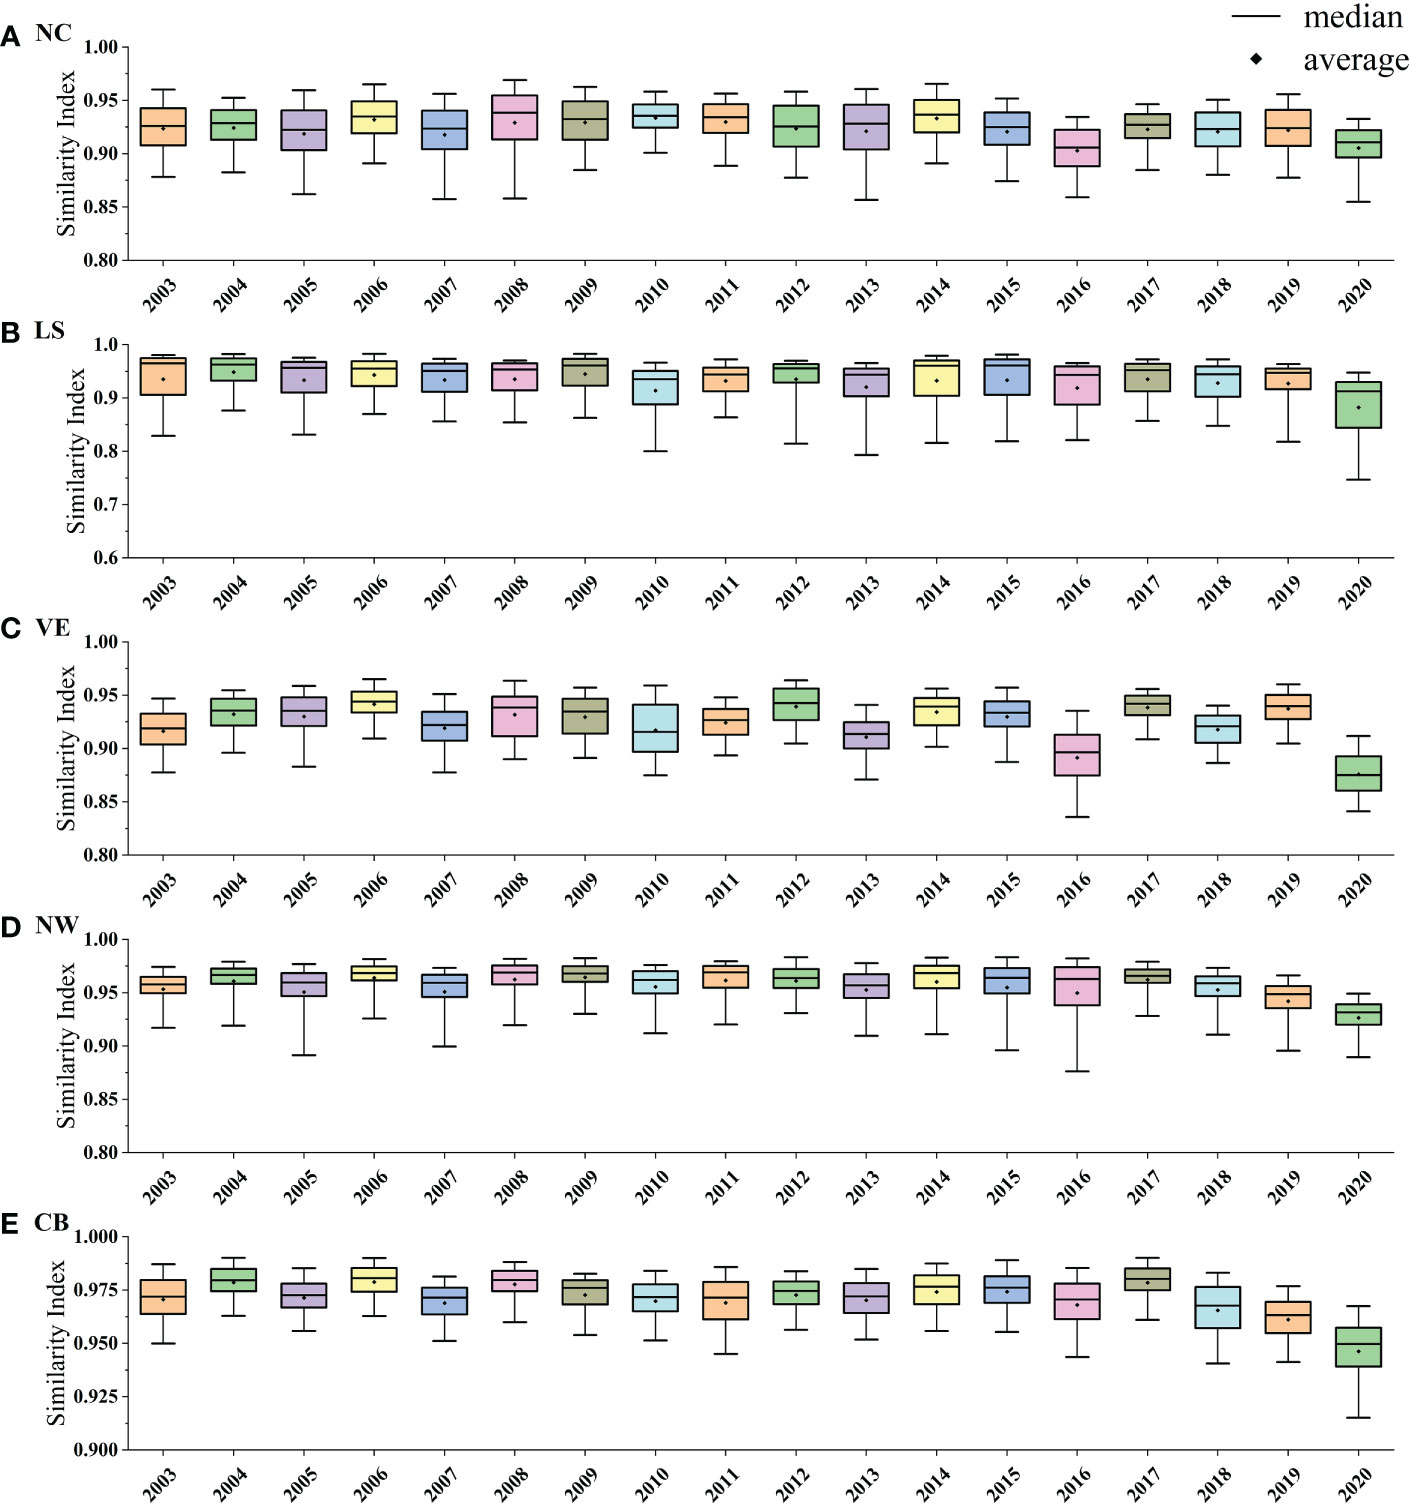
Figure 6 Quartile diagrams of similarity index between the seasonal variation of NPP for each year (2003–2020) and monthly climatology mean in typical regions: (A) NC, (B) LS, (C) VE, (D) NW and (E) CB. The rectangles, black lines, and black dots indicate the interquartile range, average, and median, respectively.
Except for the region LS, the spatial distribution of NPP seasonality differs from both the surface CHL (Yu et al., 2019) and surface carbon-to-CHL ratio (Xu et al., 2020) at least in waters deeper than 200 m in the SCS. This study suggests that there are two main reasons for this discordance: on the one hand, unlike NPP, surface CHL and surface carbon-to-CHL ratio do not contain vertical information, while there are still some errors in these two parameters obtained by satellite remote sensing. On the other hand, light conditions and nutrient availability are equally decisive factors for NPP. Therefore, the aim of this section is to discuss the direct and indirect influence of environmental parameters and dynamical processes on light conditions and nutrient supply.
In region NC, two areas of wind-driven summer upwelling are enhanced remarkably to the east of Guangdong and Qiongdong (Jing et al., 2009), while the peak of the Pearl River discharge occurs in July–August (Zhang et al., 2012; Xie et al., 2020). Together, they deliver nutrient-rich water to this region and PAR at this time is also higher than in winter, in accordance with the summer peak of NPP. The seasonal cycle of NPP in the VE region is the same as in the NC region, resulting in a higher NPP in summer than in winter. In addition to the upwelling driven by the alongshore wind stress (Wyrtki, 1961), nutrients transported by the Mekong River were also found to have a crucial impact on the summer peak of NPP (Zeng et al., 2022).
The local dynamical processes are more complex in region LS. During winter and spring, a zone of weak wind stress is formed in the direction downwind (west) of Luzon owing to the barrier effect of island against the northeasterly winds, resulting in generation of positive wind stress vorticity (He et al., 2015). Strong winter upwelling during November–January is observed in this region (Hu and Wang, 2016), driven by a combination of local wind and basin-scale circulation. Similarly, the seasonal cycle of NPP in the southern SCS is synchronized with that resulting from the influence of winter coastal upwelling off northwestern Borneo (Yan et al., 2015). Large amounts of nutrients are transported upward by the winter upwelling, when more phytoplankton could participate in photosynthetic reactions (surface CHL ~ 1.58 mg m-3, above annual average of 42.0%), positively correlating with NPP. Meanwhile, both low SST (~ 27.9°C, below 5.7% of annual average) and strong northeasterly winds in winter further enhance nutrient mixing. In summary, NPP in region LS is higher in winter than in summer.
No obvious dynamical processes are evident in region NW except for southwesterly wind mixing, and the seasonality of light and nutrients is the decisive factor affecting the seasonality of NPP. Recent results (Du et al., 2021) show that nutrients exhibit a gradational distribution from the northwest to the southeast in summer, with a maximum value (up to 7.0 μmol L-1 at 0 to 50 m) in the northwestern SCS and a nutricline depth of approximately 20 m. Meanwhile, higher SST and a shallower MLD in summer contribute to reduction in CHL concentration in this region. In region NW, owing to oligotrophic environmental conditions, the effect of lower CHL concentration on NPP is not directly positively correlated, but it is affected by light penetration (Lee et al., 2005). Compared with the annual mean data, the lower CHL (~ 0.34 mg m-3, below 7.4%) in summer leads to a higher diffuse attenuation coefficient (~ 0.05 m-1, above 7.9%), which in turn produces stronger light penetration and deeper Zeu (~ 87.3 m). Overall, the greatest PAR in summer is accompanied by the strongest light penetration, which allows more energy to penetrate into the nutrient layer, leading to a level of NPP that is consistently higher than in other seasons.
The obvious difference between region CB and region NW is the vertical distribution of nutrients (Du et al., 2021). In region CB, the annual nutricline depth is >60 m, where available light is almost dissipated. Therefore, in this region, NPP variation is minimal and the effects of all the environmental factors are almost insignificant. A weak signal of high NPP is evident in spring, corresponding to the highest PAR values. There is an area of low PAR correlation near the border between the northwest of region CB and region NW (the central SCS basin). An area of high nutrient concentration at approximately 50 m in autumn could help explain this discordant seasonality between NPP and PAR. Moreover, negative correlation between SLA and NPP occurs in an area extending southwestward from the Luzon Chanel to region CB, which might be related to mesoscale processes (Chelton et al., 2011).
SABPM is based on the radiative transfer theory of ocean optics, where the NPP is first calculated in layers and then integrated (Tao et al., 2017a; Tao et al., 2017b). This approach is strictly a physical process rather than an empirical relationship, except for the acquisition of light quantum yields (Lee Z et al., 2015). The CHL obtained by satellite remote sensing may cause two-step errors in the VGPM, but the uncertainty of input ocean color data in the aph-based model mainly originate from the remote-sensing reflectance (Lee Z et al., 2015). Based on the model comparison and the above analysis, we believe that the SABPM results are distinctive and provide a new perspective for NPP studies in the SCS. However, the seasonality of SABPM in the region NW and CB are still not validated by a large amount of field data and uncertainties exist. It is important to emphasize that the NPP seasonality is weak due to the lack of significant dynamics driving the CB region and may be subject to uncertainty caused by the model’s own inputs.
In summary, the seasonality of NPP is influenced by a variety of environmental dynamics, but it fundamentally depends on the combined regulation of light conditions, nutrient concentration, and CHL concentration. In the future, as studies of the physiological state and vertical structures of phytoplankton deepens, estimation of NPP with more accurate size-fractionated models were expected to improve this understanding (Sathyendranath et al., 2020; Liu et al., 2022; Deng et al., 2022).
Interannual variation of NPP in the SCS is jointly regulated by ENSO and IOD (Kong et al., 2019). ENSO events produce thermocline/nutricline anomalies that alter the nutrient supply to the true euphotic zone, which in turn affect primary productivity (Hu et al., 2021; Li et al., 2022). Moreover, the fractions of micro- and nano-phytoplankton in the SCS tend to rise during La Nina events (Li et al., 2017). Section 3.4 revealed those years in which the seasonal patterns exhibited large differences from the climatological monthly mean. We suppose that such interannual variations is also related to the large-scale climate events and we discuss the following two special cases.
A maximum positive (negative) seasonal variability occurred along the coastal area of NC and VE in October 2016 (2020), resulting in the highest NPP of 1323.1 mgC m-2 d-1 (lowest NPP of 885.7 mgC m-2 d-1). In October 2016 (2020), NPP above 32.2% (below 11.5%) of the climatology in these regions (Figures 7A, B, E) corresponded to a value of SLA that was 25.2% below (91.9% above) that of climatology (Figures 7C, D, F). In October 2016, the enhanced westerly winds (Figure 7G) in these regions (0.83 m s-1 higher than normal) favored the occurrence of upwelling, characterized by strong offshore Ekman transport and positive SLA (4 cm). Conversely, in October 2020, the westerly winds (Figure 7G) dropped by 1.38 m s-1, depressing the upwelling along the shelf. As a result, the offshore Ekman transport was weakened and the SLA decreased (14 cm). During these extreme events, anomalous NPP was associated with the negative SLA, indicating the important role of ENSO-related or IOD-related upwelling (Shu et al., 2018; Kong et al., 2019).
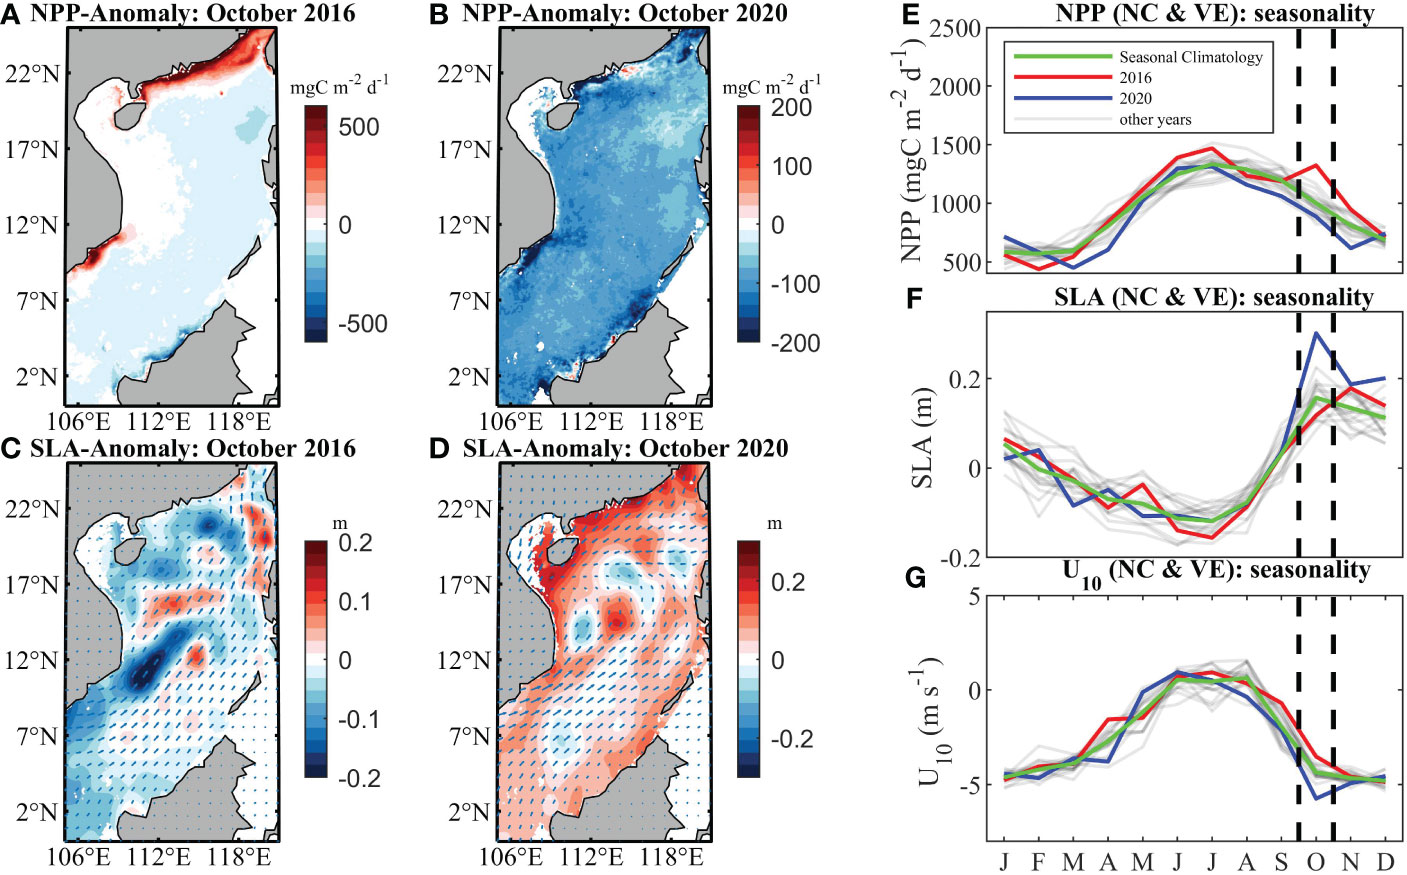
Figure 7 Spatial distribution of NPP in the SCS in October from (A) 2016 subtracted from the climatology and (B) 2020 subtracted from the climatology. Spatial distribution of SLA in the SCS in October from (C) 2016 subtracted from the climatology and (D) 2020 subtracted from the climatology. Vectors in (C) and (D) are the anomalous winds in 2016 and 2020. Seasonality of mean (E) NPP, (F) SLA and (G) U10 in the SCS for the climatology (green), 2016 (red), 2020 (blue) and other years (gray).
Also, this study found that 2020 was a special year with the most exceptional seasonal variation in NPP in the SCS. After a series of analyses similar to the process described above, NPP in each region was found to be low in March–April and November. We speculate that this is related to the low MLD in the SCS from 2019 onwards (super IOD from 2019 onwards may be the cause of the MLD and SLA anomalies, Utari et al., 2022), as the shallower MLD may have led to a compression of the nutrient-rich season. However, further analysis and more data are needed in the future to support this speculation.
Among the various NPP models available, including VGPM, CbPM, CAFE, and SABPM, the latter was found most reliable in describing the seasonal variation of NPP in the SCS. On the basis of a MODIS data product estimated using SABPM, this study investigated the seasonality of NPP by considering the spatial differences and the interannual variations. The main findings include the following. 1) NPP estimated with SABPM exhibits more spatial features of seasonality in the SCS. NPP is higher in summer than in winter in regions NC and VE, whereas it is higher in winter than in summer in region LS. The magnitude of NPP variability is relatively small in regions NW and CB, with relatively high values throughout summer in region NW and a weak signal of high NPP in spring in region CB. 2) Because nutrient limitation is one of the determinants of NPP in the SCS, high values in coastal areas are well matched with the occurrence of upwelling or river-derived input, while the main difference between regions NW and CB might be related to the depth of the nutricline. Other environmental factors including PAR, SST, MLD, and wind speed could also regulate the seasonal patterns in NPP by affecting the available light and nutrient distribution within the euphotic zone in different regions. 3) The interannual departures of NPP seasonality from climatology were observed with the largest anomalous changes coincides with the 2015–2016 ENSO and 2020 IOD events. Specific case analyses indicate that anomalous latitudinal wind speeds and SLA during these climate events could promote or hinder nutrient availability and then cause NPP anomalies. As SABPM shows potential for identifying annual signals, further applications for interannual NPP variability analysis are expected in the future.
The raw data supporting the conclusions of this article will be made available by the authors, without undue reservation.
HL performed the data analysis and drafted the manuscript. GW initiated the idea of this study, contributed to the data analysis and helped improve the manuscript. WX, YZ and LJ participated in the discussions and helped improve the manuscript. All authors contributed to the article and approved the submitted version.
This work was supported by the National Natural Science Foundation of China (grant no. 42276189), and National Natural Science Foundation of China (grant no. 41776045).
We thank the NASA EARTHDATA (https://www.earthdata.nasa.gov/), the Oregon State Ocean Productivity website (http://sites.science.oregonstate.edu/ocean.productivity/), the Copernicus Marine Environment Monitoring Service (http://marine.copernicus.eu/) and the Global Change Research Data Publishing & Repository (https://doi.org/10.3974/geodb.2019.05.01.V1) for processing and distributing the primary datasets. We are grateful to Dr. Zui Tao for his help. We thank two reviewers for their precious comments on this manuscript. We thank James Buxton MSc, from Liwen Bianji (Edanz) (www.liwenbianji.cn/), for editing the English text of a draft of this manuscript.
The authors declare that the research was conducted in the absence of any commercial or financial relationships that could be construed as a potential conflict of interest.
All claims expressed in this article are solely those of the authors and do not necessarily represent those of their affiliated organizations, or those of the publisher, the editors and the reviewers. Any product that may be evaluated in this article, or claim that may be made by its manufacturer, is not guaranteed or endorsed by the publisher.
Alvera-Azcárate A., Barth A., Rixen M., Beckers J. M. (2005). Reconstruction of incomplete oceanographic data sets using empirical orthogonal functions: Application to the Adriatic Sea surface temperature. Ocean Model. 9 (4), 325–346. doi: 10.1016/j.ocemod.2004.08.001
Ardyna M., Claustre H., Sallée J. B., d'Ovidio F., Gentili B., van Dijken G., et al. (2017). Delineating environmental control of phytoplankton biomass and phenology in the southern ocean. Geophys. Res. Lett. 44 (10), 5016–5024. doi: 10.1002/2016GL072428
Barnes M. K., Tilstone G. H., Smyth T. J., Suggett D. J., Astoreca R., Lancelot C., et al. (2014). Absorption-based algorithm of primary production for total and size-fractionated phytoplankton in coastal waters. Mar. Ecol. Prog. Ser. 504, 73–89. doi: 10.3354/meps10751
Beckers J. M., Rixen M. (2003). EOF calculations and data filling from incomplete oceanographic datasets. J. Atmos. Oceanic Technol. 20 (12), 1839–1856. doi: 10.1175/1520-0426(2003)020<1839:ECADFF>2.0.CO;2
Behrenfeld M. J., Boss E., Siegel D. A., Shea D. M. (2005). Carbon-based ocean productivity and phytoplankton physiology from space. Global Biogeochem. Cycles 19 (1). doi: 10.1029/2004GB002299
Behrenfeld M. J., Falkowski P. G. (1997a). A consumer's guide to phytoplankton primary productivity models. Limnol. Oceanogr. 42 (7), 1479–1491. doi: 10.4319/lo.1997.42.7.1479
Behrenfeld M. J., Falkowski P. G. (1997b). Photosynthetic rates derived from satellite-based chlorophyll concentration. Limnol. Oceanogr. 42 (1), 1–20. doi: 10.4319/lo.1997.42.1.0001
Behrenfeld M. J., Randerson J. T., McClain C. R., Feldman G. C., Los S. O., Tucker C. J., et al. (2001). Biospheric primary production during an ENSO transition. Science 291 (5513), 2594–2597.
Bosc E., Bricaud A., Antoine D. (2004). Seasonal and interannual variability in algal biomass and primary production in the Mediterranean Sea, as derived from 4 years of SeaWiFS observations. Global Biogeochem. Cycles 18 (1). doi: 10.1029/2003GB002034
Bouman H. A., Platt T., Doblin M., Figueiras F. G., Gudmundsson K., Gudfinnsson H. G., et al. (2018). Photosynthesis–irradiance parameters of marine phytoplankton: synthesis of a global data set. Earth Syst. Sci. Data 10 (1), 251–266. doi: 10.5194/essd-10-251-2018
Brewin R. J. W., Sathyendranath S., Platt T., Bouman H., Ciavatta S., Dall'Olmo G., et al. (2021). Sensing the ocean biological carbon pump from space: A review of capabilities, concepts, research gaps and future developments. Earth-Sci. Rev. 217, 103604. doi: 10.1016/j.earscirev.2021.103604
Campbell J., Antoine D., Armstrong R., Arrigo K., Balch W., Barber R., et al. (2002). Comparison of algorithms for estimating ocean primary production from surface chlorophyll, temperature, and irradiance. Global Biogeochem. Cycles 16 (3), 9–1-9-15. doi: 10.1029/2001GB001444
Carr M. E., Friedrichs M. A. M., Schmeltz M., Aita M. N., Antoine D., Arrigo K. R., et al. (2006). A comparison of global estimates of marine primary production from ocean color. Deep Sea Res. Part II: Topic. Stud. Oceanogr. 53 (5-7), 741–770. doi: 10.1016/j.dsr2.2006.01.028
Chassignet E. P., Hurlburt H. E., Smedstad O. M., Halliwell G. R., Hogan P. J., Wallcraft A. J., et al. (2007). The HYCOM (hybrid coordinate ocean model) data assimilative system. J. Mar. Syst. 65 (1-4), 60–83. doi: 10.1016/j.jmarsys.2005.09.016
Chavez F. P., Messié M., Pennington J. T. (2011). Marine primary production in relation to climate variability and change. Annu. Rev. Mar. Sci. 3, 227–260. doi: 10.1146/annurev.marine.010908.163917
Chelton D. B., Schlax M. G., Samelson R. M. (2011). Global observations of nonlinear mesoscale eddies. Prog. Oceanogr. 91 (2), 167–216. doi: 10.1016/j.pocean.2011.01.002
Chen Y. L. L., Chen H. Y. (2006). Seasonal dynamics of primary and new production in the northern south China Sea: The significance of river discharge and nutrient advection. Deep Sea Res. Part I: Oceanogr. Res. Papers 53 (6), 971–986. doi: 10.1016/j.dsr.2006.02.005
Dee D. P., Uppala S. M., Simmons A. J., Berrisford P., Poli P., Kobayashi S., et al. (2011). The ERA-interim reanalysis: Configuration and performance of the data assimilation system. Q. J. R. Meteorol. Soc. 137 (656), 553–597. doi: 10.1002/qj.828
Deng L., Zhou W., Xu J., Cao W., Liao J., Zhao J., et al. (2022). Estimation of vertical size-fractionated phytoplankton primary production in the northern south China Sea. Ecol. Indic. 135, 108546. doi: 10.1016/j.ecolind.2022.108546
Ducet N., Le Traon P. Y., Reverdin G. (2000). Global high-resolution mapping of ocean circulation from TOPEX/Poseidon and ERS-1 and-2. J. Geophys. Res.: Oceans 105 (C8), 19477–19498. doi: 10.1029/2000JC900063
Du C., He R., Liu Z., Huang T., Wang L., Yuan Z., et al. (2021). Climatology of nutrient distributions in the south China Sea based on a large data set derived from a new algorithm. Prog. Oceanogr. 195, 102586. doi: 10.1016/j.pocean.2021.102586
Foukal N. P., Thomas A. C. (2014). Biogeography and phenology of satellite-measured phytoplankton seasonality in the California current. Deep Sea Res. Part I: Oceanogr. Res. Papers 92, 11–25.
Frouin R., McPherson J., Ueyoshi K., Franz B. A. (2012). A time series of photosynthetically available radiation at the ocean surface from SeaWiFS and MODIS data. Remote Sens. Mar. Environ. II. SPIE 8525, 234–245. doi: 10.1117/12.981264
He Y., Cai S., Wang D., He J. (2015). A model study of Luzon cold eddies in the northern south China Sea. Deep Sea Res. Part I: Oceanogr. Res. Papers 97, 107–123.
Hellerman S. (1965). Computations of wind stress fields over the Atlantic ocean. Monthly Weather Rev. 93 (4), 239–244. doi: 10.1175/1520-0493(1965)093<0239:COWSFO>2.3.CO;2
Hirawake T., Shinmyo K., Fujiwara A., Saitoh S. I. (2012). Satellite remote sensing of primary productivity in the Bering and chukchi seas using an absorption-based approach. ICES J. Mar. Sci. 69 (7), 1194–1204. doi: 10.1093/icesjms/fss111
Huang K., Xue H., Chai F., Wang D., Xiu P., Xie Q., et al. (2022). Inter-annual variability of biogeography-based phytoplankton seasonality in the Arabian Sea during 1998–2017. Deep Sea Res. Part II: Topic. Stud. Oceanogr. 105096.
Huang Y., Yang B., Chen B., Qiu G., Wang H., Huang B., et al. (2018). Net community production in the south China Sea basin estimated from in situ O2 measurements on an argo profiling float. Deep Sea Res. Part I: Oceanogr. Res. Papers 131, 54–61. doi: 10.1016/j.dsr.2017.11.002
Hu Q., Chen X., He X., Bai Y., Gong F., Zhu Q., et al. (2021). Effect of El niño-related warming on phytoplankton's vertical distribution in the Arabian Sea. J. Geophys. Res.: Oceans 126 (11), e2021JC017882.
Hu C., Lee Z., Franz B. (2012). Chlorophyll aalgorithms for oligotrophic oceans: A novel approach based on three-band reflectance difference. J. Geophys. Res.: Oceans 117 (C1).
Hu J., Wang X. H. (2016). Progress on upwelling studies in the China seas. Rev. Geophys. 54 (3), 653–673. doi: 10.1002/2015RG000505
Jing Z., Qi Y., Hua Z., Hua Z. L., Zhang H. (2009). Numerical study on the summer upwelling system in the northern continental shelf of the south China Sea. Continent. Shelf Res. 29 (2), 467–478. doi: 10.1016/j.csr.2008.11.008
Karl D. M., Lukas R. (1996). The Hawaii ocean time-series (HOT) program: Background, rationale and field implementation. Deep Sea Res. Part II: Topic. Stud. Oceanogr. 43 (2-3), 129–156. doi: 10.1016/0967-0645(96)00005-7
Kilpatrick K. A., Podestá G., Walsh S., Williams E., Halliwell V., Szczodrak M., et al. (2015). A decade of sea surface temperature from MODIS. Remote Sens. Environ. 165, 27–41. doi: 10.1016/j.rse.2015.04.023
Kirkpatrick G. J., Millie D. F., Moline M. A., Schofield O. (2000). Optical discrimination of a phytoplankton species in natural mixed populations. Limnol. Oceanogr. 45 (2), 467–471. doi: 10.4319/lo.2000.45.2.0467
Kong F., Dong Q., Xiang K., Yin Z., Li Y., Liu J. (2019). Spatiotemporal variability of remote sensing ocean net primary production and major forcing factors in the tropical Eastern Indian and Western pacific ocean. Remote Sens. 11 (4), 391. doi: 10.3390/rs11040391
Kulk G., Platt T., Dingle J., Jackson T., Jönsson B. F., Bouman H. A., et al. (2020). Primary production, an index of climate change in the ocean: Satellite-based estimates over two decades. Remote Sens. 12 (5), 826. doi: 10.3390/rs12050826
Kulk G., Platt T., Dingle J., Jackson T., Jönsson B. F., Bouman H. A., et al. (2021). Correction: Kulk et al. Primary production, an index of climate change in the ocean: Satellite-based estimates over two decades. Remote Sens. 12, 826. doi: 10.3390/rs13173462
Kuo Y. C., Tseng Y. H. (2020). Impact of ENSO on the south China Sea during ENSO decaying winter–spring modeled by a regional coupled model (a new mesoscale perspective). Ocean Model. 152, 101655. doi: 10.1016/j.ocemod.2020.101655
Lee Z., Du K., Arnone R., Liew S., Penta B. (2005). Penetration of solar radiation in the upper ocean: A numerical model for oceanic and coastal waters. J. Geophysical Research: Oceans 110 (C9). doi: 10.1029/2004JC002780
Lee Z., Marra J. F. (2022). The use of VGPM to estimate oceanic primary production: A “Tango” difficult to dance. J. Remote Sens. 2022. doi: 10.34133/2022/9851013
Lee Z., Marra J., Perry M. J., Kahru M. (2015). Estimating oceanic primary productivity from ocean color remote sensing: A strategic assessment. J. Mar. Syst. 149, 50–59. doi: 10.1016/j.jmarsys.2014.11.015
Lee Y. J., Matrai P. A., Friedrichs M. A., Saba V. S., Antoine D., Ardyna M., et al. (2015). An assessment of phytoplankton primary productivity in the Arctic ocean from satellite ocean color/in situ chlorophyll-a based models. J. Geophys. Res.: Oceans 120 (9), 6508–6541. doi: 10.1002/2015JC011018
Lee Z. P., Weidemann A., Kindle J., Arnone R., Carder K. L., Davis C., et al. (2007). Euphotic zone depth: Its derivation and implication to ocean-color remote sensing. J. Geophys. Res.: Oceans 112 (C3).
Liao X., Ma J., Zhan H. (2012). Effect of different types of El niño on primary productivity in the south China Sea. Aquat. Ecosyst. Health Manage. 15 (2), 135–143. doi: 10.1080/14634988.2012.687655
Li T., Bai Y., Chen X., Zhu Q., Gong F., Wang D., et al. (2017). “Longtime variation of phytoplankton in the south China Sea from the perspective of carbon fixation,” in Remote sensing of the ocean, Sea ice, coastal waters, and Large water regions 2017, vol. 10422. (SPIE), 94–104.
Lin I. I., Chen J. P., Wong G. T. F., Wong G. T., Huang C. W., Lien C. C., et al. (2007). Aerosol input to the south China Sea: Results from the moderate resolution imaging spectroradiometer, the quick scatterometer, and the measurements of pollution in the troposphere sensor. Deep Sea Res. Part II: Topic. Stud. Oceanogr. 54 (14-15), 1589–1601.
Li W., Tiwari S. P., El-Askary H. M., Qurban M. A., Amiridis V., Manikandan K. P., et al. (2020). Synergistic use of remote sensing and modeling for estimating net primary productivity in the red Sea with VGPM, eppley-VGPM, and CbPM models intercomparison. IEEE Trans. Geosci. Remote Sens. 58 (12), 8717–8734. doi: 10.1109/TGRS.2020.2990373
Liu K. K., Chao S. Y., Shaw P. T., Gong G. C., Chen C. C., Tang T. Y., et al. (2002). Monsoon-forced chlorophyll distribution and primary production in the south China Sea: observations and a numerical study. Deep Sea Res. Part I: Oceanogr. Res. Papers 49 (8), 1387–1412.
Liu K. K., Chen Y. J., Tseng C. M., Lin I. I., Liu H. B., Snidvongs A., et al. (2007). The significance of phytoplankton photo-adaptation and benthic–pelagic coupling to primary production in the south China Sea: Observations and numerical investigations. Deep Sea Res. Part II: Topic. Stud. Oceanogr. 54 (14-15), 1546–1574.
Liu X., Wang M. (2018). Gap filling of missing data for VIIRS global ocean color products using the DINEOF method. IEEE Trans. Geosci. Remote Sens. 56 (8), 4464–4476. doi: 10.1109/TGRS.2018.2820423
Liu X., Wang M. (2019). Filling the gaps of missing data in the merged VIIRS SNPP/NOAA-20 ocean color product using the DINEOF method. Remote Sens. 11 (2), 178. doi: 10.3390/rs11020178
Liu H., Xie Y., Browning T. J., Xu F., Huang B.. (2022). Phytoplankton photophysiology across tropical eddies: Deconvolving nutrient, light, and community signals. Front. Mar. Sci. 9, Art.Nr.934391. doi: 10.3389/fmars.2022.934391
Li L., Wu C., Sun J., Song S., Ding C., Huang D., et al. (2020). Nitrogen fixation driven by mesoscale eddies and the kuroshio current in the northern south China Sea and the East China Sea. Acta Oceanol. Sin. 39 (12), 30–41. doi: 10.1007/s13131-020-1691-0
Li H., Zhang J., Xuan J., Wu Z., Ran L., Wiesner M. G., et al. (2022). Asymmetric response of the biological carbon pump to the ENSO in the south China Sea. Geophys. Res. Lett. 49 (2), e2021GL095254. doi: 10.1029/2021GL095254
Lohrenz S. E., Knauer G. A., Asper V. L., Tuel M., Michaels A. F., Knap A. H., et al. (1992). Seasonal variability in primary production and particle flux in the northwestern Sargasso Sea: US JGOFS Bermuda Atlantic time-series study. Deep Sea Res. Part A. Oceanogr. Res. Papers 39 (7-8), 1373–1391. doi: 10.1016/0198-0149(92)90074-4
Ma S., Tao Z., Yang X., Yu Y., Zhou X., Ma W., et al. (2014). Estimation of marine primary productivity from satellite-derived phytoplankton absorption data. IEEE J. Select. Top. Appl. Earth Observ. Remote Sens. 7 (7), 3084–3092. doi: 10.1109/JSTARS.2014.2298863
Matsumoto K., Abe O., Fujiki T., Sukigara C., Mino Y. (2016). Primary productivity at the time-series stations in the northwestern pacific ocean: is the subtropical station unproductive? J. Oceanogr. 72 (3), 359–371. doi: 10.1007/s10872-016-0354-4
Messié M., Chavez F. P. (2015). Seasonal regulation of primary production in eastern boundary upwelling systems. Prog. Oceanogr. 134, 1–18. doi: 10.1016/j.pocean.2014.10.011
Montes-Hugo M., Doney S. C., Ducklow H. W., Fraser W., Martinson D., Stammerjohn S. E., et al. (2009). Recent changes in phytoplankton communities associated with rapid regional climate change along the western Antarctic peninsula. Science 323 (5920), 1470–1473.
Nielsen E. S. (1952). The use of radio-active carbon (C14) for measuring organic production in the sea. ICES J. Mar. Sci. 18 (2), 117–140. doi: 10.1093/icesjms/18.2.117
Ning X. R., Chai F., Xue H., Cai Y., Liu C., Shi J., et al. (2004). Physical-biological oceanographic coupling influencing phytoplankton and primary production in the south China Sea. J. Geophys. Res.: Oceans 109 (C10).
Oziel L., Massicotte P., Randelhoff A., Ferland J., Vladoiu A., Lacour L., et al. (2019). Environmental factors influencing the seasonal dynamics of spring algal blooms in and beneath sea ice in western Baffin bay. Elementa: Sci. Anthropocene 7.
Pan X., Wong G. T. F., Tai J. H., Ho T. Y. (2015). Climatology of physical hydrographic and biological characteristics of the northern south China Sea shelf-sea (NoSoCS) and adjacent waters: Observations from satellite remote sensing. Deep Sea Res. Part II: Topic. Stud. Oceanogr. 117, 10–22. doi: 10.1016/j.dsr2.2015.02.022
Platt T., Sathyendranath S. (1988). Oceanic primary production: estimation by remote sensing at local and regional scales. Science 241 (4873), 1613–1620.
Reid P. C., Fischer A. C., Lewis-Brown E., Meredith M. P., Sparrow M., Andersson A. J., et al. (2009). Impacts of the oceans on climate change. Adv. Mar. Biol. 56, 1–150. doi: 10.1016/S0065-2881(09)56001-4
Robinson C. M., Cherukuru N., Hardman-Mountford N. J., Everett J. D., McLaughlin M. J., Davies K. P., et al. (2017). Phytoplankton absorption predicts patterns in primary productivity in Australian coastal shelf waters. Estuar. Coast. Shelf Sci. 192, 1–16. doi: 10.1016/j.ecss.2017.04.012
Saba V. S., Friedrichs M. A. M., Antoine D., Armstrong R. A., Asanuma I., Behrenfeld M. J., et al. (2011). An evaluation of ocean color model estimates of marine primary productivity in coastal and pelagic regions across the globe. Biogeosciences 8 (2), 489–503. doi: 10.5194/bg-8-489-2011
Sarmiento J. L., Gruber N. (2002). Sinks for anthropogenic carbon. Phys. Today 55 (8), 30–36. doi: 10.1063/1.1510279
Sathyendranath S., Platt T., Kovač Ž, Dingle J., Jackson T., Brewin R., et al. (2020). Reconciling models of primary production and photoacclimation. Appl. opt. 59 (10), C100–C114. doi: 10.1364/AO.386252
Shaw P. T., Chao S. Y., Liu K. K., Pai S. C., Liu C. T. (1996). Winter upwelling off Luzon in the northeastern south China Sea. J. Geophys. Res.: Oceans 101 (C7), 16435–16448. doi: 10.1029/96JC01064
Shih Y. Y., Shiah F. K., Lai C. C., Chou W. C., Tai J. H., Wu Y. S., et al. (2021). Comparison of primary production using in situ and satellite-derived values at the SEATS station in the south China Sea. Front. Mar. Sci. 8, 747763. doi: 10.3389/fmars.2021.747763
Silsbe G. M., Behrenfeld M. J., Halsey K. H., Milligan A. J., Westberry T. K. (2016). The CAFE model: A net production model for global ocean phytoplankton. Global Biogeochem. Cycles 30 (12), 1756–1777. doi: 10.1002/2016GB005521
Shu Y, Wang D., Feng M., Geng B., Chen J., Yao J., et al. (2018). The contribution of local wind and ocean circulation to the interannual variability in coastal upwelling intensity in the Northern South China Sea. J. Geophys. Research: Oceans 123 (9), 6766–6778. doi: 10.1029/2018JC014223
Tang D. L., Ni I. H., Kester D. R., Müller-Karger F. E. (1999). Remote sensing observations of winter phytoplankton blooms southwest of the Luzon strait in the south China Sea. Mar. Ecol. Prog. Ser. 191, 43–51. doi: 10.3354/meps191043
Tan S. C., Shi G. Y. (2009). Spatiotemporal variability of satellite-derived primary production in the south China Sea 1998–2006. J. Geophys. Res.: Biogeosci. 114 (G3).
Tao Z., Ma S., Yang X., Wang Y. (2017b). Assessing the uncertainties of phytoplankton absorption-based model estimates of marine net primary productivity. Acta Oceanol. Sin. 36 (6), 112–121. doi: 10.1007/s13131-017-1047-8
Tao Z., Wang Y., Ma S., Lv T., Zhou X. (2017a). A phytoplankton class-specific marine primary productivity model using MODIS data. IEEE J. Select. Top. Appl. Earth Observ. Remote Sens. 10 (12), 5519–5528. doi: 10.1109/JSTARS.2017.2747770
Torrecilla E., Stramski D., Reynolds R. A., Millán-Núñez E., Piera J. (2011). Cluster analysis of hyperspectral optical data for discriminating phytoplankton pigment assemblages in the open ocean. Remote Sens. Environ. 115 (10), 2578–2593. doi: 10.1016/j.rse.2011.05.014
Tseng H. C., You W. L., Huang W., Chung C. C., Tsai A. Y., Chen T. Y., et al. (2020). Seasonal variations of marine environment and primary production in the Taiwan strait. Front. Mar. Sci. 7, 38. doi: 10.3389/fmars.2020.00038
Utari P. A., Saputra O. F., Lestiana H. (2022). “The spatial and temporal impacts of mixed layer depth (MLD) variations in West sumatera coastal area,” in IOP Conference Series: Earth and Environmental Science, Vol. 1047. 012022 (IOP Publishing).
Wang H., Jin Q. H., Gao S. (2008). A preliminary study on the response of marine primary production to monsoon variations in the south China Sea. Acta Oceanol. Sin. 27 (5), 21–35.
Westberry T., Behrenfeld M. J., Siegel D. A., Boss E. (2008). Carbon-based primary productivity modeling with vertically resolved photoacclimation. Global Biogeochem. Cycles 22 (2). doi: 10.1029/2007GB003078
Williams P. J. B., Morris P. J., Karl D. M. (2004). Net community production and metabolic balance at the oligotrophic ocean site, station ALOHA. Deep Sea Res. Part I: Oceanogr. Res. Papers 51 (11), 1563–1578. doi: 10.1016/j.dsr.2004.07.001
Wu J., Goes J. I., do Rosario Gomes H., Lee Z., Noh J. H., Wei J., et al. (2022). Estimates of diurnal and daily net primary productivity using the geostationary ocean color imager (GOCI) data. Remote Sens. Environ. 280, 113183. doi: 10.1016/j.rse.2022.113183
Wyrtki K. (1961). Physical oceanography of the southeast Asian waters (University of California, Scripps Institution of Oceanography).
Xiao H. W., Luo L., Zhu R. G., Guo W., Long A. M., Wu J. F., et al. (2020). Enhanced primary production in the oligotrophic south China Sea related to southeast Asian forest fires. J. Geophys. Res.: Oceans 125 (2), e2019JC015663.
Xie Y., Huang B., Lin L., Laws E. A., Wang L., Shang S., et al. (2015). Photosynthetic parameters in the northern south China Sea in relation to phytoplankton community structure. J. Geophys. Res.: Oceans 120 (6), 4187–4204. doi: 10.1002/2014JC010415
Xie Y., Lin L., Xiao W., Yu X., Lan W., Huang B., et al. (2020). Striking seasonal pattern of primary production in the river-dominated ocean margin of the northern south China Sea (NSCS-RiOMar) revealed by new field and remotely sensed data. Prog. Oceanogr. 189, 102470. doi: 10.1016/j.pocean.2020.102470
Xu W., Wang G., Jiang L., Cheng X., Zhou W., Cao W., et al. (2020). Spatiotemporal variability of surface phytoplankton carbon and carbon-to-Chlorophyll a ratio in the south China Sea based on satellite data. Remote Sens. 13 (1), 30. doi: 10.3390/rs13010030
Xu H., Zhou W., Li A., Ji S. (2016). “Similarities and differences of oceanic primary productivity product estimated by three models based on modis for the open south China Sea,” in International Conference on Geo-Informatics in Resource Management and Sustainable Ecosystem (Singapore: Springer), 328–336.
Yan Y., Ling Z., Chen C. (2015). Winter coastal upwelling off northwest Borneo in the south China Sea. Acta Oceanol. Sin. 34 (1), 3–10. doi: 10.1007/s13131-015-0590-2
Ye H., Chen C., Sun Z., Tang S., Song X., Yang C., et al. (2015). Estimation of the primary productivity in pearl river estuary using MODIS data. Estuar. Coasts 38 (2), 506–518. doi: 10.1007/s12237-014-9830-5
Yu Y., Xing X., Liu H., Yuan Y., Wang Y., Chai F., et al. (2019). The variability of chlorophyll-a and its relationship with dynamic factors in the basin of the south China Sea. J. Mar. Syst. 200, 103230. doi: 10.1016/j.jmarsys.2019.103230
Zeng X., Bracco A., Tagklis F. (2022). Dynamical impact of the Mekong river plume in the south China Sea. J. Geophys. Res.: Oceans 127 (5), e2021JC017572.
Keywords: primary production, absorption-based model, seasonal variation, South China Sea, remote sensing
Citation: Lv H, Wang G, Xu W, Zhang Y and Jiang L (2023) Seasonal variability of satellite-derived primary production in the South China Sea from an absorption-based model. Front. Mar. Sci. 10:1087604. doi: 10.3389/fmars.2023.1087604
Received: 02 November 2022; Accepted: 16 January 2023;
Published: 06 February 2023.
Edited by:
Astrid Bracher, Alfred Wegener Institute Helmholtz Centre for Polar and Marine Research (AWI), GermanyReviewed by:
Martin Hieronymi, Institute of Carbon Cycles, Helmholtz-Zentrum Hereon, GermanyCopyright © 2023 Lv, Wang, Xu, Zhang and Jiang. This is an open-access article distributed under the terms of the Creative Commons Attribution License (CC BY). The use, distribution or reproduction in other forums is permitted, provided the original author(s) and the copyright owner(s) are credited and that the original publication in this journal is cited, in accordance with accepted academic practice. No use, distribution or reproduction is permitted which does not comply with these terms.
*Correspondence: Guifen Wang, Z3VpZmVud2FuZ0BoaHUuZWR1LmNu
Disclaimer: All claims expressed in this article are solely those of the authors and do not necessarily represent those of their affiliated organizations, or those of the publisher, the editors and the reviewers. Any product that may be evaluated in this article or claim that may be made by its manufacturer is not guaranteed or endorsed by the publisher.
Research integrity at Frontiers
Learn more about the work of our research integrity team to safeguard the quality of each article we publish.