
95% of researchers rate our articles as excellent or good
Learn more about the work of our research integrity team to safeguard the quality of each article we publish.
Find out more
ORIGINAL RESEARCH article
Front. Mar. Sci. , 26 January 2023
Sec. Coastal Ocean Processes
Volume 10 - 2023 | https://doi.org/10.3389/fmars.2023.1081688
This article is part of the Research Topic Eutrophication, Algal Bloom, Hypoxia and Ocean Acidification in Large River Estuaries, Volume II View all 8 articles
 Yanyi Miao1,2
 Bin Wang2,3*
 Dewang Li2,3,4
 Xiangyu Sun2,5Zhongsheng Xu2Qianwen Sun2,5
 Zhibing Jiang2
 Xiao Ma4,6
 Haiyan Jin1,2,5,7
 Jianfang Chen2,6*
Wind mixing is important in regulating dissolved oxygen (DO) variability; however, the transect response of DO dynamics to wind disturbance has seldom been documented with field data. In the summer of 2017, repeat transect observations off the Changjiang Estuary were conducted throughout a fresh wind (the maximum wind speed was 9.8 m s–1) event to reveal the role of physical mixing and biological activity in DO variations. After the wind event, hypoxia was alleviated presenting as the hypoxia thickness decreased from 30 m to 20 m. However, poorly ventilated near-bottom hypoxia was aggravated with a further decrease in DO. Generally, the saturation of dissolved oxygen (DOs) in depth-integrated water column increased by 9%–49% through physical diffusion with a weakened stratification and enhanced phytoplankton bloom. However, in this case, the wind-induced physical water mass mixing by transporting DO downward had a limited contribution to the water-column DO budget, while upwards nutrients induced by mixing fueled the larger vertical area of algae bloom and subsequent substantial oxygen consumption. As the wind speed increased, the air-sea exchange would be important in supplying DO, especially in nearshore areas, which could effectively offset the DO deficiency. In summary, frequently occurring fresh wind-mixing events off the Changjiang Estuary would alleviate hypoxia in the water column but probably exacerbate hypoxia at the bottom, as determined by competing ventilation and respiration roles. Such complex interactions likely occur and perform differently as wind stress varies. Thus, high-spatial and long-term process observations are required to better understand the net effects of bottom hypoxia evolution.
Coastal hypoxia (dissolved oxygen <62.5 μmol L–1 or 2 mg L–1), driven by anthropogenic eutrophication, has been commonly increasing worldwide (Diaz and Rosenberg, 1995; Rabalais et al., 2002; Hagy et al., 2004; Gilbert et al., 2005; Dai et al., 2006; Rabalais et al., 2010; Carstensen et al., 2014). The dissolved oxygen (DO) concentration is determined by the initial concentration and accumulated effects of oxygen sources and sinks, and hypoxia is generated as the oxygen sinks are greater than the oxygen sources under limited physical supply (Fennel and Testa, 2019). Coastal hypoxia is generally seasonal and occurs under strong stratification owing to freshwater discharge and summer warming (Rabouille et al., 2008; Fennel and Testa, 2019). However, stratification can be easily modulated by wind events such as storms, typhoons, monsoons, and cold air (Testa et al., 2017; Lu et al., 2018b; Laurent and Fennel, 2019; Zhao et al., 2021). The strength and the duration of wind mainly determine the strength of stratification and thus the extent of hypoxia, whereas the wind direction also influences the geographic distribution of hypoxia (Fennel and Testa, 2019). In river-dominant coastal oceans, local winds that interact with river discharge have a significant effect on plume dispersion (Wang and Justic, 2009; Lu et al., 2018b; Laurent and Fennel, 2019; Zhang et al., 2020)—for example, upwelling-favorable wind facilitates hypoxia in the northern Gulf of Mexico by changing the distribution of fresh, high-chlorophyll plumes (Feng et al., 2014; Yu et al., 2015). In a semi-enclosed bay, the wind direction plays an important role in modulating the hypoxia duration nearly year-round (Scully, 2016). In Chesapeake Bay, the advective process forced by alongshore wind supplies oxygen to subpycnocline waters rather than direct vertical mixing as the stratification maintained nearly year-round (Scully, 2010; Scully, 2016). Overall, the formation–vanish–recovery process of hypoxia is the result of the interaction between ventilation (physical mixing) and biological processes (photosynthesis and respiration) (Zhang and Li, 2010; Meier et al., 2018; Fennel and Testa, 2019; Pitcher et al., 2021). Therefore, the quantitative identification of these two processes throughout the entire episodic event is critically important for predicting hypoxia evolution (Mattern et al., 2013; Testa et al., 2017).
The seasonal bottom hypoxia off the Changjiang Estuary is considered one of the world’s largest coastal hypoxia scenarios (Li et al., 2002; Chen et al., 2007; Diaz and Rosenberg, 2008; Ning et al., 2011). Over the last several decades, comprehensive studies on the formation mechanism, long-term changes, and ecosystem responses have been reported (Zhu et al., 2011; Ni et al., 2016; Wang et al., 2017; Zhu et al., 2017). Stratification of the water column and oxygen consumption through organic decomposition are two major factors responsible for the hypoxia formation in this area (Li et al., 2002; Chen et al., 2007; Ning et al., 2011). Strong stratification caused by significant temperature and salinity differences between fresh Changjiang diluted water (CDW) and salty Taiwan Warm Current prevents vertical DO exchange from the atmosphere and surface waters (Li et al., 2002; Chen et al., 2007; Ning et al., 2011). Several recent studies have focused on the role of wind in hypoxia evolution, mainly by mooring systems and model simulations (Ni et al., 2016; Zhang et al., 2018b; Meng et al., 2022). Combining in situ observations and high-resolution ecosystem models, Zhang et al, (2018)a revealed that the magnitude and direction of wind would strongly regulate the distribution of the Changjiang River plume, which controls the evolution of vertical stratification and bottom hypoxia. Low-oxygen condition near the bottom recovers within 1 to 2 weeks as the stratification reestablished after the wind mixing events (Ni et al., 2016; Wang et al., 2017; Zhang et al., 2018b), while organic matter remineralization continued consuming dissolved oxygen. However, in situ transect observation of the water column throughout the episodic wind event is rarely reported, which inhibits understanding the contribution of physical and biological processes in the alleviation and reconstruction of hypoxia under wind influence.
In this study, we showed vertical DO distribution based on repeated transect observations off the Changjiang Estuary in the summer of 2017. To identify the controlling processes, a three-end-member mixing model (Han et al., 2012) was used to semi-quantify the contributions of physical mixing, biological processes, and air–sea exchange. The strength and the direction of the wind significantly vary across a variety of timescales throughout the year. In this case, we present the effects of a fresh wind event (5 days) on DO dynamics, which frequently occurred off the Changjiang Estuary but could be significant in regulating the bottom hypoxia evolution.
As a river-dominated estuary, the hydrological conditions of the Changjiang Estuary in summer are primarily controlled by northeastward Changjiang diluted waters and Taiwan Warm Current (Su, 1998; Chen, 2009). Changjiang, the third largest river in the world, carries a runoff of 9 × 10¹¹ m3 year–1 and a large load of terrestrial nutrients and organic matter (Zhang et al., 2007). The giant freshwater forms a vast diluted water plume off the Changjiang Estuary. Taiwan Warm Current, derived from Kuroshio, flows northward under the prevailing southerly winds and reaches Changjiang Estuary in summer (Su, 1998; Chen, 2009). The thermocline and halocline are formed there with the upper high-temperature/low-salinity water. With the main nutrient input from these two waters, the primary productivity is high (1.15 ± 1.19 g C m–2 day–1) in the summer, especially within the Changjiang plume (Liu et al., 2019).
Typical locations for summer bottom hypoxia off the Changjiang Estuary occur mainly under the Changjiang River plume (Wang et al., 2017; Zhang et al., 2018a). Section J (122–124° E, 32° N) crosses the core of the northern hypoxic area (Figure 1A). Our cruise was conducted off the Changjiang Estuary onboard the R/V Runjiang I from August 22 to September 6, 2017, and the maximum river discharge typically occurred in July (Figure 1B). There was a fresh wind event with a maximum wind speed of 9.8 m s–1 near section J (Figure 1C) (http://apdrc.soest.hawaii.edu). For the purpose of diagnosing the wind effect on DO vertical distribution, repeated observations and sampling of section J were carried out on August 28 and September 2. At each station, vertical profiles of temperature and salinity were obtained using SBE 917 plus CTD. Water samples were collected from 5-L Niskin bottles at 2, 5, 10, 20, and 30 m and at the bottom layer (2 to 3 m above the seabed) where the water depth was >30 m and fewer layers where the water depth was<30 m.
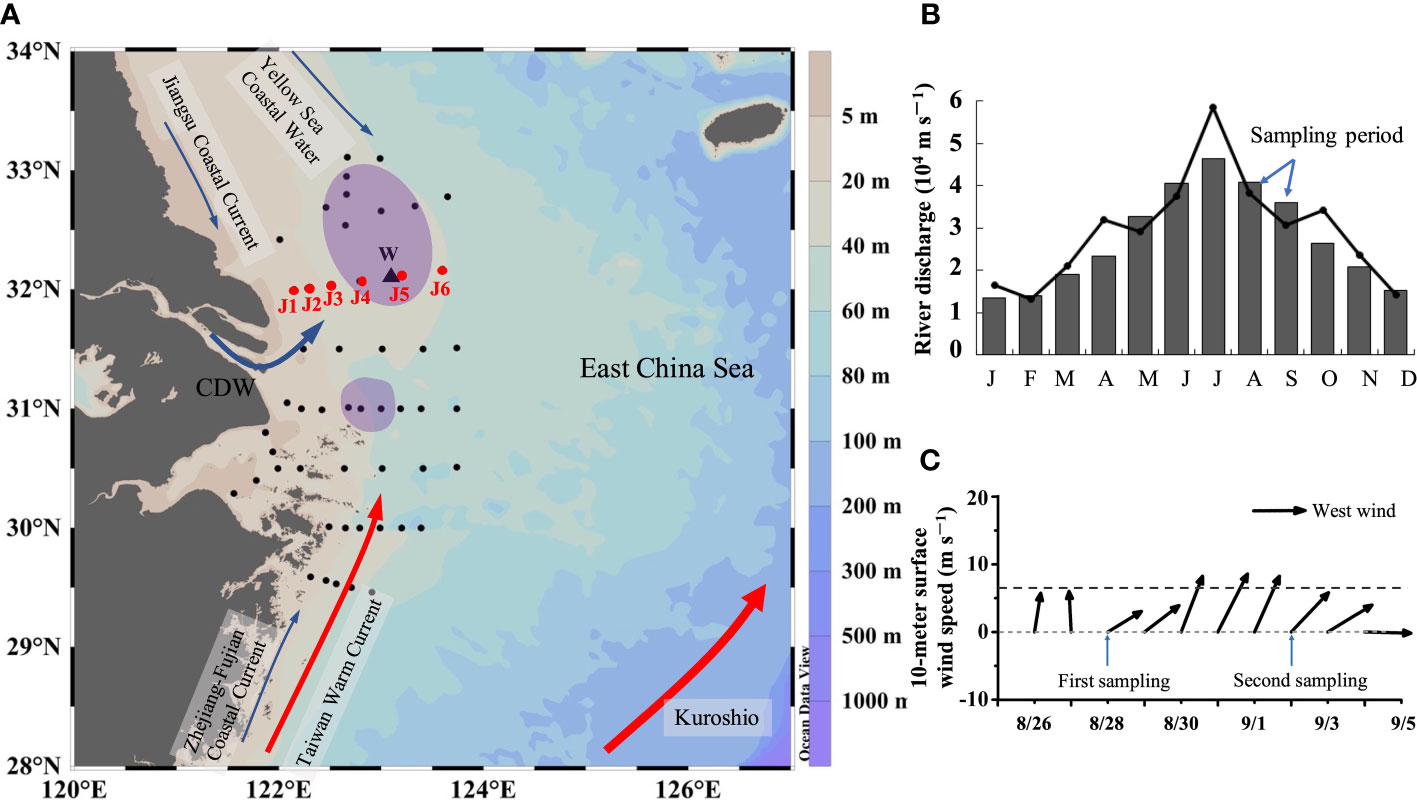
Figure 1 (A) Sampling stations and the bottom hypoxic zones (purple polygons) during the cruises. The red dots (JI~J6) are repeated sampling stations. The black triangle (W) is the wind observation site from WindSat. (B) Changjiang River discharge at the Datong hydrological station (data from: http://www.cjw.gov.cn/zwzc/bmgb/). The gray bars show the average monthly river discharge for 2000–2017. The broken line represents the average monthly net flow in 2017. (C) 10-m surface wind speed at W from August 26 to September 5 of 2017. The dashed gray line represents the average wind speed (6.7 m/s–1) in August and September.
The DO samples were fixed and titrated following the classic Winkler procedure (Oudot et al., 1988), which has a precision of ±1 μmol–1. The pH was determined using an Orion versa Star Pro pH analyzer fitted with an Orion 8102BN Ross combination pH electrode. The pH system was calibrated against three NIST-traceable pH buffers (pH 4.01, 7.00, and 10.01 at 25°C, Thermo Scientific). The precision of the pH measurements was 0.01.
For dissolved inorganic carbon (DIC) and total alkalinity (TA) measurements, samples were collected into 125-ml borosilicate glass bottles and poisoned using 0.1 ml saturated HgCl2 solution. To ensure data quality, the samples were sealed with a ground-glass stopper and vacuum grease and then fixed with a rubber band and a hose clamp (Huang et al., 2012). DIC and TA were analyzed following the procedure described by Cai (2011), with a precision of ±2 μmol kg–1. Both measurements were calibrated using certified reference materials from A.G. Dickson’s laboratory at the Scripps Institution of Oceanography (Dickson et al., 2007).
Nutrient samples were filtered through 0.45-μm cellulose acetate filters and divided into two subsamples. One subsample for ammonium (NH4 +) concentration was analyzed onboard by the indophenol blue spectrophotometric method (Grasshoff et al., 1999), while the other subsample was stored frozen for later laboratory analysis. The concentration of nitrate (NO3–), nitrite (NO2–), and silicate [Si(OH)4] was analyzed by using Skalar San++ Automated Analyzer (Grasshoff et al., 1999), with detection limits of 0.1 μmol L–1, respectively. The precision of these methods is approximately 5%.
The profile of chlorophyll α (chl α) concentrations in situ was obtained by a submersible fluorescence probe along with CTD. The surface chl α (2 m) was measured using a Turner Design Fluorometer after extraction of the GF/F sample filter in 90% acetone for 24 h in cold darkness.
The combination of the regional potential temperature and salinity (θ–S) curve and three-end-member mixing model was used to analyze the influence of initial water masses as well as to distinguish the effect of physical mixing and biological processes on vertical DO distributions. The three water masses are distinguishable in the θ–S curve shown in Figure 2: Changjiang diluted water, shelf surface water (SSW), and shelf bottom water (SBW). Characterized by the lowest salinity, the diffusion range of the CDW was determined by the maximum salinity horizontal gradient line at the outer edge of the low-salinity tongue (Mao et al., 1963). For all stations within the line, the average potential temperature and salinity at the surface (<5 m) were calculated as the end-member characteristics of the CDW. The SSW is mainly the upper Taiwan Warm Current, which has the maximum temperature. As dominated by the Kuroshio subsurface water and lower Taiwan Warm Current at the bottom water on the shelf, the SBW has the maximum salinity. The characteristics of the three water masses are listed in Table 1.
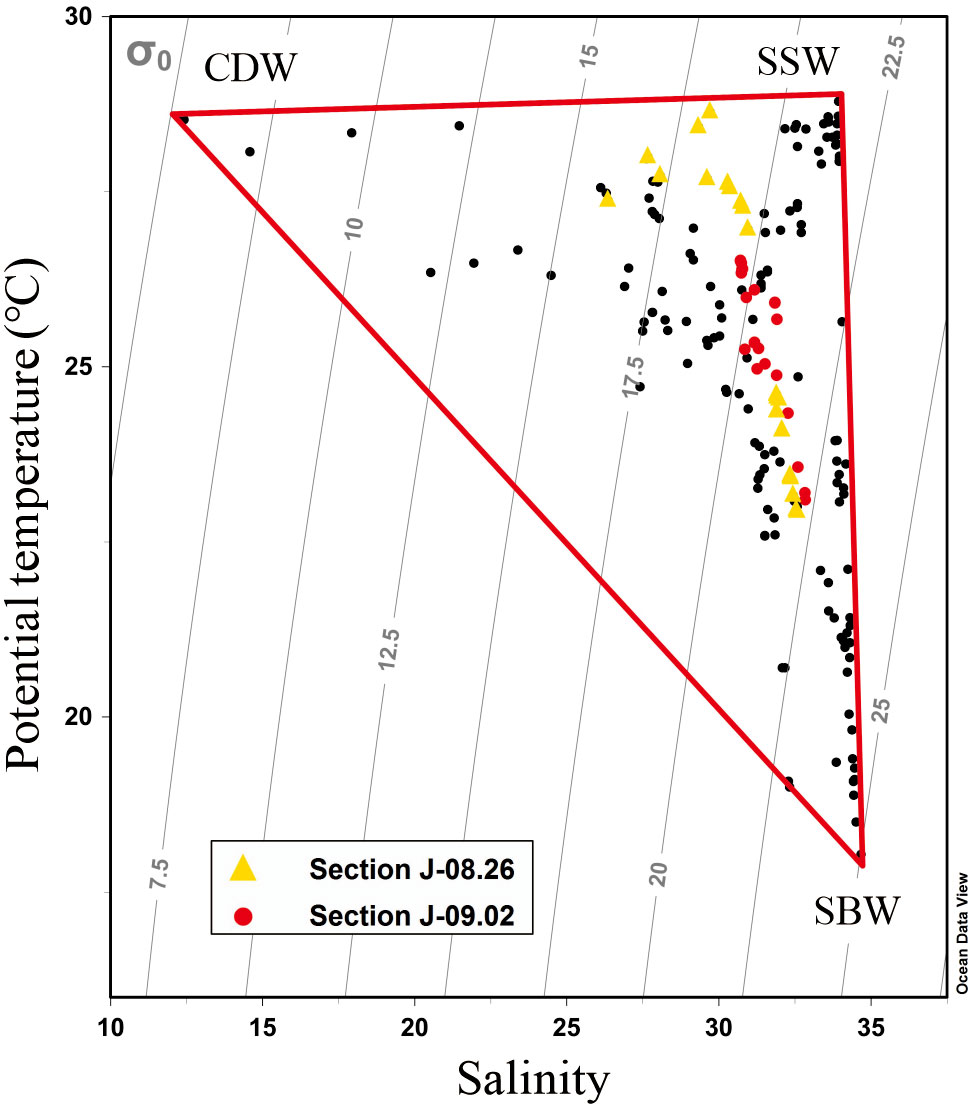
Figure 2 Scatter plot of potential temperature (θ) vs. salinity (S) of all samples during the cruises. The yellow triangles are the samples on August 26, and the red dots are the samples on September 2. The labeled vertices represent the three end-member water masses: Changjiang diluted water, shelf surface water, and shelf bottom water.
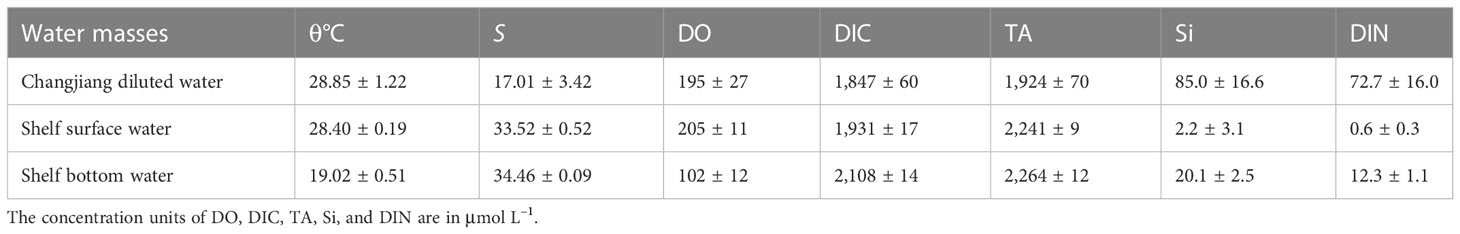
Table 1 End-member characteristics of three water masses based on measurements obtained during the cruise.
Based on two conservation parameters of potential temperature and salinity, the three-end-member mixing model was constructed to calculate the fractions of initial water masses (Cao et al., 2011; Han et al., 2012; Wang et al., 2014; Wang et al., 2017). By combining DO, DIC, TA, and nutrients, we can semi-quantitatively estimate the composition and source of materials controlled by physical water mixing as well as the modulation effect of biological metabolism. The calculation process was described by Cao et al. (2011) and Wang et al. (2017), while the uncertainty assessments were based on Han et al. (2012). The equations are as follows:
θ represents the potential temperature, S represents the salinity, and fCDW, fSSW, and fSBW represent the fraction of the CDW, SSW, SBW respectively. The conservative DO value (DOmix) caused by physical water mixing can be calculated according to f. DObio, the difference between the measured DO (DOm) and DOmix, represents the biological processes of DO. Moreover, the differences in DOm (△DOm), DOmix (△DOmix), and DObio (△DObio) express the effects of wind events on water mixing and biological processes. The calculations for DIC and nutrients were structurally identical to those of the DO formulas. The uncertainty assessment follows Han et al. (2012), and the transect-average derivation along Section J is 1.96 for ϵΔDO 2, 0.82 for ϵΔDIN, and 0.70 for ϵΔSi before the wind and 1.72, 0.65, and 0.51 after the wind, respectively.
As shown in Figure 3, the vertical DO distribution and bottom hypoxia reflected spatial variations along transect J during a fresh wind event. On August 28 (before the wind event), the surface DO at stations J1–J5 had a value of 209–287 μmol L–1 (Figure 3A), and the saturation of dissolved oxygen (DOs) was oversaturated at 101%–135% (Figure 3B). The highest DO was 287 μmol L–1 at the surface of station J4. The DO sharply decreased below the surface water. Hypoxia occurred below approximately 8 m around J4–J5, with low DOs (<26%), and the vertical area was approximately 159 km2. The DO minimum was 54 μmol L–1 at station J5. On September 2 (after the wind event), the mixed layer got deeper (Figure 3C). The DO was 178–232 μmol L–1, and the DOs at most stations was undersaturated at approximately 6%–110%. Bottom hypoxia still existed as the hypoxic depth extended to approximately 15 m in J4 and reduced to below 30 m in J5. The DO minimum continued to decrease to 41 μmol L–1 and migrated to station J4. However, the observed vertical hypoxic area decreased to 82 km2.
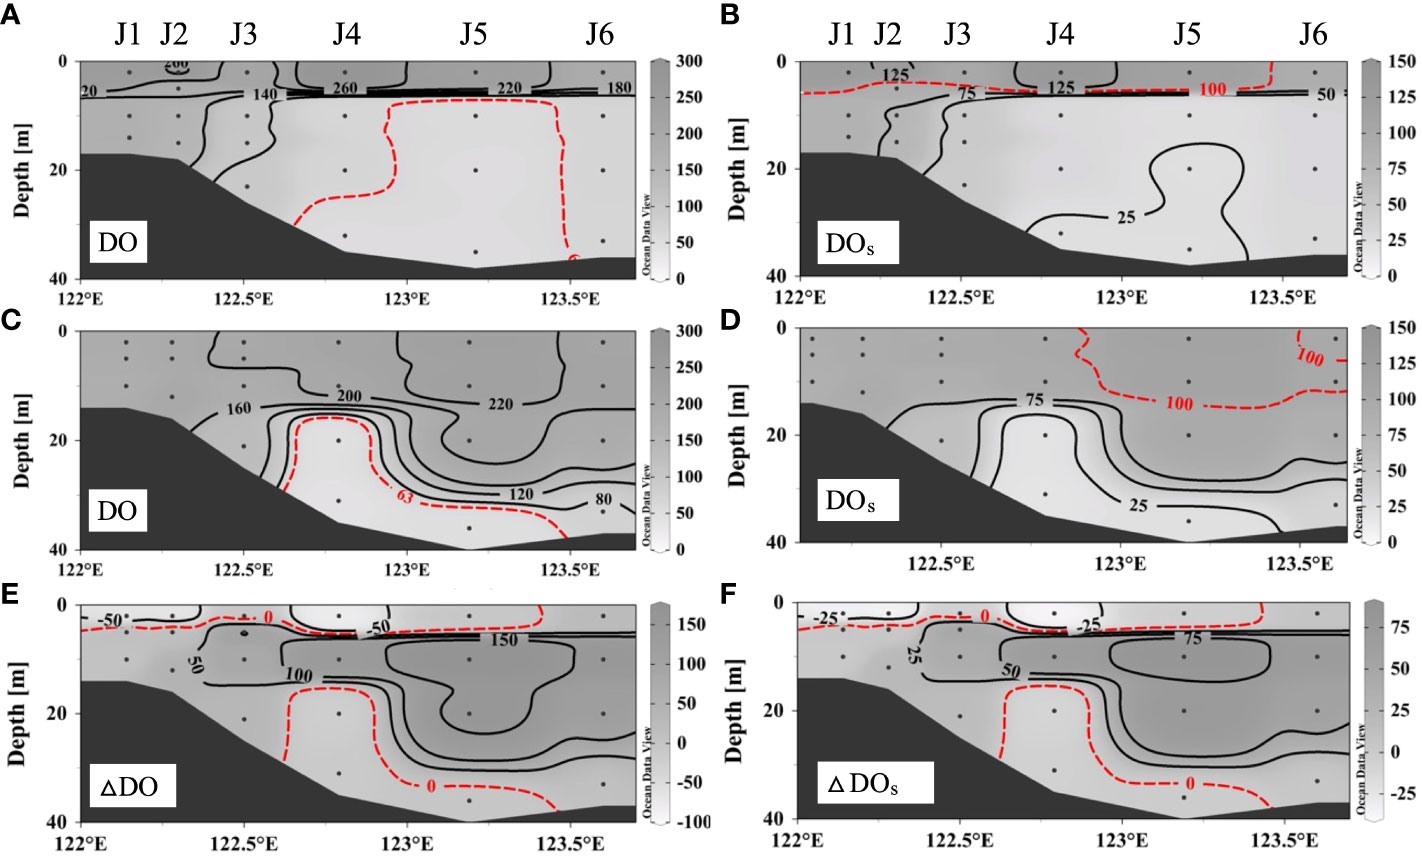
Figure 3 Dissolved oxygen distributions and saturation of dissolved oxygen along section J before wind (A, B) and after wind (C, D) and the differences between repeated observations (E, F).
After the wind event, the thickness of the mixed layer increased significantly (from approximately 8 m to more than 15 m). However, the high DO signal at the surface disappeared, and the average DO in the upper mixed layer slightly decreased from 207 ± 47 to 198 ± 22 μmol L–1. As for the hypoxic area, water column hypoxia was alleviated, while the degree of near-bottom hypoxia intensified. The vertical coverage area of hypoxia substantially decreased by 49% (from 159 to 82 km2). The DO of bottom hypoxia decreased by 6–27 μmol L–1, and the hypoxia layer depth increased at station J4. Thus, this fresh wind event, which weakened the stratification and took high-oxygen surface waters downward, released water column hypoxia in the subsurface water. However, for the poorly ventilated bottom water, hypoxia continued to develop and exacerbated.
A strong density gradient induces stratification, which reduces the intensity of vertical mixing within water columns. As shown in Figures 4A, B, before the wind event, there was an obvious thermocline and halocline at 5–10 m, with warmer and fresher water in the upper layer (T > 27°C, S< 31) and colder, saltier water in the lower layer (T< 25°C, S > 32). Stratification still existed after the wind event (Figures 4C, D), but its depth increased to 18–28 m. The salinity increased and the temperature decreased at the surface. The difference in temperature between surface and bottom waters was significantly reduced from 3.01 ± 1.30°C to 1.10 ± 1.05°C. The salinity difference decreased from 3.23 ± 1.77 to 0.70 ± 0.61. The surface spread of the CDW vanished as water above the post-stratification was well mixed.
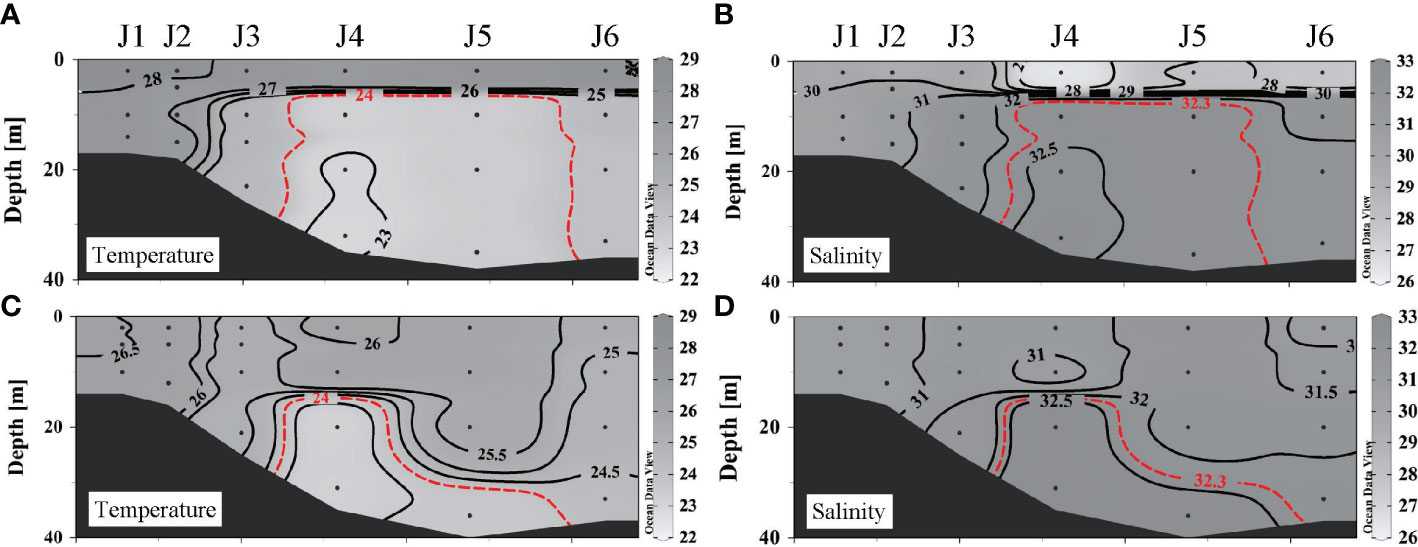
Figure 4 Distributions of temperature and salinity along section J before and after wind: (A) temperature before wind, (B) salinity before wind, (C) temperature after wind, and (D) salinity after wind.
DO varies in different water masses (Table 1), as it was 102 ± 12 μmol L–1 in SBW, much lower than that in CDW (195 ± 27 µmol L–1) and SSW (205 ± 11 μmol L–1). The wind changes the fractions (fi) of the water masses at a certain position, thereby changing its initial DO. The fraction of each water mass calculated by Equations (1)–(3) reveals that wind induced the oxygen-rich SSW down to the deep layer and oxygen-deficient SBW up to the surface layer (shown in Figures 5A–C). At nearshore, there is a significant reduction in DO supplied by physical mixing (Figure 5D) as there was an increase in SBW and a decrease in CDW and SSW. The same occurs in the offshore surface waters. However, for the waters below the pre-wind stratification offshore, the replacement of SBW by SSW contributed to an increase in DOmix.
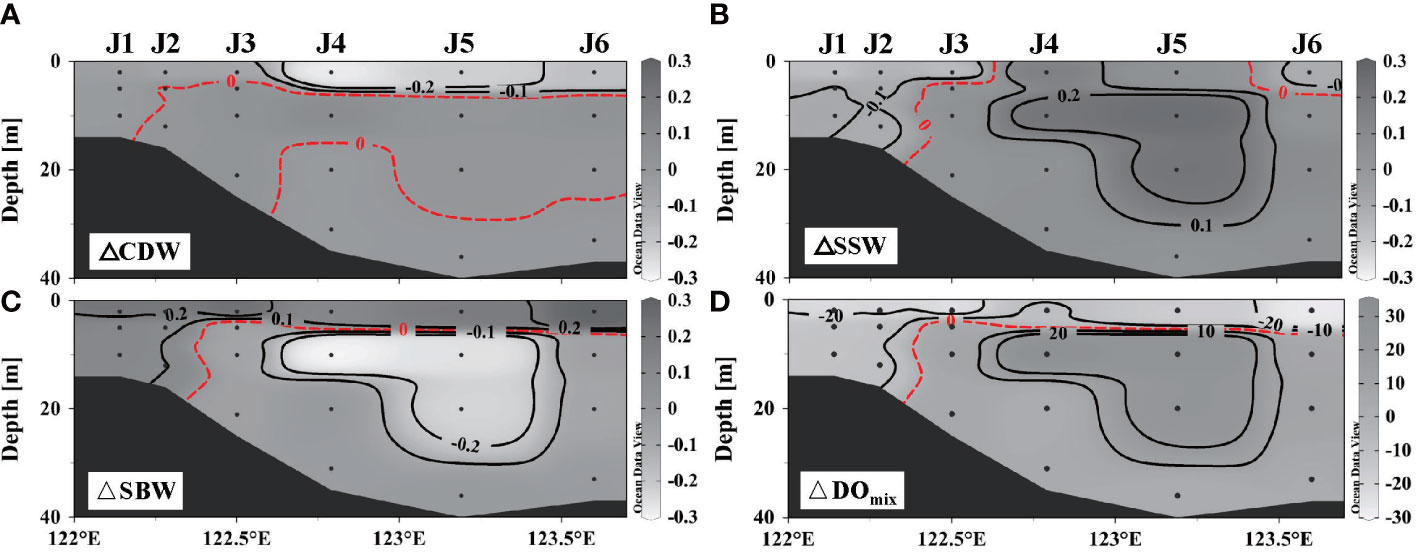
Figure 5 Differences of fractions in three end-member water masses and dissolved oxygen (DO) supplemented by physical mixing along section J: (A) Changjiang diluted water, (B) shelf surface water, (C) shelf bottom water, and (D) DO.
The general spatial and temporal distribution of DO off Chanjiang Estuary is determined by the interaction of Changjiang Estuary and Taiwan Warm Current. The DO of the subsurface layer, which is basically controlled by the Taiwan Warm Current, is lower than that of the surface layer. In addition, the summer strong stratification hinders oxygen exchange and inhibits oxygen replenishment, which is a physical prerequisite for the development of hypoxia. On the seasonal scale, typhoons in summer and strong mixing in autumn affect the existence and strength of the thermocline, thus controlling the area and duration of the summer bottom hypoxia off Changjiang Estuary (Li et al., 2011; Wang et al., 2017; Chen et al., 2020). On the interannual scale, a variation of DO in end-member water, such as the DO reduction of Kuroshio current, may make the bottom layer more prone to hypoxia (Lui et al., 2014; Wei et al., 2015; Wang et al., 2021).
The vertical distribution of properties related to biological processes revealed that photosynthesis predominated over respiration overall after wind as biological DO increased, coinciding with decreased biological DIC, DIN, and Si(OH)4 (Figure 6). The contrary occurred in the nearshore surface water (<5 m) and bottom hypoxic areas, which agreed with the decrease in chl α at station J4 (Figure 7A). However, DO released by photosynthesis (△DObio > 0) exceeded the amount consumed by respiration (△DObio< 0) by both the area and the concentration. The increase in chl α (Figure 7B) at station J5 also suggested the expanded and enhanced algal bloom. Thus, the accumulated DO within 5 days likely compensates for the serious pre-wind DO loss caused by the degradation of organic matter and would greatly alleviate hypoxia. For intensified bottom hypoxia, three-end-member models demonstrated that the increase in SSW supplied 2 to 3 μmol L–1 DO, and biological respiration consumed 6–26 μmol L–1, exceeding the physical oxygen supplement.
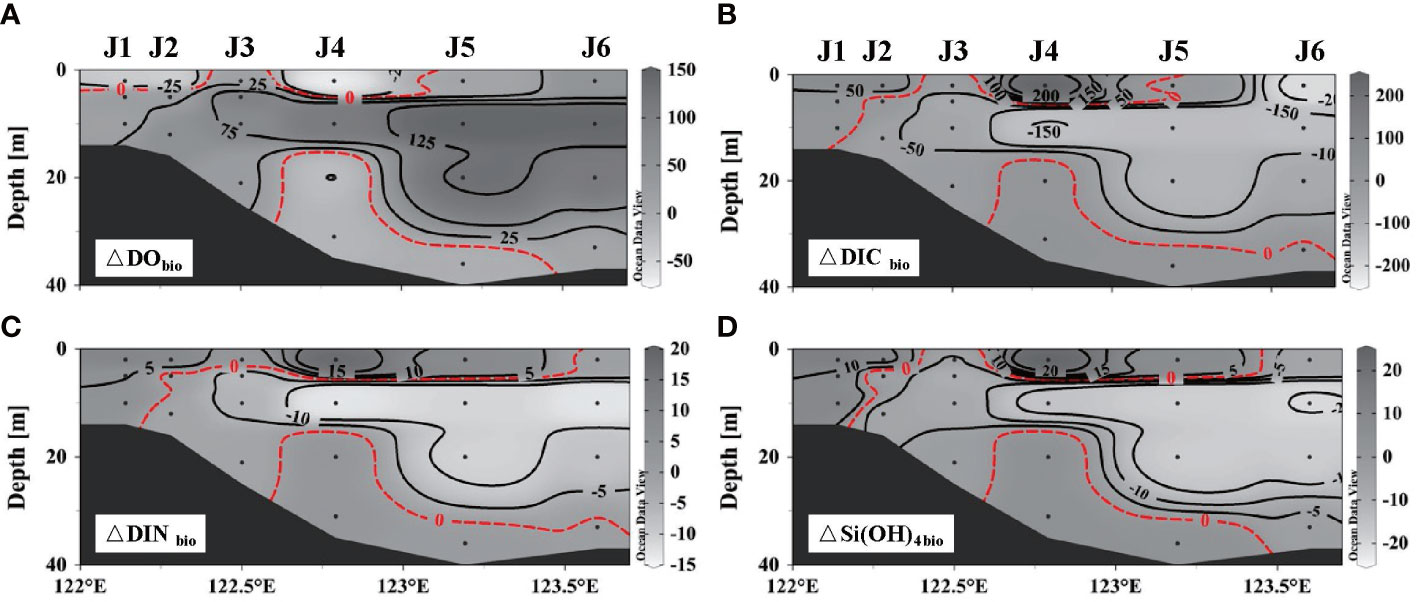
Figure 6 Distribution of parameters related to the biological process along section J: (A) dissolved oxygen, (B) dissolved organic carbon, (C) dissolved inorganic nitrogen, and (D) Si(OH)4.
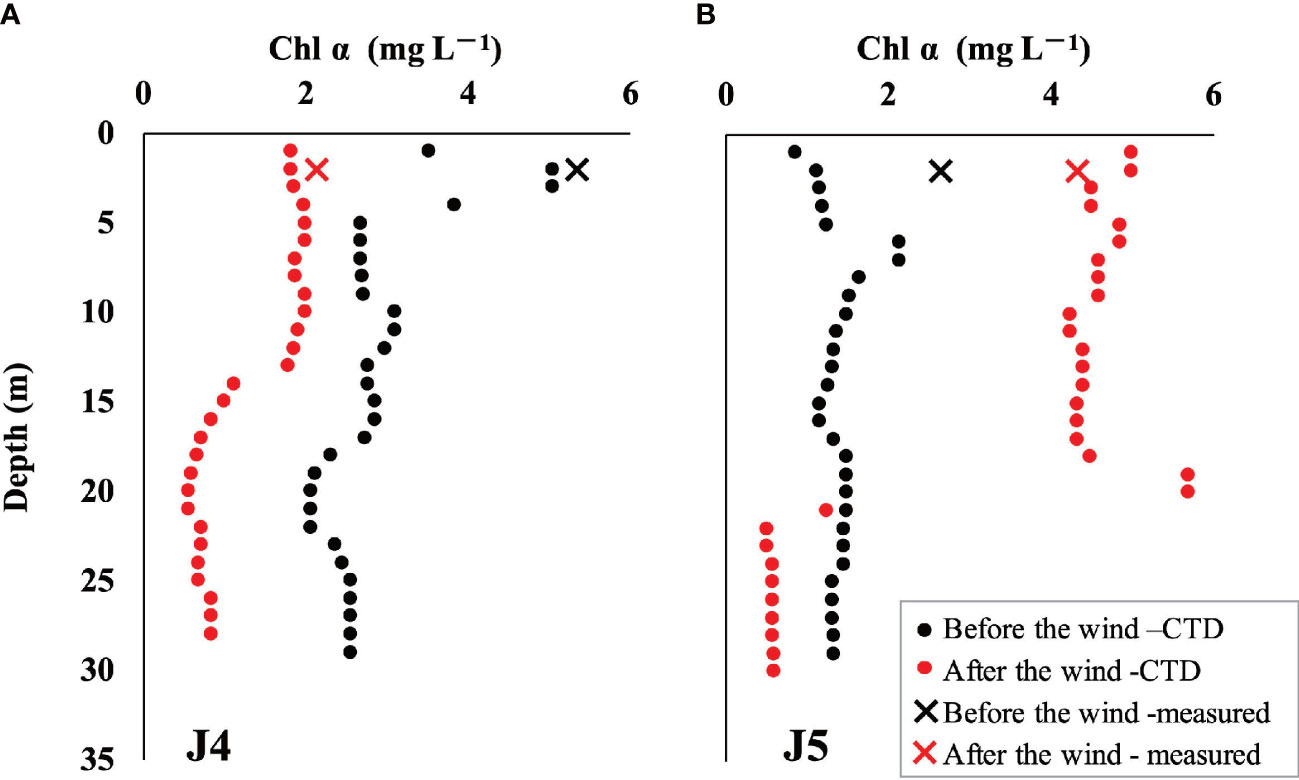
Figure 7 Distribution of chl α before and after the wind event: (A) chl α in station J4 and (B) chl α in station J5. The circles represent profile chl α obtained by a submersible fluorescence probe along with CTD, and the crosses represent surface chl α measured by Turner Design Fluorometer. The black icons represent chl α before wind, while the red icons represent that after wind.
The obvious biological DO increase mainly occurs at the offshore subsurface layer rather than at the surface layer and nearshore. Substantive quantities of nutrients are injected upwards by strong wind-induced mixing, which supports algal blooms (Wang et al., 2016; Li et al., 2022). The algae blooms triggered by the upwelling of nutrient-rich bottom water attributable to typhoons in the Changjiang Estuary have been reported with cruises (Hung et al., 2010), buoy (Li et al., 2019), and underway observations (Yu et al., 2022). However, the DO released by biological processes decreased at the nearshore surface after wind, as shown in Figure 6A. This is possibly due to the strong respiration supported by upward organic matters (Lu et al., 2018a). Li et al. (2013) also reported that the chl α declined sharply after the passage of a typhoon in the southern East China Sea. Surface algal blooms may not recover to the pre-wind level owing to water cooling or increased turbidity. Whether the biological DO increases or decreases depends on the balance between photosynthesis supported by nutrients and respiration supported by organic matter.
In this study, the air–sea DO flux was estimated as the depth-integrated DO minus the gross results of physical water mixing and biological processes. The oxygen saturation at the surface after the wind was 97 ± 7% and did not completely reach supersaturation. This means that there would be oxygen supplementation from the air to the sea. Stable stratification would hinder the air–sea exchange and exchange of the mixed surface–subsurface layer, thereby impeding oxygen supplementation. The fresh wind breaks the stratification and facilitates the movement upwards of low-oxygen bottom water (Figure 4C), which enlarges the difference between sea surface O2 and saturation oxygen concentration, thereby strengthening the DO flux from air to sea (Stigebrandt, 1991). Furthermore, the elevated wind speed further enhanced this effect by promoting change velocity (Wanninkhof, 1992). Air–sea oxygen exchange is the dominating factor for DO variations under higher wind speeds and more wavy oceans, and it takes 1 to 2 days to equilibrate for mixed layers (McNeil et al., 2006; Wesslander et al., 2011).
Excluding J1 (DO and DOs decreased by 0.03 mol m–2 and 3%, respectively), the water column DO concentration increased (by 0.22–3.51 mol m–2) overall after wind and DOs correspondingly increased by 9%–49% (Figure 8A). The depth-integrated results were used to evaluate the contributions of physical water mixing, biological processes, and air–sea exchange to the DO variations in the study area.
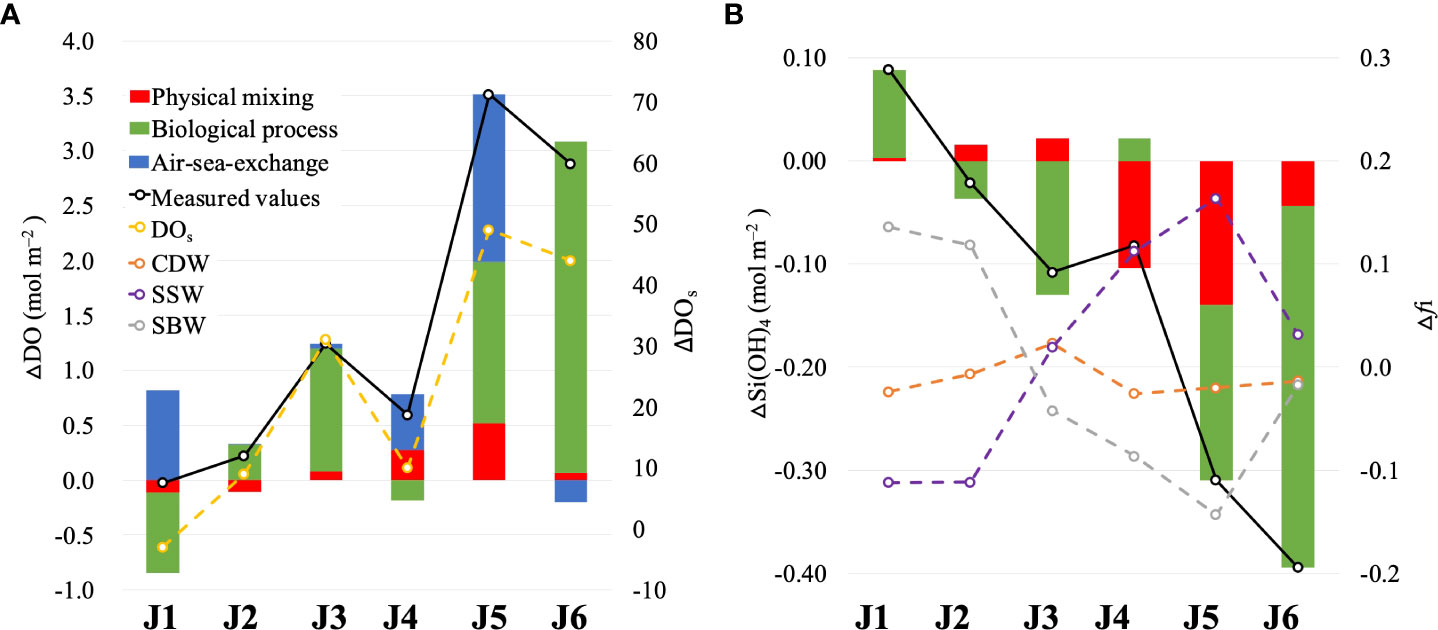
Figure 8 Depth-integrated concentration differences of (A) dissolved oxygen and saturation of dissolved oxygen and (B) Si(OH)4 and fi (the fractions of three water masses) along section J (after wind minus before wind). The lines represent the differences in measurements.
For the entire water column, the changes in depth-integrated ΔDOmix were relatively small and consistent with the depth-integrated Δfi (Figure 8A). At nearshore (as J1 and J2), DO supplied by physical mixing decreases by 0.11 mol m–2, owing to the declining CDW and SSW fraction and the increasing of SBW fraction. Offshore (from J3 to J6), the depth-integrated ΔDOmix of each station increased to varying degrees (0.06–0.52 mol m–2), as the oxygen supplement by the increase in SSW (below 5 m) completely offsets the oxygen loss by the increase of SBW (at the surface). However, the contribution of physical mixing to the water column DO budget was limited after wind. The loss of DO due to physical mixing is offset by other processes at nearshore, and the DO supplemented by mixing cannot fully account for the increase in DO offshore, whereas the depth-integrated ΔDOmix is 2%–46% of the depth-integrated ΔDOm.
The differences between the DOm and DOmix of the surface waters included the effects of biological processes and air–sea exchange. △Si(OH)4 bio was substituted into the Redfield ratio to analyze the real DO released by phytoplankton photosynthesis and predict potential hypoxia under the influence of strong winds. The depth-integrated △Si(OH)4 caused by biological processes increased at J1 and J4 and decreased at the other stations (Figure 8B). This revealed that respiration exceeded photosynthesis, contributing to △DObio consumption at J1 and J4, and the inverse occurred at the other stations (Figure 8A). In the entire section, △Si(OH)4 bio was negative, indicating net photosynthesis after the wind. The biological uptake of silicate increased by 0.03 × 10⁶ mol m-1, resulting in 0.24 × 10⁶ mol m–1 of oxygen released by the algae bloom.
The calculated air–sea DO fluxes (as the measured value minus the water mixing value and the biological value) were positive at most stations and replenished oxygen to the ocean. Especially at J1, the DO supplemented by air–sea exchange almost completely offset the DO loss caused by the invasion of bottom water and net respiration effects.
In conclusion, the depth-integrated DO of the water column overall increased, and the vertical coverage area of hypoxia decreased (Figure 9). However, the degree of hypoxia intensified as biological consumption prevailed in the physical mixing supplements. In this study, by bringing down the oxygen-rich water to the bottom and bringing up the oxygen-deficient water to the surface, wind-induced physical water mixing relieved the bottom hypoxia but had a limited effect on the depth-integrated DO. However, upwards deep water driven by physical mixing actuates significant changes in biological processes and air–sea exchange. The former is that the supplement of nutrients to the upper layer facilitates the extended vertical area of algae bloom, thus releasing substantial DO. The latter is because the upwards deep oxygen-deficient water accelerates the speed of air–sea oxygen exchange by exacerbating the DO difference between air and sea, which compensates for DO loss. In addition, the tide could cause limited contribution in bottom hypoxia off Changjiang Estuary due to the interaction effects of DO supplement by physical mixing and DO depletion by biological respiration (Zhu et al., 2017).
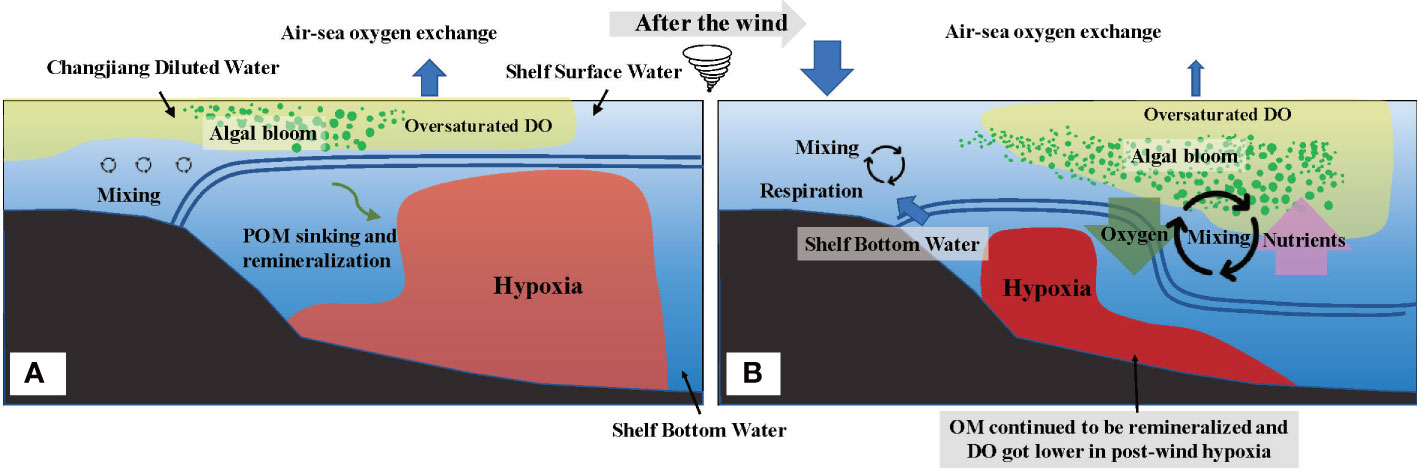
Figure 9 Conceptual model for the variations of the vertical distribution of dissolved oxygen (DO) under the wind event. Before the wind event (A) the stratification strictly prevented the replenishment of DO. Algal blooms and DO are oversaturated above the stratification, while hypoxia occurs below the stratification as sinking particle organic matter remineralizing and consuming substantial DO. After the wind event (B) the vertical area of hypoxia decreased as downwards oxygen-rich surface water and enhanced algal bloom in the thickened mixed layer. However, bottom hypoxia intensified as further biological DO consumption negatively impacted the ventilation. Moreover, the flux of air–sea oxygen exchange increased with higher wind speed, especially at nearshore where the influx of DO from air offset the DO deficiency.
Furthermore, potential hypoxia induced by post-wind blooms cannot be disregarded. If the newly formed in situ organic matter was fully decomposed, 0.24 × 10⁶ mol m–1 DO would be potentially consumed (equal amount of DO released by algae blooms). According to the pre-wind hypoxia area in section J, the remaining total amount of DO is 0.21 × 10⁶ mol m–1 after the winds, which is 85% of the potential oxygen consumption. Specifically, the extent and the degree of potential hypoxia would be more severe than it was before the wind.
In this study, repeated transect observations revealed differences in vertical DO distribution before and after a wind event. The effect of wind on water column DO variation through physical mixing, biological processes, and air–sea exchange was also analyzed. After wind, the water column hypoxia area decreased significantly owing to the downwards surface oxygen-rich waters. The DO and DOs of the water column increased by 0.22–3.51 mol m–2 and 9%–49%, respectively. However, near-bottom hypoxia intensified as bottom DO continued to decrease by 5–25 μmol L–1. The three-end-member mixing model results showed that biological respiration consumed 6–26 μmol L–1 DO, which offset the physical mixing supplement (2 to 3 μmol L–1). In summary, physical mixing induced by fresh wind ventilation decreased the coverage area of hypoxia by inducing surface oxygen-rich waters to the subsurface, but it had limited effects on the water column DO budget: the DO loss due to the upwards bottom oxygen-deficient waters was offset by other processes near the shore, and physical supplementation only accounted for 2%–46% of the water column DO increase. However, the upwards bottom water was laden with abundant nutrients, which promoted algal blooms and released large amounts of DO. Moreover, air–sea DO exchange was important, especially in nearshore areas, as it is made up of the loss caused by physical mixing and biological respiration.
Frequently occurring fresh wind mixing events off the Changjiang Estuary alleviated hypoxia by decreasing the coverage area but probably exacerbated hypoxia at the bottom as determined by the competing roles of ventilation and respiration. Such complex interactions likely occur and perform differently as wind stress varies. Thus, high-spatial and long-term process observations are required to better understand the net effects of bottom hypoxia evolution.
The original contributions presented in the study are included in the article/supplementary material. Further inquiries can be directed to the corresponding authors.
YM performed the field survey and analyses of data and wrote the draft. BW designed the experiment and the manuscript. DL reviewed and edited the manuscript. XS contributed to the data on nutrients. ZX and QS participated in discussions of the manuscript. ZJ performed the survey. XM provided the temperature and salinity data. HJ and JC designed the research. All authors contributed to the article and approved the submitted version.
This study is jointly supported by the Project of Long-term Observation and Research Plan in the Changjiang Estuary and Adjacent East China Sea (LORCE) (no. SZ2001), the National Program on Global Change and Air–Sea Interaction (Phase II)—Hypoxia and Acidification Monitoring and Warning Project in the Changjiang Estuary (grant no. SZ2001), the National Natural Science Foundation (U1709201, 42276046,41806095, and 41706120), the Key R&D Program of Zhejiang (grant no. 2022C03044), the Science Foundation of Donghai Laboratory (grant no. DH-2022KF0217, DH-2022KF0201, and DH-2022KF0216), and the Project of State Key Laboratory of Satellite Ocean Environment Dynamics (grant no. SOEDZZ2105).
We would like to thank the captain and crew of R/V Runjiang I during the cruise. We also thank Zhongqiang Ji, Tianzhen Zhang, and Huabo Yao for their support during sample collection.
The authors declare that the research was conducted in the absence of any commercial or financial relationships that could be construed as a potential conflict of interest.
All claims expressed in this article are solely those of the authors and do not necessarily represent those of their affiliated organizations, or those of the publisher, the editors and the reviewers. Any product that may be evaluated in this article, or claim that may be made by its manufacturer, is not guaranteed or endorsed by the publisher.
Cai W.-J. (2011). Estuarine and coastal ocean carbon paradox: CO2 sinks or sites of terrestrial carbon incineration? Annu. Rev. Mar. Sci. 3, 123–145. doi: 10.1146/annurev-marine-120709-142723
Cao Z. M., Dai M. H., Zheng N., Wang D. L., Li Q., Zhai W. D., et al. (2011). Dynamics of the carbonate system in a large continental shelf system under the influence of both a river plume and coastal upwelling. J. Geophys. Res. 116, G02010. doi: 10.1029/2010jg001596
Carstensen J., Andersen J. H., Gustafsson B. G., Conley D. J. (2014). Deoxygenation of the baltic sea during the last century. Mar. Pollut. Bull. 111, 5628–5633. doi: 10.1073/pnas.1323156111
Chen C.-T. A. (2009). Chemical and physical fronts in the bohai, yellow and east china seas. J. Mar. Syst. 78, 394–410. doi: 10.1016/j.jmarsys.2008.11.016
Chen C.-C., Gong G.-C., Chou W.-C., Shiah F.-K. (2020). Hypoxia in autumn of the east china sea. Mar. pollut. Bull. 152, 110875. doi: 10.1016/j.marpolbul.2019.110875
Chen C.-C., Gong G.-C., Shiah F.-K. (2007). Hypoxia in the east china sea: One of the largest coastal low-oxygen areas in the world. Mar. Environ. Res. 64, 399–408. doi: 10.1016/j.marenvres.2007.01.007
Dai M. H., Guo X. H., Zhai W. D., Yuan L. Y., Wang B. W., Wang L. F., et al. (2006). Oxygen depletion in the upper reach of the pearl river estuary during a winter drought. Mar. Chem. 102, 159–169. doi: 10.1016/j.marchem.2005.09.020
Diaz R., Rosenberg R. (1995). Marine benthic hypoxia: A review of its ecological effects and the behavioral responses of benthic macrofauna. Oceanogr. Mar. Biol. 33, 245–303.
Diaz R. J., Rosenberg R. (2008). Spreading dead zones and consequences for marine ecosystems. Science. 321, 926–929. doi: 10.1126/science.1156401
Dickson A. G., Sabine C. L., Christian J. R. (2007). Guide to best practices for 964 ocean CO2 measurements (PICES Special Publication 3) (Sidney: North Pacific Marine Science Organization).
Feng Y., Fennel K., Jackson G. A., DiMarco S. F., Hetland R. D. (2014). A model study of the response of hypoxia to upwelling-favorable wind on the northern gulf of mexico shelf. J. Mar. Syst. 131, 63–73. doi: 10.1016/j.jmarsys.2013.11.009
Fennel K., Testa J. M. (2019). Biogeochemical controls on coastal hypoxia. Annu. Rev. Mar. Sci. 11, 105–130. doi: 10.1146/annurev-marine-010318-095138
Gilbert D., Sundby B., Gobeil C., Mucci A., Tremblay G. H. (2005). A seventy-two-year record of diminishing deep-water oxygen in the st. Lawrence estuary: The northwest atlantic connection. Limnol. Oceanogr. 50, 1654–1666. doi: 10.4319/lo.2005.50.5.1654
Grasshoff K., Kremling K., Ehrhardt M. (1999). Methods of seawater analysis, 3rd completely revised and enlarged edition (Weinheim; New York; Chichester; Brisbane; Singapore; Toronto: Wiley-VCH).
Hagy J. D., Boynton W. R., Keefe C. W., Wood K. V. (2004). Hypoxia in chesapeake ba-2001: Long-term change in relation to nutrient loading and river flow. Estuaries. 27, 634–658. doi: 10.1007/bf02907650
Han A. Q., Dai M. H., Kao S. J., Gan J. P., Li Q., Wang L. F., et al. (2012). Nutrient dynamics and biological consumption in a large continental shelf system under the influence of both a river plume and coastal upwelling. Limnol. Oceanogr. 57, 486–502. doi: 10.4319/lo.2012.57.2.0486
Huang W. J., Wang Y. C., Cai W. J. (2012). Assessment of sample storage techniques for total alkalinity and dissolved inorganic carbon in seawater. Limnol. Oceanogr. 10, 711–717. doi: 10.4319/lom.2012.10.711
Hung C.-C., Gong G.-C., Chou W.-C., Chung C.-C., Lee M.-A., Chang Y., et al. (2010). The effect of typhoon on particulate organic carbon flux in the southern east china sea. Biogeosciences. 7, 3007–3018. doi: 10.5194/bg-7-3007-2010
Laurent A., Fennel K. (2019). Time-evolving, spatially explicit forecasts of the northern gulf of mexico hypoxic zone. Environ. Sci. Technol. 53, 14449–14458. doi: 10.1021/acs.est.9b05790
Li D. W., Chen J. F., Ni X. B., Wang K., Zeng D. Y., Wang B., et al. (2019). Hypoxic bottom waters as a carbon source to atmosphere during a typhoon passage over the east china sea. Geophys. Res. Lett. 46, 11329–11337. doi: 10.1029/2019gl083933
Liu X., Laws E. A., Xie Y. Y., Wang L. X., Lin L. Z., Huang B. Q. (2019). Uncoupling of seasonal variations between phytoplankton chlorophyll a and production in the east china sea. J. Geophys. Res. 124, 2400–2415. doi: 10.1029/2018jg004924
Li Y. X., Yang D. Z., Xu L. J., Gao G. D., He Z. W., Cui X., et al. (2022). Three types of typhoon-induced upwellings enhance coastal algal blooms: A case study. J. Geophys. Res. 127, e2022JC018448. doi: 10.1029/2022jc018448
Li Y. D., Ye X., Wang A. J., Li H. D., Chen J., Qiao L. (2013). Impact of typhoon morakot on chlorophyll a distribution on the inner shelf of the east china sea. Mar. Ecol. Prog. Ser. 483, 19–29. doi: 10.3354/meps10223
Li X. G., Yu Z. M., Song X. X., Cao X. H., Yuan Y. Q. (2011). The seasonal characteristics of dissolved oxygen distribution and hypoxia in the changjiang estuary. J. Coast. Res. 27, 52–62. doi: 10.2112/jcoastres-d-11-00013.1
Li D. J., Zhang J., Huang D. J., Wu Y., Liang J. (2002). Oxygen depletion off the changjiang (yangtze river) estuary. Sci. China Ser. D. 45, 1137–1146. doi: 10.1360/02yd9110
Lu Z. M., Gan J. P., Dai M. H., Liu H. B., Zhao X. Z. (2018b). Joint effects of extrinsic biophysical fluxes and intrinsic hydrodynamics on the formation of hypoxia west off the pearl river estuary. J. Geophys. Res. 123, 6241–6259. doi: 10.1029/2018jc014199
Lui H. K., Chen C. T. A., Lee J., Bai Y., He X. Q. (2014). Looming hypoxia on outer shelves caused by reduced ventilation in the open oceans: Case study of the east china sea. Estuar. Coast. Shelf Sci. 151, 355–360. doi: 10.1016/j.ecss.2014.08.010
Lu J., Jiang J. B., Li A. C., Ma X. C. (2018a). Impact of typhoon chan-hom on the marine environment and sediment dynamics on the inner shelf of the east china sea: In-situ seafloor observations. Mar. Geol. 406, 72–83. doi: 10.1016/j.margeo.2018.09.009
Mao H.-L., Gan Z.-J., Lan S.-F. (1963). A preliminary study of the yangzte diluted water and its mixing process. Oceanologia Et Limnologia Sin. 5, 183–206.
Mattern J. P., Fennel K., Dowd M. (2013). Sensitivity and uncertainty analysis of model hypoxia estimates for the texas-louisiana shelf. J. Geophys. Res. 118, 1316–1332. doi: 10.1002/jgrc.20130
McNeil C. L., Ward B., McGillis W. R., DeGrandpre M. D., Marcinowski L. (2006). Fluxes of N2, O2, and CO2 in nearshore waters off martha's vineyard. Cont. Shelf Res. 26, 1281–1294. doi: 10.1016/j.csr.2006.04.008
Meier H. E. M., Vaeli G., Naumann M., Eilola K., Frauen C. (2018). Recently accelerated oxygen consumption rates amplify deoxygenation in the baltic sea. J. Geophys. Res. 123, 3227–3240. doi: 10.1029/2017jc013686
Meng Q. C., Zhou F., Ma X. C., Xuan J. L., Zhang H., Wang S., et al. (2022). Response process of coastal hypoxia to a passing typhoon in the east china sea. Front. Mar. Sci. 9. doi: 10.3389/fmars.2022.892797
Ni X. B., Huang D. J., Zeng D. Y., Zhang T., Li H. L., Chen J. F. (2016). The impact of wind mixing on the variation of bottom dissolved oxygen off the changjiang estuary during summer. J. Mar. Syst. 154, 122–130. doi: 10.1016/j.jmarsys.2014.11.010
Ning X. R., Lin C., Su J., Liu C., Hao Q., Le F. (2011). Long-term changes of dissolved oxygen, hypoxia, and the responses of the ecosystems in the east china sea from 1975 to 1995. J. Oceanogr. 67, 59–75. doi: 10.1007/s10872-011-0006-7
Oudot C., Gerard R., Morin P., Gningue I. (1988). Precise shipboard determination of dissolved-oxygen (winkler procedure) for productivity studies with a commercial system. Limnol. Oceanogr. 33, 146–150. doi: 10.4319/lo.1988.33.1.0146
Pitcher G. C., Aguirre-Velarde A., Breitburg D., Cardich J., Carstensen J., Conley D. J., et al. (2021). System controls of coastal and open ocean oxygen depletion. Prog. Oceanogr. 197, 102613. doi: 10.1016/j.pocean.2021.102613
Rabalais N. N., Diaz R. J., Levin L. A., Turner R. E., Gilbert D., Zhang J. (2010). Dynamics and distribution of natural and human-caused hypoxia. Biogeosciences. 7, 585–619. doi: 10.5194/bg-7-585-2010
Rabalais N. N., Turner R. E., Wiseman W. J. (2002). Gulf of mexico hypoxia, aka "the dead zone". Annu. Rev. Ecol. Syst. 33, 235–263. doi: 10.1146/annurev.ecolsys.33.010802.150513
Rabouille C., Conley D. J., Dai M. H., Cai W. J., Chen C. T. A., Lansard B., et al. (2008). Comparison of hypoxia among four river-dominated ocean margins: The changjiang (yangtze), mississippi, pearl, and rhone rivers. Cont. Shelf Res. 28, 1527–1537. doi: 10.1016/j.csr.2008.01.020
Scully M. E. (2010). The importance of climate variability to wind-driven modulation of hypoxia in chesapeake bay. J. Phys. Oceanogr. 40, 1435–1440. doi: 10.1175/2010jpo4321.1
Scully M. E. (2016). Mixing of dissolved oxygen in chesapeake bay driven by the interaction between wind-driven circulation and estuarine bathymetry. J. Geophys. Res. 121, 5639–5654. doi: 10.1002/2016jc011924
Stigebrandt A. (1991). Computations of oxygen fluxes through the sea surface and the net production of organic matter with application to the baltic and adjacent seas. Limnol. Oceanogr. 36, 444–454. doi: 10.4319/lo.1991.36.3.0444
Testa J. M., Clark J. B., Dennison W. C., Donovan E. C., Fisher A. W., Ni W. F., et al. (2017). Ecological forecasting and the science of hypoxia in chesapeake bay. Bioscience 67, 614–626. doi: 10.1093/biosci/bix048
Wang K., Cai W. J., Chen J. F., David K., Wang B., Fan W., et al. (2021). Climate and human-driven variability of summer hypoxia on a large river-dominated shelf as revealed by a hypoxia index. Front. Mar. Sci. 8. doi: 10.3389/fmars.2021.634184
Wang K., Chen J. F., Jin H. Y., Li H. L., Gao S. Q., Xu J., et al. (2014). Summer nutrient dynamics and biological carbon uptake rate in the changjiang river plume inferred using a three end-member mixing model. Cont. Shelf Res. 91, 192–200. doi: 10.1016/j.csr.2014.09.013
Wang B., Chen J. F., Jin H. Y., Li H. L., Huang D. J., Cai W. J. (2017). Diatom bloom-derived bottom water hypoxia off the changjiang estuary, with and without typhoon influence. Limnol. Oceanogr. 62, 1552–1569. doi: 10.1002/lno.10517
Wang L. X., Justic D. (2009). A modeling study of the physical processes affecting the development of seasonal hypoxia over the inner louisiana-texas shelf: Circulation and stratification. Cont. Shelf Res. 29, 1464–1476. doi: 10.1016/j.csr.2009.03.014
Wang T., Liu G., Gao L., Zhu L., Fu Q., Li D. (2016). Biological and nutrient responses to a typhoon in the yangtze estuary and the adjacent sea. J. Coast. Res. 32, 323–332. doi: 10.2112/jcoastres-d-15-00006.1
Wanninkhof R. (1992). Relationship between wind speed and gas exchange over the ocean. J. Geophys. Res. 97, 7373–7382. doi: 10.1029/92jc00188
Wei Q. S., Wang B. D., Chen J. F., Xia C. S., Qu D. P., Xie L. P. (2015). Recognition on the forming-vanishing process and underlying mechanisms of the hypoxia off the yangtze river estuary. Sci. China Earth Sci. 58, 628–648. doi: 10.1007/s11430-014-5007-0
Wesslander K., Hall P., Hjalmarsson S., Lefevre D., Omstedt A., Rutgersson A., et al. (2011). Observed carbon dioxide and oxygen dynamics in a baltic sea coastal region. J. Mar. Syst. 86, 1–9. doi: 10.1016/j.jmarsys.2011.01.001
Yu L. Q., Fennel K., Laurent A. (2015). A modeling study of physical controls on hypoxia generation in the northern gulf of mexico. J. Geophys. Res. 120, 5019–5039. doi: 10.1002/2014jc010634
Yu P. S., Yang X. F., Wang B., Li T., Tao B. Y., Zheng M. H., et al. (2022). Moderate CO2 sink due to phytoplankton bloom following a typhoon passage over the east china sea. Cont. Shelf Res. 238, 104696. doi: 10.1016/j.csr.2022.104696
Zhang W., Hetland R. D., Ruiz V., DiMarco S. F., Wu H. (2020). Stratification duration and the formation of bottom hypoxia over the texas-louisiana shelf. Estuar. Coast. Shelf S. 238, 106711. doi: 10.1016/j.ecss.2020.106711
Zhang H., Li S. Y. (2010). Effects of physical and biochemical processes on the dissolved oxygen budget for the pearl river estuary during summer. J. Mar. Syst. 79, 65–88. doi: 10.1016/j.jmarsys.2009.07.002
Zhang J., Liu S. M., Ren J. L., Wu Y., Zhang G. L. (2007). Nutrient gradients from the eutrophic changjiang (yangtze river) estuary to the oligotrophic kuroshio waters and re-evaluation of budgets for the east china sea shelf. Prog. Oceanogr. 74, 449–478. doi: 10.1016/j.pocean.2007.04.019
Zhang Z. W., Wu H., Yin X. Q., Qiao F. L. (2018b). Dynamical response of changjiang river plume to a severe typhoon with the surface wave-induced mixing. J. Geophys. Res. 123, 9369–9388. doi: 10.1029/2018jc014266
Zhang W. X., Wu H., Zhu Z. Y. (2018a). Transient hypoxia extent off changjiang river estuary due to mobile changjiang river plume. J. Geophys. Res. 123, 9196–9211. doi: 10.1029/2018jc014596
Zhao Y. Y., Uthaipan K., Lu Z. M., Li Y. D., Liu J., Liu H. B., et al. (2021). Destruction and reinstatement of coastal hypoxia in the south china sea off the pearl river estuary. Biogeosciences 18, 2755–2775. doi: 10.5194/bg-18-2755-2021
Zhu Z. Y., Wu H., Liu S. M., Wu Y., Huang D. J., Zhang J., et al. (2017). Hypoxia off the changjiang (yangtze river) estuary and in the adjacent east china sea: Quantitative approaches to estimating the tidal impact and nutrient regeneration. Mar. Pollut. Bull. 125, 103–114. doi: 10.1016/j.marpolbul.2017.07.029
Keywords: Changjiang Estuary, wind mixing, dissolved oxygen, hypoxia, biological processes
Citation: Miao Y, Wang B, Li D, Sun X, Xu Z, Sun Q, Jiang Z, Ma X, Jin H and Chen J (2023) Observational studies of the effects of wind mixing and biological process on the vertical distribution of dissolved oxygen off the Changjiang Estuary. Front. Mar. Sci. 10:1081688. doi: 10.3389/fmars.2023.1081688
Received: 27 October 2022; Accepted: 03 January 2023;
Published: 26 January 2023.
Edited by:
Baoshu Yin, Institute of Oceanology (CAS), ChinaReviewed by:
Tao Wang, Ocean University of China, ChinaCopyright © 2023 Miao, Wang, Li, Sun, Xu, Sun, Jiang, Ma, Jin and Chen. This is an open-access article distributed under the terms of the Creative Commons Attribution License (CC BY). The use, distribution or reproduction in other forums is permitted, provided the original author(s) and the copyright owner(s) are credited and that the original publication in this journal is cited, in accordance with accepted academic practice. No use, distribution or reproduction is permitted which does not comply with these terms.
*Correspondence: Bin Wang, d2FuZ2JpbkBzaW8ub3JnLmNu; Jianfang Chen, amZjaGVuQHNpby5vcmcuY24=
Disclaimer: All claims expressed in this article are solely those of the authors and do not necessarily represent those of their affiliated organizations, or those of the publisher, the editors and the reviewers. Any product that may be evaluated in this article or claim that may be made by its manufacturer is not guaranteed or endorsed by the publisher.
Research integrity at Frontiers
Learn more about the work of our research integrity team to safeguard the quality of each article we publish.