
94% of researchers rate our articles as excellent or good
Learn more about the work of our research integrity team to safeguard the quality of each article we publish.
Find out more
ORIGINAL RESEARCH article
Front. Mar. Sci., 31 January 2023
Sec. Marine Ecosystem Ecology
Volume 10 - 2023 | https://doi.org/10.3389/fmars.2023.1078042
 Mayumi L. Arimitsu1*
 John F. Piatt2
 James T. Thorson3
 Katherine J. Kuletz4Gary S. Drew2Sarah K. Schoen2Daniel A. Cushing5Caitlin Kroeger6†William J. Sydeman6
Introduction: Seabirds are abundant, conspicuous members of marine ecosystems worldwide. Synthesis of distribution data compiled over time is required to address regional management issues and understand ecosystem change. Major challenges when estimating seabird densities at sea arise from variability in dispersion of the birds, sampling effort over time and space, and differences in bird detection rates associated with survey vessel type.
Methods: Using a novel approach for modeling seabirds at sea, we applied joint dynamic species distribution models (JDSDM) with a vector-autoregressive spatiotemporal framework to survey data collected over nearly five decades and archived in the North Pacific Pelagic Seabird Database. We produced monthly gridded density predictions and abundance estimates for 8 species groups (77% of all birds observed) within Cook Inlet, Alaska. JDSDMs included habitat covariates to inform density predictions in unsampled areas and accounted for changes in observed densities due to differing survey methods and decadal-scale variation in ocean conditions.
Results: The best fit model provided a high level of explanatory power (86% of deviance explained). Abundance estimates were reasonably precise, and consistent with limited historical studies. Modeled densities identified seasonal variability in abundance with peak numbers of all species groups in July or August. Seabirds were largely absent from the study region in either fall (e.g., murrelets) or spring (e.g., puffins) months, or both periods (shearwaters).
Discussion: Our results indicated that pelagic shearwaters (Ardenna spp.) and tufted puffin (Fratercula cirrhata) have declined over the past four decades and these taxa warrant further investigation into underlying mechanisms explaining these trends. JDSDMs provide a useful tool to estimate seabird distribution and seasonal trends that will facilitate risk assessments and planning in areas affected by human activities such as oil and gas development, shipping, and offshore wind and renewable energy.
Knowledge of marine predator species distributions across space and time is needed to inform a variety of ecosystem processes, as well as to identify habitat use by marine wildlife as required for management purposes (Warwick et al., 2021). Seabirds are meso- to upper trophic level marine predators that spend the most of their time foraging at sea, where they are relatively easy to identify and count from vessels (Tasker et al., 2009). Survey data can be synthesized to provide insight into seabird distribution and abundance, interspecific interactions, and marine ecosystem structure (Ballance, 2007).
Information on the abundance of seabirds at sea is necessary to inform management of marine bird populations that may be vulnerable to human activities such as shipping, offshore energy development, or to aid conservation of threatened seabird species (Yen et al., 2005; Renner and Kuletz, 2015). Identifying the seasonal distribution of biological resources with high sensitivity to oil pollution and vulnerability to offshore wind energy infrastructure (Kelsey et al., 2018) is a priority in continental shelf regions that are leased for offshore energy project developments (Petersen et al., 2019). Additionally, resulting data products (e.g., species distribution maps) can inform essential management decisions for fisheries when assessing risk to marine birds and mammals from fishing gear and other industrial fishing activities (Zador et al., 2008; Fox et al., 2021).
Pelagic seabird survey databases currently exist for many important and productive large marine ecosystems around the world. Among the largest is the North Pacific Pelagic Seabird Database (NPPSD), which includes data obtained mostly from the continental shelf and adjacent deep ocean waters of western North America (Drew et al., 2005). The current version contains strip transect data on >20 million seabirds, collected by hundreds of investigators operating from different vessel types during the past 47 years. Data from the NPPSD have been used to inform many issues, including status and trends, threats to populations, climate change, endangered species, habitat use, and trophic relationships (Humphries et al., 2012; Renner et al., 2013; Kuletz et al., 2015).
Statistical difficulties when analyzing at sea survey data arise from large spatiotemporal variability in seabird dispersion and sampling effort and bias associated with variable survey methods and and vessel types. Because seabirds often aggregate when foraging, survey data are overdispersed and have a high frequency of zero-values. Therefore, it can be challenging to accurately estimate seabird densities, account for environmental variability, and adjust for methodological bias within a single analysis. Perhaps not surprisingly, commercial groundfish stock assessments using vessel-based survey data are confounded by many of the same statistical issues. For that reason, we tested a geostatistical approach for analysis of seabird data using a modeling framework originally developed for fisheries science (Thorson et al., 2015).
Our main purpose was to produce gridded species distribution models to assess monthly seabird abundance and seasonal trends based on contemporary density levels to inform current management decisions. We applied a Vector Autoregressive Spatiotemporal (VAST) model to quantify spatiotemporal variability of seabird abundance in Cook Inlet, Alaska and tested the model’s efficacy in accounting for environmental factors and methodological differences in surveys over time. Specifically, we applied Joint Dynamic Species Distribution Models (JDSDMs) to generate density estimates for species based on spatiotemporal covariance among species (Thorson et al., 2016). JDSDMs can improve predictive power over single-species models (Ovaskainen et al., 2016), and may be especially useful for rare or cryptic species because they use shared information from spatiotemporal covariance of more abundant or identifiable community members (Omori and Thorson, 2022). JDSDMs were originally developed to model distributions of fish and other taxa (Thorson et al., 2016), but herein we apply them to seabirds for the first time.
Cook Inlet is a shallow (~65% of area< 80 m depth), tidally-influenced estuary that extends ~350 km north of the Gulf of Alaska continental shelf. At its mouth, Kennedy Entrance is 90 km wide between the Kenai and Alaska Peninsulas. The Inlet is a main shipping route to Anchorage, the state’s population center and commerce hub, and a region with commercial and sport fisheries, large seabird refuges, and an active offshore oil and gas industry. Our study region includes the area between Kennedy Entrance and Kalgin Island (Figure 1; 58.8 – 60.4°N Latitude, 151-154.2°W Longitude). Three marine ecoregions (Figure 1; Piatt and Springer, 2007) in Cook Inlet are characterized by distinct oceanographic conditions: warm, fresh, and sediment-laden waters that flow south along the west side; upwelling and strong northward currents that create nutrient rich and productive conditions at the mouth and along the east side; and glacially-influenced estuarine conditions occur within inner Kachemak Bay (Speckman et al., 2005).
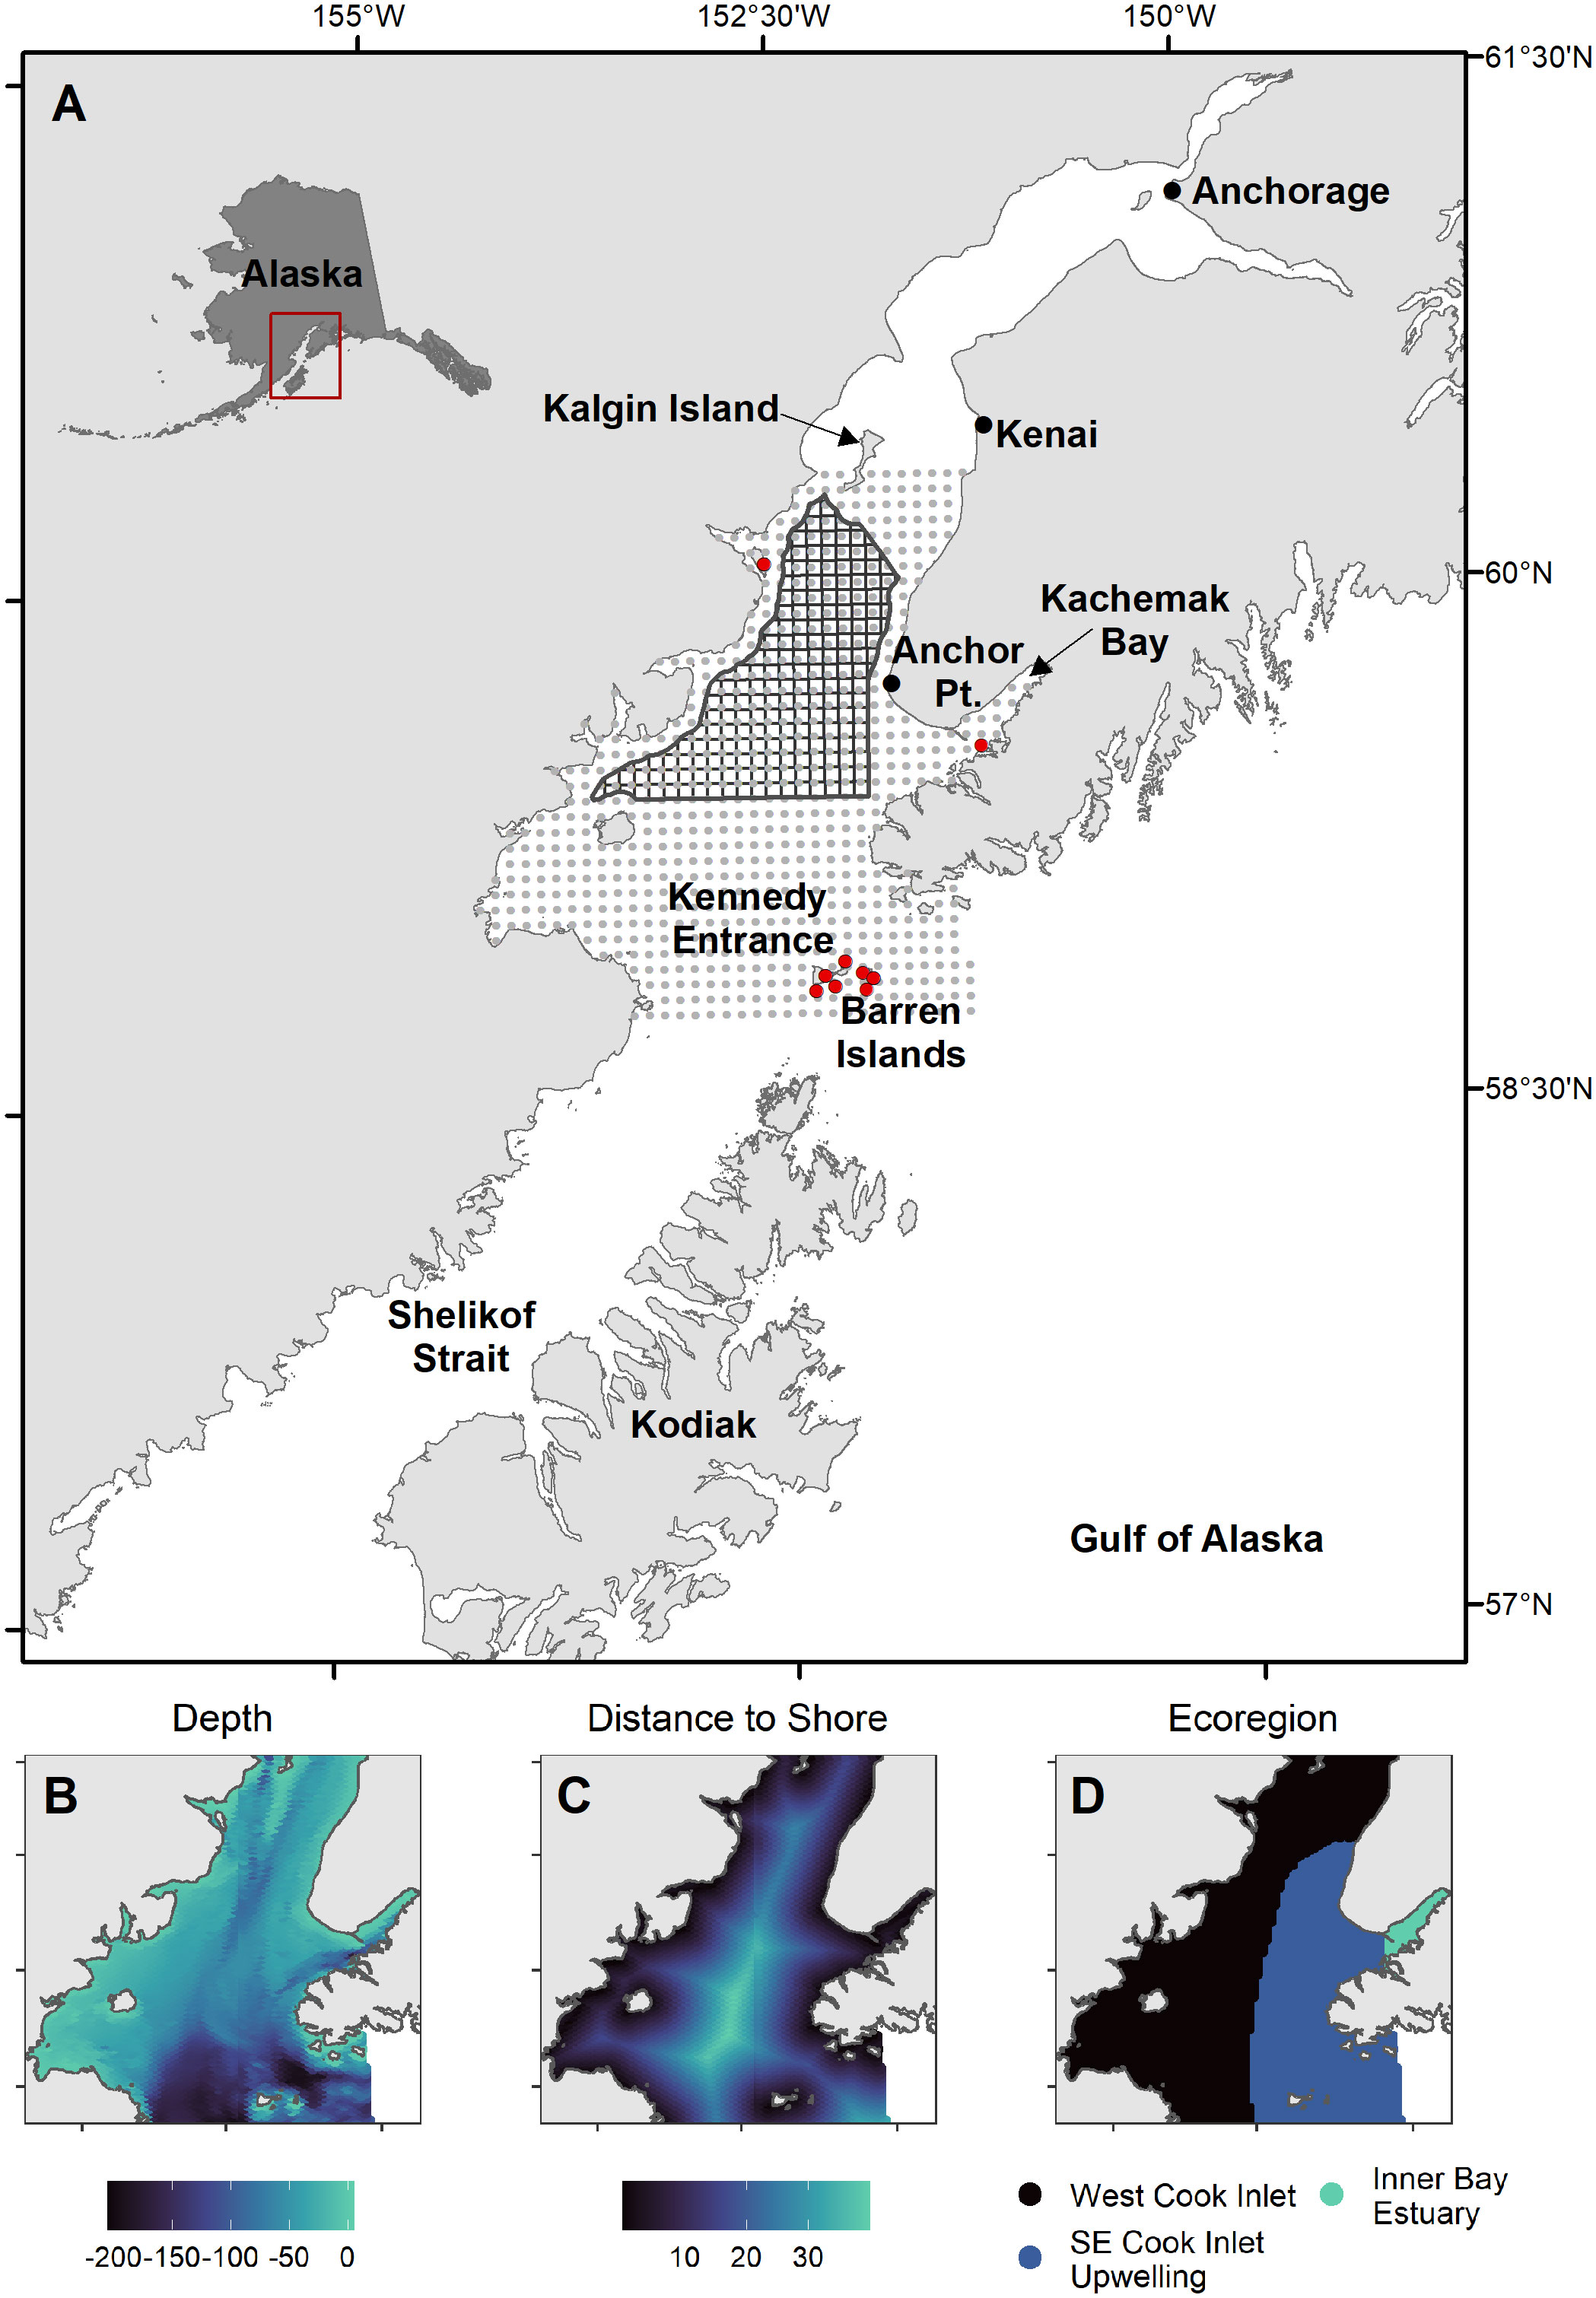
Figure 1 Maps of study region. (A) 5x5 km prediction grid (grey circles), major seabird colony locations (red circles), and potential oil and gas lease sale blocks (black polygons) in Cook Inlet, Alaska. (B–D) Habitat covariates: bottom depth (m, Zimmermann and Prescott, 2014), distance to shore (km), and spatial extent of marine ecoregions defining major oceanographic features (Piatt and Springer, 2007).
We compiled data from at sea surveys conducted in lower Cook Inlet spanning March to October from 1975 to 2021 (Figure 2; Drew et al., 2005). This includes systematic surveys conducted on cross-inlet transects during the 1990’s (Piatt, 1993; Agler et al., 1995; Piatt, 2002), some of which were repeated in 2016-2021 (Arimitsu et al., 2021b), surveys of Kachemak Bay during multiple years (Kuletz et al., 2011), and opportunistic surveys (e.g., most surveys during the 1970s and early 1980s). Most surveys were conducted using strip-transect protocols developed for pelagic (Gould and Forsell, 1989) and coastal (Irons et al., 2000) surveys. Strip transect surveys were summarized into 3-4 km long transect segments as the sample unit. Observations of live birds made within the survey transect area (km2, transect length x strip width) during boat-based pelagic surveys were summed across behaviors (on the water, flying, foraging) for each transect segment.
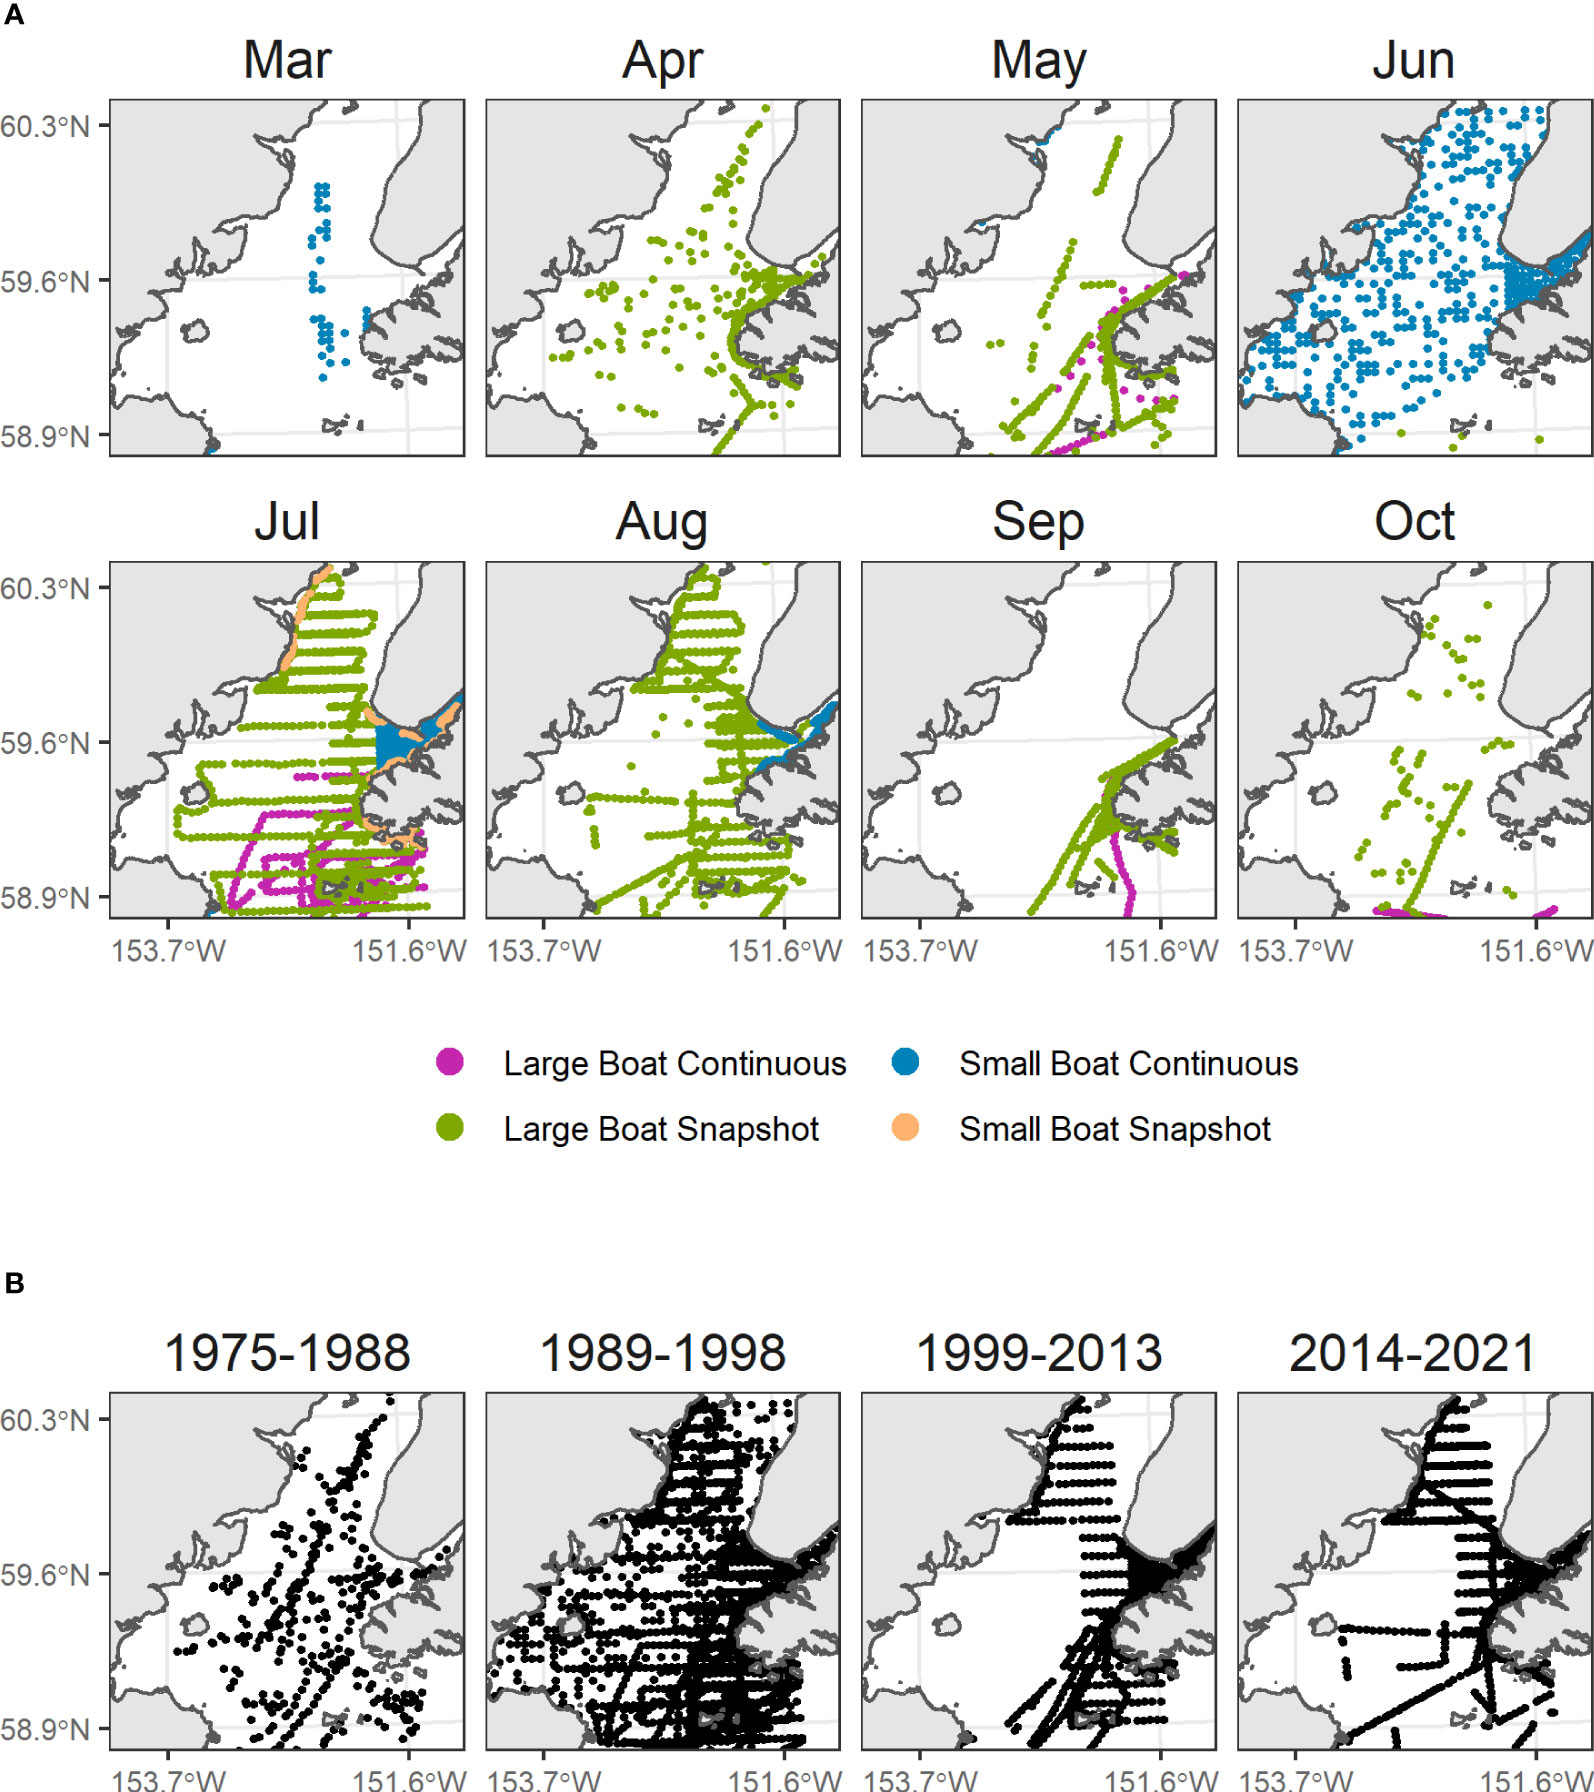
Figure 2 Seabird surveys in Cook Inlet, Alaska. (A) Factors known to affect detection rates of seabirds at sea were modeled as detection effects (colors). (B) Year groupings were modeled as decadal factors, to account for variation in density over time and to condition species-specific monthly density predictions upon contemporary (2014-2021) density levels.
We modeled joint dynamic species distributions for dark shearwaters (Ardenna spp., including A. grisea and A. tenuirostris), black-legged kittiwake (Rissa tridactyla), common murre (Uria aalge), pigeon guillemot (Cepphus columba), Kittlitz’s murrelet (Brachyramphus brevirostris), marbled murrelet (B. marmoratus), horned puffin (Fratercula corniculata), and tufted puffin (F. cirrhata). Together these species comprise 77% of all birds counted on surveys in Cook Inlet.
Unidentified Brachyramphus murrelets (n = 4653) were apportioned to species using the ratio of identified Brachyramphus species (Arimitsu et al., 2011). Species apportionment was applied pro rata at the transect level, or within a 12.5 km diameter hexagonal grid (~100 km2). On occasions that no birds were identified to species within a grid cell, we applied the regional species proportions (0.13 Kittlitz’s murrelet: 0.87 marbled murrelet). Two morphologically similar Ardenna shearwaters were not apportioned to species because of persistently low identification rates.
JDSDMs were implemented within the VAST modeling framework (Thorson, 2019). Seabird count data were modeled at the monthly time scale with a Poisson-link delta model using a Gamma error distribution. This approach jointly models encounter rates using presence/absence data and positive density using non-zero count data with an offset for area sampled (a, km2). For sample i, species c, location s, and month t, linear predictors representing encounter probability p1(i):
and positive density p2(i):
Where subscripts 1 and 2 refer to the first and second linear predictors, η is the number of factors f, L refers to loading’s matrices for β temporal, ω spatial, and ε spatiotemporal sources of variation generating covariation among species. γ1(ci,p) is the average effect of X(i,ti,p), which is a three-dimensional array of np habitat covariates, and η1(v1,f) represents random variation among detection factors, which are coded in VAST as vessel effects. Finally, Q(i,k) is a matrix composed of nk decadal factors, and λ1(k) is the estimated effect of decadal factors, which are coded in VAST as catchability covariates.
Link functions r1 and r2:
are combined to estimate variation in density d:
VAST uses stochastic partial differential equations to approximate a Matérn correlation function to smooth across points in space, assuming that observations closer to one another are more similar than more distant observations. We applied a 2-D mesh sampling across 500 knots, and used factor-model decomposition to model covariation among species with two spatial and spatiotemporal factors (Thorson et al., 2016). Parameters associated with temporal variability (β1 and β2) and spatiotemporal variability (ε1 and ε2) were modeled as random effects following a random walk.
We applied static habitat covariates (Figures 1B–D) to improve model fit and to inform predictions across unsampled areas. Locations were assigned to marine ecoregion, which were included as a categorical predictor, and we explored models that applied distance to shore and bottom depth (correlation = 0.53) with linear and quadratic terms. Bottom depth was extracted from a smooth sheet bathymetry grid at 50 m x 50 m resolution (Zimmermann and Prescott, 2014), or in areas outside this grid we used the General Bathymetric Chart of the Oceans 15 arc-second grid (GEBCO Compilation Group, 2020). Habitat covariates were applied only to the first linear predictor because exploratory analyses indicated that including them for both linear predictors didn’t further improve model fit [evaluated by minimum Akiake Information Criteria (AIC), not shown]. Our use of static covariates in this manner was to improve predictions rather than to explain ecological relationships.
To account for random variation in observed densities among survey platforms and protocols, we included vessel platform size (small boat< 15 m vs. large boat ≥ 15 m) and flying bird counting method (continuous vs. snapshot, Tasker et al., 2009) as detection factors in four combinations.
Because models were based on historical data with unequal sampling across space and time, we estimated spatial variability in seabird densities across year groupings (1975–1988, 1989–1998, 1999–2013, 2014–2021), which were chosen as the approximate year of inflection between decadal-scale ocean temperature patterns defining ecosystem states in the Gulf of Alaska. These include the 1989 regime shift (Hare and Mantua, 2000), the shift towards negative Pacific Decadal Oscillation conditions in 1999 (Bond et al., 2003), and the multi-year marine heatwaves that occurred after 2013 with acute and lingering ecosystem impacts on seabirds and their prey resources (Piatt et al., 2020; Arimitsu et al., 2021a; Schoen et al., 2022). Some year groupings were based partly on data availability (Figure S1), e.g., only two years were sampled prior to the 1976–1977 regime shift (Hare and Mantua, 2000), so we grouped those years with the 1977–1988 (warm) period. Similarly, few bird survey data are available to resolve effects of warming/cooling that occurred during the 2000’s, (Janout et al., 2010) so we combined years from 1999–2013.
The purpose of modeling decadal effects was to account for (i.e., remove the estimated effect of) changes in density for each decadal factor relative to the most recent one (i.e., 2014–2021) to produce predictions based on contemporary density levels for each species. To better understand the magnitude of density changes over time, we examined combined effects as the sum of λ1(k) and λ2(k) for each species.
Parameters were estimated using maximum likelihood while integrating the joint likelihood with respect to random effects as implemented in VAST v.3.9.0 (www.github.com/James-Thorson-NOAA/VAST) with R version 4.1.2 (R Core Team, 2021). Model fit was evaluated for convergence and validated using simulation-based quantile residuals with the DHARMa package (Hartig, 2022). AIC, graphical measures, and percent deviance explained (PDE) were also used as model diagnostics. We used AIC to evaluate the effectiveness of JDSDM for improving the model fit compared to univariate index models for each species following Thorson et al. (2016). Density predictions were extrapolated to a 5 km x 5 km grid over the study area, a spatial scale similar to transect segment length and relevant to potential oil and gas lease sale blocks in this region (Figure 1A) and plotted on log scale by species group for each month. To identify variability in seabird abundance across months, area-weighted and bias-corrected predicted densities were summed across the study area to provide an abundance estimate for each species.
JDSDM predictions provided a high level of explanatory power across space and time (85.9 PDE). Although quantile residuals indicate the presence of outliers in this model configuration, standardized residuals and quantile-quantile plots were approximately normal, and residual patterns were evenly distributed across predictions for each species (Figures S2, S3). The best fit model based on minimum AIC included marine ecoregion as a categorical predictor, and second-degree polynomial fits for bottom depth and distance to shore (Table 1). Ecoregion effects estimates indicate that compared with the Inner Bay Estuary, shearwaters and horned puffin had higher probability of occurrence in the SE Upwelling region and Western Cook Inlet, and pigeon guillemot had lower probability of occurrence in Western Cook Inlet (Figure S4).
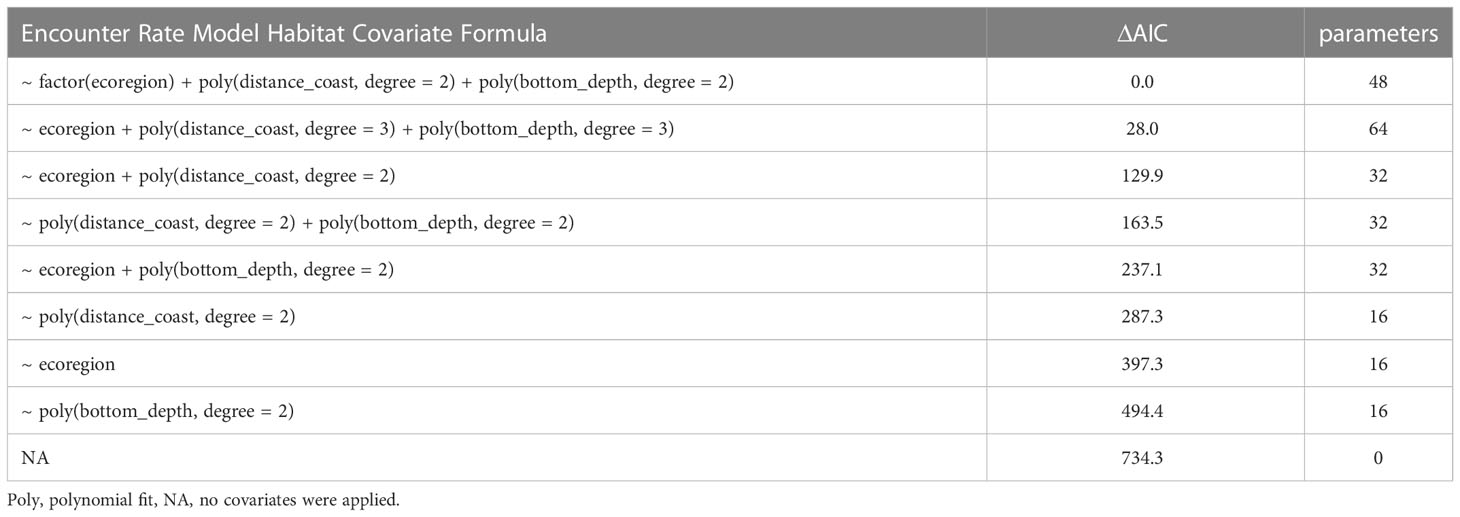
Table 1 Model selection for habitat covariates used in seabird distribution models based on minimum Akaike Information Criteria (ΔAIC = 0).
The model predicted monthly distributions for each species (Figures 3; S5–S12) and estimated seasonal abundance patterns along with their uncertainty. (Figure 4 and Table 2). Abundance was greatest during summer months (June–August) but patterns differed among species. Trans-equatorial migrant shearwaters (non-breeding) were widely distributed within Cook Inlet during May–August (Figure 3), with peak abundance in July (Figure 4). Black-legged kittiwakes occurred in higher densities in coastal areas and near colonies (Figure 3), but abundance was more stable through the summer (June–August) than other months or compared with other species (Figure 4). Common murres were concentrated in the SE Upwelling region from Kennedy Entrance and north to outer Kachemak Bay. Like kittiwakes, murres were dense in waters adjacent to their colonies (Figure 3) and abundance estimates were relatively more stable through the summer (June-August) than during other months or species (Figure 4). Abundance of Kittlitz’s and marbled murrelets peaked in July then declined in September and October following their breeding season (Figure 4). Pigeon guillemot numbers peaked in June (Figure 4), few were observed in September and October, but in contrast to murrelets they were commonly found during winter and spring. Their distribution was limited to more southern and coastal portions of the study area (Figure 3), and in association with small colonies, scattered along both sides of the Inlet. Tufted puffins were concentrated in the turbulent southern waters near their large breeding colony on the Barren Islands, at the entrance to Cook Inlet (Figure 3). Horned puffin were most abundant near their breeding colonies on Chisik Island (western Cook Inlet) and Barren Islands, and along a southeasterly track from there to Anchor Point (Figure 3). Abundance of both puffin species peaked in June through August followed by a decline into the fall (Figure 4).
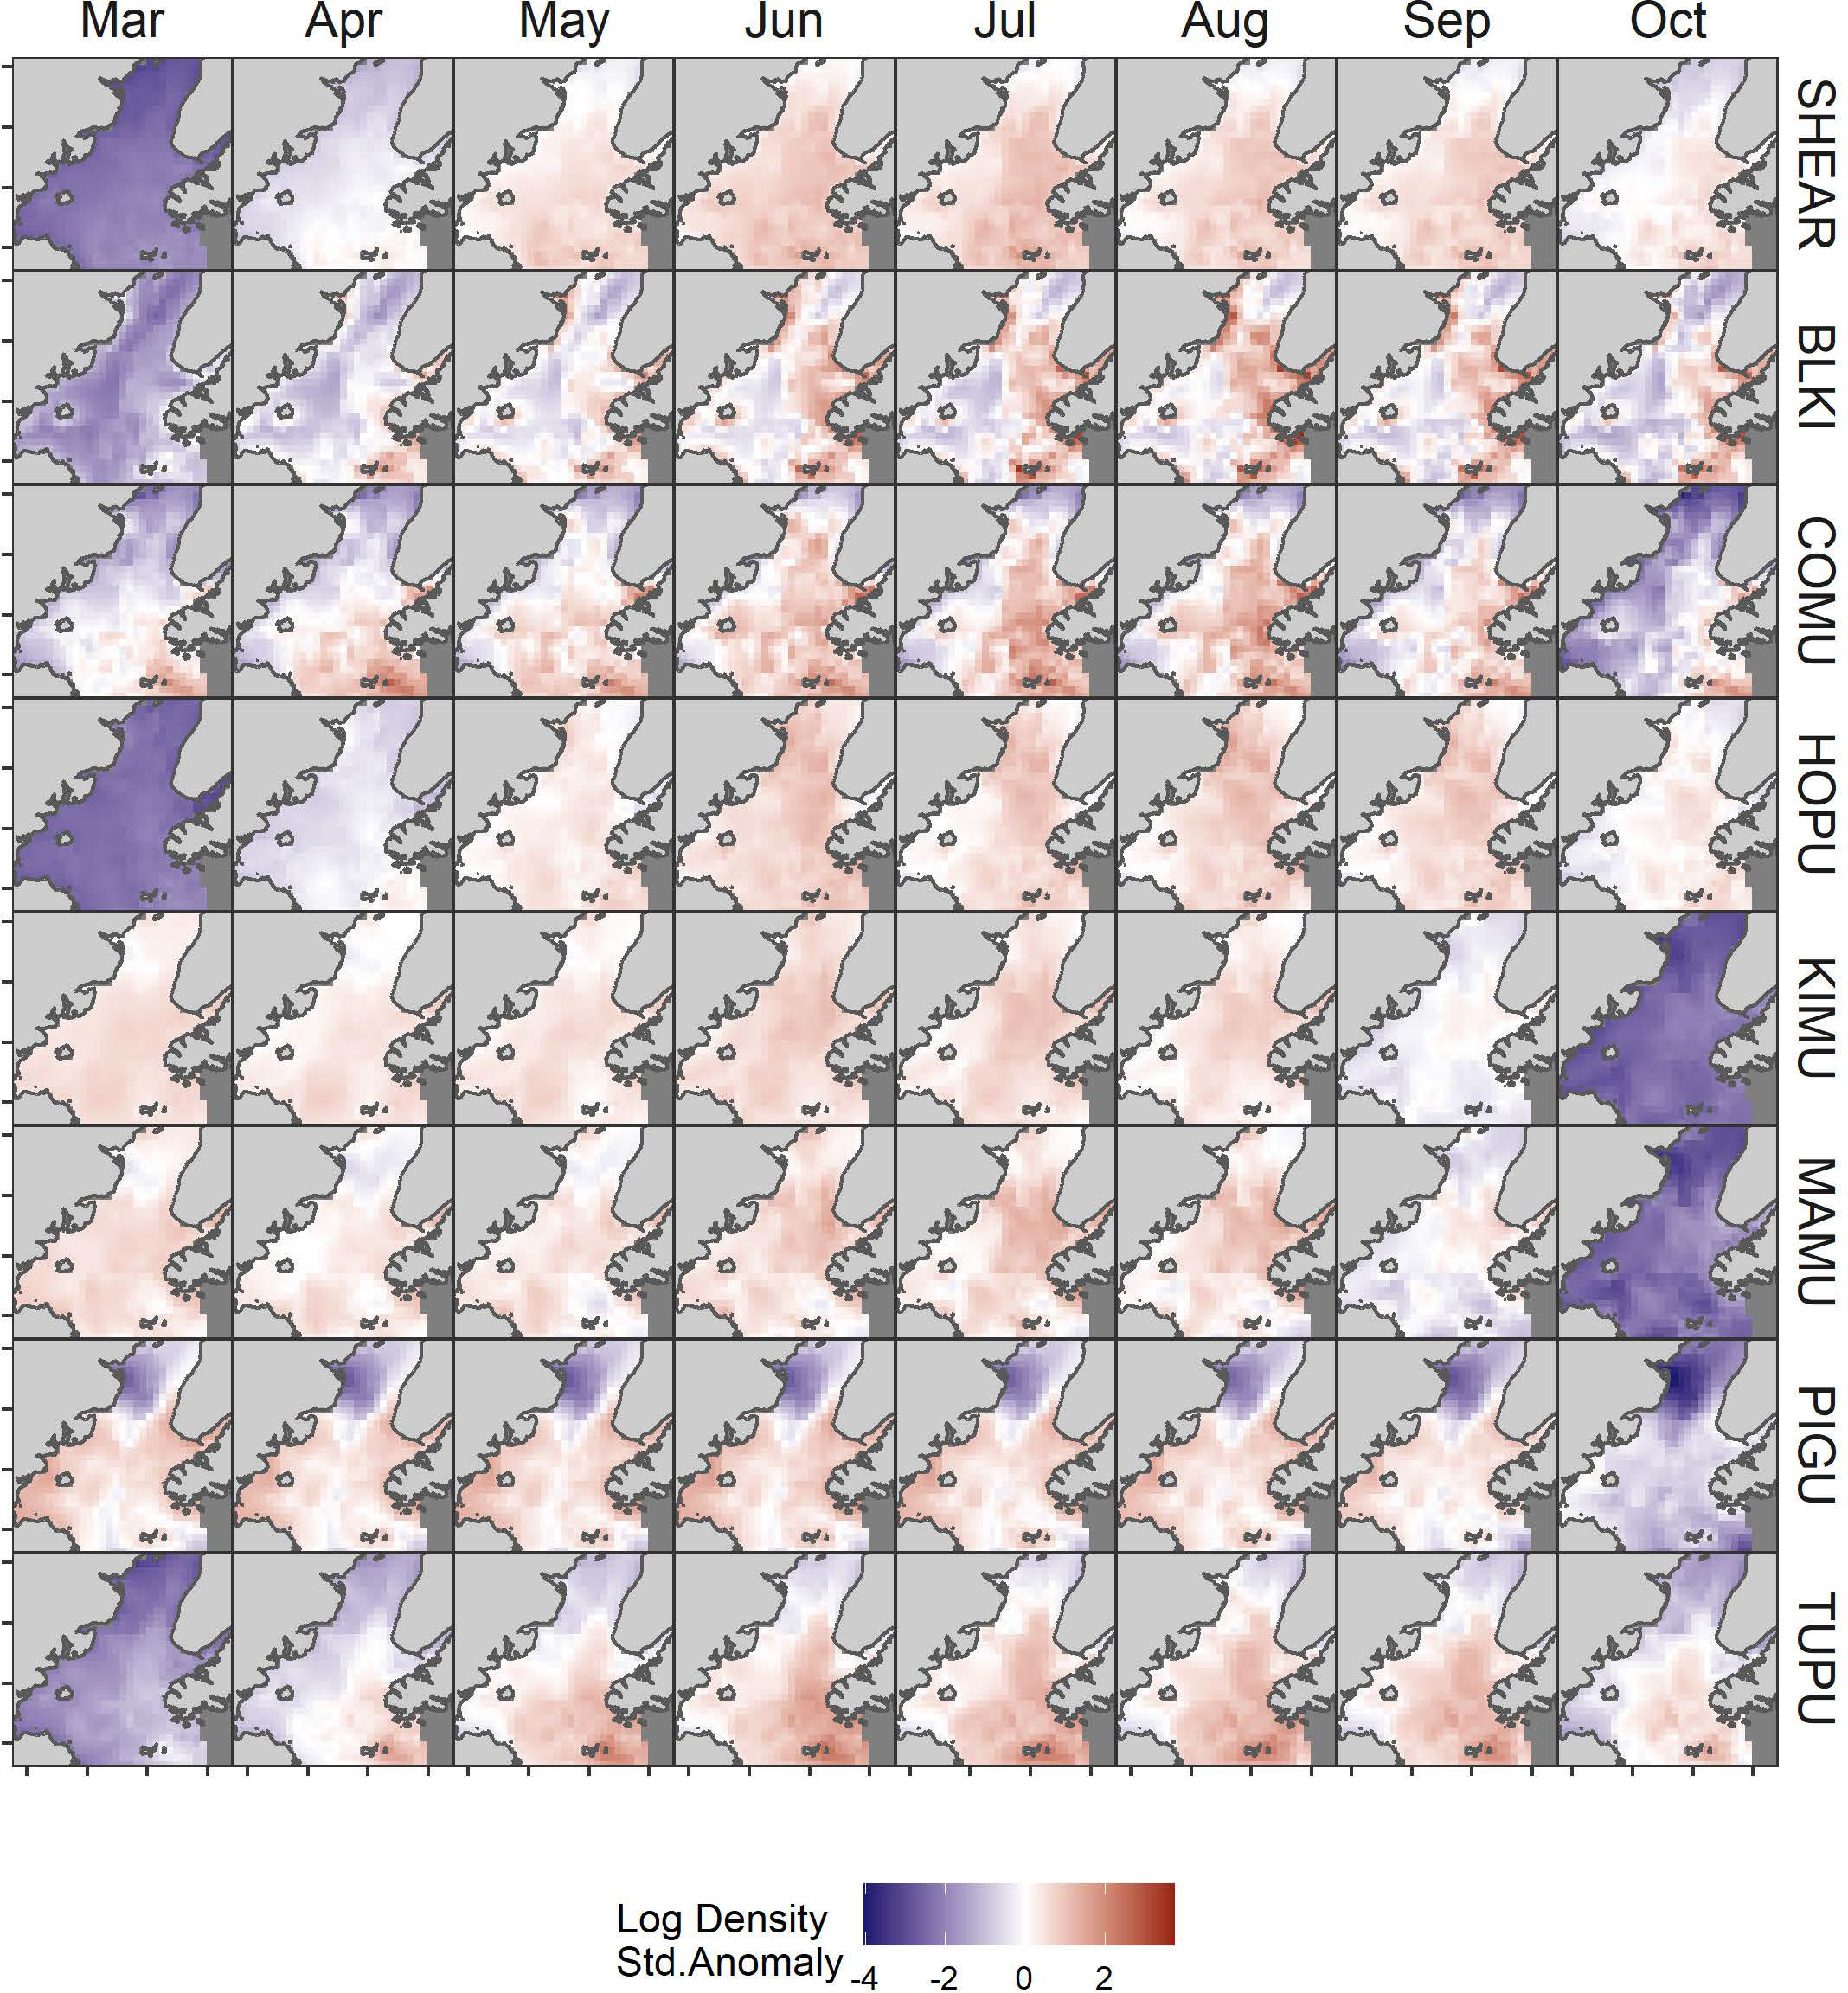
Figure 3 Monthly variation in predicted log density of seabirds in Cook Inlet, Alaska. Log density estimates were standardized to mean = 0 and SD = 1 by species SHEAR, shearwaters; BLKI, black-legged kittiwake; COMU, common murre; PIGU, pigeon guillemot; KIMU, Kittlitz’s murrelet; MAMU, marbled murrelet; HOPU, horned puffin; TUPU, tufted puffin.
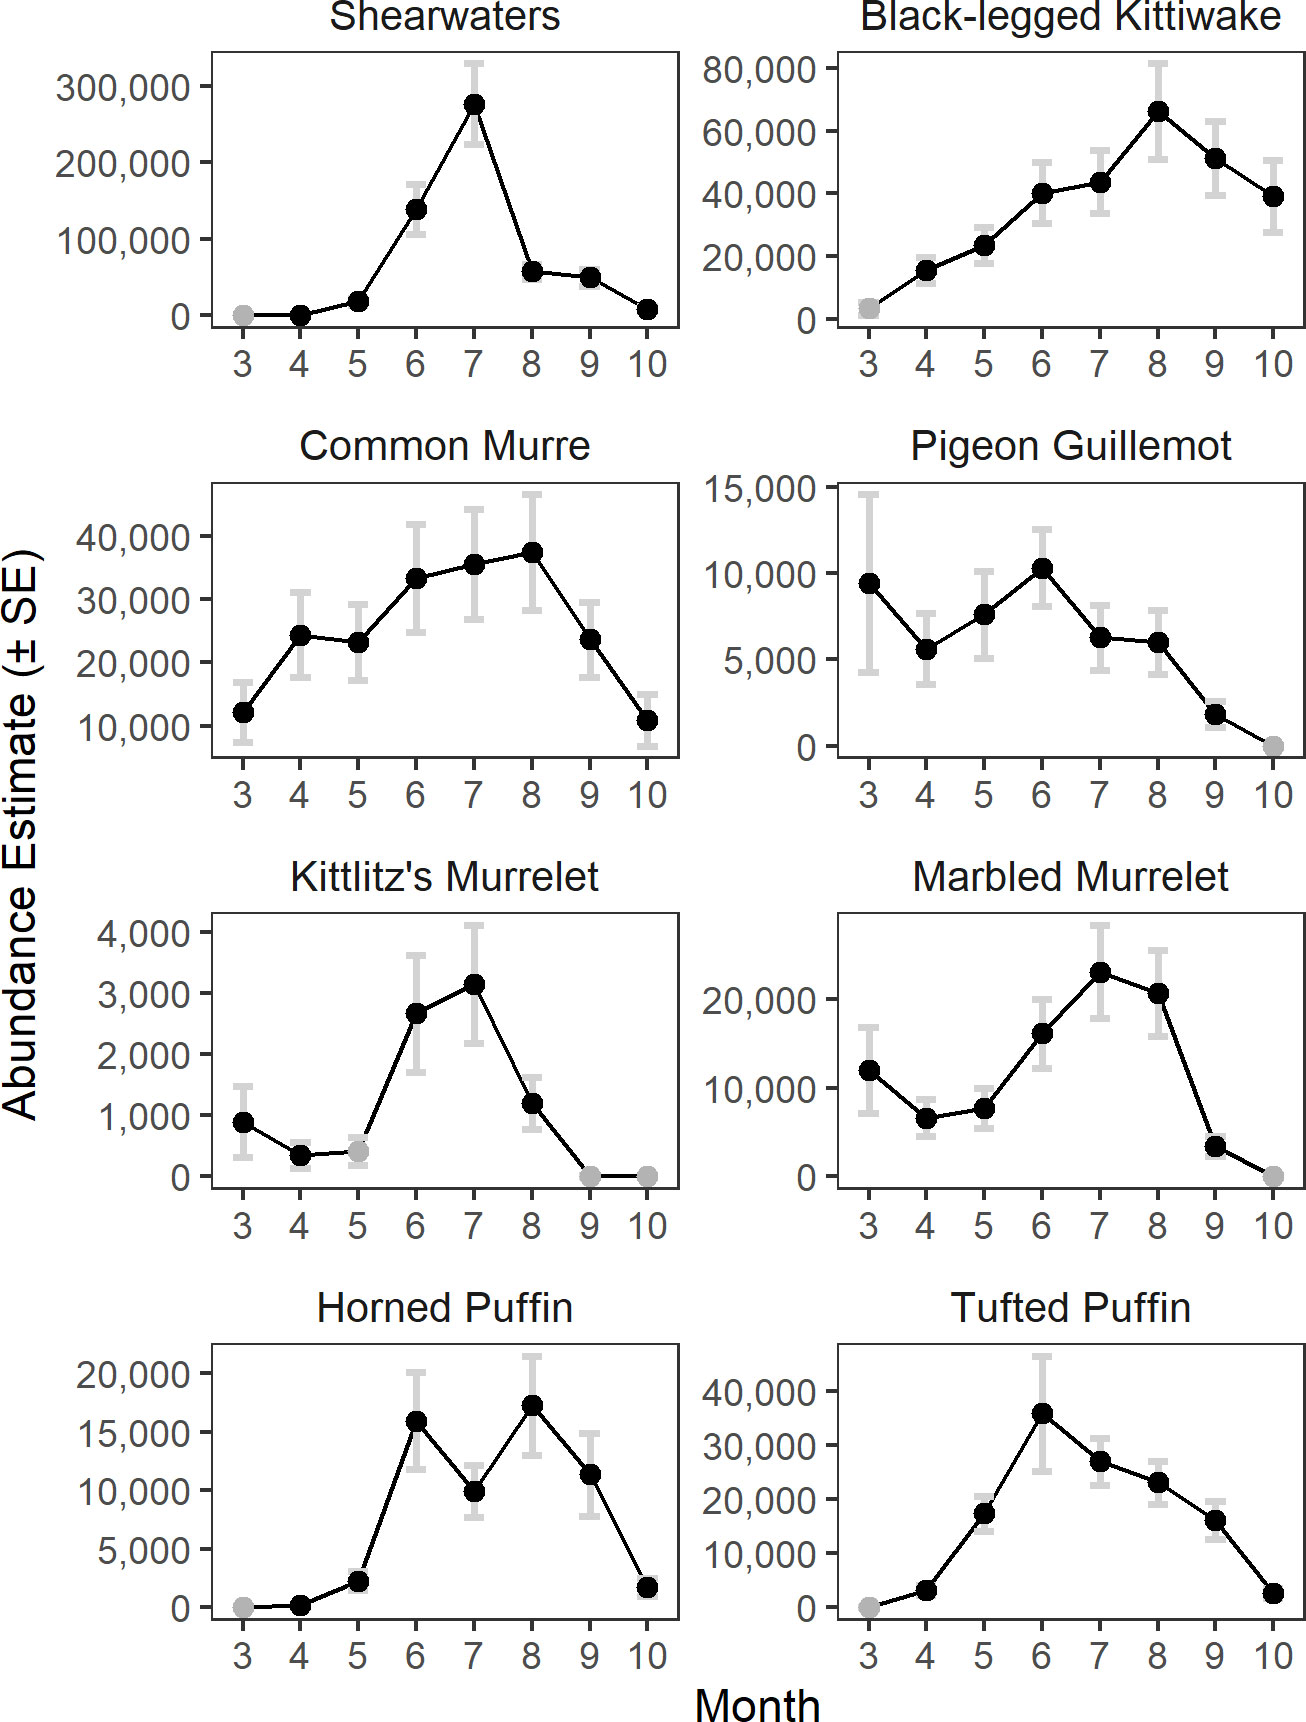
Figure 4 Monthly abundance estimates of seabirds in Cook Inlet, Alaska. Months with zero encounters are indicated by grey circles.
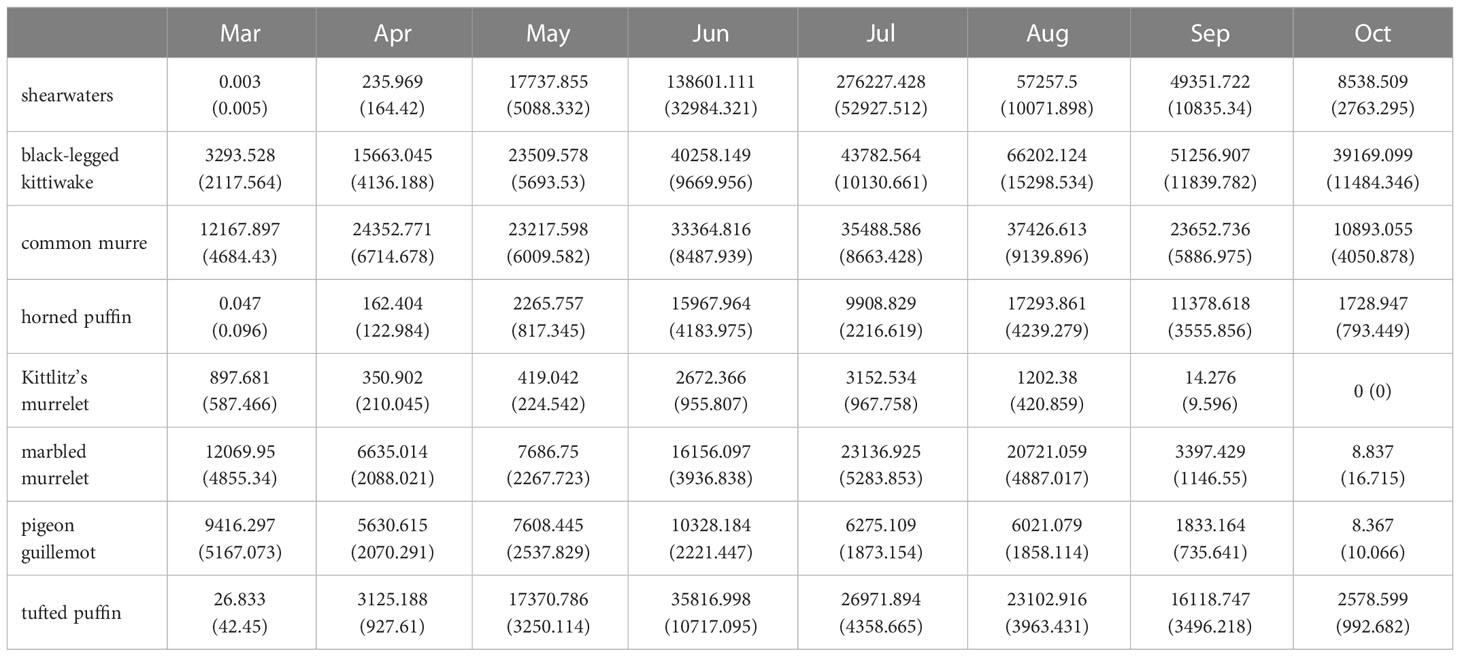
Table 2 Monthly seabird abundance estimates (SE) in Cook Inlet, Alaska.
As expected, the combined detection effects of boat size and flying-bird-counting methods on predicted densities identified substantial effects that differed among species (Figure 5A). Large boat detection effects were generally neutral or negative (observed the same or more birds) and and small boat effects were generally neutral or positive (same or fewer birds). Detection factors contrasting flying bird count methods were mixed negative and positive, indicating that vessel size was a stronger and more consistent driver of detection effects in our study region. Estimated detection effects for shearwaters, pigeon guillemots, and tufted puffins were lower in magnitude and variability, indicating that boat size and flying bird counting method had lesser effects on predicted densities for these species than for species smaller in size (Figure 5A).
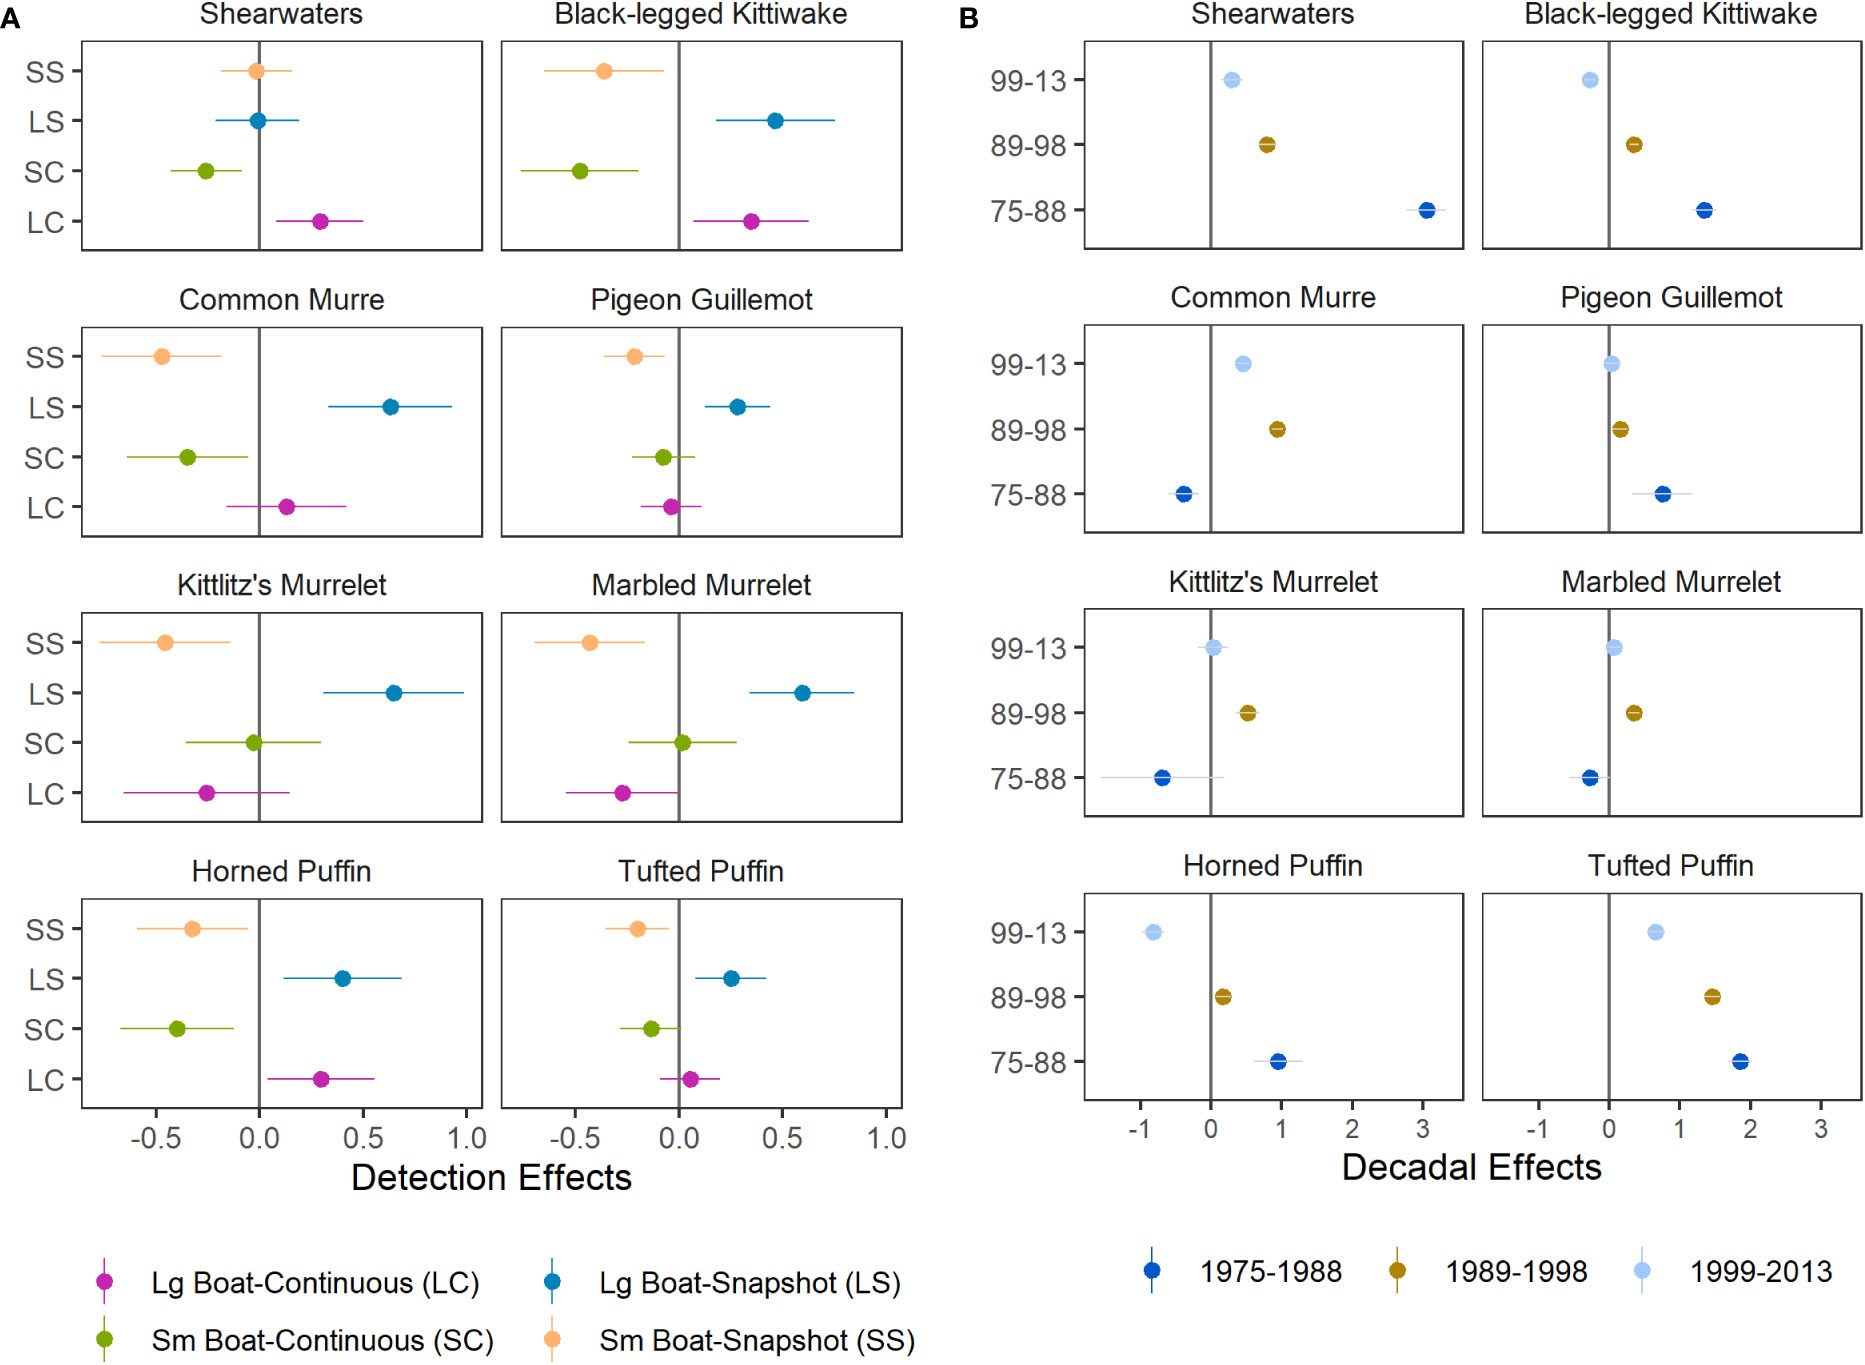
Figure 5 Species-specific parameter estimates (median ± SD) for (A) detection effects, which account for differences in boat size and flying bird counting methods, and (B) decadal effects, which represent the difference between density levels in each year group and those of the most recent years of data, 2014–2021, at zero (dark grey line).
Combined effects of decadal factors indicate that densities of shearwaters and tufted puffins have declined over time (Figure 5B). Densities of kittiwakes and horned puffins were also greater during 1975–1988 and 1989–1998 compared to densities during 2014–2021 but were lowest during 1999–2013 (Figure 5B). Common murre densities peaked in the 1990’s but declined markedly by the 2020’s. Densities of pigeon guillemots, which occupy nearshore habitats, were higher during 1975–1988 than later periods (Figure 5B). Densities of marbled and Kittlitz’s murrelets declined since the 1990’s but no significant difference was found in other decades and uncertainty for the earliest year grouping was high (Figure 5B). Due to limited sampling of nearshore murrelet habitat from large vessels during the 1975–1988 period, as well as limited knowledge about the biology, distribution, and identification of murrelets the early survey years, we interpret decadal effects for murrelets conservatively for all but the 1990’s when effort and spatial extent provide the richest data contrasts (Figures 2; S1).
The JDSDM produced better fits than univariate models (ΔAIC = 505.9), indicating that predictive ability was improved by incorporating species covariance across space and time. Correlations were positive for many species group-pairs for components that modeled temporal and spatiotemporal variation but were mixed between positive and negative for the spatial component (Figure 6). For example, the average spatial variation of marbled murrelet, and to a lesser extent, of Kittlitz’s murrelet were negatively correlated to the spatial variation of black-legged kittiwake and common murre. Species-pairs tended to be similar in seasonality and habitat use as evidenced by strongly positive correlations of temporal and spatial components of variability, while negative correlations in spatial components of variability were associated with more neutral correlations in temporal components of variability (Figure 6).
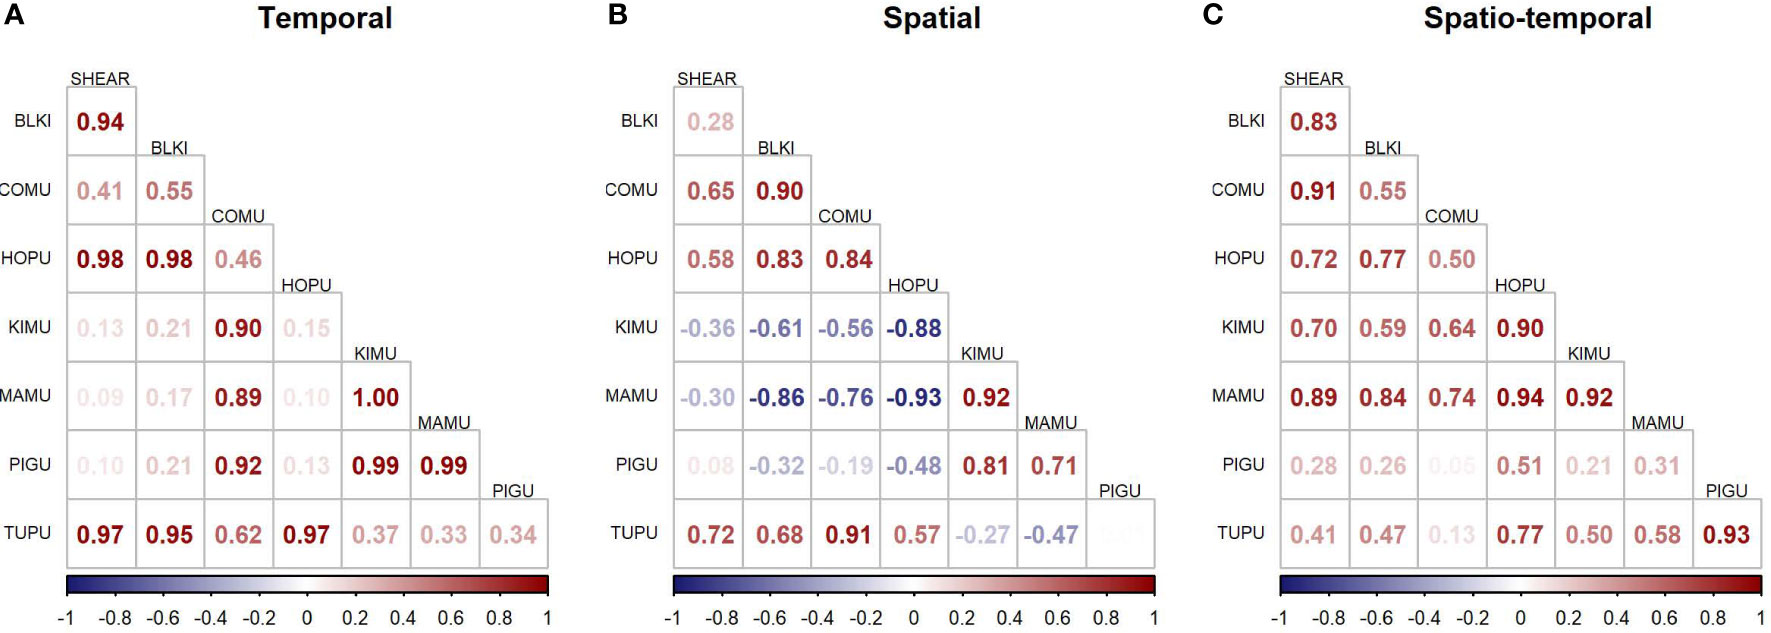
Figure 6 Species correlations of modeled densities across (A) time, (B) space, and (C) the interaction of space and time. SHEAR, dark shearwaters; BLKI, black-legged kittiwake; COMU, common murre; HOPU, horned puffin; KIMU, Kittlitz’s murrelet; MAMU, marbled murrelet; PIGU, pigeon guillemot; TUPU, tufted puffin.
In this study we used VAST JDSDMs to assess seasonal variation in distributions of seabirds using survey data spanning nearly five decades in Cook Inlet, Alaska. Despite large gaps in data across space and time, JDSDM generated robust predictions of species distributions, and derived credible at sea abundance estimates with relatively narrow confidence limits in most cases. This approach provides exceptional tools for modeling pelagic seabird data that can assist managers and scientists with risk management, planning, research, and conservation.
Predicted densities were strongly correlated among species groups, indicating the JDSDM effectively shared information across species. Our approach also used environmental covariates to improve predictions in unsampled locations and accounted for species-specific differences in detection among vessel platforms and survey methodologies. We also estimated decadal effects to account for changes in density over time, which made it possible to provide seasonal density distributions at contemporary levels relevant to current management decisions. We identified strong spatiotemporal patterns within the seabird community, and several modeled outputs from this work are relevant to potential assessments of resource impacts of current and future energy development in Cook Inlet, Alaska. For the specific purposes of resource management, risk assessment, and response planning in our study area, gridded density predictions are available (Arimitsu et al., 2023) for further analyses by resource managers and agencies concerned with seabird populations in Cook Inlet.
Recent efforts in the Atlantic and Pacific Outer Continental Shelf waters have applied spatial predictive modeling to derive seasonal maps for resource assessments (Winship et al., 2018; Leirness et al., 2021). These efforts used boosted regression trees (BRT) and Generalized Additive Models for Location, Scale and Shape (GAMLSS) to predict densities of seabirds across space and time. We applied JDSDM with VAST for a similar purpose due to its flexibility and ability to reconstruct fine-scale distributions, and also to derive estimates of monthly total abundance and uncertainty. Previous work using simulated and empirical data showed that BRT and GAM were proficient at replicating non-linear relationships with environmental covariates, but VAST models produced more robust species abundance indices and associated standard errors than BRT or GAM (Brodie et al., 2020). Additionally, VAST is designed to accommodate highly skewed observational data and capable of modeling survey-specific detection issues commonly encountered in biological data. Moreover, and specific to seabird at sea survey data, the geostatistical methods implemented in VAST make efficient use of autocorrelation inherent in samples derived from transect data and can be applied to non-randomized sampling designs with unequal sampling in space and time.
Gridded density estimates that span seasonal time-scales provided a of understanding spatiotemporal variation in at sea abundance and provide information on where or when risk from anthropogenic or natural perturbations may occur. Risk assessments within the potential lease sale areas (Figure 1) for Cook Inlet might benefit by focusing on the upwelling area offshore of Anchor Point and outer Kachemak Bay, which we show here are local, long-term density hotspots for seabirds designated as species of conservation concern including Kittlitz’s murrelet and tufted puffin (USFWS, 2021), and where large aggregations of migratory shearwaters also occurred during in summer. Model estimates also provided insight on where or when more data are required to reduce uncertainty. For example, large gaps in sampling effort (especially in winter November–March) and high-density areas near colony locations at the Barren Islands during summer would be important times and areas to invest more survey effort. Uncertainty in predicted densities could be reduced as new data become available, and the predictions reported herein can be updated using the existing or improved models in the future. Future applications of JDSDMs to model at sea survey data will focus on estimating abundance trends of seabirds over larger spatial and temporal scales, and will also be applied to different species groups, particularly endangered or threatened species. Although our objective for this work was to produce seasonal (monthly) abundance estimates at contemporary (2014–2021) density levels, future work will apply this application with different model configurations to produce decadal abundance trends for the peak (July–August) seasonal density levels.
Our analysis of decadal effects on seabird densities in Cook Inlet identified persistent declines in Ardenna shearwaters and tufted puffins since the late-1970’s. The decline in shearwaters was most pronounced in the 1970’s–1990’s, and may have stabilized in the 2000’s. While Cook Inlet constitutes a small fraction of shearwater foraging habitat (e.g., Shaffer et al., 2006), significant reductions in their use of Cook Inlet are consistent with large declines of shearwaters observed elsewhere in North America during the late-1980’s and early 1990’s (Veit et al., 1997). More recently there has also been a large-scale northward redistribution of foraging short-tailed shearwaters in response to climatic drivers (Kuletz et al., 2020), which may also affect their residence time and observed abundance in Cook Inlet. Our results also indicate that declines of tufted puffin densities at sea continued to the present decade, consistent with reported declines of tufted puffins throughout the Northern Gulf of Alaska (Goyert et al., 2017; Cushing et al., 2018), British Columbia, Canada (Gaston et al., 2009), the U.S. Pacific Northwest (Piatt and Kitaysky, 2002), and throughout its range in North America (Pearson et al., 2022).
Our results are consistent with previous work that estimated abundance and trends of seabirds in the region, both from at sea surveys and colony counts, and distribution patterns identified in this study are confirmed by what is known about the ecology of seabirds in the region. For example, Kuletz et al. (2011) documented steep declines (56–84%) of Brachyramphus murrelets densities in Cook Inlet during the 1990’s, down from estimates of nearly 60,000 birds in summer 1993 (Agler et al., 1998). In line with previous estimates and magnitude of declines, we estimated contemporary (2014–2021) density levels for Kittlitz’s and marbled murrelets are 60% and 37% (respectively) lower than they were in the 1990’s, with combined estimates on the order of 20,000 birds in June (Table 2). Our seasonal patterns are consistent with previous work that documented murrelet migrations away from coastal areas during post breeding molt in fall (Piatt et al., 2021), and their return in winter and spring prior to summer months when their densities are greatest (Arimitsu et al., 2011; Kuletz et al., 2011). Similarly, recent large-scale declines of murres are consistent with trends based on colony counts, where numbers increased through the 1980’s and 1990’s but were severely impacted by a large murre die-off in 2015-2016 (Piatt et al., 2020) and lingering effects of marine heatwaves on reproductive success and population size at the colonies (Schoen et al., 2022).
The use of JDSDMs to estimate seabird distribution and seasonal trends will facilitate risk assessments and planning in areas affected by human activities such as oil and gas development, shipping, and offshore wind and renewable energy. Although this application is broadly relevant for informing marine ecosystem processes, predicting habitat use, and aiding conservation of species in any region that employs standard marine bird survey methodology, in this paper we provide tools to inform assessments in Cook Inlet, Alaska including: (1) gridded density predictions of monthly seabird distribution and (2) species-specific abundance indices, their seasonal trends, and uncertainty. In addition to providing a novel method for producing fine-scale monthly distributions from historical seabird data, we envision that these publicly available products will aid in quantitatively supporting management and conservation decisions.
The data presented in the study are deposited in the U.S. Geological Survey, Alaska Science Center Trusted Digital Repository, accession numbers doi.org/10.5066/F7WQ01T3 and doi.org/10.5066/P94NDFRI.
MA, JP, JT, WS, KK, and CK conceived the ideas and designed methodology; MA, JP, KK, GD, SS, and DC conducted surveys and compiled data; MA, JT, JP, and CK analyzed data, MA led the writing of the manuscript. All authors contributed to the article and approved the submitted version.
Funding was provided by the Bureau of Ocean and Energy Management (BOEM, Interagency Agreements M10PG0050, M14PG0031, and M19PG0002), USGS Alaska Science Center, USGS Outer Continental Shelf (OCS) Program, North Pacific Research Board (grant numbers 637, 1427b, L37-01A, and 2105), Exxon Valdez Oil Spill Trustee Council, and Alaska Department of Fish and Game.
We are grateful for support of Cathy Coon, Tim White, and Rick Raymond (BOEM); Mona Kahlil and Lianne Ball (OCS); and the many data contributors (Table S1) and field crews that made this work possible. We thank Curry Cunningham (NOAA, UAF) for conceptual discussions. Libby Loggerwell (NOAA), Josh Adams (USGS), John Pearce (USGS), and two reviewers provided helpful comments on earlier drafts. Any use of trade, firm, or product names is for descriptive purposes and does not imply endorsement by the US Government.
Author DC is owner of Pole Star Ecological Research LLC.
The remaining authors declare that the research was conducted in the absence of any commercial or financial relationships that could be construed as a potential conflict of interest.
All claims expressed in this article are solely those of the authors and do not necessarily represent those of their affiliated organizations, or those of the publisher, the editors and the reviewers. Any product that may be evaluated in this article, or claim that may be made by its manufacturer, is not guaranteed or endorsed by the publisher.
The Supplementary Material for this article can be found online at: https://www.frontiersin.org/articles/10.3389/fmars.2023.1078042/full#supplementary-material
Agler B., Kendall S., Irons D. (1998). Abundance and distribtuion of marbled and Kittlitz’s murrelets in southcentral and southeast Alaska. Condor 100, 254–265. doi: 10.2307/1370266
Agler B., Kendall S., Seiser P., Irons D. (1995). Estimates of marine bird and sea otter abundance in lower Cook Inlet, Alaska during summer 1993 and winter 1994. Anchorage, AK. Minerals Management Service OCS Study. 94-0063. 148 p.
Arimitsu M., Piatt J., Hatch S., Suryan R., Batten S., Bishop M. A., et al. (2021a). Heatwave-induced synchrony within forage fish portfolio disrupts energy flow to top pelagic predators. Glob. Change Biol. 27, 1859–1878. doi: 10.1111/gcb.15556
Arimitsu M., Piatt J., Romano M., van Pelt T. (2011). Status and distribution of the Kittlitz’s murrelet Brachyramphus brevirostris in Kenai Fjords. Mar. Ornithol. 22, 13–22.
Arimitsu M., Piatt J., Thorson J., Kuletz K., Drew G., Schoen S., et al. (2023). gridded seabird density estimates in lower Cook Inlet, Alaska (Alaska: U.S. Geological Survey data release). doi: 10.5066/P94NDFRI
Arimitsu M., Schoen S., Piatt J., Marsteller C., Drew G. (2021b). Monitoring the recovery of seabirds and forage fish following a major ecosystem disruption in lower Cook Inlet, Alaska (Anchorage, Alaska: U.S. Department of the Interior, Bureau of Ocean Energy Management. OCS Study BOEM 2021-031), 50.
Bond N., Overland J., Spillane M., Stabeno P. (2003). Recent shifts in the state of the north Pacific. Geophys. Res. Lett. 30, 2–5. doi: 10.1029/2003GL018597
Brodie S., Thorson J., Carroll G., Hazen E., Bograd S., Haltuch M., et al. (2020). Trade-offs in covariate selection for species distribution models: a methodological comparison. Ecogr. (Cop.). 43, 11–24. doi: 10.1111/ecog.04707
Cushing D., Roby D., Irons D. (2018). Patterns of distribution, abundance, and change over time in a subarctic marine bird community. Deep. Res. Part II. 147, 148–163. doi: 10.1016/j.dsr2.2017.07.012
Drew G. S., Schoen S. K., Hood M. D., Arimitsu M. L., Piatt J. F. (2005). North Pacific Pelagic Seabird Database (NPPSD) (ver 4.0, January 2023): U.S. Geological Survey data release. doi: 10.5066/F7WQ01T3
Fox C., Robertson C., O’Hara P., Tadey R., Morgan K. (2021). Spatial assessment of albatrosses, commercial fisheries, and bycatch incidents on Canada’s Pacific coast. Mar. Ecol. Prog. Ser. 672, 205–222. doi: 10.3354/meps13783
Gaston A., Bertram D., Boyne A., Chardine J., Davoren G., Diamond A., et al. (2009). Changes in Canadian seabird populations and ecology since 1970 in relation to changes in oceanography and food webs. Environ. Rev. 17, 267–286. doi: 10.1139/A09-013
Gould P., Forsell D. (1989). Techniques for shipboard surveys of marine birds. (Anchorage, AK: U.S. Fish and Wildlife Service Technical Report 25). 20 pp. doi: 10.5962/bhl.title.23841
Goyert H., Garton E., Drummond B., Renner H. (2017). Density dependence and changes in the carrying capacity of Alaskan seabird populations. Biol. Conserv. 209, 178–187. doi: 10.1016/j.biocon.2017.02.011
Hare S., Mantua N. (2000). Empirical evidence for north Pacific regime shifts in 1977 and 1989. Prog. Oceanogr. 47, 103–145. doi: 10.1016/S0079-6611(00)00033-1
Hartig F. (2022) DHARMa: Residual diagnostics for heirarchical (multi-level/mixed) regression models. R package version 0.4.5. Available at: https://CRAN.R-project.org/package=DHARMa.
Humphries G., Huettmann F., Nevitt G., Deal C., Atkinson D. (2012). Species distribution modeling of storm-petrels (Oceanodroma furcata and O. leucorhoa) in the North Pacific and the role of dimethyl sulfide. Polar Biol. 35, 1669–1680. doi: 10.1007/s00300-012-1207-2
Irons D., Kendall S., Erickson W., McDonald L., Lance B. (2000). Nine years after the Exxon Valdez oil spill: Effects on marine bird populations in prince William sound, Alaska. Condor 102, 723. doi: 10.1650/0010-5422(2000)102[0723:NYATEV]2.0.CO;2
Janout M., Weingartner T., Royer T., Danielson S. (2010). On the nature of winter cooling and the recent temperature shift on the northern Gulf of Alaska shelf. J. Geophys. Res. 115, 1–14. doi: 10.1029/2009JC005774
Kelsey E. C., Felis J. J., Czapanskiy M., Pereksta D. M., Adams J. (2018). Collision and displacement vulnerability to offshore wind energy infrastructure among marine birds of the Pacific outer continental shelf. J. Environ. Manage. 227, 229–247. doi: 10.1016/j.jenvman.2018.08.051
Kuletz K., Cushing D., Labunski E. (2020). Distributional shifts among seabird communities of the northern Bering and Chukchi seas in response to ocean warming during 2017 – 2019. Deep. Res. Part II 181–182, 104913. doi: 10.1016/j.dsr2.2020.104913
Kuletz K. J., Ferguson M. C., Hurley B., Gall A. E., Labunski E. A., Morgan T. C. (2015). Seasonal spatial patterns in seabird and marine mammal distribution in the eastern Chukchi and western Beaufort seas: Identifying biologically important pelagic areas. Prog. Oceanogr. 136, 175–200. doi: 10.1016/j.pocean.2015.05.012
Kuletz K., Speckman S., Piatt J., Labunski E. (2011). Distribution, population status and trends of Kittlitz’s murrelet Brachyramphus brevirostris in lower Cook Inlet and Kachemak Bay, Alaska. Mar. Ornithol. 39, 85–95. Available at: http://www.marineornithology.org/PDF/39_1/39_1_85-95.pdf.
Leirness J., Adams J., Ballance L., Coyne M., Felis J., Joyce T., et al. (2021). Modeling at-sea density of marine birds to support renewable energy planning on the Pacific outer continental shelf of the contiguous United States. (Camarillo, CA: U.S. Department of the Interior, Bureau of Ocean Energy Management). OCS Study BOEM 2021-014, 385.
Omori K., Thorson J. (2022). Identifying species complexes based on spatial and temporal clustering from joint dynamic species distribution models. ICES J. Mar. Sci.79, 677–688. doi: 10.1093/icesjms/fsac015
Ovaskainen O., Abrego N., Halme P., Dunson D. (2016). Using latent variable models to identify large networks of species-to-species associations at different spatial scales. Methods Ecol. Evol.7, 549–555. doi: 10.1111/2041-210X.12501
Pearson S., Keren I., Hodum P., Drummond B., Hipfner M., Rojek N., et al. (2023). Range-wide changes in the North American Tufted Puffin Fratercula cirrhata breeding population over 115 years. Bird Conservation International 33, E24. doi: 10.1017/S0959270922000193
Petersen J., Nelson D., Marcella T., Michel J., Atkinson M., White M., et al. (2019). Environmental Sensitivity Index Guidelines, Version 4.0. NOAA Tech. Memo. NOS OR&R 52 (4), 9–38.
Piatt J. (1994). Monitoring seeabird populations in areas of oil and gas development on the Alaskan continental shelf: oceanic, shelf and coastal seabird assemblages at the mouth of a tidally-mixed estuary (Anchorage, Alaska: National Biological Survey, Minerals Management Service).
Piatt J. (2002). Response of seabirds to fluctuations in forage fish density. Ed. Piatt J. F. (Anchorage, AK: USGS Final Report to Exxon Valdez Oil Spill Trustee Council and Minerals Management Service), 406.
Piatt J. F., Parrish J. K., Renner H. M., Schoen S. K., Jones T. T., Arimitsu M., et al. (2020). Extreme mortality and reproductive failure of common murres resulting from the northeast Pacific marine heatwave of 2014-2016. PLoS One 15, e0226087. doi: 10.1371/journal.pone.0226087
Piatt J., Douglas D., Arimitsu M., Kissling M., Madison E., Schoen S., et al. (2021). Kittlitz’s murrelet seasonal distribution and post-breeding migration from the Gulf of Alaska to the Arctic ocean. Arctic 74, 482–495. doi: 10.14430/arctic73992
Piatt J., Kitaysky A. (2002). “Tufted puffin (Fratercula cirrhata),” in The birds of north America. Eds. Poole A., Gill F.(Philadelphia, PA: Cornell Laboratory of Ornithology), 1–31.
Piatt J. F., Springer A. M. (2007). “Marine ecoregions of Alaska,” in Long-term ecological change inthe northern Gulf of Alaska. Ed. Spies R. (Amsterdam: Elsevier), 522–526.
R Core Team (2021). R: A language and environment for statistical computing (Vienna, Austria: R Foundation for Statistical Computing). Available at: https://www.R-project.org/.
Renner M., Parrish J., Piatt J., Kuletz K., Edwards A., Hunt G. (2013). Modeled distribution and abundance of a pelagic seabird reveal trends in relation to fisheries. Mar. Ecol. Prog. Ser. 484, 259–277. doi: 10.3354/meps10347
Renner M., Kuletz K. (2015). A spatial-seasonal analysis of the oiling risk from shipping traffic to seabirds in the Aleutian Archipelago. Mar. Pollut. Bull. 101, 127–136. doi: 10.1016/j.marpolbul.2015.11.007
Schoen S., Arimitsu M., Marsteller C., Piatt J. (2022). Lingering impacts of the 2014-2016 northeast Pacific marine heatwave on seabird demography in Cook Inlet, Alaska. Mar. Ecol. Prog. Ser. doi: 10.3354/meps14177
Shaffer S., Tremblay Y., Weimerskirch H., Scott D., Thompson D., Sagar P. M., et al. (2006). Migratory shearwaters integrate oceanic resources across the Pacific ocean in an endless summer. Proc Natl Acad Sci U S A 103, 12799–12802. doi: 10.1073/pnas.0603715103
Speckman S., Piatt J., Mintevera C., Parrish J. (2005). Parallel structure among environmental gradients and three trophic levels in a subarctic estuary. Prog. Oceanogr. 66, 25–65. doi: 10.1016/j.pocean.2005.04.001
Tasker M., Jones P. H., Dixon T., Blake B. (2009). Counting seabirds at sea from ships: A review of methods employed and a suggestion for a standardized approach. Auk 101, 567–577.
Thorson J., Shelton A., Ward E., Skuag H. (2015). Geostatistical delta-generalized linear mixed models improve precision for estimated abundance indices for West Coast groundfishes. ICES J. Mar. Sci. 72, 1297–1310. doi: 10.1093/icesjms/fst048
Thorson J. T. (2019). Guidance for decisions using the vector autoregressive spatio-temporal (VAST) package in stock, ecosystem, habitat and climate assessments. Fish. Res. 210, 143–161. doi: 10.1016/j.fishres.2018.10.013
Thorson J., Ianelli J., Larsen E., Ries L., Scheuerell M., Szuwalski C., et al. (2016). Joint dynamic species distribution models: a tool for community ordination and spatio-temporal monitoring. Glob. Ecol. Biogeogr. 25, 1144–1158. doi: 10.1111/geb.12464
USFWS (2021). Birds of conservation concern 2021 migratory bird program. (Washington DC: U.S. Fish and Wildlife Service), 48.
Veit R., McGowan J., Ainley D., Wahls T., Pyle P. (1997). Apex marine predator declines ninety percent in association with changing oceanic climate. Glob. Change Biol. 3, 23–28. doi: 10.1046/j.1365-2486.1997.d01-130.x
Warwick V., Santora J., Waggitt J., Trathan P. (2021). Multi-scale assessment of distribution and density of procellariform seabirds within the Northern Antarctic Peninsula marine ecosystem. ICES J. Mar. Sci. 78, 1324–1339. doi: 10.1093/icesjms/fsab020
Winship A., Kinlan B., White T., Leirness J., Christensen J. (2018). Modeling At-Sea density of marine birds to support Atlantic marine renewable energy planning. (Silver Spring, MD: U.S. Department of Commerce. Bureau of Ocean Energy Management). OCS Study BOEM 2018-010, 67.
Yen P. P.-W., Sydeman W. J., Morgan K. H., Whitney F. A. (2005). Top predator distribution and abundance across the Eastern Gulf of Alaska: Temporal variability and ocean habitat associations. Mar. Ecol. 52, 799–822. doi: 10.1016/j.dsr2.2004.12.018
Zador S., Parrish J., Punt A., Burke J., Fitzgerald S. (2008). Determining spatial and temporal overlap of an endangered seabird with a large commercial trawl fishery. Endanger. Species Res. 5, 103–115. doi: 10.3354/esr00152
Keywords: species distribution models (SDM), marine bird distribution, marine bird surveys, detection factor, decadal scale change, Cook Inlet, Alaska, Gulf of Alaska
Citation: Arimitsu ML, Piatt JF, Thorson JT, Kuletz KJ, Drew GS, Schoen SK, Cushing DA, Kroeger C and Sydeman WJ (2023) Joint spatiotemporal models to predict seabird densities at sea. Front. Mar. Sci. 10:1078042. doi: 10.3389/fmars.2023.1078042
Received: 24 October 2022; Accepted: 06 January 2023;
Published: 31 January 2023.
Edited by:
Angel Borja, Marine Research Division, Technology Center Expert in Marine and Food Innovation (AZTI), SpainReviewed by:
Rui Martins, University of Lisbon, PortugalCopyright © 2023 Arimitsu, Piatt, Thorson, Kuletz, Drew, Schoen, Cushing, Kroeger and Sydeman. This is an open-access article distributed under the terms of the Creative Commons Attribution License (CC BY). The use, distribution or reproduction in other forums is permitted, provided the original author(s) and the copyright owner(s) are credited and that the original publication in this journal is cited, in accordance with accepted academic practice. No use, distribution or reproduction is permitted which does not comply with these terms.
*Correspondence: Mayumi L. Arimitsu, bWFyaW1pdHN1QHVzZ3MuZ292
†Present address: Caitlin Kroeger, San Jose State University (SJSU) Research Foundation, Moss Landing Marine Labs, Moss Landing, CA, United States
Disclaimer: All claims expressed in this article are solely those of the authors and do not necessarily represent those of their affiliated organizations, or those of the publisher, the editors and the reviewers. Any product that may be evaluated in this article or claim that may be made by its manufacturer is not guaranteed or endorsed by the publisher.
Research integrity at Frontiers
Learn more about the work of our research integrity team to safeguard the quality of each article we publish.