
95% of researchers rate our articles as excellent or good
Learn more about the work of our research integrity team to safeguard the quality of each article we publish.
Find out more
ORIGINAL RESEARCH article
Front. Mar. Sci. , 19 June 2023
Sec. Coastal Ocean Processes
Volume 10 - 2023 | https://doi.org/10.3389/fmars.2023.1070217
 Lucy Carruthers1*
 Holly East1Vasile Ersek1Andrew Suggitt1
 Millie Campbell1Kara Lee1Victoria Naylor2
 Dominic Scurrah1
 Liam Taylor2,3
Low-lying coral reef islands have been projected to become uninhabitable by the end of the century due to sea level rise, but such projections of vulnerability assume that reef islands are static landforms that flood incrementally with sea level rise. In fact, GIS-based reef island shoreline analyses have demonstrated that reef islands are highly dynamic landforms that may adjust their shorelines in response to changing environmental conditions. However, the vast majority of reef island shoreline analyses have been undertaken in the Pacific Ocean, leaving our understanding of changes in the Indian Ocean more limited. Further, our knowledge of how island dynamics can impact groundwater resources is restricted due to the assumption that islands will exhibit purely erosional responses to sea level rise. Here, we analyse shoreline evolution on 49 reef islands over a 50-year timeframe in Huvadhoo Atoll, Maldives. Additionally, rates of shoreline change were used to undertake numerical modelling of shifts in freshwater lens volume in 2030, 2050 and 2100 in response to changes in recharge. Despite sea level rising at 4.24 mm/year (1969-2019), accretion was prevalent on 53% of islands, with the remaining islands eroding (25%) or remaining stable (22%). Average net shoreline movement was 4.13 m, ranging from -17.51 to 65.73 m; and the average rate of shoreline change (weighted linear regression) was 0.13 m/year, ranging from -0.07 to 2.65 m/year. The magnitudes and rates of reef island evolution were found to be highly site-specific, with island type found to be the only significant predictor of either net shoreline movement or weighted linear regression. Results suggest that freshwater lens volume was substantially impacted by shoreline change compared to changes in recharge whereby accretion and erosion led to large increases (up to 65.05%) decreases (up to -50.4%) in les volume, respectively. We suggest that the capacity of reef islands to both (1) adjust their shorelines, and even accrete, under conditions of sea level rise; and (2) increase their storage of groundwater over the coming decades represents highly valuable geomorphic ecosystem services.
Coral reef islands are low-lying landforms (< 3 m above sea level) constructed from unconsolidated sediment, generated by carbonate-producing organisms within the surrounding marine environments (Stoddart and Steers, 1977; Perry et al., 2011). Reef islands provide a crucial geomorphic ecosystem service as they are the only habitable land within atoll nations, such as Kiribati, Tuvalu, the Marshall Islands and the Maldives (Kench et al., 2015). Moreover, these islands have the capacity to store groundwater as a freshwater lens, a layer of freshwater that floats on top of denser seawater. This storage of freshwater represents a highly valuable ecosystem service as groundwater is a vital source of freshwater for island communities (Bailey et al., 2009; White and Falkland, 2010; Werner et al., 2017). In the absence of fresh groundwater, island inhabitants typically rely either on costly and energy-intensive desalination, and/or on rainwater harvesting as sources of freshwater. However, increasing rainfall variability due to climate change can lead to tanks being depleted (Ministry of Environment, 2020). In addition to changes in rainfall patterns, coral reef islands are considered amongst the most vulnerable environments to many aspects of climate change, and in particular, to sea level rise because of their small size and low-lying elevations (Woodroffe, 2008; Webb and Kench, 2010; Perry et al., 2011; Kench et al., 2015; Kench et al., 2018). By 2100, sea level is projected to rise globally between 0.43 m and 0.83 m under low and high CO2 emission scenarios, respectively (IPCC, 2019). Such increases in sea level have been projected to render reef islands unhabitable by the end of the century due to shoreline erosion, flooding and inundation (Storlazzi et al., 2015; Storlazzi et al., 2018; Bramante et al., 2020; Scott et al., 2020; Masselink et al., 2021). Furthermore, erosion of island shorelines can lead to water scarcity for island inhabitants as a decrease in island width can reduce the size of the freshwater lens (Chui and Terry, 2012; Oberle et al., 2017). As a result, such environmental changes could create the first generation of environmental refugees attributed to climate change (Myers, 2002; Carrington et al., 2018).
There is a growing body of research that questions the paradigm of islands being static landforms that will erode and inundate incrementally with sea level rise. Rather, studies have demonstrated that over millennial timescales, reef islands can adjust to sea level rise and are geomorphically dynamic (Woodroffe et al., 2000; McKoy et al., 2010; Kench et al., 2014; East et al., 2018). Similarly, over decadal timescales, GIS-based analyses of shoreline change have highlighted the highly dynamic nature of reef islands and their apparent physical resilience to erosion (Fletcher et al., 2003; Webb and Kench, 2010; Biribo and Woodroffe, 2013; Yates et al., 2013; Duvat and Pillet, 2017; Duvat et al., 2017). For example, the first of such studies, by Webb and Kench (2010), investigated reef island shoreline change across a multi-decadal time scale and provided new perceptions of island stability. Despite a 2 mm/year sea level rise over the time period (1944-2006), 86% of the 27 atoll islands remained stable or accreted. Likewise, at Wotje Atoll in the Marshall Islands, Ford (2013) analysed 52 islands from 1945 to 2012 and found that 69% accreted and 31% eroded. More recently, in Takapoto Atoll in French Polynesia, Duvat and Pillet (2017) studied 49 islands from 1969-2013 and observed 41% remained stable, 26% eroded and 33% accreted.
GIS-based spatial analyses of reef island shoreline change have increased in frequency across the Pacific Ocean with a total of 770 islands analysed across 15 studies (Collen et al., 2009; Webb and Kench, 2010; Rankey, 2011; Ford, 2012; Biribo and Woodroffe, 2013; Ford, 2013; Le Cozannet et al., 2013; Yates et al., 2013; Ford and Kench, 2015; Kench et al., 2015; Mann and Westphal, 2016; Duvat and Pillet, 2017; Duvat et al., 2017; Kench et al., 2018; Sengupta et al., 2021). Thus far, there have only been four studies in the Indian Ocean (Duvat, 2019) across the Chagos Archipelago (Hamylton and East, 2012; Purkis et al., 2016), Scattered Islands (Testut et al., 2016) and Maldives (Aslam and Kench, 2017). Aslam and Kench (2017) quantified shoreline change within Huvadhoo Atoll, Maldives, by analysing planform changes on 184 islands between 1969 and 2004/2006. They found islands behaved differently compared to the accreting islands in the Pacific, as 45% of islands decreased in size, 40% remained stable and 15% accreted. Additionally, a relationship between island size and geomorphic response was identified as smaller islands (< 10 ha) eroded whereas larger islands accreted.
Collectively, such studies of reef island shoreline change are critical for atoll nations as results can be used to infer future landform trajectories and national vulnerability assessments by informing decision-making in island planning and management. Yet, analyses of the controls on shoreline change have, to date, been limited, which compromises our ability to determine the types of islands that are most likely to be stable or mobile in the next decades to centuries. Of the few studies that do quantitatively analyse controls on morphological change, island size is prominent (Duvat, 2019). For example, Duvat and Pillet (2017) and Duvat et al. (2017) found that smaller islands (< 5 ha) were associated with higher rates and magnitudes of shoreline change. However, Ford (2013) observed that smaller islands (< 5 ha) displayed the lowest magnitude of change (average net shoreline movement 0.74 m) compared to larger islands (> 5 ha). In contrast, Webb and Kench (2010) found no significant relationship between island size and shoreline change. While island size is typically examined, Kench and Brander (2006) discovered a relationship between island shape and shoreline change when investigating the response of island shorelines to seasonal oscillations in the Maldives. Their findings suggested that greatest morphodynamic change occurred on circular islands due to the circular nature of both island and reef platform wave focusing patterns adjust quickly following slight changes in wave exposure. Together, these studies demonstrate how controls on island change vary spatially and that there are evidently multiple controls on reef island shoreline evolution.
Another method utilized in reef island research is groundwater resource modelling, which is an approach that enables investigations into the impacts of climate change on the freshwater lens. Improving such knowledge is important for water resources planning and management as it can infer on which islands communities could be at risk from water scarcity. Numerous studies have modelled the impacts of many aspects of climate change (e.g. sea level rise, tropical cyclones, over wash events and changes in rainfall) on freshwater lenses through numerical or analytical methods (Bailey et al., 2009; Chui and Terry, 2012; Terry and Chui, 2012; Chui and Terry, 2013; Ketabchi et al., 2014; Morgan and Werner, 2014), including in the Maldives (Bailey et al., 2014; Alsumaiei and Bailey, 2018a; Alsumaiei and Bailey, 2018b). Thus far, studies have assumed that all islands will erode when encountered with prospective sea level rise. For instance, Alsumaiei and Bailey (2018a) quantified the response of freshwater lenses in the Maldives to sea level rise. By 2050, under sea level rise scenarios of 1, 3.5 and 6.5 mm/year, islands with a gentle beach slope (0.5%) were to experience shoreline erosion of 8, 28 and 52 m respectively and islands with a steeper slope (2%) 2, 7 and 13m of erosion respectively. As such, their findings showed that by 2050 the freshwater lenses in small islands (< 0.6 km2) reduced in volume between 11% and 36% and in larger islands (> 1.0 km2) between 8% and 26%. However, findings from GIS-based shoreline change research have shown that islands are dynamic and can undergo several modes of change when faced with increasing sea levels (Webb and Kench, 2010; Aslam and Kench, 2017; Duvat, 2019). To date, knowledge of the varying modes of reef island shoreline change has not been integrated into groundwater resource modelling. Analyses of groundwater resource modelling alongside data on reef island dynamics can provide a more realistic and holistic understanding of future groundwater security.
Here, we present new insights into multidecadal shoreline change in Huvadhoo Atoll, Maldives, and their impact on groundwater. This study is the first to investigate multiple environmental variables (island type, area, shape, wave exposure) which could be influencing the observed shoreline changes in Huvadhoo Atoll; and is also the first to use the results of shoreline change analyses to estimate future groundwater resource trajectories in response to changes in recharge and sea level. Historical aerial imagery and satellite images from a total of 49 islands were analysed over a 50-year time period (1969-2019). Specific research objectives were to (1) quantify the morphological change of coral reef islands over 50 years; (2) examine the relationship between the magnitude and rate of change and various variables including island size, shape, type and wave exposure; and (3) analyse how island dynamics could affect groundwater resources for island communities. We highlight that the capacity of reef islands to adjust their shorelines and even accrete, under conditions of sea level rise represents a highly valuable geomorphic ecosystem service. Additionally, the ability of islands to store groundwater, despite variations in environmental change, represents an additional geomorphic ecosystem service that offers hope for the future habitability of reef islands.
The Maldives is a 900 km-long archipelago (Naseer and Hatcher, 2004) that extends from 6°57 ´N to 0°34 ´S and is situated in the central Indian Ocean (Figure 1) (Kench and Brander, 2006). It consists of 16 atolls, five oceanic faros and four oceanic platform reefs, incorporating 2,041 reef structures with a total area of 4,494 km2 (Naseer and Hatcher, 2004). The Maldivian landmass is comprised of 1,190 coral reef islands, that are mid- to late Holocene in age, with a total area of 227.45 km2 (Naseer and Hatcher, 2004; Kench et al., 2005; East et al., 2018). It is the lowest nation on Earth (< 1.5 m above mean sea level; MEE, 2017) and is, therefore, typically considered extremely vulnerable to the effects of climate change, particularly sea level rise (ref). This study is focused on Huvadhoo Atoll, which is located in the southern Maldives (0°32 ´N, 73°17 ´E) and is the nation’s largest atoll at approximately 60 km wide, 80 km in length and with an area of 3279 km2 (Naseer and Hatcher, 2004). The atoll rim is discontinuous, with channels between the atoll rim platforms allowing ocean waves and currents to propagate across the lagoon, which has a depth of 80 m. The atoll has 241 reefs, with a combined area of 437.9 km2 (Naseer and Hatcher, 2004).
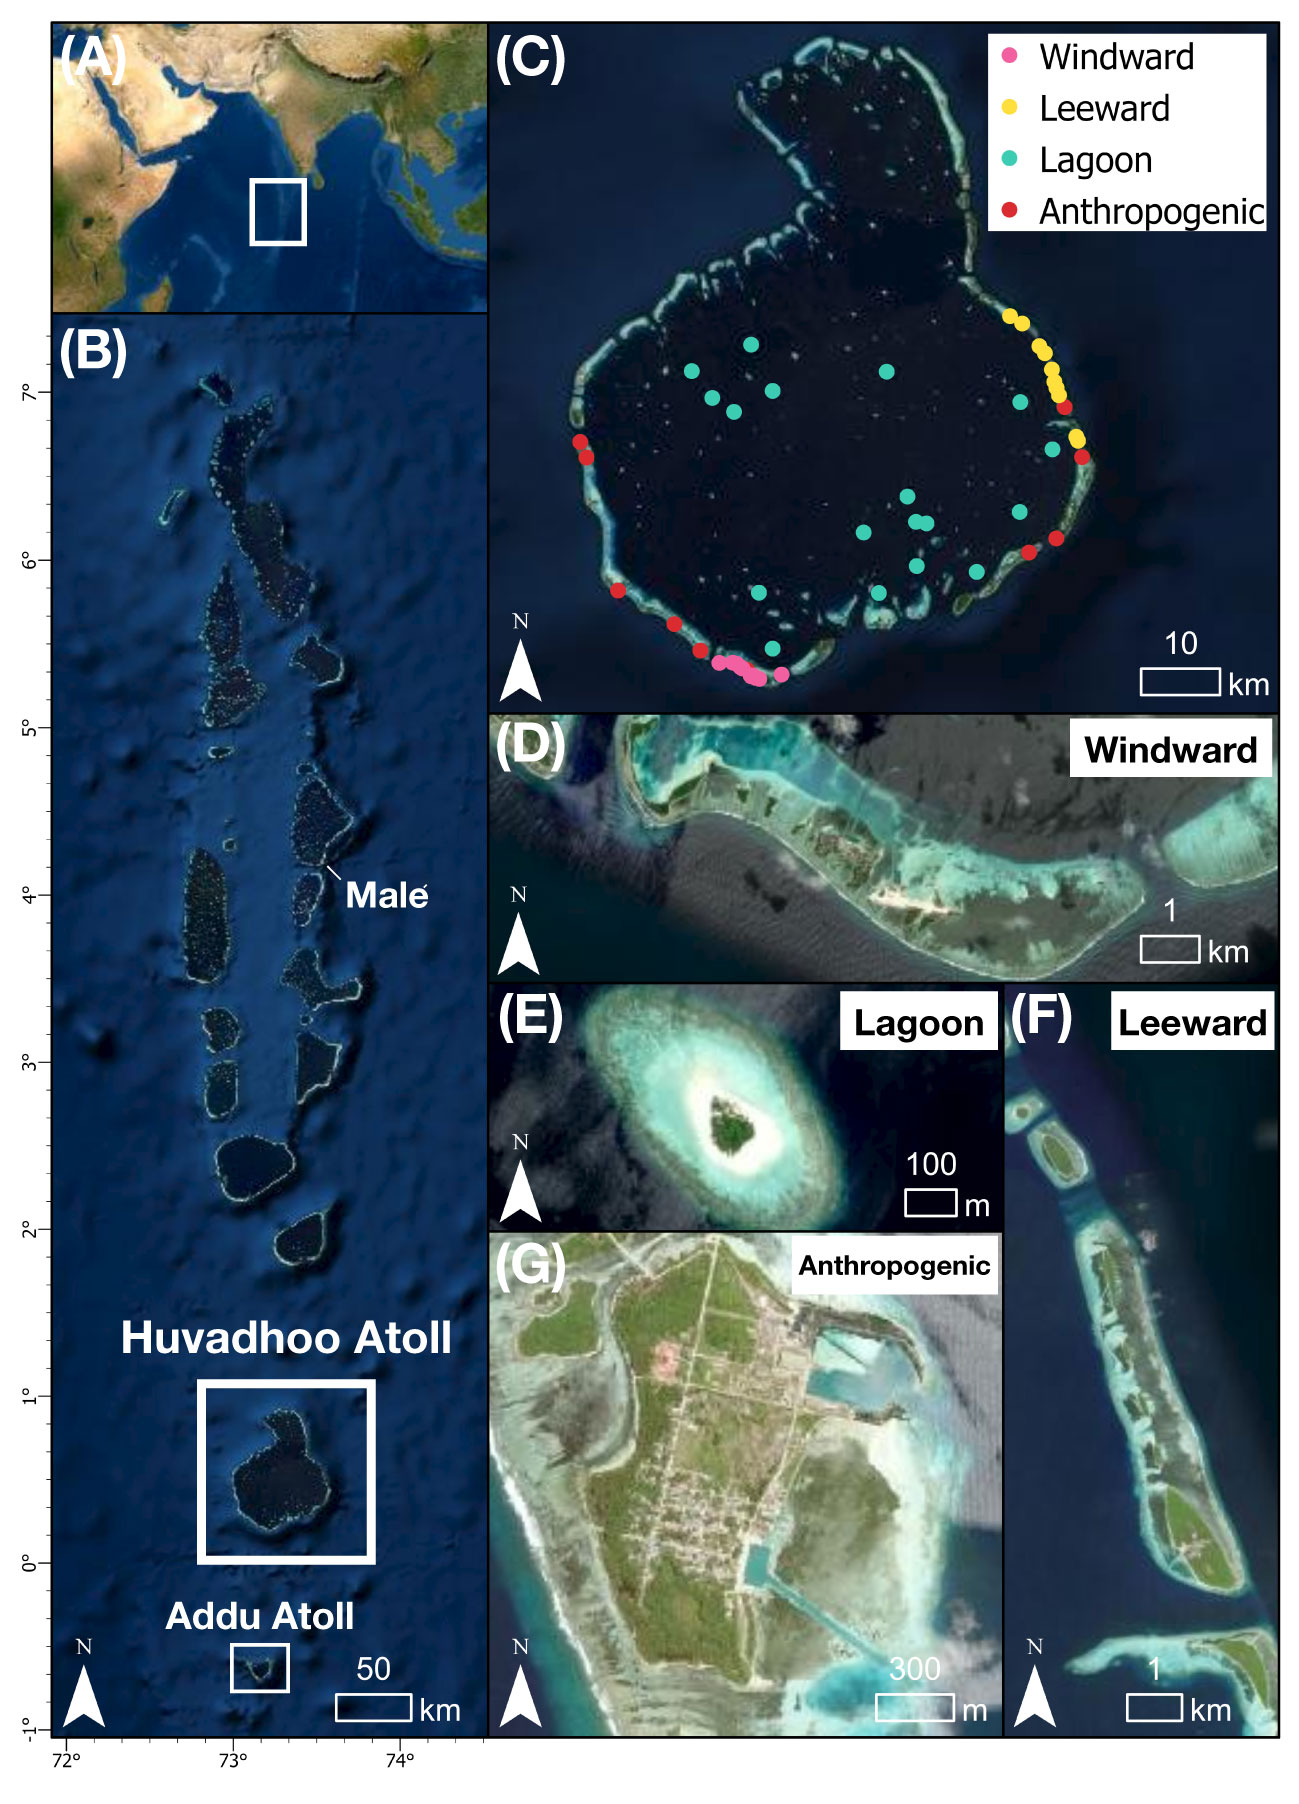
Figure 1 (A) Location of the Maldives within the Indian Ocean, (B) the Maldives, (C) the four different island types in Huvadhoo Atoll, (D) an example of islands on the windward rim, (E) a lagoon island, (F) example of islands on the leeward rim; and (G) an anthropogenic island (Imagery source: www.esri.com).
The climate in the Maldives can be divided into two distinct monsoon periods, Hulhangu and Iruvai, which are marked by strong seasonal reversals in wind direction (Kench and Brander, 2006). The Hulhangu monsoon period takes place in April to November and is characterised by west to northwest wind directions with a mean wind speed of 5.1 m s-1. The Iruvai monsoon takes place during December to March and is characterised by east to northeast wind directions with a mean wind speed of 4.9 m s-1 (Kench and Brander, 2006). Oceanic swell waves advance from a south-easterly direction between November and March with a mean wave significant height (Hs) of 0.75 m and a south to south-westerly direction between April and November with a peak wave height of 1.8 m in July (Young, 1999). Thus, wave energies between November and March are greater than those between April and November. WaveWatch III model hindcasts for the time period 1979 – 2010 found that wave height and wave period (TO) were significantly higher and longer at windward sites (Hs = 1.6 ± 0.4 m, TO = 10.0 ± 1.6 s) compared to leeward sites (Hs = 1.4 ± 0.4 m, TO = 9.7 ± 1.5 East et al., 2018).
Sea level trends vary spatially within the Maldives as tide gauge records from 1987 to 2014 for Malé Atoll in the central Maldives show an increase of 3.2 mm/year, whereas Addu Atoll in the south shows an increase in sea level of 4.0 mm/year (Caldwell et al., 2015). However, NASA satellite data for Malé and Addu Atolls from 1993 to 2019 suggest sea level was rising 4.12 ± 1.22 mm/year and 3.07 ± 0.97 mm/year respectively (NASA, 2022). In Huvadhoo Atoll, sea level reconstructions from fossil coral microatolls indicate that sea level is rising by approximately 4.24 mm/year (Kench et al., 2020). Huvadhoo Atoll experiences a mean spring tide of 0.96 m and the tidal regime is semi-diurnal tidal with strong diurnal inequality (Wadey et al., 2017; Kench et al., 2022).
A total of 49 islands were analysed across Huvadhoo Atoll with 31 islands on the atoll rim (islands on the atoll periphery) and 18 located within the atoll lagoon. Islands were categorised into four different types (Figure 1): (1) lagoon (n = 18) islands are those located on reef platforms within atoll lagoons; (2) leeward rim (n = 10) and (3) windward rim (n = 11) islands, based on their exposure to open ocean swell whereby windward islands were located on the south-western atoll rim and leeward islands were located on the northern-eastern atoll rim and; (4) anthropogenic (n = 10) islands were those with human modifications to their shorelines, such as land reclamation, harbours and coastal development. As such, these categories represented the variety of islands within the Maldives.
Shoreline change positions were derived from black and white historical imagery taken by the Royal Air Force from 1969, and high-resolution Google Earth satellite imagery from between 2006 and 2019 (Table 1) (Testut et al., 2016). Imagery from 1969 was scanned from hard copies or negatives at minimum resolution of 900 dpi and had a scale of<1:25,000 (Aslam and Kench, 2017). Satellite images were georeferenced in ArcMap 10.5, using fixed natural (e.g., coral reefs and beach rock) and anthropogenic (e.g., corners of roads and corners of buildings) features as control points that were readily identifiable in both the source image and image undergoing georeferencing (Yates et al., 2013; Aslam and Kench, 2017).
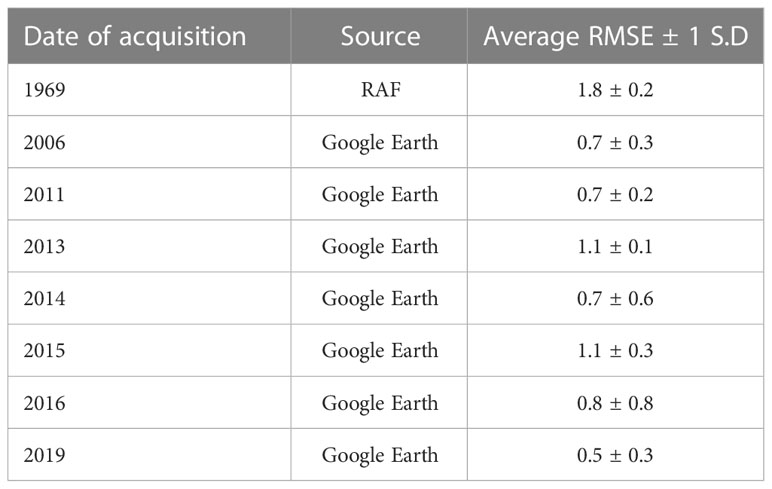
Table 1 Characteristics of imagery used and RMSE ± 1 S.D for each shoreline year.
The first stage in shoreline analysis was to establish a shoreline proxy. Shoreline proxies are indicators used to assess shoreline and island change (Duvat et al., 2017), such as the high-water line, base of the beach, debris line, edge of coastal structures, mean high water line and vegetation line (Biribo and Woodroffe, 2013). Following previous reef island shoreline change research, this study used the vegetation line as the shoreline proxy owing to its ability to be readily identified in all sources of imagery (Webb and Kench, 2010; Ford, 2013; Mann and Westphal, 2016; Aslam and Kench, 2017). The vegetation line was digitized for all images and saved as a shapefile in ArcMap 10.5. Shoreline change was analysed using the Digital Shoreline Analysis System (DSAS), which is available as an ArcGIS extension (Thieler et al., 2009). DSAS uses a baseline to calculate shoreline change metrics based on transects cast at 5 m intervals along the shoreline and a confidence interval of 2σ (95%) was applied when determining shoreline change rates (Thieler and Danforth, 2016). Two shoreline change metrics were selected for this study. Firstly, net shoreline movement (NSM, m) was calculated, which is a measure of the net change between the oldest and most recent shoreline year (Ford, 2012; Thieler and Danforth, 2016; Sengupta et al., 2021). Secondly, weighted linear regression (WLR, m/year) was calculated as a rate of change shoreline statistic where a greater emphasis is placed on data points where the position uncertainty is smaller (Thieler and Danforth, 2016). Consequently, shorelines with a higher degree of uncertainty have less influence on the WLR than those with lower uncertainty, and it thus provides a robust measure of shoreline change (Ford, 2012).
When analysing shoreline change from aerial photography and satellite imagery, errors and uncertainties were quantified. Three potential sources of error were identified: image resolution (pixel size), georeferencing and shoreline digitization (Ford, 2012; Duvat et al., 2017). Georeferencing error, the root mean square (RMS) value ArcGIS records during georeferencing, ranged from 0.0 m to 2.7 m. Image resolution error is the pixel size of each image, which ranged from 0.2 m to 5.0 m. Digitizing error was calculated as the average of digitizing the same strip of coastline by the operator 10 times and calculating the width at the widest points. Errors ranged from 0.2 m to 1.0 m for shoreline digitization, and an average was calculated as 0.54 m. An overall measure of uncertainty was then calculated as the square root of the sum of each individual uncertainty squared (RMSE). RMSE was calculated for 1969, 2006, 2011, 2013, 2014, 2015, 2016 and 2019 for each island shoreline and varied from ± 0.3 m to 4.2 m. Table 1 displays the average RMSE ± 1 S.D for each shoreline year. Islands that were considered eroding had values lower than average RMSE, and islands that were accreting had values higher than average RMSE. Islands that were classified as stable lied within the ± average RMSE boundary.
Island area was calculated in 2019, and the shape of an island was converted into a numerical value by dividing the width of an island by its length. Circular islands resulted in a value closer to 1.0 and elongated islands were less than or greater than 1.0. Island area and shape data for all 39 islands can be found in Supplementary Table 1.
Wave exposure was modelled as a function of wind speed, wind direction and fetch length (i.e. the distance over open ocean that wind can travel unobstructed by land or reefs). The same protocols previously applied in reef environments were followed (Chollett and Mumby, 2012; Graham et al., 2015; Perry et al., 2015). Fetch lengths were calculated using the USGS model (Rohweder et al., 2012), which uses the procedure recommended by the Shoreline Protection Manual (U.S. Army Corps of Engineers, 1984). A binary raster was generated to represent the distribution of land masses and reef crests using the outputs of the Millennium Coral Reef Mapping Project (spatial resolution = 30 m2; Andréfouët et al., 2006). Fetch lengths were calculated every 22.5° (16 compass directions) as the arithmetic mean of 5 radials spread at 3° increments around the desired wind directions. Maximum fetch lengths were 650 km as this is the distance required for maximal wave conditions to be attained (Hill et al., 2010). Wind data from Kaadedhdhoo Airport (0.49°N, 73.00°E; n = 2643, 2014) were used to calculate both the probability of wind blowing from each of the 16 compass directions, and the mean wind velocities for each direction. Fetch lengths were then converted into wave exposures (Joules m-3) using established equations based on linear wave theory (Chollett and Mumby, 2012). To estimate the wave exposure associated with each island, data were extracted from the model from 8 compass directions off each reef platform and an average was calculated. Wave data for all 39 islands can be found in Supplementary Table 1.
The following steps were used to obtain estimates of groundwater depth and volume for 2030, 2050 and 2100. Annual precipitation for GDh. Kaadehdhoo island in 2019 was obtained from the 2020 Maldives Statistical Year Handbook (National Bureau of Statistics, 2021). Daily potential evapotranspiration was calculated using the Thornthwaite method (1948), as applied in (Bailey and Jenson, 2014; Bailey et al., 2014), and aquifer recharge was calculated using the Griggs and Peterson method (1993). Estimates of future island width were calculated using the width of each island from 2019 and the corresponding island’s average rate of shoreline change (weighted linear regression, m/year), resulting in widths for the years 2030, 2050 and 2100. By using each island’s average rate of shoreline change, we assume future sea level rise rates were similar to historical rates. These island widths were used to calculate the volume of the freshwater lens (Oude Essink, 2001). Firstly, the deepest position of the fresh-salt water interface was calculated.
where B is the width of the island (m), = 0.025, k is hydraulic conductivity and f is recharge (m/day). Once was calculated, the freshwater lens volume (V) was estimated.
where is effective porosity (m3/m).
For each island where horizontal hydraulic conductivity was 75 m/day (Bailey et al., 2014), effective porosity was 0.2 m3 m-3 (Anthony, 1987), and alpha was 0.025 (Oude Essink, 2001). Freshwater lens volumes were estimated based on changes in precipitation for 2030, 2050 and 2100, and under different emission scenarios for each time point (Relative concentrating pathway (RCP) 2.6, 4.5, 7.0 and 8.5). A summary table for changes in total precipitation relative to 1995-2014 for each time point, emission scenario and model output can be found in Supplementary Table 2. These estimates in total precipitation were obtained from the IPCC WG1 Interactive Atlas using CMIP6 dataset with advanced uncertainty (Gutiérrez et al., 2021). Supplementary Table 3 lists all 33 global climate models (GLMs) used in this analysis. The models used in the Atlas generate a range of statistical values therefore to reflect model output uncertainty. Volumes were generated based on the 5th percentile (P5), median and 95th percentile (P95) values (Gutiérrez et al., 2021).
Shoreline change was analysed by comparing changes in shoreline positions in historical aerial imagery from 1969 and satellite images from between 2006 and 2019 at Huvadhoo Atoll and results show varying patterns of shoreline change (Figure 2). Out of the 49 islands studied, 26 islands accreted (53%), 12 eroded (25%) and 11 remained stable (22%) (Table 2). Out of a total of 14,043 transects, 7,688 accreted (55%), 5,223 eroded (37%) and 1,133 exhibited no change (8%). Accretion dominated anthropogenic and lagoon islands whereby 90% and 61% accreted, respectively. Windward islands primarily accreted (37%) or remained stable (37%). A higher proportion of leeward islands underwent erosion (40%) or remained stable (40%). Overall, NSM was 4.13 ± 23.99 m and WLR was 0.13 ± 0.60 m/year, with anthropogenic islands displaying substantial rates and magnitudes of change (Table 3 and Figure 3). Upon exclusion of anthropogenic islands, which highly favour accretion due to land reclamation, 44% of islands accreted, 28% eroded and 28% remained stable. Shoreline change data for all 49 islands are provided in Supplementary Table 4.

Figure 2 Spatial trends in modes of change at Huvadhoo Atoll, Maldives (Imagery source: www.esri.com).
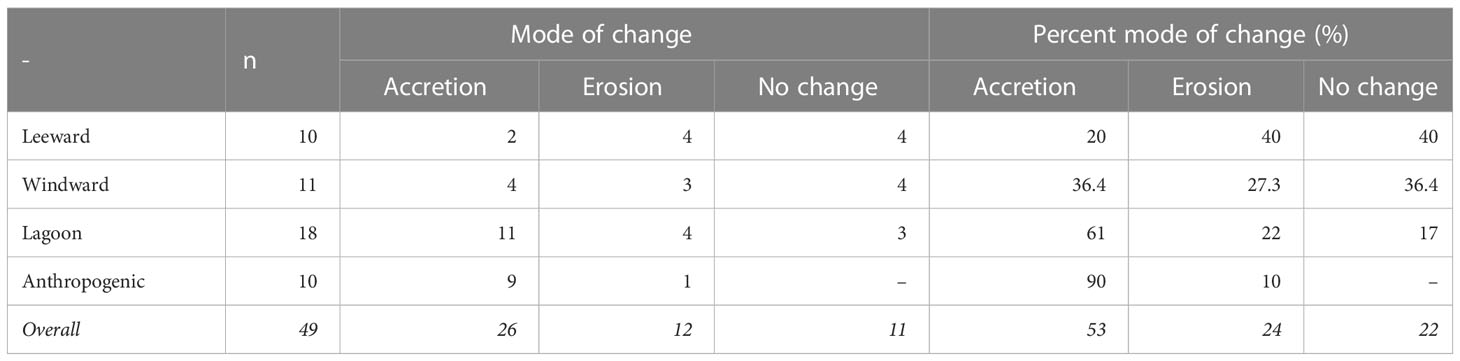
Table 2 Summary results of modes of change and percent mode of change (%) for each island type.
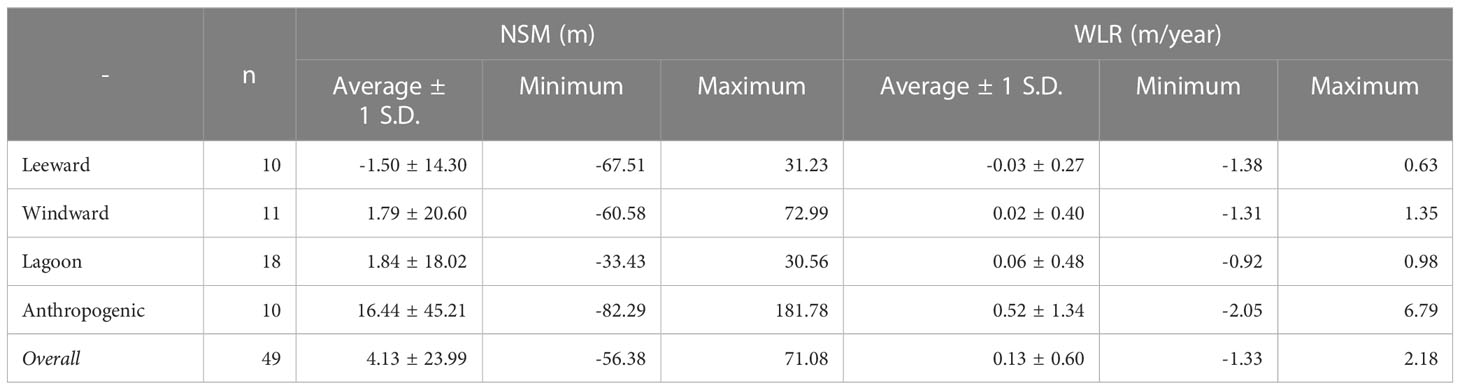
Table 3 Summary results of Net Shoreline Movement (m) and Weighted Linear Regression (m/year) for each island type from 1969 - 2019.
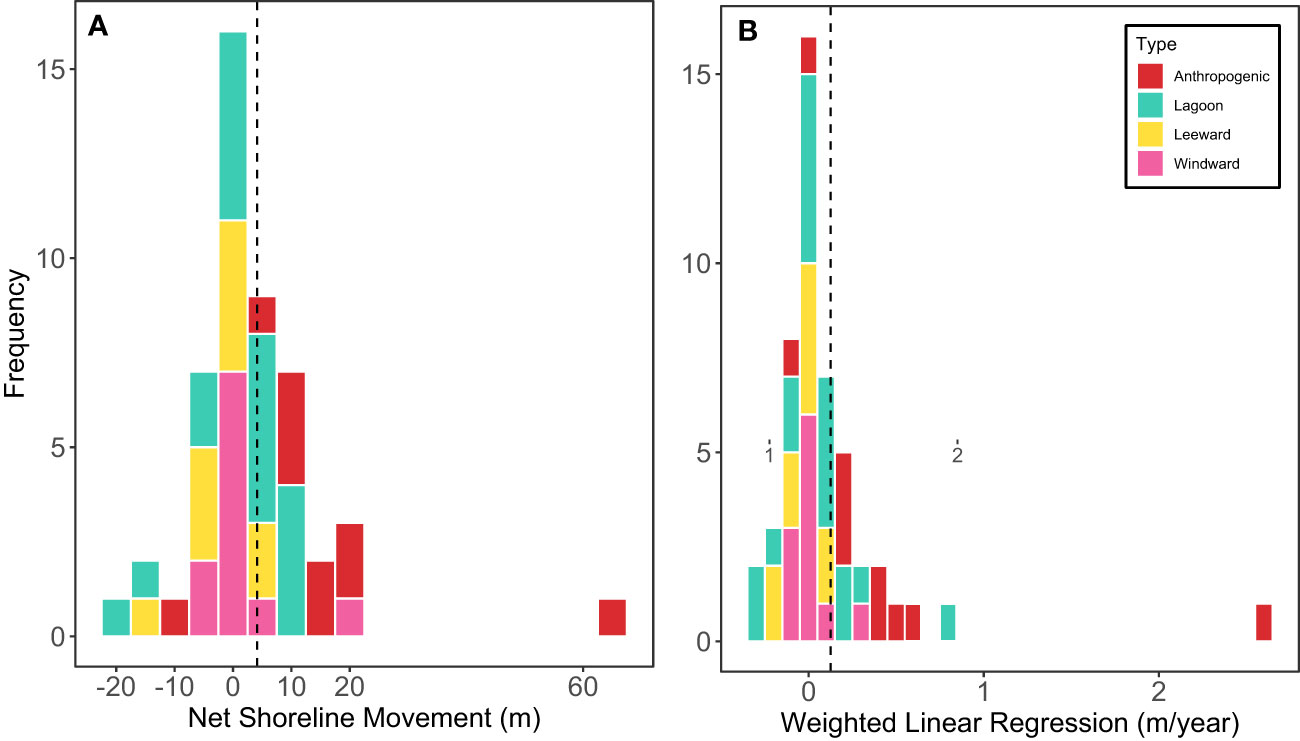
Figure 3 Histograms showing (A) the distribution of Net Shoreline Movement (m) amongst the different island types; and (B) the distribution of Weighted Linear Regression (m/year) amongst the different islands types. Dashed black line represents the mean.
The rate and magnitude of shoreline change varied substantially amongst the different island types. Anthropogenic islands displayed the highest magnitude and rate of island change with NSM of 16.44 ± 45.21 m and WLR of 0.52 ± 1.34 m/year, largely as a result of sediment input arising from land reclamation projects. Land reclamation was observed on nine anthropogenic islands, which included: the increase in island size, construction of passages between islands, and, in one case, the joining of islands. Moreover, eight islands experienced the construction of harbours, boat channels and sea walls. Substantial island development meant that large rates of shoreline change (up to 2.65 m/year) were observed over the study period. Land reclamation was observed on the lagoon side of all anthropogenic islands resulting in advancement of lagoon shorelines due to the constructions of harbours and artificial shorelines. Notably, one anthropogenic island eroded over the study period with NSM -8.30 ± 30.28 m and WLR -0.07 ± 0.60 m/year, although variation across monitoring transects was high. In terms of human modifications, it had the least developed shorelines with the construction of an airport and a harbour dredged into the reef flat. Morphological change is proceeding at greater magnitude and rate on anthropogenic islands compared to natural islands as lagoon islands displayed an NSM of 1.84 ± 18.02 m and WLR of 0.06 ± 0.48 m/year and windward islands had a NSM 1.79 ± 20.60 m and WLR 0.02 ± 0.40 m/year. However, leeward islands eroded throughout the 50-year time period by -1.50 m ± 14.30 m, at an erosional rate of -0.03 ± 0.27 m/year.
Table 4 describes the eight types of geomorphic change that were observed at Huvadhoo Atoll across the study period (Figures 4, 5). Notable types of adjustment include island migration upon the lagoonal reef platforms which was observed in 11 study islands. Further, advance of the lagoon shoreline was detected in nine study islands. Additionally, seven islands underwent parallel migration, five of which were leeward islands. Overall, lagoon shorelines underwent greater magnitudes of geomorphic change with 10 islands exhibiting morphological change on their lagoon shorelines whereas ocean shoreline change was only observed on five islands.
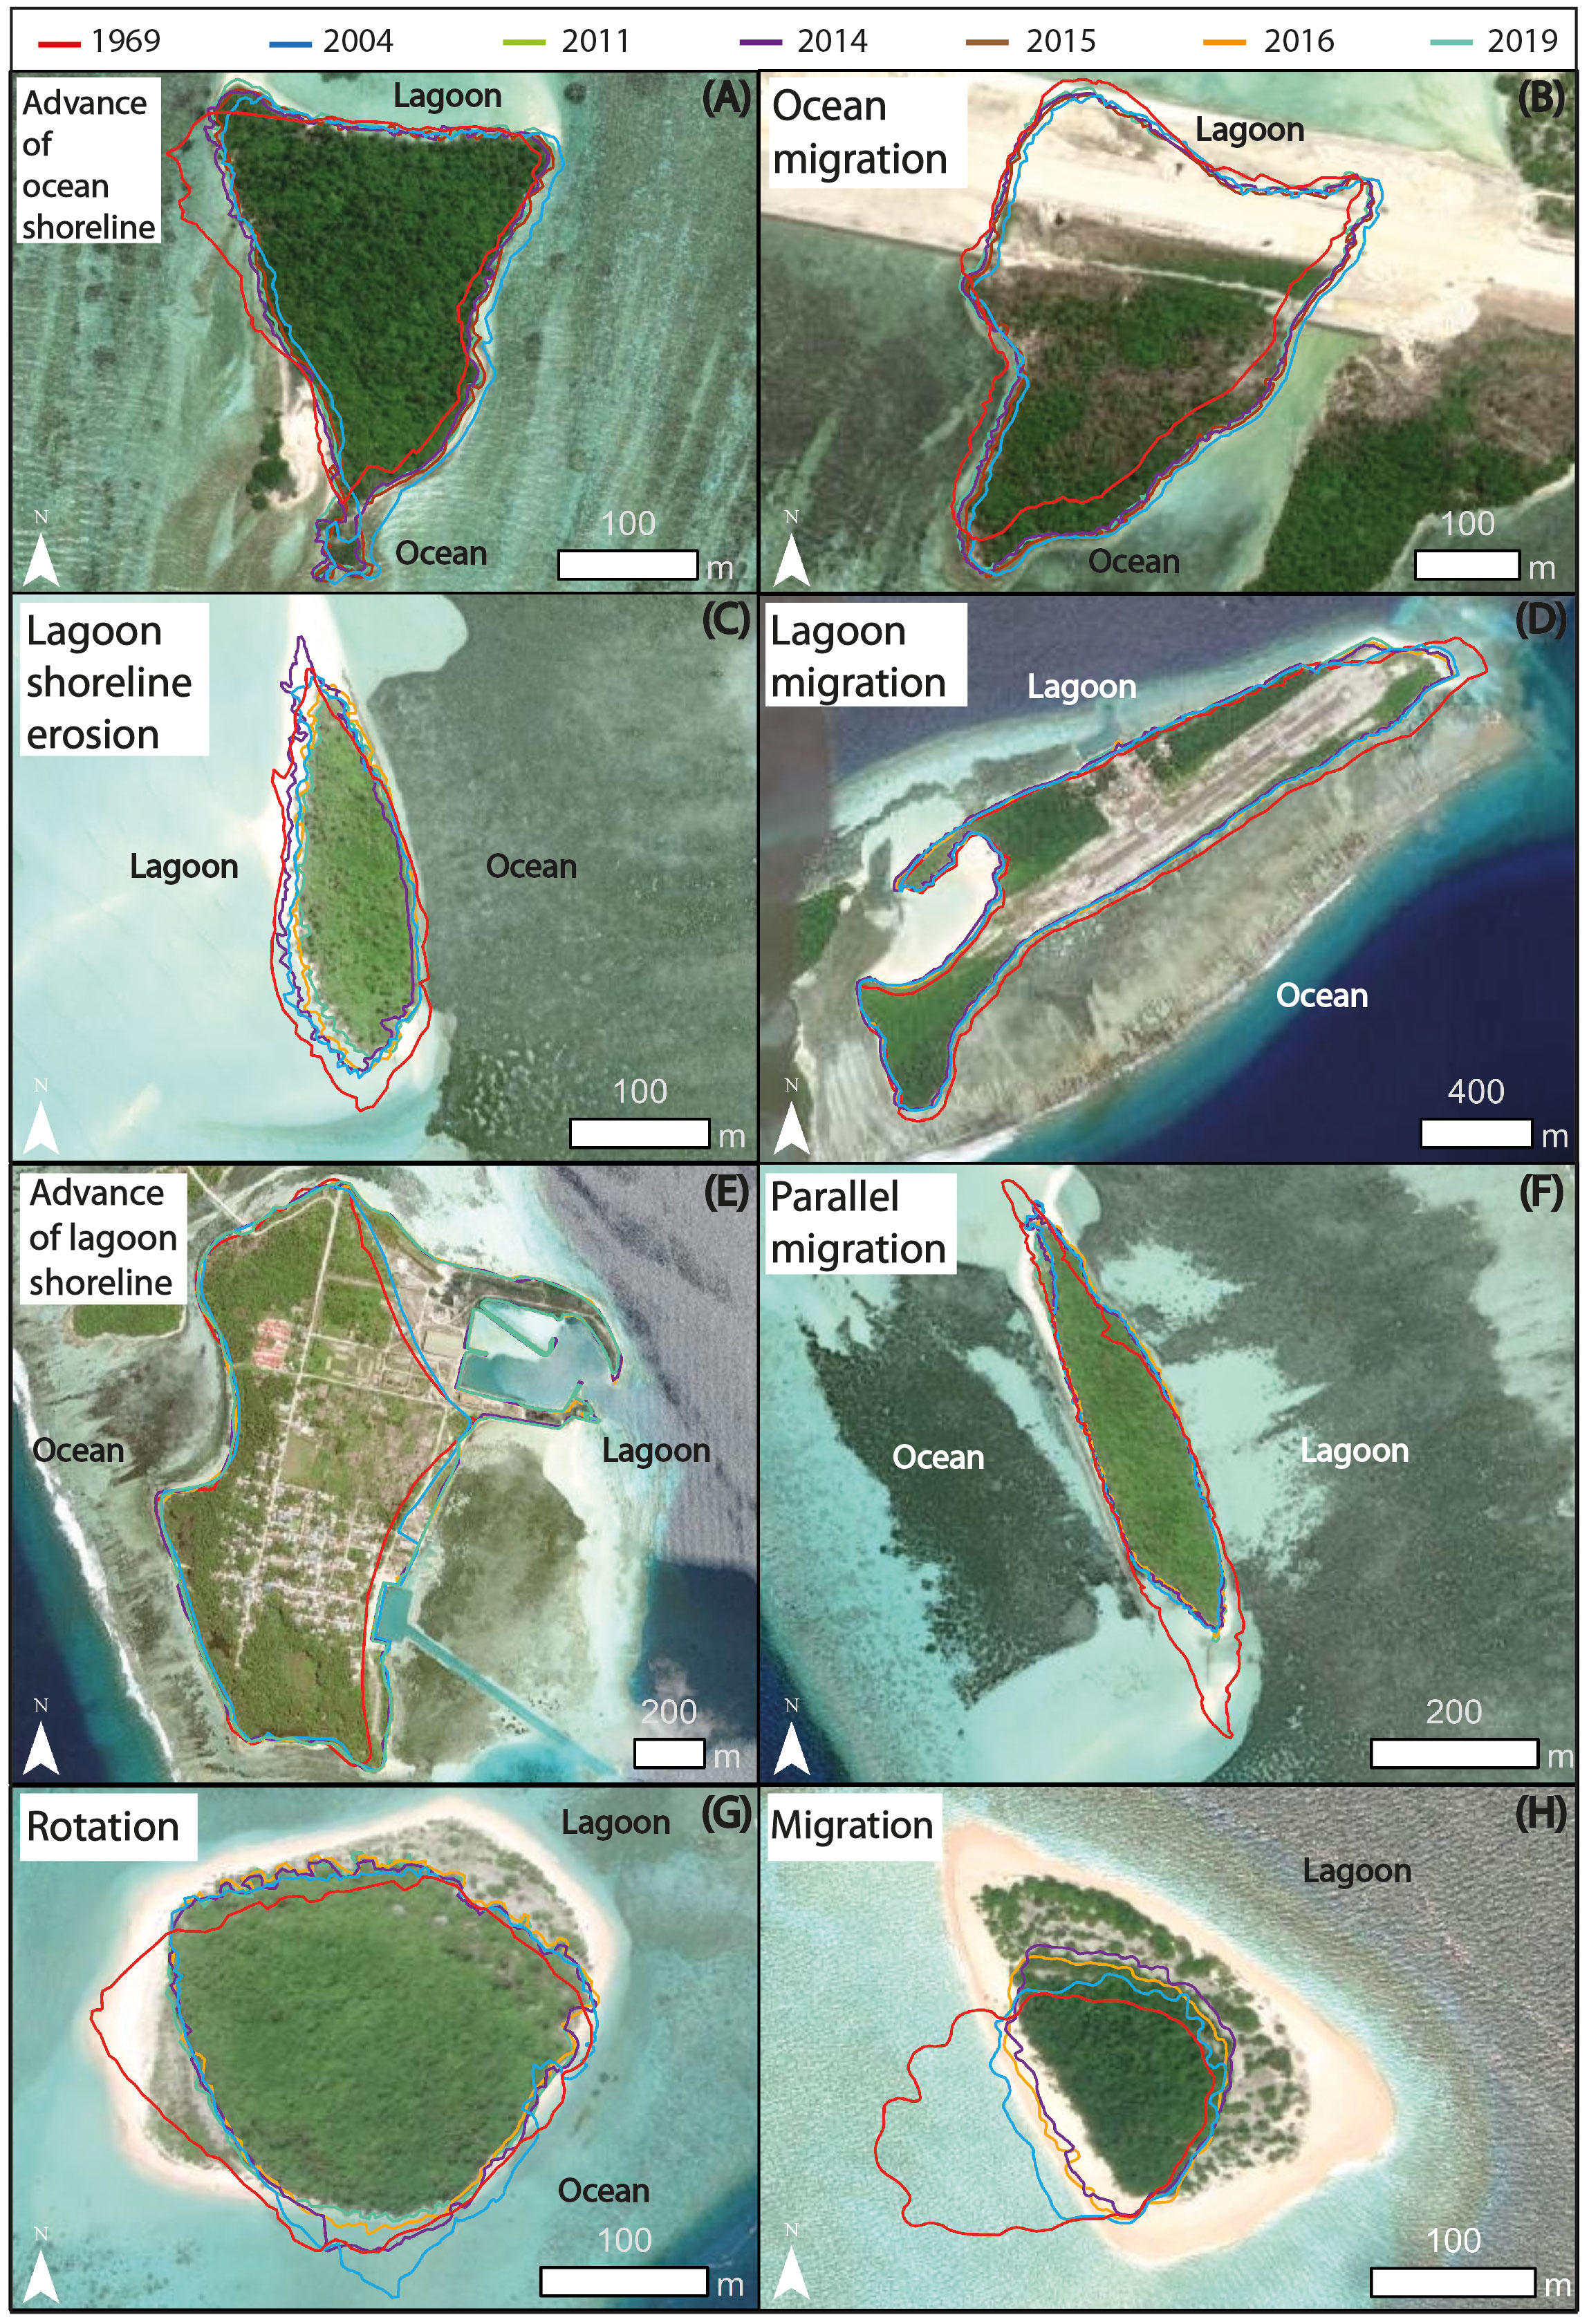
Figure 4 Different styles of geomorphic change from 1969 – 2019 at Huvadhoo Atoll, Maldives; (A) advance of ocean shoreline, island 11, (B) ocean migration, island 17, (C) lagoon shoreline erosion, island 9, (D) lagoon migration, island 45, (E) advance of lagoon shoreline, island 48, (F) parallel migration, island 3, (G) rotation, island 6; and (H) migration, island 36 (Imagery Source: www.esri.com).
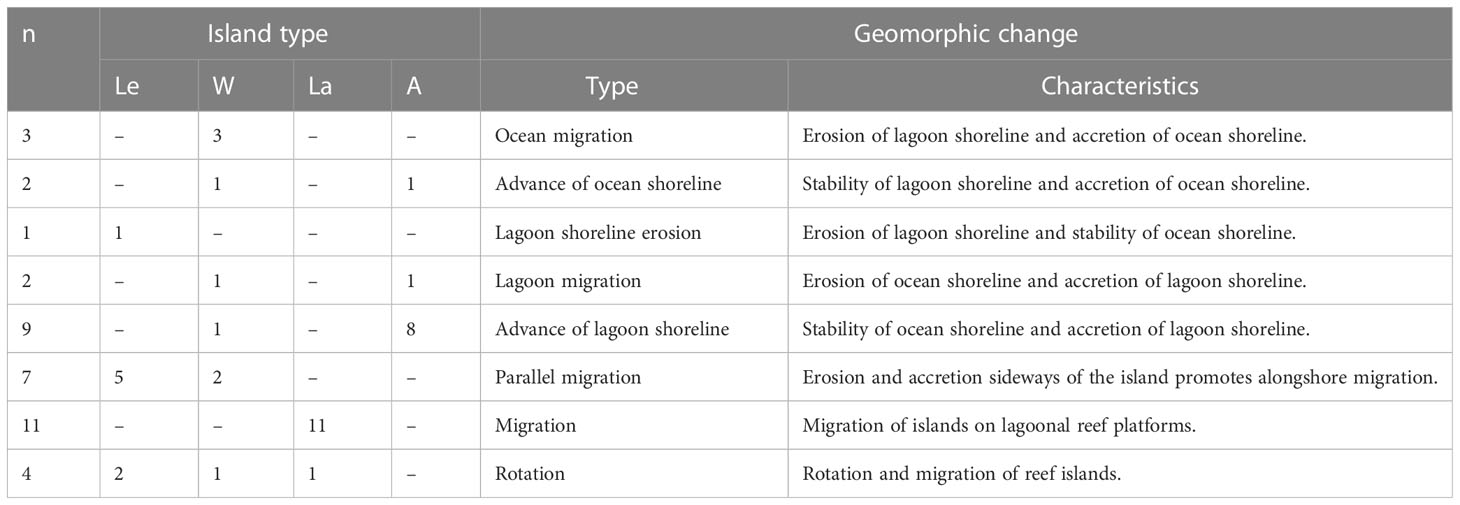
Table 4 Summary of the different types of geomorphic change at Huvadhoo Atoll from 1969 – 2019 by island type where Le = leeward, W = windward, La = Lagoon and A = anthropogenic islands.
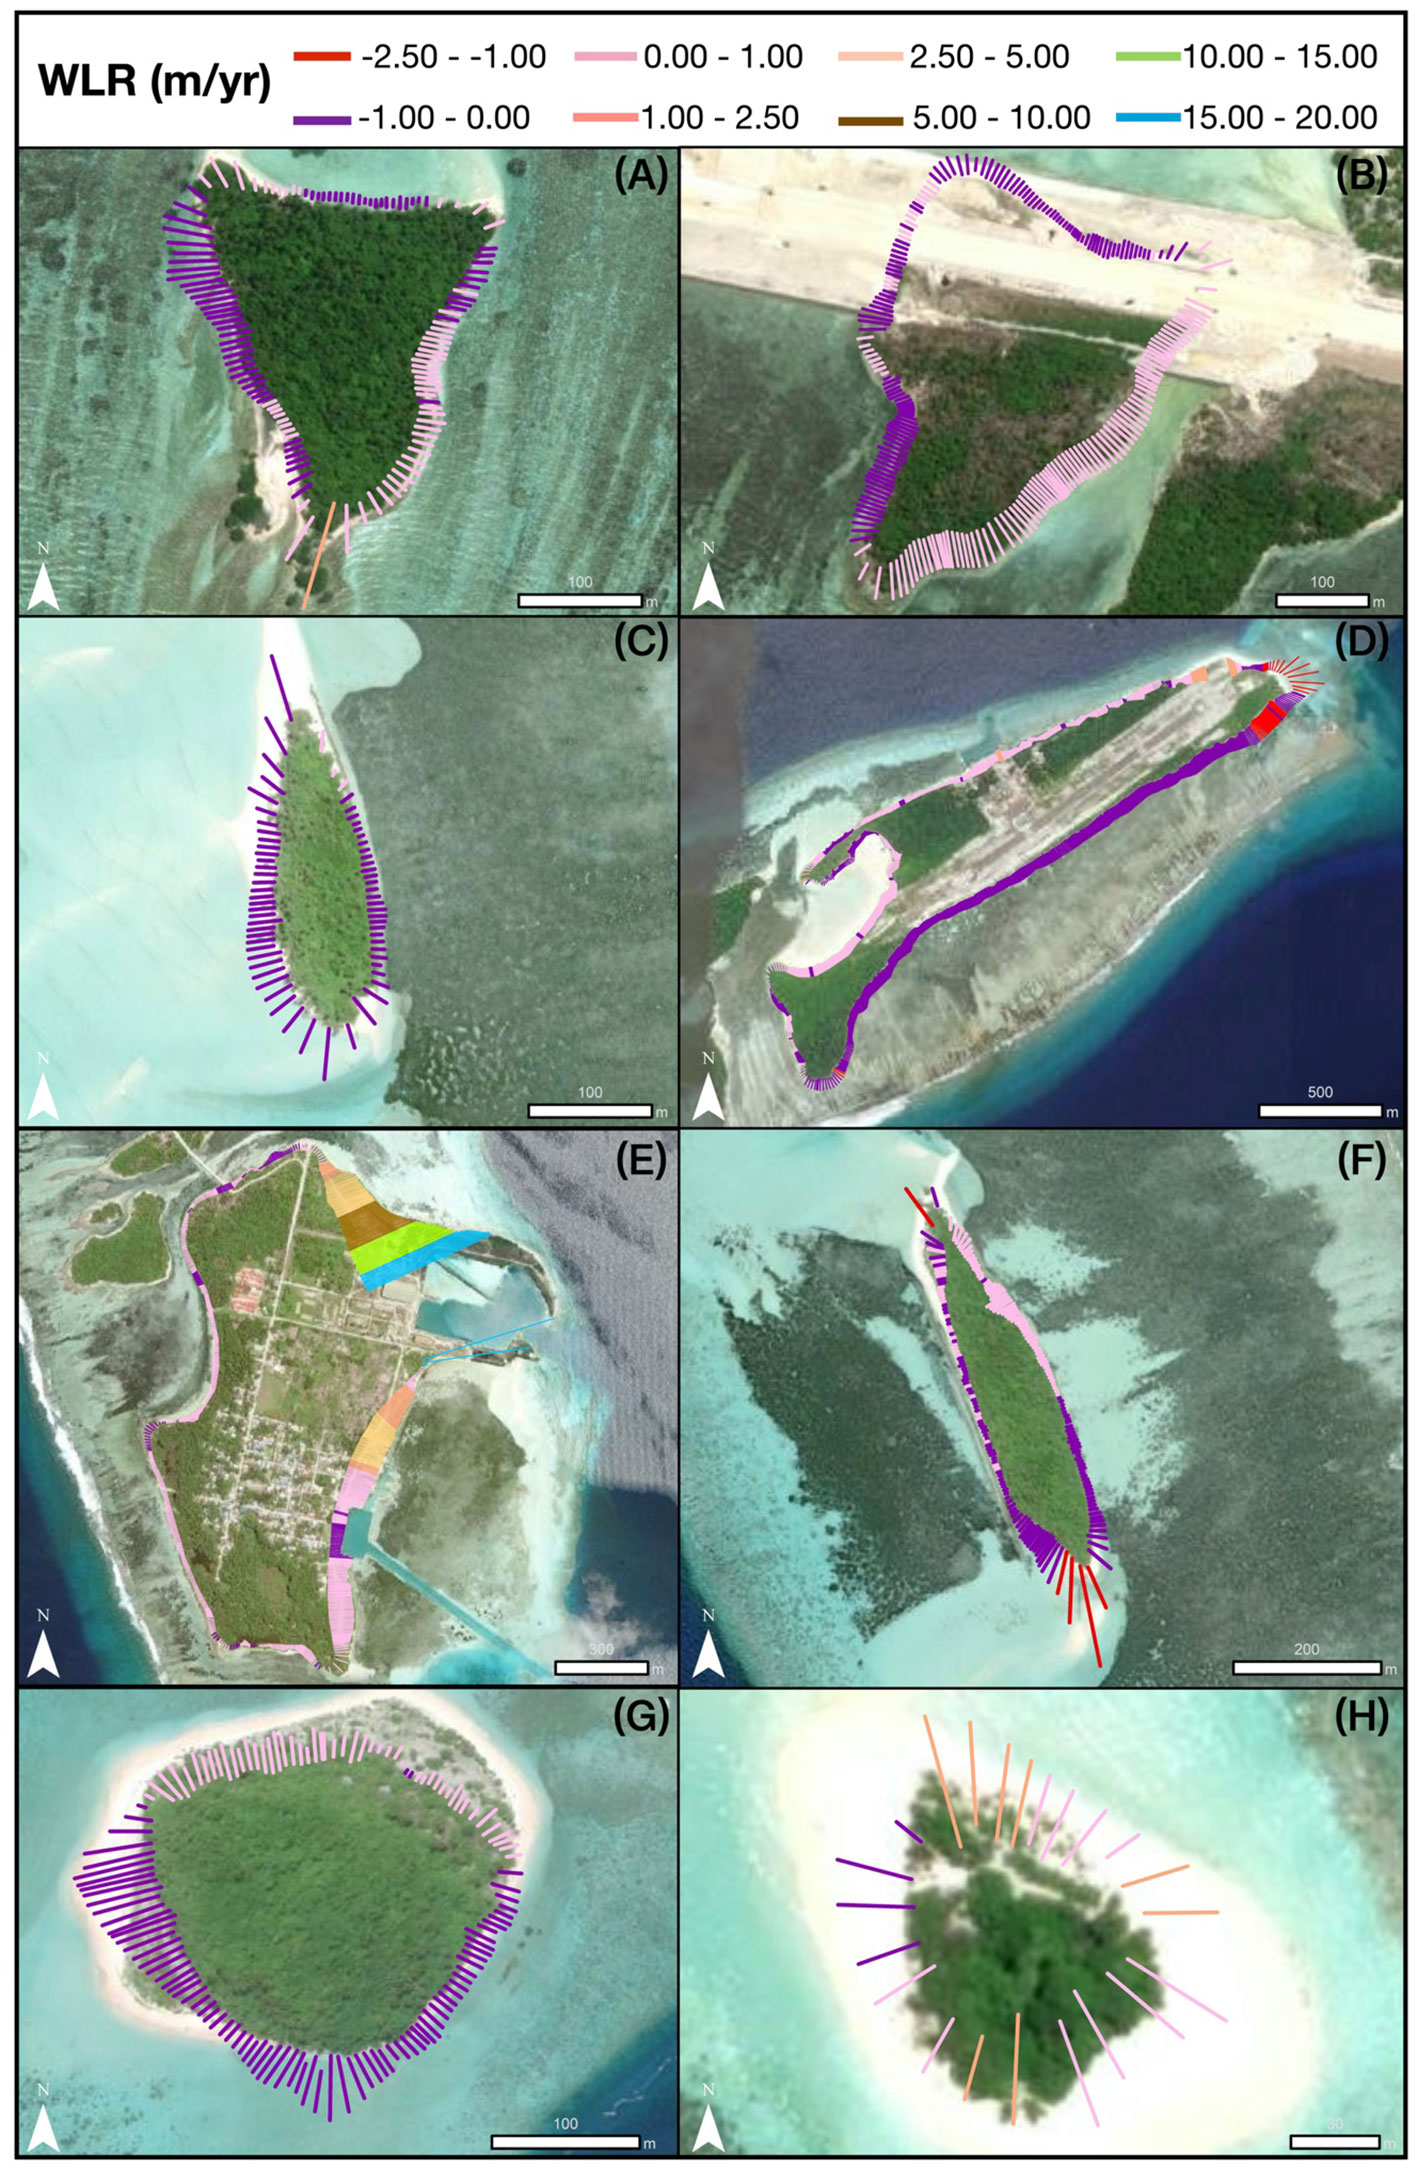
Figure 5 Shoreline change rates calculated by weighted linear regression (m/year) from 1969 – 2019 at Huvadhoo Atoll, Maldives for; (A) island 11, (B) island 17, (C) island 9, (D) island 45, (E) island 48, (F) island 3, (G) island; 6 and (H) island 36 (Imagery Source: www.esri.com).
Geomorphic change varied between island type as on lagoonal islands migration was widespread because this behaviour tends to favour islands located on lagoonal platforms which results in an increase in island size (Aslam and Kench, 2017). Migration was also found in smaller (< 10 ha), circular (< 1.5) islands which is expected as these types of islands are typically found on lagoonal platforms. Larger (> 10 ha), more complex islands favoured parallel migration whereby different erosion and accretion of the island resulted in alongshore migration and these tend to be found on the atoll rim. As such, the majority of leeward islands underwent parallel migration, which could explain their overall erosional response as when sediment is eroded from one side of the island and transported to the other, it is possible that some sediment is lost along the way, resulting in net island erosion. However, ocean migration dominated windward islands which could be because of the larger wave energies, due to being exposed to oceanic swell, providing the energy to transport sediment to oceanward island shorelines. Or, because windward islands have a larger sediment budget that has enabled accretion of oceanward shorelines. Finally, our study found that advancement of lagoon shorelines was prevalent in anthropogenic islands due to being heavily modified with land reclamation and harbours resulting in expansion of lagoon shorelines. Geomorphic changes of all 49 islands are provided in Supplementary Table 5.
As land reclamation had significantly altered anthropogenic island shorelines, the 10 anthropogenic islands were excluded from size, shape and wave exposure statistical tests.
Island area varied from 0.3 ha to 33.2 ha with island size averaging 5.3 ± 6.6 ha. Larger islands were situated on the atoll rim with leeward and windward island area averaging 8.9 ± 6.8 ha and 6.7 ± 9.4 ha respectively, whereas island area in the atoll lagoon averaged 2.5 ± 1.5 ha. Windward islands exhibited the largest variability in island size with a range of 32.5 ha followed by leeward at 18.9 ha and lagoon at 5.7 ha. Overall, smaller islands (0 to 10 ha) accreted by 0.56 ± 16.77 m with at a rate of 0.02 ± 0.39 m/year and larger islands (> 10 ha) accreted by 3.65 ± 23.38 m at a rate of 0.06 ± 0.46 m/year. No significant correlation was found between net shoreline movement and island size (r = 0.093, P = 0.573, n = 39; Pearson’s correlation). Similarly, no significant correlation was found between weighted linear regression and island size (r = 0.014, P = 0.931, n = 39; Pearson’s correlation).
Shape data ranged from 0.4 to 8.1, with average island shape 2.4 ± 1.8. No significant correlation was found between net shoreline movement and island shape (r = 0.026, P = 0.811; Pearson’s correlation). Equally, no significant correlation was found between weighted linear regression and island shape variables (r = -0.021, P = 0.899; Pearson’s correlation).
In Huvadhoo Atoll, wave exposure is highest (< 124.35 J m-3) off the western margin of the atoll rim while the most sheltered locations are on the leeward side of the westerly and south-westly atoll rim platforms (> 0 J m-3). The atoll lagoon is subject to a cross-atoll gradient with wave exposure increasing from west (< 0 J m-3) to east (<~95 J m-3) due to the dominant westerly wind direction, which means fetch length increases as wind blows from west to east across the atoll lagoon (Figure 6). Lagoon islands experienced on average wave exposure of 60.8 J m-3, leeward 96.0 J m-3 and windward 120.0 J m-3. No significant relationship was found between net shoreline movement and wave exposure (R2 = 0.006, P = 0.766; linear regression). Additionally, no significant relationship was found between weighted linear regression data and wave exposure (R2 = 0.043, P = 0.410; linear regression). Finally, no clear correlation was found between wave exposure on natural islands (leeward, windward and lagoon), and the magnitude and rate of shoreline change despite the varying degrees of wave exposure experienced at each island type.
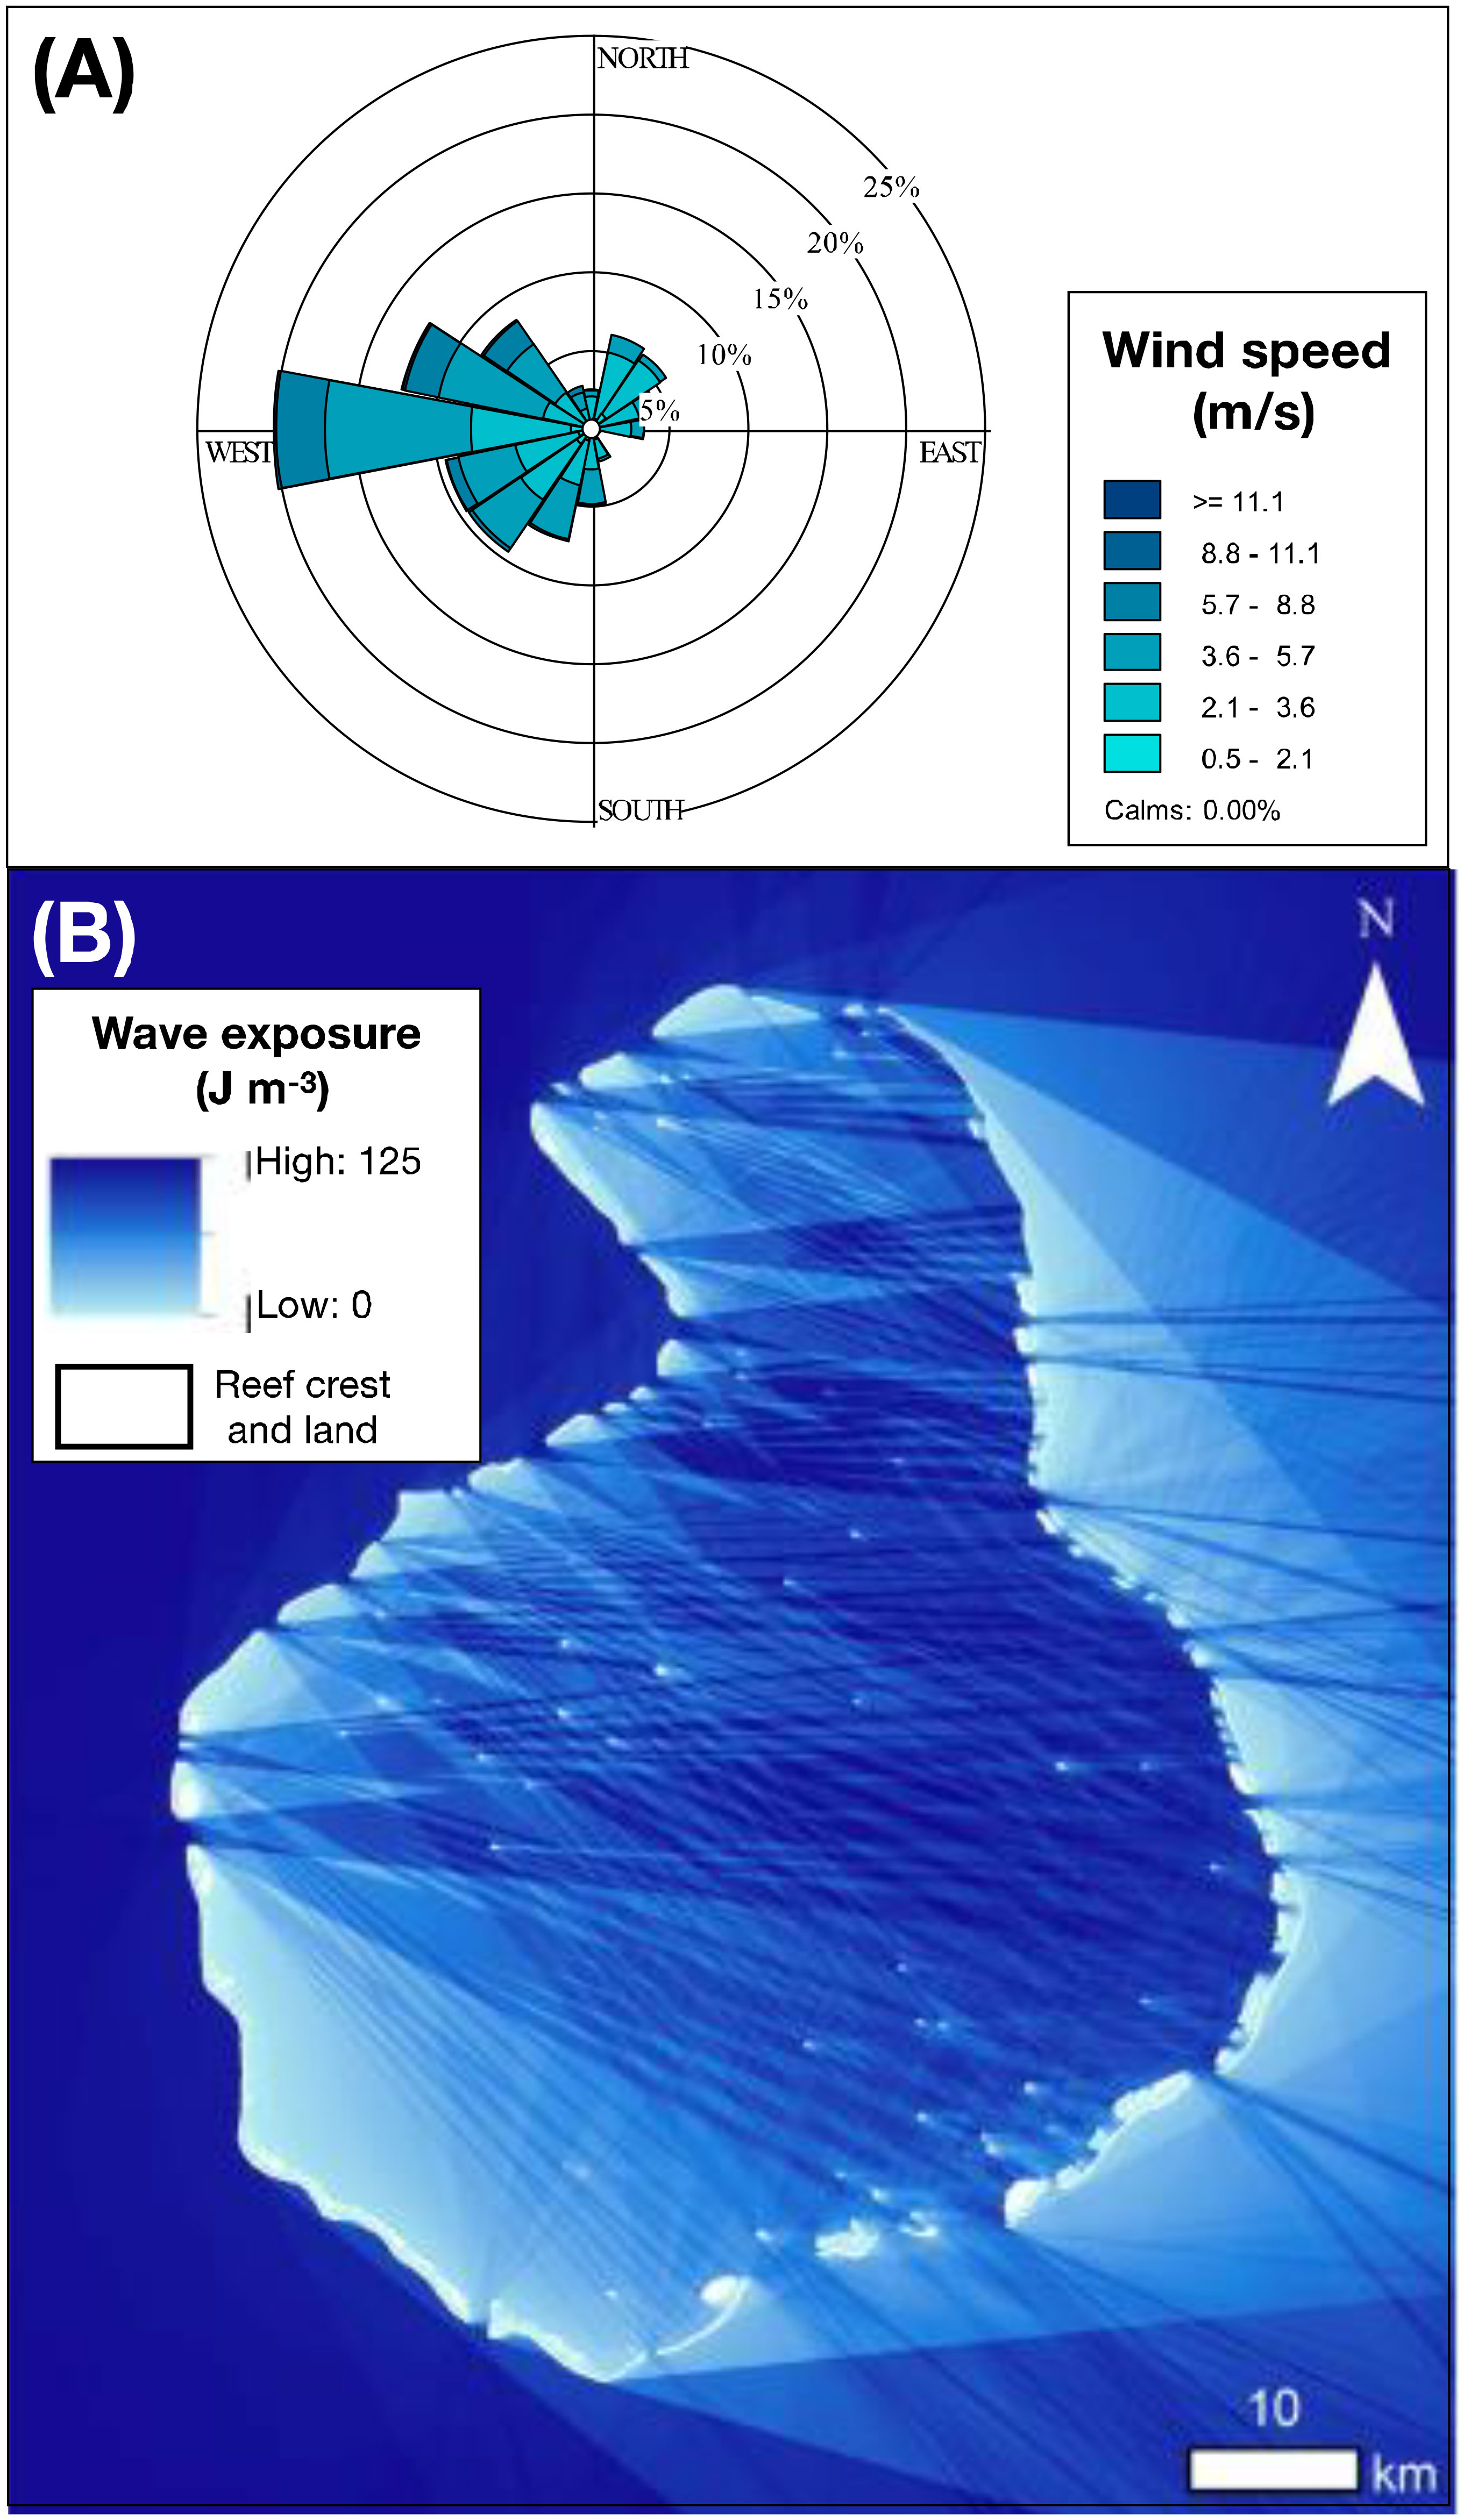
Figure 6 (A) Annual wind rose showing wind speed (m/s) and direction generated using 2014 wind data from Kaadedhdhoo Airport (0.49°N, 73.00°E; n = 2643); and (B) wave exposure model J m-3) for Huvadhoo Atoll.
Visual plotting suggested that island type was the strongest predictor of shoreline change, and subsequent testing of all factors simultaneously showed this to be the case (Figure 7). Linear Mixed Models were fitted to both NSM and WLR within the nlme package [R ‘nlme’ package, function lme(), Pinheiro, 2023)], separately, in which type was controlled for as a random factor (random intercept), and wave exposure, island size, and island shape were included as fixed factors. No significant effects of wave exposure, size or shape were found, with either NSM or WLR as the response variable (p< 0.05, Supplementary Table 6). For further confirmation we removed the island type variable and fitted analogous Generalised Linear Models (GLMs, R ‘stats’ package, function glm(), R Core Team, 2021) to the same data, with wave exposure, size of island, and shape of island as predictors, i.e. omitting island type as an explanatory variable altogether. Here again no continuous variables were found to be significant predictors (p< 0.05, Supplementary Table 7) of either NSM or WLR (also reflecting the single variable regressions reported in 3.2.1 to 3.2.3 above), so we proceeded by further analyzing the effect of island type on shoreline change alone, using ANOVA/MANOVA testing.
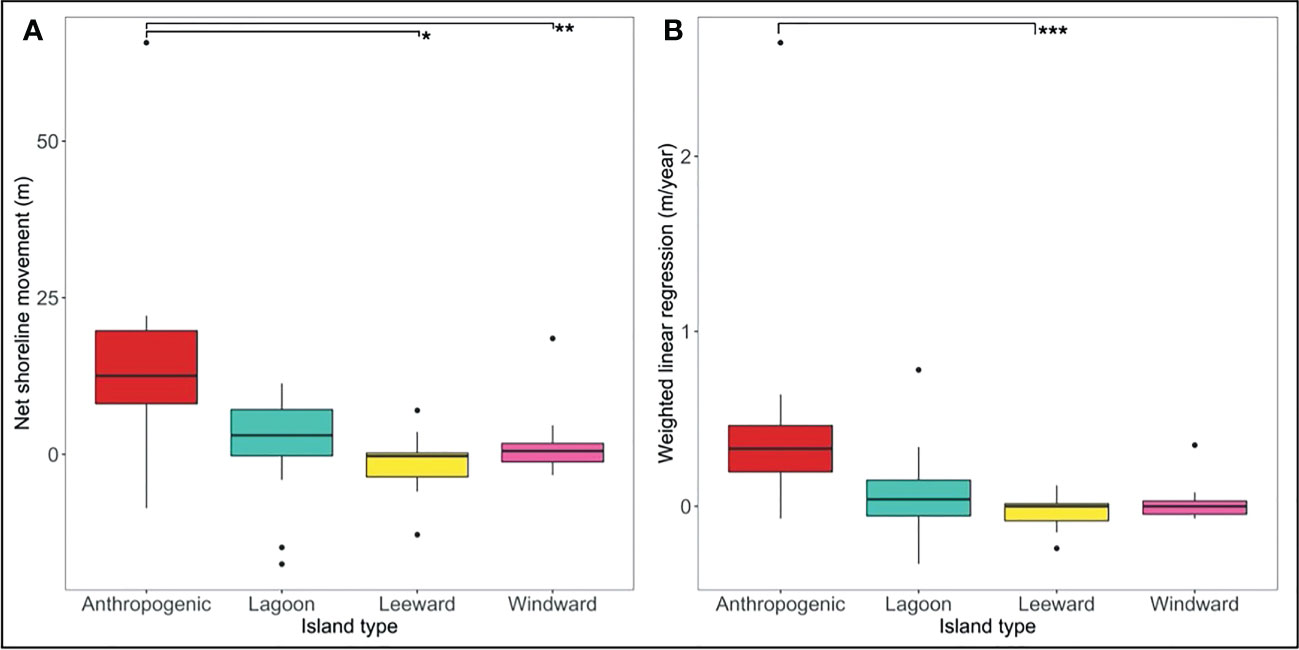
Figure 7 Difference between island type and (A) Net Shoreline Movement (m); and (B) Weighted Linear Regression (m/year), * P = 0.002, ** P = 0.025, and ***P = 0.014.
In these final analyses of shoreline change predictors, island type was identified as a significant predictor of NSM and WLR (Figure 7). The effect of type was confirmed both via (one way) ANOVA tests on the two response variables separately- NSM (F (3,45) = 5.891, p = 0.002), WLR (F (3,45) = 4.411, p = 0.008)- and when combined into one model using MANOVA (Pillai’s trace = 0.30, F (3,45) = 2.62, p = 0.022).
Rates of shoreline change (WLR data) were used to estimate island widths for 2030, 2050 and 2100, which enabled numerical modelling of freshwater lens volumes under different recharge conditions. Recharge conditions were based on the corresponding changes in rainfall for each emission scenario (RCP 2.6, 4.5, 7.0 and 8.5) and model output (P5, median, P95) in 2030, 2050 and 2100 (Figure 8). Rainfall for emission scenarios RCP 2.6, 4.5, 7.0 and 8.5 varied from -2.7 to 8.1%, -3.8 to 11.1%, -3.4 to 10.1% and -3.5 to 14.1%, respectively. Model outputs reflected the range of uncertainties in percent changes in future rainfall predictions whereby P5 (5th percentile) reflected a decrease in rainfall ranging between -3.8 to -0.6%, median varied from 0.2 to 4.7%, and P95 (95th percentile) showed larger increases in rainfall at 3.2 to 14.1%. Recharge data for the different years, emission scenarios, and model outputs are provided in Supplementary Table 2.
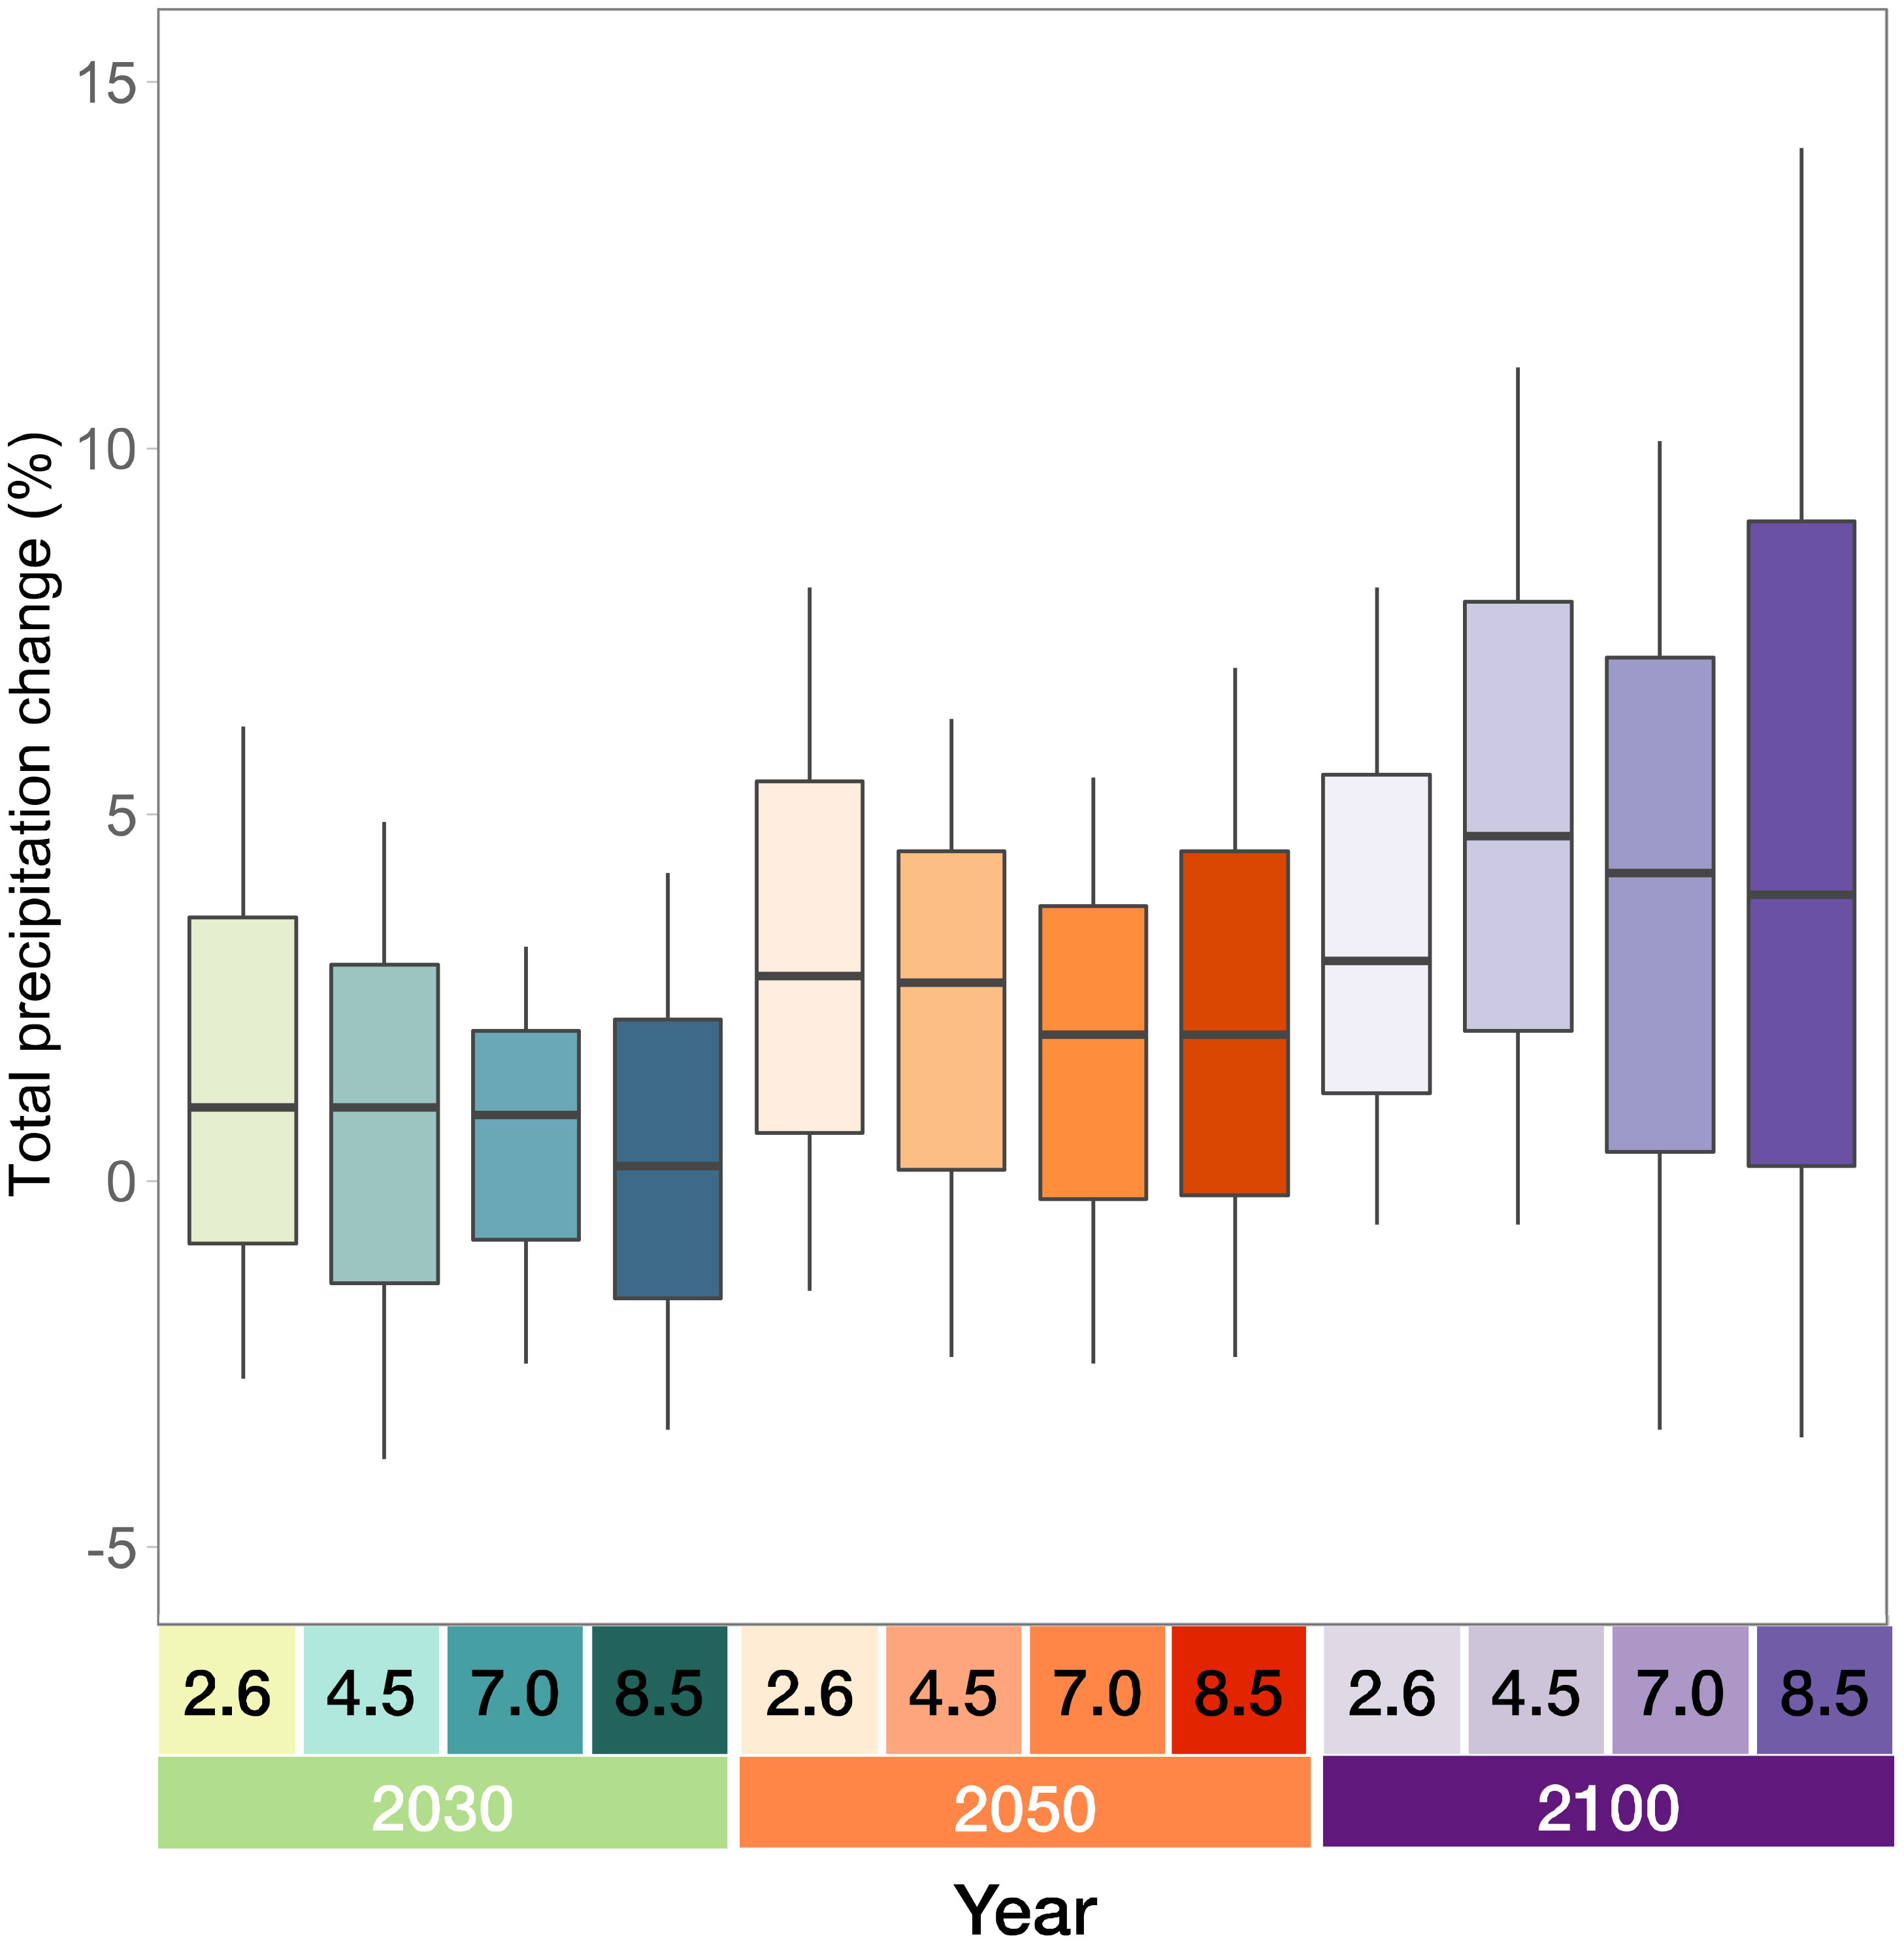
Figure 8 Total precipitation change (%) for 2030, 2050 and 2100 under different emission scenarios (RCP 2.5, 4.5, 7.0 and 8.5) Data source: Gutiérrez et al., 2021.
The largest variability in freshwater lens volume was associated reef island shoreline change, while changes in rainfall had less of an impact. Figure 9 displays the percent changes in lens volume for accreting and eroding islands combined. In Figure 9A, median values tend to be similar for RCP 2.6 (-1.0%, 0.6%, 3.5% for 2030, 2050 and 2100 respectively) and 4.5 (-1.6%, 0.1%, 3.5% for 2030, 2050 and 2100 respectively), but decrease slightly for RCP 7.0 (-0.9%, 0.1%, 1.9% for 2030, 2050 and 2100 respectively) and 8.5 (-1.4%, 0.1%, 1.9% for 2030, 2050 and 2100 respectively). In Figure 9B median values tend to remain consistent (at ~ 1.0%, 3.0% and 6.0% for 2030, 2050 and 2100 respectively) between all emission scenarios for each year. Figure 9C displayed a wider range in the percent difference in lens volume, particularly for 2100 with median values 8.1%, 9.6%, 9.1%, and 11.1% for RCP 2.6, 4.5, 7.0 and 8.0 respectively. Median values varied considerably between each year and time point, suggesting that at P95 outputs there is greater variability in freshwater lens volume. As islands predominantly accreted in this study, overall, an increase in island lens volume was found across all timeframes and emissions scenarios. Further, upon exclusion of anthropogenic islands, which favoured accretion and displayed large rates of shoreline change due to land reclamation, lens volume nevertheless increased for natural islands. For instance, at median model outputs for emission scenario RCP 2.6 lens volume increased by 5.2 ± 1.9%, 9.6 ± 5.2% and 17.6 ± 12.6% for 2030, 2050 and 2100 respectively. Additionally, for RCP 8.5 lens volume increased by 2.0 ± 1.9%, 6.3 ± 5.3% and 15.0 ± 12.8% for 2030, 2050 and 2100 respectively.
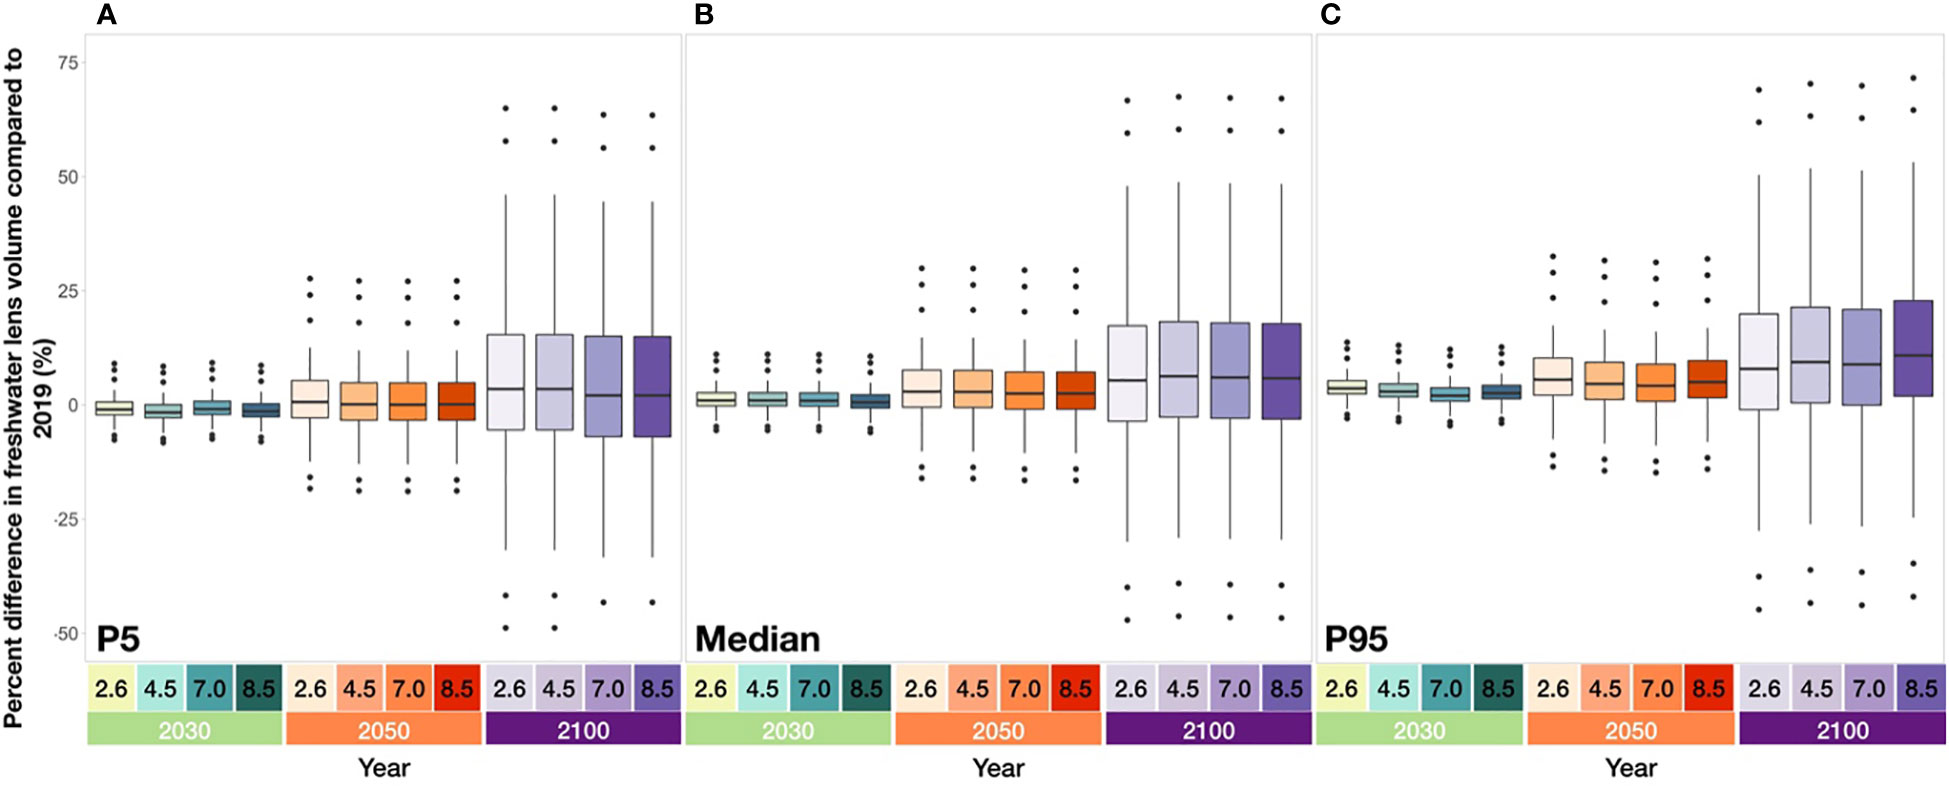
Figure 9 Percent difference in freshwater lens volume when compared to 2019 for 2030, 2050 and 2100 under difference emission scenarios (RCP 2.6, 4.5, 7.0 and 8.5) for IPCC model outputs (A) fifth percentile, (B) median; and (C) ninety fifth percentile.
Estimated freshwater lens volumes in 2030, 2050 and 2100 were compared against 2019 to calculate percent differences in lens volume, and islands were grouped as either accreting or eroding based on their shoreline change statistics. Summary statistics of percent difference in lens volume are provided in Supplementary Table 8. On accreting islands, increases in island width compensated for a reduction in precipitation. Decreases in recharge (P5) still led to increases in lens volume across all emission scenarios which increased over time from 2030 to 2100. For instance, under RCP 2.6 scenarios in 2030, 2050 and 2100, lens volume increased by 1.3 ± 2.8%, 6.8 ± 7.4% and 18.4 ± 17.2%, respectively. Under RCP 8.5 scenarios, in 2030, 2050 and 2100 lens volume increased by 0.8 ± 2.8%, 6.2 ± 7.5% and 16.6 ± 17.5%, respectively. The largest decrease in lens volume was in 2100 under RCP 7.0 and 8.5 at -0.7%, whereas the greatest increase in volume was in 2100 under RCP 2.6 and 4.5 at 65.05%. Median values showed very little differences in lens volume between emission scenarios. For example, in 2030 lens volume increased by 3.3 ± 2.8% for RCP 2.6, 4.5, 7.0 and by 2.9 ± 2.8% for RCP 8.5. Larger increases in recharge (P95) resulted in substantial expansions of the freshwater lens, which doubled at each time point for each emission scenario. For example, for RCP 7.0 lens volume increased by 4.5 ± 2.8%, 10.6 ± 7.4% and 23.9 ± 17.1% for the years 2030, 2050 and 2100 respectively. The greatest decrease in volume was in 2030 under RCP 7.0 and 1.9% and the largest increase in lens volume was in 2100 under RCP 8.5 with a maximum increase of 71.1%.
On eroding islands, the freshwater lens decreased when recharge was reduced (P5) which intensified with each time point. For instance, under RCP 7.0 the lens volume decreased by -3.8 ± 1.8%, -6.3 ± 5.2% and -15.2 ± 14.5% for 2030, 2050 and 2100 respectively. The largest decrease in lens volume was in 2100 under RCP 8.5 at -50.4%, followed closely by RCP 7.0 at -50.3%; whereas the greatest increase in volume was in 2100 under RCP 2.6 and 4.5 at -0.6%. Similar to accreting islands, median values showed very little differences in lens volume between emission scenarios. For example, in 2030 lens volume decreased by -1.2 ± 1.8% for RCP 2.6, 4.5, 7.0 and by -1.6 ± 1.8% for RCP 8.5. Greater increases in recharge (P95) meant that in 2030 the freshwater lens increased slightly by 1.6 ± 1.8%, 0.9 ± 1.8%, 0.6 ± 1.8% for RCP 2.6, 4.5 and 8.0 respectively while under RCP 7.0 lens volumed remained the same when compared to 2019 at 0.0 ± 1.8%. Despite an increase in rainfall, lens volume decreased for 2050 and 2100, however, the decrease in volume was not as severe when compared to P5 and median outputs. Under RCP 7.0, the lens volume decreased by -1.9 ± 5.3% and -8.0 ± 14.6% for 2050 and 2100 respectively; and under RCP 8.0 by -1.2 ± 5.3% and -6.1 ± 14.6% for 2050 and 2100, respectively.
This study assesses coral reef island shoreline change at Huvadhoo Atoll, with islands undergoing substantial shoreline change over the 50-year time period. Similar to previous shoreline change studies (Webb and Kench, 2010; Ford, 2013; Yates et al., 2013), this study found that despite sea level rising 4.24 mm/year at Huvadhoo Atoll, the majority of islands accreted (53%), whereas only 25% of islands eroded, and 22% displayed no change. Moreover, 55% of transects accreted, 37% eroded and 8% displayed no change. Even with the exclusion of anthropogenic islands, which highly favour accretion due to land reclamation, 44% of islands accreted, 28% eroded and 28% remained stable. Net shoreline change (NSM) ranged from -17.51 to 65.73 m, with an average shoreline movement of 4.13 ± 23.99 m. Additionally, shoreline change rates varied from -0.07 to 2.65 m/year with an average accretional rate of 0.13 ± 0.60 m/year. Bruun-style predictions of the impacts of sea level rise on shorelines project catastrophic erosion of coral reef island shorelines (Yamano et al., 2007; Dickinson, 2009). Though sea level rise is an important factor driving long-term shoreline change (Yates et al., 2013), due to the lack of widespread and consistent erosion, results indicate that sea level is not the sole factor impacting reef island shoreline change.
The prevalence of accretion at Huvadhoo Atoll contrasts previous findings of Aslam and Kench (2017) that erosion was the dominant style of island change (45%) followed by no change (40%) and accretion (15%). Both studies observed shoreline change on some of the same study islands with conflicting results, for instance, from 1969-2008 in Aslam and Kench’s study, three lagoon islands were eroding and two were displaying no change, however, in this study, the same five study islands have accreted. Similarly, an island on the windward rim that was displaying no change between 1969 and 2008 has eroded between 1969 and 2019. This discrepancy in findings may be because (i) the islands have shifted to a more accretionary mode of shoreline change since 2008 due to an increase of sediment production and/or transport to reef island shorelines; or (ii) our study covered a longer time period (1969-2019) than Aslam and Kench’s analysis (1969-2008), which enabled the inclusion of naturally occurring periods of shoreline variability. The differences that can arise when interpreting short- and long-term shoreline change rates was emphasized by Mann et al. (2016) who compared shoreline change on 14 islands in Taku Atoll, Papa New Guinea, over varying time points between 1943-2012. They found substantial variations in shoreline change rates depending on the time period of analysis, for example, from 1943 to 2012, WLR ranged from -1.04 ± 0.22 m/year to 0.65 ± 0.15 m/year, with an average rate of 0.06 ± 0.07 m/year. However, for shorter time periods (2003 to 2021), WLR rates of shoreline change were substantially higher, with WLR ranging between -2.81 ± 1.04 m/year and 2.74 ± 1.62 m/year with an average rate of -0.25 ± 0.37 m/year. Hence, reef island shoreline change findings are sensitive to the timeframe of analysis.
Contrary to previous studies, this study found no relationship between island size and shoreline change. Multiple studies in the Pacific have documented a relationship between island size and shoreline change, suggesting that smaller islands (< 10 ha) undergo erosion whereas larger islands tend to be more stable (Duvat, 2019; Sengupta et al., 2021). In the Maldives, Aslam and Kench (2017) found that islands in Huvadhoo Atoll behaved very similar to islands in the Pacific as a significant relationship was discovered between island size and shoreline change whereby smaller islands (< 10 ha) eroded and larger islands were dominated by accretion.
Despite the variety of island shapes at Huvadhoo Atoll, there was no significant relationship between island shape and shoreline change with results contradictory to the findings by Kench and Brander (2006) in the Maldives, who found island shape impacted morphological change more than wave energy, whereby the beaches on circular islands were more susceptible to shoreline oscillations than elliptical islands. However, the observed geomorphological responses were over seasonal time frames, whereas this study investigates shoreline change over multi-decadal time scales. Yet, some studies have found that circular and elliptical reefs are more prone to retain sediment, compared to linear reefs (Mandlier and Kench, 2012; Mandlier, 2013).
As Huvadhoo Atoll is situated close to the equator, it rarely experiences tropical storms, however, it is exposed to oceanic swell driven by high latitude storms (Aslam and Kench, 2017). Previous studies suggested that wave exposure is a key control on island morphology (Fletcher et al., 2003; Webb and Kench, 2010; Yates et al., 2013; Duvat and Pillet, 2017; Duvat et al., 2017), yet results from the present study found no relationship between wave exposure and shoreline change.
The lack of significant relationships between island size, island shape, wave exposure and shoreline change contrasts findings and suggestions from previous research (Webb and Kench, 2010; Aslam and Kench, 2017; Duvat and Pillet, 2017; Duvat, 2019; Sengupta et al., 2021). As such, findings from this study highlight that reef island shoreline dynamics are very site-specific and controlled by a range of different variables. For example, in addition to the variables analysed in this study, variability in island sediment grain size, vegetation type, elevation, reef platform morphologies, bathymetry are all additional variables that may be interact to control the magnitudes of reef island shoreline change. From a management perspective, the site-specific nature of reef island shoreline dynamics makes island planning decisions problematic as it is complex to predict which islands may be the most and least mobile over decadal timescales.
A significant difference in shoreline change was found between island types whereby shoreline change was significantly higher on anthropogenic islands than all other island types. A key reason for this was due to the extreme modifications of anthropogenic island shorelines, which meant that they were undergoing morphological change at a greater magnitude and rate than natural islands. While nine out of the 10 anthropogenic islands accreted, the least modified island eroded. Therefore, small-scale modifications may enable erosion to be more clearly identified, whereas erosion may be occurring on other islands, but large-scale modifications, such as land reclamation, may be masking any natural morphological changes within the data.
Large island communities (>1,000 people) tend to inhabit islands that have undergone significant modifications (i.e., coastal development or hard engineering) and the future stability of these islands is still unclear. While these anthropogenic islands may have experienced a substantial increase in size, modifications have been relatively recent and there is a lack of long-term data available which would enable us to understand how such severe modifications may impact island shoreline dynamics. Further, modifications have been found to not only impact shorelines on the modified island, but those of other islands within the atoll. For instance, when investigating the impact of coastline modification and sea level rise on island shorelines in North Malé Atoll, Maldives, Rasheed et al. (2020) found that increased flow rate in the channel between Hulhumalé and the neighbouring island Kanifinolhu influenced erosion of the island Kudabandos. This increased erosion was due to land reclamation blocking sediment transport across the lagoon to Kudabandos’s shorelines and sediment was instead transported to the channel.
Modification of reef island shorelines is widespread in the Maldives and a recent investigation by Duvat and Magnan (2019) across 608 islands found that the capacity of inhabited and modified islands to respond to climate pressures had severely decreased over the last decade. An increase in human activities has meant that in one decade 56 natural islands were exploited. Further, significant population growth has occurred on 47 inhabited islands meaning that the number of islands experiencing a substantially high human footprint increased by 9.2%. Similarly, this study found that island modification occurred on rapid timescales with major developments appearing over the last decade (from 2006 to 2014). The Maldives have experienced a surge in population over recent years as in 2021 the population was 543,620 whereas in 2011 the population was 380,493 (World Bank, 2022). A rapidly increasing population will place extra pressure on islands as land becomes increasingly sparse, thus, islands may undergo further modification to combat the growing population. In addition to a surge in population, a rise in tourism has led to an increase in visitors each year with 1,321,855 people visiting the country in 2021. As such, it has become the one of the dominant industries in the region accounting for 26% of the country’s GDP (Maldives Bureau of Statistics, 2020). This has led to a rise in the number of resorts, hotels and guests houses and, as of December 2020, 159, 13 and 638 existed respectively (Statistical Yearbook, 2021). As the tourism industry increases in the Maldives, more islands may undergo substantial transformations to accommodate the rise in popularity. Expansions in population and tourism could lead to the construction of additional island infrastructure both globally and in the Maldives. Consequently, a challenge for the future adaptive capacity of atoll nations is to develop infrastructure that can accommodate for naturally shifting reef island shorelines which is implemented quickly enough to ensure that reef island physical response to sea level rise is not compromised.
Results from this study have demonstrated how shoreline change can substantially impact groundwater availability as freshwater lens volume was primarily influenced by the erosion or accretion of islands over the coming decades. The percent difference in freshwater lens volume, when compared to 2019, varied considerably between 2030, 2050 and 2100, while changes in model outputs (i.e., P5, median and p95) and emission scenarios had little impact. We suggest that decreases in recharge, as reflected in the IPCC scenarios for the next 78 years (Gutiérrez et al., 2021), may not impact lens volume on accreting islands, but could contribute to reductions in the lens volumes of eroding islands. Moreover, as increases in recharge from 2030 onwards are highly likely (Gutiérrez et al., 2021), this could lead to an increase in lens volume for accreting islands and offset substantial decreases in lens volume for eroding islands (White et al., 2007). We note that this study used island width estimates based on current rates of sea level rise, therefore, the increase in magnitude and rate of sea level rise could further influence island dynamics and, in turn, groundwater availability.
As islands predominantly accreted in this study, overall, an increase in island lens volume was found across all timeframes and emissions scenarios, and when removing anthropogenic islands calculations of average shifts in lens volumes. Results from this study infer that groundwater has the potential to be a crucial source of freshwater for islands in the Maldives (Bailey et al., 2014), particularly on uninhabited islands as they are not subject to the stresses of exploitation and anthropogenic contamination. However, groundwater in the Maldives is highly susceptible to pollution due to high hydraulic conductivity and shallow depths to the water table (White et al., 2007; Bailey et al., 2016). While there is limited groundwater quality research in the region, a handful of studies have identified poor water quality with elevated salinity levels from saltwater intrusion and sewage-based pollutants (such as nitrates and fecal coliform) commonly detected (Barthiban et al., 2012; Jaleel et al., 2020; MoEnv, 2020; Leoni et al., 2021). Currently, 54% of the population use rainwater harvesting, 34% bottled water and 15% using desalinated water (National Bureau of Statistics, 2014). Due to increasing climate variability, rain tanks have been depleted during the dry period, which has led to an increasing reliance on emergency water from desalination facilities. For instance, between 2017 and 2020, 59 islands were supplied with drinking water during the dry season at an annual cost of 6.9 million MRF (Ministry of Environment, 2020). On accreting islands, further investigations into groundwater quality and aquifer remediation could enable groundwater to become a sustainable resource, especially during the drier months when rainwater harvesting is challenging. In addition to the benefits for island communities, groundwater is vital for future island ecology, such as mangroves, as groundwater flow can reduce salinity and increase nutrient availability, increasing plant growth (Hayes et al., 2019). Thus, groundwater has both high socioeconomic and ecological value as it can play a crucial role in sustaining reef island ecosystems and humanity. Indeed, we highlight that the future resilience of fresh groundwater on reef islands, as projected in the present study, represents a valuable geomorphic ecosystem service.
GIS-based shoreline change research and numerical modelling of future shifts in freshwater lens volumes have revealed insights into positive outcomes for island communities whereby we have found the prevalence of reef island accretion and, in turn, a future increase in the volume of island fresh water lenses. However, when taking into consideration the future stability of reef islands, it is important to note that their persistence may be threatened with increasing climatic and environmental pressures. Firstly, as the surrounding coral reefs are responsible for supplying sediment to reef islands, a decline in reef health may influence sediment budgets and, therefore, island physical stability (Kench and Cowell, 2002; Perry et al., 2008; Perry et al., 2011; Aslam and Kench, 2017; East et al., 2020). Reductions in reef health can arise from a variety of climatic and anthropogenic stressors, such as bleaching (Morri et al., 2015; Sully et al., 2019), ocean acidification (Hoegh-Guldberg et al., 2007; Liu et al., 2014; Mollica et al., 2018) and pollution (Wear and Thurber, 2015; Wenger et al., 2016). Each of these stressors has the potential to reduce sediment supply to reef island shorelines, in the absence of which, reef island physical resilience will be contingent upon the adjustment of finite volumes of sediment on reef platforms. Secondly, it is possible that the increase in the magnitude and rate of sea level rise over the coming decades (IPCC, 2019) could result in a tipping point being reached for coral reef islands, beyond which they could lose the capacity to keep up with rising sea levels. Lastly, changes in shoreline positions can impact the habitability of reef islands by potentially devastating island infrastructure (East et al., 2018) and threatening the security of freshwater supplies due to substantial erosion of island shorelines (Alsumaiei and Bailey, 2018a; Duvat and Magnan, 2019). Hence, while island landforms may remain physically resilient, and may maintain their freshwater lenses, their habitability may become increasingly challenging for island communities.
Multidecadal shoreline change research of 49 islands in Huvadhoo Atoll, Maldives has facilitated a greater understanding of reef island shoreline vulnerabilities. Specifically, analyses of historical aerial photographs and satellite imagery revealed substantial changes in reef island shorelines at Huvadhoo Atoll between 1969 and 2019. Contrary to previous findings, our results found accretion was the dominant mode of island change whereby 53% of islands accreted, 25% eroded and 22% displayed no change. Our results provide evidence that islands are continually changing their shape and size as eight different types of island adjustment were documented in this study, with lagoon migration and parallel migration being the most dominant modes of adjustment. Of note, advancement of the lagoon shoreline was prevalent due to the artificial shorelines that were created on the lagoon side of anthropogenic islands. Thus, shoreline change was significantly higher on anthropogenic than natural islands, and the rates and magnitudes of island shoreline change were significantly higher on anthropogenic islands than on all other island types. Additionally, this study utilised numerical modelling with rates of shoreline change to estimate freshwater lens volume for 2030, 2050 and 2100 in response to changes in recharge and shoreline migration. Freshwater lens modelling inferred that lens volume was substantially impacted by shoreline change compared to changes in recharge, whereby shoreline accretion led to large increases in lens volume. As islands predominantly accreted in this study, overall an increase in island lens volume was found across all timeframes and emissions scenarios, which remained the case when anthropogenic islands were removed from calculations. The capacity for accreting islands to increase their storage of groundwater over the coming decades offers new insights into groundwater resources in the Maldives. Our findings have implications for reef island management as the immobilisation of shorelines through hard engineering (e.g., construction of sea walls and concrete harbours) compromises the value of these geomorphic ecosystem services and, in turn, reef island physical resilience to climate change. We suggest that the capacity of reef islands to both (1) adjust their shorelines, and even accrete, under conditions of sea level rise; and (2) increase their storage of groundwater over the coming decades represents highly valuable geomorphic ecosystem services.
The original contributions presented in the study are included in the article/Supplementary Material. Further inquiries can be directed to the corresponding author.
LC and HE conceived the study. Island shoreline analyses were undertaken by LC, MC, KL, VN, DS and LT. LC undertook numerical modelling of groundwater resources. LC and AS carried out the statistical analyses. LC wrote the manuscript with input from HE, VE and AS. All authors contributed to the article and approved the submitted version.
LC was supported by a Ph.D studentship from Northumbria University. AS was supported by a Vice Chancellor’s Senior Research Fellowship from Northumbria University.
The authors declare that the research was conducted in the absence of any commercial or financial relationships that could be construed as a potential conflict of interest.
All claims expressed in this article are solely those of the authors and do not necessarily represent those of their affiliated organizations, or those of the publisher, the editors and the reviewers. Any product that may be evaluated in this article, or claim that may be made by its manufacturer, is not guaranteed or endorsed by the publisher.
The Supplementary Material for this article can be found online at: https://www.frontiersin.org/articles/10.3389/fmars.2023.1070217/full#supplementary-material
Alsumaiei A. A., Bailey R. T. (2018a). Quantifying threats to groundwater resources in the republic of Maldives part I: Future rainfall patterns and sea-level rise. Hydrological Processes 32 (9), 1137–1153. doi: 10.1002/hyp.11480
Alsumaiei A. A., Bailey R. T. (2018b). Quantifying threats to groundwater resources in the republic of Maldives part II: Recovery from tsunami marine overwash events. Hydrological Processes 32 (9), 1154–1165. doi: 10.1002/hyp.11473
Andréfouët S., Muller-Karger F. E., Robinson J. A., Kranenburg C. J., Torres-Pulliza D., Spraggins S. A., et al. (2006). “Global assessment of modern coral reef extent and diversity for regional science and management applications: a view from space,” in Proceedings of the 10th international coral reef symposium, Okinawa, Japan, 28 June-32nd July 2004. Ed. Suzuki Y., et al (Japanese Coral Reef Society).
Aslam M., Kench P. S. (2017). Reef island dynamics and mechanisms of change in huvadhoo atoll, republic of Maldives, Indian ocean. Anthropocene. 18, 57–68. doi: 10.1016/j.ancene.2017.05.003
Bailey R. T., Barnes K., Wallace C. D. (2016). Predicting future groundwater resources of coral atoll islands. Hydrological Processes 30 (13), 2092–2105. doi: 10.1002/hyp.10781
Bailey R. T., Jenson J. W. (2014). Effects of marine overwash for atoll aquifers: Environmental and human factors. Groundwater 52 (5), 694–704. doi: 10.1111/gwat.12117
Bailey R. T., Jenson J. W., Olsen A. E. (2009). Numerical modeling of atoll island hydrogeology. Ground Water 47 (2), 184–196. doi: 10.1111/j.1745-6584.2008.00520.x
Bailey R. T., Khalil A., Chatikavanij V. (2014). Estimating transient freshwater lens dynamics for atoll islands of the Maldives. J. Hydrology. 515, 247–256. doi: 10.1016/j.jhydrol.2014.04.060
Barthiban S., Lloyd B. J., Maier M. (2012). Sanitary hazards and microbial quality of open dug wells in the Maldives islands. J. Water Resource Prot. 04 (07), 474–486. doi: 10.4236/jwarp.2012.47055
Biribo N., Woodroffe C. D. (2013). Historical area and shoreline change of reef islands around Tarawa atoll, Kiribati. Sustainability Sci. 8 (3), 345–362. doi: 10.1007/s11625-013-0210-z
Bramante J., Ashton A., Storlazzi C., Cheriton O. M., Donnelly J. P. (2020). Sea Level rise will drive divergent sediment transport patterns on fore reefs and reef flats, potentially causing erosion on atoll islands. J. Geophysical Research: Earth Surface 125 (10). doi: 10.1029/2019JF005446
Caldwell P. C., Merrifield M. A., Thompson P. R. (2015). “Sea Level measured by tide gauges from global oceans – the joint archive for Sea level holdings (NCEI accession 0019568), version 5.5,” in NOAA National centers for environmental information, dataset. doi: 10.7289/V5V40S7W
Carrington K., Hogg R., Scott J., Sozzo M.. (2018). The palgrave handbook of criminology and the global south, the palgrave handbook of criminology and the global south. doi: 10.1007/978-3-319-65021-0
Chollett I., Mumby P. J. (2012). Predicting the distribution of montastraea reefs using wave exposure. Coral Reefs 31 (2), 493–503. doi: 10.1007/s00338-011-0867-7
Chui T. F. M., Terry J. P. (2012). Modeling fresh water lens damage and recovery on atolls after storm-wave washover. Ground Water 50 (3), 412–420. doi: 10.1111/j.1745-6584.2011.00860.x
Chui T. F. M., Terry J. P. (2013). Influence of sea-level rise on freshwater lenses of different atoll island sizes and lens resilience to storm-induced salinization. J. Hydrology. 502, 18–26. doi: 10.1016/j.jhydrol.2013.08.013
Collen J. D., Garton D. W., Gardner J. P. A. (2009). Shoreline changes and sediment redistribution at palmyra atoll (Equatorial pacific ocean): 1874-present. J. Coast. Res. 25 (3), 711–722. doi: 10.2112/08-1007.1
Dickinson W. R. (2009). Pacific atoll living: How long already and until when? GSA Today 19 (3), 4–10. doi: 10.1130/GSATG35A.1
Duvat V. K. E. (2019). A global assessment of atoll island planform changes over the past decades. Wiley Interdiscip. Reviews: Climate Change 10 (1), 1–16. doi: 10.1002/wcc.557
Duvat V. K. E., Magnan A. K. (2019). Rapid human-driven undermining of atoll island capacity to adjust to ocean climate-related pressures. Sci. Rep. 9 (1), 1–16. doi: 10.1038/s41598-019-51468-3
Duvat V. K. E., Pillet V. (2017). Shoreline changes in reef islands of the central pacific: Takapoto atoll, northern tuamotu, French Polynesia. Geomorphology. 282, 96–118. doi: 10.1016/j.geomorph.2017.01.002
Duvat V. K. E., Salvat B., Salmon C. (2017). Drivers of shoreline change in atoll reef islands of the tuamotu archipelago, French Polynesia. Global Planetary Change 158, 134–154. doi: 10.1016/j.gloplacha.2017.09.016
East H. K., Perry C. T., Kench P. S., Liang Y., Gulliver P. (2018). Coral reef island initiation and development under higher than present Sea levels. Geophysical Res. Lett. 45 (20), 11,265–11,274. doi: 10.1029/2018GL079589
East H. K., Perry C. T., Beetham E. P., Kench P. S., Liang Y. (2020). Modelling reef hydrodynamics and sediment mobility under sea level rise in atoll reef island systems. Global Planetary Change 192 (April), 103196. doi: 10.1016/j.gloplacha.2020.103196
Fletcher C., Rooney J., Barbee M., Lim S. C., Richmond B. (2003). ‘Mapping shoreline change using digital orthophotogrammetry on Maui, hawaii.’. J. Coast. Res., 106–124.
Ford M. (2012). Shoreline changes on an urban atoll in the central pacific ocean: Majuro atoll, Marshall islands. J. Coast. Res. 279 (May), 11–22. doi: 10.2112/jcoastres-d-11-00008.1
Ford M. (2013). Shoreline changes interpreted from multi-temporal aerial photographs and high resolution satellite images: Wotje atoll, Marshall islands. Remote Sens. Environment. Elsevier Inc. 135, 130–140. doi: 10.1016/j.rse.2013.03.027
Ford M. R., Kench P. S. (2015). Multi-decadal shoreline changes in response to sea level rise in the Marshall islands. Anthropocene 11, 14–24. doi: 10.1016/j.ancene.2015.11.002
Graham N. A. J., Jennings S., MacNeil M. A., Mouillot D., Wilson S. K. (2015). Predicting climate-driven regime shifts versus rebound potential in coral reefs. Nature. 518 (7537), 94–97. doi: 10.1038/nature14140
Gutiérrez J. M., Jones R. G., Narisma G. T., Alves L. M., Amjad M., Gorodetskaya M., et al. (2021). “Atlas,” in Climate change 2021: The physical science basis. contribution of working group I to the sixth assessment report of the intergovernmental panel on climate change. Eds. Masson-Delmotte V., Zhai P., Pirani A., Connors S. L., Péan C., Berger S., et al. (Cambridge University Press), Press. Available at: http://interactive-atlas.ipcc.ch/. Interactive Atlas.
Hamlin S. N., Anthony S. S. (1987). “‘Ground-water resources of the Laura area, Majuro atoll, Marshall islands’,” in USGS water resources investigation report, 87–4047. Available at: https://pubs.usgs.gov/wri/1987/4047/report.pdf.
Hamylton S., East H. (2012). A geospatial appraisal of ecological and geomorphic change on diego garcia atoll, chagos islands (British indian ocean territory). Remote Sens. 4 (11), 3444–3461. doi: 10.3390/rs4113444
Hayes M. A., Jesse A., Welti N., Tabet B., Lockington D., Lovelock C. E. (2019). Groundwater enhances above-ground growth in mangroves. J. Ecol. 107 (3), 1120–1128. doi: 10.1111/1365-2745.13105
Hill N. A., Pepper A. R., Puotinen M. L., Hughes M. G., Edgar G. J., Barrett N. S., et al. (2010). Quantifying wave exposure in shallow temperate reef systems: Applicability of fetch models for predicting algal biodiversity. Mar. Ecol. Prog. Ser. 417 (Walker 1998), 83–95. doi: 10.3354/meps08815
Hoegh-Guldberg O., Mumby P. J., Hooten A. J., Steneck R. S., Greenfield Gomez E., et al. (2007). Coral reefs under rapid climate change and ocean acidification. Sci. (New York N.Y.) 318 (5857), 1737–1742. doi: 10.1126/science.1152509
IPCC. (2019). IPCC Special Report on the Ocean and Cryosphere in a Changing Climate [Pörtner H.-O., Roberts D. C., Masson-Delmotte V., Zhai P., Tignor M., Poloczanska E., et al (eds.)]. In press, https://www.ipcc.ch/srocc
Jaleel M. I., Ibrahim S. A., Hussain A., Mustafa M., Pathirana A. (2020). A screening approach for assessing groundwater quality for consumption in small islands: Case study of 45 inhabited islands in the Maldives. Water (Switzerland) 12 (8), 2209. doi: 10.3390/w12082209
Kench P. S., McLean R. F., Nichol S. L. (2005). New model of reef-island evolution: Maldives, Indian Ocean. Geology 33 (2), 145–148.
Kench P. S., Brander R. W. (2006). Response of reef island shorelines to seasonal climate oscillations: South maalhosmadulu atoll, Maldives. J. Geophysical Research: Earth Surface 111 (1), 1–12. doi: 10.1029/2005JF000323
Kench P. S., Cowell P. J. (2002). “Variations in sediment production and implications for atoll island stability under rising sea level,” in Proceedings of the ninth international coral reef symposium, Bali, 23-27 October 2000, 2(October 2000), 1181–1186.
Kench P. S, Owen S. D., Ford M. R. (2014). Sea level in the central pacific ocean. 41, 820–827. doi: 10.1002/2013GL059000.Received
Kench P. S, Thompson D., Ford M. R., Ogawa H, McLean R. F. (2015). Coral islands defy sea-level rise over the past century: Records from a central pacific atoll. Geology 43 (6), 515–518. doi: 10.1130/G36555.1
Kench P. S., Beetham E., Turner T., Morgan K. M., Owen S. D., McLean R. F. (2022). Sustained coral reef growth in the critical wave dissipation zone of a maldivian atoll. Commun. Earth Environment. 3 (1), 9. doi: 10.1038/s43247-021-00338-w
Kench P. S., Ford M. R., Owen S. D. (2018). Patterns of island change and persistence offer alternate adaptation pathways for atoll nations. Nat. Commun. 9 (1). doi: 10.1038/s41467-018-02954-1
Kench P. S., McLean R. F., Owen S. D., Ryan E., Morgan K. M., Ke L., et al. (2020). Climate-forced sea-level lowstands in the Indian Ocean during the last two millennia. Nat. Geos. 13 (1), 61–64. doi: 10.1038/s41561-019-0503-7
Ketabchi H., Mahmoodzadeh D., Ataie-Ashtiani B., Werner A. D., Simmons C. T. (2014). Sea-Level rise impact on fresh groundwater lenses in two-layer small islands. Hydrological Processes 28 (24), 5938–5953. doi: 10.1002/hyp.10059
Le Cozannet G., et al. (2013). Exploring the relation between sea level rise and shoreline erosion using sea level reconstructions: an example in French Polynesia. J. Coast. Res. 165 (65), 2137–2142. doi: 10.2112/si65-361.1
Leoni B., Zanotti C., Nava V., Rotiroti M., Stefania G. A., Fallati L., et al. (2021). Freshwater system of coral inhabited island: Availability and vulnerability (Magoodhoo island of faafu atoll – Maldives). Sci. Total Environ. 785, 147313. doi: 10.1016/j.scitotenv.2021.147313
Liu Y., Peng Z., Zhou R., Song S., Liu W., You C., et al. (2014). Acceleration of modern acidification in the south China Sea driven by anthropogenic CO2. Sci. Rep. 4, 1–5. doi: 10.1038/srep05148
Mandlier P. G. (2013). Field observations of wave refraction and propagation pathways on coral reef platforms. Earth Surface Processes Landforms 38 (9), 913–925. doi: 10.1002/esp.3328
Mandlier P. G., Kench P. S. (2012). Analytical modelling of wave refraction and convergence on coral reef platforms: Implications for island formation and stability. Geomorphology. 159–160, 84–92. doi: 10.1016/j.geomorph.2012.03.007
Mann T., Bayliss-Smith T., Westphal H. (2016). A geomorphic interpretation of shoreline change rates on reef islands. J. Coast. Res. 319 (October 2015), 500–507. doi: 10.2112/jcoastres-d-15-00093.1
Mann T., Westphal H. (2016). Multi-decadal shoreline changes on takú atoll, Papua new Guinea: Observational evidence of early reef island recovery after the impact of storm waves. Geomorphology 257, 75–84. doi: 10.1016/j.geomorph.2015.12.028
Masselink G., McCall R., Beetham E., Kench P., Storlazzi C. (2021). Role of future reef growth on morphological response of coral reef islands to Sea-level rise. J. Geophysical Research: Earth Surface, 1–21. doi: 10.1029/2020jf005749
McKoy H., Kennedy D. M., Kench P. S. (2010). Sand cay evolution on reef platforms, mamanuca islands, Fiji. Mar. Geology. 269 (1–2), 61–73. doi: 10.1016/j.margeo.2009.12.006
MoEnv. (2020). “Groundwater resource management and aquifer protection in Maldives, baseline assessment report,” in Ministry of environment, Male, Maldives.
Mollica N. R., Guo W., Cohen A. L., Huang K., Foster G. L., Donald H. K., et al. (2018). Ocean acidification affects coral growth by reducing skeletal density. Proc. Natl. Acad. Sci. United States America 115 (8), 1754–1759. doi: 10.1073/pnas.1712806115
Morgan L. K., Werner A. D. (2014). Seawater intrusion vulnerability indicators for freshwater lenses in strip islands. J. Hydrology 508, 322–327. doi: 10.1016/j.jhydrol.2013.11.002
Mörner N. A., Tooley M., Possnert G. (2004). New perspectives for the future of the Maldives. Global Planetary Change 40 (1–2), 177–182. doi: 10.1016/S0921-8181(03)00108-5
Morri C., Montefalcone M., Lasagna R., Gatti G., Rovere A., Parravicini V., et al. (2015). Through bleaching and tsunami: Coral reef recovery in the Maldives. Mar. pollut. Bull. 98 (1–2), 188–200. doi: 10.1016/j.marpolbul.2015.06.050
Myers N. (2002). Environmental refugees: A growing phenomenon of the 21st century. Philos. Trans. R. Soc. B: Biol. Sci. 357 (1420), 609–613. doi: 10.1098/rstb.2001.0953
NASA. (2022). Sea Level evaluation tool. Available at: https://sealevel.nasa.gov/sea-level-evaluation-tool (Accessed 12 August 2022).
Naseer A., Hatcher B. G. (2004). Inventory of the maldives’ coral reefs using morphometrics generated from landsat ETM+ imagery. Coral Reefs 23 (1), 161–168. doi: 10.1007/s00338-003-0366-6
National Bureau of Statistics (2014). Population and housing census statistical release VI: Housing and household characteristics. Sites J. Of 20Th Century Contemp. French Stud., 1–355.
National Bureau of Statistics. (2020). Statistical yearbook 2020. http://statisticsmaldives.gov.mv/yearbook/2020.
National Bureau of Statistics. (2021). Statistical yearbook 2021. http://statisticsmaldives.gov.mv/yearbook/2020.
Oberle F. K. J., Swarzenski P. W., Storlazzi C. D. (2017). Atoll groundwater movement and its response to climatic and sea-level fluctuations. Water (Switzerland) 9 (9), 1–18. doi: 10.3390/w9090650
Oude Essink G. H. P. (2001). Improving fresh groundwater supply - problems and solutions. Ocean Coast. Manage. 44 (5–6), 429–449. doi: 10.1016/S0964-5691(01)00057-6
Perry C. T., Kench P. S., Smithers S. G., Riegl B., Yamano Y., O'Leary M. J. (2011). Implications of reef ecosystem change for the stability and maintenance of coral reef islands. Global Change Biol. 17 (12), 3679–3696. doi: 10.1111/j.1365-2486.2011.02523.x
Perry C. T., Murphy G. N., Graham N. A.J., Wilson S. K., Januchowski-Hartley F. A., East H. K. (2015). Remote coral reefs can sustain high growth potential and may match future sea-level trends. Sci. Rep. 5, 4–11. doi: 10.1038/srep18289
Perry C. T., Spencer T., Kench P. S. (2008). Carbonate budgets and reef production states: A geomorphic perspective on the ecological phase-shift concept. Coral Reefs 27 (4), 853–866. doi: 10.1007/s00338-008-0418-z
Pinheiro J. (2023). _nlme: Linear and nonlinear mixed effects models_. R nlme version 3.1.162. Available at: https://CRAN.R-project.org/package=nlme.
Purkis S. J., Gardiner R., Johnston M. W., Sheppard C. R. C.. (2016). A half-century of coastline change in Diego Garcia - the largest atoll island in the chagos. Geomorphology. 261, 282–298. doi: 10.1016/j.geomorph.2016.03.010
Rankey E. C. (2011). Nature and stability of atoll island shorelines: Gilbert island chain, Kiribati, equatorial pacific. Sedimentology 58 (7), 1831–1859. doi: 10.1111/j.1365-3091.2011.01241.x
Rasheed S., Warder S. C., Plancherel Y., Piggot M. D. (2020). Response of tidal flow regime and sediment transport in north male’ atoll, Maldives to coastal modification and sea level rise. Ocean Sci. Discussions, 1–27. doi: 10.5194/os-2020-80
Rohweder J., Johnson J. T., Anderson D., Clark S., Chamberlin F., Potter D., et al. (2012)‘Application of wind fetch and wave models for habitat rehabilitation and enhancement projects –2012 update’. Available at: http://www.umesc.usgs.gov/management/dss/wind_fetch_wave_models_2012update.html.
R Core Team (2021). R: A language and environment for statistical computing (Vienna, Austria: R Foundation for Statistical Computing). Available at: https://www.R-project.org/.
Scott F., Antolinez J., McCall R., Storlazzi C., Reniers A., Pearson S. (2020). Hydro-morphological characterization of coral reefs for wave runup prediction. Front. Mar. Sci. 7 (May), 1–20. doi: 10.3389/fmars.2020.00361
Sengupta M., Ford M. R., Kench P. S. (2021). Shoreline changes in coral reef islands of the federated states of Micronesia since the mid-20th century. Geomorphology 377, 107584. doi: 10.1016/j.geomorph.2020.107584
Stoddart D. R., Steers J. A. (1977). “The nature and origin of coral reef islands,” in Biology and geology of coral reefs, vol. 4. , 59–105.
Storlazzi C. D., Elias E. P. L., Berkowitz P. (2015). Many atolls may be uninhabitable within decades due to climate change. Sci. Rep. Nat. Publishing Group 5, 1–9. doi: 10.1038/srep14546
Storlazzi C. D., Gingerich S. B., Dongeren A. V., Cheriton O. M., Swarzenski P. W., Quataert E., et al. (2018). Most atolls will be uninhabitable by the mid-21st century because of sea-level rise exacerbating wave-driven flooding. Sci. Adv. 4 (4), 1–10. doi: 10.1126/sciadv.aap9741
Sully S., Burkepile D. E., Donovan M. K., Hodgson G., Woesik R. V. (2019). A global analysis of coral bleaching over the past two decades. Nat. Commun. 10 (1), 1–5. doi: 10.1038/s41467-019-09238-2
Terry J. P., Chui T. F. M. (2012). Evaluating the fate of freshwater lenses on atoll islands after eustatic sea-level rise and cyclone-driven inundation: A modelling approach. Global Planetary Change. 88–89, 76–84. doi: 10.1016/j.gloplacha.2012.03.008
Testut L., Duvat V., Ballu V., Fernandes R. M.S., Pouget F., Salmon C., et al. (2016). Shoreline changes in a rising sea level context: The example of grande glorieuse, scattered islands, Western Indian ocean. Acta Oecologica 72, 110–119. doi: 10.1016/j.actao.2015.10.002
Thieler E. R., Danforth W. W. (2016). Historical shoreline mapping (II): Application of the digital shoreline mapping and analysis systems (DSMS/DSAS) to shoreline change mapping in Puerto Rico stable URL : http://www.jstor.org/stable/4298256 REFERENCES linked references are available o. J. Coast. Res. 10 (3), 600–620. doi: 10.1140/epjd/e2012-30054-0
Thieler E. R., Himmelstoss E. A., Zichichi J. L., Ergul A. (2009). ‘The digital shoreline analysis system (DSAS) version 4.0-an ArcGIS extension for calculating shoreline change’, (No. 2008-1278), US geological survey.
Thornthwaite C. W. (1948). An approach toward a rational classification of climate. Geographical Rev. 38 (1), 55. doi: 10.2307/210739
U.S. Army Corps of Engineers (1984). Shore protection manual (Fort Belvoir, Virginia: Coastal Engineering Research Center).
Wadey M., Brown S., Nicholls R. J., Haigh I. (2017). Coastal flooding in the Maldives: an assessment of historic events and their implications. Natural Hazards. 89 (1), 131–159. doi: 10.1007/s11069-017-2957-5
Wear S. L., Thurber R. V. (2015). Sewage pollution: Mitigation is key for coral reef stewardship. Ann. New York Acad. Sci. 1355 (1), 15–30. doi: 10.1111/nyas.12785
Webb A. P., Kench P. S. (2010). The dynamic response of reef islands to sea-level rise: Evidence from multi-decadal analysis of island change in the central pacific. Global Planetary Change. 72 (3), 234–246. doi: 10.1016/j.gloplacha.2010.05.003
Wenger A. S., Williamson D. H., Silva E T., Ceccarelli D. M., Browne N. K., Petus C., et al. (2016). Effects of reduced water quality on coral reefs in and out of no-take marine reserves. Conserv. Biol. 30 (1), 142–153. doi: 10.1111/cobi.12576
Werner A. D., Sharp H. K., Galvis S. C., Post V. E. A., Sinclair P. (2017). Hydrogeology and management of freshwater lenses on atoll islands: Review of current knowledge and research needs. J. Hydrology. 551, 819–844. doi: 10.1016/j.jhydrol.2017.02.047
White I., Falkland T., Metutera T., Metai E., Overmars M., Perez P., et al. (2007). Challenges in freshwater management in low coral atolls. J. Cleaner Production 15 (16), 1522–1528. doi: 10.1016/j.jclepro.2006.07.051
White I., Falkland T. (2010). Management of freshwater lenses on small pacific islands. Hydrogeology J. 18 (1), 227–246. doi: 10.1007/s10040-009-0525-0
Woodroffe C. D. (2008). Reef-island topography and the vulnerability of atolls to sea-level rise. Global Planetary Change 62 (1–2), 77–96. doi: 10.1016/j.gloplacha.2007.11.001
Woodroffe C. D., McLean R. F., Smithers S. G., Lawson E. M. (2000). Atoll reef-island formation and response to sea-level change: West island, Cocos (Keeling) islands. Mar. Geology 170 (1–2), 331–346. doi: 10.1016/S0025-3227(00)00094-3
Yamano H., Kayanne H., Yamaguchi T., Kuwahara Y., Yokoki H., Shimazaki H., et al. (2007). Atoll island vulnerability to flooding and inundation revealed by historical reconstruction: Fongafale islet, Funafuti atoll, Tuvalu. Global Planetary Change 57 (3–4), 407–416. doi: 10.1016/j.gloplacha.2007.02.007
Yates M. L., Le Cozannet G., Garcin M., Salai E., Walker P. (2013). Multidecadal atoll shoreline change on manihi and manuae, French Polynesia. J. Coast. Res. 289 (February), 870–882. doi: 10.2112/jcoastres-d-12-00129.1
Keywords: shoreline change, coral reef islands, atoll, geomorphic ecosystem service, Indian Ocean, freshwater lens, groundwater, Maldives
Citation: Carruthers L, East H, Ersek V, Suggitt A, Campbell M, Lee K, Naylor V, Scurrah D and Taylor L (2023) Coral reef island shoreline change and the dynamic response of the freshwater lens, Huvadhoo Atoll, Maldives. Front. Mar. Sci. 10:1070217. doi: 10.3389/fmars.2023.1070217
Received: 24 October 2022; Accepted: 27 March 2023;
Published: 19 June 2023.
Edited by:
Juan Jose Munoz-Perez, University of Cádiz, SpainReviewed by:
Han Soo Lee, Hiroshima University, JapanCopyright © 2023 Carruthers, East, Ersek, Suggitt, Campbell, Lee, Naylor, Scurrah and Taylor. This is an open-access article distributed under the terms of the Creative Commons Attribution License (CC BY). The use, distribution or reproduction in other forums is permitted, provided the original author(s) and the copyright owner(s) are credited and that the original publication in this journal is cited, in accordance with accepted academic practice. No use, distribution or reproduction is permitted which does not comply with these terms.
*Correspondence: Lucy Carruthers, bHVjeTIuY2FycnV0aGVyc0Bub3J0aHVtYnJpYS5hYy51aw==
Disclaimer: All claims expressed in this article are solely those of the authors and do not necessarily represent those of their affiliated organizations, or those of the publisher, the editors and the reviewers. Any product that may be evaluated in this article or claim that may be made by its manufacturer is not guaranteed or endorsed by the publisher.
Research integrity at Frontiers
Learn more about the work of our research integrity team to safeguard the quality of each article we publish.