 Renee Mercaldo-Allen1
 Peter J. Auster2
 Paul Clark1
 Mark S. Dixon1
 Erick Estela1
 Yuan Liu1,3
 Lisa Milke1Gillian Phillips1,3Dylan Redman1
 Barry C. Smith1Alison Verkade4
 Julie M. Rose1*
- 1Milford Laboratory, Northeast Fisheries Science Center, National Oceanic and Atmospheric Administration (NOAA) Fisheries, Milford, CT, United States
- 2Mystic Aquarium & Department of Marine Sciences, University of Connecticut, Groton, CT, United States
- 3A.I.S. Inc., North Dartmouth, MA, United States
- 4Habitat and Ecosystem Services Division, Greater Atlantic Regional Fisheries Office, National Oceanic and Atmospheric Administration (NOAA) Fisheries, Gloucester, MA, United States
Oyster aquaculture gear may augment natural seafloor by providing structured habitat for economically important fish species. Underwater video census was used to assess fish abundance and community composition on eastern oyster (Crassostrea virginica) shelf and bag style aquaculture off-bottom cages and within natural rock reef habitat. During 2018, underwater cameras were mounted on four study cages at a dense shellfish farm of 40-100 commercial cages (dense cage farm), on four single cages interspersed on low relief seafloor (sparse cage farm), and amongst four boulders on a rock reef (rock reef), within an embayment off Milford, Connecticut, which is part of Long Island Sound, in the United States. In 2019, cameras were similarly deployed on two study cages per farm at each of three shellfish farms off Milford, Norwalk and Westport, CT. Video was recorded hourly in eight-minute segments from 7 am to 7 pm. Data loggers monitored seawater temperature, light intensity, and current speed. Fish abundance (MaxN) was calculated for all videos. We compared fish abundance and community composition between May and September, on cage and boulder habitat, on cages at dense and sparse farms and on cages across farm locations. In 2018, abundance of black sea bass (Centropristis striata), scup (Stenotomus chrysops) and tautog (Tautoga onitis) was significantly higher on cages than boulders, regardless of cage number. Cunner (Tautogolabrus adspersus) abundance was significantly higher on boulders than cages when cage sites were grouped. However pairwise comparisons indicated that cunner were significantly higher at the sparse cage farm versus the rock reef but cunner abundance on the dense cage farm and rock reef sites was not significantly different. Abundance of black sea bass, scup, tautog, and cunner were not significantly different across 2019 farm locations. Young-of-the-year fish occurred episodically at all sites during both years, with black sea bass and scup most abundant. Fish abundance corresponded to seasonal changes in seawater temperature and was highest at the warmest temperatures. Light intensity and current speed explained less variation in fish abundance relative to temperature, and relationships were inconsistent across habitats and farm locations Our results suggest that multi-tiered oyster aquaculture cages contribute structure to seafloor environments that provide habitat for temperate reef fish similar to natural rock reefs.
Introduction
Growing anecdotal and scientific evidence suggests that aquaculture gear may provide valuable habitat and ecosystem services for fish (e.g., Ferriss et al., 2021; Mercaldo-Allen et al., 2021; Shinn et al., 2021; Theuerkauf et al., 2021). Off-bottom cages, deployed on the seafloor but elevated several inches off the substrate, are increasingly employed for shellfish aquaculture along the eastern seaboard. These cages produce more oysters on a smaller spatial footprint than traditional on-bottom cultivation methods where oysters are grown on the seafloor (e.g., Walton et al., 2013; Archer et al., 2014; Scuderi and Chen, 2019; Mercaldo-Allen et al., 2021). Multi-tiered cages hold oysters on shelves in mesh bags or inside stacked trays and create physical structures with high vertical relief. While not identical to the biogenic structure, functional equivalent in size to boulder substrate, oyster cages can expand the quantity of hard bottom habitat available on soft sediments (Lefcheck et al., 2021). The scale of aquaculture operations, and the number, proximity and footprint of gear on the seafloor may influence the habitat value conferred by shellfish farms (Dumbauld et al., 2009). Cage size and configuration varies, affecting the amount of added structure, for example, standard shelf and bag cages (1.22 x 0.91 x 0.61 m) typically hold 3 shelves with oysters, but much larger cages are also used by shellfish growers, having as many as 20 stacked trays, and could contribute even higher relief habitat (Mercaldo-Allen et al., 2020; Mercaldo-Allen et al., 2021). Clusters of farms within the same region can provide contiguous patches of habitat that support movement of transient species (Erbland and Ozbay, 2008). Shellfish farms with high cage densities, which substantially increase the amount of structure in low relief areas, may function much like an artificial reef (e.g., DeAlteris et al., 2004; Marenghi et al., 2010). Oyster aquaculture cages that increase the surface area and substrate on the seafloor may supplement the habitat available for structure-oriented species.
Previous studies of fish associated with oyster aquaculture cages in the temperate Northwest Atlantic region have used traditional sampling methods, that typically involved disturbance of natural communities (e.g., lift nets, quadrats, suction dredging, fish traps) and demonstrated that shellfish farms are populated by species associated with hard bottom seafloor environments, including black sea bass (Centropristis striata), cunner (Tautogolabrus adspersus), scup (Stenotomus chrysops), and tautog (Tautoga onitis) (e.g., DeAlteris et al., 2004; Tallman and Forrester, 2007; Mercaldo-Allen et al., 2020). A synthesis of available data on provisioning of ecosystem services by shellfish aquaculture concluded that fish abundance is generally higher on farms relative to unstructured or structured seafloor (Barrett et al., 2022). This synthesis also observed that fish assemblages on farms are more similar in composition to those on structured seafloor versus unstructured seafloor. A literature review and meta-analysis of habitat-related interactions with bivalve aquaculture also corroborated higher abundance and species richness of fish and macrofauna on aquaculture versus structured or unstructured seafloor, with notable increases in wild fauna associated with addition of oyster aquaculture (Theuerkauf et al., 2021). Although these studies clearly substantiate the important role that aquaculture gear may serve as habitat for structure-oriented fish assemblages, direct underwater observations of fish in and around aquaculture gear with minimal disturbance are needed to observe how these structures function as habitat for fish.
Underwater video census has become a widely accepted method for assessing fish in habitats with irregular topography, like rocks and reefs, where it is more difficult to apply traditional methods of sampling, such as trawling (Clarke et al., 2010). Small, rugged, waterproof digital or “action” cameras (Struthers et al., 2015) offer a relatively low cost and easy way to collect high quality video that is readily accessible to researchers and citizen scientists alike (e.g., Florisson et al., 2018; Zarco-Perello and Enríquez, 2019; Ulrich and Bonar, 2020). Recently these video methods have been extended to aquaculture gear and naturally occurring habitat (e.g., Muething et al., 2020; Ferriss et al., 2021; Mercaldo-Allen et al., 2021; Shinn et al., 2021).Video recording of fish interactions with aquaculture gear and natural structure can reveal how fish species at various life history stages use these habitats, produce indices of fish abundance, discern patterns of community composition, identify habitat-specific behaviors and visualize provision of ecosystem services. However, video analysis is extremely labor-intensive, and this recent research has had spatial and/or temporal limitations that constrained the conclusions that could be drawn from the data.
Temperate reef fish that associate with aquaculture gear in the northwest Atlantic generally demonstrate high affinity for complex habitat and inhabit cobble and boulder seafloor, as well as artificial and manmade structures (e.g., piers, pipelines, cables, shipwrecks, sunken planes; Olla et al., 1975; Steimle and Zetlin, 2000; Tallman and Forrester, 2007). More recently, artificial structures such as wind farms and oil platforms have also been shown to attract and increase numbers of hard bottom fish (Bolser et al., 2020). Habitat complexity, abundance of colonizing organisms, and extent of structured seafloor influence the composition of fish assemblages (Pickering and Whitmarsh, 1997; Parsons et al., 2016). For structure-dependent fishes, prevalence of hard substrate and seafloor complexity can be a limiting factor in population size and distribution (Olla et al., 1975). In the central basin of Long Island Sound, where the seafloor consists primarily of low relief sand and shell bottom, natural rock reef habitat is relatively limited and patchy in distribution (Poppe et al., 2000; Zajac et al., 2000). Oyster aquaculture cages that add complexity to seafloor environments may contribute emergent habitat to areas with low vertical relief and little natural structure. In this way, aquaculture farms may function like artificial reefs, with the potential to enhance carrying capacity and abundance of species with ecological and economic importance, including black sea bass, scup, tautog, and cunner, which have habitat bottlenecks that limit survival in surrounding natural habitats (Folpp et al., 2020).
This research is important for a shellfish aquaculture industry that has experienced rapid growth over the last decade (FAO, 2022). The majority of shellfish aquaculture farms in the United States are currently located in the nearshore environment, frequently in close proximity to coastal communities. A growing industry and visibility has contributed to a broad public discussion of the importance of sustainable aquaculture development (Naylor et al., 2021; Rubino, 2023). Scientific reviews of shellfish aquaculture-environment interactions (Dumbauld et al., 2009; Shumway, 2011), and of the potential interactions between aquaculture and wildlife (Barrett et al., 2019) have highlighted the importance of careful farm siting but also the potential ecological benefits that farms may provide. Video of fish around aquaculture gear may enhance public understanding of farming practices and contribute to ongoing discussions in coastal communities regarding shellfish cultivation. Sharing of underwater video footage via websites and social media provides an outreach tool that can visually communicate scientific observations to a broader audience (Struthers et al., 2015; Danylchuk et al., 2018). Visual observations of ecosystem services provided to fish by aquaculture gear are critical to effective fisheries management decisions around permitting of aquaculture sites and regulation of farming practices.
Research is needed to better understand the ecosystem services provided by aquaculture gear relative to natural structured habitats, the influence of cage number on habitat value and whether fish abundance and community composition is consistent across farm sites at different geographic locations. Our study goals were to 1. compare fish abundance and community composition on oyster aquaculture cages to natural structured boulder habitat (grouped cage farm sites vs. rock reef; 2018), 2. compare fish abundance and community composition at dense and sparse cage farms (dense cage farm vs. sparse cage farm; 2018) and 3. compare fish abundance and community composition across multiple shellfish farms at different geographic locations (Milford vs. Norwalk vs Westport farms; 2019).
Materials and methods
Habitat comparison
To assess fish interactions with aquaculture gear relative to natural structure, we studied shellfish farms with high (dense) and low (sparse) cage abundance versus boulders on a rock reef. Three study sites were located in the same embayment west of Charles Island, near Milford Connecticut, within central Long Island Sound (Figure 1A). The dense cage farm site, with 40-100 commercial cages, was located on a 0.11 km2 (27.2 acres) shellfish lease, permitted for up to 200 off-bottom cages. An adjacent 0.25 km2 (61.8 acres) lease, permitted for up to 250 off-bottom cages, was co-located at the dense cage farm site. As these were working farms, the number of cages in the area varied on any particular day and across the season and limited our ability to test the effect of specific cage density itself. Four study cages were placed at the dense cage farm site and cages were spaced 47.5 m (156 ft) apart.
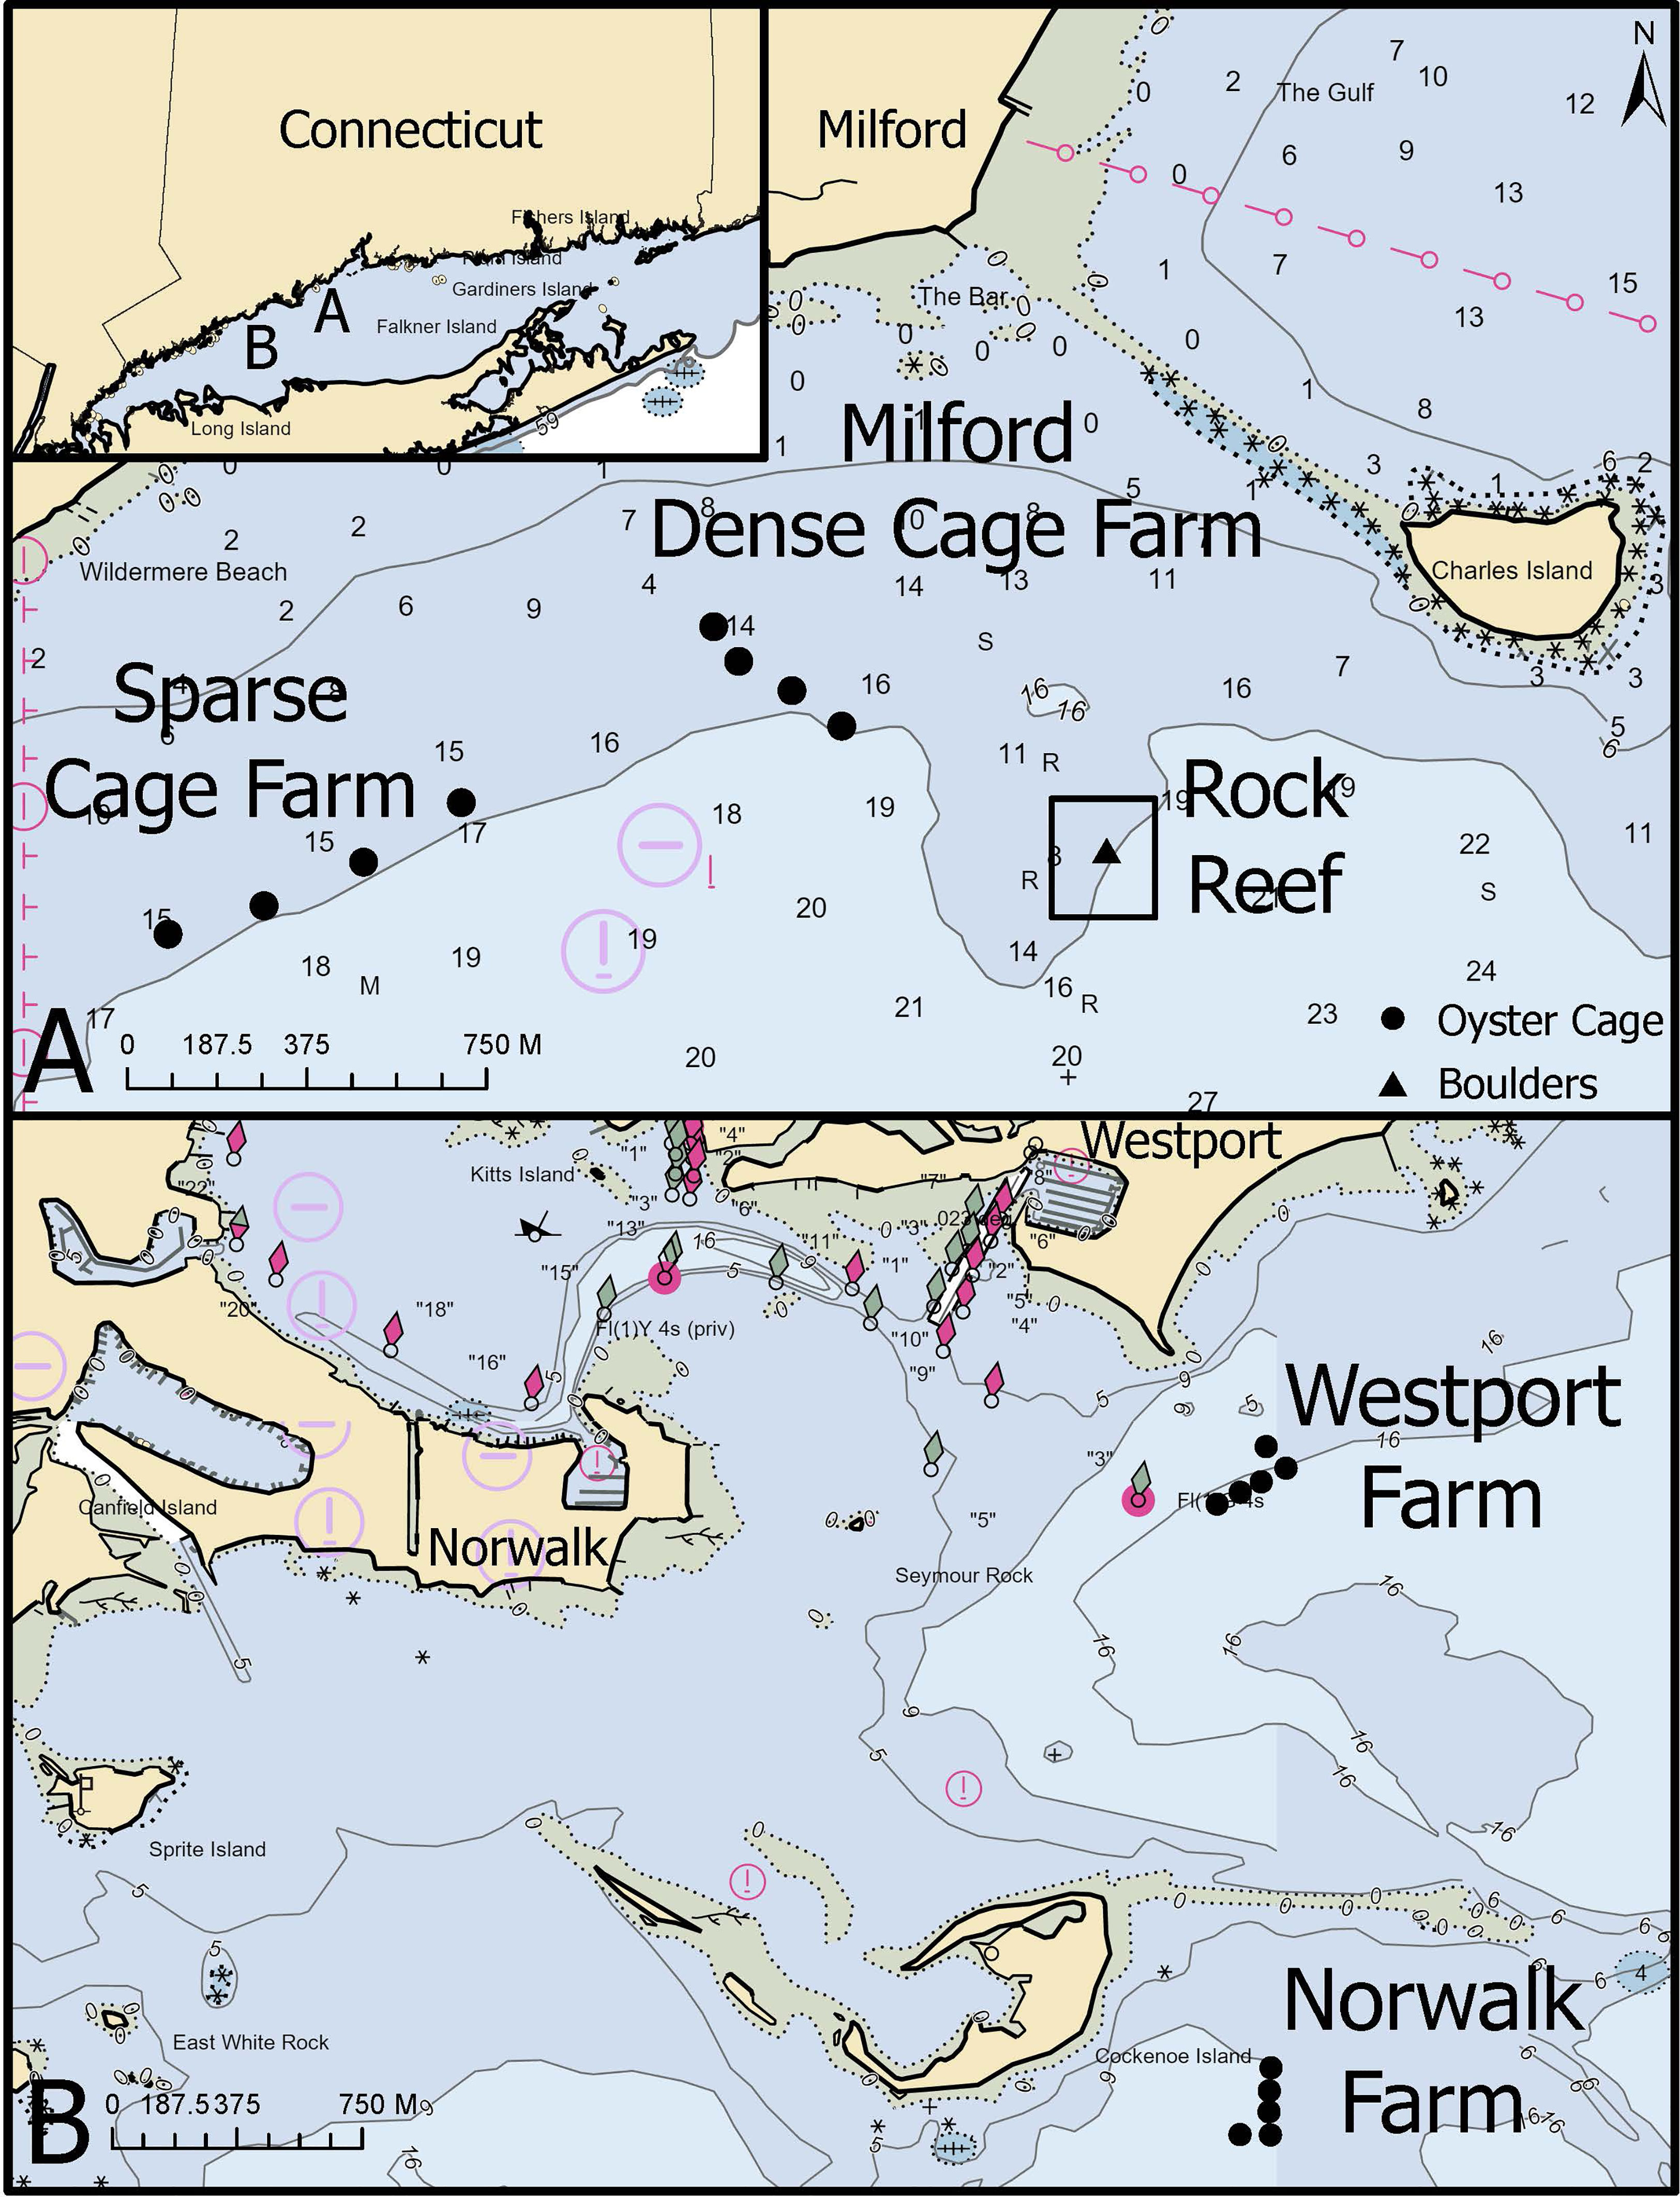
Figure 1 Map of study sites, including cages placed at dense and sparse farms, a rock reef, and three commercial shellfish farms. Inset map shows location of sites within Long Island Sound, USA. Symbols indicate the placement of individual cages or boulders with adjacent T-platform stands; the four t-platform stands at the rock reef site could not be delineated at this map scale. Numbers indicate water depth in meters. (A) Sites within a single embayment near Milford, CT, included a natural cobble and boulder rock reef (rock reef), 5 single cages (sparse cage farm), and cages deployed adjacent to a commercial oyster farm (dense cage farm). The rock reef and sparse cage farm sites were only sampled in 2018; the dense cage farm location was sampled in both 2018 (dense cage farm) and 2019 (Milford farm). (B) Two additional farms were sampled in 2019 (Norwalk and Westport).
A smaller farm containing five cages, the sparse cage farm site, was located at the intersection of 2 large shellfish leases, each 0.20 km2 (51 acres) in size, where traditional on-bottom oyster aquaculture with no off bottom gear was underway. Here, the sand and shell bottom was characterized by low vertical relief, contained areas of live oysters and empty shell valves, and was devoid of rocks or boulders. Study cages were deployed 82 m (270 ft) apartin a line along the delineation between the two on-bottom aquaculture leases. This small farm of 5 cages was designated a “sparse” farm relative to the “dense” farm that had up to 100 cages in the study area.
The rock reef site, consisting of cobble and boulder substrate, served as a structured control site for natural hard bottom habitat. The reef was horseshoe-shaped, patchy and covered 0.25 km2 (61.8 acres) of seafloor. Cobble and boulders composed up to 70% of the reef substrate (Mercaldo-Allen et al., 2011). Four boulders, a minimum of 10 m apart and out of visual range of one another, were selected for study within the reef.
Distances between the Milford study sites (dense cage farm, sparse cage farm and rock reef) ranged from 745 to 1,537 m (Mercaldo-Allen et al., 2020). Water depths at high tide measured 4.6 m (15 ft) at the dense cage farm, and 6.1 m (20 ft) at the sparse cage farm and rock reef sites. During the May to September study period, temperature and salinity in the Milford embayment ranged from 11.9 to 24.7°C and from 20.1 to 28.2 PSU, respectively.
Farm location comparison
To compare fish abundance and community composition among oyster cage farms at several geographic locations, two study cages were placed at each of three established, active commercial oyster aquaculture bottom cage farms in the coastal waters of Milford, Norwalk and Westport, Connecticut (Figure 1B). The Milford Farm site was the same location as the dense cage farm site in 2018, and was described above. The other two farms were located in western Long Island Sound. The Norwalk Farm was a 0.5 km2 (1.2 acre) lease permitted for 50 cages near Cockenoe Shoals. The Westport Farm was situated further inshore on a 0.67 km2 (16.1 acre) lease permitted for 10 cages adjacent to Cedar Point (Figure 1B). The Norwalk and Westport farms were located 1,852 m apart. Study cages were placed 45.7 m (156 ft) apart at Milford, 61 m (200 ft) apart at Westport and 71 m (233 ft) apart at Norwalk. Water depths at high tide measured 4.6 m (15 ft) at Milford, 5.5 m (18 ft) at Norwalk and 7.6 m (25 ft) at Westport. The Westport and Norwalk Farms were approximately 25.5 and 26.8 km from the Milford Farm, respectively.
Cages were deployed at the Milford Farm on May 29th and at the Norwalk and Westport farms on May 30th, 2019. Cages remained on all 3 sites until the last sampling date, September 19th. Video was collected on seven camera deployments dates at the Milford, Norwalk and Westport farms from June to September 2019.
Oyster aquaculture cages and camera deployments
We used commercially-available shelf and bag style oyster aquaculture bottom cages (Ketcham Supply, New Bedford MA, USA) constructed of 11.43 cm mesh, heavy duty 8-gauge vinyl coated wire, with 2 reinforced 3.81 cm wire mesh feet. Wire mesh feet elevated cages 15.2 cm off the seafloor, and 10 bricks were added to each cage foot for ballast. Cages measured 1.22 x 0.91 x 0.61 m, and had 3 shelves, each holding 2 bags of oysters (6 bags per cage). Bags, made from 2.3 cm plastic mesh, measured 1.07 m long by 0.52 m wide. Cages were stocked with 150-200 seed oysters measuring 2.5 to 4.5 cm in size. Cage handling methods and oyster stocking densities reflect general industry practices (Charles Viens, Charles Island Oyster Farm, pers. comm).
We mounted cameras on four cages at each farm following previously published protocols (Mercaldo-Allen et al., 2021); briefly, we used ~0.6 m of 2.22 cm flex marine wet exhaust and water hose coupled with a section of 0.84 cm outer diameter PVC pipe, which provided stability and shock absorption to cameras during cage handling. This side mount, which hung 0.3 m off the cage corner, provided a view of 2 cage sides and the interface between cage and seafloor (Figure 2A). To collect video of the upper cage surface, the top camera mount was positioned like a periscope at the cage corner, providing a view of the entire horizontal cage surface (Figure 2A).
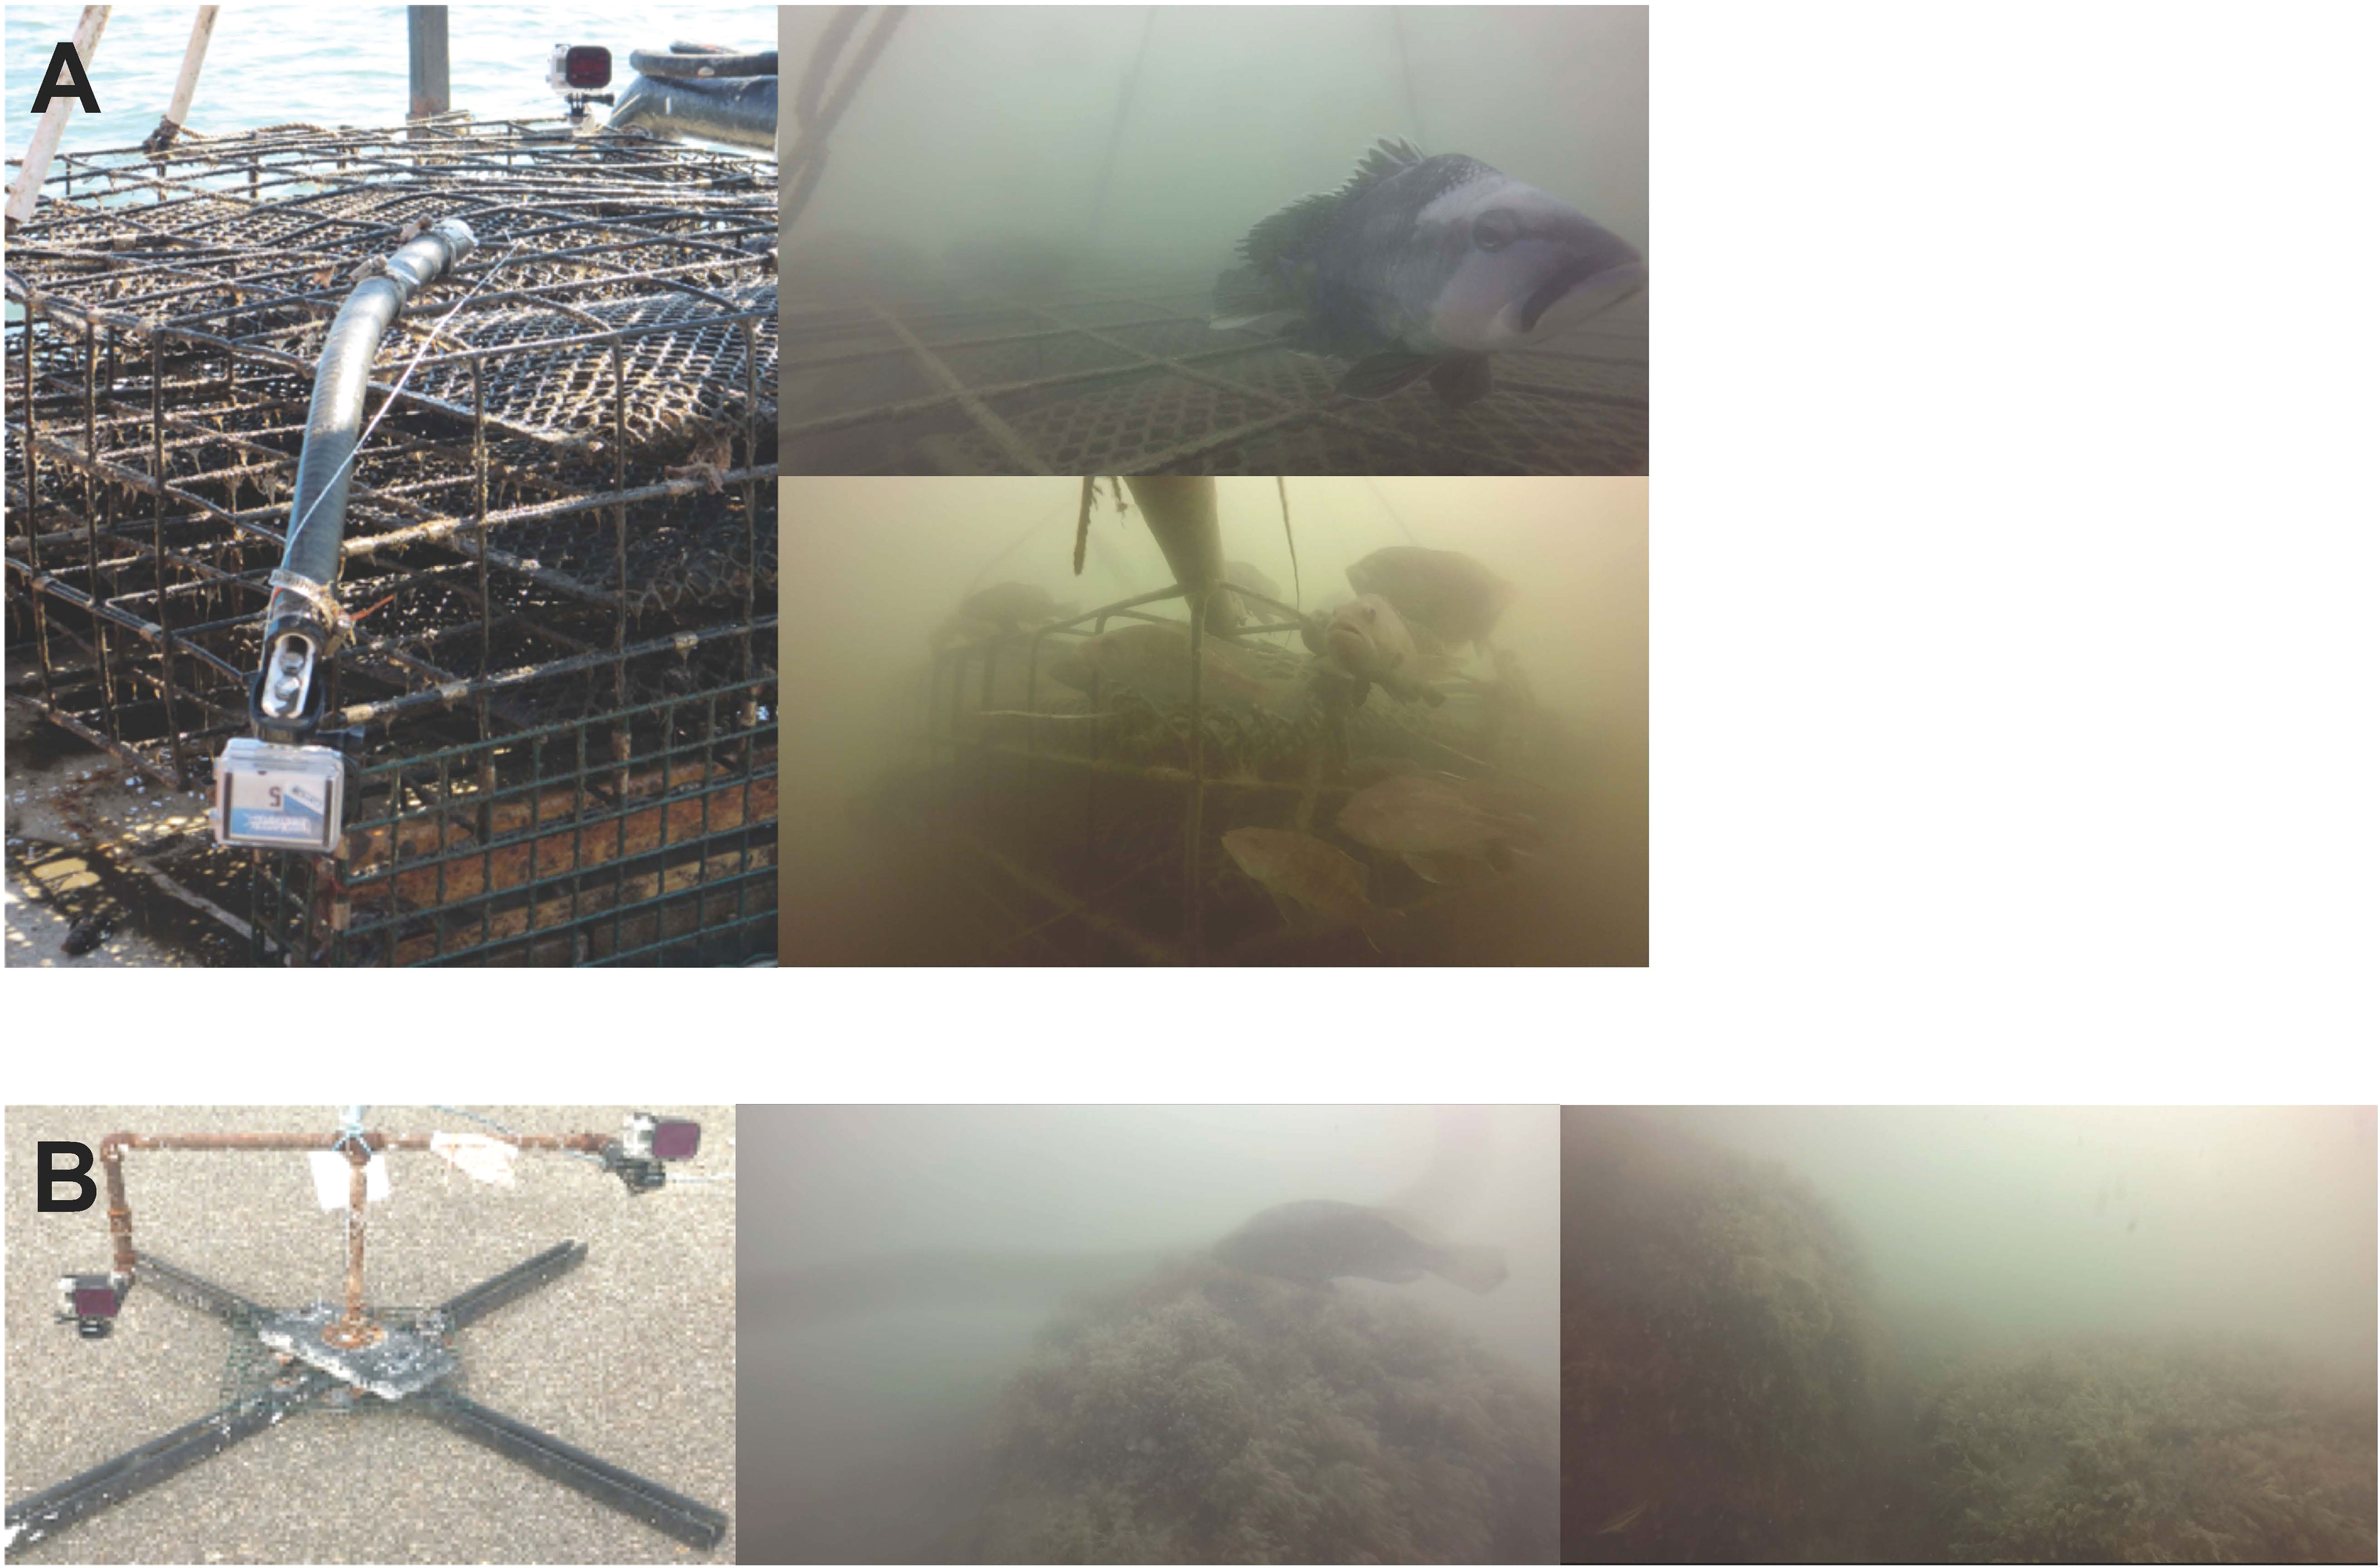
Figure 2 Photographs of camera placements on cages and T-platform stands, and the corresponding views provided by each camera. (A) Cameras were attached to cages that provided perspective across the top of the cage surface, down two sides of the cage, and the cage-seafloor interface. (B) Cameras were deployed adjacent to boulders using a minimal-structure “T-platform” stand that provided perspective across the boulder top, side, and boulder-seafloor interface.
On day 1 of camera deployments, each individual study cage was mechanically hauled onto the deck of the boat, 2 cameras were attached and each cage was redeployed. Video recording at hourly intervals took place from 7 am to 7 pm on day 2. On day 3, the cages were brought back on deck, cameras were retrieved and the cages were returned to the seafloor. This was repeated for all cage sites during both years of cage deployments.
Boulders on rock reef
Boulder deployments on the rock reef site in 2018 also followed previously published protocols (Mercaldo-Allen et al., 2021): divers selected 4 boulders (~ 40 to 55 cm in height) to use repeatedly in video recording deployments. The rock reef site was marked by placing a central hub made from 2 cinder blocks on the seafloor and attaching this hub to a buoyed line. Individual boulders, selected in each of the four compass directions (4 boulders total), were spaced at a minimum distance of 10 m from the hub and were out of visual range of one another. Ground lines were laid from the hub to each boulder so that divers could relocate the 4 boulders during subsequent camera deployments and retrievals while minimizing the overall structure added to the rock reef site.
We constructed T-platform stands to mount cameras among boulders that provided a similar perspective to cage-mounted cameras and minimized added structure to the rock reef site, as described previously in Mercaldo-Allen et al. (2021) (Figure 2B). The height of each T-platform was customized to match the elevation of the boulders. Three boulders had similar heights and were paired with T-platforms that measured 45.7 cm high. The 4th boulder was taller and required a T-platform that measured 71 cm high. The stands were built from pieces of threaded metal pipe with 2 mounting arms, positioned 69 cm apart. The X-shaped base was constructed using a 4.1 cm Aickinstrut fiberglass channel with 90° brackets. Vinyl-coated mesh, with 2.54 cm openings, was bolted to the top of the strut. A zinc plate measuring 12.7 x 25.4 cm and weighing 16 kg, bolted to the top of the mesh, provided ballast. A 1.3 cm floor flange was attached to the top of the zinc plate. Interchangeable 1.3 cm threaded black pipe was used to adjust the T-platforms to the height of each replicate boulder. The base was painted black to better blend in with the seafloor. Each T-platform was placed 40 to 60 cm from a boulder to ensure a similar field of view across boulders of slightly varying heights. One camera was positioned to record across the top boulder surface while the other camera captured the side of the boulder and the boulder-seafloor interface. Divers manually attached and detached cameras from mounting clips on each T-platform stand.
Camera recording and environmental parameters
Camera recording followed protocols described in Mercaldo-Allen et al. (2021). Briefly, time-synched GoPro Hero® Silver 3+ cameras were programmed to record video at 30 frames per second, 1920 x 1080 resolution 10 megapixel, with a wide angle lens (firmware v03.02). Cameras were housed within a polycarbonate waterproof case with BacPac® attachment to accommodate a timer. A Polar Pro® magenta filter, with a 0.5 stop reduction in exposure, was affixed to each camera lens to reduce natural green coloration in video. Intervalometer Blink® timers (CamDo) were paired with GoPro cameras to delay onset of video recording and extend battery life. Cameras were deployed unbaited. Video recording began approximately 24-hours after cameras were deployed, which was intended to reduce deployment-related disturbance effects on fish abundance and behavior. Video was recorded for 8 minutes every hour from 7AM to 7PM, yielding 13 recordings per camera deployment, which enabled collection over a complete tidal cycle and most daylight hours.
We collected video on the dense cage farm during all 17 weekly camera deployments over the 17-week study period from May to September 2018 (Table 1). Nine camera deployment dates compared fish abundance and community composition on the structure provided by cages versus boulders (dense cage farm vs rock reef), and 8 camera deployment dates compared fish abundance and community composition at the dense cage farm versus the sparse cage farm.
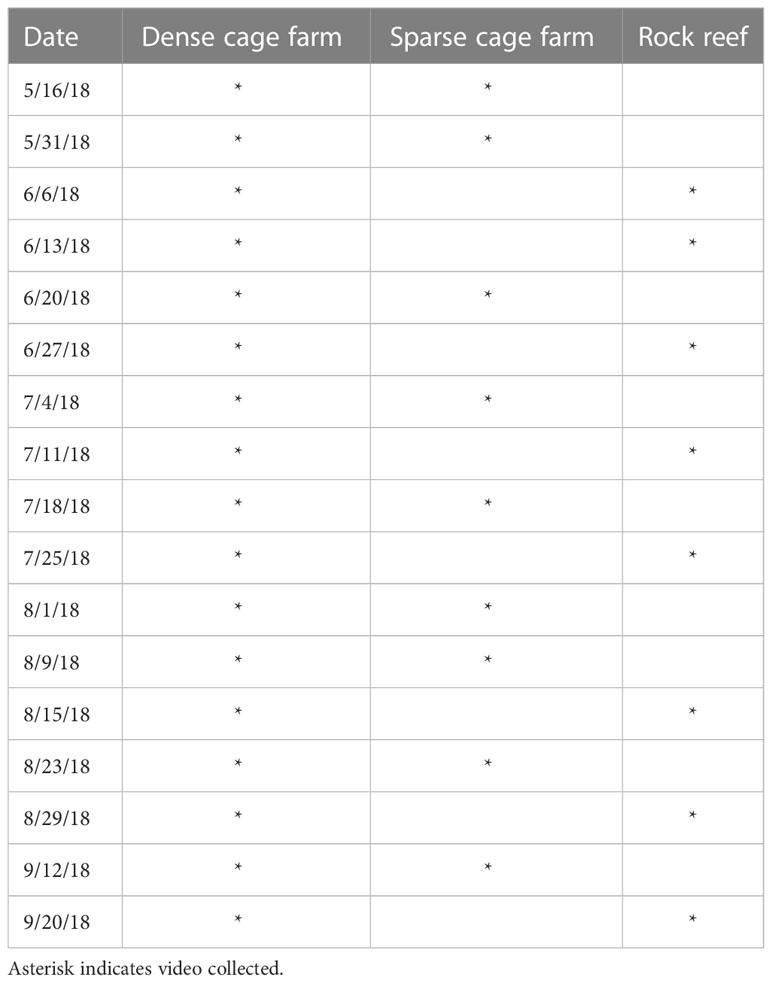
Table 1 Dates of video collection at three habitats in 2018.
To evaluate the influence of environmental parameters on fish abundance, current speed, light intensity and seawater temperatures were monitored at each study site throughout camera deployments. Currents were measured using a TCM-1 tilt current meter (Lowell Instruments) that recorded current speed (cm s-1) over 1-minute intervals. A 5-point running mean was used to derive smoothed records of current speed. HOBO® pendant temperature and light data loggers (Onset Computer) were deployed to record light illuminance at depth (lumens m-2) and seawater temperature (°C) over 5-min intervals. A current meter and data logger was attached to one cage at each farm. At the rock reef, a current meter and data logger were mounted on a T-platform stand that was hand-lowered to the seafloor using a buoyed line and left for the duration of each camera deployment. Current speed, light intensity, and seawater temperature were collected over the 3 days of each camera deployment. Salinity (PSU) was measured at each site during both camera deployment and retrieval using a handheld YSI Pro30® salinity, conductivity, and temperature meter.
Video analysis
Video analysis followed methods described in Mercaldo-Allen et al. (2021). Briefly, the Observer® XT (v14.0; Noldus Information Technology) software was used for scoring time-synched video that was recorded simultaneously with top and side cameras. Fish abundance, calculated as MaxN, was defined as the maximum number of fish of a given species present in a single frame within each 8-minute video segment. Although water clarity varied between deployments and among hours within a single deployment, visibility generally extended the full length of the cage/boulder. Only fish within the immediate vicinity of the cage/boulder, that were positively identified using morphological features and swimming behavior, were included in counts, in order to minimize the effect of variable water clarity across videos. A total fish abundance metric was generated by summing the MaxN across species for each interval video. Qualitative assessments of colonizing organisms on boulders and cages were conducted during video analysis (2018 & 2019) and while cages were on the boat deck for camera attachment and removal (2019) to describe habitat attributes of all cage farms, and rock reef sites.
Data analysis
Daily average MaxN abundances were generated by taking the mean of the 13 hourly videos on each date. Species were categorized as “common” or “rare” based on frequency of occurrence. Species that were observed on greater than 75% of sampling dates at any location were considered “common,” and the remaining species were considered numerically rare or transient. Univariate statistics were performed using the statistical software program R version 4.2.0 (www.r-project.org). A modified repeated measures ANOVA was used to compare habitats in 2018 and farms in 2019 across the time series of repeated sampling dates (Wilcox, 2022). Repeated measures analysis was applied to univariate metrics including MaxN abundance data for individual species, total fish abundance, species richness, as well as individual environmental parameters including light, temperature, and current speed. The general approach taken across both years of data was to first conduct a global test comparing habitat (2018; with the two cage sites considered replicates and compared to the single rock reef site) or farm location (2019; three farm sites), with pairwise comparisons only performed when global tests were significant. The repeated measures analysis was based on a comparison of marginal distributions over the sampling time series, and used a percentile bootstrapping method with trimmed means as the measure of location, which had no assumptions of normality or homoscedasticity, was robust to the potential for outliers in the data, and provided a measure of effect size based on the projection distance, as described in Wilcox (2022). Familywise error within pairwise comparisons was controlled using Hochberg’s sequentially rejective approach, which employs an increasingly conservative corrected α as the number of tests grows. This was chosen over the standard Bonferroni correction because Hochberg’s method achieves higher power while still minimizing the chance of Type I errors (Wilcox, 2022). In 2018, the three habitats could not be sampled simultaneously due to logistical constraints (Table 1), so data were pooled by month prior to repeated measures analysis. In 2019, all three farms were sampled simultaneously, thus data pooling was not necessary.
A running interval smoother was used to assess the explanatory power of temperature, light, and current speed as predictors of fish abundance in both the 2018 and 2019 datasets (Wilcox, 2022). Smoothers were selected over regression and correlation approaches as they are robust to conditions of nonnormality or heteroscedasticity and to the presence of outliers in the data, all of which are common in environmental datasets. Additionally, smoothers do not assume linearity, and can have a good fit for relationships that are linear, nonlinear, or zero (Wilcox, 2022). Smoothers do not yield a p-value, and no equation is generated, so these were used here for exploratory analysis as opposed to hypothesis testing. Data were analyzed at the site level within each year, and all sampling dates were pooled to maximize the sample size and range of conditions under which to explore predictive relationships.
Multivariate statistical analysis was performed using the statistical software program PRIMER version 7 (PRIMER-e Ltd.). MaxN data for all species were square root transformed and similarity matrices were generated using the Bray-Curtis coefficient. Nonmetric multidimensional scaling was used to visualize similarities in fish assemblages across samples taken within individual project years. The analysis of similarity (ANOSIM) test was used to test for the significance of differences in fish assemblages associated with habitat (2018) and farm location (2019), with Hochberg’s method used to control familywise error rate. Similarity percentages analysis (SIMPER) was used to identify the species primarily responsible for dissimilarities between paired treatments.
Results
Habitat comparison
A total of 17 fish species were observed during the 2018 habitat comparison deployments (Figure 3, Table 2). The four most commonly occurring species were present at both dense and sparse cage farm and boulder habitats, and included black sea bass, cunner, scup, and tautog. Numerically rare or transient species (observed at both habitats) included bluefish (Pomatomus saltatrix), striped bass (Morone saxatilis), striped killifish (Fundulus majalis), striped searobin (Prionotus evolans), summer flounder (Paralichthys dentatus), and windowpane flounder (Scophthalmus aquosus); (only observed in association with cages) included banded rudderfish (Seriola zonata), Atlantic menhaden (Brevoortia tyrannus), hake (Urophycis spp.), and yellow jack (Carangoides bartholomaei); (only in association with boulder habitat) included Atlantic silverside (Menidia menidia), smallmouth flounder (Etropus microstomus), and weakfish (Cynoscion regalis).
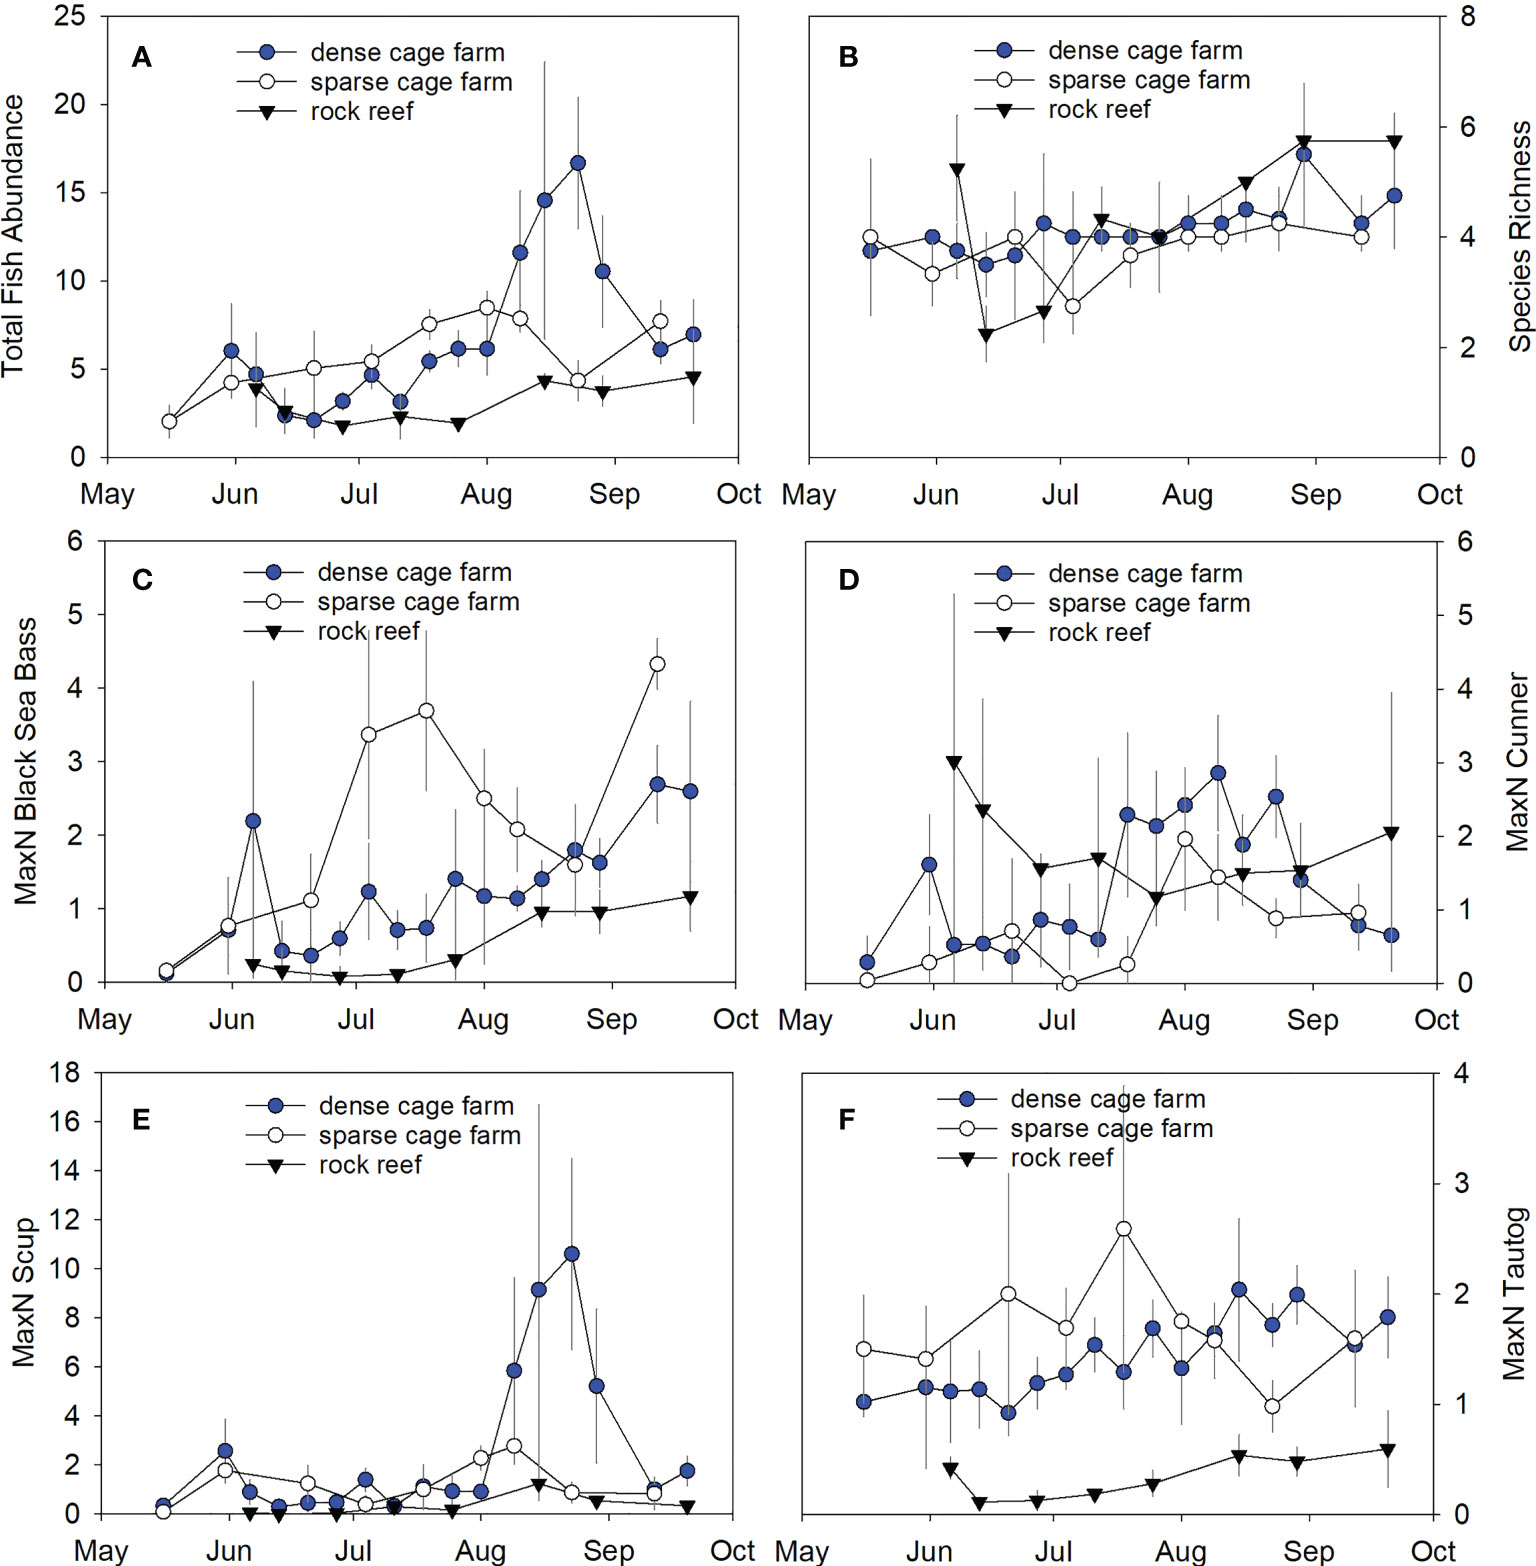
Figure 3 Time series of fish abundance and species richness at the dense cage farm, sparse cage farm, and rock reef sites between May and September 2018. Symbols indicate mean ± SD. (A) Total fish abundance across all species, (B) Species richness, (C) Black sea bass, (D) Cunner, (E) Scup, (F) Tautog.
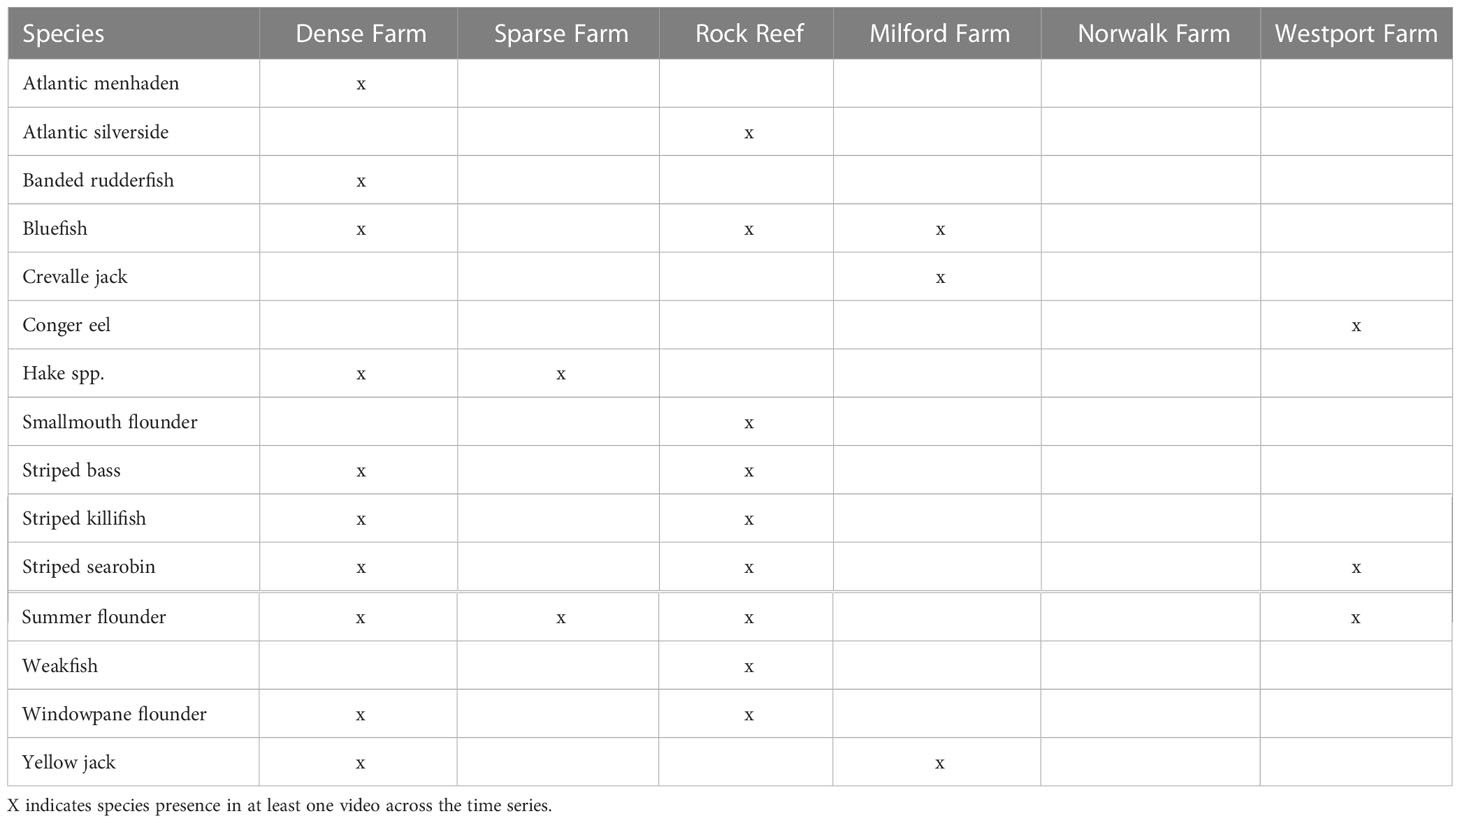
Table 2 Occurrence of numerically rare species across habitats and farm locations.
Total fish abundance was significantly greater at the cage habitat versus the boulder habitat (p=0.0062, effect size=1.6; Figure 3A). Both the dense cage farm and sparse cage farm sites had significantly higher fish abundance than the rock reef site (p<0.0001 and p=0.0032, effect sizes 0.7 and 2.4 respectively). There were no significant differences between the dense cage farm versus sparse cage farm sites (p=0.95). Species richness did not significantly differ between the cage versus the boulder habitats (p=0.07; Figure 3B).
The ANOSIM test indicated significant differences between the fish community composition when comparing the boulder to the cage habitat (p=0.0001; R=0.633). The fish community associated with the rock reef site was significantly different from both the dense cage farm (p=0.0001, R=0.600) and the sparse cage farm (p=0.0001, R=0.688). There were no significant differences in the fish communities associated with the two cage sites (p=0.35, R=0.021). SIMPER analysis indicated that scup (27%), tautog (20%), black sea bass (17%), and cunner (14%) contributed most to the dissimilarity between the dense cage farm and rock reef sites, while black sea bass (24%), tautog (22%), cunner (20%), and scup (19%) contributed most to the dissimilarity between the sparse cage farm and rock reef sites.
Black sea bass, scup, and tautog abundance were all significantly higher at the dense cage habitat than the boulder habitat (p<0.0001 for black sea bass and tautog, effect sizes=1.7 and 2.2, respectively; p=0.017 for scup, effect size 1.7; Figure 3). Black sea bass abundance was highest at the sparse cage farm site, the dense cage farm had intermediate abundance, and the lowest abundance was at the rock reef site (p=0.008, effect size=0.6 dense cage farm vs. sparse cage farm; p=0.004, effect size=1.4; dense cage farm vs. rock reef; p=0.007, effect size=1.4; sparse cage farm vs. rock reef; Figure 3C). Scup abundance was significantly lower at the rock reef site than either of the two cage sites (both p<0.0001, effect sizes=3.6 and 1.6, respectively; Figure 3E); there was no significant difference in scup abundance at the dense cage farm versus the sparse cage farm site (p=0.26). Tautog abundance followed the same pattern, with significantly lower abundance at the rock reef site versus either cage site (both p<0.0001, effect sizes=4.7 and 1.7, respectively; Figure 3F) but no significant difference between the two cage sites (p=0.25).
Cunner abundance was significantly higher at the boulder habitat versus the cage habitat (p=0.02, effect size=0.72; Figure 3D), but this result was driven by the difference between the rock reef and sparse cage farm sites (p<0.001, effect size=1.0); there were no significant differences between the rock reef and dense cage farm sites (p=0.23) or the dense cage farm and sparse cage farm sites (p=0.10).
Young-of-year (YOY) fish were observed for 6 of the 17 total fish species recorded in 2018: black sea bass, cunner, scup, tautog, hake, and menhaden (Table 3). YOY black sea bass and scup were observed on both habitats and in all three locations; YOY tautog were observed on the two cage sites but not the rock reef site; YOY cunner, hake, and menhaden were observed on the dense cage farm only. The species for which YOY were observed most frequently and at highest abundance were black sea bass and scup (Figure 4). This life history stage was only observed late in the season, beginning in early August, and continuing through the final sampling date in September. While we note overall trends here, we opted not to perform statistical analysis of this more limited dataset, since YOY were only observed on a few sampling dates. On dates for which YOY were recorded, the mean percentage of black sea bass observed that were YOY was 27% on the dense cage farm, 20% on the sparse cage farm, and 67% on the rock reef (Figures 4A, C, E); mean percentage for scup was 61% on the dense cage farm, 16% on the sparse cage farm site, and 35% on the rock reef (Figures 4B, D, F). Maximum YOY black sea bass abundance on dates where YOY were recorded was 10 at the dense cage farm, 6 at the sparse cage farm, and 4 at the rock reef; max YOY scup abundance was 73 at the dense cage farm, 8 at the sparse cage farm, and 16 at the rock reef (Table 3).
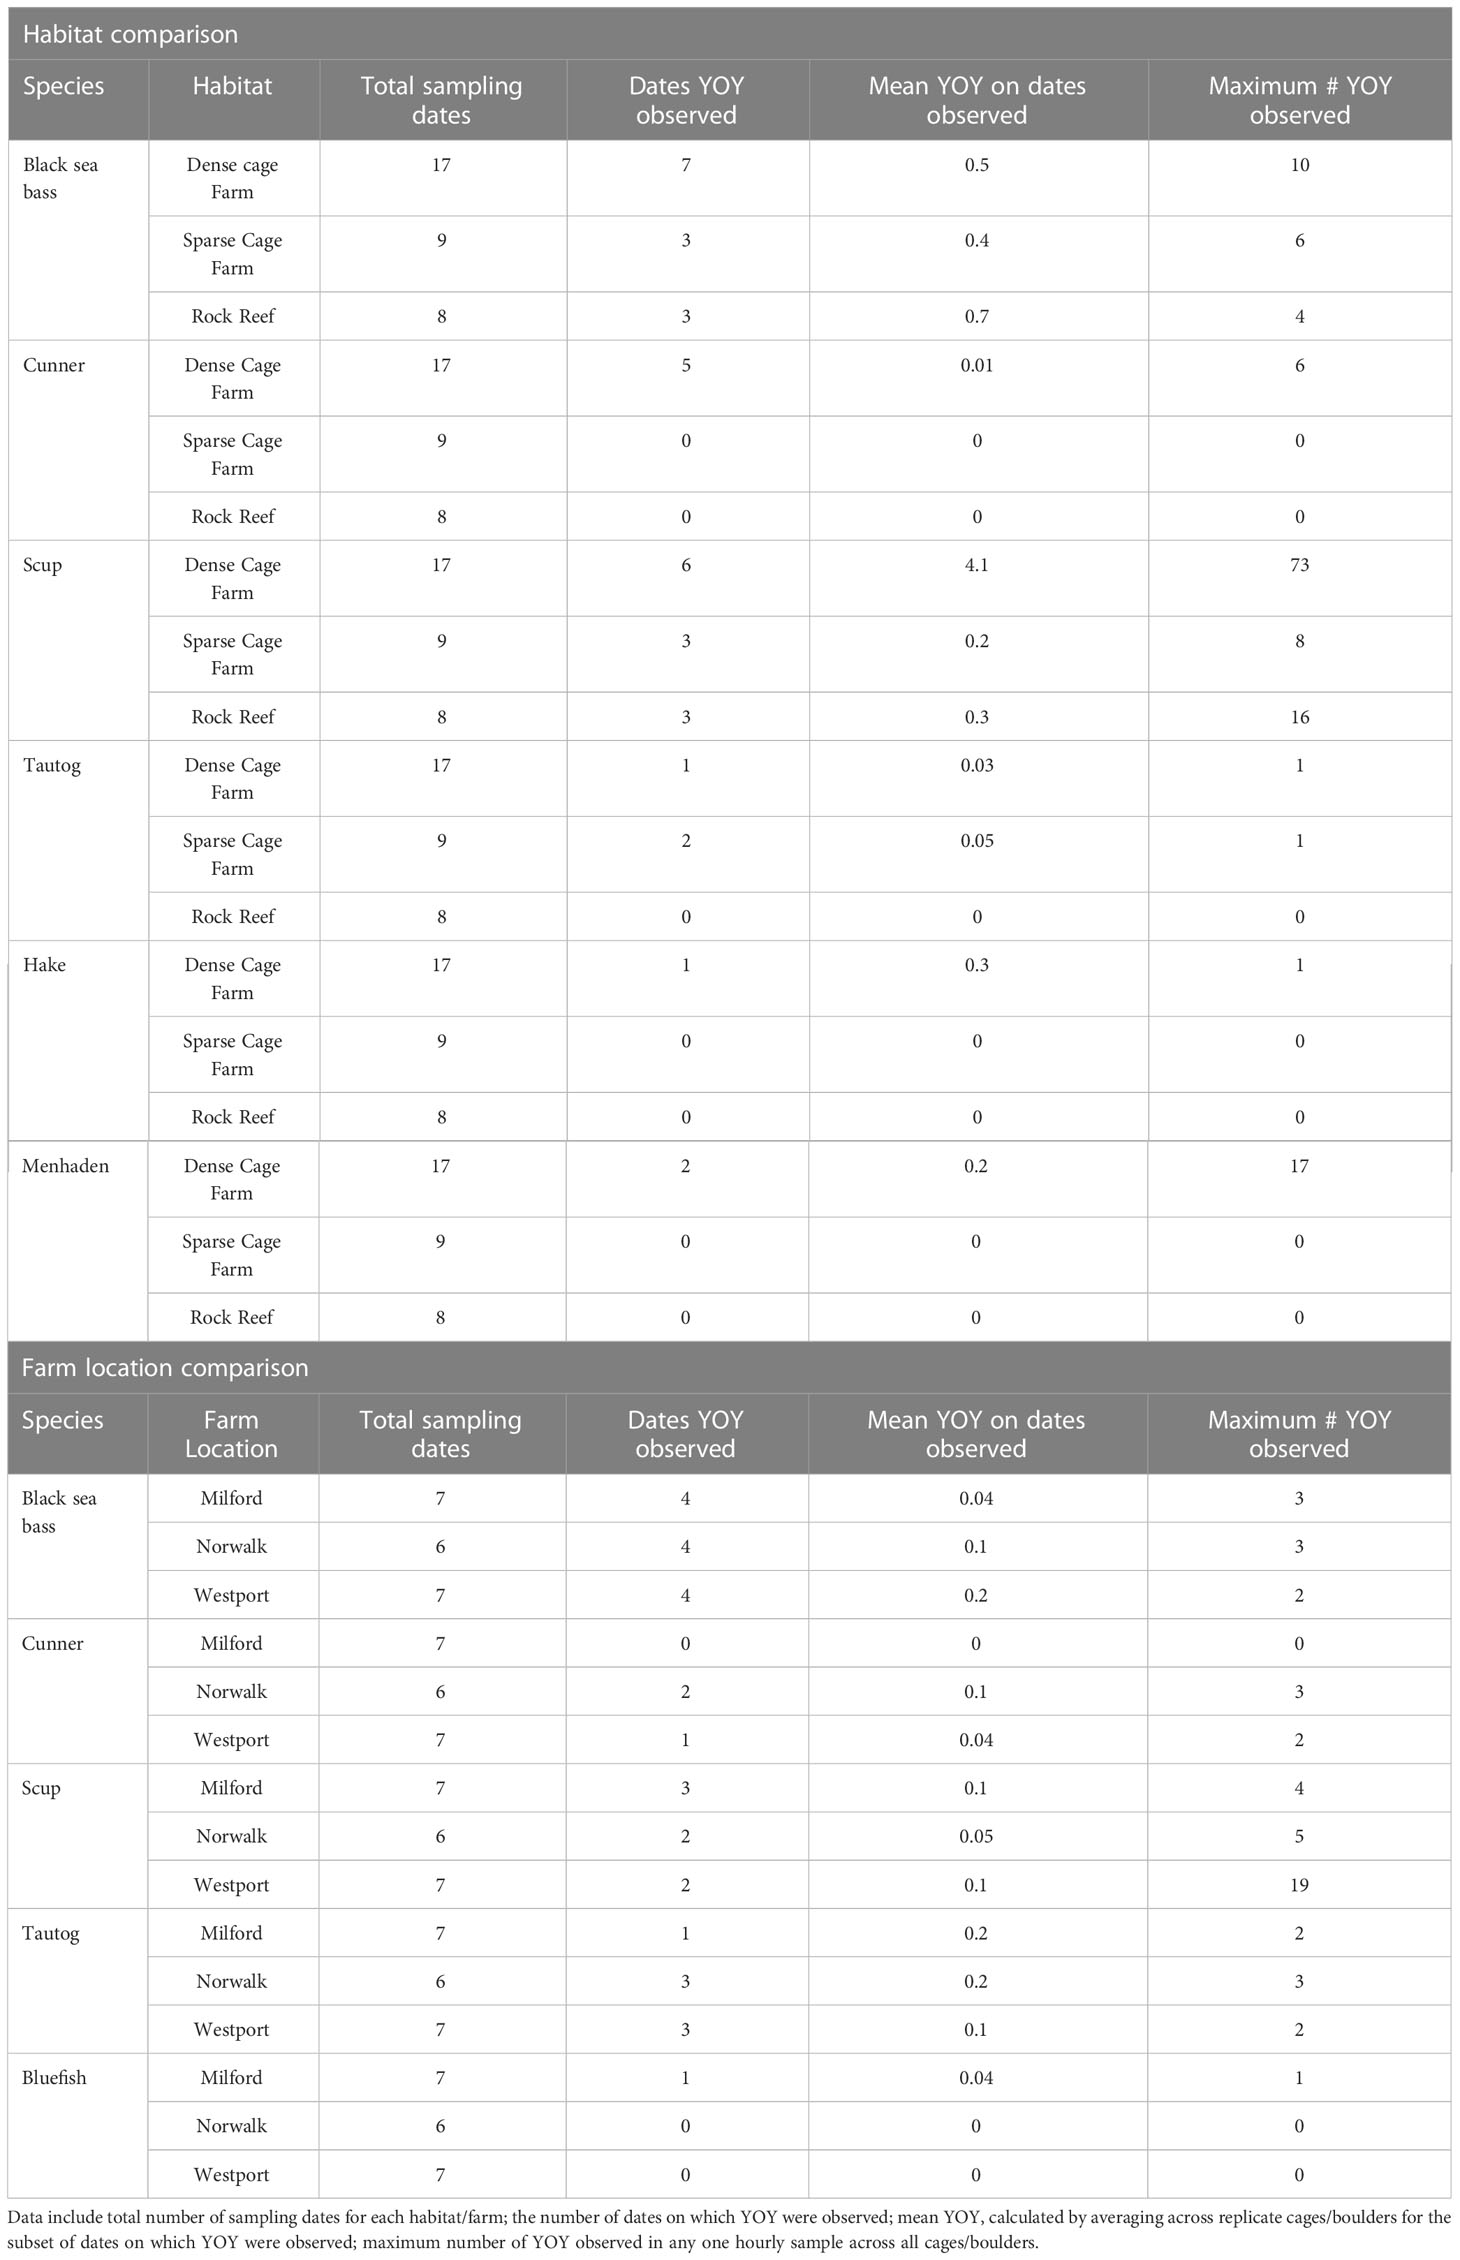
Table 3 Summary observations for young-of-year (YOY) fish across habitats and across farm locations.
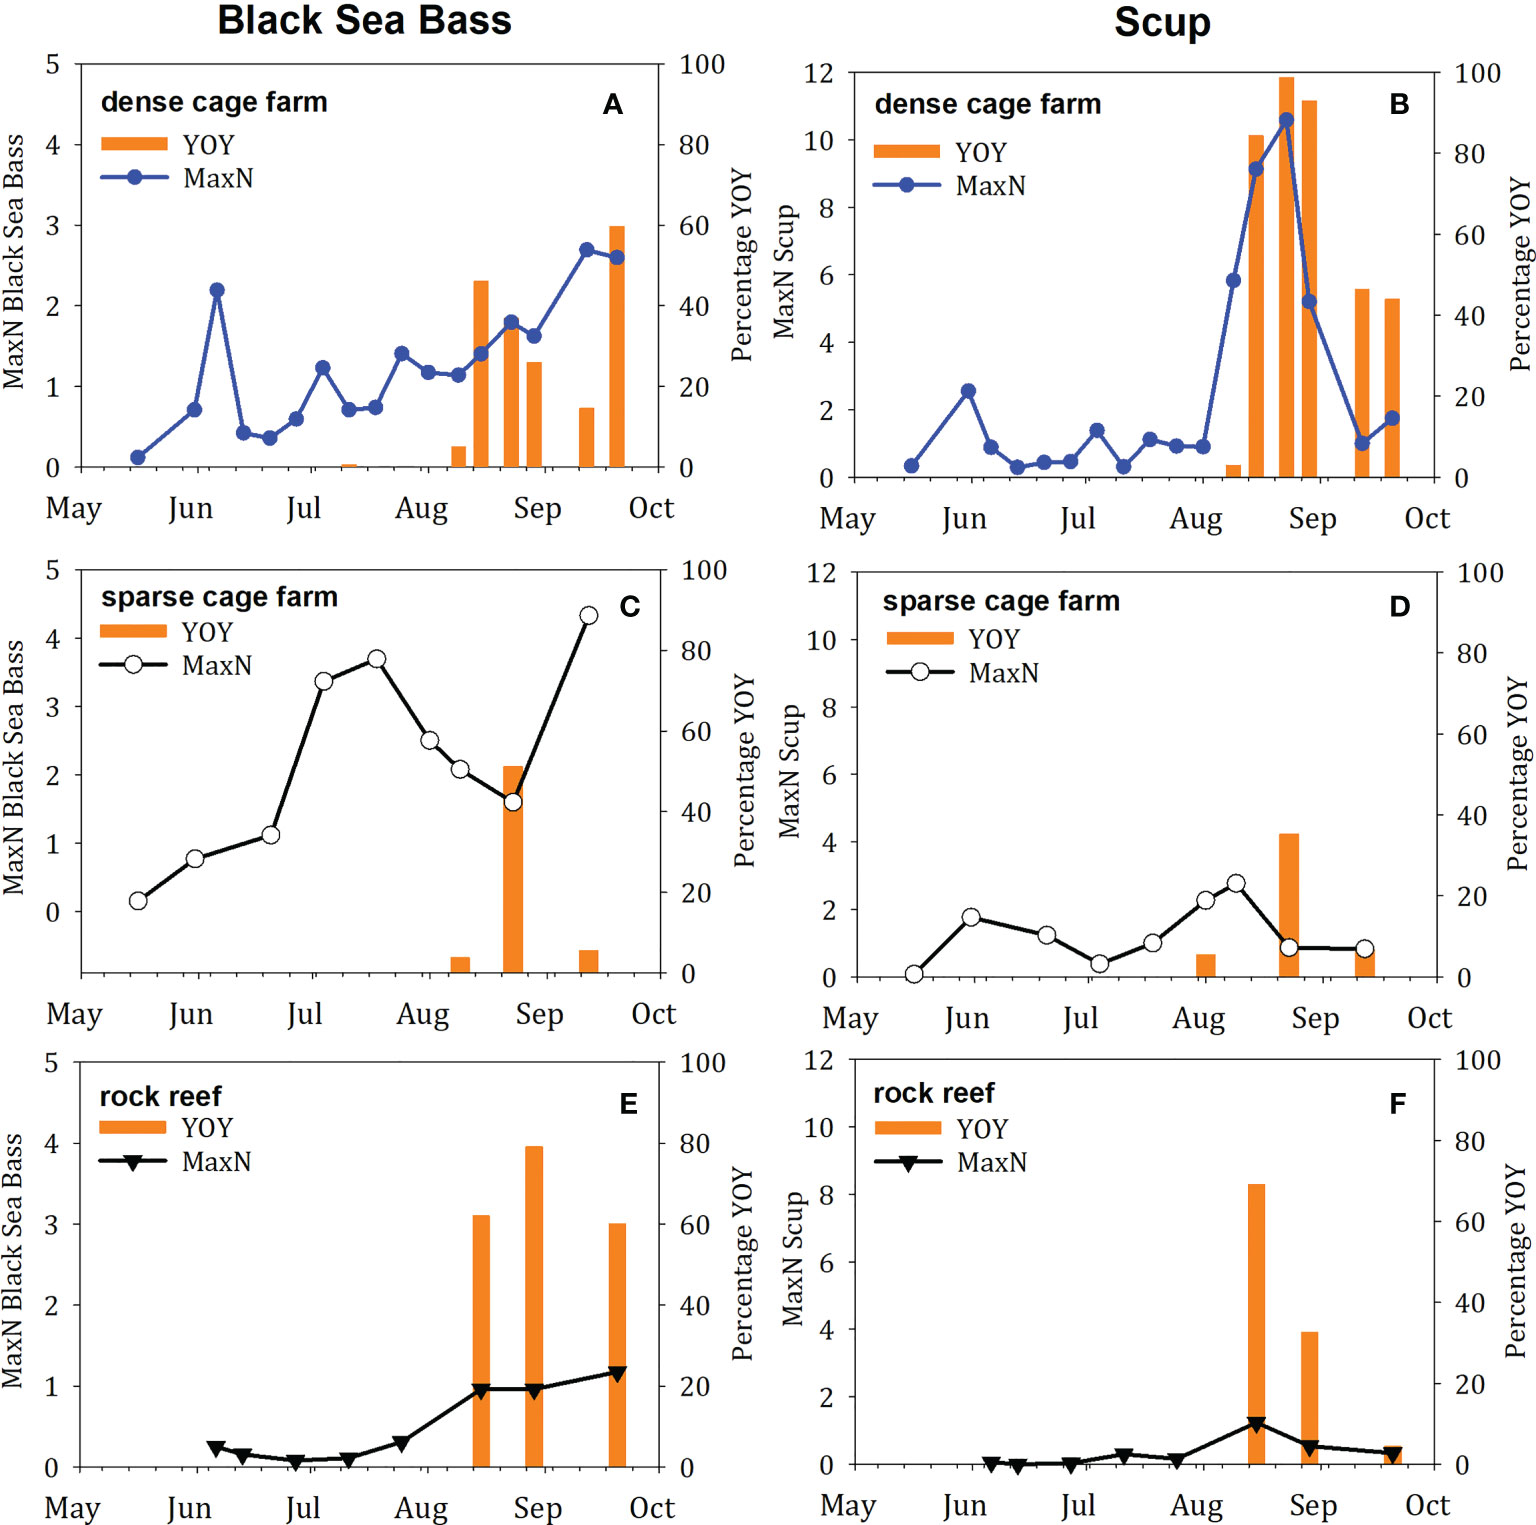
Figure 4 Time series of fish abundance and proportion of fish observed that were young-of-year (YOY) in 2018, for the two species with high relative abundance of YOY. In each figure, the MaxN abundance is indicated by the line and scatter plot, and the proportion of that abundance that was YOY is indicated by the orange bars. Species included (A, C, E) Black sea bass, (B, D, F) Scup. Sites included (A, B) dense cage farm, (C, D) sparse cage farm, (E, F) rock reef.
Visual inspection of video from cages observed minimal growth of colonizing organisms on cages, bags, lines and rigging at the dense cage farm and sparse cage farm sites during 2018. There were 2 visually dominant species present, the colonial hydroid Campanularia spp. and lacy crust bryozoan Membranipora membranacea. No algae were observed. Boulders on the rock reef were colonized primarily by Campanularia spp. (sparsely) as well as the spiral-tufted bryozoan Crisularia turrita.
Environmental variables were similar across habitats with temperature, light and current measured over the full 13 hours during which hourly 8-minutes video segments were recorded (Figure 5). There were no significant differences between boulder and cage habitats in mean current speed (p=0.67) or maximum current speed (p=0.50). Significantly higher minimum current speeds were observed at the boulder habitat relative to cage habitats (p=0.008), although the mean difference was relatively small, 0.34 cm s-1; a similar pattern was observed in the site comparisons: minimum current speeds were higher at the reef relative to the dense cage farm (p=0.024; mean difference 0.28 cm s-1) and the sparse cage farm (p=0.008; mean difference 0.48 cm s-1), and higher at the dense cage farm site than the sparse cage farm site (p=0.03; mean difference 0.39 cm s-1) (Figure 5A). There were no significant differences between boulder and cage habitats in mean light intensity (p=0.36) or maximum light intensity (p=0.12) (Figure 5B). We did not compare minimum light intensity since we did not consistently assess full day lengths across all sampling days. Significant temperature differences were recorded across the two habitats and across the three sites (all p<0.001), with the rock reef site highest, dense cage farm intermediate, and sparse cage farm site exhibiting the lowest temperature, but it is important to note that the differences observed across sites were quite small (mean 0.7°C) relative to the overall range of temperatures observed across the study (13-25°C; Figure 5C). Over the study period, salinity ranged from 20.1 to 28.2 PSU at the 3 sites in the Milford embayment and from 21.1 to 27.9 PSU at the 3 farm sites in 2018 and 2019, respectively.
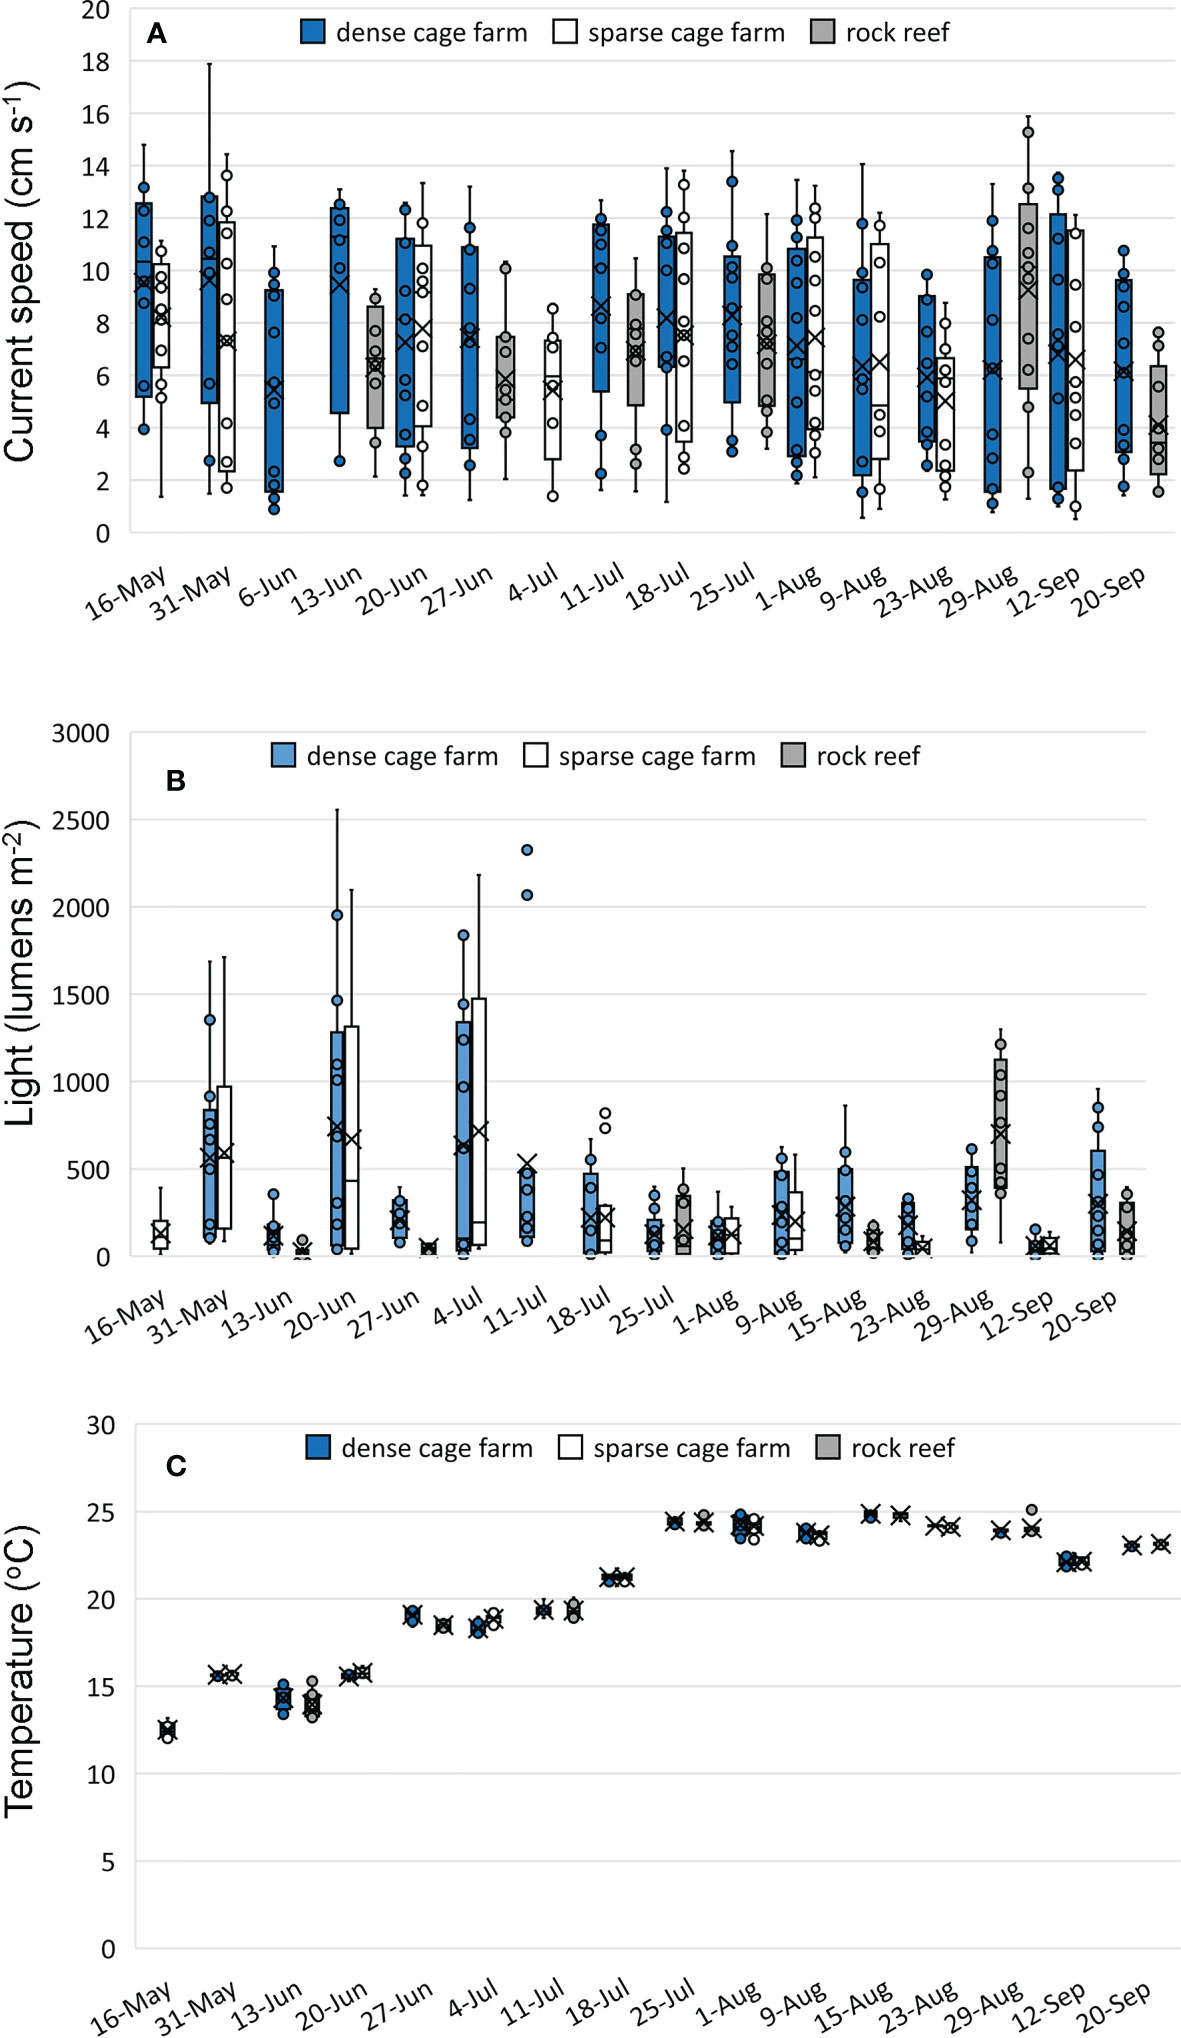
Figure 5 Environmental conditions at the dense cage farm, sparse cage farm, and rock reef sites in 2018. Mean current speed, light, and temperature were generated for each hourly interval during which cameras were recording. Boxplots indicate 25%, 50%, and 75% quartiles of the 13 hourly intervals on each date, mean is indicated by the ‘x’ symbol, and whiskers are set to 1.5 times the interquartile range. (A) current speed (cm s-1), (B) light (lumens m-2), (C) temperature (°C).
Temperature was the best overall predictor of fish abundance, for the total fish abundance metric as well as all four of the most commonly observed species (Table 4). Current speed explained >20% of the variation in fish abundance intermittently across the three sites in 2018, including the total abundance of fish on the dense cage farm site (24.6%), abundance of black sea bass and tautog on the rock reef site (22.7% and 35.0%, respectively), and abundance of scup and tautog at the dense cage farm site (29.5% and 32.9% respectively). Light intensity also explained >20% of the variation in fish abundance intermittently across the three sites in 2018, including the abundance of black sea bass, scup, and tautog on the rock reef (51.2%, 66.0%, and 39.8% respectively), and abundance of tautog on the dense cage farm site (25.1%).
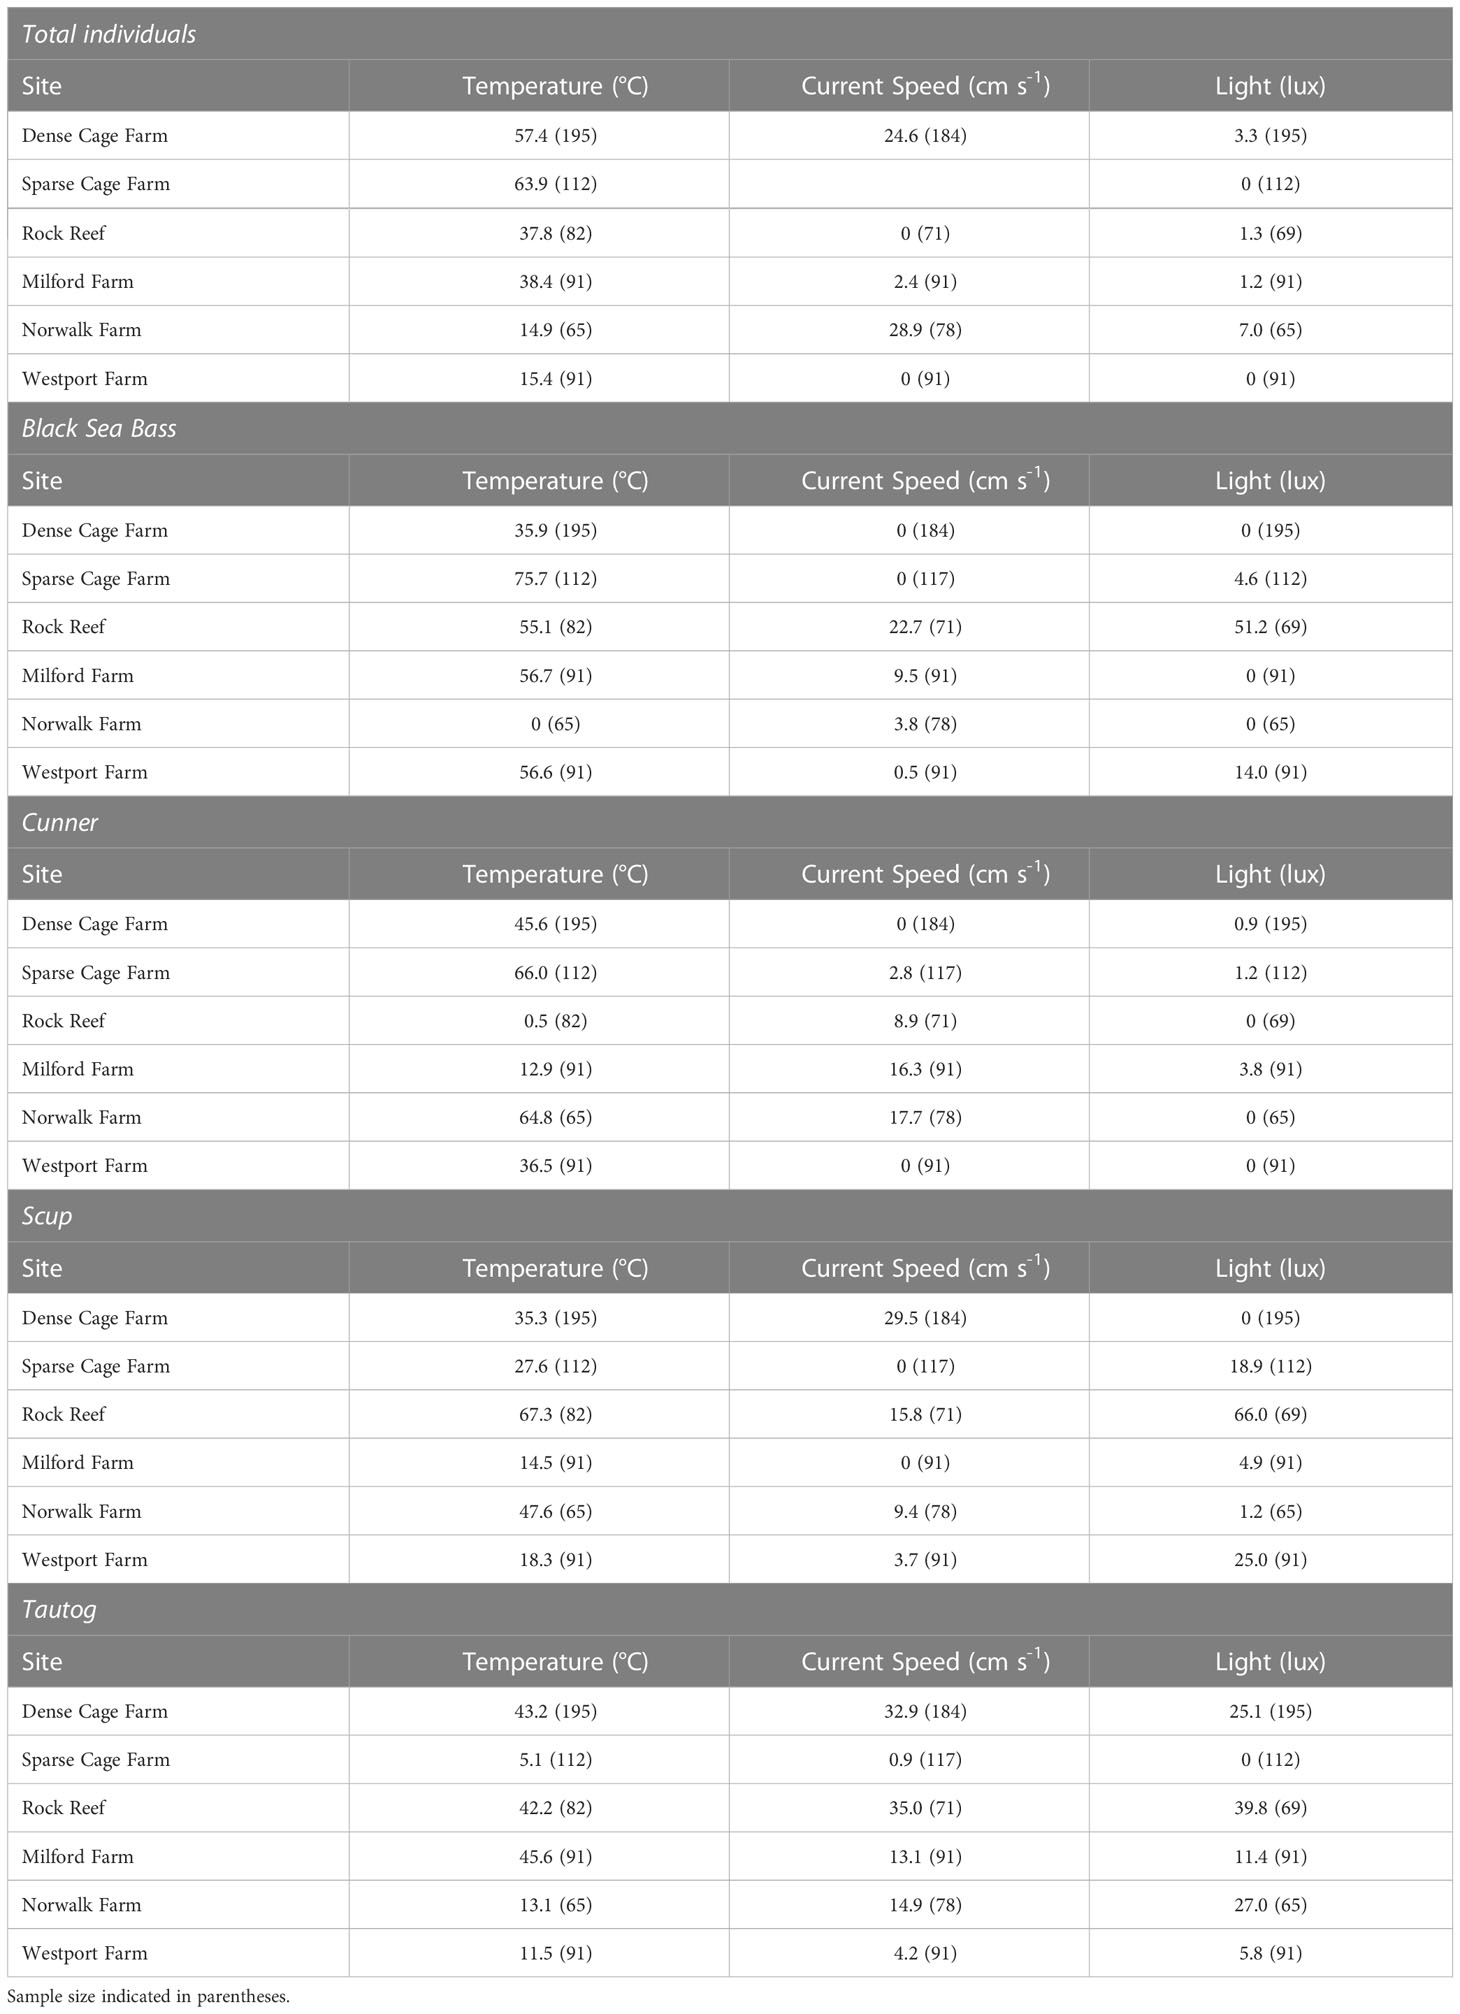
Table 4 Explanatory power (%) of running interval smooths using temperature, current speed, and light as predictors of fish abundance across sites in 2018 and 2019.
Farm location comparison
A total of 10 fish species were recorded across the three farms in 2019 (Figure 6, Table 2). The four most commonly-observed species occurred at all three farms, and was consistent with observations across habitats in 2018: black sea bass, cunner, scup, and tautog. These four species were the only ones observed at the Westport farm. Bluefish, Crevalle jack (Caranx hippos), and yellow jack were observed rarely at the Milford farm. Conger eel (Conger oceanicus), striped searobin, and summer flounder were observed rarely at the Norwalk farm.
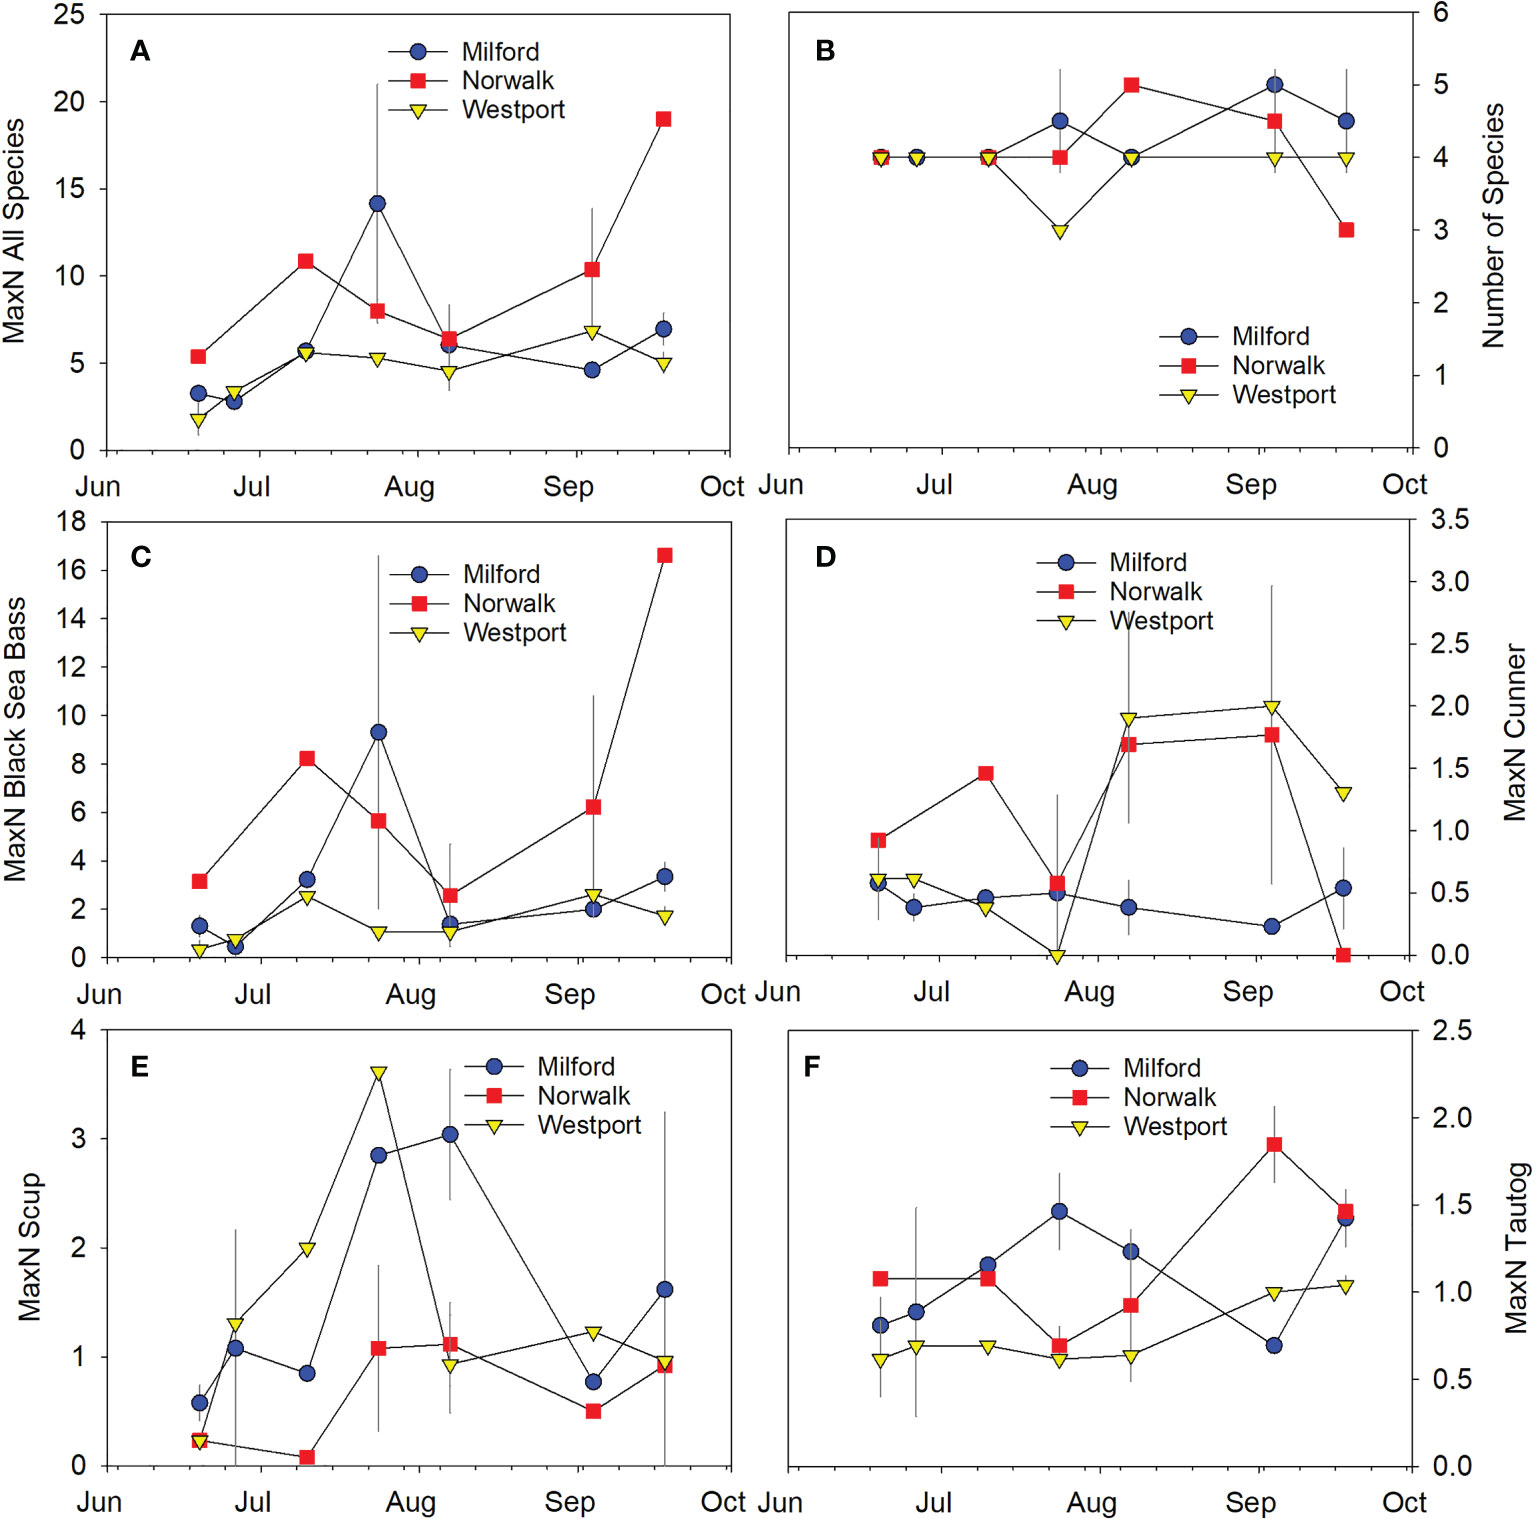
Figure 6 Time series of fish abundance and species richness at the three commercial shellfish farms sampled in 2019. Symbols indicate mean ± SD. (A) Total fish abundance across all species, (B) Species richness, (C) Black sea bass, (D) Cunner, (E) Scup, (F) Tautog.
The ANOSIM test indicated significant differences between the fish community composition across the three farm sites (p=0.005; R=0.217). The fish community associated with the Norwalk farm was significantly different from both the Milford farm (p=0.009, R=0.316) and the Westport farm (p=0.003, R=0.344). There were no significant differences in the fish communities associated with the Milford and Westport farms (p=0.28, R=0.037). SIMPER analysis indicated that black sea bass, scup, and cunner were the strongest contributors to the dissimilarity between Norwalk and Milford as well as between Norwalk and Westport.
In contrast to the consistent differences in MaxN abundance across the habitat comparison (dense farm, sparse farm, rock reef) in 2018, MaxN abundance was quite similar across farms in 2019 (Figure 6). No significant difference was observed across farms for total fish abundance (p=0.17; Figure 6A), species richness (p=0.63; Figure 6B), or abundance of any of the four most common species, including black sea bass (p=0.10; Figure 6C), cunner (p=0.18; Figure 6D), scup (p=0.20; Figure 6E), or tautog (p=0.12; Figure 6F).
YOY fish were more rarely observed in 2019 relative to observations in 2018 (Table 3). YOY fish were observed for 5 of the 10 total fish species recorded in 2019: black sea bass, cunner, scup, tautog, and bluefish. YOY black sea bass, scup, and tautog were observed at all three farms. YOY cunner was observed at the Norwalk and Westport farms but not the Milford farm. YOY bluefish were observed at the Milford farm only. As in 2018, YOY were observed sporadically across the field season, and we note overall trends here, but have opted not to perform statistical analysis of this more limited dataset. In contrast to the observations in 2018, YOY for a few species were observed earlier in the sampling season (black sea bass in July, tautog in June, bluefish in June). On dates for which YOY were recorded, the mean percentage of the total number of black sea bass observed that were YOY was 1.4% at the Milford farm, 2.1% at the Norwalk farm, and 20% at the Westport farm (Figures 7A, C, E); mean percentage for scup was 9.5% at the Milford farm, 8.0% at the Norwalk farm, and 8.5% at the Westport farm (Figures 7B, D, F). The maximum YOY black sea bass abundance on dates where YOY were recorded was 3 at the Milford farm, 3 at the Norwalk farm, and 2 at the Westport farm; maximum observed YOY scup abundance was 4 at the Milford farm, 5 at the Norwalk farm, and 19 at the Westport farm (Table 3).
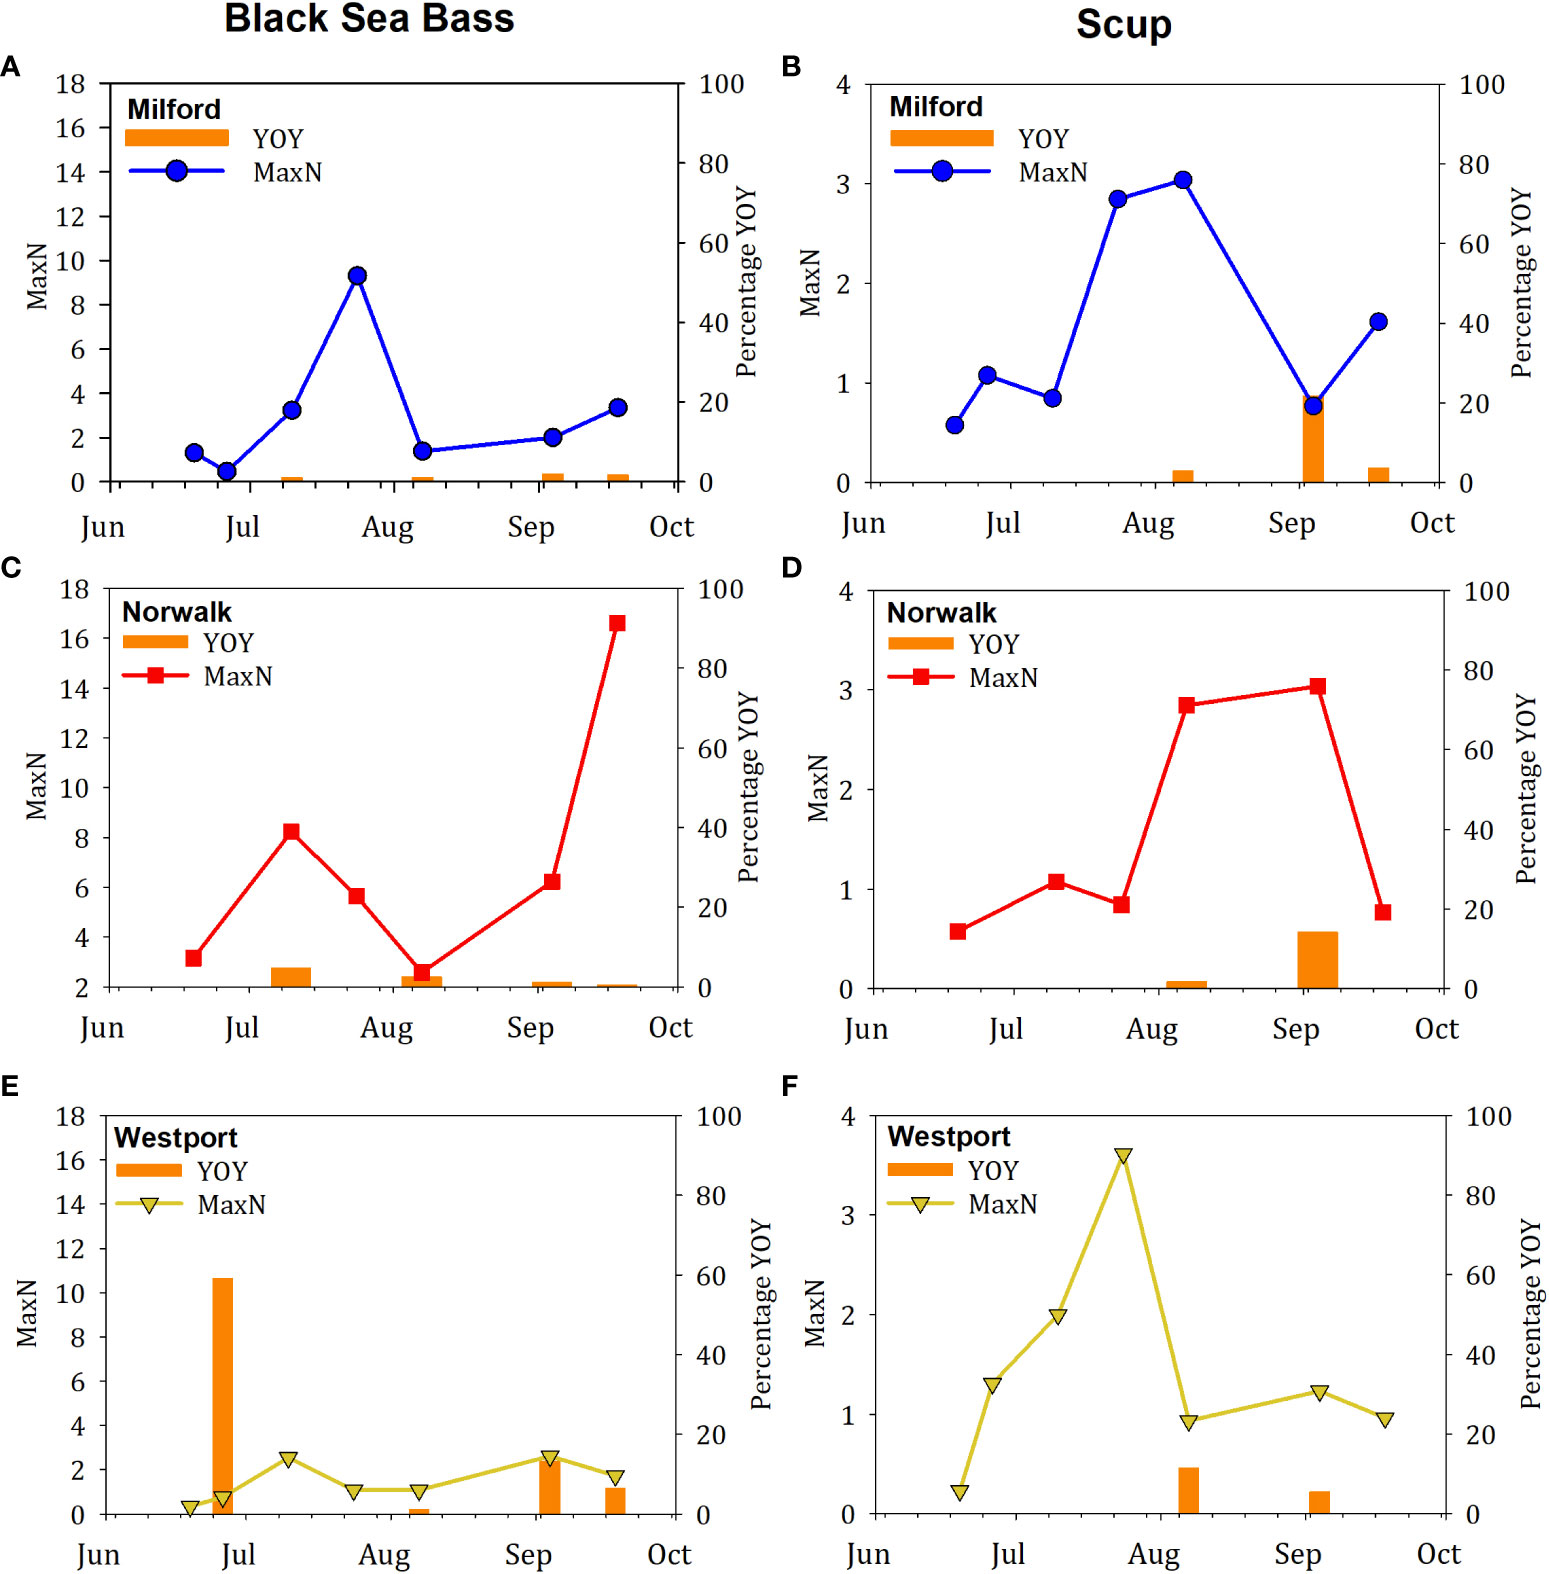
Figure 7 Time series of fish abundance and proportion of fish observed that were young-of-year (YOY) in 2019. In each figure, the MaxN abundance is indicated by the line and scatter plot, and the proportion of that abundance that was YOY is indicated by the orange bars. Species included (A, C, E) Black sea bass, (B, D, F) Scup. Farm locations included (A, B) Milford, (C, D) Norwalk, (E, F) Westport.
Visual inspection of cages while on the boat deck and during video analysis noted minimal growth of colonizing organisms at the Milford, Norwalk and Westport farms during 2019. The majority of colonizers occurred on the lines and rigging rather than the cage or bag mesh. The Milford farm had few colonizers compared to Westport and Norwalk. Colonial hydroids and the filamentous brown algae Desmerestia spp. were present in low abundance on the cage, lines, and buoys in Milford. At Norwalk, colonial hydroids Campanularia spp, and the algae Desmerestia spp., Porphyra spp., Ulva lactuca, and Ahnfeltia spp. were observed. Red algal species included Porphyra spp. and Dasya spp. The macroalgae U. lactuca and Dasya spp. were most commonly found on the wire cage mesh. There was very little growth on aquaculture gear at Westport, where cages, lines, and buoys were colonized by caprellid amphipods and colonial hydroids. Macroalgae included Dasya spp., Enteromorpha intestinalis, and Desmerestia spp.
Minimum current speed did not vary significantly across the three farms (p=0.08; Figure 8A). Mean and maximum current speeds varied significantly across farms (both p<0.001). Norwalk had significantly higher mean and maximum current speeds relative to Milford and Westport (all p<0.001). Westport had higher mean current speeds than Milford (p=0.02), but maximum current speed did not differ between these two farms (p=0.90).
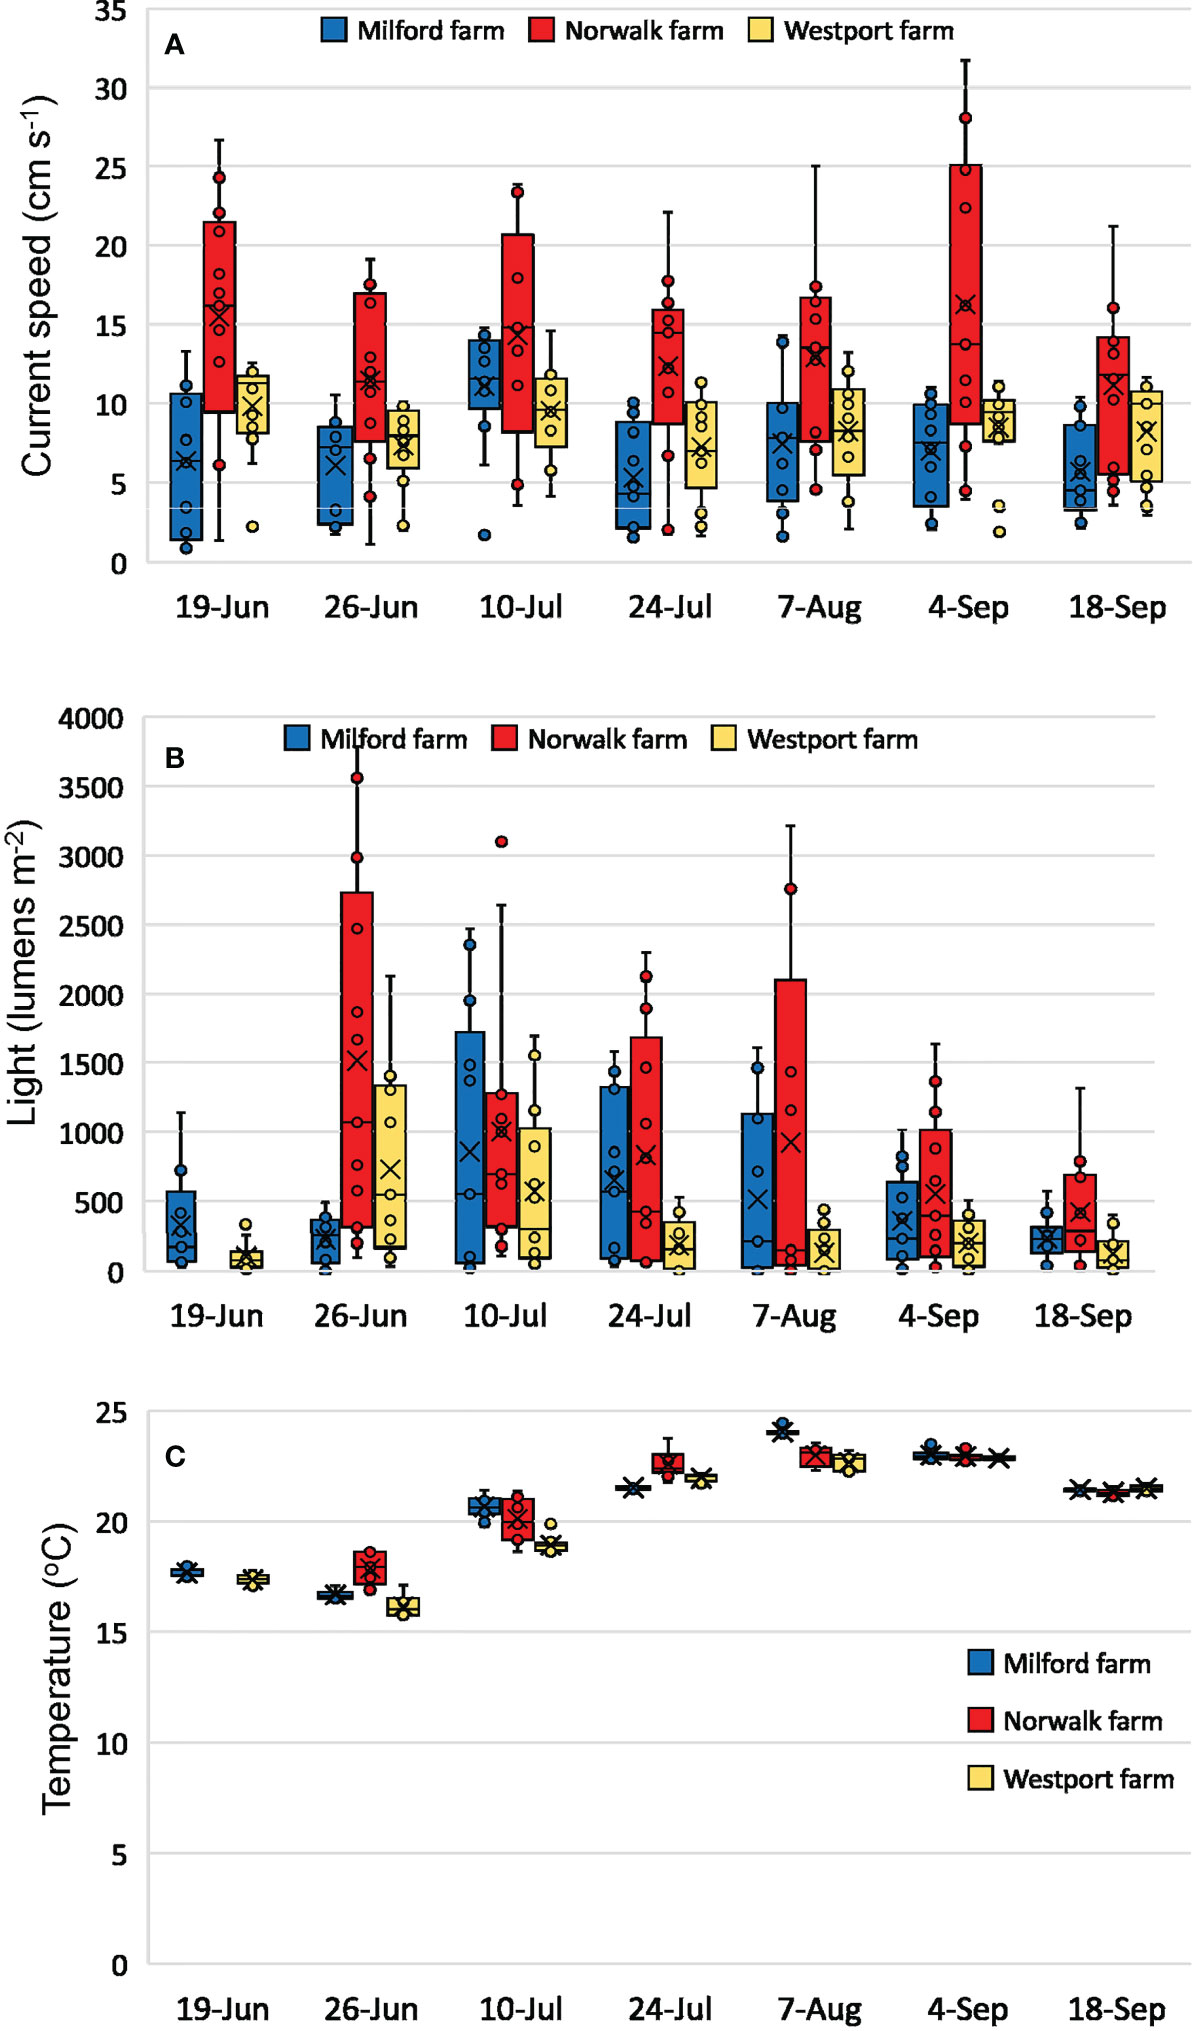
Figure 8 Environmental conditions at the three commercial shellfish farms sampled in 2019. Mean current speed, light, and temperature were generated for each hourly interval during which cameras were recording. Boxplots indicate 25%, 50%, and 75% quartiles of the 13 hourly intervals on each date, mean is indicated by the ‘x’ symbol, and whiskers are set to 1.5 times the interquartile range. (A) current speed (cm s-1), (B) light (lumens m-2), (C) temperature (°C).
Minimum light intensities were not statistically compared since we did not consistently assess full day lengths across all of our sampling days. Mean and maximum light intensities varied significantly across farms (p=0.008 and p=0.003, respectively; Figure 8B). Mean and maximum light intensities were highest in Norwalk relative to Milford and Westport (all p<0.001). There were no significant differences in mean light (p=0.21) or maximum light (p=0.25) between the Milford and Westport farms.
Temperatures across the three farms were statistically similar in their daily minimum (p=0.30), mean (p=0.40), and maximum (p=0.16) over the course of the field season (Figure 8C). The overall range of temperatures recorded during the field season was narrower than in 2018, ranging from 15-24°C.
As observed in 2018, temperature was the best overall predictor, for the total fish abundance as well as all four of the most commonly observed species (Table 4). Current speed and light intensity were again intermittent in their predictive ability for fish abundance across farms in 2019. Current speed explained >20% of the variation in abundance for total individuals in Norwalk (28.9%); light explained >20% of the variation in scup abundance in Westport (25.0%), and tautog abundance in Norwalk (27.0%).
Discussion
Habitat comparison (cages vs boulders)
Fish were present on oyster aquaculture cages on every sampling date, and occurred in greater numbers than on boulders (Figure 3). Each of the four most common fish species: black sea bass, cunner, scup, and tautog, were observed consistently in association with the dense cage farm site across the 17- week time series. When compared to nearby natural structured habitat, total fish abundance, as well as abundance of 3 of the 4 most common fish species was greater in association with cages when compared to boulders. The fourth species, cunner, were similar in abundance at the dense cage farm site when compared to the rock reef site. These observations are consistent with a recent meta-analysis by Theuerkauf et al. (2021) which reported increased abundance of wild fish in association with oyster aquaculture gear when compared to structured and unstructured natural habitat. Tallman and Forrester (2007) reported juvenile and adult scup and tautog were three times more abundant in fish traps near oyster cages than on natural rock reefs and that black sea bass occurred in similar numbers on both habitats in Narragansett Bay, Rhode Island. Black sea bass and tautog are known to preferentially select habitats with greater complexity and show high site fidelity to structure (Olla et al., 1974; Olla et al., 1979; Able et al., 2005; Drohan et al., 2007; Cullen and Stevens, 2017). Demersal scup, which are common on both sandy substrate and hard bottom (Steimle, 1999; Mercaldo-Allen et al., 2020; Mercaldo-Allen et al., 2021), may be attracted to the edge habitat created by cages along the border between shellfish farms and low relief sediments (Bilodeau et al., 2021; Schultz et al., 2021), where cages with high vertical relief may provide access to food and refuge. Cunner showed no statistically distinguishable preference between the dense cage farm and rock reef sites, although there were more cunner present at the rock reef site than the sparse cage farm site. Abundance and recruitment of this shelter-dependent species is known to be enhanced by increasing habitat complexity (Olla et al., 1979; Tupper and Boutilier, 1997; Tupper and Juanes, 2017). In Great Bay, New Hampshire, where rock substrate is limited, cunner were found at higher abundance around oyster cages on shellfish farms as compared with oyster reef, eelgrass and mudflat habitats (Glenn, 2016). Cages may provide an important source of refuge and structure for cunner in soft sediment environments otherwise lacking in hard substrate.
At the same time, it was also clear that oyster aquaculture cages do not perfectly replicate natural structure. While there were no differences in species richness between the cage and boulder habitats, community composition significantly differed between the two habitat types, with black sea bass, tautog, and scup at higher abundance on the cages than the boulders. This result was not surprising, given the physical differences in the overall structure of the cages versus the boulders, and the continuity and spatial patchiness of the habitats. Shelf and bag cages have a variety of large and small openings that accommodate a broader range of fish sizes than do crevices in and around solid boulders, and a variety of fish sizes were observed for all three species. While cages and boulders were of similar height (about 1 m), multi-dimensional cages had greater breadth, depth and more interior spaces while on boulders, habitat generally consisted of attached organisms that colonized solid exterior rock surfaces. For this reason, cage farms may offer increased volume, greater surface area and more interstitial spaces than do rock reef environments (Erbland and Ozbay, 2008). Cages and boulders, while both creating complex habitat, have distinct architecture, differ in spatial dimensions and therefore may accommodate a different suite of fish species, sizes and life stages (Glenn, 2016).
Elevated relief and habitat complexity positively influences the abundance and composition of fish communities (Wilhelmsson et al., 2006; Parsons et al., 2016). In a study of fish habitat use on eelgrass, on-bottom traditional oyster aquaculture and longline aquaculture areas, Muething et al. (2020) noted a positive relation between fish abundance and vertical structure. Emergent structure can increase refuge availability, create an obstacle to fast swimming predators who rely on speed to pursue small prey and consequently, increase survivorship relative to low relief seafloor (Scharf et al., 2006). Habitats with higher complexity may provide fish with additional physical or biological resources (e.g., forage, protection from predation or environmental stress, courtship or spawning areas) and therefore support higher fish abundance and greater species diversity (Charton and Ruzafa, 1998). The high vertical relief afforded by cages may make these structures particularly attractive to structure-oriented fish.
Juveniles (1+) and adults comprised the majority of fish observed across both habitats, but in late summer, young-of-year (YOY) were also present in association with cages and boulders. Generally, YOY appeared episodically and could be quite numerous (e.g. 73 YOY scup observed simultaneously on a single cage on 8/15/18 at the dense cage farm site). In total, we observed YOY for 5 fish species in 2018, and YOY for each of these species was observed at least once on the dense cage farm site (Table 3). The species for which YOY were observed most often, in association with both habitats, were black sea bass and scup (Figure 5). Reliance of fish on structure relates closely to body size and life history stage (Bohnsack, 1989; Paxton et al., 2017). Fish interactions and habitat preferences change over ontogeny but are strongest among young fish (Steimle and Zetlin, 2000; Diaz et al., 2003; Paxton et al., 2017). Structure-dependent species, like cunner and tautog, demonstrate limited movement for the first few years of life and require cover to meet fundamental needs, in particular, protection during periods of overnight or winter torpor (Olla et al., 1974; Olla et al., 1979; Charton and Ruzafa, 1998; Able et al., 2005; Tupper and Juanes, 2017). Structures that extend up in the water column may be the first substrate that fish encounter during settlement (Wilhelmsson et al., 2006). While juvenile fish are associated with large bedforms and biogenic structures, the mesoscale and microscale environments within these structures offer valuable refuge for fish at small sizes (Diaz et al., 2003).
While quantification of fish behavior was beyond the scope of this study, we note that fish were periodically observed foraging on cages, harness, and lines. Multi-dimensional cages, containing mesh bags and live oysters with attached lines and rigging, provide many surfaces for attachment of epifaunal organisms, algae and invertebrates (Dumbauld et al., 2009; Mercaldo-Allen et al., 2021). Colonization of surfaces with epibiotic growth is believed to enhance the value of cages by providing a source of camouflage and forage (e.g., Shumway et al., 2003; Forrest et al., 2009; Glenn, 2016). Sessile organisms, attached to oyster rafts, represented a large portion of the diet for black sea bream (Acanthopagrus schlegelii), a fish which occurs in high abundance on shellfish farms in Hiroshima, Japan (Tsuyuki and Umino, 2017; Tsuyuki and Umino, 2018). Aquaculture gear may provide greater surface area for colonizing organisms than naturally occurring habitats with less structure or lower complexity (DeAlteris et al., 2004).
Temperate reef fish are known to undergo seasonal movements that correspond to cyclic changes in seawater temperature. Of the measured environmental parameters, seawater temperature showed the strongest association with fish abundance on cage and boulder habitats and across shellfish farms over the study period, and in general fish abundance declined as temperatures decreased, particularly at temperatures below 20°C (Table 4). This result was not surprising, as temperature is the physical variable known to exert the greatest influence on fish physiology, activity and behavior with fish generally most active during the warm summer months (Volkoff and Rønnestad, 2020) and hence more likely to be observed in video recordings. Fish abundance was closely tied to water temperatures, and was highest at the warmest temperatures (Figures 3, 6). Adult black sea bass, scup and tautog migrate into deeper waters when temperatures decline in the late fall while small cunner, black sea bass and tautog remain inshore and exhibit reduced swimming activity or enter into winter torpor (e.g, Olla et al., 1974; Morse, 1978; Auster, 1989; Hales and Able, 2001; Moser and Shepherd, 2009).
Changing currents, in response to daily tidal cycles, are also known to affect the small-scale distribution and maneuverability of fish, including cunner and tautog, especially at high flow velocities and small body sizes (Auster, 1989; Auster et al., 2003). Given the relatively low current speeds observed at the sparse cage farm, dense cage farm and rock reef sites (< 12 cm S-1), it was not surprising that current speed was a less important predictor of fish abundance than temperature (Table 4). In instances with explanatory power >0, fish abundance generally declined with increasing current speed, but results were inconsistent across habitats and farms, and explanatory power never exceeded 35%. Fish, which rely on visual cues for swimming and feeding, can also be affected by diurnal changes in ambient light levels (Stoner, 2004). However, we found that light levels showed no consistent pattern as a predictor of total and species-specific fish abundance across cage sites for both study years. Overall, light intensity was a good predictor of abundance for black sea bass, scup and tautog on the Rock Reef in 2018, and in all three instances fish abundance increased with increasing light levels, but light explained almost none of the variation in cunner at any site in either year. Cryptic cunner which remain in close association with shelter, may be less responsive to variable light levels than demersal fish that may actively alter their behavior and position around shelter relative to changes in brightness and visibility. Tautog actively forage during daylight hours and take refuge in shelter overnight (Olla et al., 1974) while black sea bass are thought to extend visual foraging into the twilight (crepuscular) period (Horodysky et al., 2013; Campanella et al., 2019). Species accustomed to benthic environments with poor water clarity and low visibility are less likely to demonstrate a discernable pattern relative to variations in light levels. Although current and light levels are known to influence fish abundance in coastal and estuarine environments, differences recorded across habitats within this study were likely too small to have biological relevance.
Habitat comparison 2018 (dense vs sparse cage farms)
Our ability to draw conclusions related to cage density based on absolute cage numbers was limited by our sampling design in 2018. While the deployment of cages at two farms with different cage numbers facilitates our comparison of boulder versus cage habitat, we did not have spatial replication of our dense or sparse cage farm sites. Additionally, the number of cages on the dense cage farm varied over the season as growers conducted normal farming activities, thus we did not strictly control the number of cages on the dense cage farm site. It is worth noting ways in which the two sites were similar or different, but differences cannot be ascribed to cage density alone. However, fish were present at the sparse farm site on all sampling dates, and no significant differences were observed in fish community composition, total fish abundance, or abundance of scup, cunner, or tautog between dense and sparse sites. It is possible that there may not be a minimum number of cages necessary on a shellfish farm to experience elevated abundance of structure-oriented fish species. Other studies have suggested that individual oyster cages contribute discrete, localized structure for reef species (Erbland and Ozbay, 2008). These results are noteworthy, because they indicate that oyster aquaculture gear, deployed on large or small farms, appear to offer attractive habitat for structure-oriented fish species in areas with otherwise low relief that without the gear, may support a lower abundance of these species. Future research specifically testing gear density effects may be valuable.
Farm location 2019 and across year comparison (2018 vs 2019)
When compared to differences across habitat within a single embayment, the differences observed across farms in central-western Long Island Sound was relatively small. The four most commonly-observed fish species from the 2018 sampling season (black sea bass, cunner, scup, and tautog) were all observed again in 2019 in association with each of the three farms sampled. The geographic location of shellfish farms did not appear to influence numbers of fish on oyster cages. Total fish abundance, species richness, and abundance of the four most common species, black sea bass, cunner, scup, and tautog, did not vary significantly by farm during the 2019 sampling season.
The overall fish community composition associated with the Norwalk farm was significantly different from the Milford and Westport farms. SIMPER analysis indicated that black sea bass was the largest contributor to the differences between Norwalk and Milford/Westport, with scup and cunner also contributing at a lower relative percentage. This result was in contrast to the repeated measures ANOVA that did not detect differences based on farm location for any individual species. It is possible that we did not have enough statistical power to detect small farm location differences that were identified by a community analysis. This result was interesting given that the Norwalk and Westport farms were in much closer geographic proximity (1.8 km) than the Milford and Westport farms (25 km) (Figure 1) and water depths at Norwalk (5.5 m) and Milford (4.6 m) were more similar than at Westport (7.6 m). The Norwalk farm exhibited significantly higher mean and maximum current speeds, as well as mean and maximum light intensity, when compared to the Milford and Westport farms, and suggests that environmental conditions may have influenced community composition across the three farms (Figure 8). However, when these environmental variables were evaluated as predictors of fish abundance within each site, neither current speed nor light was a consistent predictor of fish abundance at any location (Table 4).
Occurrence of YOY fish was lower at all farms sampled in 2019 relative to sites sampled in 2018, and young fish appeared earlier in the 2019 sampling season (Table 3, Figures 4, 7). We believe these differences were more likely due to natural interannual variability than spatial variability, since the 2019 Milford farm was the same location as the 2018 dense cage farm site, and was sampled in both years. Interannual variability in abundance of YOY black sea bass, scup, and tautog has been observed in Long Island Sound (Molnar, 2020), and our observations underscore the challenge of using a metric with strong interannual variability, such as YOY, as an indicator of good fish habitat.
Interannual variability was also noted in colonizing organisms between years with a much more extensive colonizer community observed on cages in 2018 versus 2019. Epifaunal communities are often ephemeral, show high spatial and temporal variability, and may experience periods of low recruitment and survival (Steimle and Zetlin, 2000). Although dense growth of colonizing organisms may enhance the attractiveness of habitat, and provide greater opportunities for foraging activity, we found that cages and boulders experienced high fish activity even when colonizer coverage was minimal. It is possible, however, that reduced colonization of epifauna in 2019, relative to 2018, may have minimized cover available for small fish and for this reason, had the potential to affect YOY abundance. The extent of colonization by epifaunal organisms appears to be only one attribute that contributes to the suitability of cages and boulders as habitat for fish.
Methodological considerations
The use of underwater video census, as well as the MaxN abundance metric, yield conservative estimates of fish abundance in association with structured habitat. The use of underwater video, in natural light, restricted our observations to daylight hours. Due to highly variable turbidity in the water column, we only counted fish that occurred in the immediate vicinity of the cage. It is likely that fish species preferring the cage interior were undercounted by video, and benthic species such as naked goby, oyster toadfish, and rock gunnel, were not observed on video but fell out of cages and onto the deck of the boat during camera deployment and retrieval. Epifaunal growth on and around boulders likely also obscured some small fish from view. The viewable area within videos observed the same type of fish activities at both boulder and cage habitats. While the MaxN metric prevents the double-counting of fish that swim in and out of video, the fact that our camera placement did not provide a full view of cages or boulders meant that there were likely fish in association with these structures that were not in view when the MaxN was generated at each hourly interval.
These methodological considerations apply to both cages and boulders, and should not impact the comparison of these habitats, or the comparison of farms across locations. Furthermore, by employing conservative methods, the data generated here represent minimum estimates of fish abundance and diversity in association with structured habitat. Future research using a broader range of methods is necessary to fill the data gaps (e.g. night fish activity, use of the area inside or beneath the cage) and refine the abundance measurements provided here.
Fish behavior and provision of ecosystem services
While scoring video for fish abundance, we made a qualitative assessment of fish behaviors associated with cages and boulders. Although this study did not quantify fish behavior, it is worth noting that black sea bass, cunner, scup and tautog all demonstrated a variety of interactions with oyster cages that related to habitat use. Behaviors associated with cages included foraging (picking and grazing on cages, lines, rigging, and mesh bags), sheltering (inside cages and bags), escape (into cages when pursued by predators or aggressively challenged by other fish), station keeping (small fin movements to hold place in currents above or alongside cage or boulder), schooling (grouping above or alongside the cage), territoriality (agonistic aggressive chasing or biting), courtship (males pursue females, swimming close together), and reproductive activity (release of gametes). Most of the less prevalent species appear to be transiting through the habitats, with the exception of yellow jack, which were observed schooling at high abundance above cages during several recording intervals in late summer. Behavioral interactions with oyster cages can provide insights into how aquaculture gear may meet the functional requirements of fish in much the same way as natural structured seafloor (Mercaldo-Allen et al., 2021; Shinn et al., 2021).
Oyster aquaculture gear as fish habitat
Oyster aquaculture cages on shellfish farms appear to function as artificial reefs, providing habitat to structure-oriented fish of economic importance in soft bottom environments. The data presented here suggest that habitat provisioning occurs similarly between oyster aquaculture cages placed at dense or sparse farms, and across farms within an estuary. The three common species that were observed at elevated abundance on cages relative to natural boulder habitat all have commercial and recreational fisheries, and enhancement of natural populations through habitat addition would provide economic benefits to coastal communities. Black sea bass is federally managed, and includes artificial structure as part of its essential fish habitat text description for both juvenile and adult life stages. There are both commercial and recreational fisheries for black sea bass in Connecticut, with 2021 landings reports of 950 metric tons for recreational, and 52 metric tons (valued at $410,000) for the commercial fishery (NOAA Fisheries Office of Science of Technology, 2023). Scup is also federally managed, and Connecticut is one of the top five states for both recreational and commercial landings. The 2021 scup landings reports were 1,296 metric tons for recreational, and 353 metric tons (valued at $793,000) for the commercial fishery. Tautog is managed by the state of Connecticut, with 2021 recreational landings of 977 metric tons, and a small commercial fishery of 7 metric tons (valued at $58,000).
Addition of structured habitat to low relief seafloor is a commonly used strategy to sustain or enhance fish communities (Mangel et al., 2006). Observations of high numbers of black sea bream near oyster raft structures in Hiroshima Bay, Japan, suggests that oyster farming areas serve as artificial reefs for this species (Tsuyuki and Umino, 2017; Tsuyuki and Umino, 2018). Use of oyster cages by fish at a variety of life stages suggests a role for aquaculture gear in supporting populations of economically valued species throughout their life cycle. High quality habitats, those which meet functional requirements for fish throughout ontogeny, may qualify for designation as essential fish habitat (Levin and Stunz, 2005). Artificial structures in the marine environment can provide many of the same benefits for fish as natural hard bottom substrate. The uncertainty of attraction versus production is real but the effect of artificial structure depends on the species of interest and the surrounding landscape and natural habitats, where artificial structure can overcome habitat bottlenecks and enhance recruitment/survival (Folpp et al., 2020). However, further study is needed to discern whether structures like cages serve to attract and aggregate fish from existing nearby habitats or act to increase fish production through creation of new habitat (Pickering and Whitmarsh, 1997).
Shellfish farming practices may affect fish abundance around aquaculture gear. Oyster cages require periodic tending to remove attached growth, adjust stocking densities, and harvest market size oysters (Northern Economics, 2014). Handling, maintenance or removal of cages, although infrequent, may result in the reduction or elimination of colonizing organisms, and the disruption of fish (DeAlteris et al., 2004; Tallman and Forrester, 2007). Farms where many cages are in close proximity may provide alternative refuge for fish that are displaced when a single cage is removed. Shellfish gear that remains deployed for prolonged periods may elevate carrying capacity and fish abundance above baseline levels on low relief seafloor (DeAlteris et al., 2004). Development of cultivation practices that minimize disruption to fish or colonizing communities while accommodating shellfish production needs is a valuable area of future research.
Environments which support high fish abundance, increase refuge availability or elevate growth rates, relative to other juvenile habitats, may be serving as nursery areas for young fish (Beck et al., 2001). Observations of recently settled juvenile fish around oyster cages, sometimes in high abundance, suggests that aquaculture gear may provide nursery habitat for obligate reef species. Shelter-poor environments can pose a bottleneck to survival of recently settled fish while the addition of artificial structure can expand settlement habitat (Bohnsack, 1989). Environments that support young fish have the potential to enhance recruitment, survival and abundance, and may be prioritized for management and conservation (Mangel et al., 2006). The presence of young-of-the-year fish on shellfish farms suggest that cage structures may potentially contribute to enhancement of fish production by increasing habitat complexity in areas with otherwise low relief seafloor, particularly at the end of the nursery season.
Conclusion
Temperate reef species were highly associated with oyster aquaculture cages. Higher abundances of recreationally and commercially fished black sea bass, scup and tautog were observed on cages than boulders while cunner occurred at similar abundance on both shellfish farms and the rock reef. Fish abundance was similar at dense and sparse cage farms and across shellfish farms in western and central Long Island Sound. Seasonal seawater temperature was highly correlated with patterns of fish abundance. Young-of-the-year black sea bass and scup were observed at all study sites during late summer, suggesting that aquaculture gear has the potential to enhance production of these economically valuable fish species in structure-limited environments. High fish abundance in and around aquaculture gear suggests that oyster cages function much like artificial reefs, providing habitat for structure-oriented black sea bass, cunner, scup and tautog similar to that afforded by boulders on a natural rock reef. These observations of fish interactions with aquaculture gear may help inform regulators and fishery managers who make decisions about shellfish farm permitting and practices and inform ongoing public discussions about shellfish aquaculture industry growth in coastal communities.
Data availability statement
The raw data supporting the conclusions of this article will be made available by the authors, without undue reservation.
Author contributions
All authors agree to be listed and have made substantial contributions to this work. PC and GP reviewed the videos and conducted the MaxN scoring, EE YL, and DR were responsible for field operations and camera deployments, MD and BS conducted dive operations, PA and AV contributed to experimental design, and, RM-A, LM, and JR were principal investigators.
Funding
This study was funded by NOAA Fisheries Office of Aquaculture.
Acknowledgments
Field operations were conducted aboard the Milford Laboratory’s 15-m NOAA R/V Victor Loosanoff. We thank David Carey, Kristin DeRosia-Banick and Shannon Kelly of the State of Connecticut, Bureau of Aquaculture, Jimmy Bloom and Rachel Precious of Copps Island Oysters and James Markow of Noank Aquaculture Cooperative for the loan of seed oysters and deployment assistance, shellfish growers Jeff Northrup of Hummock Island Oyster Company, Gary Salce of G & B Shellfish and Charles Viens of Charles Island Oyster Farms for access to leased shellfish beds, NOAA divers Calandrea DeCastro, Keith Golden, and Jerry Prezioso for dive support, Arthur Allen of the Coast Guard Office of Search and Rescue for analysis of current meter data, and Bobbi Bevaqua, William DeFrancesco, Peter Hudson, Deaven Maull, Max Mauro and Ned Dimes Marina for support of field operations, and NOAA’s Northeast Fisheries Science Center and Office of Aquaculture for funding. Use of tradenames® does not imply endorsement.
Conflict of interest
Authors YL and GP are employed by A.I.S., Inc.
The remaining authors declare that the research was conducted in the absence of any commercial or financial relationships that could be construed as a potential conflict of interest.
Publisher’s note
All claims expressed in this article are solely those of the authors and do not necessarily represent those of their affiliated organizations, or those of the publisher, the editors and the reviewers. Any product that may be evaluated in this article, or claim that may be made by its manufacturer, is not guaranteed or endorsed by the publisher.
References
Able K. W., Hales L. S., Hagan S. M. (2005). Movement and growth of juvenile (age 0 and 1+) tautog (Tautoga onitis [L.]) and cunner (Tautogolabrus adspersus [Walbaum]) in a southern new Jersey estuary. J. Exper. Mar. Biol. Ecol. 327 (1), 22–35. doi: 10.1016/j.jembe.2005.05.019
Archer A., Reitsma J., Murphy D. (2014). A comparison of bottom and floating gear for growing American oysters (Crassostrea virginica) in southeastern Massachusetts. Massachusetts: Marine Extension Bulletin, Woods Hole Sea Grant, Woods Hole. Available at: https://ecsga.org/wp-content/uploads/2019/02/Oyster_Grow_FINAL_185504.pdf.
Auster P. J. (1989). Species profiles: life histories and environmental requirements of coastal fishes and invertebrates (North Atlantic and mid-Atlantic) – tautog and cunner. US fish wildl serv biol rep 82(11.105) (US Army Corps of Engineers, TR EL-82-4), 13. Available at: https://apps.dtic.mil/sti/pdfs/ADA214300.pdf.
Auster P. J., Lindholm J., Schaub S., Funnell G., Kaufman L. S., Valentine P. C. (2003). Use of sand wave habitats by silver hake. J. Fish Biol. 62, 143–152. doi: 10.1046/j.1095-8649.2003.00016.x
Barrett L. T., Swearer S. E., Dempster T.. (2019). Impacts of marine and freshwater aquaculture on wildlife: a global meta-analysis. Rev Aquacult 11, 1022-1044. doi: 10.1111/raq.12277
Barrett L. T., Theuerkauf S. J., Rose J. M., Alleway H. K., Bricker S. B., Parker M., et al. (2022). Sustainable growth of non-fed aquaculture can generate valuable ecosystem benefits. Ecosyst. Serv. 53, 101396. doi: 10.1016/j.ecoser.2021.101396
Beck M. W., Heck K. L., Able K. W., Childers D. L., Eggleston D. B., Gillanders B. M., et al. (2001). The identification, conservation, and management of estuarine and marine nurseries for fish and invertebrates: A better understanding of the habitats that serve as nurseries for marine species and the factors that create site-specific variability in nursery quality will improve conservation and management of these areas. BioScience 51 (8), 633–641. doi: 10.1641/0006-3568(2001)051[0633:TICAMO]2.0.CO;2
Bilodeau S. M., Layman C. A., Silman M. R. (2021). Benthic pattern formation in shallow tropical reefscapes: does grazing explain grazing halos? Landscape Ecol. 36 (6), 1605–1620. doi: 10.1007/s10980-021-01239-1
Bohnsack J. (1989). Are high densities of fishes at artificial reefs the result of habitat limitation or behavioral preference? Bull. Mar. Sci. 44, 631–645.
Bolser D. G., Egerton J. P., Grüss A., Loughran T., Beyea T., McCain K., et al. (2020). Environmental and structural drivers of fish distributions among petroleum platforms across the U.S. Gulf Mexico. Mar. Coast. Fish. 12, 142–163. doi: 10.1002/mcf2.10116
Campanella F., Auster P. J., Taylor J. C., Muñoz R. C. (2019). Dynamics of predator-prey habitat use and behavioral interactions over diel periods at sub-tropical reefs. PloS One 14 (2), e0211886. doi: 10.1371/journal.pone.0211886
Charton J. A. G., Ruzafa A. P. (1998). Correlation between habitat structure and a rocky reef fish assemblage in the southwest Mediterranean. Mar. Ecol. 19, 111–128. doi: 10.1111/j.1439-0485.1998.tb00457.x
Clarke M. E., Whitmire C., Fruh E., Anderson J., Taylor J., Rooney J., et al. (2010). “Developing the SeaBED AUV as a tool for conducting routine surveys of fish and their habitat in the pacific,” in 2010 IEEE/OES autonomous underwater vehicles (Piscataway, N.J.: IEEE), vol. 2010, 1–5. doi: 10.1109/AUV.2010.5779665
Cullen D., Stevens B. (2017). Use of an underwater video system to record observations of black sea bass (Centropristis striata) in waters off the coast of Maryland. Fish. Bull. 115, 408–418.
Danylchuk A. J., Morgan C., Ring N. (2018). So you want to make a film: An introduction to creating videos for broader impacts in fisheries and aquatic sciences. Fisheries 43, 144–151. doi: 10.1002/fsh.10059
DeAlteris J. T., Kilpatrick B. D., Rheault R. B. (2004). A comparative evaluation of the habitat value of shellfish aquaculture gear, submerged aquatic vegetation and a non-vegetated seabed. J. Shellfish Res. 23 (3), 867–874.
Diaz R. J., Cutter G. R. Jr., Able K. W. (2003). The importance of physical and biogenic structure to juvenile fishes on the shallow inner continental shelf. Estuaries 26, 12–20.
Drohan A. F., Manderson J. P., Packer D. B. (2007). Essential fish habitat source document. black sea bass, centropristis striata, life history and habitat characteristics (NOAA technical memorandum NMFS-NE), 200. Available at: https://repository.library.noaa.gov/view/noaa/4038.
Dumbauld B. R., Ruesink J. L., Rumrill S. S. (2009). The ecological role of bivalve shellfish aquaculture in the estuarine environment: a review with application to oyster and clam culture in West coast (USA) estuaries. Aquacult 290, 196–223. doi: 10.1016/j.aquaculture.2009.02.033
Erbland P. J., Ozbay G. (2008). A comparison of the macrofaunal communities inhabiting a Crassostrea virginica oyster reef and oyster aquaculture gear in Indian river bay, Delaware. J. Shellfish Res. 27 (4), 757–768. doi: 10.2983/0730-8000(2008)27[757:ACOTMC]2.0.CO;2
FAO (2022) The state of world fisheries and aquaculture. Available at: https://www.fao.org/publications/sofia/2022/en/ (Accessed 03/07/2023).
Ferriss B., Veggerby K., Bogeberg M., Conway-Cranos L., Hoberecht L., Kiffney P., et al. (2021). Characterizing the habitat function of bivalve aquaculture using underwater video. Aquacult. Environ. Interact. 13, 439–454. doi: 10.3354/aei00418
Florisson J. H., Tweedley J. R., Walker T. H. E., Chaplin J. A. (2018). Reef vision: A citizen science program for monitoring the fish faunas of artificial reefs. Fish. Res. 206, 296–308. doi: 10.1016/j.fishres.2018.05.006
Folpp H. R., Schilling H. T., Clark G. F., Lowry M. B., Maslen B., Gregson M., et al. (2020). Artificial reefs increase fish abundance in habitat-limited estuaries. J. Appl. Ecol. 57, 1752–1761. doi: 10.1111/1365-2664.13666
Forrest B. M., Keeley N. B., Hopkins G. A., Webb S. C., Clement D. M. (2009). Bivalve aquaculture in estuaries: Review and synthesis of oyster cultivation effects. Aquaculture 298 (1–2), 1–15. doi: 10.1016/j.aquaculture.2009.09.032
Glenn M. E. (2016). A comparison of macrofaunal and algal communities in oyster aquaculture gear, an eelgrass bed, oyster reef, and a mudflat in great bay, new Hampshire (Durham, NH: MSc thesis, University of New Hampshire), 53. Available at: https://scholars.unh.edu/thesis/876.
Hales L. S., Able K. (2001). Winter mortality, growth and behavior of young-of-the-year of four coastal fishes in NJ (US) waters. Mar. Biol. 139, 45–54. doi: 10.1007/s002270100571
Horodysky A. Z., Brill R. W., Crawford K. C., Seagroves E. S., Johnson A. K. (2013). Comparative visual ecophysiology of mid-Atlantic temperate reef fishes. Biol. Open 2 (12), 1371–1381. doi: 10.1242/bio.20136825
Lefcheck J. S., Pfirrmann B. W., Fodrie F. J., Grabowski J. H., Hughes A. R., Smyth A. R. (2021). Consumption rates vary based on the presence and type of oyster structure: A seasonal and latitudinal comparison. J. Exper. Mar. Biol. Ecol. 536, 151501. doi: 10.1016/j.jembe.2020.151501
Levin P. S., Stunz G. W. (2005). Habitat triage for exploited fishes: Can we identify essential “Essential fish habitat?” Estuar. Coast. Shelf Sci. 64, 70–78. doi: 10.1016/j.ecss.2005.02.007
Mangel M., Levin P., Patil A. (2006). Using life history and persistence criteria to prioritize habitats for management and conservation. Ecol. Appl. 16 (2), 797–806. doi: 10.1890/1051-0761(2006)016[0797:ULHAPC]2.0.CO;2
Marenghi F., Ozbay G., Erbland P., Rossi- Snook K. (2010). A comparison of the habitat value of sub-tidal and floating oyster (Crassostrea virginica) aquaculture gear with a created reef in delaware’s inland bays, USA. Aquacult. Int. 18, 69–81. doi: 10.1007/s10499-009-9273-3
Mercaldo-Allen R., Clark P., Liu Y., Meseck S., Milke L., Redman D. (2020). Macrofaunal assemblages on oyster aquaculture and rock reef habitat in long island sound. North. Amer. J. Aquacult. 82, 92–100. doi: 10.1002/naaq.10127
Mercaldo-Allen R., Clark P., Liu Y., Phillips G., Redman D., Auster P. J., et al. (2021). Exploring video and eDNA metabarcoding methods to assess oyster aquaculture cages as fish habitat. Aquacult. Environ. Interact. 13, 277–294. doi: 10.3354/aei00408
Mercaldo-Allen R., Goldberg R., Clark P. E., Kuropat C. A. (2011). Observations of juvenile American lobsters, Homarus americanus, on a rock-reef in long island sound. Northeast. Nat. 18, 45–60. doi: 10.1656/045.018.0105
Molnar D. (2020). “Job 8: estuarine seine survey, 22 p. In a study of marine recreational fisheries in connecticut. federal aid in sport fish restoration F19AF00242 (F-54-R-39),” in Annual progress report, Annual Performance Report March 1, 2019 – February 28, 2020. Conn. Dep. Energy Environ. Prot, Hartford, CT.
Morse W. W. (1978) Biological and fisheries data on scup, stenotomus chrysops (Linnaeus) U.S. natl. mar. fish. serv. northeast fish. cent. sandy hook lab. tech. rep. no. 12. Available at: https://repository.library.noaa.gov/view/noaa/33307.
Moser J., Shepherd G. R. (2009). Seasonal distribution and movement of black sea bass (Centropristis striata) in the Northwest Atlantic as determined from a mark-recapture experiment. J. Northw. Atl. Fish. Sci. 40, 17–28. doi: 10.2960/J.v40.m638
Muething K. A., Tomas F., Waldbusser G., Dumbauld B. R. (2020). On the edge: assessing fish habitat use across the boundary between pacific oyster aquaculture and eelgrass in willapa bay, Washington, USA. Aquacult. Environ. Interact. 12, 541–557. doi: 10.3354/aei00381
Naylor R. L., Hardy R. W., Buschmann A. H., Bush S. R., Cao L., Klinger D. H., et al. (2021). A 20-year retrospective review of global aquaculture. Nature 591, 551–563.
NOAA Fisheries Office of Science and Technology Commercial landings query. Available at: www.fisheries.noaa.gov/foss (Accessed 03/07/2023).
Northern Economics, Inc (2014). Assessment of the value of shellfish aquaculture in the gulf of Mexico as habitat for commercial and recreational fish species (Prepared for Auburn University School of Fisheries, Aquaculture and Aquatic Sciences and Alabama Cooperative Extension), 25. Available at: https://pensacolaoystercluster.com/wp-content/uploads/2022/02/Eco-Value-of-Oyster-Aquaculture.pdf.
Olla B. L., Bejda A. J., Martin D. (1974). Daily activity, movements, feeding, and seasonal occurrence in the tautog, Tautoga onitis. Fish. Bull. 72, 27–35.
Olla B. L., Bejda A. J., Martin D. (1975). Activity, movements, and feeding behavior of the cunner, Tautogolabrus adspersus, and comparison of food habitats with young tautog, Tautoga onitis, off long island, new York. Fish. Bull. 73, 895–900. Available at: https://fisherybulletin.nmfs.noaa.gov/content/activity-movements-and-feeding-behavior-cunner-tautogolabrus-adspersus-and-comparison-food.
Olla B. L., Bejda A. J., Martin A. D. (1979). Seasonal dispersal and habitat selection of cuynner, Tautogolabrus adspersus, and young tautog, Tautoga onitis, in fire island inlet, long island, new York. Fish. Bull. 77 (1), 255–261. Available at: https://fisherybulletin.nmfs.noaa.gov/content/seasonal-dispersal-and-habitat-selection-cunner-tautogolabrus-adspersus-and-young-tautog.
Parsons D. F., Suthers I. M., Cruz D. O., Smith J. A. (2016). Effects of habitat on fish abundance and species composition on temperate rocky reefs. Mar. Ecol. Prog. Ser. 561, 155–171. doi: 10.3354/meps11927
Paxton A. B., Pickering E. A., Adler A. M., Taylor J. C., Peterson C. H. (2017). Flat and complex temperate reefs provide similar support for fish: Evidence for a unimodal species-habitat relationship. PLoS One 12 (9), e0183906. doi: 10.1371/journal.pone.0183906
Pickering H., Whitmarsh D. (1997). Artificial reefs and fisheries exploitation: a review of the a’ttraction versus production’ debate, the influence of design and its significance for policy. Fish. Res. 31, 39–59.
Poppe L. J., Knebel H. J., Seekins B. A., Hastings M. E. (2000). “Map showing the distribution of surficial sediments in long island sound,” in Georeferenced seafloor mapping and bottom photography in long island sound. Eds. Paskevich V. F., Poppe L. J. (Woods Hole, MA: Open-File Report 00-304, U.S. Geological Survey, Coastal and Marine Geology Program, Woods Hole Science Center). Available at: http://pubs.usgs.gov/of/of00-304/.
Rubino M. C.. (2023). Policy Considerations for Marine Aquaculture in the United States. Reviews in Fisheries Science & Aquaculture 1, 86-102. doi: 10.1080/23308249.2022.2083452
Scharf F. S., Manderson J. P., Fabrizio M. C. (2006). The effects of seafloor habitat complexity on survival of juvenile fishes: species specific interactions with structural refuge. J. Exper. Mar. Biol. Ecol. 335, 167–176. doi: 10.1016/j.jembe.2006.03.018
Schultz A. L., Malcolm H. A., Bucher D. J., Smith S. D. (2021). Effects of reef proximity on the structure of fish assemblages of unconsolidated substrata. PLoS One 7 (11), e49437. doi: 10.1371/journal.pone.0049437
Scuderi B., Chen X. (2019). Production efficiency in new england’s oyster aquaculture industry. Aquac. Econ. Manage. 23, 45–64. doi: 10.1080/13657305.2018.1449272
Shinn J. P., Munroe D. M., Rose J. M. (2021). A fish's-eye-view: accessible tools to document shellfish farms as marine habitat in new Jersey, USA. Aquacult. Environ. Interact. 13, 295–300. doi: 10.3354/aei00407
Shumway S. E. (Ed.) (2011). Shellfish aquaculture and the environment (Ames, Iowa: John Wiley and Sons), 528. doi: 10.1002/9780470960967
Shumway S. E., Davis C., Downey R., Karney R., Krauter J., Parsons J., et al. (2003). Shellfish aquaculture–in praise of sustainable economies and environments. World Aquaculture Soc. 34, 15–18.
Steimle F. W. (1999). Essential fish habitat source document. scup, stenotomus chrysops, life history and habitat characteristics (NOAA Tech. Memo. NMFS-NE), 140. Available at: https://repository.library.noaa.gov/view/noaa/3154.
Steimle F., Zetlin C. (2000). Reef habitats in the middle Atlantic bight: Abundance, distribution, associated biological communities, and fishery resource use. Mar. Fish. Rev. 62, 24–42.
Stoner A. W. (2004). Effects of environmental variables on fish feeding ecology: implications for the performance of baited fishing gear and stick assessment. J. Fish Biol. 65, 1445–1471. doi: 10.1111/j.0022-1112.2004.00593.x
Struthers D. P., Danylchuk A., Wilson A. D. M., Cooke S. J. (2015). Action cameras: Bringing aquatic and fisheries research into view. Fisheries 40 (10), 502–512. doi: 10.1080/03632415.2015.1082472
Tallman J. C., Forrester G. E. (2007). Oyster grow-out cages function as artificial reefs for temperate fishes. Trans. Amer. Fish. Soc 136, 790–799. doi: 10.1577/T06-119.1
Theuerkauf S. J., Barrett L. T., Alleway H. K., Costa-Pierce B. A., St. Gelais A., Jones R. C. (2021). Habitat value of bivalve shellfish and seaweed aquaculture for fish and invertebrates: Pathways, synthesis and next steps. Rev. Aquac. 14, 54–72. doi: 10.1111/raq.12584
Tsuyuki A., Umino T. (2017). Spatial movement of black sea bream Acanthopagrus schlegelii around the oyster farming area in Hiroshima bay, Japan. Fish. Sci. 83, 235–244. doi: 10.1007/s12562-016-1058-9
Tsuyuki A., Umino T. (2018). Assessment of ichthyofauna at oyster rafts in Hiroshima bay, Japan, using underwater video cameras. Aquacult. Sci. 66, 267–274. doi: 10.11233/aquaculturesci.66.267
Tupper M., Boutilier R. G. (1997). Effects of habitat on settlement, growth, predation, risk and survival of a temperate reef fish. Mar. Ecol. Prog. Ser. 151, 225–236. doi: 10.3354/meps151225
Tupper M., Juanes F. (2017). Testing foraging arena theory: The effects of conspecific density and habitat type on time and energy budgets of juvenile cunner. J. Exper. Mar. Biol. Ecol. 487, 86–93. doi: 10.1016/j.jembe.2016.12.001
Ulrich T. L., Bonar S. A. (2020). Inexpensive, underwater filming of rare fishes in high definition. Fisheries 45 (3), 122–130. doi: 10.1002/fsh.10391
Volkoff H., Rønnestad I. (2020). Effects of temperature on feeding and digestive processes in fish. Temperature (Austin) 7 (4), 307–320. doi: 10.1080/23328940.2020.1765950
Walton W. C., Davis J. E., Supan J. E. (2013). Off-bottom culture of oysters in the gulf of Mexico (U.S. Department of Agriculture, Southern Regional Aquaculture Center, SRAC Publication No. 4308), 5. Available at: https://shellfish.ifas.ufl.edu/wp-content/uploads/Off-Bottom-Culture-of-Oysters-in-the-GoM-SRAC-4308.pdf.
Wilhelmsson D., Yahya S. A. S., Öhman M. C. (2006). Effects of high-relief structures on cold temperate fish assemblages: A field experiment. Mar. Biol. Res. 2 (2), 136–147. doi: 10.1080/17451000600684359
Zajac R. N., Lewis R. S., Poppe L. J., Twichell D. C., Vozarik J., DiGiacomo-Cohen M. L. (2000). Relationships among sea-floor structure and benthic communities in long island sound at regional and benthoscape scales. J. Coast. Res. 16 (3), 627–640.
Keywords: oyster aquaculture cages, fish, MaxN, rock reef, habitat, video, shellfish farm
Citation: Mercaldo-Allen R, Auster PJ, Clark P, Dixon MS, Estela E, Liu Y, Milke L, Phillips G, Redman D, Smith BC, Verkade A and Rose JM (2023) Oyster aquaculture cages provide fish habitat similar to natural structure with minimal differences based on farm location. Front. Mar. Sci. 10:1058709. doi: 10.3389/fmars.2023.1058709
Received: 30 September 2022; Accepted: 21 March 2023;
Published: 05 April 2023.
Edited by:
Michael Phillips, WorldFish, MalaysiaReviewed by:
Damian Coman Brady, University of Maine, United StatesBinbin Jiang, Tongji University, China in collaboration with reviewer DB
Julieta Martinelli, University of Washington, Seattle, United States
Copyright © 2023 Mercaldo-Allen, Auster, Clark, Dixon, Estela, Liu, Milke, Phillips, Redman, Smith, Verkade and Rose. This is an open-access article distributed under the terms of the Creative Commons Attribution License (CC BY). The use, distribution or reproduction in other forums is permitted, provided the original author(s) and the copyright owner(s) are credited and that the original publication in this journal is cited, in accordance with accepted academic practice. No use, distribution or reproduction is permitted which does not comply with these terms.
*Correspondence: Julie M. Rose, anVsaWUucm9zZUBub2FhLmdvdg==