 Jutarak Luang-on1,2*
 Joji Ishizaka3
 Anukul Buranapratheprat4
 Jitraporn Phaksopa5
 Joaquim I. Goes6
 Elígio de Raús Maúre7
 Eko Siswanto2
 Yuanli Zhu8
 Qian Xu1
 Phattaranakorn Nakornsantiphap9
 Hiroshi Kobayashi10Satsuki Matsumura11
- 1Graduate School of Environmental Studies, Nagoya University, Nagoya, Japan
- 2Earth Surface System Research Center, Research Institute for Global Change, Japan Agency for Marine-Earth Science and Technology, Yokohama, Japan
- 3Institute for Space-Earth Environmental Research, Nagoya University, Nagoya, Japan
- 4Department of Aquatic Science, Faculty of Science, Burapha University, Chonburi, Thailand
- 5Department of Marine Science, Faculty of Fisheries, Kasetsart University, Bangkok, Thailand
- 6Lamont-Doherty Earth Observatory, Columbia University, Palisades, NY, United States
- 7Department of Research and Study, Northwest Pacific Region Environmental Cooperation Center, Toyama, Japan
- 8Key Laboratory of Marine Ecosystem Dynamics, Second Institute of Oceanography, Ministry of Nature Resources, Hangzhou, China
- 9Department of Renewable Power Plant, Electricity Generating Authority of Thailand, Bangkok, Thailand
- 10University of Yamanashi, Kofu, Japan
- 11Japan Fisheries Research and Education Agency, Kanagawa, Japan
In recent decades, red tides of non-toxic harmful algal blooms have frequently occurred in monsoon-influenced tropical areas, particularly the green form of Noctiluca scintillans (hereafter green Noctiluca). However, our understanding of the mechanism of red tide formation is hindered by spatial and temporal constraints of field data. In this study, we used moderate resolution imaging spectroradiometer (MODIS) ocean color data along with a locally developed algal-bloom classification algorithm to investigate the seasonal variability of dominant red tides across the upper Gulf of Thailand (uGoT). During our July 2018 observation, a super green Noctiluca bloom with extraordinarily high chl-a (>1,469 mg m-3) displayed a distinct spectral reflectance characteristic among red tides in blue-to-green and red-to-near infrared wavelengths. According to the distinctive in situ hyperspectral characteristics of uGoT algal blooms, we developed a classification algorithm for MODIS normalized at 488, 531, and 667 nm, which successfully discriminated green Noctiluca in three levels of blooms, namely, super (100%), strong (>80%), and weak (>40%), from other algal blooms (i.e., dinoflagellates, diatoms, cyanobacteria, and mixed red tide species) as well as non-bloom oceanic and coastal waters using MODIS data, as confirmed by uGoT red tide reports. Monthly MODIS-based discrimination composites from 2003 to 2021 revealed seasonal variability in the surface distribution and bloom frequency of green Noctiluca and other red tides according to the Asian monsoon seasons: the southwest monsoon (May–September) and the northeast monsoon (October–January of the following year). Green Noctiluca blooms occurred farther from the shore and estuaries than other red tides (dinoflagellates and cyanobacteria), and were much more frequent than other red tides between the Tha Chin and Chao Phraya River mouths during the non-monsoon period (February to April). The frequency and distribution of green Noctiluca blooms, as well as other algal blooms, varied with the monsoon season. By comparing MODIS-derived algal blooms to monsoon-induced factors (i.e., sea surface winds, precipitation, and river discharge), we present an unprecedented overview of the spatial and temporal dynamics of red tides throughout the uGoT under Asian monsoon conditions. This research contributes to our understanding of the impact of climate change on phytoplankton dynamics.
1 Introduction
The large dinoflagellate Noctiluca scintillans Macartney 1810 (syn. miliaris Suriray 1836) Kofoid and Swezy, 1921, hereafter referred to as Noctiluca, causes red tides of non-toxic harmful algal blooms worldwide (Harrison et al., 2011). As active Noctiluca blooms typically discolor seawater to an orange-red color owing to the presence of carotenoids, this phytoplankton is referred to as red Noctiluca. In the marine food web, Noctiluca plays an important role as a primary grazer of phytoplankton, and also consumes bacteria, small zooplankton, and fish eggs. As it requires external food, the blooming of this species has been commonly documented in areas of upwelling and other productive locations, particularly where diatoms are abundant, and may be connected to eutrophication (Fonda Umani et al., 2004; Harrison et al., 2011; Turkoglu, 2013). Although Noctiluca does not produce toxins like other dinoflagellates, massive Noctiluca blooms have the potential to reduce fish yield in aquaculture areas by consuming large amounts of fish eggs (Enomoto, 1956), and may act as a vector of phycotoxins to higher trophic levels or translocation to natural shellfish beds (Escalera et al., 2007).
Green Noctiluca (Figure 1) is an extraordinary form of Noctiluca that includes the individual photosynthetic endosymbiont Protoeuglena noctilucae (Wang et al., 2016). Endosymbiont photosynthetic pigments (i.e., chlorophyll a and b) contribute to the green color of Noctiluca, and the photosynthetic product provides energy to the host (Sweeney, 1971; Hansen et al., 2004; Saito et al., 2006). Because of these features, green Noctiluca is referred to as a mixotroph in the marine food web. According to Hansen et al. (2004), photosynthesis in green Noctiluca cells grown without prey increases with irradiance to approximately 200 ng C cell-1 d-1 at an irradiance level of ~250–300 μmol photons m-2 s-1. Photosynthesis was also more significant in green Noctiluca than phagotrophy, which only contributed 30% to the direct growth of green Noctiluca at an irradiance of 150 μmol photons m-2 s-1. Conversely, green Noctiluca turned colorless when the endosymbiont vanished after approximately two weeks in a control culture without any feeding organisms, with all host cells dying after approximately one month (Lirdwitayaprasit, 2001).
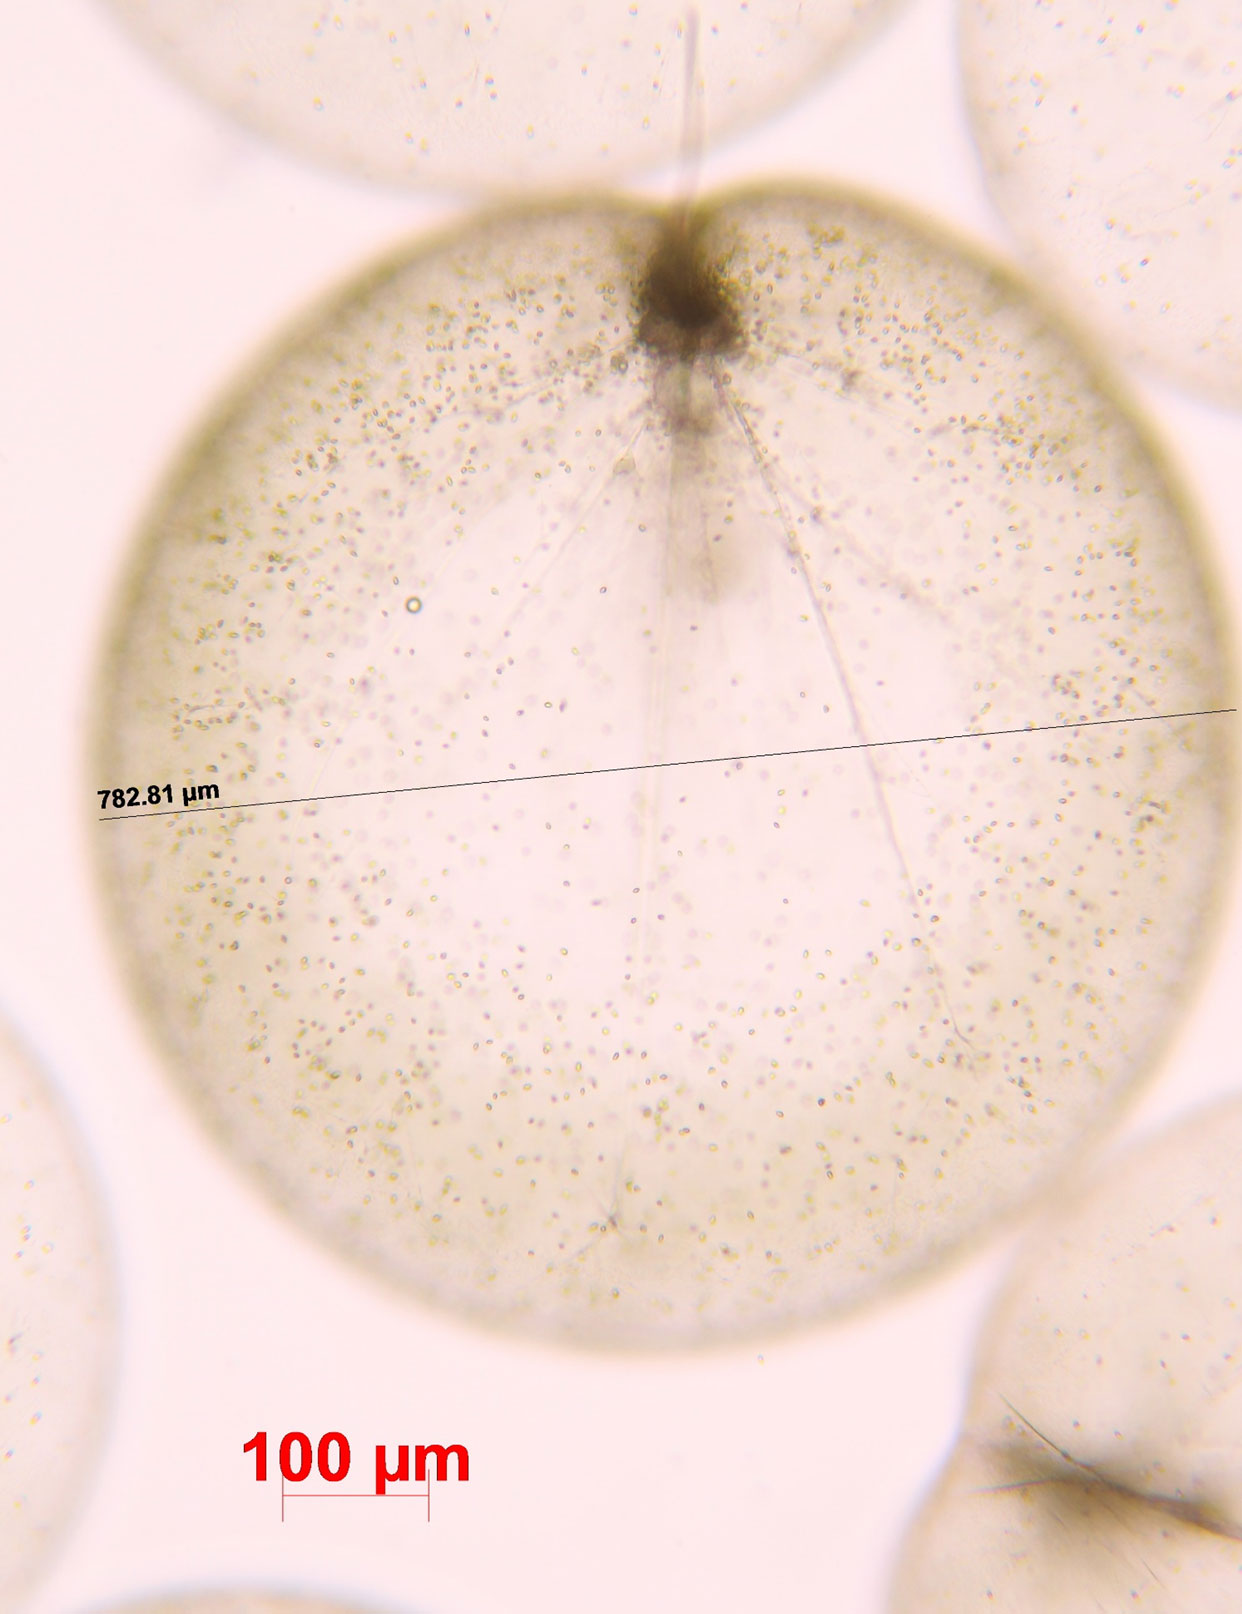
Figure 1 A cell of green Noctiluca scintillans. Photo by Dr. Vichaya Gunbua.
Unlike red Noctiluca, which is more widely distributed, green Noctiluca is exclusively present in the western tropical Pacific and Indian Ocean, including the Bay of Bengal, Arabian Seas, Gulf of Oman, Gulf of Thailand, and Manila Bay (Harrison et al., 2011). During an active bloom, the high cell density of green Noctiluca can continuously turn clear seawater into sticky dark green water for more than a week and potentially deplete the dissolved oxygen content, generating hypoxic conditions in the water column and resulting in massive fish mortality (Wattayakorn, 2006). In the last two decades, the increasing number and intensity of green Noctiluca blooms have had serious impacts on fisheries and tourism (Gomes et al., 2009; do Rosário Gomes et al., 2014; Goes et al., 2018). The dynamics of green Noctiluca are believed to be related to anthropogenic nutrient inputs and monsoons (Sriwoon et al., 2008; Goes et al., 2018), although the detailed mechanisms remain unclear.
The upper Gulf of Thailand (uGoT, Figure 2A), a shallow tropical semi-enclosed bay, is highly susceptible to hypertrophic and eutrophic conditions related to major river discharge along the northern coast, as well as water circulation patterns influenced by Asian monsoons (Buranapratheprat et al., 2021). As a result, non-toxic algal blooms generate red tides of various phytoplankton species in different locations multiple times per year, the most common of which are green Noctiluca and dinoflagellate Ceratium furca blooms (Lirdwitayaprasit, 2003). Green Noctiluca is commonly found in waters more than 10 m deep, with higher salinity (22–33 psu) than those inhabited by dinoflagellates (12–27 psu) (Lirdwitayaprasit et al., 2006). The vertical distribution of green Noctiluca can tolerate a wide range of salinity (10–31 psu), requiring an acclimation period to adapt to low salinity conditions (Lirdwitayaprasit et al., 2012). Sriwoon et al. (2008) reported that the seasonal cell abundance of green Noctiluca off the coast of Chonburi Province (i.e., off the northeastern coast of Thailand) is high (low) during the rainy (dry) season of the southwest (northeast) monsoon from May to September (November to February). Seasonal variability may result from the interaction between increased river discharge into the northern uGoT and the transfer of riverine nutrient inputs by eastward circulation generated by the monsoon along the northern coast (Buranapratheprat et al., 2002; Buranapratheprat et al., 2006; Yu et al., 2018). Chuenniyom et al. (2012) examined the green Noctiluca population in the Tha Chin estuary (off the north coast of Thailand) and observed a dense population in the outer part of the estuary with relatively high salinity, as well as a red tide during the high loading period of river discharge from November to December 2009. Moreover, ammonium nitrogen and dissolved inorganic nitrogen concentrations influence the total green Noctiluca population density, whereas orthophosphate phosphorus regulates the development of green Noctiluca red tides (Chuenniyom et al., 2012). Although the seasonal dynamics of green Noctiluca in northern coastal waters are related to an increase in riverine inputs and circulation induced by monsoons (Sriwoon et al., 2008; Chuenniyom et al., 2012), the overall dynamics of green Noctiluca and other red tides in the uGoT remain unknown. This is attributed to a lack of continuous tracking of the spatial and temporal variations in phytoplankton populations.
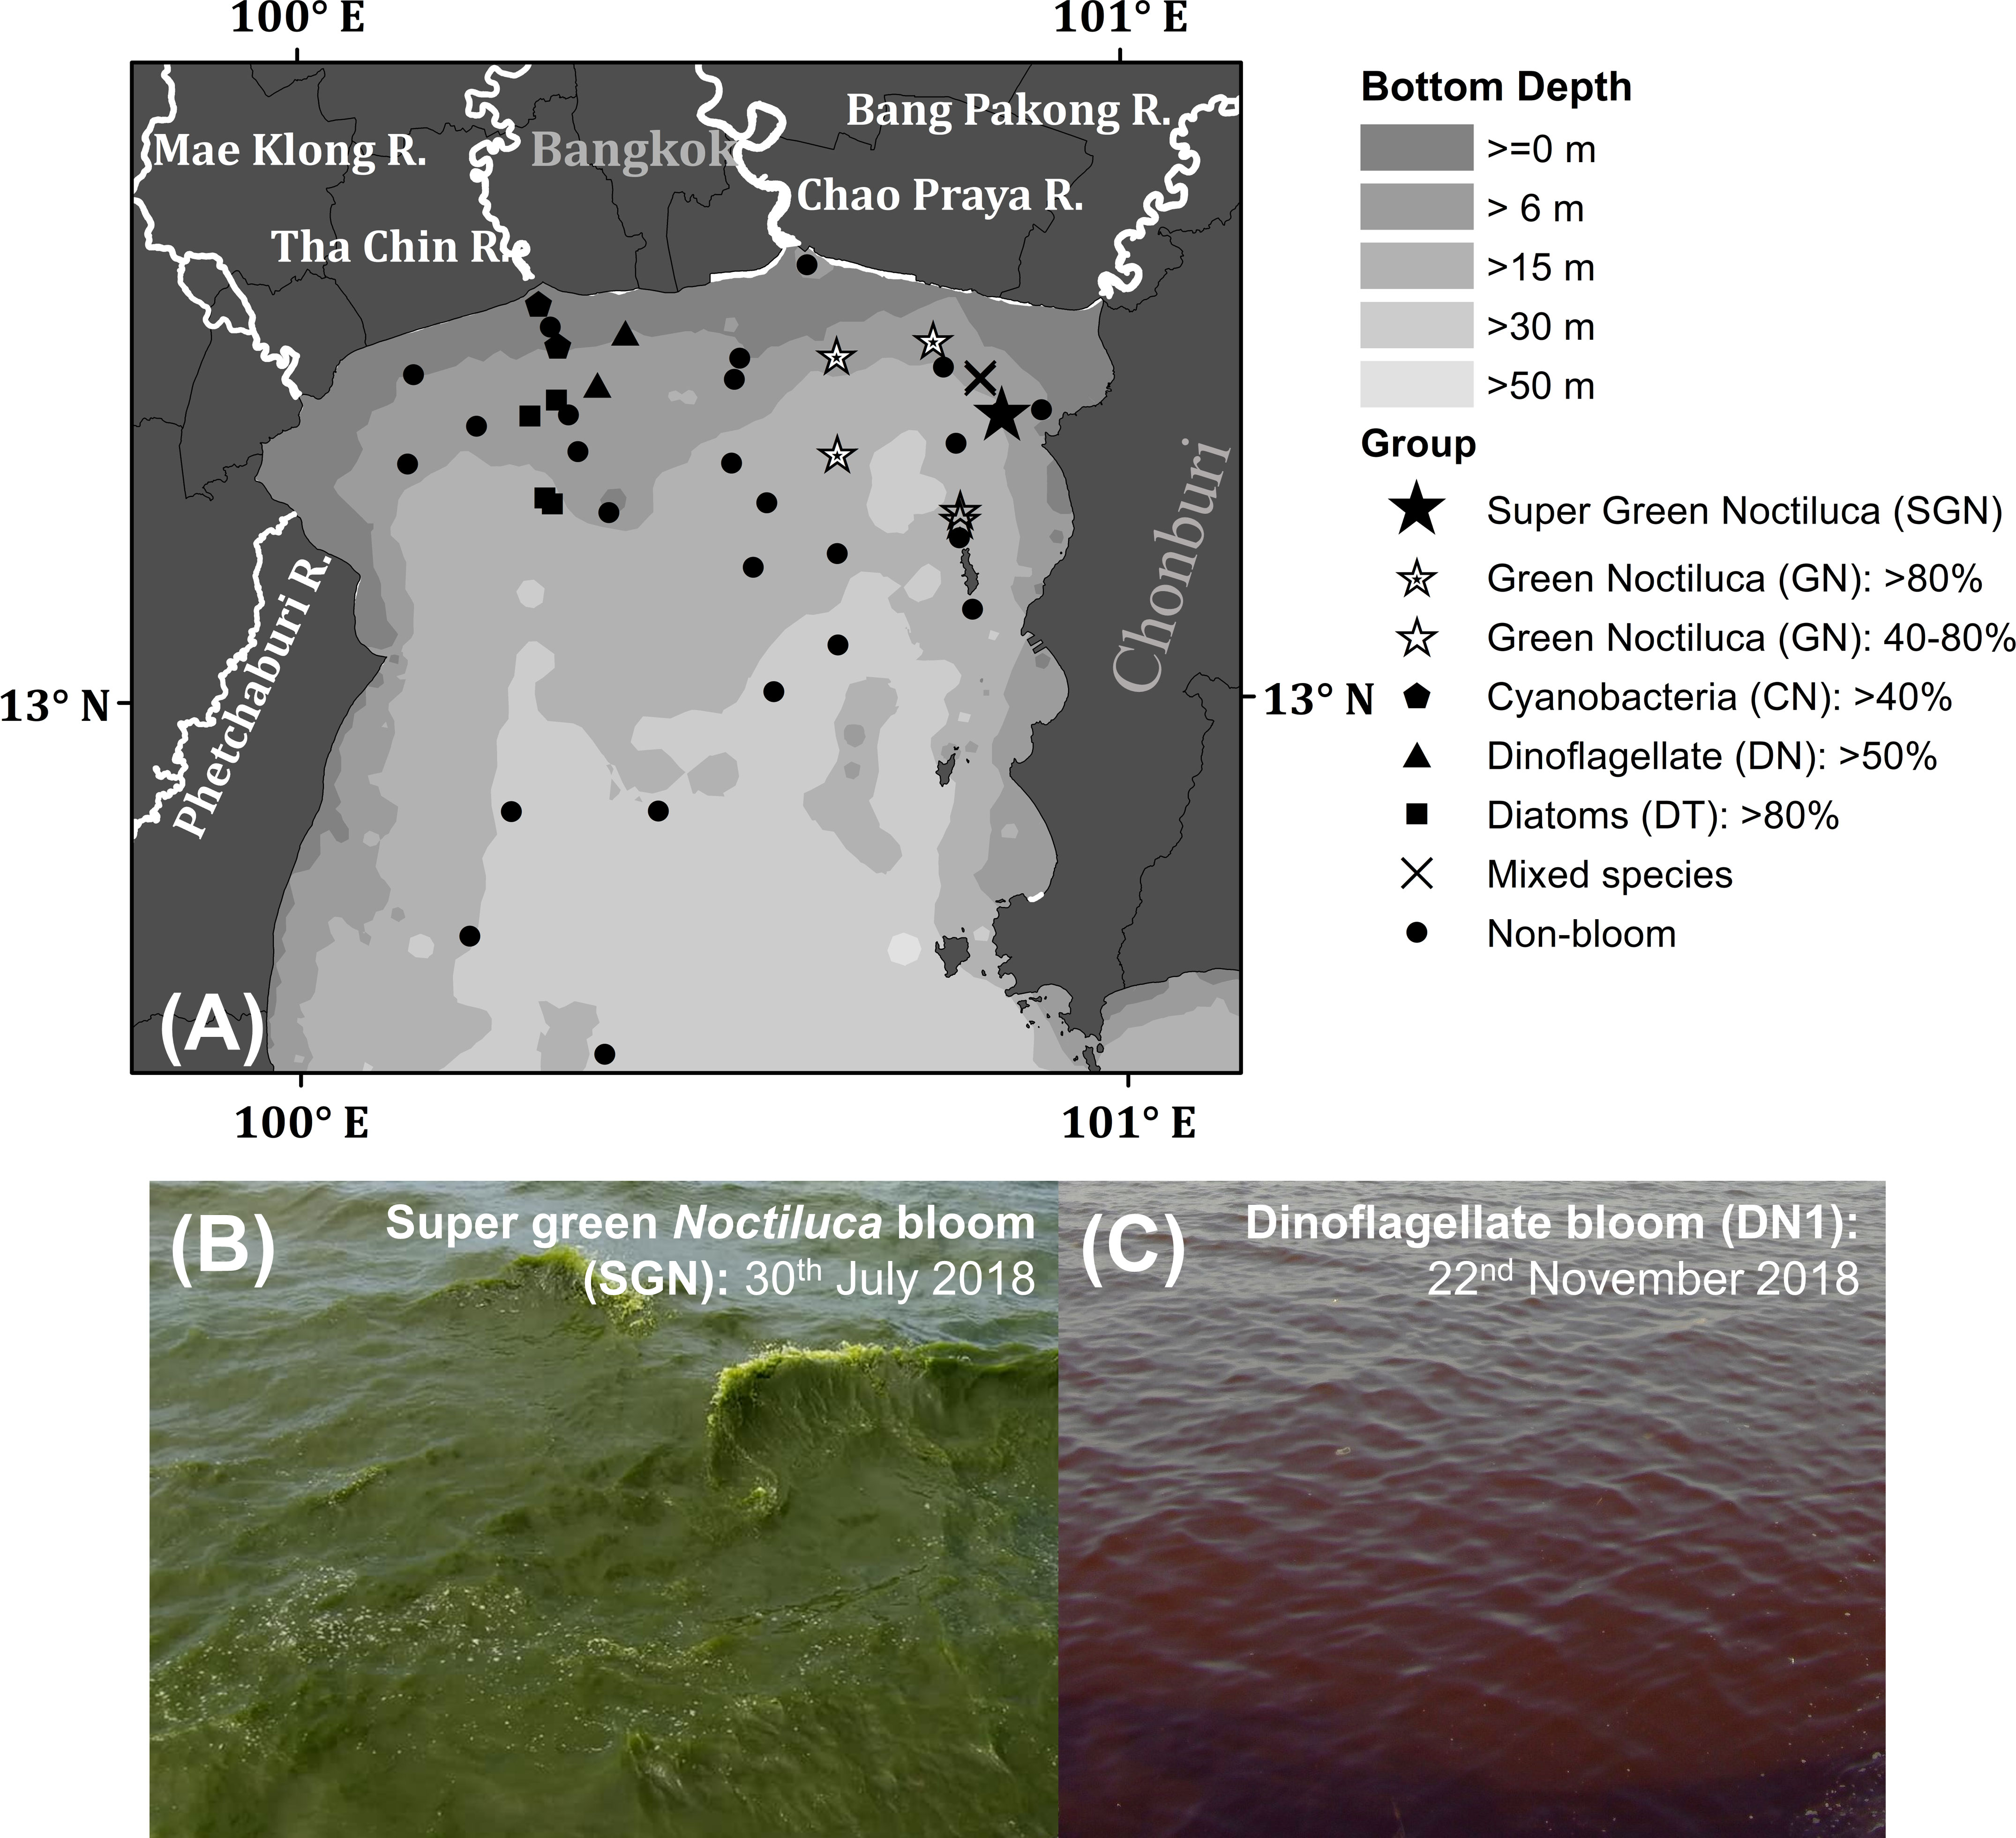
Figure 2 Map of sampling stations in the uGoT (A) and photos of the sea surface during super green Noctiluca (B) and dinoflagellate Ceratium furca (C) blooms. The symbols in (A) indicate water types during ship observations.
In previous research, satellite ocean color radiometry in the blue and green wavelength ranges has been applied to determine chlorophyll a (chl-a) concentrations, a key photosynthetic pigment prevalent in all phytoplankton groups, and clarify how total phytoplankton biomass varies under the influence of Asian monsoons in the uGoT (Buranapratheprat et al., 2009; Intacharoen et al., 2018; Luang-on et al., 2021). Furthermore, Suwanlertcharoen and Prukpitikul (2018) employed a satellite remote sensing technique to detect algal blooms in the uGoT using the maximum chlorophyll index, which is based on the red to near-infrared bands of Sentinel-3A, in conjunction with RGB false-color composite images. Although this method was successful at detecting intense green Noctiluca blooms in offshore regions with high maximum chlorophyll index values, it was unable to distinguish between specific groups of red tides. Therefore, better approaches for discriminating algal blooms with satellite ocean color data should be developed to improve our understanding of red tide dynamics in the uGoT.
Unlike the green color of Noctiluca caused by photosynthetic pigments of the endosymbiont, red tides of other phytoplankton species typically turn the seawater into red, brown, or reddish-brown colors (Chumnantana et al., 2006) depending on the major pigments of the phytoplankton. Using a reverse-phase high-performance liquid chromatography (HPLC) method, Furuya and Lirdwitayaprasit (2000) identified pigment markers of the green Noctiluca endosymbiont, including neoxanthin, violaxanthin, zeaxanthin, lutein, and chl-b in relation to chl-a. For other uGoT red tides, pigment markers include peridinin for dinoflagellates, fucoxanthin for diatoms, and zeaxanthin for cyanobacteria (Higgins et al., 2011), which can be used to quantify phytoplankton communities using CHEMical TAXonomy software (CHEMTAX), a program that estimates phytoplankton class abundance based on pigment marker concentrations (Mackey et al., 1996). Because the major light absorption peaks differ among the red tide marker pigments (Clementson and Wojtasiewicz, 2019), the different water colors during red tides are expected to have distinct spectral reflectance characteristics that can be measured and discriminated by satellite ocean color observations.
Recently, a unique reflectance signature of green Noctiluca was detected using a hyperspectral optical instrument with a fine spectral resolution employed in the oceanic waters of the northern Arabian seas (Dwivedi et al., 2015). The reflectance of green Noctiluca increases at wavelengths of 440–550 nm when compared with the spectra of diatom blooms and non-bloom waters. Dwivedi et al. (2015) and Baliarsingh et al. (2017) employed this unique feature to discriminate green Noctiluca (and red Noctiluca) from diatoms in moderate resolution imaging spectroradiometer (MODIS) data. Furthermore, Shang et al. (2014) reported that dinoflagellates exhibit lower reflectance values than diatoms and a less pronounced reflectance slope in the blue wavelengths (443–488 nm) in East China Sea coastal waters. This difference in spectral characteristics was utilized to create a bloom index, which was used to differentiate blooms from MODIS data by considering the fluorescence line height and total absorption coefficient. Tao et al. (2015) subsequently observed spectral absorption and reflectance characteristics of the two algal groups in the East China Sea. Distinct spectral differences were discovered in the green and red wavelengths and were applied to develop two indices for discriminating dinoflagellate Prorocentrum donghaiense from diatoms based on MODIS reflectance wavelengths. Shen et al. (2019) also proposed a method for distinguishing between dinoflagellates and diatoms based on a green-red spectral slope for medium resolution imaging spectrometer data. However, although the reflectance spectral characteristics of phytoplankton blooms can be used to classify red tides using satellite data, such an approach has never been attempted in turbid coastal waters containing more than two bloom groups, such as the uGoT.
Therefore, to improve our understanding of seasonal red tide dynamics, we employ ship observation data to develop a technique for remotely detecting and classifying green Noctiluca spp. and other phytoplankton blooms in the uGoT using MODIS data. First, we clarify the in situ spectral reflectance characteristics of green Noctiluca and other algal bloom waters using HPLC-CHEMTAX-derived phytoplankton compositions and chl-a concentrations. Second, we develop an algorithm for discriminating green Noctiluca blooms from other phytoplankton blooms according to the specific spectral features of each phytoplankton group. Then, we apply the algorithm to MODIS data and validate its performance with field reports of uGoT algal blooms. Seasonal variations in the surface distribution and frequency of green Noctiluca blooms and associated red tides are also investigated and discussed in relation to several environmental variables linked to Asian monsoons.
2 Data and methods
2.1 In situ data
Field observations were undertaken in the uGoT between 2017 and 2019 during favorable conditions for frequent red tides. We collected bio-optical data of phytoplankton bloom and non-bloom waters during wet (July to August) and dry (November to January) seasons characterized by the southwest and northeast monsoons, respectively. These observations resulted in 45 co-located measurements of chl-a concentration, phytoplankton pigments, and remote sensing reflectance collected around the uGoT (Figure 2A).
Chl-a and phytoplankton pigments in sea surface water samples were filtered through 25-mm Whatman GF/F glass-fiber filters under vacuum pressure of <0.01 MPa and immediately preserved prior to analysis in the laboratory. Chl-a was extracted in N, N-dimethyl formamide (Suzuki and Ishimaru, 1990) at ~4°C and measured using a pre-calibrated Turner Designs 10-AU Fluorometer (Welschmeyer, 1994). Phytoplankton pigment samples were immediately frozen and kept at approximately −80°C then measured in methanol extracts using the reverse-phase HPLC method (Van Heukelem and Thomas, 2001) and a Zorbax Eclipse XDB-C8 column (150 mm × 4.6 mm, 3.5 μm; Agilent Technologies).
The HPLC-measured pigment compositions were then inputted into CHEMTAX software to estimate the major phytoplankton groups within each sample. Eleven marker pigments that were dominant in the HPLC data (peridinin, 19’-butanoyloxyfucoxanthin, fucoxanthin, 19’-hexoyloxyfucoxanthin, alloxanthin, neoxanthin, violaxanthin, zeaxanthin, lutein, chl-b, and chl-a) were selected to classify eight different phytoplankton groups (dinoflagellates, cryptophytes, prymnesiophytes, haptophytes, cyanobacteria, diatoms, and chlorophytes in exponential and stationary phases). In this study, green Noctiluca was referred to as a chlorophyte because of the pigment composition of its endosymbiont (Furuya and Lirdwitayaprasit, 2000). The pigment-to-chl-a ratios used in the initial run in the CHEMTAX analysis were derived from previous studies in the East China Sea (Xu et al., 2019) and central Bohai Sea (Lu et al., 2018), as well as an experimental study on pigment changes during the evolution of green Noctiluca in the Gulf of Thailand (Furuya and Lirdwitayaprasit, 2000). The output ratio matrix from the previous run was used as the input for the next ratio matrix for fifteen runs of CHEMTAX, and the final ratio selected from the most stable ratio among the fifteen outputs were used to determine phytoplankton group compositions (Latasa, 2007). The initial and final pigment-to-chl-a ratios are presented in the Supplementary Appendix 1.
In situ remote sensing reflectance (Rrs ) values between wavelengths of 320 nm and 950 nm were measured from shipboard by RAMSES hyperspectral radiometers (TriOS, Germany): one onboard sky-facing sensor was used to measure the sky irradiance (ACC-VIS) and two radiance sensors (ARC-VIS) with dome coverings were used to measure the water-leaving radiance immediately above the sea surface (see in Supplementary Appendix 2; Yang et al., 2018). The measured water-leaving radiance (Lw ) and downwelling irradiance (Ed ) were then calculated using the in situ Rrs as follows: Rrs(λ)=Lw(λ)/Ed(λ), where λ is the wavelength. The Rrs values at all wavelengths were further normalized using Rrs at 547 nm to reveal the distinctive spectral characteristics of each dominant phytoplankton group.
2.2 Development of the algal-bloom classification algorithm
An algal-bloom classification algorithm was developed to discriminate water containing green Noctiluca blooms from that containing other algal blooms and non-bloom waters. The algorithm was based on 45 corresponding datasets of in situ and normalized Rrs spectra, CHEMTAX-derived phytoplankton composition, and chl-a (Figure 2A). In situ chl-a was initially considered to distinguish between algal blooms (≥10 mg m-3) and non-blooms in coastal and oceanic waters (<10 and ≤1.5 g m-3, respectively). Then, we investigated the distinctive Rrs spectral characteristics of algal bloom waters by comparing them with in situ chl-a and percentages of the CHEMTAX-derived phytoplankton group composition. To clarify the spectral characteristics of each algal bloom water sample, the Rrs spectra of each group were normalized. Owing to the distinct spectral characteristics of algal bloom waters and their high compatibility with MODIS data (see Supplementary Appendix 3), the normalized Rrs values in MODIS band-compliant wavelengths of 488, 531, and 667 nm were chosen to discriminate among water types for MODIS data. A simple grouping method was then performed using normalized Rrs values to develop the algal-bloom classification algorithm.
2.3 Satellite data processing
Level-2 (L2) MODIS ocean color products (1-km spatial resolution) from the Aqua satellite on cloudless days that coincided with reports of algal blooms (Table 2) during 2003–2021 were retrieved from the NASA Ocean Color website (https://oceancolor.gsfc.nasa.gov/). Data quality was controlled using the masks of LAND, HIGLINT, HILT, CLDICE, HISOLZEN, LOWLW, and NAVFAIL (https://www.oceancolor.gsfc.nasa.gov/atbd/ocl2flags/) after being reprojected to the geographical WGS84 coordinate system. Before applying the algal-bloom classification algorithm, the single MODIS Rrs values at 488 nm (Rrs 488), 531 nm (Rrs 531), 547 nm (Rrs 547), and 667 nm ( 667), as well as the normalized values at 488 nm (Rrs 488/Rrs 547), 531 nm (Rrs 531/Rrs 547), and 667 nm (Rrs 667/Rrs 547), were verified and improved based on in situ data (see Supplementary Appendix 3). The corrected MODIS data were then processed using the algal-bloom classification algorithm to classify seven groups of bloom waters and non-bloom oceanic and coastal waters, as shown in Figure 5. For algorithm validation, MODIS-derived algal-bloom classified images on cloudless days were compared with uGoT red tide reports (Table 2), and MODIS chl-a images were estimated using a local chl-a algorithm (Luang-on et al., 2021).
The percentage of the relative bloom frequency was calculated to investigate the seasonal dynamics of individual red tides. Monthly composite data for each water type were obtained by dividing the pixel number of each water type during 2003–2021 by the total number of monthly satellite images then multiplying by 100 at each location. It should be noted that, on the percentage frequency images, the green Noctiluca bloom is a composite of three bloom levels (>50%, >80%, and 100%). The results were then compared to monthly climatological data on river discharge, precipitation rate, and sea surface winds (Luang-on et al., 2021).
3 Results
3.1 In situ hyperspectral reflectance characteristics of algal blooms
During our observations in July and August 2018 and 2019, green Noctiluca blooms occurred in the northeastern uGoT. When incorporating November and December 2017 and 2018, other blooms of dinoflagellates, diatoms, and cyanobacteria occurred in the west of the uGoT near the Tha Chin River (Figure 2A). In situ chl-a, HPLC-CHEMTAX-derived phytoplankton group composition, and Rrs data indicate 16 stations of algal blooms, as shown in Figure 3. According to the chl-a concentration and phytoplankton composition, seven groups of algal bloom waters (Table 1) were classified according to the distinct Rrs characteristics in blue, green, and red wavelengths of green Noctiluca and other algal bloom waters. These groups are described below.
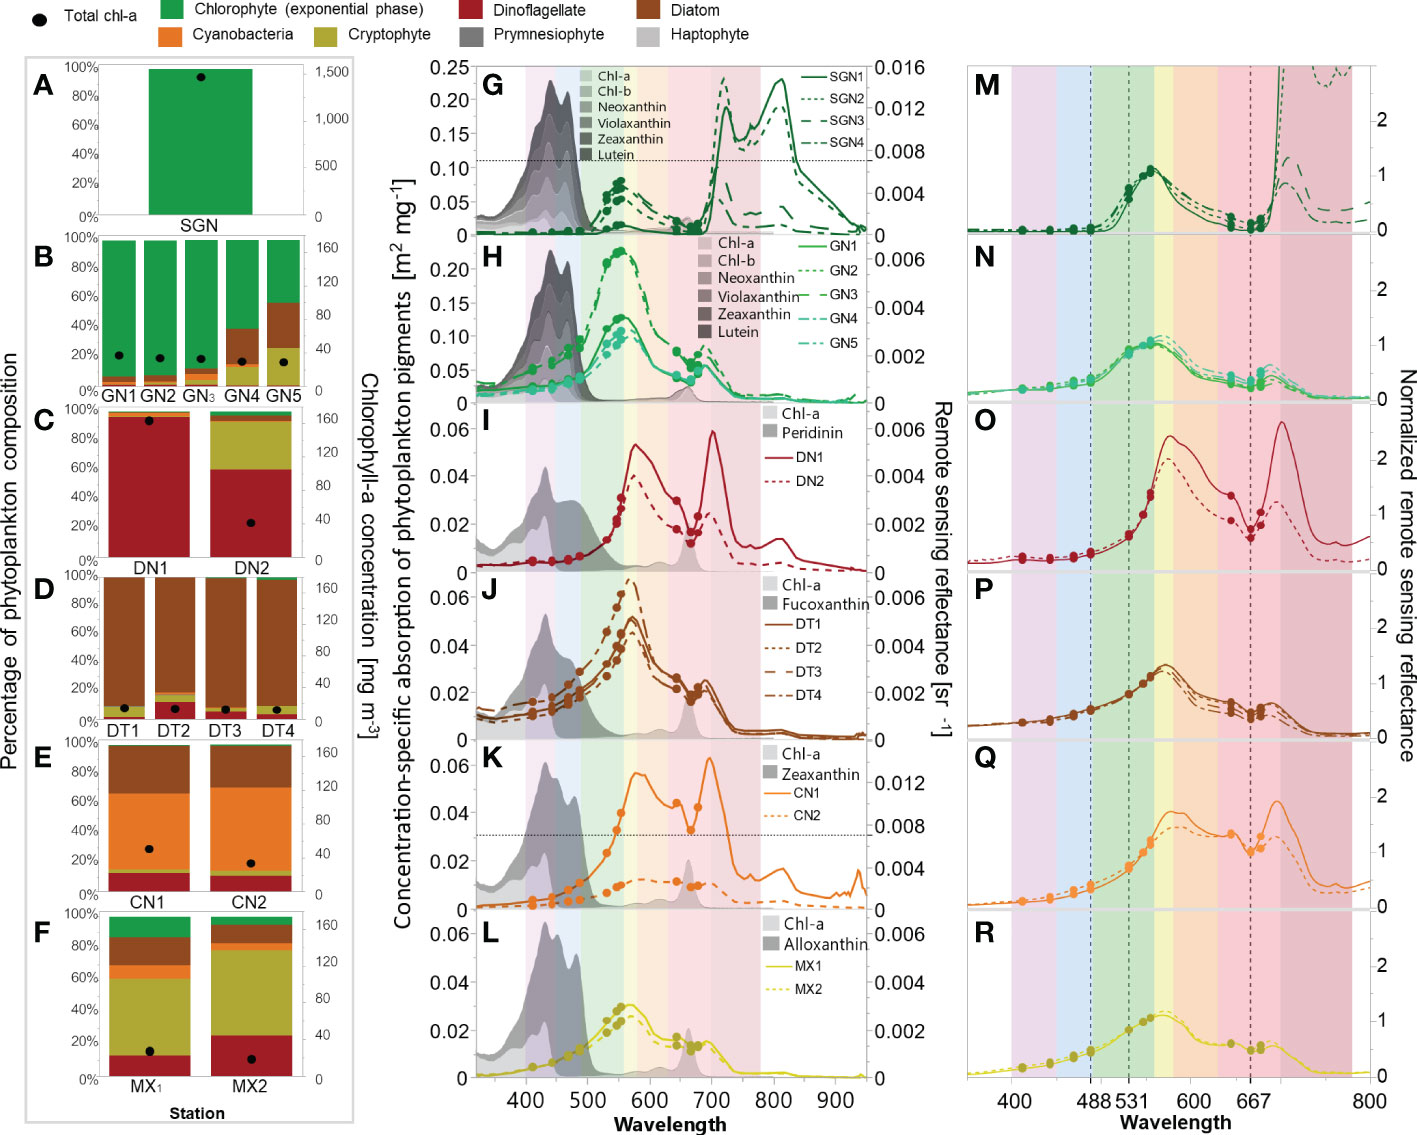
Figure 3 In situ chl-a and CHEMTAX-derived phytoplankton group composition (left), Rrs spectra and concentration-specific absorption of pigment markers of the dominant phytoplankton groups retrieved from Clementson and Wojtasiewicz (2019) employed in the CHEMTAX analysis (middle), and Rrs spectra normalized to Rrs 547 (right) of super green Noctiluca (A, G, M), strong-to-weak green Noctiluca (B, H, N), dinoflagellate (C, I, O), diatom (D, J, P), cyanobacteria (E, K, Q), and mixed species (F, L, R) blooms. Dots (G–R) indicate in situ Rrs at MODIS wavelengths. Black dotted lines (M–R) indicate the normalized Rrs wavelengths used to discriminate among algal blooms. Color stripes (G–R) indicate purple (400–450), blue (451–490), green (491–560), yellow (561–580), orange (581–630), red (631–700), and near-infrared (701–780) wavelengths.
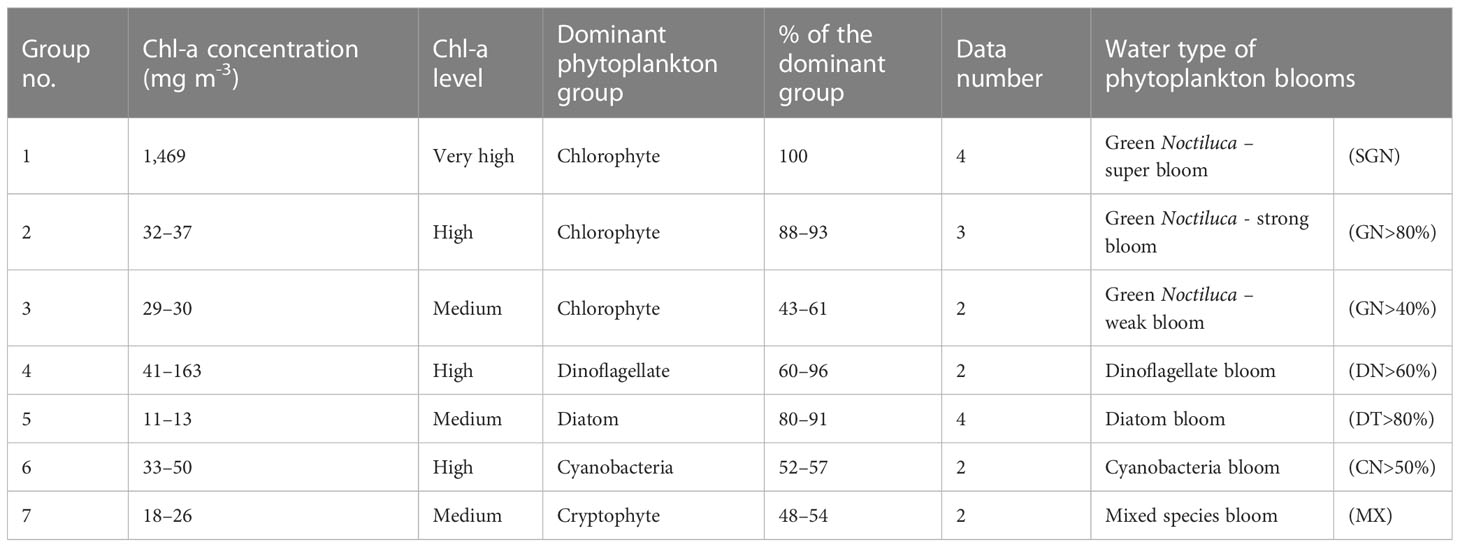
Table 1 A summary of the. Rrs categorization criteria for algal bloom waters based on in situ data obtained during 2017–2019.
Group 1. On July 30, 2018, we encountered a super bloom of green Noctiluca (SGN) with recorded cell densities greater than 1,500,000 cells L-1 at the sea surface, which turned the seawater dark green (Figure 2B). The recorded chl-a concentration was extremely high (>1,469 mg m-3). The pigment composition measured by HPLC during the super bloom was similar to the findings of Furuya and Lirdwitayaprasit (2000). Neoxanthin, violaxanthin, lutein, and chl-b were detected in this study, but not zeaxanthin. Nonetheless, HPLC-CHEMTAX analysis revealed that the bloom was entirely green Noctiluca (100%) (Figure 3A). Owing to the instability of the surface water mass and bloom patch, four Rrs spectra were measured during the bloom (Figure 3G). The in situ Rrs spectra were relatively low in the violet to blue (400–490 nm;<0.00034 sr-1) and red (min. between 664 and 668 nm;<0.00064 sr-1) wavelengths. These relatively low Rrs characteristics have never been documented in the measured spectrum of green Noctiluca in the northern Arabian Sea (Dwivedi et al., 2015), although a peak in green (max. between 557 and 558 nm; 0.0008–0.0051 sr-1) wavelengths corresponded to the noticeable green color of the bloom. Furthermore, extraordinarily high Rrs (>0.01 sr-1) was observed in the red to near-infrared (NIR) wavelengths (~706 to ~825 nm), with decreasing Rrs in the visible wavelengths.
Groups 2 and 3. Strong (GN>80%) and weak (GN>40%) green Noctiluca blooms exhibited much lower chl-a concentrations (Figure 3B) than SGN blooms. The high NIR observed in the SGN spectra disappeared in these blooms (Figure 3H) and remained as only a small peak in the red-to-NIR wavelengths associated with the chlorophyll fluorescence peak. The signature of increasing reflectance from blue to green wavelengths for the green Noctiluca bloom spectrum reported in the Arabian Sea (Dwivedi et al., 2015) was also observed in the Rrs spectra of these groups, but was considerably lower in the blue wavelength and higher in the peak of the green wavelength (max. between 554 and 564 nm; 0.0028 to 0.0063 sr-1).
Group 4. Dinoflagellate Ceratium furca blooms (DN>60%) had high chl-a (Figure 3C) and discolored the seawater to red (Figure 2C). Green Rrs values decreased rapidly from long to short wavelengths and were lower than those of the GN>80% and GN>40% blooms. This characteristic may be related to the enhanced absorption of peridinin, a marker pigment of dinoflagellates (Clementson and Wojtasiewicz, 2019). Rrs spectra showed two peaks in yellow (max. between 574 and 577 nm; 0.004 to 0.0053 sr-1) and red-to-NIR (max. between 696 and 701 nm; 0.0025 to 0.0058 sr-1) wavelengths. These two peaks arose during intense blooms, particularly the red-to-NIR peak.
Group 5. Diatom blooms (DT>80%) were observed in medium chl-a (Figure 3D), which had the lowest chl-a among all blooms. The Rrs spectra peaked in the yellow band (max. between 568 and 572 nm; 0.0045–0.0068 sr-1), similar to dinoflagellate blooms; however, violet to green values were higher in diatom blooms. The higher reflectance in green wavelengths compared to dinoflagellate blooms was also observed in the bloom spectra in the East China Sea (Shang et al., 2014; Tao et al., 2015).
Group 6. Cyanobacteria blooms (CN>50%) were found in high chl-a waters with lower abundances of diatoms and dinoflagellates (Figure 3E). Rrs spectra with values gradually increasing from blue to green wavelengths were generally similar to those of DN>60% and DT>80% (Figure 3K). Otherwise, the increase in Rrs of cyanobacteria in the orange to red range was greater than that for dinoflagellates, particularly from 645 to 678 nm.
Group 7. Cryptophytes dominated a mixed red tide population observed in samples with medium chl-a concentration (Figure 3F). Because cryptophytes have never been proven to cause red tides in the uGoT, we refer to this group as mixed (MX) bloom water. The Rrs spectra gradually increased from blue to green, peaking in the yellow band (max. between 568 and 571 nm; 0.0026 to 0.0031 sr-1, Figure 3L). This characteristic was similar to that of DT>80% blooms, but the Rrs values were much lower.
Normalizing the Rrs spectra by Rrs 547 (Figure 3M–R) helped highlight the differences in spectral characteristics for each algal bloom type. Normalized Rrs spectra, particularly in the blue (451–490 nm), green (491–560 nm), and red (581–700 nm) bands, showed the unique spectral characteristics of green Noctiluca in comparison to the other groups. Green Noctiluca had low normalized Rrs values in the blue and red wavelengths and a peak in the green band. These characteristics became clearer as the bloom intensity increased. Normalized Rrs spectra of DN>60% and CN>50% blooms, as well as DT>80% and MX blooms, were higher in red and blue-to-green wavelengths than those recorded for strong and weak GN blooms. These distinct spectral characteristics in the blue, green, and red wavelengths, which are expressed by the water color, provide an opportunity to distinguish green Noctiluca blooms from other blooms using satellite ocean color data.
3.2 Algal-bloom classification algorithm
Differences in the spectral signatures of in situ normalized Rrs values in blue, green, and red bands (Figure 3M–R) were utilized to discriminate green Noctiluca blooms and classify water types based on MODIS wavelengths. Unlike former green Noctiluca discriminating approaches that used a cluster of differences in MODIS-retrieved Rrs 488 to Rrs 443 and Rrs 531 (Dwivedi et al., 2015; Baliarsingh et al., 2017), we used observed normalized Rrs values at 488, 531, and 667 nm for a straightforward approach to grouping water types based on chl-a levels and dominant phytoplankton composition in waters with more diverse algal bloom species. The seven types of bloom waters (i.e., SGN, GN>80%, GN>40%, DN>60%, DT>80%, CN>50%, and MX) and two types of non-bloom waters (i.e., coastal and oceanic waters) were thus classified as shown in Figure 4.
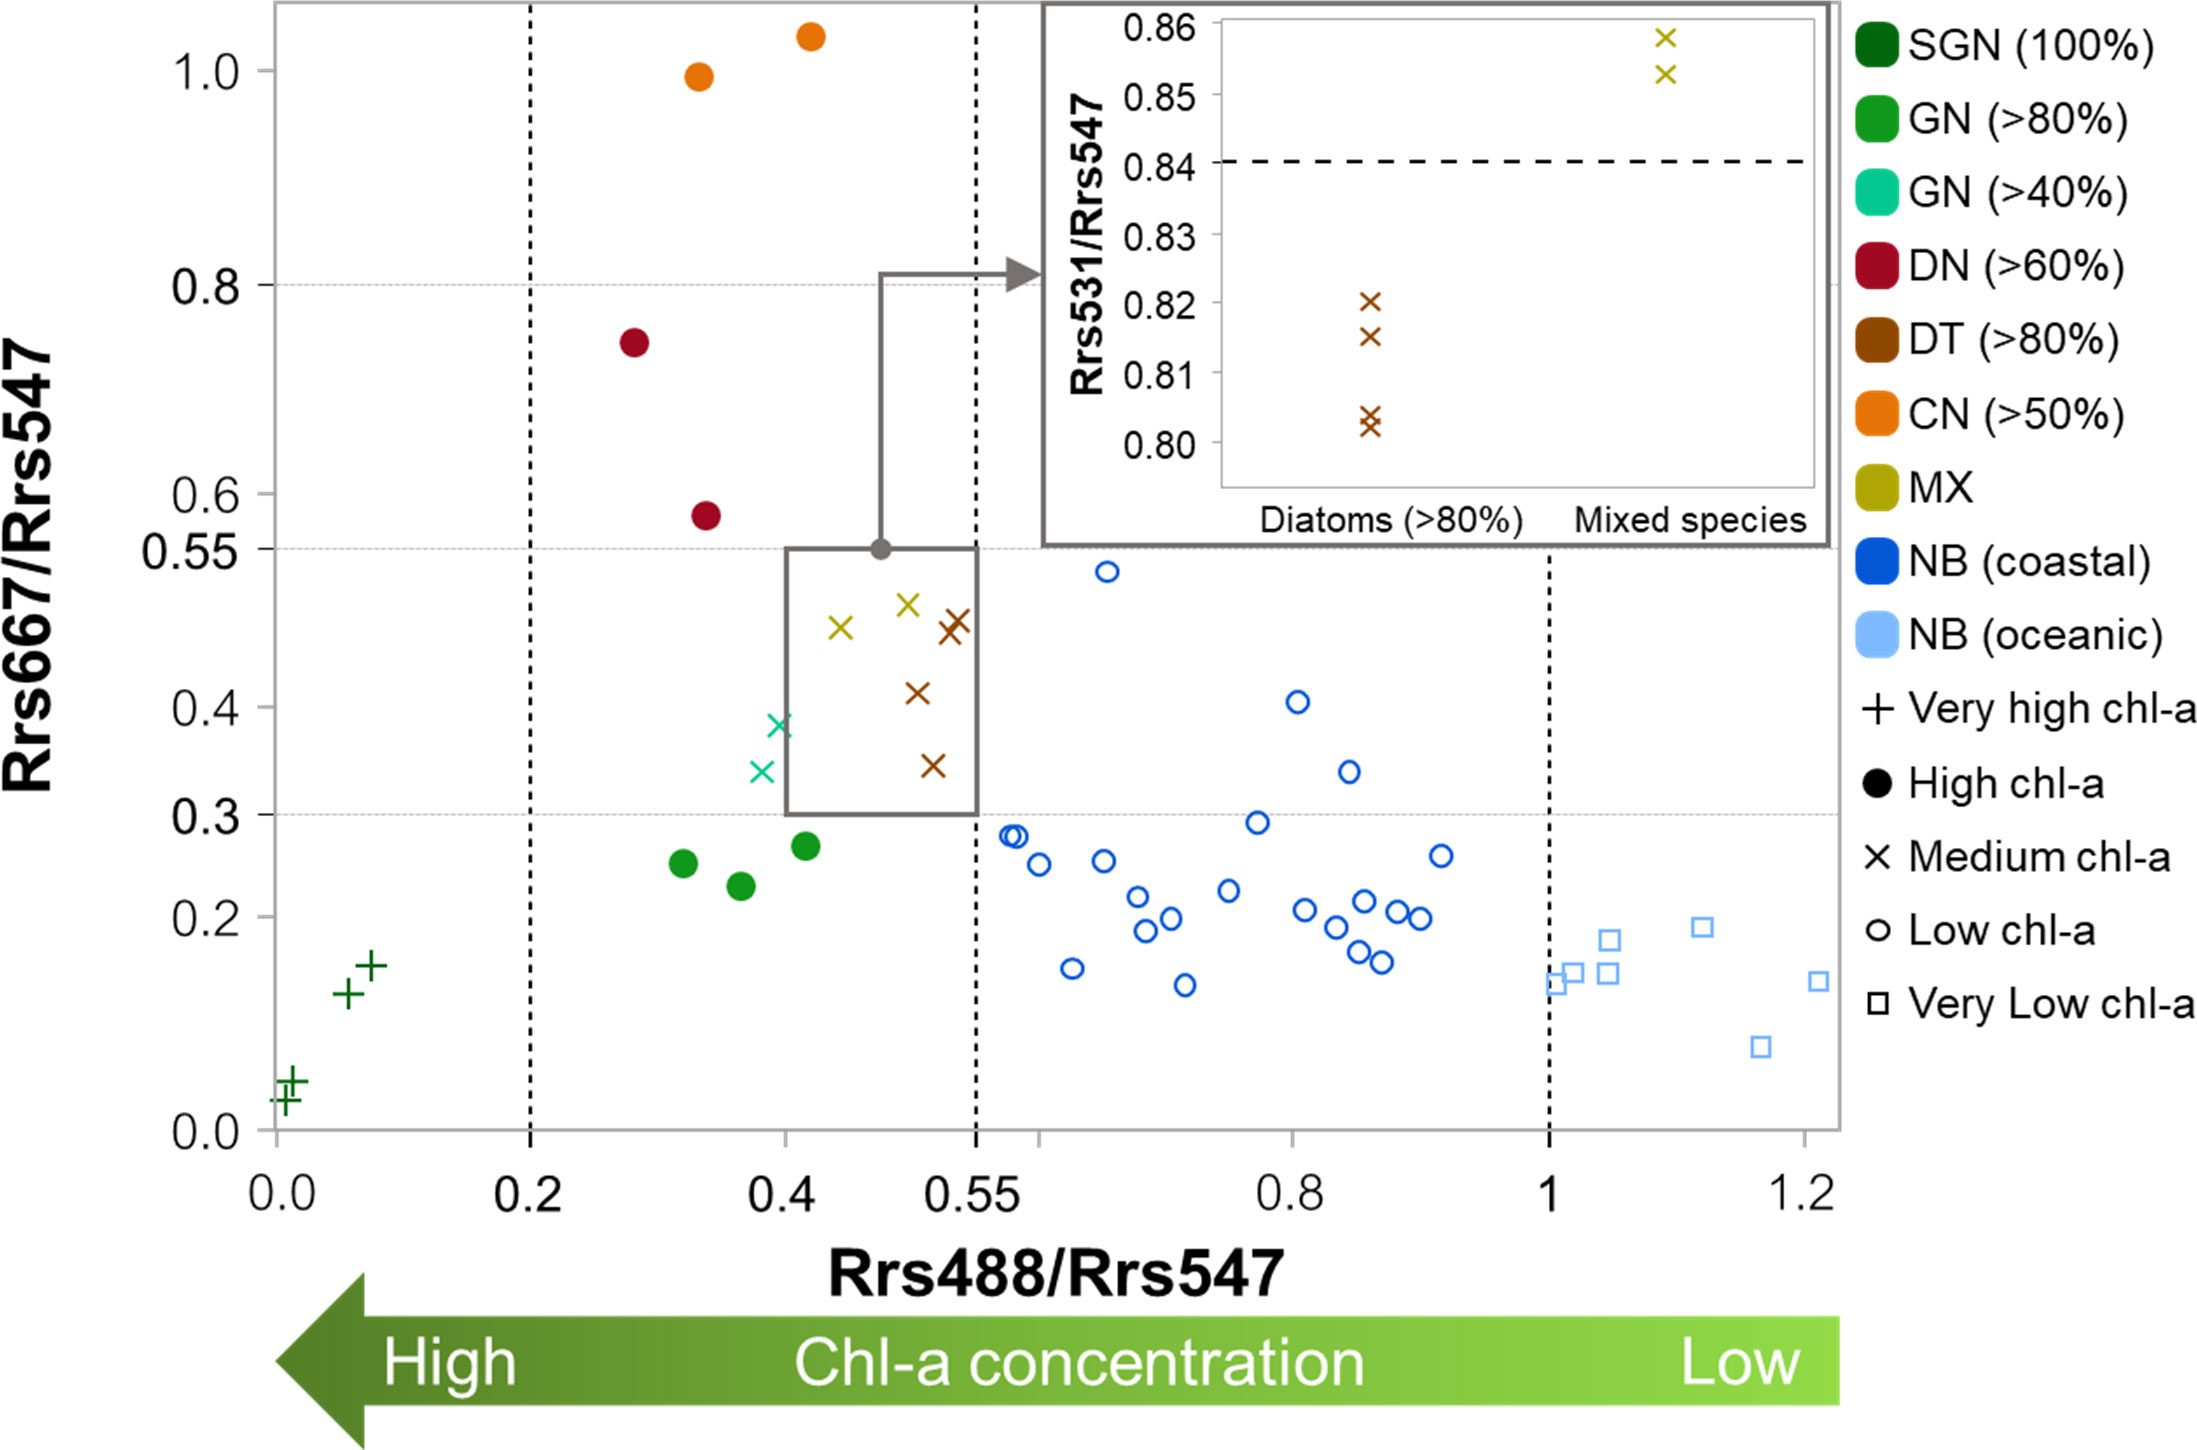
Figure 4 Discrimination of super green Noctiluca (SGB), green Noctiluca (GN), dinoflagellate (DN), diatom (DT), cyanobacteria (CN), and mixed species (MX) blooms, as well as non-bloom (NB) coastal and oceanic waters according to chl-a level and dominant phytoplankton composition using the normalized Rrs at 488, 531, and 667 nm in the uGoT.
The normalized Rrs 488 results demonstrated an inverse relationship with chl-a levels, which were used to differentiate blooms from non-bloom waters. In this step, SGN blooms (very high chl-a), which had very low normalized Rrs 488 values, were independently separated from non-bloom coastal (low chl-a) and non-bloom oceanic (very low chl-a) waters. The low values (≤0.2) of SGN blooms corresponded to low Rrs spectral characteristics at blue wavelengths (Figure 3G, M). Meanwhile, high chl-a bloom waters with normalized Rrs 488 values ranging from 0.2 to 0.55 (i.e., GN>80%, DN>60%, and CN>50%) were distinguished using normalized Rrs 667 values. This cluster criterion was related to a shift in the Rrs values at red wavelengths (Figure 3H, I, K). For blooms with medium chl-a concentration (i.e., GN>40%, DT>80%, and MX), the normalized Rrs values were moderate, at 488 nm (0.2 and 0.55) and 667 nm (0.3 and 0.55). Normalized Rrs 488 values less than 0.4 differentiated GN>40% blooms from the other blooms. Normalized Rrs 531 values lower and higher than 0.84 were used to differentiate DT>80% and MX blooms, respectively.
Algorithm application and validation using MODIS data. The classification algorithm based on normalized Rrs 488, Rrs 531, and Rrs 667 data processed with daily MODIS data is summarized in Figure 5. MODIS Rrs verification showed compatibility between in situ and MODIS normalized Rrs 488 data (see Supplementary Appendix 3), as demonstrated in Luang-on et al. (2021). However, overestimation of the normalized Rrs 531 and underestimation of the normalized Rrs 667 were observed in this study. Therefore, correction of MODIS was conducted before applying the algal-bloom classification algorithm to the satellite data to improve its accuracy (Figures S3–S5).
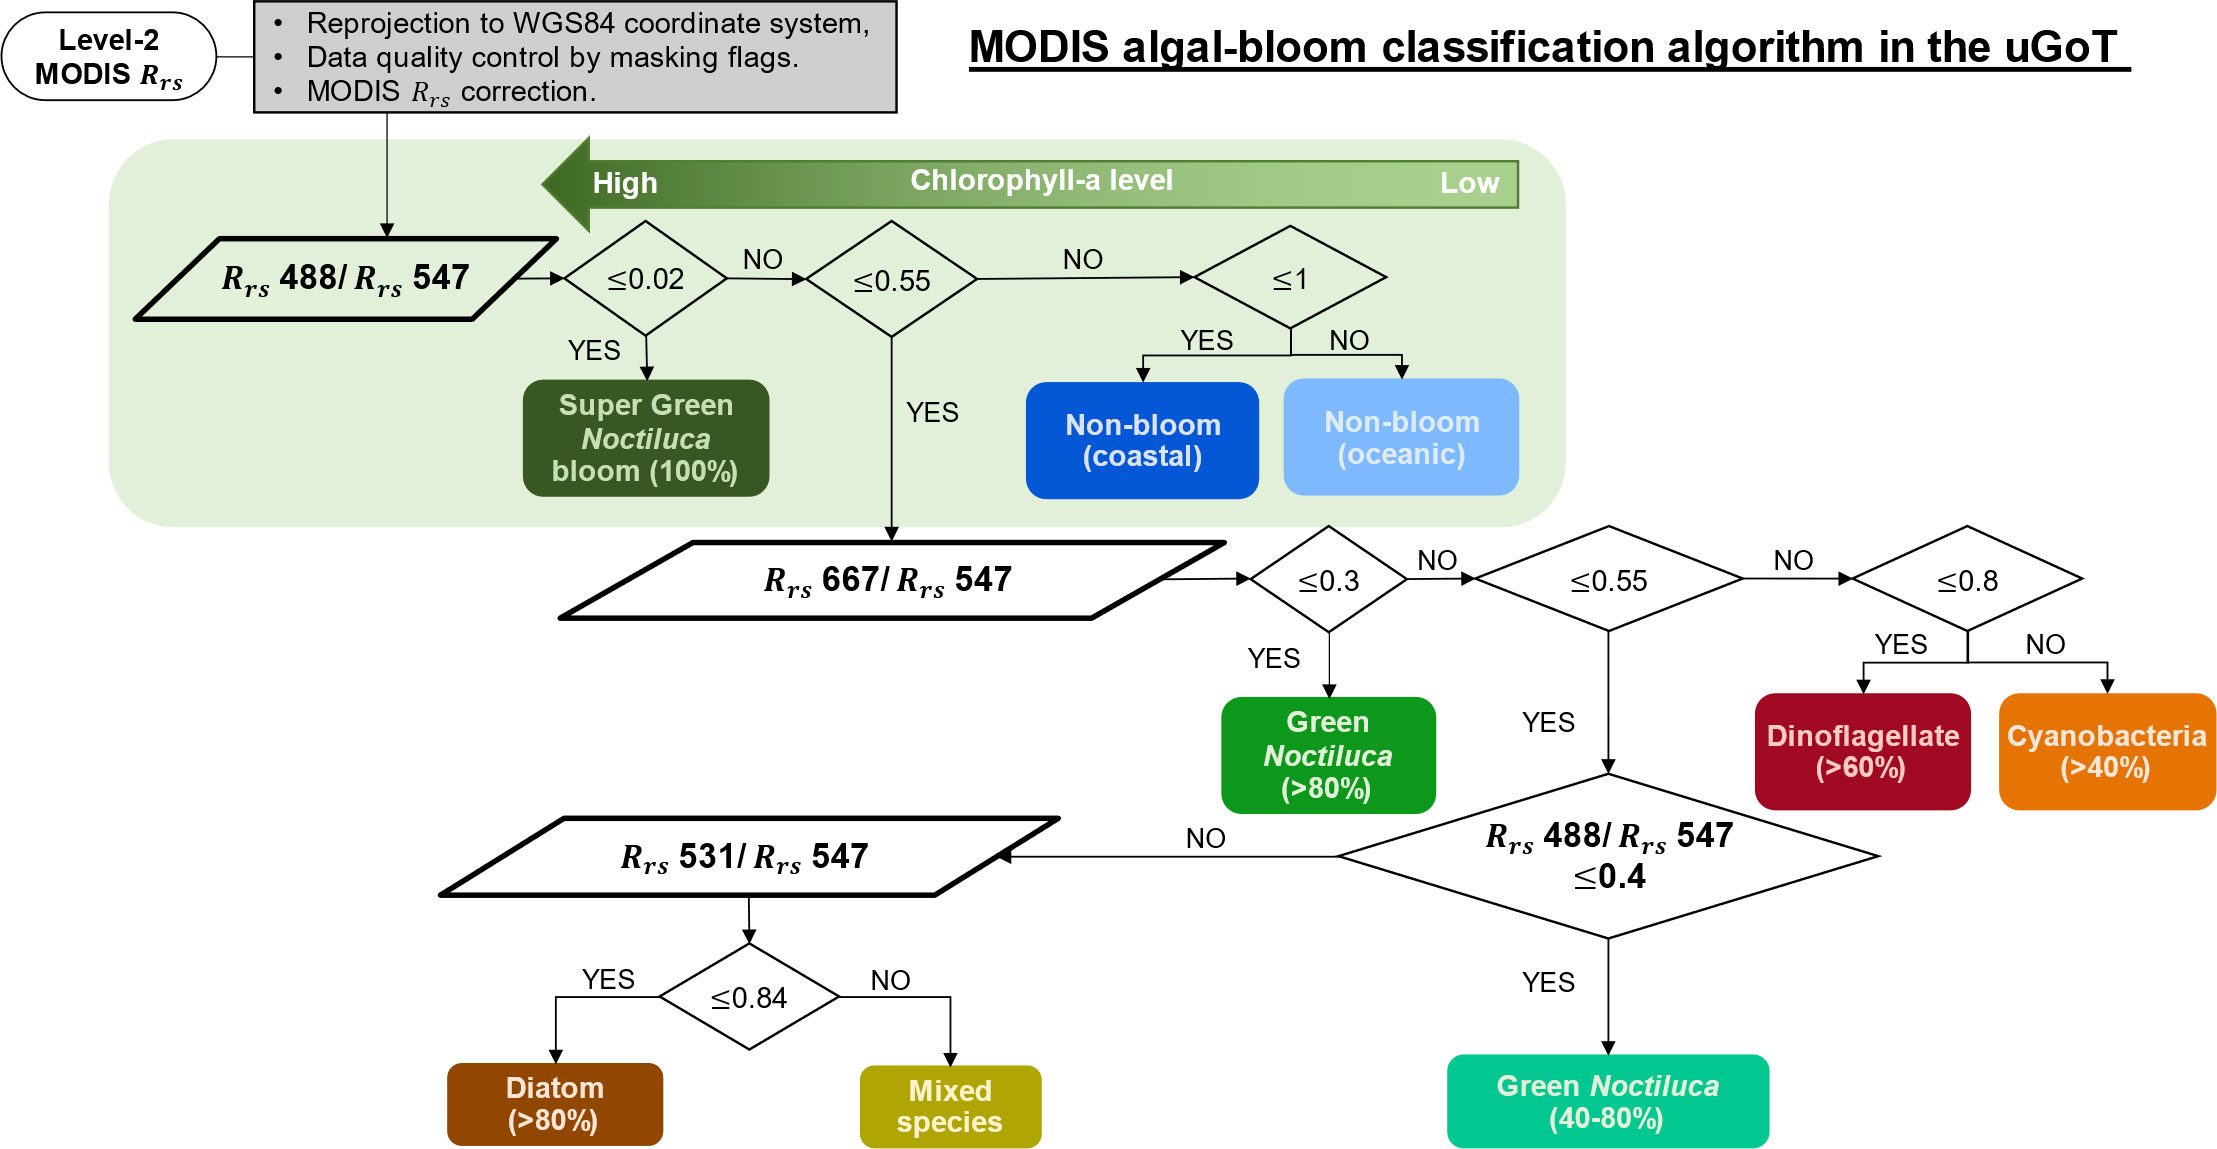
Figure 5 Flow diagram of MODIS data processing for discriminating algal blooms in the uGoT.
MODIS-derived algal bloom images on cloudless days compared well with uGoT red tide reports in Table 2, demonstrating that the classification with MODIS data could detect red tide events (Figure 6), although the red tide reports do not always provide the exact incident date. Satellite images showed a bloom in the same area as recorded in the reports during the periods of GN blooms in March 2009, January 2016, and August 2019 (Figures 6A–1–C–1). The images also matched with the DN>60% blooms of Ceratium furca during July 2010 and Karenia sp. from February 11–20, 2020, as well as the following DT>80% bloom of Leptocylindrus sp. on June 20, 2017 (Figures 6D–1–F–1). These images further support our categorization findings, which fit our concept of an algal bloom in locations with high chl-a concentrations (≥10 mg m-3, Figures 6A–2–F–2). Furthermore, our findings revealed that high chl-a levels around major river mouths may be caused by dinoflagellate and cyanobacterial blooms, as demonstrated by the image of the C. furca bloom (Figure 6D–1), whereas GN blooms were located further from the shore. These findings reveal that our algorithm is capable of detecting red tides and studying their dynamics.
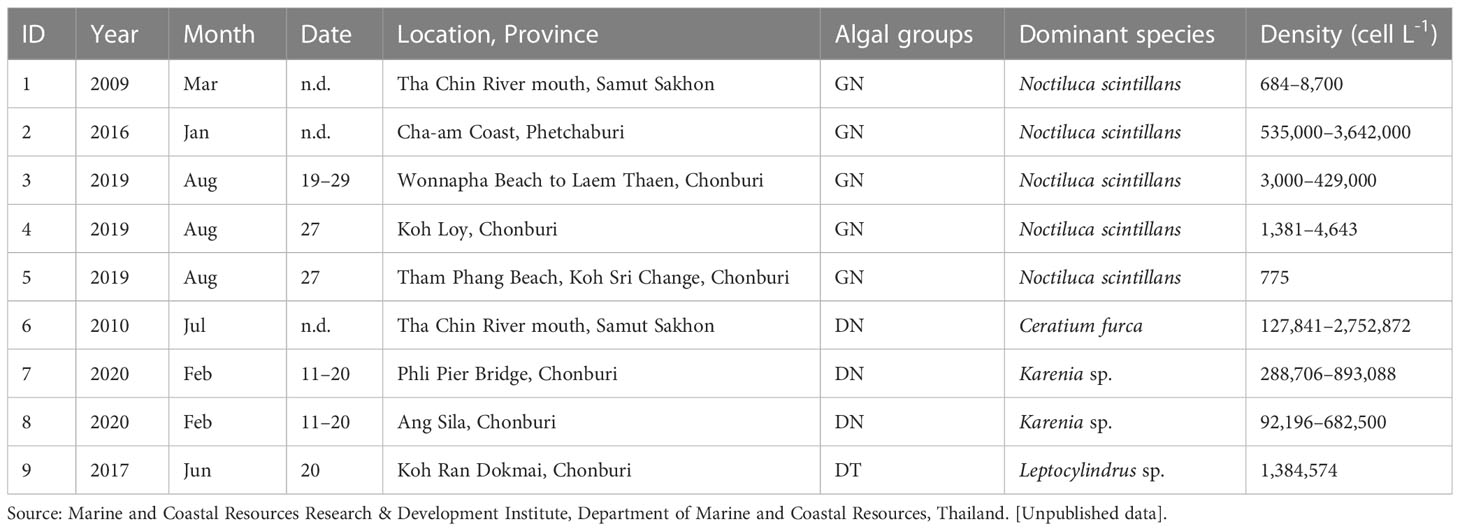
Table 2 Reports of red tides in the uGoT.
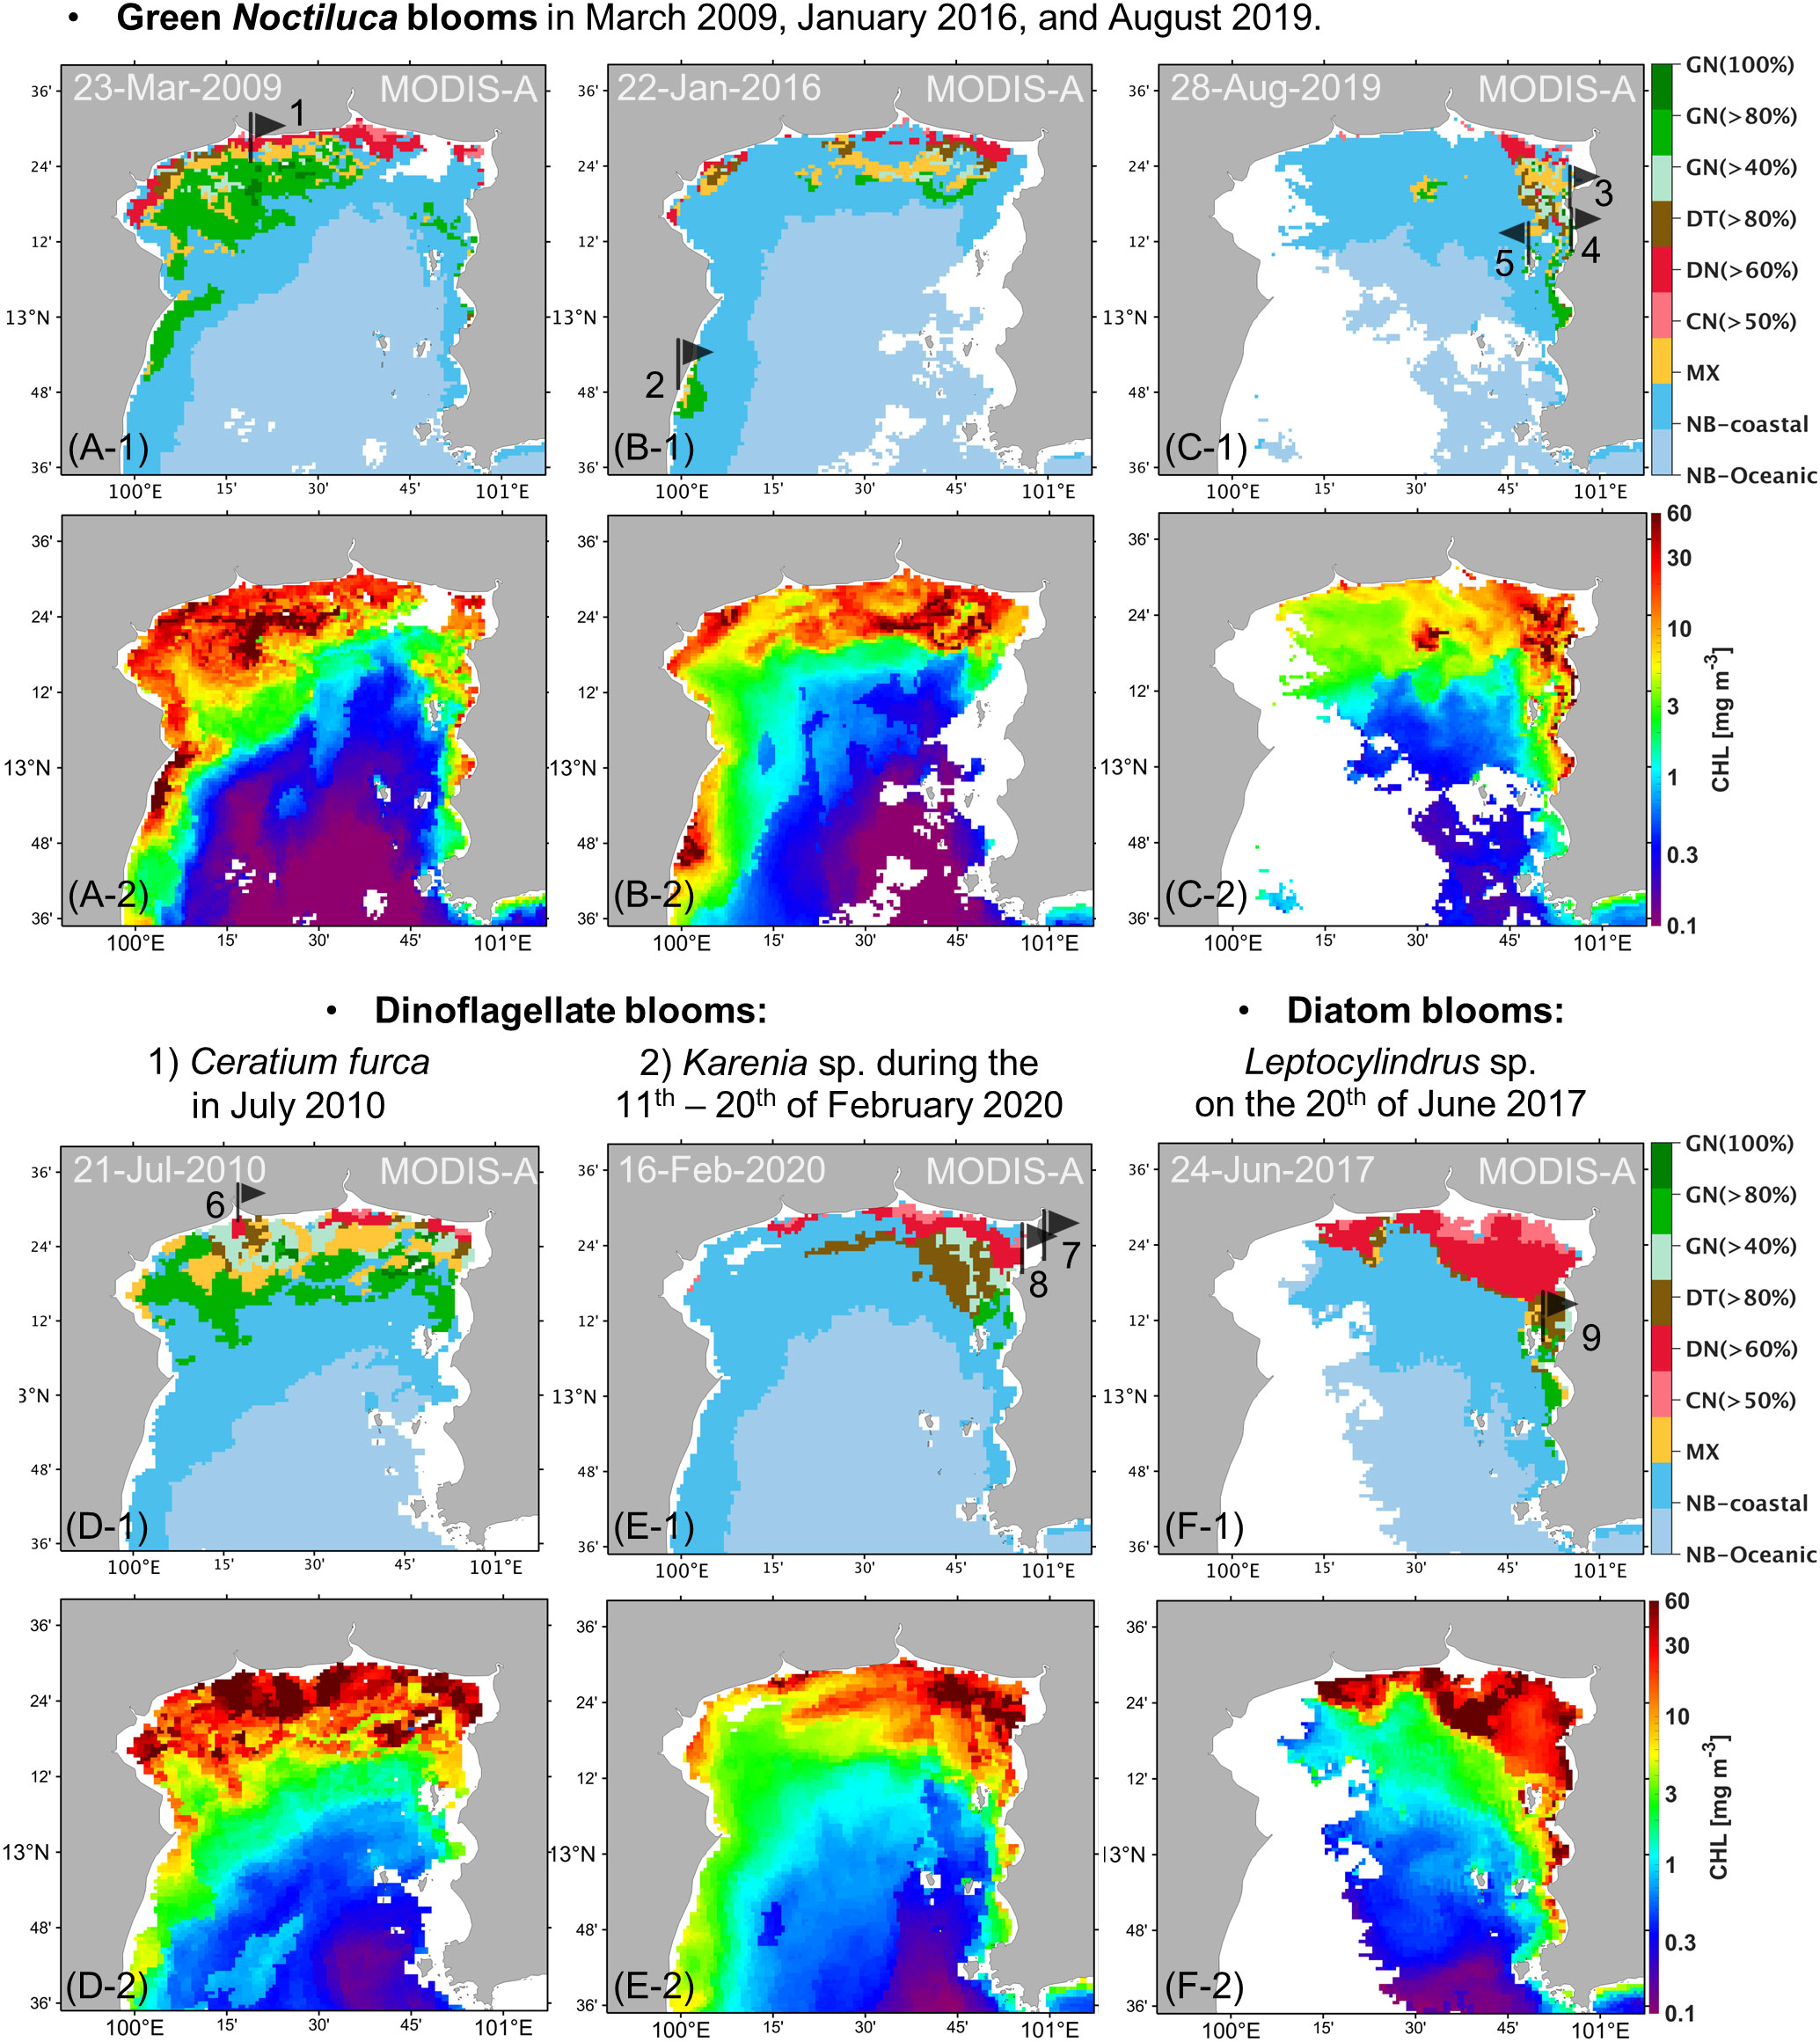
Figure 6 Daily MODIS data processed using the uGoT algal-bloom classification algorithm (A, F-1) and uGoT chl-a algorithm (Luang-on et al., 2021, A, F-2). Red tide reports are indicated by black flags and numbers corresponding to Table 2.
3.3 MODIS-derived seasonal distribution
Using the algal-bloom classification algorithm, the percentage of the relative bloom frequency of each phytoplankton group in each month was computed through the time series of corrected MODIS data (2003 – 2021) to investigate the seasonal spatial distribution and frequency patterns of algal blooms in different seasons: non-monsoon (NOM; February–April), southwest monsoon (SWM; May–September), and northeast monsoon (NEM; October–January of the following year) (Figure 7). To better understand the seasonal dynamics, the results were then compared to the seasonal variations in sea surface winds, precipitation, and river discharge in the uGoT, which we used to represent surface circulation and nutrient input, as shown in Figure 8.
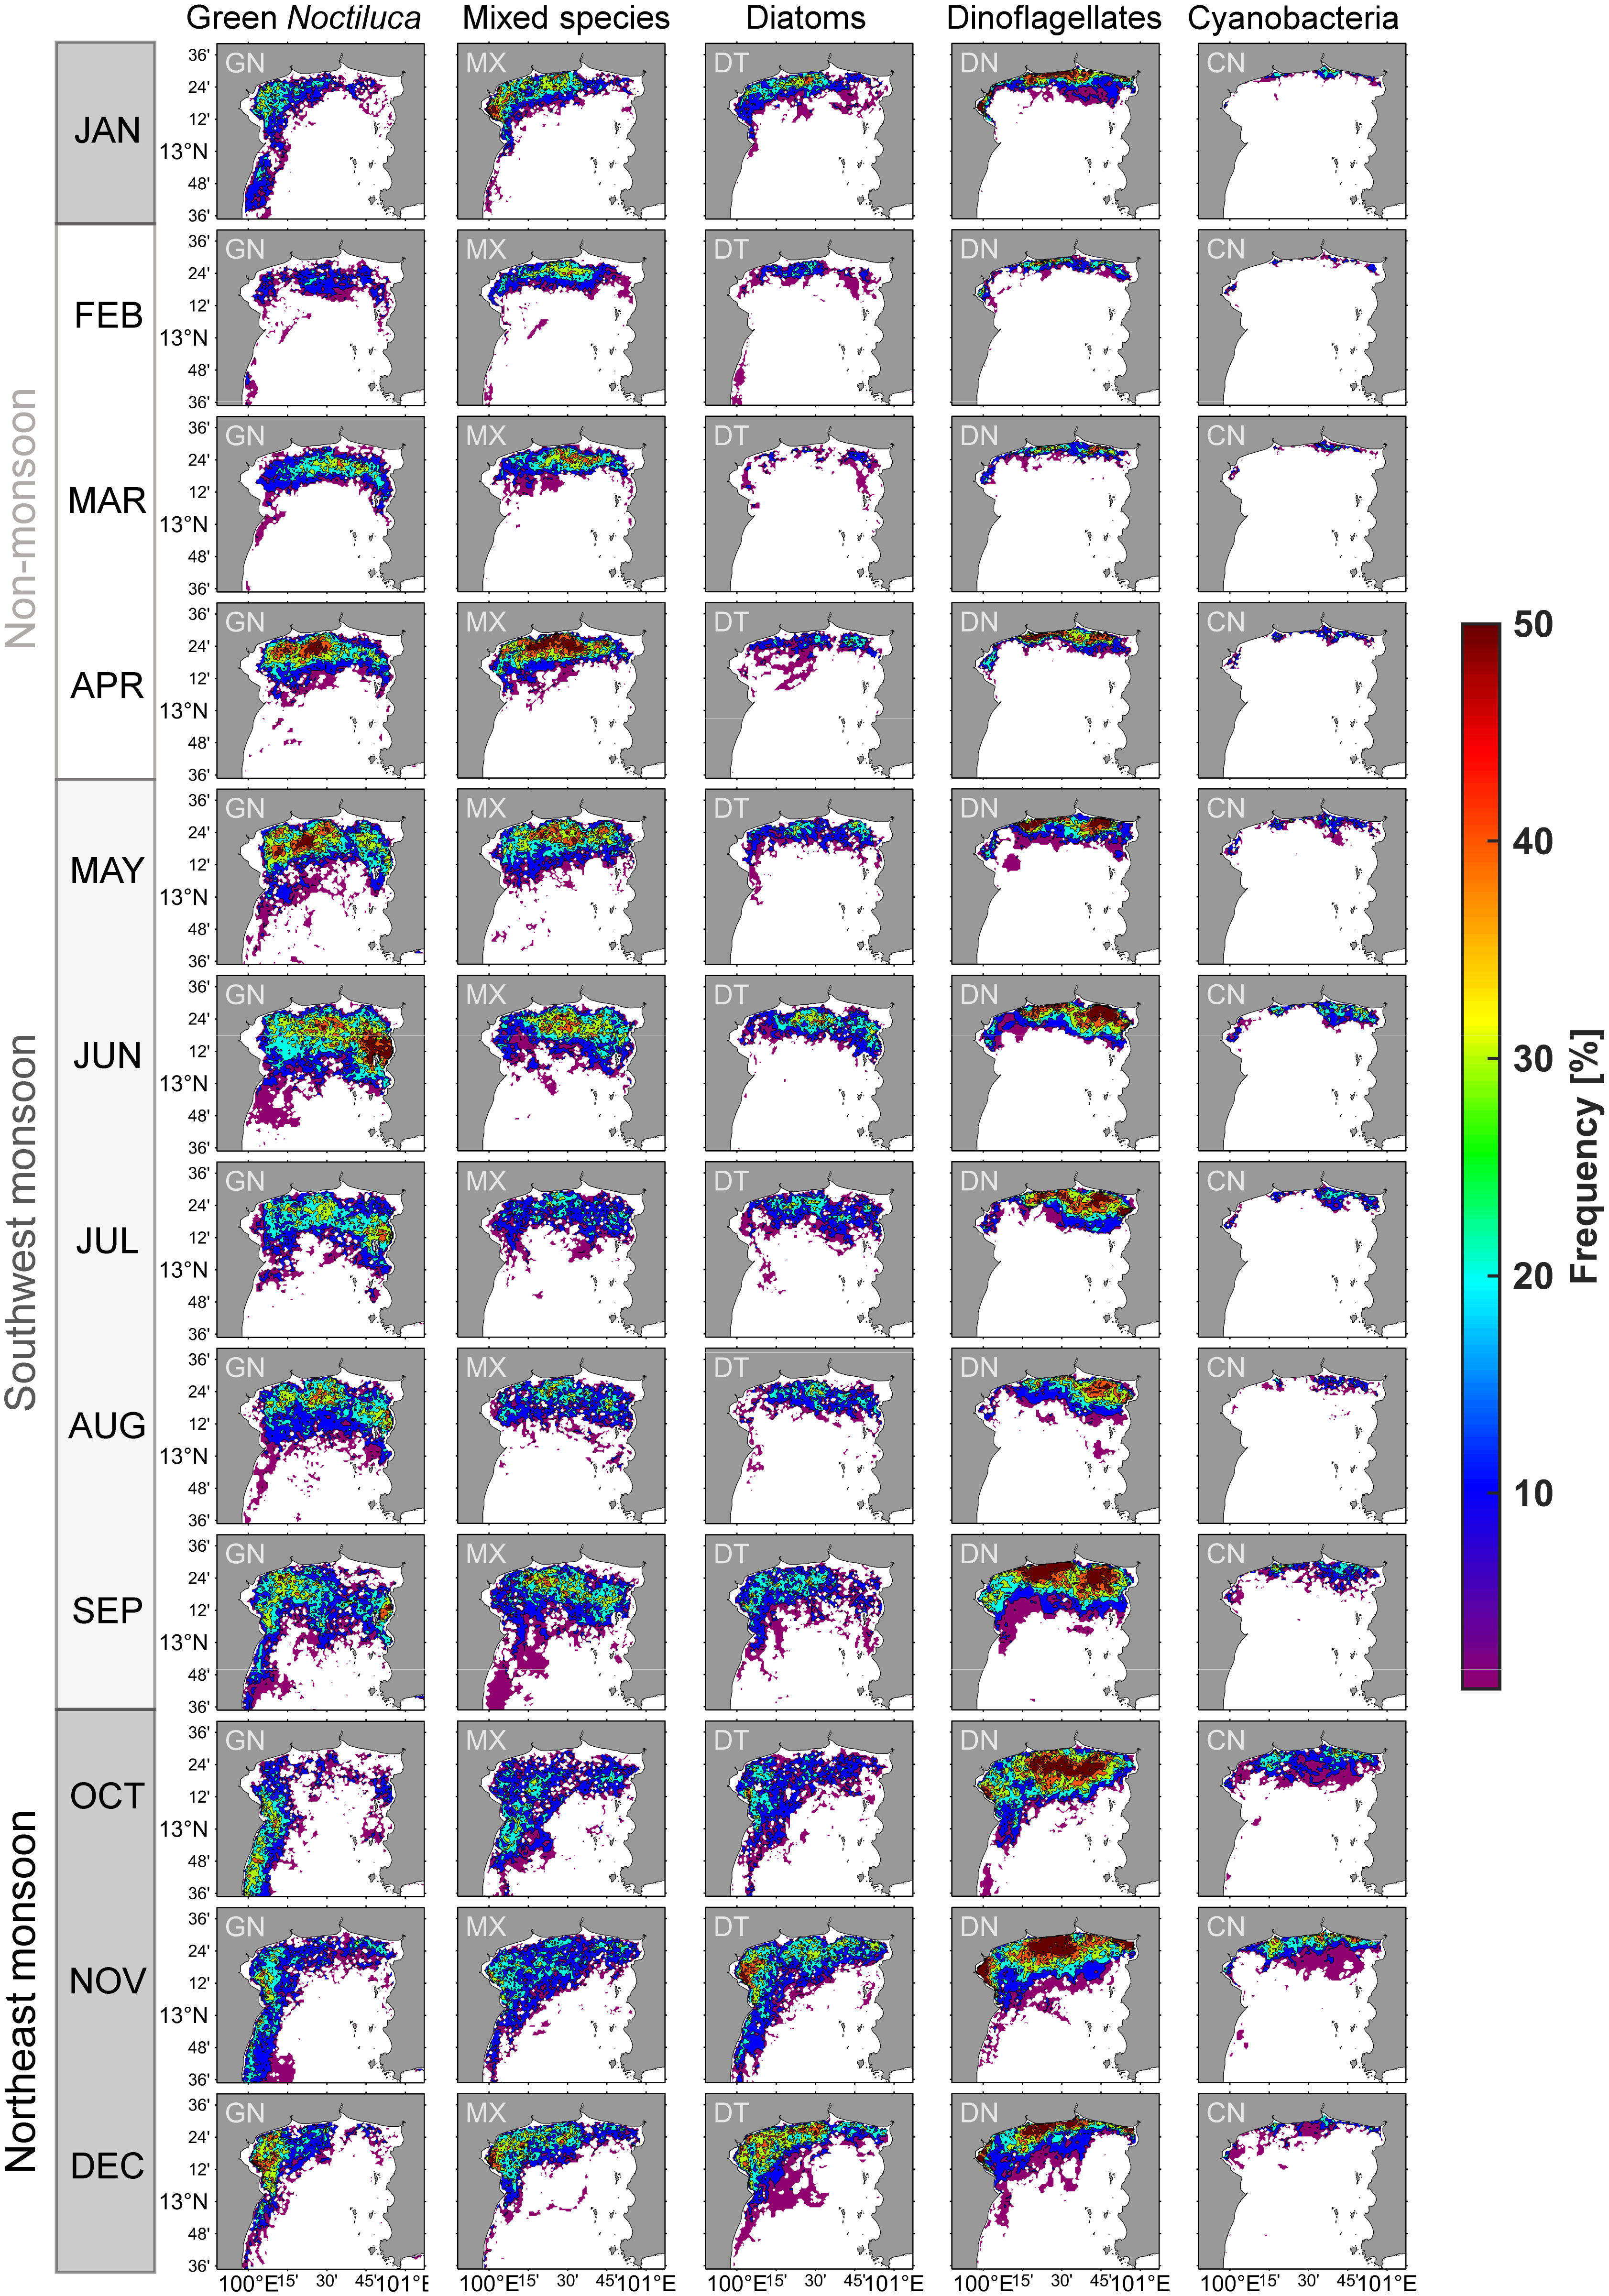
Figure 7 Monthly climatological distribution of the percentage bloom frequency of green Noctiluca (GN), mixed species (MX), diatom (DT), dinoflagellate (DN), and cyanobacteria (CN) blooms during 2003–2021. The percentage indicates the frequency of each phytoplankton bloom per data during this period. The white area had no blooms of any phytoplankton group. The minimum percentage was 5% (two times in 30 days).
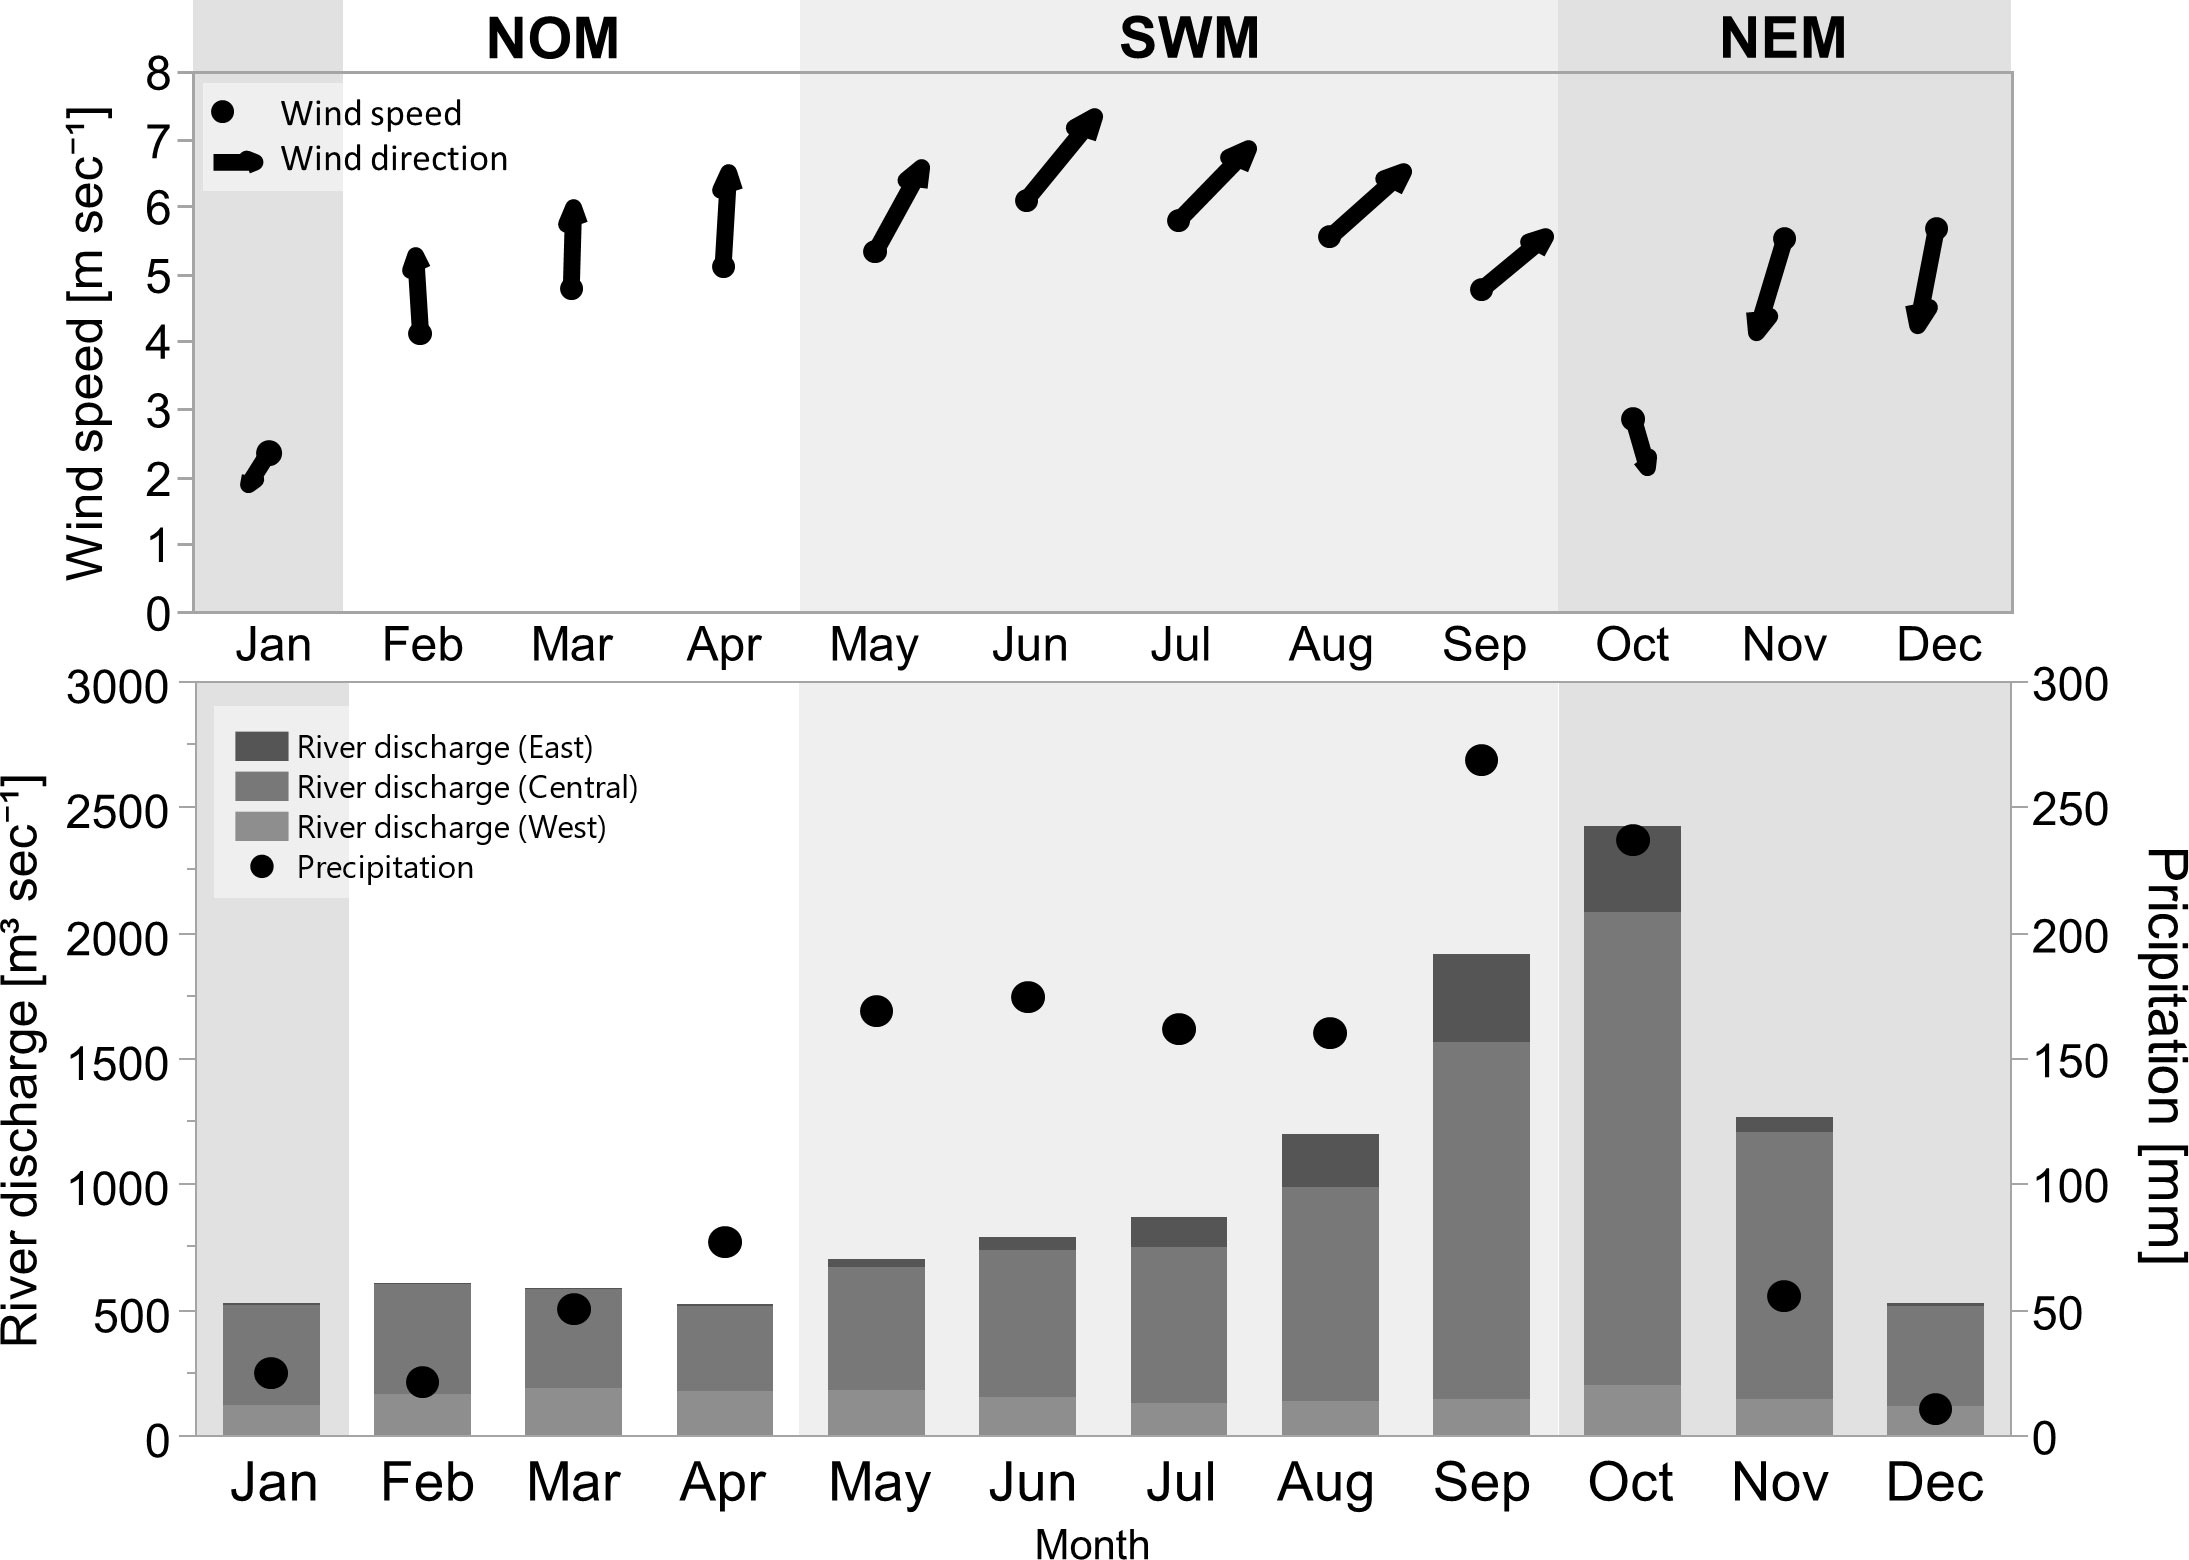
Figure 8 Monthly climatological data of sea surface wind speed and direction (upper), precipitation, and river discharge from the east, central, and west coasts of the uGoT (bottom) during 2003–2017; modified from Luang-on et al. (2021).
In general, GN blooms occurred farther from the shore and estuaries than red tides of DN>60% and CN>50%, and were distributed seasonally in patterns similar to MX blooms. DT>80% blooms showed a distribution pattern similar to that of DN>60% blooms. The bloom frequency exceeded 50% or 15 days per month in all phytoplankton groups. However, the high bloom frequency of these blooms varied in areas with different monsoon seasons.
During the NOM period, southerly winds blow steadily, with an increase in precipitation and low river discharge. GN bloom area and frequency increased in the north between the Tha Chin and Chao Phraya Rivers, with averages of three to six days per month (9–19%) from the early to late season. The highest frequency was in April, at 68% or 21 days, which was similar to that of MX blooms. A few other blooms were also observed in more confined locations, particularly around estuaries and coasts.
During the SWM, the southwest monsoon wind peaked in June, resulting in heavy precipitation and an increase in river discharge throughout the season. All red tides experienced intense blooms in terms of area and frequency. GN blooms covered the largest area compared to other phytoplankton groups, and were observable in the upper part of the uGoT, particularly in the offshore and eastern regions between June and September. The blooms occurred on an average of four to five days per month (15–18%) and up to six days (20%) in June, with the most intense bloom in the east along the coast of Chonburi Province, lasting up to 22 days (74%), which coincided with the highest southwesterly wind magnitude. When river discharge was high in the late season, GN blooms decreased in frequency, and DN>60% blooms became more frequent, occurring on an average of five to seven days per month and up to 25 days (84%) in September, particularly between the rivers in the center and east of the uGoT. DT>80% and CN>50% blooms had a lower area coverage and frequency than GN and DN>60% blooms, predominately near western and eastern estuaries in the late season, respectively.
During the NEM, the northeast monsoonal wind dominated from November onward, resulting in less precipitation, whereas the highest river discharge occurred in October. All types of algal blooms frequently occurred from the Chao Phraya estuary to the west and south. GN blooms had a lower frequency in NEM than SWM, with an average frequency of four days (12–14%) every month throughout the season and up to 19 days (63%) in December. The main bloom area was along the western coast, beginning in the south in October and shifting north from November to December, similar to MX blooms. Others bloomed more frequently along the northern coast toward the west, whereas CN>50% bloom area was restricted to estuaries. DN>60% blooms were the most frequent, averaging up to eight days (25%) with a maximum frequency of 24 days (79%) in October at the highest river discharge in the outer Chao Phraya and Tha Chin estuaries, and shifting closer to the shore and estuaries when river discharge decreased in November. DT>80 blooms also increased in frequency, with an average frequency of up to five days (17%) from November to December. All blooms then faded in January upon weakening of the monsoon wind.
4 Discussion
4.1 Spectral characteristics of green Noctiluca blooms and other red tides
The hyperspectral reflectance of green Noctiluca blooms in uGoT coastal eutrophic waters showed unique spectral characteristics, with Rrs peaks in green (~554 to ~564 nm) and low Rrs values in the violet to blue (~400 to ~490 nm) and red (~630 to ~700 nm) wavelengths, especially when they evolved into SGN blooms (Figure 3G–H). The low Rrs values were attributed to high light absorption by photosynthetic pigments (i.e., chlorophylls, particularly chl-b) and by non-photosynthetic carotenoids (e.g., neoxanthin, violaxanthin, and lutein) in the violet to blue regions (Bricaud et al., 2004; Clementson and Wojtasiewicz, 2019). Carotenoid absorption is also responsible for the discoloration caused by red Noctiluca (Balch and Haxo, 1984; Shaju et al., 2018). Therefore, the relatively low reflectance in the violet and blue regions of SGN blooms was attributed to an increase in the photosynthetic pigments of the green endosymbiont.
An increase in the Rrs spectral slope between 440 nm and 550 nm reported by Dwivedi et al. (2015) for green Noctiluca in the open ocean Arabian Sea was also observed for the green Noctiluca blooms of the coastal uGoT. However, the steeper slope for green Noctiluca blooms of the uGoT was caused by the increase in the peak green wavelength and the lower Rrs values at short wavelengths compared to the spectra reported for Arabian Sea green Noctiluca. We suspect that these differences were caused by increased absorption by non-algal particles and colored dissolved organic matter, which are typical of coastal waters such as the uGoT.
Furthermore, our green Noctiluca spectra showed relatively high reflectance in the NIR wavelengths (~706 to ~825 nm) during SGN blooms (Figure 2B and 3A, G). This feature has never previously been reported in studies of green Noctiluca blooms, but has been observed in the reflectance spectra of red Noctiluca (Astoreca et al., 2005; Van Mol et al, 2007; Qi et al., 2019), floating macroalgae (Hu, 2022), and land vegetation (Govender et al., 2007). Reflectances higher than 700 nm are typically low because of high water absorption. However, this feature was not observed continuously, even during measurements at the same sampling point (Figure 3G). Green Noctiluca possesses an extraordinary ability to manage its buoyancy via regulation of intracellular ammonium and lipid concentrations (Lirdwitayaprasit et al., 2012; Goes et al., 2018). It can also accumulate at the sea surface when seawater conditions are stable. We presume that the high NIR reflectance was caused by the high density of green Noctiluca cells occupying the sea surface instead of water molecules, causing high backscattering of NIR (Van Mol et al., 2007). Because NIR wavelengths are commonly used in atmospheric correction algorithms, this elevated reflectance can lead to the saturation of reflectance and the elimination of some pixels of green Noctiluca blooms in satellite level-3 data, which include atmospheric failure masks, such as the maximum iterations reached for NIR iteration (Patt et al., 2003; Van Mol et al., 2007). We propose that this process of pixel elimination be reconsidered so that NIR satellite ocean color level-3 data can be used for the detection of super blooms.
Differences in the spectral characteristics between green Noctiluca and other phytoplankton blooms were highlighted by the normalized Rrs spectra (Figure 3M–R). The absence of green Noctiluca-specific pigments increased (decreased) the normalized Rrs values in the blue (green) bands of other phytoplankton blooms. Moreover, the green peak of green Noctiluca was low in the spectra of DN>60% blooms; this could be attributed to the presence of peridinin, which uniquely generates high absorption between 500 nm and 550 nm (Bricaud et al., 2004). In the red region, all green Noctiluca spectra were lower than those of DN>60% and CN>50%, which was possibly attributed to the absorption of photosynthetic pigments and the scattering of cell structures. Therefore, the Rrs ratios between the blue, green, and red regions can be utilized to discriminate green Noctiluca blooms from other phytoplankton blooms.
4.2 Algorithm performance
Our algal-bloom classification algorithm (Figure 5) was developed to discriminate green Noctiluca from other algal bloom and non-bloom waters based on the distinctive in situ hyperspectral characteristics of uGoT algal blooms. This algorithm was then applied to satellite data by utilizing the unique normalized spectral characteristics of green Noctiluca in blue (Rrs 488/Rrs 547), green (.531/Rrs 547), and red (Rrs 667/Rrs 547) bands, as described in Section 4.1. The general concept of this classification algorithm was to use the normalized Rrs in blue (i.e., the ratio of blue to green wavelengths) to distinguish algal bloom and non-bloom waters because this value covaries with chl-a in the uGoT (Intacharoen et al., 2018; Luang-on et al., 2021). SGN blooms, which have relatively high chl-a and low Rrs in violet to blue wavelengths, were discriminated from other algal blooms and non-bloom waters by this blue-to-green ratio. Meanwhile, the normalized Rrs values in green and red bands were used to discriminate groups of algal blooms in medium and high chl-a waters, respectively.
Because GN>80% and GN>40% blooms have lower reflectance in the red band than in other groups, as well as in the blue band, low normalized Rrs in red was utilized to discriminate them from other dinoflagellates and cyanobacteria. Based on the specific features of low reflectance in blue and red bands, our algorithm was able to discriminate between the three levels of green Noctiluca blooms. The use of normalized Rrs allowed the classification of water types in relation to chl-a and green Noctiluca blooms, in contrast to other algorithms that do not specify the levels of blooms and utilize similar single Rrs in blue-to-green wavelengths without normalization (Dwivedi et al., 2015; Baliarsingh et al., 2017). However, in coastal waters with high concentrations of colored dissolved organic matter, which have high absorption in the blue light region, this algorithm should be used with caution for determining bloom and non-bloom waters according to the relationship between normalized Rrs in the blue band and chl-a concentration. In that case, using green and red wavelengths to determine bloom waters might be more effective, such as methods developed in East China Seas, in which the blooms are mainly caused by dinoflagellate and diatoms (Tao et al., 2015; Shen et al., 2019).
A comparison of MODIS-derived algal bloom images with uGoT red tide reports and chl-a images demonstrated that our algorithms could discriminate green Noctiluca from other algal blooms and non-bloom waters (Figure 6 and Table 2). Green Noctiluca blooms, which are often observed in coastal areas, were shown by our algorithm to be patchy in offshore areas, which is comparable to the results given by the maximum chlorophyll index described in Suwanlertcharoen and Prukpitikul (2018). Furthermore, the satellite images of our classification revealed that high chl-a in the nearshore and estuaries was likely caused by phytoplankton other than green Noctiluca. Thus, our classification algorithm described green Noctiluca blooms (weak to super blooms) and a variety of other red tides, that is, dinoflagellates, cyanobacteria, and mixed species blooms, in more detail than existing algorithms.
As demonstrated above, the application of our algal-bloom classification algorithms to MODIS data yielded useful information on water types. This allowed for the discrimination of green Noctiluca from other red tides in high chl-a coastal waters. This approach offers the potential to use multi-hyperspectral satellite data to monitor and study the dynamics of different red tides. To avoid errors caused by the difference in wavelengths in each satellite data, the correlation between Rrs values should be validated before applying the algorithm to identify the blooms.
4.3 Seasonal variability of green Noctiluca and other red tides
We used MODIS-derived bloom frequency images (Figure 7) to understand the seasonal dynamics of green Noctiluca and other red tides across the entire uGoT. The seasonal patterns of red tide distribution and areas with the highest bloom frequency in each red tide were distinct in each monsoon season. Monsoon-induced elements such as sea surface winds, precipitation, and river flow (Figure 8), which impact uGoT surface chl-a levels (Luang-on et al., 2021), are therefore expected to influence the seasonal variability of uGoT red tides. These elements are discussed in the following paragraphs.
River discharge. Strong precipitation increased river discharge from the SWM to early NEM, induced high nutrient loads (Thaipichitburapa et al., 2010; Yuenyong et al., 2019), decreased ocean salinity (Buranapratheprat et al., 2002; Yu et al., 2018), and enhanced surface stability (Buranapratheprat et al., 2008; Yu et al., 2018). The blooms of all phytoplankton groups, particularly GN in the SWM and DN>60% in the NEM (Figure 7), responded to the increase in anthropogenic nutrients. Enhanced surface stability owing to an increase in freshwater discharge may also facilitate the promotion of surface blooms of dinoflagellates, including green Noctiluca. Moreover, our findings showed that DN>60% blooms occurred mainly in estuaries and closer to the shore, which were more highly influenced by freshwater discharge than green Noctiluca blooms. This finding is consistent with the preferred salinity range of dinoflagellates such as Ceratium furca (12–27 psu) and green Noctiluca (22–33 psu) (Lirdwitayaprasit et al., 2006), as well as the correlation between high salinity (25–29 psu) and green Noctiluca abundance reported by Chuenniyom et al. (2012). Thus, our results suggest that, in addition to contributing anthropogenic nutrients, river discharge may influence red tide distributions by regulating salinity levels.
Precipitation. In addition to causing high river discharge, precipitation can drain land-based nutrients from coastal aquaculture through runoff and tiny canals, stimulating high surface chl-a in the north of the uGoT (Luang-on et al., 2021). Our results demonstrated that high surface chl-a, even at low river discharge during the NOM, is related to green Noctiluca rather than other red tide species (Figure 7). The green Noctiluca succession can be explained by its mixotrophic ability, which allows it to consume external food, such as diatoms and other dinoflagellates, while still obtaining energy from the photosynthetic endosymbiont (Lirdwitayaprasit, 2015; Goes et al., 2018). Lirdwitayaprasit (2015) demonstrated that, without an external food supply, green endosymbionts disappeared after approximately two weeks of incubation, and Noctiluca host cells died about a month later. Therefore, a small increase in precipitation draining land-based nutrients should be sufficient to trigger green Noctiluca blooms.
Monsoon winds. The SWM and NEM generate eastward and westward transportation, respectively (Buranapratheprat et al., 2002; Buranapratheprat et al., 2006; Yu et al., 2018; Luang-on et al., 2021). This monsoon influence can be seen in the changes in hotspots of green Noctiluca and other algal blooms (Figure 7). During the SWM, green Noctiluca blooms occurred most frequently in the west, especially between June and September, which is consistent with red tide reports from both local notifications and documentation (Lirdwitayaprasit et al., 2006; Sriwoon et al., 2008). The eastward circulation that transports river discharge and phytoplankton cells may promote blooms. Furthermore, we discovered that green Noctiluca blooms were abundant throughout the season in nearly half of the uGoT, particularly offshore rather than in coastal areas. However, this pattern shifted to the western coast during the transition to the NEM from October to the end of the NEM, corresponding to westward transportation. In addition, only a high bloom frequency of green Noctiluca occurred in the southwest in October and November. The green Noctiluca distribution, which extends slightly further than that of other red tide groups, might be attributed to its large cell vacuole, which is filled with ammonium ions, causing high buoyancy (Elbrächter and Qi, 1998). This suggests that green Noctiluca cells could be transported into the southern gulf during the NEM. Meanwhile, strong southerly winds may cause aggregation of green Noctiluca cells and promote blooming in the north between the two rivers in the absence of a monsoon influence.
The seasonal dynamics of red tides based on seasonal variations in MODIS-derived blooms and monsoon-induced variables are presented in Figure 9. During the NOM, southerly winds may push high-salinity water masses to the north during low river discharge, resulting in the aggregation of green Noctiluca cells. Increasing nutrient levels owing to increasing precipitation may promote green Noctiluca blooms. Nonetheless, an increase in green Noctiluca cells, which feed on other phytoplankton, may have a controlling effect on the populations of other red tides. The SWM generates high precipitation and increases river discharge, resulting in a high nutrient load. All phytoplankton are then promoted, and red tides of green Noctiluca and dinoflagellates are likely to develop as the surface stability increases. Meanwhile, salinity levels can determine the bloom area of both red tides. Because of eastward circulation, green Noctiluca blooms accumulate and are promoted in the east rather than in other areas. During the NEM, all blooms shift to the west because of Westward transportation. This transportation might allow the discharge of freshwater from major rivers, promoting dinoflagellates and other algal blooms along the northern coast, whereas green Noctiluca might be transported to the south because of its passive buoyancy.
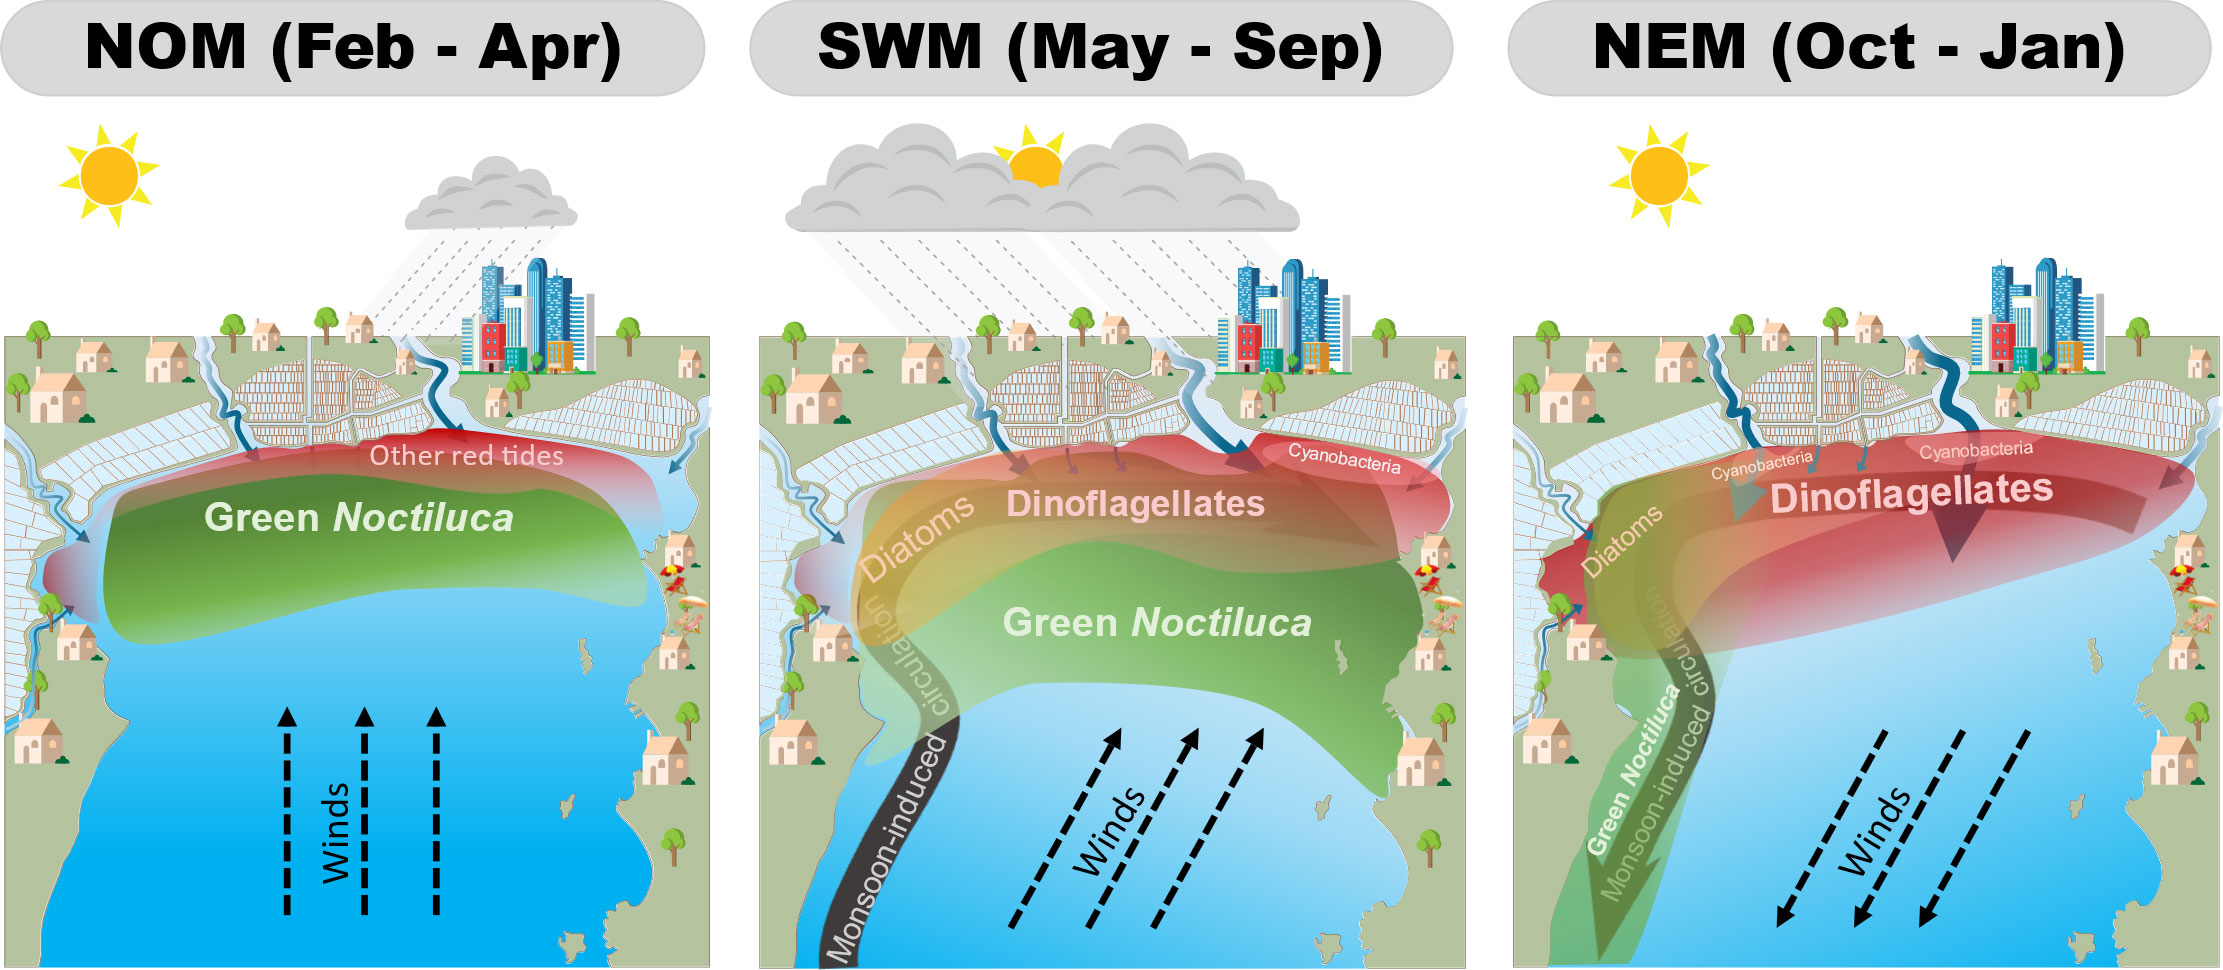
Figure 9 Synopsis of the seasonal dynamics of uGoT red tides under non-monsoon (left), southwest monsoon (middle), and northeast monsoon (right) conditions.
Therefore, our algal-bloom classification algorithm based on MODIS data can be used to better understand the seasonal variability of green Noctiluca and other red tides, which can be influenced by monsoon-induced factors that regulate nutrient input, salinity, surface stability, and surface circulation. Our findings also demonstrate that green Noctiluca is more extensive than other red tide groups because of its feeding behavior, in addition to these parameters. In addition to detecting and monitoring blooms, our approach can be used to examine the dynamics of red tides in the uGoT.
5 Conclusion
In this study, we clarified the unique hyperspectral reflectance characteristics of green Noctiluca and other algal blooms (i.e., dinoflagellates, diatoms, cyanobacteria, and mixed species) using new in situ bio-optical datasets collected in the uGoT between 2017 and 2019. A suite of algal-bloom classification algorithms was developed based on the normalized Rrs values at 488, 531, and 667 nm, which are compatible with the MODIS wavelengths. The satellite Rrs was verified and corrected before applying the algorithms to MODIS data. The algorithms performed well with MODIS data, effectively distinguishing green Noctiluca blooms from other phytoplankton blooms and non-bloom waters, as well as revealing bloom dynamics. The seasonal variability of green Noctiluca and other algal blooms was clarified by comparing MODIS-derived bloom frequency images to monsoon-induced parameters. We confirmed that these parameters can influence red tide variations, emphasizing the effects of Asian monsoons on phytoplankton variation in the uGoT. This study reveals the mechanisms of seasonal red tide dynamics in relation to monsoon-induced variables. Thus, our results build confidence in the application of satellite ocean color observations for monitoring the dynamics of red tides in regional coastal waters influenced by human pollution and the global climate.
Data availability statement
The original contributions presented in the study are included in the article/Supplementary Material. Further inquiries can be directed to the corresponding author.
Author contributions
JL-O collected the samples, analyzed the field and satellite data, developed the algal-bloom classification algorithm, and wrote this manuscript. JI contributed to project administration, supervision, and funding acquisition. AB and JP made the contribution of ship observations and sample analysis in Thailand, as well as manuscript revision. JG and ES also contributed to the writing revision and edition. EM assisted with satellite data analysis. YZ, QX, and PN helped with the sample collection and measurements. HK and SM contributed in situ bio-optical data to validate satellite Rrs data. All authors contributed to the article and approved the submitted version.
Funding
This work was supported by the Sasakawa Scientific Research Grant of the Japan Science Society (JSS-29-714); ISEE International Joint Research Program and Japan; Global Change Observation Mission-Climate (GCOM-C) project of the Japan Aerospace Exploration Agency (JAXA); and Grants-in-Aid for Scientific Research (KAKENHI JP21H05317) funded by the Ministry of Education, Culture, Sports, Science, and Technology-Japan (MEXT). JG is supported by NASA grants 80LARC21DA002-GLIMR AABO8078, NNX17AG66G-ECO4CAST and NOAA GST SA18-CUNY01.
Acknowledgments
We gratefully acknowledge the data support provided by the Royal Irrigation Department (Thailand) and the Department of Marine and Coastal Resources (Thailand). We also thank the following people for their facilitation of the ship observation and sample analysis in Thailand and Japan, without whose help this work would never have been possible: Prof. Dr. Shettapong Meksumpun and Assistant Prof. Suchai Worachananat of Kasetsart University, Dr. Vichaya Gunbua of Burapha University, and Assistant Prof. Yoshihisa Mino of Nagoya University.
Conflict of interest
The authors declare that the research was conducted in the absence of any commercial or financial relationships that could be construed as a potential conflict of interest.
Publisher’s note
All claims expressed in this article are solely those of the authors and do not necessarily represent those of their affiliated organizations, or those of the publisher, the editors and the reviewers. Any product that may be evaluated in this article, or claim that may be made by its manufacturer, is not guaranteed or endorsed by the publisher.
Supplementary material
The Supplementary Material for this article can be found online at: https://www.frontiersin.org/articles/10.3389/fmars.2023.1031901/full#supplementary-material
References
Astoreca R., Rousseau V., Ruddick K. G., van Mol B., Parent J.-Y., Lancelot C. (2005). "Optical properties of algal blooms in an eutrophicated coastal area and its relevance to remote sensing", in Remote Sensing of the Coastal Oceanic Environment. 58850V-58850V–11. doi: 10.1117/12.615160
Balch W. M., Haxo F. T. (1984). Spectral properties of noctiluca miliaris suriray, a heterotrophic dinoflagellate. J. Plankton Res. 6, 515–525. doi: 10.1093/plankt/6.3.515
Baliarsingh S. K., Dwivedi R. M., Lotliker A. A., Sahu K. C., Kumar T. S., Shenoi S. S. C. (2017). An optical remote sensing approach for ecological monitoring of red and green noctiluca scintillans. Environ. Monit Assess. 189, 330. doi: 10.1007/s10661-017-6037-9
Bricaud A., Claustre H., Ras J., Oubelkheir K. (2004). Natural variability of phytoplanktonic absorption in oceanic waters: Influence of the size structure of algal populations. J. Geophys Res. Oceans 109, C11010. doi: 10.1029/2004JC002419
Buranapratheprat A., Morimoto A., Phromkot P., Mino Y., Gunbua V., Jintasaeranee P. (2021). Eutrophication and hypoxia in the upper gulf of Thailand. J. Oceanogr. 77, 831–841. doi: 10.1007/s10872-021-00609-2
Buranapratheprat A., Niemann K. O., Matsumura S., Yanagi T. (2009). MERIS imageries to investigate surface chlorophyll in the upper gulf of Thailand. Coast. Mar. Sci. 33, 22–28. doi: 10.15083/00040700
Buranapratheprat A., Yanagi T., Matsumura S. (2008). Seasonal variation in water column conditions in the upper gulf of Thailand. Cont Shelf Res. 28, 2509–2522. doi: 10.1016/j.csr.2008.07.006
Buranapratheprat A., Yanagi T., Sawangwong P. (2002). Seasonal variations in circulation and salinity distributions in the upper gulf of Thailand: Modeling approach. Mer 40, 147–155.
Buranapratheprat A., Yanagi T., Sojisuporn P., Chinorost B. (2006). Influence of local wind field on seasonal circulations in the upper gulf of Thailand. Coast. Mar. Sci. 30, 19–26.
Chuenniyom W., Meksumpun C., Meksumpun S. (2012). Impacts of nutrients and related environmental factors on distribution and size structure of noctiluca scintillans populations of the eutrophic tha chin estuary, Thailand. Water Sci. Technol. 65, 1994–2002. doi: 10.2166/wst.2012.099
Chumnantana R., Marine P., Resources C. (2006). Causative phytoplankton of red tide phenomena in the upper Gulf of Thailand (Technical Paper no. 1/2006). Marine and Coastal Resources Research and Development Institute, Bangkok. Available at: https://www.dmcr.go.th/detailLib/2124.
Clementson L. A., Wojtasiewicz B. (2019). Dataset on the absorption characteristics of extracted phytoplankton pigments. Data Brief 24, 103875. doi: 10.1016/j.dib.2019.103875
do Rosário Gomes H., Goes J. I., Matondkar S. G. P., Buskey E. J., Basu S., Parab S., et al. (2014). Massive outbreaks of noctiluca scintillans blooms in the Arabian Sea due to spread of hypoxia. Nat. Commun. 5, 4862. doi: 10.1038/ncomms5862
Dwivedi R., Rafeeq M., Smitha B. R., Padmakumar K. B., Thomas L. C., Sanjeevan V. N., et al. (2015). Species identification of mixed algal bloom in the northern Arabian Sea using remote sensing techniques. Environ. Monit Assess. 187, 51. doi: 10.1007/s10661-015-4291-2
Elbrächter M., Oi Z. (1998) “Aspects of Noctiluca (Dinophyceae) population dynamics,” in Physiological ecology of harmful algal blooms, eds. D M Anderson, A D Cambella, and G M Hallegraeff, 315–335.
Enomoto Y. (1956) On the occurrence and the food of noctiluca scintillans (Macartney) in the waters adjacent to the west coast of Kyushu, with special reference to the possibility of the damage caused to the fish eggs by that plankton (Accessed July 26, 2022).
Escalera L., Pazos Y., Moroño Á., Reguera B. (2007). Noctiluca scintillans may act as a vector of toxigenic microalgae. Harmful Algae 6, 317–320. doi: 10.1016/j.hal.2006.04.006
Fonda Umani S., Beran A., Parlato S., Virgilio D., Zollet T., de Olazabal A., et al. (2004). Noctiluca scintillans macartney in the northern Adriatic Sea: Long-term dynamics, relationships with temperature and eutrophication, and role in the food web. J. Plankton Res. 26, 545–561. doi: 10.1093/plankt/fbh045
Furuya K., Lirdwitayaprasit T. (2000). Pigment composition of pedinomonas noctilucae (Pedinophyceae), an endosymbiont of green noctiluca (Dinophyceae). La mer 38, 95–97.
Goes J. I., Gomes H., do R., Al-Hashimi K., Buranapratheprat A. (2018). “Ecological drivers of green noctiluca blooms in two monsoonal-driven ecosystems,” in Global ecology and oceanography of harmful algal blooms. ecological studies (Analysis and synthesis), vol. 232 . Eds. Glibert P. M., Berdalet E., Burford M. A., Pitcher G. C., Zhou M. (Cham: Springer), 327–336. doi: 10.1007/978-3-319-70069-4_17
Gomes H., do R., Matondkar S. G. P., Parab S. G., Goes J. I., Pednekar S., et al. (2009). Unusual blooms of the green noctiluca miliaris ( dinophyceae ) in the Arabian Sea during the winter monsoon. Geophysical Monograph Ser. 185, 347–363. doi: 10.1029/2008GM000831
Govender M., Chetty K., Bulcock H. (2007). A review of hyperspectral remote sensing and its application in vegetation and water resource studies. Water SA 33, 145–151. doi: 10.4314/wsa.v33i2.49049
Hansen P. J., Miranda L., Azanza R. (2004). Green noctiluca scintillans: A dinoflagellate with its own greenhouse. Mar. Ecol. Prog. Ser. 275, 79–87. doi: 10.3354/meps275079
Harrison P. J., Furuya K., Glibert P. M., Xu J., Liu H. B., Yin K., et al. (2011). Geographical distribution of red and green noctiluca scintillans. Chin. J. Oceanology Limnology 29, 807–831. doi: 10.1007/s00343-011-0510-z
Higgins H. W., Wright S. W., Schlüter L. (2011). “Quantitative interpretation of chemtaxonomic pigment data,” in Phytoplankton pigments: Characterization, chemotaxonomy and applications in oceanography. Eds. Roy S., Llewellyn C. A., Egeland E. S., Johnsen G. (Cambridge: Cambridge University Press), 257–313.
Hu C. (2022). Hyperspectral reflectance spectra of floating matters derived from hyperspectral imager for the coastal ocean (HICO) observations. Earth Syst. Sci. Data 14, 1183–1192. doi: 10.5194/essd-14-1183-2022
Intacharoen P., Dasananda S., Buranapratheprat A. (2018). MODIS-based observation of sea surface chlorophyll-a concentration over upper gulf of Thailand. Suranaree J. Sci. Technol. 25, 59–72.
Kofoid C. A., Swezy O. (1921). The free-living unarmored dinoflagellata. Memoirs Univ. California 5, 1–562. doi: 10.5962/bhl.title.24995
Latasa M. (2007). Improving estimations of phytoplankton class abundances using CHEMTAX. Mar. Ecol. Prog. Ser. 329, 13–21. doi: 10.3354/meps329013
Lirdwitayaprasit T. (2003). "Red tide in the inner gulf of Thailand", in Workshop on Red Tide Monitoring in Asian Coastal Waters. (University of Tokyo), 53–56.
Lirdwitayaprasit T. (2001). "Culture of green Noctiluca under laboratory conditions: I. Feeding behavior and sexual reproduction", in Proceedings of the Fifth IOC/WESTPAC International Science Symposium 27–31.
Lirdwitayaprasit T., Chuabkarnrai P., Nitithamyong C., Furuya K. (2012). Effect of salinity on vertical migration of green noctiluca under laboratory conditions. Coast. Mar. Sci. 35, 70–72. doi: 10.15083/00040636
Lirdwitayaprasit T., Meksumpun S., Rungsura S., Furuya K. (2006). Seasonal variations in cell abundance of noctiluca scintillans in the coastal waters off chonburi province, the upper gulf of Thailand. Coast. Mar. Sci. 30, 80–84. doi: 10.15083/00040753
Lu L., Jiang T., Xu Y., Zheng Y., Chen B., Cui Z., et al. (2018). Succession of phytoplankton functional groups from spring to early summer in the central bohai Sea using HPLC–CHEMTAX approaches. J. Oceanogr 74, 381–392. doi: 10.1007/s10872-018-0469-x
Luang-on J., Ishizaka J., Buranapratheprat A., Phaksopa J., Goes J. I., Kobayashi H., et al. (2021). Seasonal and interannual variations of MODIS aqua chlorophyll–2017) in the upper gulf of Thailand influenced by Asian monsoons. J. Oceanogr. 78, 209–228. doi: 10.1007/s10872-021-00625-2
Mackey M. D., Mackey D. J., Higgins H. W., Wright S. W. (1996). CHEMTAX - a program for estimating class abundances from chemical markers: Application to HPLC measurements of phytoplankton. Mar. Ecol. Prog. Ser. 144, 265–283. doi: 10.3354/meps144265
Patt F. S., Barnes R. A., Eplee R. E., Jr., Franz B. A., Robinson W. D., et al. (2003). SeaWiFS Post Launch Technical Report Series: Algorithm updates for the fourth SeaWiFS data reprocessing. eds. S. B. Hooker and E. R. Firestone Greenbelt, Maryland: National Aeronautics and Space Administration, Goddard Space Flight Center. Available at: https://oceancolor.gsfc.nasa.gov/docs/technical/seawifs_reports/postlaunch/post_vol22_abs/.
Qi L., Tsai S. F., Chen Y., Le C., Hu C. (2019). In Search of Red Noctiluca scintillans Blooms in the East China Sea. Geophys. Res. Lett. 46, 5997–6004. doi: 10.1029/2019GL082667
Saito H., Furuya K., Lirdwitayaprasit T. (2006). Photoautotrophic growth of noctiluca scintillans with the endosymbiont pedinomonas noctilucae. Plankton Benthos Res. 1, 97–101. doi: 10.3800/pbr.1.97
Shaju S. S., Akula R. R., Jabir T. (2018). Characterization of light absorption coefficient of red noctiluca scintillans bloom in the south Eastern Arabian Sea. Oceanologia 60, 419–425. doi: 10.1016/j.oceano.2017.12.002
Shang S., Wu J., Huang B., Lin G., Lee Z., Liu J., et al. (2014). A new approach to discriminate dinoflagellate from diatom blooms from space in the East China Sea. J. Geophys Res. Oceans 119, 4653–4668. doi: 10.1002/2014JC009876
Shen F., Tang R., Sun X., Liu D. (2019). Simple methods for satellite identification of algal blooms and species using 10-year time series data from the East China Sea. Remote Sens Environ. 235, 111484. doi: 10.1016/j.rse.2019.111484
Sriwoon R., Pholpunthin P., Lirdwitayaprasit T., Kishino M., Furuya K. (2008). Population dynamics of green noctiluca scintillans (Dinophyceae) associated with the monsoon cycle in the upper gulf of Thailand. J. Phycol 44, 605–615. doi: 10.1111/j.1529-8817.2008.00516.x
Suwanlertcharoen T., Prukpitikul S. (2018). Detection of phytoplankton blooms in the upper gulf of Thailand using sentinel-3A OLCI imagery. Environ. Nat. Resour J. 16, 9–20. doi: 10.14456/ennrj.2018.2
Suzuki R., Ishimaru T. (1990). An improved method for the determination of phytoplankton chlorophyll using n, n-dimethylformamide. J. Oceanographical Soc. Japan 46, 190–194. doi: 10.1007/BF02125580
Sweeney B. M. (1971). Laboratory studies of a green noctiluca from new Guinea. J. Phycol. 7 (1), 53–58. doi: 10.1111/j.1529-8817.1971.tb01478.x
Tao B., Mao Z., Lei H., Pan D., Shen Y., Bai Y., et al. (2015). A novel method for discriminating prorocentrum donghaiense from diatom blooms in the East China Sea using MODIS measurements. Remote Sens Environ. 158, 267–280. doi: 10.1016/j.rse.2014.11.004
Thaipichitburapa P., Meksumpun C., Meksumpun S. (2010). Province-based self-remediation efficiency of the tha chin river basin, Thailand. Water Sci. Technol. 62, 594–602. doi: 10.2166/wst.2010.293
Turkoglu M. (2013). Red tides of the dinoflagellate noctiluca scintillans associated with eutrophication in the Sea of marmara (the dardanelles, Turkey). Oceanologia 55, 709–732. doi: 10.5697/oc.55-3.709
Van Heukelem L., Thomas C. S. (2001). Computer-assisted high-performance liquid chromatography method development with applications to the isolation and analysis of phytoplankton pigments. J. Chromatogr A 910, 31–49. doi: 10.1016/S0378-4347(00)00603-4
Van Mol B., Ruddick K., Astoreca R., Park Y., Nechad B. (2007). Optical detection of a noctiluca scintillans bloom. EARSeL eProceedings 6, 130–137.
Wang L., Lin X., Goes J. I., Lin S. (2016). Phylogenetic analyses of three genes of pedinomonas noctilucae, the green endosymbiont of the marine dinoflagellate noctiluca scintillans, reveal its affiliation to the order marsupiomonadales (Chlorophyta, pedinophyceae) under the reinstated name protoeu. Protist 167, 205–216. doi: 10.1016/j.protis.2016.02.005
Wattayakorn G. (2006). “Environmental issues in the gulf of Thailand,” in The environment in Asia pacific harbours. Ed. Wolanski E. (Dordrecht: Springer), 249–259. doi: 10.1007/1-4020-3655-8_16
Welschmeyer N. A. (1994). Fluorometric analysis of chlorophyll a in the presence of chlorophyll b and pheopigments. Limnol Oceanogr 39, 1985–1992. doi: 10.4319/lo.1994.39.8.1985
Xu Q., Sukigara C., Goes J. I., Gomes R., Zhu Y., Wang S. (2019). Interannual changes in summer phytoplankton community composition in relation to water mass variability in the East China Sea. J. Oceanogr 75, 61–79. doi: 10.1007/s10872-018-0484-y
Yang M. M., Ishizaka J., Goes J. I., Gomes H., do R., de Raus Maúre E., et al. (2018). Improved MODIS-aqua chlorophyll-a retrievals in the turbid semi-enclosed ariake bay, Japan. Remote Sens (Basel) 10, 1335. doi: 10.3390/rs10091335
Yu X., Guo X., Morimoto A., Buranapratheprat A. (2018). Simulation of river plume behaviors in a tropical region: Case study of the upper gulf of Thailand. Cont Shelf Res. 153, 16–29. doi: 10.1016/j.csr.2017.12.007
Keywords: algal bloom, Noctiluca scintillans, seasonal variability, monsoon, MODIS ocean color data, classification algorithm, phytoplankton, red tide
Citation: Luang-on J, Ishizaka J, Buranapratheprat A, Phaksopa J, Goes JI, Maúre ER, Siswanto E, Zhu Y, Xu Q, Nakornsantiphap P, Kobayashi H and Matsumura S (2023) MODIS-derived green Noctiluca blooms in the upper Gulf of Thailand: Algorithm development and seasonal variation mapping. Front. Mar. Sci. 10:1031901. doi: 10.3389/fmars.2023.1031901
Received: 30 August 2022; Accepted: 08 February 2023;
Published: 27 February 2023.
Edited by:
Javier A. Concha, European Space Research Institute (ESRIN), ItalyReviewed by:
Xuerong Sun, University of Exeter, Exeter, United KingdomSanjiba Kumar Baliarsingh, Indian National Centre for Ocean Information Services, India
Copyright © 2023 Luang-on, Ishizaka, Buranapratheprat, Phaksopa, Goes, Maúre, Siswanto, Zhu, Xu, Nakornsantiphap, Kobayashi and Matsumura. This is an open-access article distributed under the terms of the Creative Commons Attribution License (CC BY). The use, distribution or reproduction in other forums is permitted, provided the original author(s) and the copyright owner(s) are credited and that the original publication in this journal is cited, in accordance with accepted academic practice. No use, distribution or reproduction is permitted which does not comply with these terms.
*Correspondence: Jutarak Luang-on, anRsYWlyNzk5N0BnbWFpbC5jb20=