 Sabrina Geraci-Yee
 Bassem Allam
 Jackie L. Collier
- School of Marine and Atmospheric Sciences, Stony Brook University, Stony Brook, NY, United States
Progress in understanding and managing QPX disease outbreaks in hard clams (Mercenaria mercenaria) has been limited by lack of insight into basic aspects of the biology and ecology of the opportunistic pathogen Mucochytrium quahogii (formerly QPX or Quahog Parasite Unknown). One barrier is that while several methods have been able to detect M. quahogii in seawater and sediment, its abundance was typically too low for reliable quantification by those methods. Here we describe the development and validation of a sensitive, M. quahogii-specific, nested quantitative PCR (nqPCR) assay following the Minimum Information for Publication of Quantitative Real-Time PCR Experiments (MIQE) guidelines. The assay reaches the theoretical limit of detection (LOD) of a PCR assay at 3 copies per reaction with excellent efficiency, linearity, and minimal sample PCR inhibition. The functionality of the assay was evaluated by quantifying M. quahogii in sediment and seawater samples, which revealed that M. quahogii was broadly distributed throughout the marine environment, detected in 75% of samples, with mean estimated abundance of 0.21 cells per mg sediment, 0.55 cells per ml bottom seawater, and 0.02 cells per ml surface seawater. M. quahogii was most prevalent and most abundant in sediment and bottom seawater samples, suggesting that the flocculent layer at the sediment-water interface is an important environmental reservoir where M. quahogii may interact with hard clams. This assay will serve as a valuable tool to better understand QPX disease dynamics and offers a model to guide development of similar assays for other important marine microbes typically present at similarly low abundance.
1 Introduction
Quahog Parasite Unknown (QPX) disease in hard clams, Mercenaria mercenaria, has caused mass mortality events in both wild and cultured hard clams since the 1960s. Progress in our understanding of QPX disease outbreaks has been limited in part by poor understanding of the biology and ecology of the opportunistic thraustochytrid pathogen, first cultivated in the 1990’s but only recently formally described as Mucochytrium quahogii (Geraci-Yee et al., 2021). The distribution and abundance of M. quahogii in the marine environment is poorly described and its preferred habitats are unknown, as is how QPX disease is transmitted to the hard clam host (Geraci- Yee et al., submitted; Geraci-Yee, 2021).
M. quahogii has been detected in marine aggregates by in situ hybridization and by PCR-based assays in sediment, seawater, and other environmental samples (Lyons et al., 2005; Gast et al., 2006; Lyons et al., 2006; Gast et al., 2008; Liu et al., 2009). For example, the M. quahogii-specific real-time quantitative PCR (qPCR) assay, used routinely for monitoring QPX disease in hard clams (Liu et al., 2009; Geraci-Yee et al., 2022), detected M. quahogii in 9% of sediment samples but in no seawater samples (Liu et al., 2009). Similar challenges have been encountered with efforts to quantify the natural abundance of other labyrinthulomycete genera using qPCR (Nakai et al., 2013). Greater sensitivity was achieved by the addition of extra PCR steps to create a nested PCR assay, which was able to detect M. quahogii in 40% of environmental samples from Massachusetts (Gast et al., 2008). This assay was sensitive but non-quantitative, being evaluated by denaturing gradient gel electrophoresis (DGGE) (Gast et al., 2006). Adding an additional PCR step to a qPCR assay (i.e., nested qPCR assay or nqPCR) can also increase the sensitivity and specificity of DNA amplification compared to a conventional single-step qPCR assay (Takahashi and Nakayama, 2006), and offers a path for quantifying the distribution of not only M. quahogii and other specific species of labyrinthulomycetes, but also other important but low-abundance marine microbes.
In a nested PCR assay, there are two (or more) sets of primers used and two (or more) rounds of thermal cycling. Typically, a set of primers spaced relatively far apart is used to amplify the target DNA during the first or outer step. Then another pair of primers is used in the second or inner step to amplify a fragment nested within the ‘outer’ fragment. A nested PCR can be used in a qPCR assay as a nested qPCR (nqPCR) by performing regular PCR reactions before using the product as template in a real-time qPCR assay (Takahashi and Nakayama, 2006; Banno et al., 2011). In order for the assay to be quantitative, the initial phase of amplification (first, outer step) must take place entirely in exponential phase, meaning the PCR reaction must not go to completion (Haff, 1994).
Here we describe the development of a nqPCR SYBR-based assay for sensitive detection and quantification of M. quahogii from marine environmental samples following the Minimum Information for Publication of Quantitative Real-Time PCR Experiments (MIQE) guidelines (Bustin et al., 2009; Bustin et al., 2010). We apply the nqPCR assay to a large set of sediment and seawater samples, confirming that M. quahogii is prevalent in the environment, as expected for an opportunistic pathogen, and that the M. quahogii-specific nqPCR assay is sensitive enough to quantify M. quahogii at its natural environmental abundance.
2 Methods
2.1 Assay development
Primers designed by Stokes et al. (2002) were used to develop the M. quahogii-specific nqPCR assay, illustrated in Figure 1 (Stokes et al., 2002; Qian et al., 2007). The first, outer PCR reaction used QPX-F and LABY-Y, which produce a product of ~700 bp, followed by LABY-A and QPX-R2 in the second, inner qPCR reaction, which produce a product of ~400 bp. Both PCR reactions use one M. quahogii-specific primer so the final product should be M. quahogii-specific. All quality control measures described in Geraci-Yee et al. (2022) were followed, such as positive and negative controls, and at least triplicate replicate reactions. In addition, PCR setup and contamination procedures were augmented by including a new, separate workspace for setup of the outer reaction.
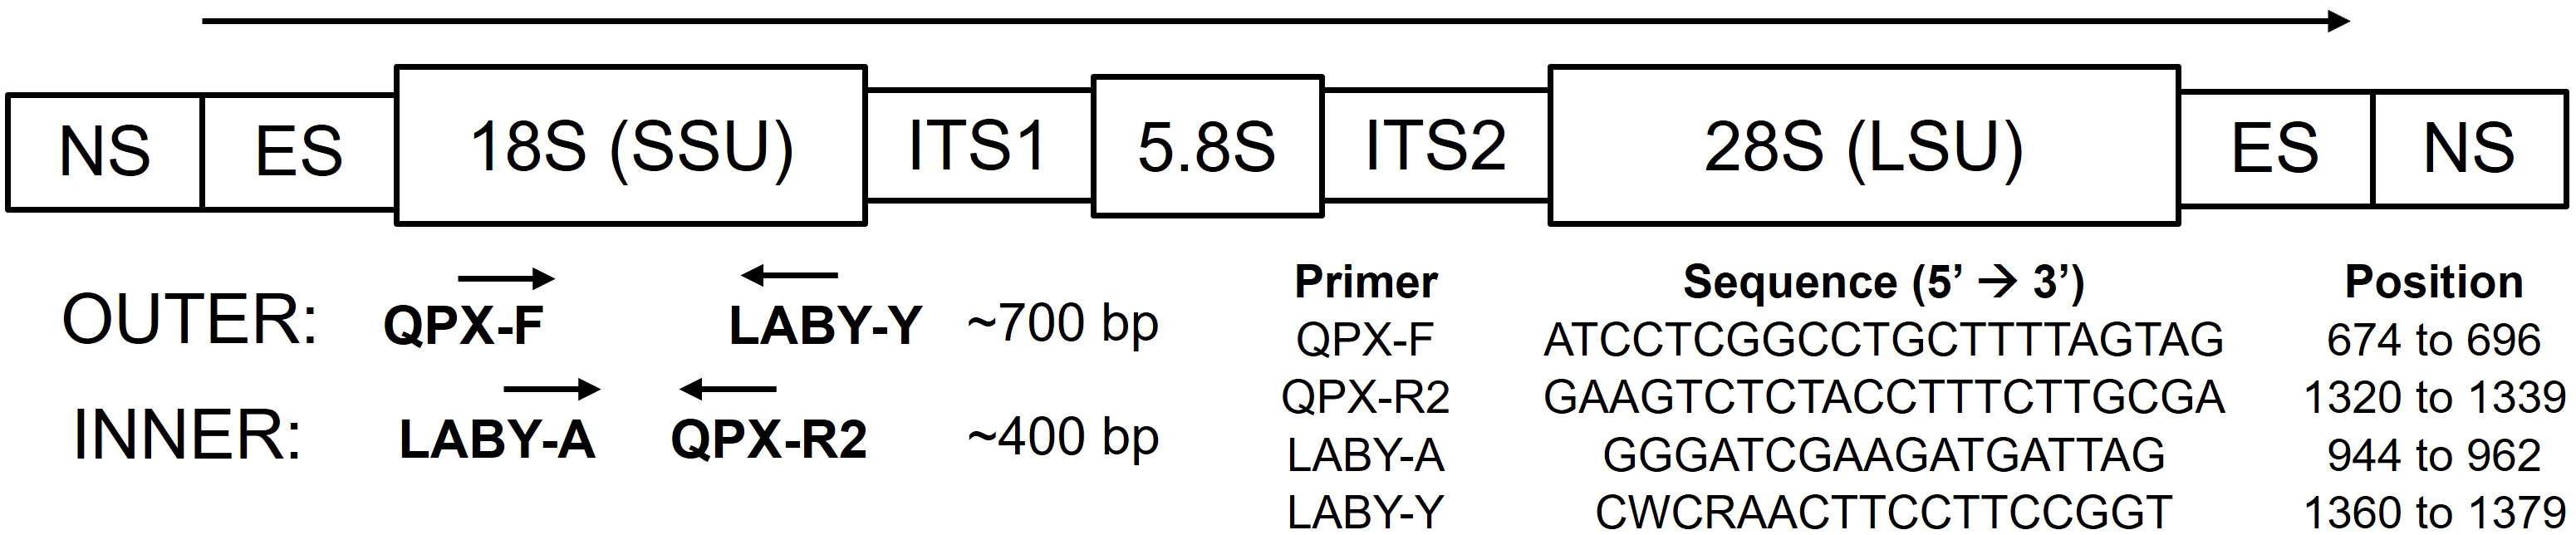
Figure 1 Schematic of the ribosomal RNA (rRNA) genes showing primers, respective locations and directions in which they prime, modified from Qian et al. (2007) with primers from Stokes et al. (2002). Primer positions are based on M. quahogii (QPX) sequence AY052644 in GenBank. NS, nontranscribed region; ES, external transcribed spacer; SSU, small subunit or 18S rRNA gene; ITS1, internal transcribed spacer 1; 5.8S, 5.8S rRNA gene; ITS2, internal transcribed spacer 2; LSU, large subunit or 28S rRNA gene.
Under standard PCR, the outer and inner PCR reactions were tested using M. quahogii genomic DNA (gDNA) extracted from a geographically representative mixture of 4 isolates: two from New York (8BC7 (ATCC TSD-50) and 20AC1), one from Massachusetts (MA; ATCC 50749), and one from Virginia (VA), using the NucleoSpin Genomic DNA Tissue kit (Macherey-Nagel, Inc., Bethlehem, PA) and diluted to 0.5 ng/µl. In addition, linear plasmid DNA containing the M. quahogii rRNA region amplified by QPX-F and 28S46Rev (5’-ATATGCTTAARTTCAGCGGGT-3’), developed by Liu et al. (2009) and described in Geraci-Yee et al. (2022), was also tested in the nested PCR design over a 105 range of concentrations (10, 103, and 106 copies/µl). Primers were synthesized by Integrated DNA Technologies, Inc. (Coralville, IA). Each 20 µl PCR reaction contained 3.3 µl of nuclease-free water, 2 µl of 25 mM MgCl2, 2 µl of 2 mM dNTPs, 2 µl of 2 µM forward and reverse primers (QPX-F and LABY-Y, final concentration 200 nM), 3.2 µl of 50% glycerol (8% final concentration), 4 µl of 5X GoTaq Flexi buffer (colorless), 0.5 µl GoTaq G2 Flexi DNA Polymerase (Promega, Madison, WI), and 1 µl of template DNA. The PCR program used to test the reactions was 35 cycles of 95°C for 30 seconds, 55°C for 1 minute, 72°C for 2 minutes (Liu et al., 2009). The same PCR parameters were used for both outer and inner PCR reactions. The inner PCR reaction contained 1 µl of PCR product from the outer reaction with the same PCR reagents as the outer reaction except the primers, LABY-A and QPX-R2. PCR products from the inner reaction were examined by agarose gel electrophoresis, which confirmed the expected amplicon size of 400 bp.
The PCR conditions for the outer reaction were optimized by standard approaches, according to Haff (1994). The outer reaction was performed as a qPCR reaction to determine the cycle limit for the exponential phase of amplification. Serial dilutions of plasmid DNA from 10 to 106 copies were used as template and prepared in the same way as described in Geraci-Yee et al. (2022). The qPCR thermocycler used was the Mastercycler realplex4 ep gradient S (Eppendorf, Hamburg, Germany) with realplex software (version 2.2) and twin.tec PCR 96 well, semi-skirted, colorless plates (Eppendorf, Hamburg, Germany), sealed with TempPlate RT Optical Film (USA Scientific, Ocala, FL). Each 12.5 μl reaction contained 6.25 μl of Takyon No Rox SYBR MasterMix dTTP Blue (Eurogentec, Fremont, CA), 0.75 µl of nuclease-free water, 1.25 μl of 2 μM forward and reverse primers (QPX-F and LABY-Y, final concentration 200 nM), 2 µl of 50% glycerol, and 1 μl of template DNA. For the first trial, the outer reaction qPCR used a PCR program of 10 minutes at 95°C, followed by 40 cycles of denaturation at 95°C for 30 seconds, anneal gradient from 50-60°C for 1 minute, and extension at 72°C for 2 minutes. Fluorescence was measured for individual wells at the end of each cycle with the detection threshold determined automatically by the qPCR software using the noiseband threshold and automatic baseline setting to determine quantification cycle or Cq values (also known at CT values). Melt curve analysis as well as agarose gel electrophoresis were used to confirm the expected amplicon. The anneal gradient revealed a thermal optimum between 53 and 56°C with PCR efficiencies around 95%, with lower and higher anneal temperatures producing efficiencies below or above the 90-110% accepted range. Since the initial testing of the outer PCR reaction was done at an anneal of 55°C, we decided to use that anneal temperature for the remaining trials, using the PCR program: 10 minutes at 95°C, followed by 40 cycles of 95°C for 30 seconds, 55°C for 1 minute, and 72°C for 2 minutes. We performed primer titration to determine the lowest concentration of primers for the outer reaction. Primer concentrations tested were (forward/reverse, nM): 200/200, 100/100, 75/75, and 50/50. The only combination that had acceptable PCR efficiency was 200/200 nM of forward/reverse primer, with suppression of PCR efficiency observed with the lower concentrations. We also tested the addition of 1% DMSO to the master mix, which did not enhance the PCR efficiency or linearity. The outer reaction using 200 nM of primers was exponential for all concentrations of the standard curve until 25 cycles with a PCR efficiency of 95% and linearity of 0.951.
After testing the outer reaction as a qPCR, we went back to standard PCR to test the number of cycles (5, 10, 15, 20, and 25 cycles) using serial dilutions of linear plasmid DNA from 1 to 105 copies and 3 µl of template to construct the standard curve, as 3 copies represents theoretical limit of detection (LOD) of a PCR reaction (Bustin et al., 2009). In addition, M. quahogii gDNA was used as a positive control. Each 20 µl PCR reaction contained 1.3 µl of nuclease-free water, 2 µl of 25 mM MgCl2, 2 µl of 2 mM dNTPs, 2 µl of 2 µM forward and reverse primers (QPX-F and LABY-Y, final concentration 200 nM), 3.2 µl of 50% glycerol, 4 µl of 5X GoTaq Flexi buffer (colorless), 0.5 µl GoTaq G2 Flexi DNA Polymerase (Promega, Madison, WI), and 3 µl of template DNA (Supplementary File 1 Table S1). The PCR cycle was 95°C for 30 seconds, 55°C for 1 minute, 72°C for 2 minutes (Supplementary File 1 Table S2). After the outer reaction was performed, 1 µl of PCR product was used in the inner qPCR assay, where each reaction contained 6.25 μl of Takyon, 0.625 μl of 2 μM forward and reverse primers (LABY-A and QPX-R2, final concentration 100 nM), 2 μl of 50% glycerol, and 0.125 μl of DMSO (Supplementary File 1 Table S3). The real-time PCR program used was our standard program of 10 minutes at 95°C, followed by 40 cycles of 95°C for 30 seconds, 55°C for 1 minute, 72°C for 1 minute (Supplementary File 1 Figure S1). Melt curve analysis and agarose gel electrophoresis revealed a single peak at 81°C that coincided with the expected 400 bp amplicon. PCR efficiency and linearity were within acceptable limits and therefore did not require additional optimization, compliant with the MIQE guidelines. The best PCR efficiency and linearity were observed after 10 and 15 cycles of the outer PCR reaction, so additional testing was performed at 10, 12, and 15 cycles. From these, the best PCR efficiency and linearity were observed at 12 cycles with an average efficiency of 96.5% and linearity of 0.985. We retested the reduction of primer concentration in the outer reaction to reduce potential carryover into the inner reaction; however, as before, this reduced PCR efficiency. The nqPCR conditions described here and in detail in Supplementary File 1 (detailed methods protocol: Tables S1-3, Figure S1) were the conditions used to construct the standard curve for quantification, determine analytical specificity and sensitivity, and evaluate functionality using environmental samples (seawater and sediment).
2.1.1 Analytical specificity and sensitivity
The nqPCR assay was tested for specificity against species belonging to each of the four groups comprising the cultivated labyrinthulomycetes: labyrinthulids (Labyrinthula sp. isolate KIE13), aplanochytrids (Aplanochytrium stocchinoi isolate GSB06), oblongichytrids (Oblongichytrium sp. isolate 606), and several thraustochytrids (Aurantiochytrium limacinum ATCC MYA-1381, Schizochytrium aggregatum ATCC28209, Thraustochytrium aureum ATCC34304, and Japanochytrium marinum ATCC 28207). gDNA was extracted using the NucleoSpin Genomic DNA Tissue kit (Macherey-Nagel, Inc., Bethlehem, PA), following the manufacturer’s protocol for cultured cells, and diluted to 0.5 ng/µl for use as template DNA in the assay. Both melt curve and agarose gel electrophoresis analyses were used to evaluate the assay’s specificity. The sensitivity or limit of detection (LOD) of the assay was tested by determining the number of failed reactions at the lowest concentration of the standard curve (3 copies). The standard curve was performed to validate the LOD of 3 copies using at least 6 replicates per run, totaling 42 reactions over 5 independent determinations.
2.1.2 Inter-run calibrator
Due to the large number of samples analyzed with this assay, it was impossible for all samples to be run on the same plate. Therefore, an inter-run calibrator (IRC), also known as an inter-plate calibrator (IPC), was used to correct run-to-run differences (Bustin et al., 2010) and a single, highly precise standard curve was used for quantification (Svec et al., 2015) following the general strategy described in Geraci-Yee et al. (2022). All Cq values, including the standard curve, were corrected by subtracting the IRC from the individual run and adding the average IRC value for all plates (Equation 1) (Kubista, 2010). Varying concentrations (152, 15.2, and 1.52 pg/µl) of M. quahogii gDNA (from mixed isolates) run in at least triplicate were tested as the IRC to determine the most stable and robust calibrator. The IRC used was 152 pg/µl of M. quahogii gDNA.
2.2 Assay evaluation
Environmental samples (sediment and seawater) were collected from a variety of sampling sites across Long Island, New York, during 2014 and 2015 (Figure 2 and Supplementary File 2 Table S5), including a QPX-enzootic site in Barnstable, Massachusetts, as part of a large-scale hard clam field survey. Sediment was collected using a ponar sediment grab (0.04 m2) and surface sediment (top 2 cm) was homogenized and stored in a sterile Whirl-Pak®. Surface (SSW) and bottom (BSW) seawater were collected using a 2 L Niskin bottle (General Oceanics, Miami, FL). All samples were put on ice for transport back to the laboratory and processed immediately within several hours. SSW and BSW samples were inverted gently to mix and up to 350 ml was filtered under low vacuum pressure "< 100 in Hg" on a 0.4 µm (47 mm) polycarbonate filter (GE Osmonics Inc., Minnetonka, MN). Seawater filters were carefully folded using sterile forceps and stored in cryovials. Seawater filters and sediment were stored at -80°C until DNA extraction using the MO BIO PowerSoil DNA isolation kit (Qiagen, Hilden, Germany) according to the manufacturer’s protocol. For sediment samples, an average of 314 ± 61 (SD) mg sediment was used for DNA extraction. For BSW samples an average of 333 ± 41 (SD) ml and for SSW samples an average of 331 ± 50 (SD) ml was used for DNA extraction. Extracted DNA was quantified using Quant-iT PicoGreen (Molecular Probes, Eugene, OR). Most samples had low DNA concentrations, so we did not assess DNA purity with Nanodrop (Thermo Fisher Scientific, Wilmington, DE), as reliability of purity ratios below 20 ng/µl is often compromised. Sample DNA was stored at -20°C until being used in the nqPCR assay. Each sample was run in triplicate using 3 µl of template DNA in the outer reaction and 1 µl of the outer PCR product in the inner qPCR assay. Cq values were accepted if the standard deviation was less than 0.5 for at least two of the three replicates; samples that did not meet this criterion were rerun until replicates agreed. Melt curve and agarose gel electrophoresis analysis were performed to ensure specificity (Tm at 81°C and 400 bp amplicon). Furthermore, a representative set of nqPCR products were purified and Sanger sequenced using the inner reaction forward primer (LABY-A) to confirm assay specificity.
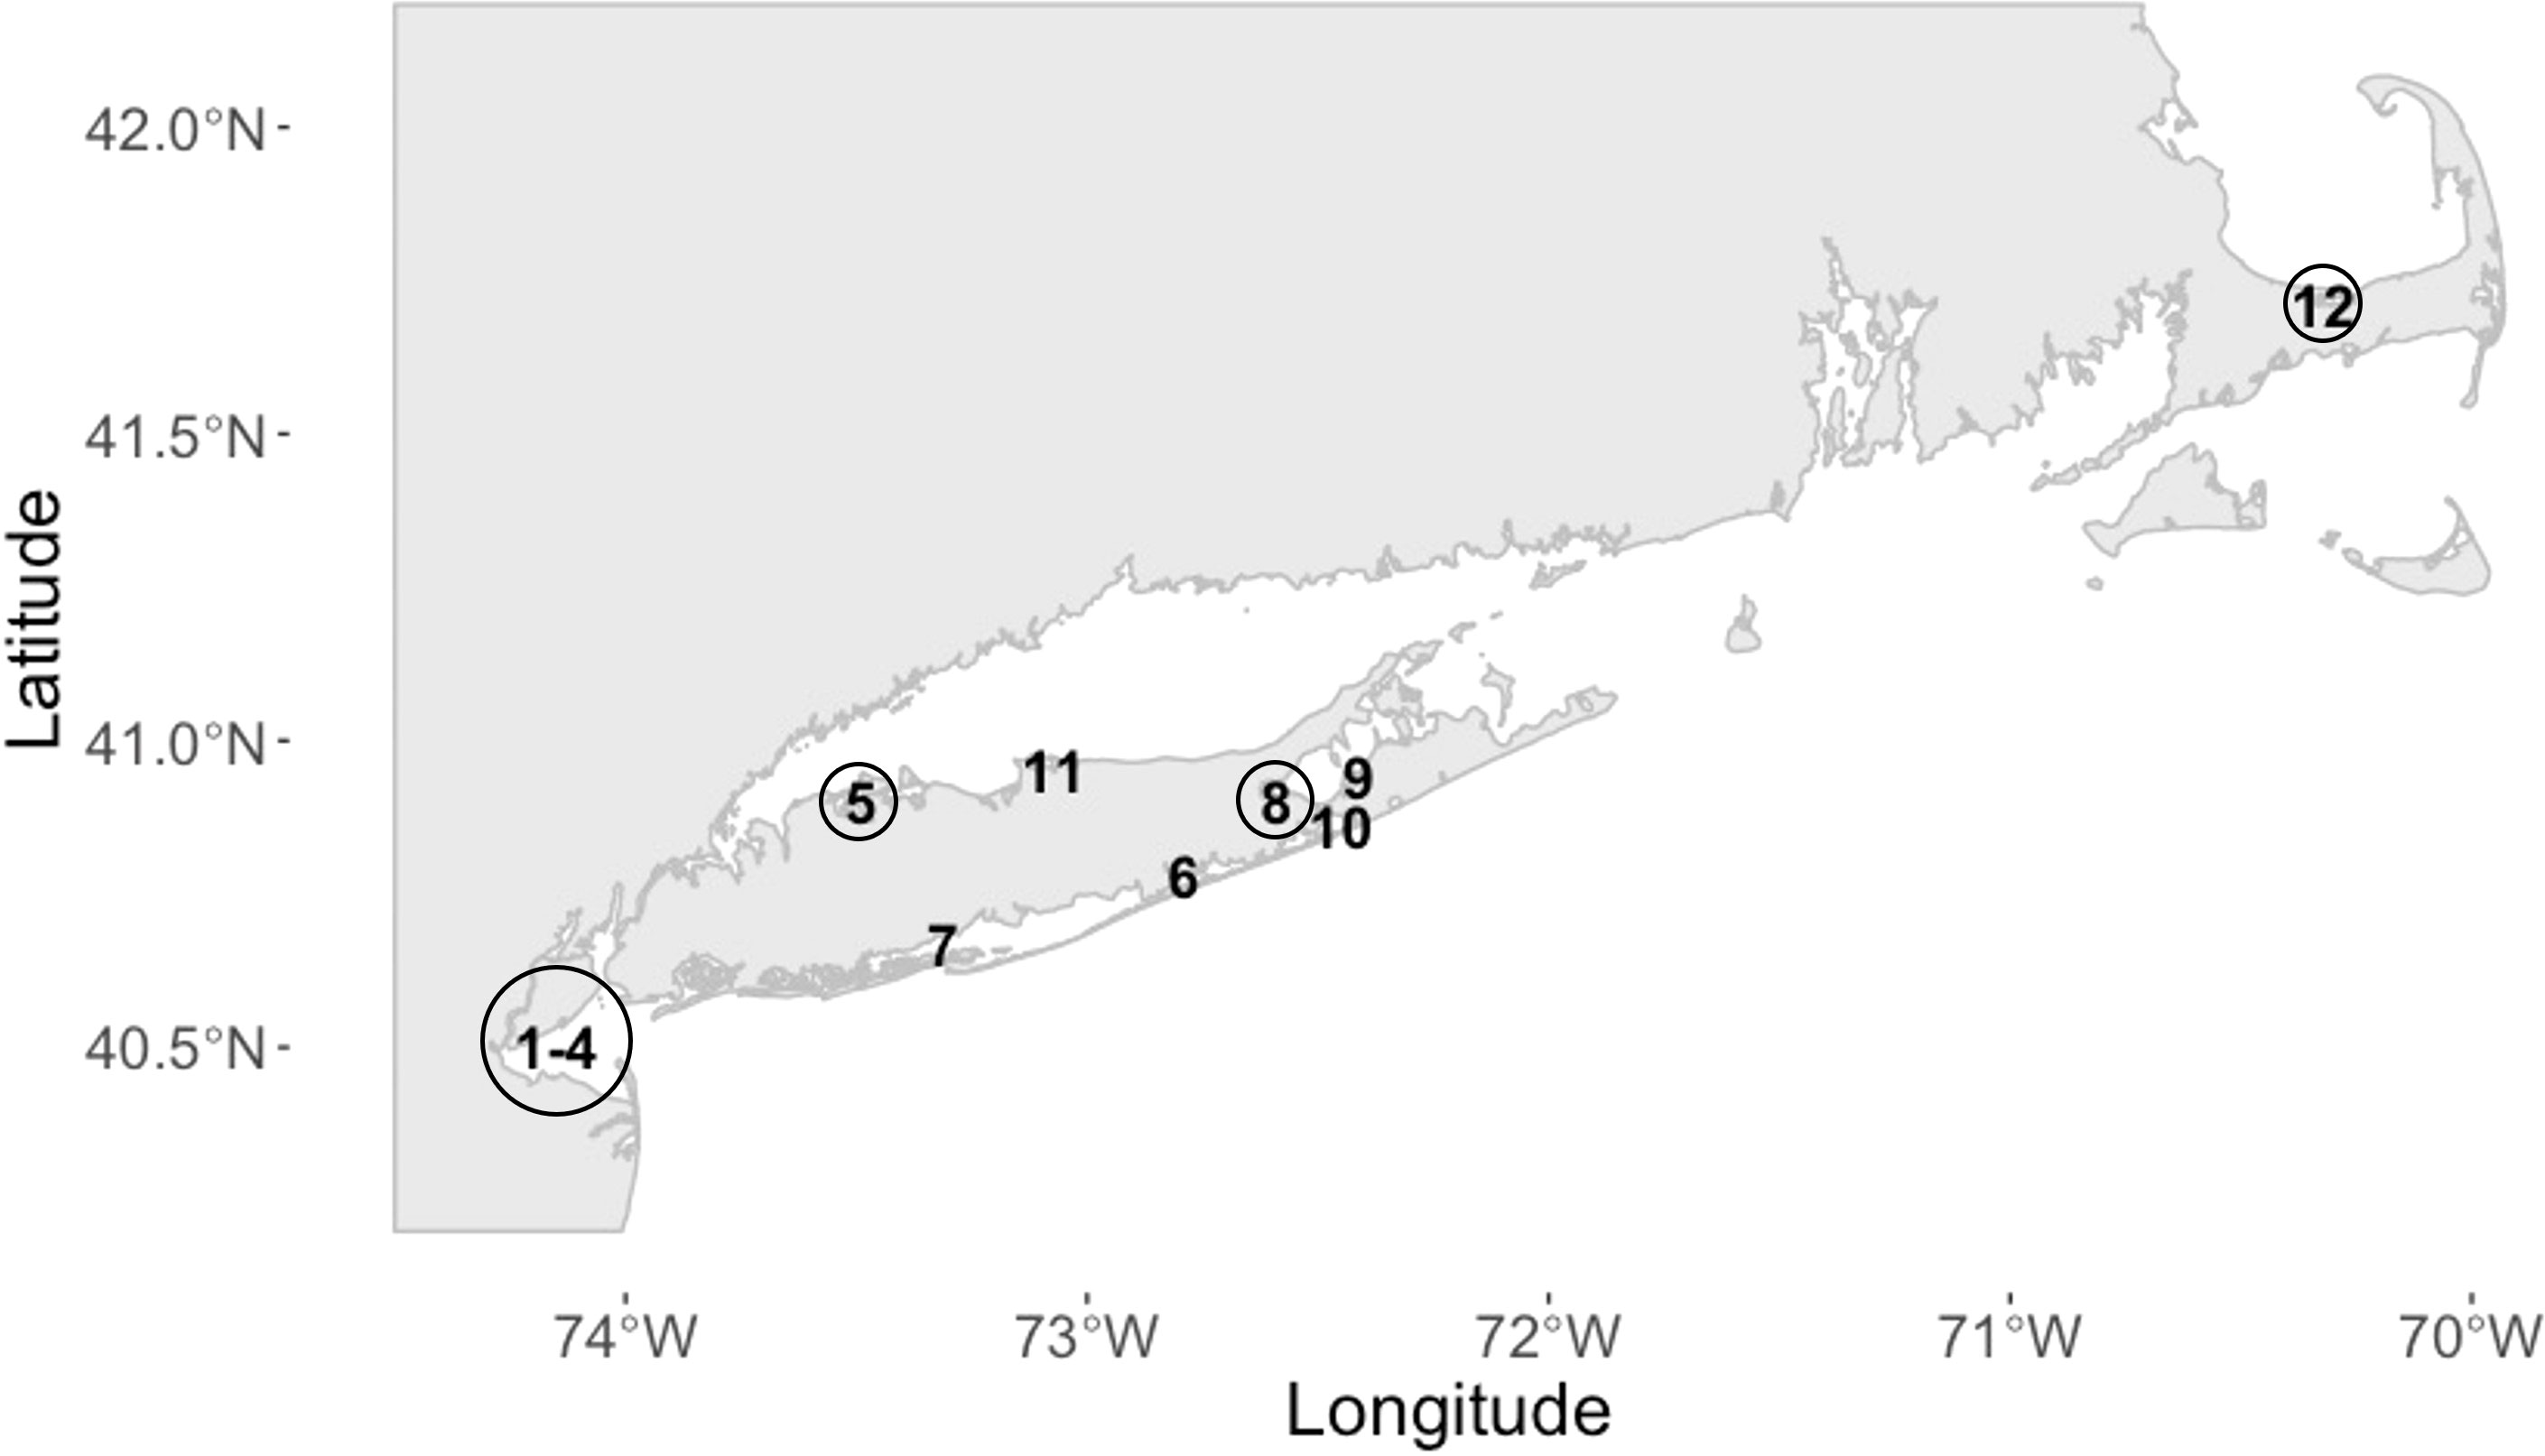
Figure 2 Location of sampling sites in Long Island, New York, and Cape Cod, Massachusetts (MA). 1-4 = Raritan Bay (RB), 5 = Oyster Bay (OB), 6 = Moriches Bay (MB), 7 = Babylon Bay (BB), 8 = Birch Creek (BC), 9 = Peconic Estuary (PE), 10 = Shinnecock Bay (SB), 11 = Port Jefferson Harbor (PJ), and 12 = Massachusetts (MA). Sites with a previous history of QPX disease are circled (RB, OB, BC, and MA; circle size is arbitrary). Location coordinates are provided in Supplementary File 2; Table S5.
2.2.1 Inhibition testing
Due to the large number of samples analyzed, it was impractical to test each sample for inhibition. Therefore, inhibition testing was carried out on a representative set of samples. After nqPCR, at least 6 samples of each type (i.e., sediment, BSW, and SSW) were assessed, including negative and a range of positive samples from low to high copy number, representing samples from each sampling bay, season, and year. Since there were no samples with enough M. quahogii to perform the dilution series spanning several orders of magnitude needed to assess PCR amplification efficiency, 17 µl of sample template DNA from these samples were spiked with 2 µl of 107 M. quahogii linear plasmid copies/µl (final concentration of 106 copies/µl). The spiked sample template DNA was used to create a dilution series, in the same manner as the standard curve. M. quahogii-spiked sample PCR efficiency and linearity were determined, and the efficiency was considered acceptable if it was within 10% of the efficiency of the standard curve (Irwin et al., 2012) with a linearity of at least 0.98 (Johnson et al., 2013).
3 Results
3.1 Assay performance
We assessed assay performance as efficiency and linearity of the standard curve over 5 independent trials each with at least 6 technical replicates (Figure 3). The average PCR efficiency was 99.21% with a range of 96 to 101% and linearity > 0.988, in compliance with the MIQE guidelines (Bustin et al., 2009; Bustin et al., 2010). There were 2 failed reactions of 42 total reactions (4.76%) at the LOD of 3 copies, which is within the failed reaction limit (5%) for the LOD according to the MIQE guidelines. The Cq standard deviation (SD) of replicates of the individual points on the standard curve from the 5 independent trials ranged from 0.36 to 0.89. These Cq SDs represent the raw Cq values not corrected with the IRC; therefore, these Cq SDs are impacted by run-to-run variation. No amplification was observed in the qPCR or nqPCR negative control (no template added) after implementation of the quality control protocols.
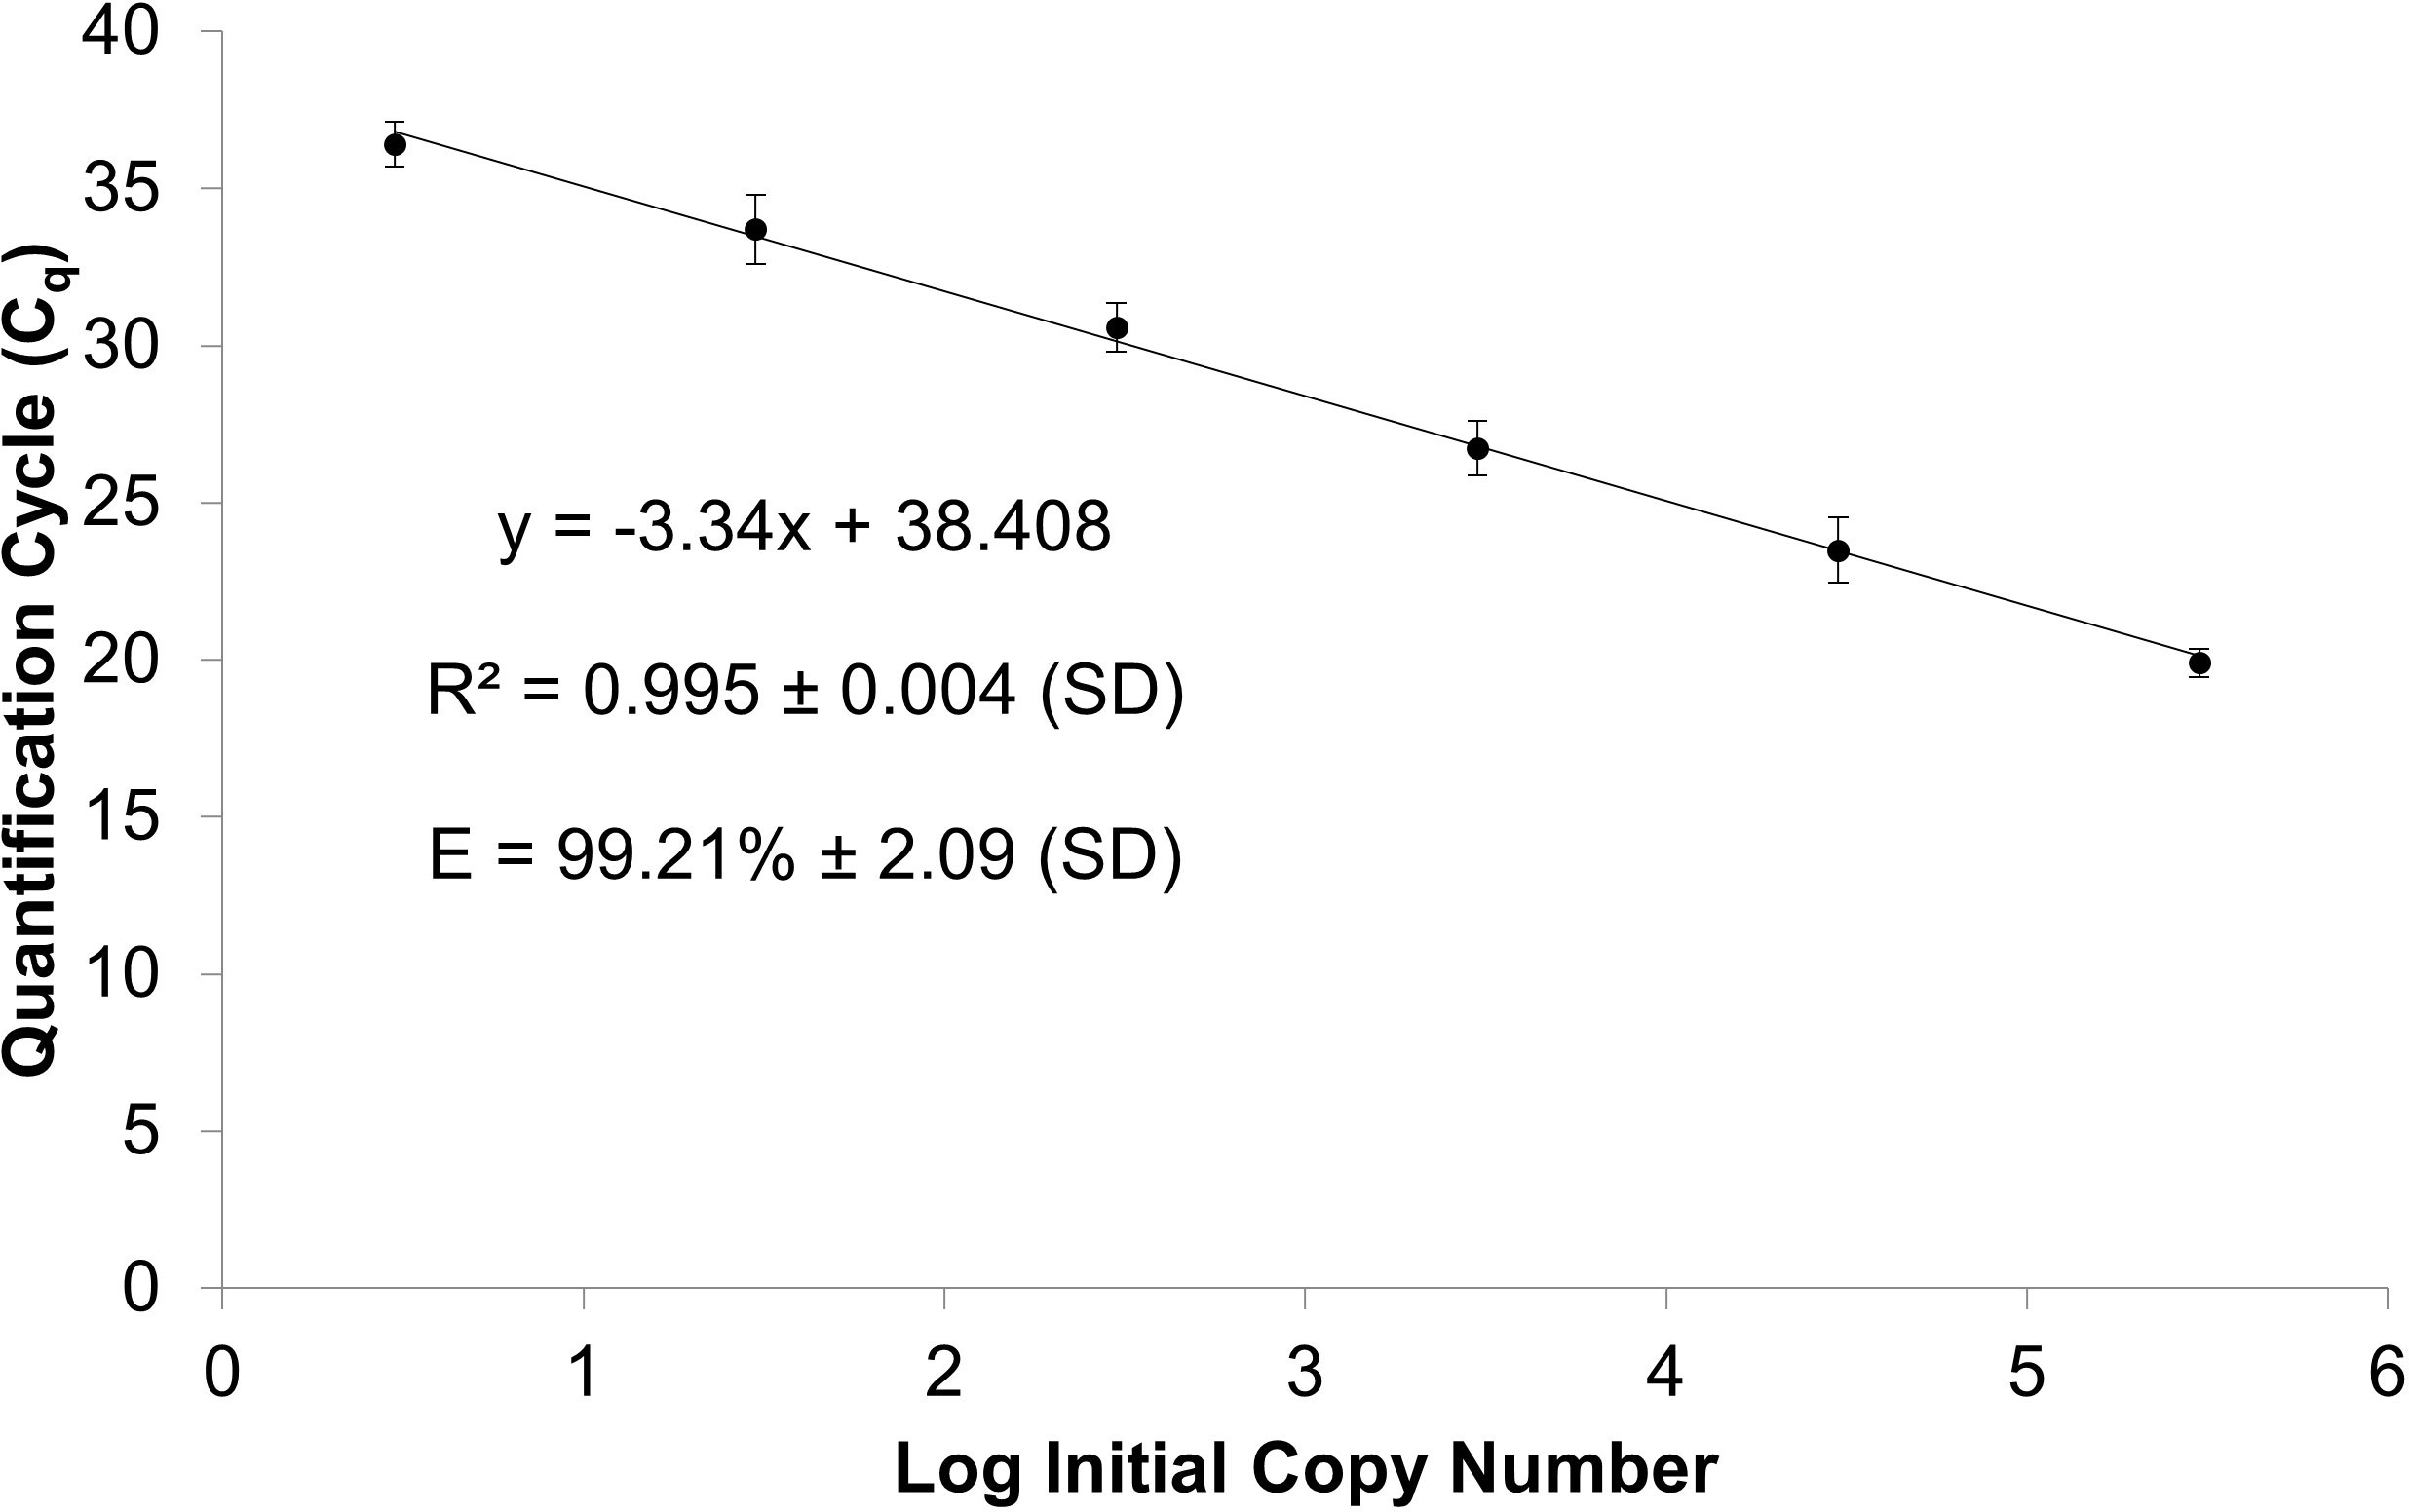
Figure 3 Standard curve of linearized plasmid serial dilutions containing 3 to 3 x 10⁵ M. quahogii copies averaged over 5 independent trials using at least 6 replicates per run with 95% confidence intervals (CI). The efficiency (E) and linearity (R2) are expressed as the average and standard deviation (SD).
The assay was specific for M. quahogii as revealed by specificity testing (Table 1). While there were late amplification of products (high Cq values) for most of the labyrinthulomycetes tested, melt curve analysis and agarose gel electrophoresis revealed different melt temperatures (Tm) and product sizes. Cq values for these samples ranged from 31.6 to 37.2 with large SDs (> 0.5) between technical replicates, suggesting that the PCR was heavily influenced by stochastic processes. Most of the labyrinthulomycetes tested had a product that was ~150 bp with a broad Tm peak between 78-79°C, likely representing a PCR artifact, such as a large primer concatemer. Additionally, Aurantiochytrium and Aplanochytrium had a larger product (~450 bp) associated with a Tm peak around 80°C. We think this is an rRNA amplification product produced in the absence of the M. quahogii target, when the leftover general labyrinthulomycete LABY-Y primer interacts with the nonspecific LABY-A primer in the inner qPCR reaction. These non-specific products were very faint, and we were unable to isolate and verify them by sequencing.
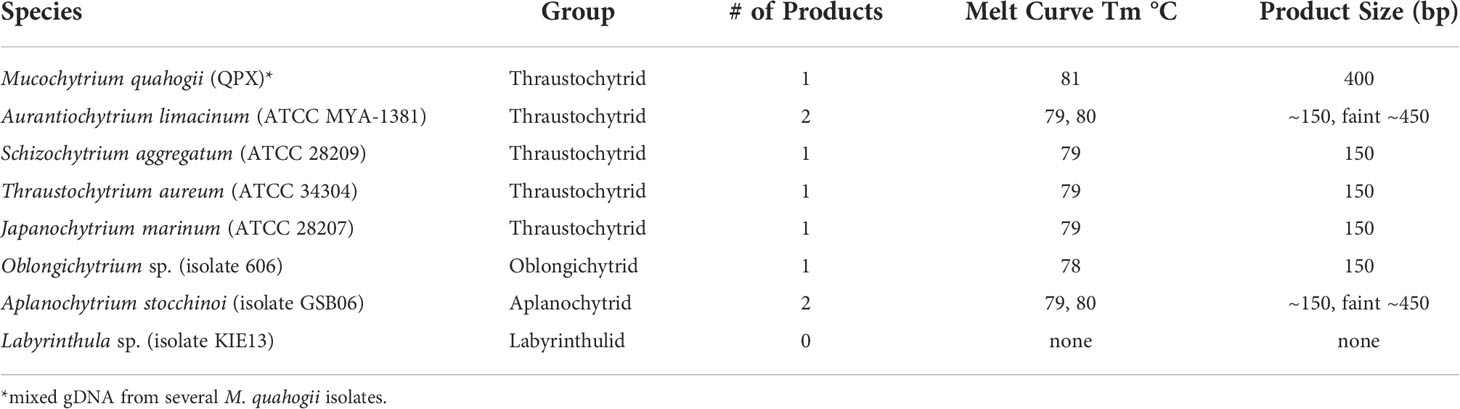
Table 1 Results from melt curve and gel electrophoresis analyses from the nqPCR assay’s analytical specificity testing.
The mean Cq value of the IRC across 15 independent runs (1 run for the standard curve and 14 runs with the environmental samples) was 14.3 with a SD of 0.34, indicating excellent inter-run variation (reproducibility). A highly precise, robust standard curve consisting of 8 replicates was run and Cq values were corrected using the IRC and Equation 1 (Supplementary File 1 Table S4 and Figure S4). The replicates of this standard curve had excellent intra-run variation (repeatability) with SDs less than 0.5 for each concentration. The standard curve gave an efficiency of 99.37% and linearity of 0.996. The Cq corrected standard curve was used to convert IRC-corrected Cq values into M. quahogii copy number using Equation 2. Using the IRC as a measure of assay reproducibility, the IRC raw Cq values were translated into copy number using Equation 2 to determine the coefficient of variation (CV) between independent runs, which was 20%.
3.2 Assay evaluation
A total of 206 samples collected from 12 sampling sites from May to November during 2014 and 2015, comprising 71 sediment, 64 BSW, and 71 SSW samples, were analyzed with the nqPCR assay. The average DNA concentration (ng/µl) for sediment samples was 15.74 ± 6.74 (SD) with a range of 3.99 to 36.98, for BSW samples was 13.33 ± 8.49 (SD) with a range of 1.76 to 37, and for SSW samples was 13.13 ± 9.67 (SD) with a range of 1.18 to 58.48. Of the 206 samples, 154 (75%) were positive for M. quahogii by nqPCR, with 89% of sediment samples, 83% of BSW samples, and 56% of SSW samples positive (Figure 4). The average Cq SD of replicate positive samples was 0.31 ± 0.19 (SD) indicating excellent intra-run variation (repeatability). Melt curve analysis of nqPCR products revealed a single peak at 81°C (Figure 5 and Supplementary File 1 Figure S2), which was the same observed Tm of both M. quahogii gDNA and plasmid standards. From the positive samples, 6 samples from each sample type (n=18) were randomly selected and visualized by agarose gel electrophoresis, from which the target amplicon was gel-purified and Sanger sequenced. All 18 samples had > 99% sequence identity to M. quahogii (QPX) sequences in NCBI GenBank. Average sample PCR efficiency and linearity were 91.8% ± 3.3 (SD) and 0.99 ± 0.007 (SD) (Table 2), suggesting that inhibition was minimal with PCR efficiencies within 10% of the efficiency of the standard curve used for quantification.
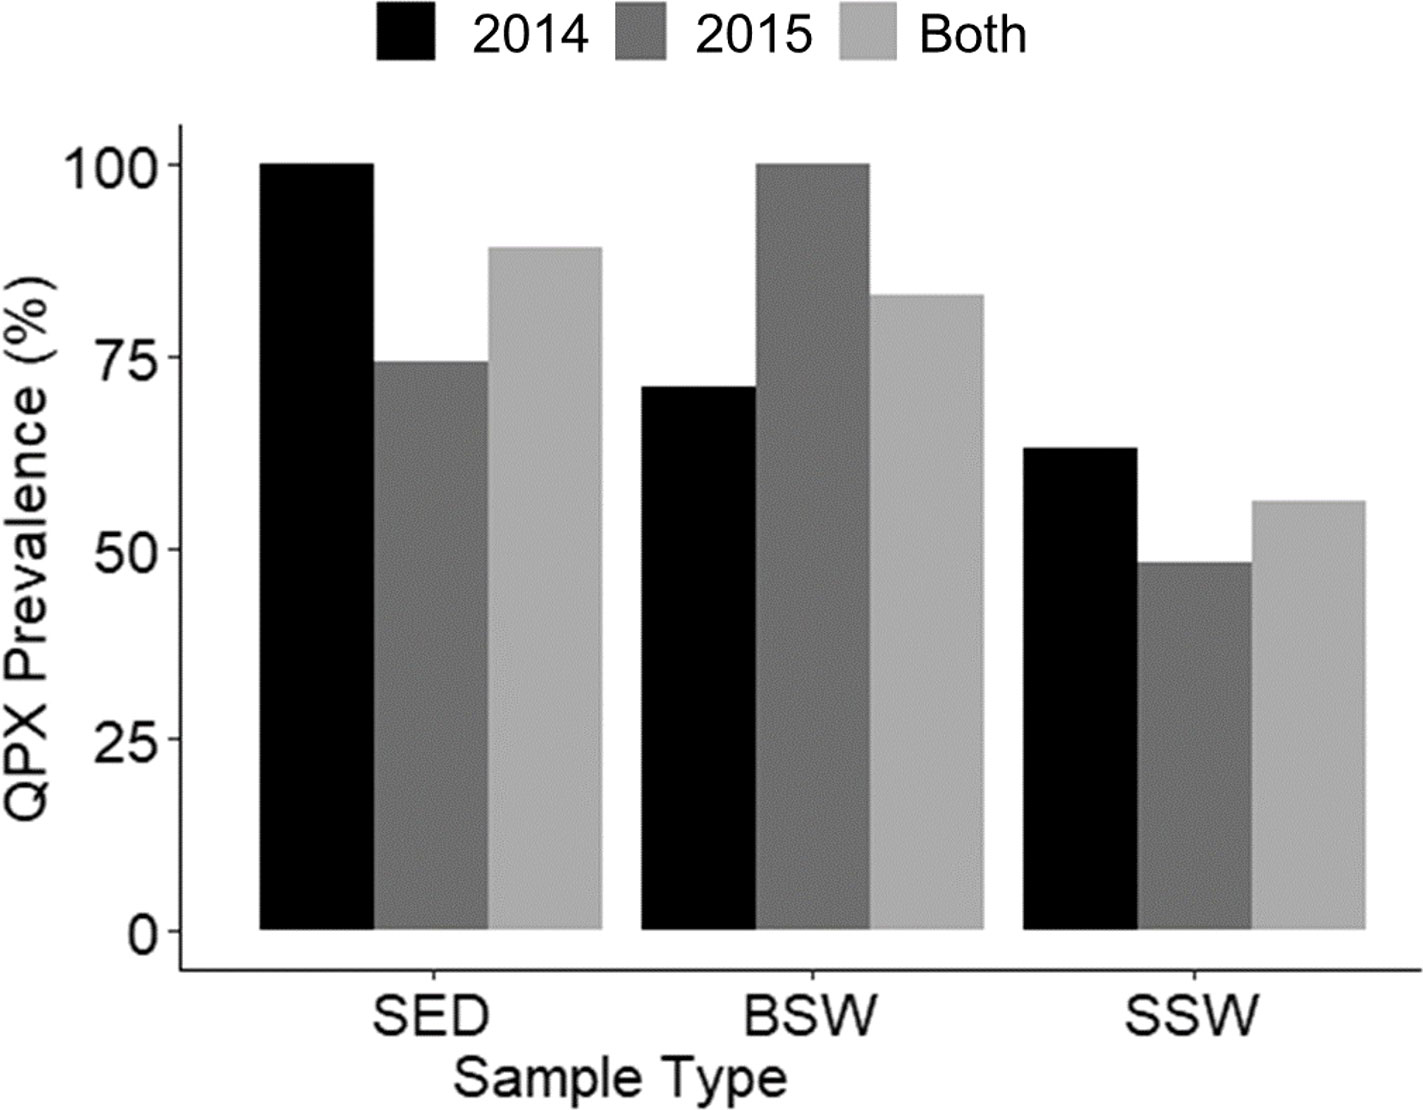
Figure 4 M. quahogii (QPX) prevalence (% positive samples) by sample type and year. SED represents sediment samples, BSW represents bottom seawater samples, and SSW represents surface seawater samples.
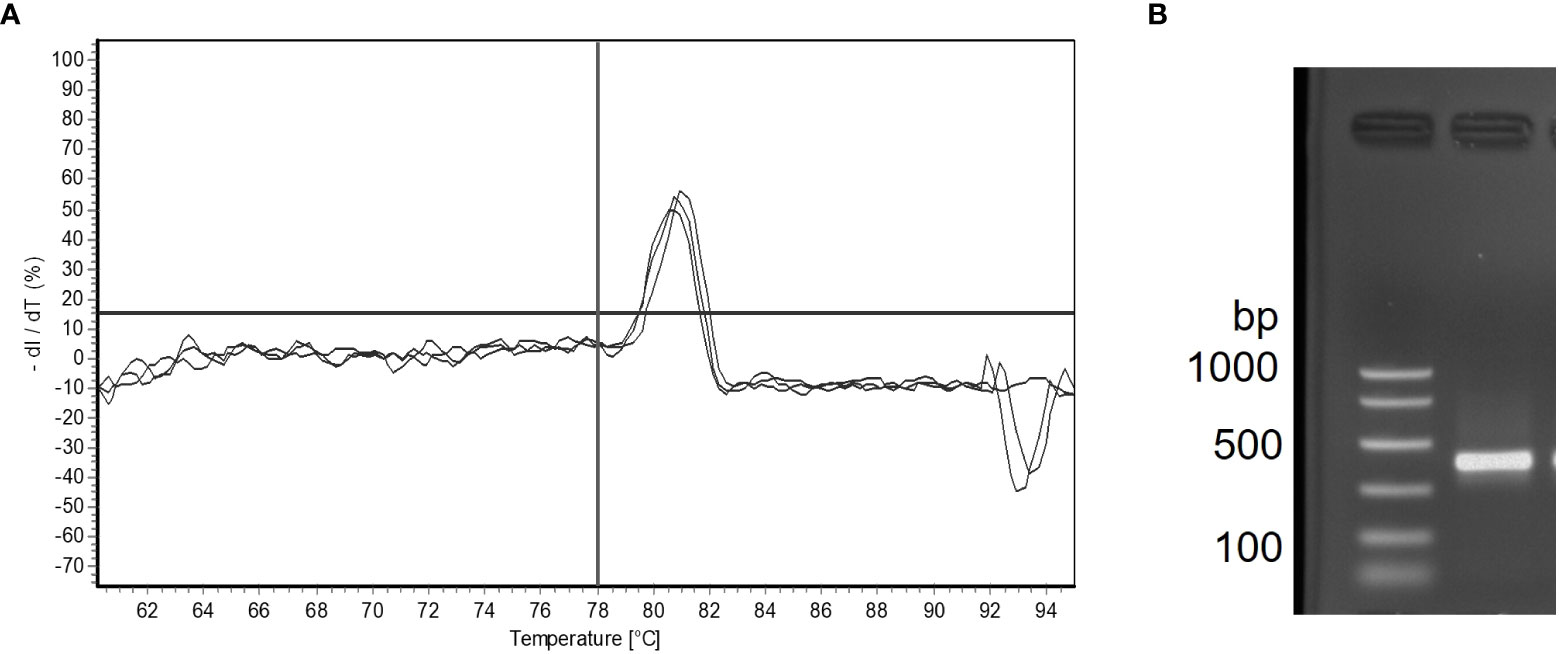
Figure 5 Melt curve analysis showing three technical replicates with one product melting at 81°C in a M. quahogii positive bottom seawater (BSW) sample (A). The horizontal line is oriented at 0% dl/dT and the vertical line is oriented at 78°C. Gel electrophoresis analysis for the same sample showing one product at ~400 bp (B). The nqPCR product was sequenced and was > 99% identical to M. quahogii (QPX) sequences in GenBank.
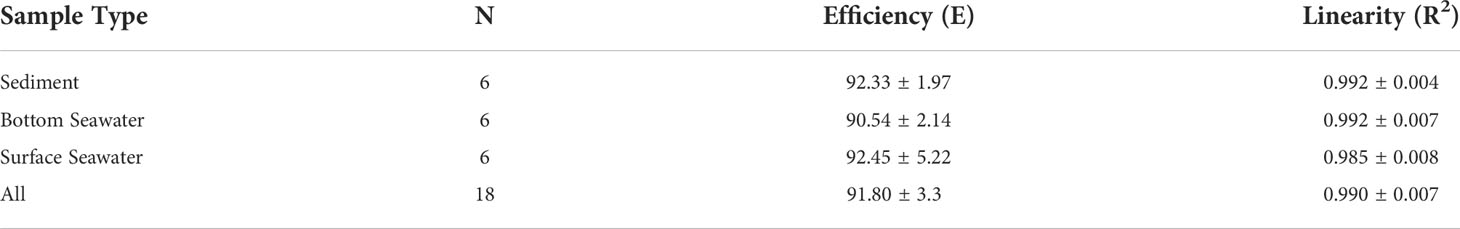
Table 2 Mean ± standard deviation (SD) of PCR efficiency (E) and linearity (R2) of spiked sample serial dilutions for inhibition testing by sample type from a mix of representative samples.
Close examination of amplification and melt curves revealed that some samples had linear instead of exponential quantification curves with a broad melt curve peak (Tm ~72°C). The linear amplification curves were easily identified as they also crossed the threshold very early (low Cq value; Supplementary File 1 Figure S3). Agarose gel electrophoresis revealed these samples had a smear, sometimes with the target M. quahogii band. These samples were rerun with either 1 µl of template DNA in the outer PCR reaction (as opposed to 3 µl) or 1:10 and/or 1:100 dilutions of the outer PCR product in the inner qPCR. Either reduction of the template DNA in the outer PCR reaction or dilution of the outer reaction PCR product was effective in producing exponential amplification, and removed the smear when visualized in a gel, leaving the target M. quahogii amplicon if the sample was positive; in the case of negative samples, the smear was effectively removed with no amplification observed. The estimated M. quahogii concentrations of the 1:10 and 1:100 dilutions for individual samples were in agreement. Of the 206 samples tested, 165 (80%) did not require adjustment to the protocol, while 5 samples (2%) required 1 µl of template DNA used in the outer PCR reaction, plus 24 (12%) samples required a 1:10 dilution and 12 (6%) samples required a 1:100 dilution of the outer PCR product for the inner qPCR reaction. These samples either contained too much DNA or PCR product for the inner qPCR assay to function properly or promoted an artifactual interaction between the general labyrinthulomycete primers. Average sample DNA concentration was slightly greater for the sediment and BSW samples that required adjustment to the protocol (e.g., less template or dilution of outer product) in comparison to the samples that did not require adjustment to the protocol (sediment mean DNA concentration 17.53 ng/µl, n=12 vs. 15.49 ng/µl, n=59 and BSW 18.68 ng/µl, n=23 vs. 10.24 ng/µl, n=41; for SSW, DNA concentration was similar between samples that required adjustment or did not: 13.6 ng/µl, n=6 v. 13.09 ng/µl, n=65). Occasionally, some M. quahogii-negative samples had late amplification (high Cq values past the LOD) with broad melt curves and a Tm between 77-79°C, sometimes accompanied by the Tm of the smear (~72°C). When visualized on a gel, the amplicon was smaller (100-150 bp) than the M. quahogii amplicon (~400 bp) and very faint, similar to the non-specific products found during specificity testing (Table 1).
From the mean corrected Cq value of each sample (Equation 1), the M. quahogii (QPX) copy number was determined using Equation 2, and the number of copies per mg sediment or ml seawater was determined using Equation 3, where 100 µl represents the DNA elution volume.
The concentration of M. quahogii ranged from below the detection limit of the assay (or negative) to 703 copies/mg sediment, 2,980 copies/ml BSW, and 176 copies/ml SSW with mean concentrations of 93 copies/mg sediment, 241 copies/ml BSW, and 7 copies/ml SSW (Figure 6 and Table 3). We converted M. quahogii gene copies to cellular abundance, using 440 copies/mononucleate cell as described in Geraci-Yee et al. (2022), assuming that the rDNA copy number of M. quahogii cells in culture is similar to that of M. quahogii in the environment. Aspects of the M. quahogii nqPCR assay for MIQE compliance are summarized in our modified version of the MIQE checklist (Table 4) (Bustin et al., 2009; Bustin et al., 2010; Geraci-Yee et al., 2022).
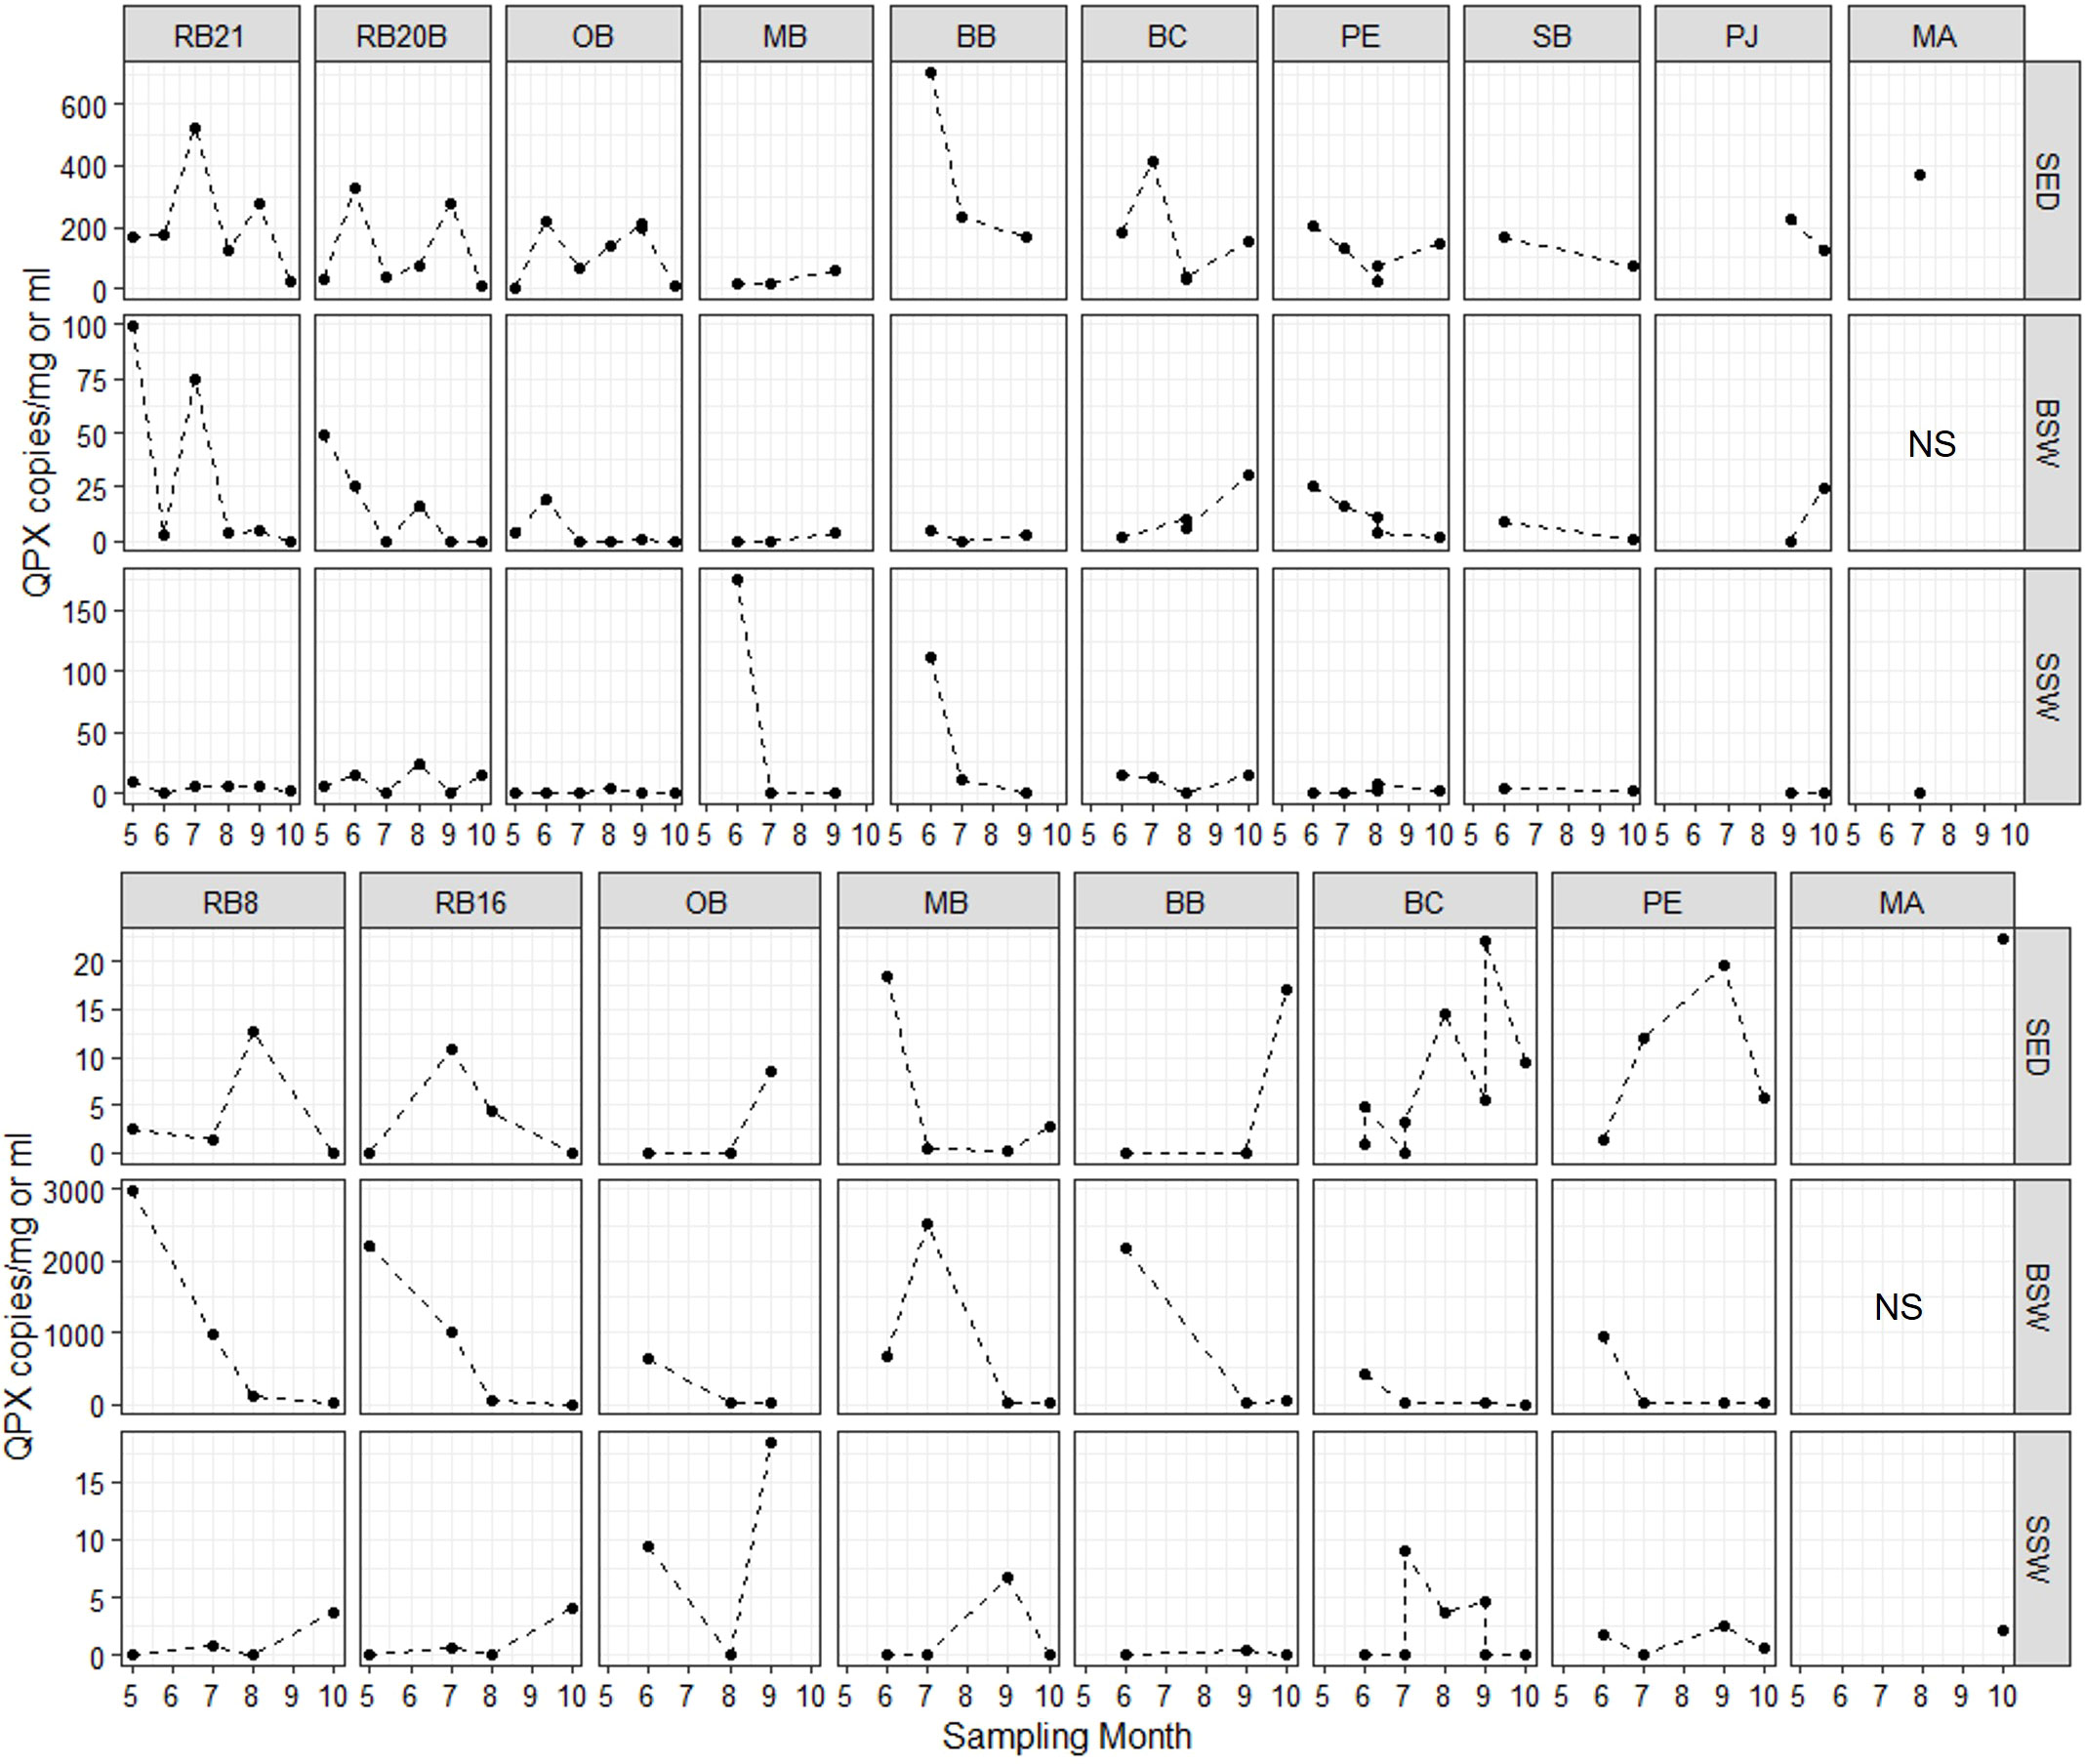
Figure 6 M. quahogii (QPX) abundance in copies per mg sediment or ml seawater as determined by the nqPCR assay. Note the varying scales used in the y-axis per each row. SED, sediment; BSW, bottom seawater; and SSW, surface seawater; NS, no sample (intertidal site).
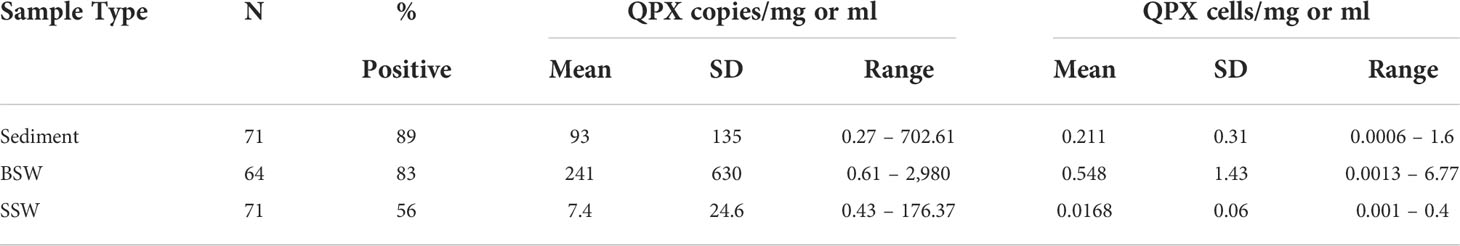
Table 3 Summary statistics of M. quahogii (QPX) concentration in 18S gene copies per mg sediment or ml seawater, as well as theoretical conversion to cellular concentration using 440 copies per mononucleate cell.
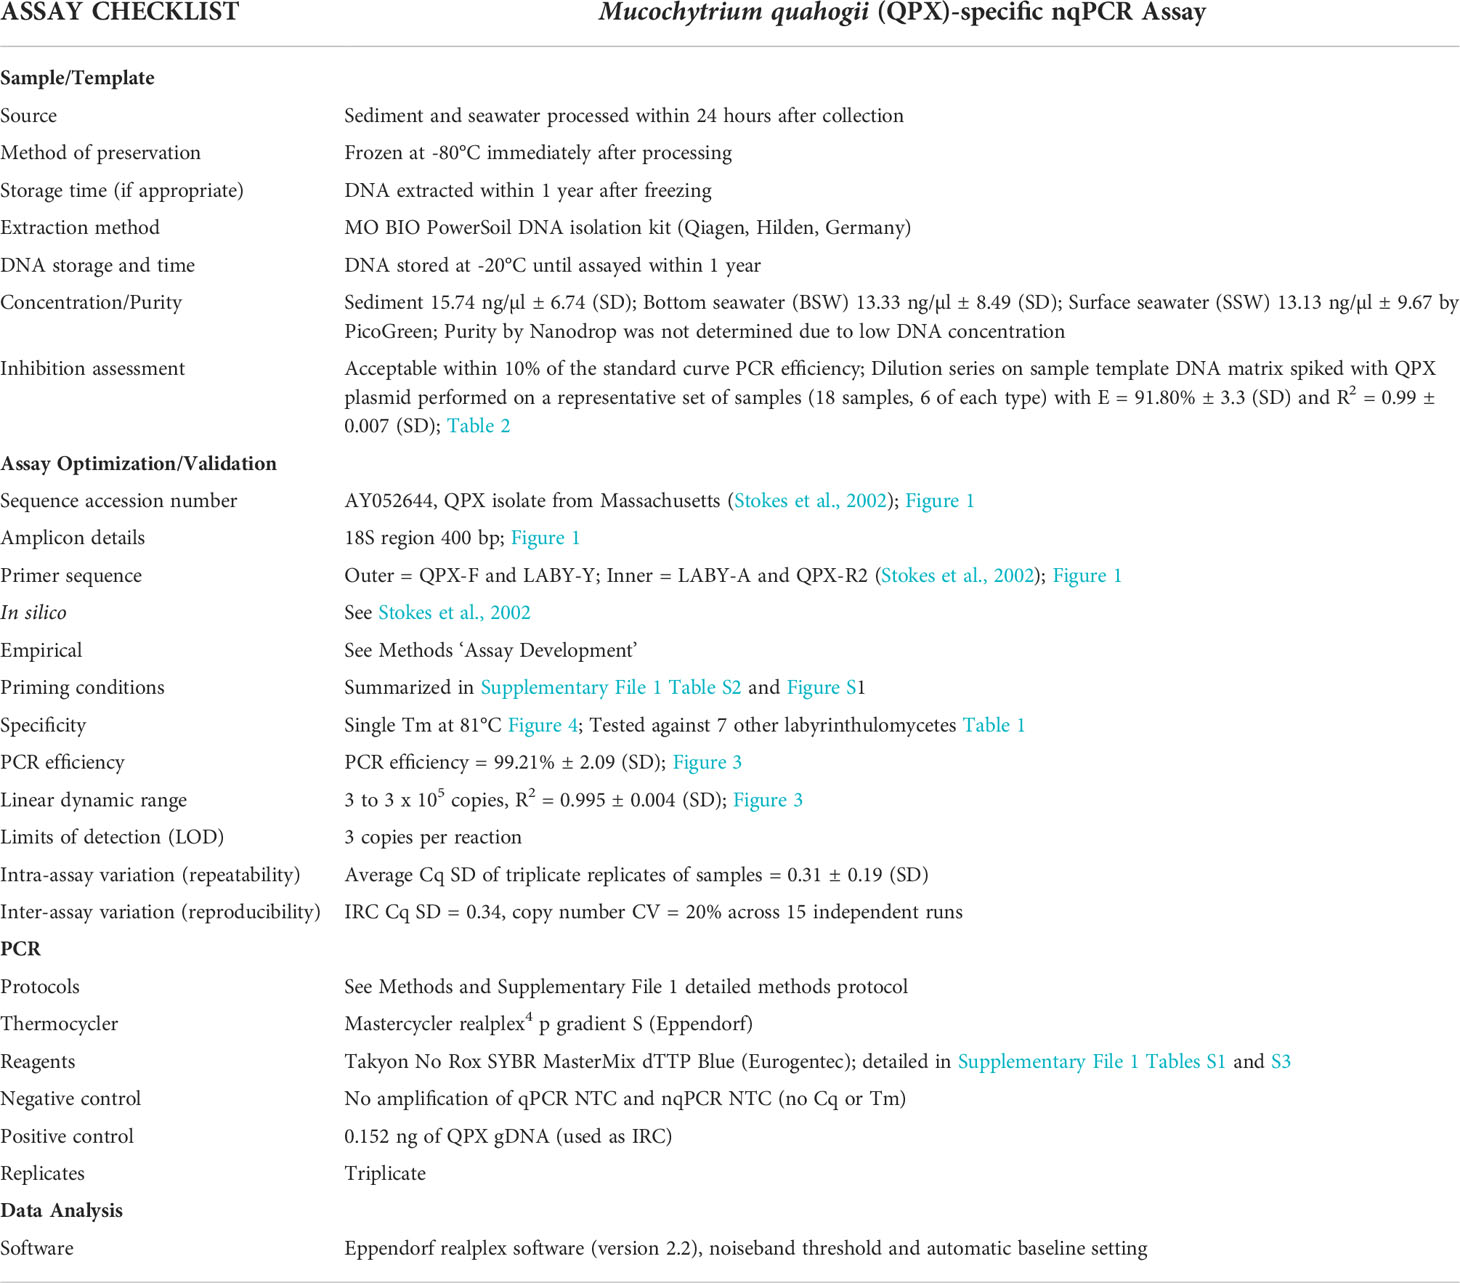
Table 4 Modified MIQE checklist for the nqPCR assay.
3.3 M. quahogii in New York waters
M. quahogii was detected at every sampling time point in at least one of the environmental sample types, except at BC on July 14, 2015 (sediment and SSW were negative and there was not a BSW sample since the site can be shallow depending on the tides). M. quahogii was detected in 100% of sediment samples in 2014 and in 100% of BSW samples in 2015 (Figure 4), and although M. quahogii appeared more prevalent (% positive samples) in sediment and BSW than SSW samples, the difference was not significant (Kruskal-Wallis rank sum test). The abundance of M. quahogii varied by orders of magnitude among samples of each type, suggesting that while M. quahogii is widespread, it has very patchy spatiotemporal distribution (Figure 6). Coinciding with the difference in sediment and BSW prevalence between years was significantly greater M. quahogii abundance in sediment in 2014 than in 2015 (p=6.25E-11) and significantly greater M. quahogii abundance in BSW in 2015 than in 2014 (p=6.24E-05) (Wilcoxon rank sum test; Supplementary File 2 Table S6 and Figure S5). Environmental metadata revealed than 2014 was a “wetter” (more freshwater, lower salinity) year compared to 2015 (less freshwater, higher salinity) (Supplementary File 2; Table S7), which may account for the observed differences, as changes in precipitation can affect many other environmental factors, including salinity, delivery of terrestrial organic matter, and production of marine organic matter, particularly for thraustochytrids (Ueda et al., 2015; Geraci-Yee, 2021). Otherwise, there were no clear patterns in distribution of M. quahogii. There were no significant differences in M. quahogii abundance by QPX disease history (sites with and without a history of QPX disease in hard clams), sampling site, or sampling month (Supplementary File 2; Table S6). Moreover, M. quahogii abundance was not significantly correlated to measured environmental metadata: seawater temperature, salinity, or dissolved oxygen (Spearman’s rank order method).
4 Discussion
The MIQE-compliant M. quahogii-specific nqPCR developed in this study is sensitive enough to detect and quantify M. quahogii in sediment and seawater samples against the background of other labyrinthulomycetes. Although the final amplicon size is larger than traditionally used in qPCR assays, adjustment to the extension time and use of a SYBR-based assay demonstrates that the assay functions properly within the MIQE guidelines and accepted qPCR practices (Bustin et al., 2009; Bustin et al., 2010). The nested design enabled the detection of M. quahogii in 75% of the environmental samples tested, representing a significant increase from the non-nested qPCR assay used by Liu et al. (2009), which was only able to detect M. quahogii in 4 of 43 sediment samples (9%) and none of 40 seawater samples, even though we cannot rule out the remote possibility that abundance of M. quahogii may have changed in the environment over the decade that separates both studies. M. quahogii prevalence in our 2014-2015 environmental samples from New York (89% of sediment, 83% of BSW samples, and 56% of SSW) was similar to the 55% of seawater and 46% of sediment samples from QPX disease enzootic sites in Massachusetts that were positive using a non-quantitative nested PCR assay (Gast et al., 2006; Gast et al., 2008). Although the M. quahogii nqPCR assay did occasionally produce non-specific products, this only happened in the absence of the M. quahogii target and could be easily identified by melt curve analysis (lower Tm compared to the M. quahogii Tm) and/or agarose gel electrophoresis. Given the many rounds of PCR (52 total cycles) and use of four primers, including two general labyrinthulomycete primers, the non-specific products could arise from PCR artifacts such as large primer dimers or from real amplification of non-target rRNA genes. The smaller artifact bands (100-150 bp) in the environmental nqPCR were similar to those seen in the specificity testing using other labyrinthulomycetes (Table 1).
For the few M. quahogii-positive sediment samples, Liu et al. (2009) calculated concentrations ranging from 35 to 215 M. quahogii cells/mg sediment with a mean of 117.5 cells/mg ± 88.4 (SD), which are much higher than the estimates obtained from this nqPCR assay (Table 3). As discussed by Geraci-Yee et al. (2022), the Liu et al. (2009) values likely represent overestimation derived from the use of circular plasmid for the standard curve, lower copy number conversion to cellular concentration (181 vs. 440 copies/cell), and correction factors applied for PCR inhibition and DNA recovery rate of the extraction method. Due to a combination of improvements in our methods, from DNA extraction to following the MIQE-recommended dilution series approach to determine PCR efficiency (revealing negligible PCR inhibition, Table 2) rather than an alien spike (Bustin et al., 2009; Bustin et al., 2010), we can now avoid such potentially inflationary correction factors. With their greater PCR inhibition, Liu et al. (2009) more often needed to dilute the template DNA, which may sometimes have reduced the M. quahogii target DNA to below the detection limit of the assay, generating false negatives.
Measured by nqPCR, M. quahogii abundance was highly variable but typically less than 1 cell/ml or mg in seawater and sediment (Table 3, Figure 6), with maximums of 0.4 cells/ml SSW, 6.77 cells/ml BSW, and 1.6 cells/mg sediment, suggesting that M. quahogii does not exist at high densities in environmental samples. Supporting these cellular concentration estimates are the low abundances found in Gast et al. (2008) by in situ hybridization in macrophytes and scraping of detritus with less than 5 M. quahogii cells per slide for each sample examined. Taken qualitatively, this suggests that M. quahogii is not particularly abundant even when associated directly with potential substrates like macrophytes and detritus.
To our knowledge only one study has attempted to quantify individual genera of labyrinthulomycetes. Nakai et al. (2013) were able to quantify two genera, Aurantiochytrium and Oblongichytrium, from seawater in coastal Japan. Mean (± SD) concentration of Aurantiochytrium and Oblongichytrium was 12.15 ± 1.55 cells/ml and 16.75 ± 2 cells/ml seawater, respectively. Although these estimates are greater than our M. quahogii abundance estimates for seawater samples (Table 3), the difference could reflect that both Aurantiochytrium and Oblongichytrium comprise many species. The other 5 labyrinthulomycete genera that Nakai et al. (2013) designed qPCR assays for were not successfully quantified from any of their seawater samples. Moreover, labyrinthulomycetes were able to be quantified by qPCR in only 8 of 212 (3.8%) seawater samples, despite the fact that labyrinthulomycetes were present in 104 additional samples when quantified by acriflavine direct detection method (AfDD), a common method used to enumerate labyrinthulomycetes (Raghukumar and Schaumann, 1993). Low and sporadic abundance pose a challenge for investigating the ecology not only of specific taxa for labyrinthulomycetes, but for other microorganisms as well. Our study demonstrates that nqPCR offers a potential solution for quantification of low-abundance microbes, which has been used widely in diagnostic applications for human pathogens, such as malaria (Tran et al., 2014) and tuberculosis (Takahashi and Nakayama, 2006), as well as important plant pathogens (Banno et al., 2011; Coy et al., 2014). We believe that this is the first time that a nqPCR assay has been used for the quantification of a marine pathogen, representing a novel approach that can be applied to ecological investigations of other marine microorganisms where conventional qPCR assays, such as those used in Nakai et al. (2013), have limited success. The only pitfall that may occur when using the nqPCR approach is the increased risk of contamination due to the additional manipulation of DNA template and extremely high sensitivity of the nested reactions. However, there are well-established protocols for minimizing PCR contamination, such as the use of filter tips and separate rooms or areas for each step (Zehr and Turner, 2001; Takahashi and Nakayama, 2006), which were utilized here and further described in Geraci-Yee et al. (2022) and Supplementary File 1 (detailed methods protocol).
We have described the development of a M. quahogii (QPX)-specific nqPCR assay that is MIQE-compliant and sensitive enough to quantify M. quahogii from natural samples, amid a background of related organisms, as demonstrated by assaying 206 environmental samples, of which 75% were positive. Such information is needed to identify potential reservoirs in which M. quahogii may be able to survive and grow outside its hard clam host, as a pathogen with an environmental reservoir has the potential to cause widespread disease because it is not limited by its host’s density (Harvell et al., 2004; Burge et al., 2013). Results from this assay represent new insights into both prevalence and abundance of M. quahogii in the environment, suggesting that M. quahogii may be associated with the flocculent layer at the sediment-water interface, making interaction with hard clams likely as they live in the same habitat buried in the sediment. Besides the interannual differences found in the distribution of M. quahogii in sediment and bottom seawater, there were no clear patterns in the distribution or abundance of M. quahogii in the environment, as well as no significant correlations with environmental metadata. Other environmental conditions not measured in this study may more strongly determine M. quahogii distribution and abundance, offering avenues for future research. Nevertheless, this assay represents a valuable tool to better understand M. quahogii dynamics in the environment and possible relationships with QPX disease outbreaks, and provides a model to guide the development of similar assays for other important marine microbes typically present at similarly low abundance.
Data availability statement
The original contributions presented in the study are included in the article/Supplementary Material. Further inquiries can be directed to the corresponding author.
Author contributions
JC and BA secured funding to develop the methodology and perform the field survey. SGY developed and validated the method, and wrote the manuscript with guidance from JC and BA. All authors contributed to the article and approved the submitted version.
Funding
This research was supported by projects R/FBM-36 and R/XG-32 funded by the National Sea Grant College Program of NOAA to the Research Foundation of State University of New York on behalf of New York Sea Grant.
Acknowledgments
We are grateful to the members of the Marine Animal Disease Laboratory (MADL) and Collier Lab for Microbial Ecology at Stony Brook University for assistance with sample processing, including but not limited to Dr. Ewelina Rubin, Dr. Mariana Rius, and Rachel Hartman. We also thank Raymond Czaja for assistance with creating a map of the sampling locations. Lastly, we thank the New York State Department of Environmental Conservation (NYSDEC), specifically Captain Todd Smith, Dr. Soren Dahl, Wade Carden, and Debra Barnes, for field and administrative support. We are also thankful to Joshua Reitsma (Cape Cod Cooperative Extension) for providing samples from Massachusetts.
Conflict of interest
The authors declare that the research was conducted in the absence of any commercial or financial relationships that could be construed as a potential conflict of interest.
Publisher’s note
All claims expressed in this article are solely those of the authors and do not necessarily represent those of their affiliated organizations, or those of the publisher, the editors and the reviewers. Any product that may be evaluated in this article, or claim that may be made by its manufacturer, is not guaranteed or endorsed by the publisher.
Supplementary material
The Supplementary Material for this article can be found online at: https://www.frontiersin.org/articles/10.3389/fmars.2022.988918/full#supplementary-material
References
Banno S., Saito H., Sakai H., Urushibara T., Ikeda K., Kabe T., et al. (2011). Quantitative nested real-time PCR detection of verticillium longisporum and v. dahliae in the soil of cabbage fields. J. Gen. Plant Pathol. 77 (5), 282–291. doi: 10.1007/s10327-011-0335-9
Burge C. A., Kim C. J., Lyles J. M., Harvell C. D. (2013). Special issue oceans and humans health: the ecology of marine opportunists. Microb. Ecol. 65 (4), 869–879. doi: 10.1007/s00248-013-0190-7
Bustin S. A., Beaulieu J. F., Huggett J., Jaggi R., Kibenge F. S., Olsvik P. A., et al. (2010). MIQE précis: Practical implementation of minimum standard guidelines for fluorescence-based quantitative real-time PCR experiments. BMC Mol. Biol. 11, 74. doi: 10.1186/1471-2199-11-74
Bustin S. A., Benes V., Garson J. A., Hellemans J., Huggett J., Kubista M., et al. (2009). The MIQE guidelines: minimum information for publication of quantitative real-time PCR experiments. Clin. Chem. 55 (4), 611–622. doi: 10.1373/clinchem.2008.112797
Coy M., Hoffmann M., Gibbard H. K., Kuhns E., Pelz-Stelinski K., Stelinski L. (2014). Nested-quantitative PCR approach with improved sensitivity for the detection of low titer levels of candidatus liberibacter asiaticus in the Asian citrus psyllid, diaphorina citri kuwayama. J. microbiological Methods 102, 15–22. doi: 10.1016/j.mimet.2014.04.007
Gast R. J., Cushman E., Moran D. M., Uhlinger K. R., Leavitt D., Smolowitz R. (2006). DGGE-based detection method for quahog parasite unknown (QPX). Dis. Aquat Organ 70 (1-2), 115–122. doi: 10.3354/dao070115
Gast R. J., Moran D. M., Audemard C., Lyons M. M., DeFavari J., Reece K. S., et al. (2008). Environmental distribution and persistence of quahog parasite unknown (QPX). Dis. Aquat Organ 81 (3), 219–229. doi: 10.3354/dao01948
Geraci-Yee S. (2021). Taking the "X" out of QPX disease: Distribution and dynamics of the hard clam pathogen, Mucochytrium quahogii (formerly QPX = quahog parasite unknown). [Ph.D.] Stony Brook NY: Stony Brook University.
Geraci-Yee S., Allam B., Collier J. L. (2022). Keeping up with advances in qPCR pathogen detection: an example for QPX disease in hard clams. Dis. Aquat Organ 148, 127–144. doi: 10.3354/dao03648
Geraci-Yee S., Brianik C. J., Rubin E., Collier J. L., Allam B. (2021). Erection of a new genus and species for the pathogen of hard clams 'Quahog parasite unknown' (QPX): Mucochytrium quahogii gen. nov., sp. nov. Protist 172 (1), 125793. doi: 10.1016/j.protis.2021.125793
Haff L. A. (1994). Improved quantitative PCR using nested primers. Genome Res. 3, 332–337. doi: 10.1101/gr.3.6.332
Harvell D., Aronson R., Baron N., Connell J., Dobson A., Ellner S., et al. (2004). The rising tide of ocean diseases: unsolved problems and research priorities. Front. Ecol. Environ. 2 (7), 375–382. doi: 10.1890/1540-9295(2004)002[0375:TRTOOD]2.0.CO;2
Irwin P. L., Nguyen L. H., Chen C. Y., Uhlich G. A., Paoli G. C. (2012). A method for correcting standard-based real-time PCR DNA quantitation when the standard's polymerase reaction efficiency is significantly different from that of the unknown's. Anal. Bioanal Chem. 402 (9), 2713–2725. doi: 10.1007/s00216-012-5737-9
Johnson G., Nolan T., Bustin S. A. (2013). “"Real-time quantitative PCR, pathogen detection and MIQE,” in PCR detection of microbial pathogens: Second editions, methods in molecular biology. Ed. Wilks M. (Totowa, NJ: Springer).
Liu Q., Allam B., Collier J. L. (2009). Quantitative real-time PCR assay for QPX (Thraustochytriidae), a parasite of the hard clam (Mercenaria mercenaria). Appl. Environ. Microbiol. 75 (14), 4913–4918. doi: 10.1128/AEM.00246-09
Lyons M. M., Smolowitz R., Dungan C. F., Roberts S. (2006). Development of a real time quantitative PCR assay for the hard clam pathogen quahog parasite unknown (QPX). Dis. Aquat. Organisms 72, 45–52. doi: 10.3354/dao072045
Lyons M. M., Smolowitz R., Uhlinger K. R., Gast R. J., Ward J. E. (2005). Lethal marine snow: Pathogen of bivalve mollusc concealed in marine aggregates. Limnology Oceanography 50, 1983–1988. doi: 10.4319/lo.2005.50.6.1983
Nakai R., Nakamura K., Jadoon W. A., Kashihara K., Naganuma T. (2013). Genus-specific quantitative PCR of thraustochytrid protists. Mar. Ecol. Prog. Ser. 486, 1–12. doi: 10.3354/meps10412
Qian H., Liu Q., Allam B., Collier J. L. (2007). Molecular genetic variation within and among isolates of QPX (Thraustochytridae), a parasite of the hard clam Mercenaria mercenaria. Dis. Aquat. Organisms 77, 159–168. doi: 10.3354/dao01848
Raghukumar S., Schaumann K. (1993). An epifluorescence microscopy method for direct detection and enumeration of the fungi like marine protist, the thraustochytrids. Limnology Oceanography 38, 182–187. doi: 10.4319/lo.1993.38.1.0182
Stokes N. A., Calvo L. M. R., Reece K. S., Burreson E. M. (2002). Molecular diagnostics, field validation, and phylogenetic analysis of quahog parasite unknown (QPX), a pathogen of the hard clam Mercenaria mercenaria. Dis. Aquat. Organisms 52, 233–247. doi: 10.3354/dao052233
Svec D., Tichopad A., Novosadova V., Pfaffl M. W., Kubista M. (2015). How good is a PCR efficiency estimate: Recommendations for precis and robust qPCR efficiency assessments. Biomolecular Detection Quantification 3, 9–16. doi: 10.1016/j.bdq.2015.01.005
Takahashi T., Nakayama T. (2006). Novel technique of quantitative nested real-time PCR assay for Mycobacterium tuberculosis DNA. J. Clin. Microbiol. 44 (3), 1029–1039. doi: 10.1128/JCM.44.3.1029-1039.2006
Tran T. M., Aghili A., Li S., Ongoiba A., Kayentao K., Doumbo S., et al. (2014). A nested real-time PCR assay for the quantification of plasmodium falciparum DNA extracted from dried blood spots. Malaria J. 13 (1), 1–8. doi: 10.1186/1475-2875-13-393
Ueda M., Nomura Y., Doi K., Nakajima M., Honda D. (2015). Seasonal dynamics of culturable thraustochytrids (Labyrinthulomycetes, stramenopiles) in estuarine and coastal waters. Aquat. Microbial Ecol. 74, 187–204. doi: 10.3354/ame01736
Keywords: qPCR, Mucochytrium quahogii, labyrinthulomycetes, Mercenaria mercenaria, QPX disease, low-abundance template, microbial detection methods, MIQE
Citation: Geraci-Yee S, Allam B and Collier JL (2022) A nested quantitative PCR assay for detection of the hard clam pathogen Mucochytrium quahogii (=QPX) in environmental samples. Front. Mar. Sci. 9:988918. doi: 10.3389/fmars.2022.988918
Received: 07 July 2022; Accepted: 14 October 2022;
Published: 27 October 2022.
Edited by:
Frederic Coulon, Cranfield University, United KingdomReviewed by:
Inbakandan Dhinakarasamy, Sathyabama Institute of Science and Technology, IndiaConor McManus, Rhode Island Department of Environmental Management, United States
Copyright © 2022 Geraci-Yee, Allam and Collier. This is an open-access article distributed under the terms of the Creative Commons Attribution License (CC BY). The use, distribution or reproduction in other forums is permitted, provided the original author(s) and the copyright owner(s) are credited and that the original publication in this journal is cited, in accordance with accepted academic practice. No use, distribution or reproduction is permitted which does not comply with these terms.
*Correspondence: Jackie L. Collier, amFja2llLmNvbGxpZXJAc3Rvbnlicm9vay5lZHU=