 Chuang Jin1,2
 Zheng Gong1,2*
 Lei Shi3
 Kun Zhao1,2
 Rafael O. Tinoco4
 Jorge E. San Juan5
 Liang Geng1,2
 Giovanni Coco6
- 1State Key Laboratory of Hydrology-Water Resources and Hydraulic Engineering, Hohai University, Nanjing, China
- 2Jiangsu Key Laboratory of Coast Ocean Resources Development and Environment Security, Hohai University, Nanjing, China
- 3Zhejiang Institute of Hydraulic and Estuary (Zhejiang Institute of Marine Planning and Design), Hangzhou, China
- 4Department of Civil and Environmental Engineering, University of Illinois at Urbana-Champaign, Urbana, IL, United States
- 5Department of Civil, Environmental and Geo-Engineering, University of Minnesota Twin Cities, Minneapolis, MN, United States
- 6School of Environment, Faculty of Science, University of Auckland, Auckland, New Zealand
Salt marshes play a key role in attenuating wave energy and promoting sedimentation necessary to potentially adapt to sea level rise. The changes in the soil surface elevation, as a result of spatially and temporally varied sedimentation pattern, affect the hydrodynamics, marsh edge extension and so the sedimentation rate. Little attention has yet been paid to the medium-term sedim\entation under the influence of marsh extension. To fill this gap, we performed a 6-year (from 2012 to 2018) field observation to obtain the soil surface elevation of the cross-shore tidal flats in the center Jiangsu Coast (China). The salt marsh edge is extracted from remote sensing images using NVDI technique, which allows us to quantify the seaward extension of salt marshes. Results highlight that soil surface elevation in the salt marsh region varies spatially and temporally as a function of marsh topography, inundation frequency and distance to the salt marsh edge. The sedimentation rate reduces linearly shoreward as a result of increasing soil surface elevation in the marsh region. At the transition of salt marshes and bare flats, the sedimentation rate follows a parabolic relationship with the increase in distance to the salt marsh edge but decreases linearly at the more landward sites. The maximum sedimentation rate is initially located around the mean high-water level and moves towards the edge of the salt marsh as a result of marsh extension and increasing soil surface elevation. Our field observations reveal these medium-term marsh dynamics and provide a unique dataset for development, testing and validation of numerical simulations to enhance predictions of the overall evolution of tidal flats.
1 Introduction
Tidal flats are the transition region of sea and land. They are important geomorphological and ecological systems providing habitat for aquatic species (van Eerden et al., 2005; Friedrichs, 2011), preventing coastal inundation (Möller et al., 2014), and protecting against sea level rise (Krauss et al., 2010; Webb et al., 2013; Kirwan et al., 2016). The morphology of tidal flats is continuously modulated by the interactions between hydrodynamics (e.g., tidal currents, waves, storm events), sediment supply, global climate change (i.e. storm events and sea level rise), and biological factors (e.g., salt marshes, biofilms) (Le Hir et al., 2000; D’Alpaos et al., 2007; Green and Coco, 2007; Kirwan et al., 2010; Friedrichs, 2011; Fagherazzi et al., 2012; Chen et al., 2019; Zhao et al., 2021; Jin et al., 2022). Salt marshes in front of coastal infrastructure provide important ecological services in attenuating wave and current energy, trapping sediment and accelerating sedimentation (Temmerman et al., 2003; van de Koppel et al., 2005; Anderson and Smith, 2014; Gong et al., 2017). Sedimentation in salt marshes, in turn, facilitates the further growth and extension of salt marshes, forming the so-called “biogeomorphic feedback loop” (Wang and Temmerman, 2013; Bouma et al., 2016; Schwarz et al., 2018). Increasing attention has been paid to field investigations, which focus either on the limit of the salt marsh edge controlled by a dynamic retreat behavior (Marani et al., 2011; Bendoni et al., 2016; Zhao et al., 2022) or on the survival of salt marshes under the threat of sea level (Mudd et al., 2004; Fagherazzi et al., 2012; Wang and Temmerman, 2013; Möller et al., 2014; Rogers et al., 2014; Lovelock et al., 2015; Bouma et al., 2016; Swales et al., 2016; Brückner et al., 2019). Short-term (e.g., days, months, <1 year) field work has been widely performed to investigate the hydrodynamics or the morphodynamic response to forcing conditions on tidal flats (e.g., Fan, 2010; Shi et al., 2014; Zhang et al., 2021). The impact of the seaward growth of salt marshes is usually ignored. In terms of the long-term (e.g., >10 years) morphological evolution of tidal flats, the marsh dynamics (e.g., seaward growth, sediment trapping) exert a large impact on the sedimentation and the morphological evolution in the marsh region. However, the long-term morphological evolution is usually studied using numerical simulation rather than field observations. Field investigations on sedimentation patterns over a medium-term to long-term timescale are scarce, and the association with the constant seaward extension of salt marshes remain unclear.
Past studies have revealed important features of the dynamics of salt marshes: (1) Salt marshes dampen velocities, enhance turbulence and promote sedimentation through their leaf, stem, and root networks (Nepf, 2012; Tinoco and Coco, 2018; Yang and Nepf, 2018; San Juan et al., 2019; Tinoco et al., 2020). (2) Laboratory experiments show that salt marshes can cause up to 60% of wave height reduction (Möller et al., 2014). (3) The stem and leaves capture and settle suspended sediment effectively, exceeding 70% of the overall amount of sedimentation under dense salt marsh and rapid flow (Mudd et al., 2010; Chen et al., 2018). (4) The density of stems partly determines the sedimentation rate (Gleason et al., 1979). (5) Salt marsh roots also contribute to sedimentation by enhancing the soil strength and preventing erosion. Therefore, salt marshes are an important factor in promoting sedimentation and affecting the marsh topography.
The presence of salt marshes causes large temporal and spatial variability in sedimentation in the upper-intertidal flats. This has been studied through field observations and bio-geomorphological numerical simulations (Temmerman et al., 2003; Temmerman et al., 2005; Bouma et al., 2007; D’Alpaos et al., 2007; Fagherazzi et al., 2012; Zhou et al., 2016; Brückner et al., 2019; Geng et al., 2021). Existing field investigations have shown continuous and seasonal sedimentation associated with inundation frequency in the marsh region (Gong et al., 2017; Willemsen et al., 2018). The largest bed level change occurs in the spring and summer seasons (March to May and June to August). Numerical simulations have compared the sedimentation with and without the coverage of salt marshes (D’Alpaos et al., 2007). Without the cover of salt marshes, the sedimentation rate displays a linear relationship from the marsh edge to the landside. The increasing distance from the marsh edge corresponds to the decreasing sedimentation rate. With the presence of Spartina alterniflora, the accretion rate is high at the elevation of Mean Sea Level (MSL) and decreases progressively with the increase in the marsh elevation. The lowest limit of the vegetation is set at the MSL in the numerical model. The maximum sedimentation appears in the vicinity of the salt marsh edge owing to the rapid reduction of the suspended sediment concentration in this region (D’Alpaos et al., 2007). Field observations also found a similar increase in the sedimentation rate (SR) near the edge (Willemsen et al., 2018). However, medium to long term field observations in the marsh region are still scarce. To better understand the morphodynamics of tidal flats, the sedimentation rate along the cross-shore profile and the impact factors need further investigations.
The soil surface elevation and inundation frequency are known to affect the sedimentation pattern. The sedimentation rate increases exponentially with the inundation period, while an increase in the soil surface elevation corresponds to a decreased sedimentation rate (Pethick, 1981; French, 1993; Allen, 1994; Cahoon et al., 1995). No direct link has been found between waves and bed level change in the marsh region (Willemsen et al., 2018). Marsh sedimentation alters the hydrodynamics (e.g., water level and inundation frequency) and feedbacks to the following sedimentation rate and marsh edge extension. Once the hydrodynamics (e.g., water depth or inundation frequency) and disturbance period allow the survival of salt marshes (Bouma et al., 2016), salt marshes will establish and the border extends seaward (D’Alpaos et al., 2007; Hu et al., 2011; Zhou et al., 2016; Brückner et al., 2019; Geng et al., 2021). It has been pointed out that when the Spartina colonizes seaward, the overall accretion rate increases (D’Alpaos et al., 2007). The distance to the marsh edge can also affect the sedimentation. However, the influence of salt marsh extension on sedimentation rate has not been well considered.
Researchers have focused on the establishment and extension of salt marshes as a function of hydrodynamics (Morris et al., 2002; Mudd et al., 2004; D’Alpaos et al., 2007; Hughes et al., 2012; Balke et al., 2016). According to a long record of plant productivity in an estuary, Morris et al. (2002) proposed a linear relationship between plant biomass and marsh topography. The biomass is highly related to the marsh properties (e.g., the plant density). Spatially, the increase in the soil surface elevation results in a linear decrease in biomass. Later, Morris (2006) suggested a parabolic relationship between the soil surface elevation and biomass. With the increase in the water depth in the seaward direction, the biomass first increases until reaching a maximum value, and then drops as it goes farther in the seaward direction. The lowest border of the salt marsh survival has also been widely studied. Researches in different locations have indicated that the lowest border could be located at the Mean Low Water Level (MLWL), Mean Sea Level (MSL, D’Alpaos et al., 2007), or at a certain elevation below the Mean High Water Level (MHWL), e.g., 20 - 40 cm and 50 - 60 cm below MHWL suggested by Bakker et al. (2002) and Morris et al. (2002), respectively. Mckee and Patrick (1988) found the lowest elevation of Spartina alterniflora is relative to MLWL and increases with the tidal range. Wang and Temmerman (2013) analyzed remote sensing images and noted rapid shifts of tidal flats from bare to vegetated states once a threshold of a certain elevation (0.5 m below MHWL) is exceeded. Rather than relative elevation and inundation duration, inundation frequency is suggested to better determine the marsh edge than inundation duration (Balke et al., 2016; van Belzen et al., 2017). Moreover, van de Koppel et al. (2005) further highlight the importance of slope at the marsh edge through a theoretical and empirical study. The sedimentation promotes the salt marsh growth, and the salt marsh stops growing when a steep slope at the salt marsh edge is reached. However, there is still no agreement on the lowest limit of the salt marsh edge.
Overall, a large number of studies have focused on the morphological evolution of tidal flats considering the effects of salt marshes through numerical simulations, but the sedimentation related to the seaward extension of salt marshes is less investigated through field observations. The objective of this study is to investigate the impact of the seaward extension of salt marshes on the morphological evolution of tidal flats. We performed medium-term field observations (6 years) on the soil surface elevation in the cross-shore profile of the tidal flats and extracted the marsh edge from remote sensing images. We then evaluated the sedimentation characteristics in association with the marsh elevation and the distance to the marsh edge. This manuscript is structured as follows. In section 2 we introduce the methodology of the topography measurement and marsh edge extraction. In section 3, we describe the variation of the sedimentation and the marsh edge. The results are discussed in section 4, followed by conclusions provided in section 5.
2 Methodology
2.1 Field observations
We performed monthly field observations of the soil surface elevation (SSE) at the south tidal flat of Chuandong Estuary in the center of Jiangsu coast (China) from 2012 to 2018 (Figure 1). This region is the most rapidly propagating mudflat on the Jiangsu coast. The width of the tidal flat is about 2-6 km and the slope is 0.1% to 0.3%. As it is affected by a combination of the counterclockwise rotary tidal wave and progressive tidal waves, the tide is irregular, and semi-diurnal, with an average tidal range of 3.68 m. The maximum current velocity ranges from 0.5 m/s to 1 m/s, and there is a weak component of the longshore current according to a previous field study (Zhang et al., 2016). The flood duration is shorter than the ebb duration with a ratio of 0.73. The velocity during the flood tide is larger than that during the ebb tide. Waves tend to be small with the maximum significant wave height of 1.0 m in winter and 0.5 m in summer. The MHWL is 2.19 m and the MLWL is -1.87 m (Figure 1C). The substrate consists of a mixture of clay, silt, and sand (Gong et al., 2017). The grain size becomes coarser from the upper intertidal flats to the lower intertidal flats, but the occasional storm events can bring the coarse sand to the upper intertidal flats. We collected the bedload samples at sites S3 and S7 in January 2021 and analysed the grain size distribution using MasterSizer3000. The median grain size (d50) is 15.2µm at site S3 while 69.8µm at site S7. From the sea dyke to the lower intertidal flat, the cross-shore profile can be divided into four distinctive zones: (1) grass flats (freshwater or brackish water wetland), (2) Suaeda salsa and Spartina alterniflora salt marshes, (3) muddy flats, and (4) silt or sand flat (Jin et al., 2018).
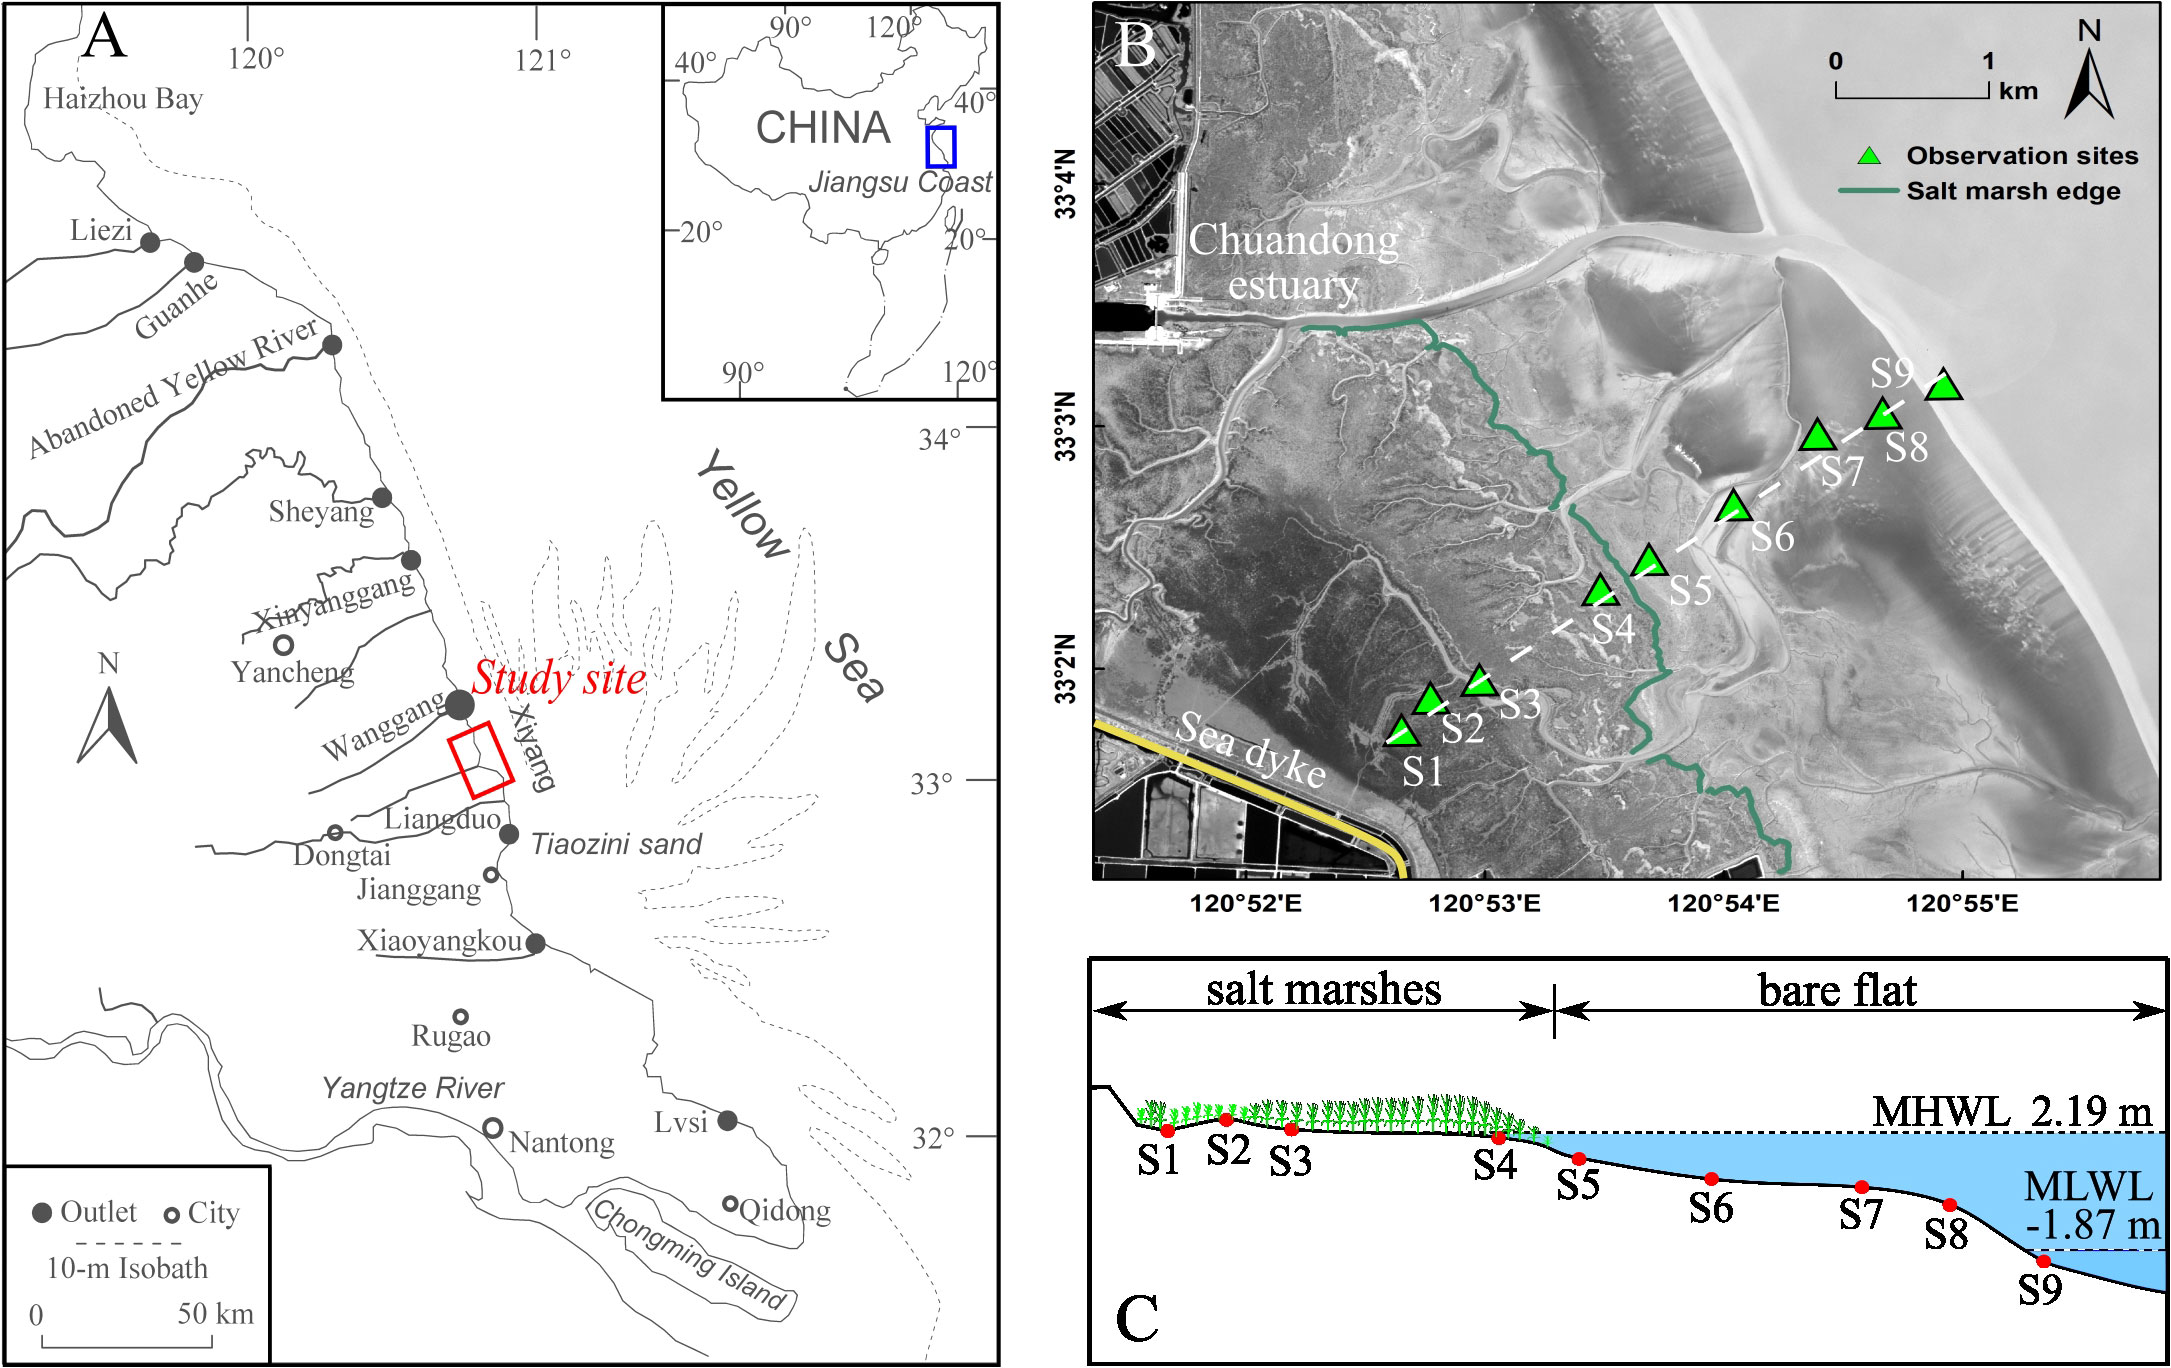
Figure 1 Observation sites, Jiangsu coast, China. (A) Map of the study site. (B) Location of observation sites S1-S9 from the upper to lower intertidal flat. Image is taken in 2013. (C) Cross-shore profile in 2012.
Nine benchmarks (S1-S9) were set up on the cross-shore profile from the upper to the lower intertidal flat in July 2012 (Figure 1A). At the beginning of field observations, sites S1-S4 are located in the salt marsh region and sites S5-S9 are on the bare flat (Figure 1B). Site S5 is located at the edge of the salt marsh surrounded by low-height salt marshes (Figure 1C). During our field survey, severe erosion occurred around some benchmarks in the lower intertidal flat. Therefore, four more sites were added (SG6, SG7, SG8 and SG89).
The soil surface elevation is calculated from the measurements using a Rod Surface Elevation Table (Rod-SET), an instrument originally developed by Cahoon et al. (2002). This instrument measures the distance from the top of the benchmark to the soil surface (see Figure 2B). The changes in distance from the top of the benchmark to the soil surface indicate the variation of the soil surface elevation. The absolute elevation at the top of the benchmark is measured and re-evaluated using Real-Time Kinematic GPS (RTK-GPS) every half a year to assess any subsidence of the benchmark. We then obtain the absolute elevation by subtracting the distance from the benchmark to the soil surface from the absolute elevation at the top of the benchmark. Readers are referred to Gong et al. (2017) for more detailed settings of benchmarks and components of the Rod-SET instrument.
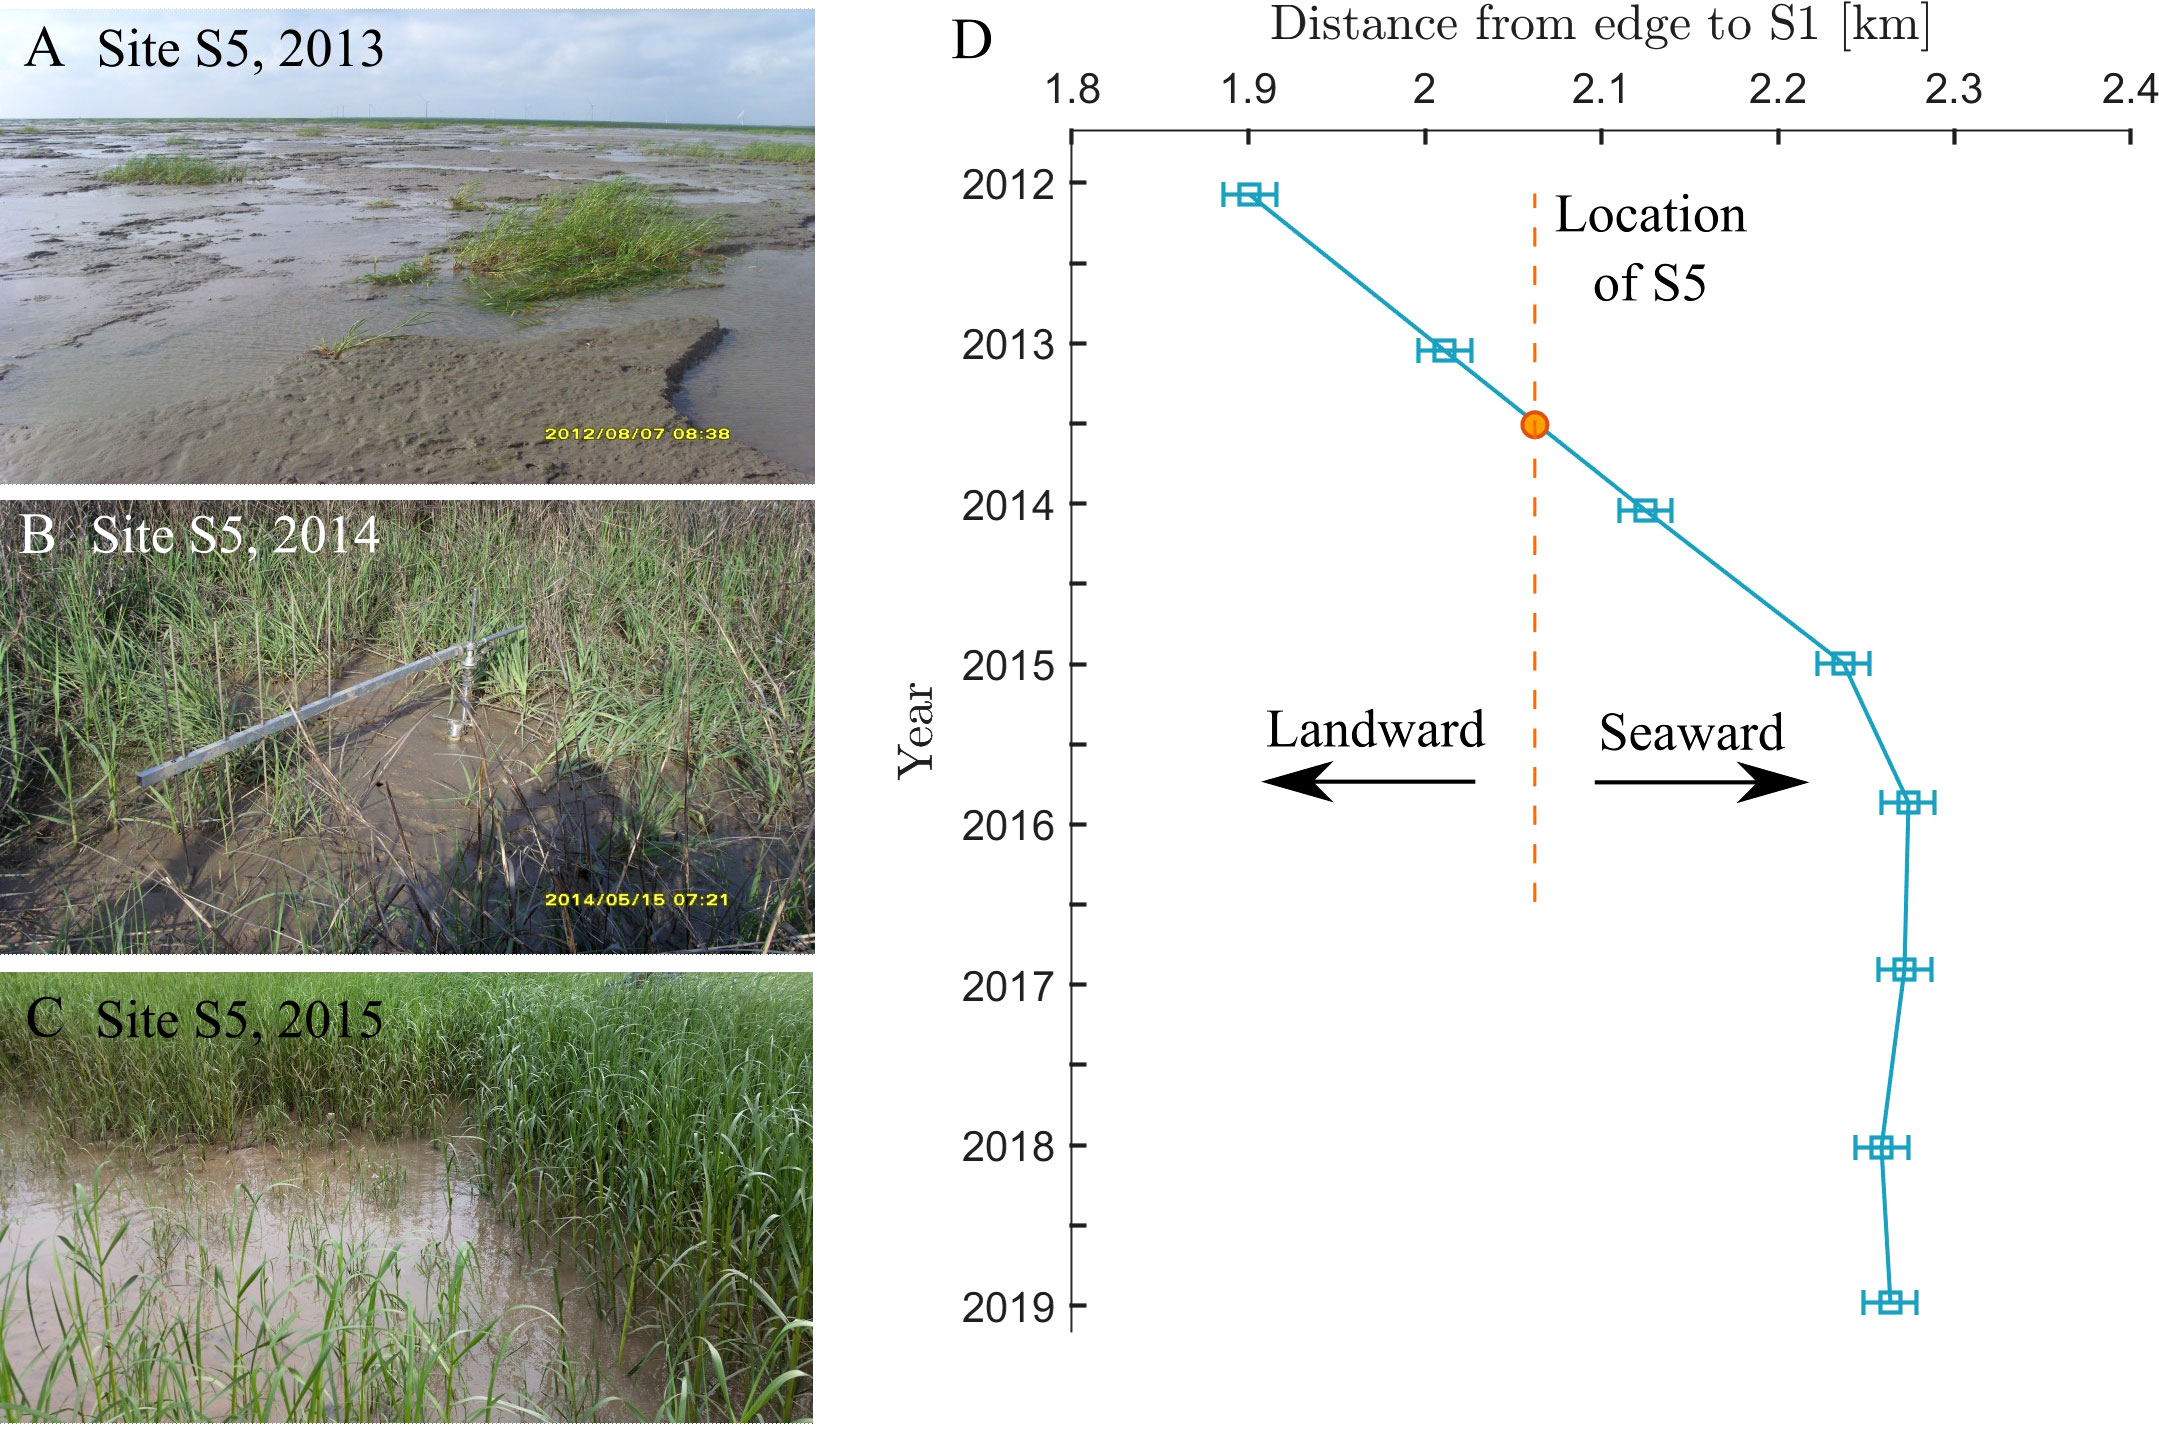
Figure 2 Photos taken at the observation site S5 in (A) 2013, (B) 2014, (C) 2015, and (D) the location of salt marsh edge as a function of time. The resolution of the remote sensing image (30 m) is shown by the errorbar.
The tide level is predicted using a dataset from the nearest tidal level station (Zhang et al., 2016; Gong et al., 2017). The inundation duration is quantified by counting the inundation hours within a month. The inundation frequency (f) is defined as the proportion of the submerged time in a month. The sedimentation rate (SR) is calculated as the difference of the soil surface elevation in two adjacent months.
2.2 Assessment of the salt marsh edge
The salt marsh edge is extracted from the remote sensing images obtained by Landsat series satellites. Image quality and tide level are considered when choosing the images. Only images with cloud cover less than 10% and salt marshes not submerged are selected. We selected images taken in October each year from 2012 to 2018 since they coincide with the time of our field observations. To extract the edge of salt marshes, we further calculated the Normalized Difference Vegetation Index (NDVI). The location where a significant change in NDVI occurs is defined as the marsh edge. The obtained location is then visually validated in the remote sensing images. As it is shown in Figure 2, the edge of salt marshes advances seaward from 2013 to 2017. The observation site S5 is fully covered by salt marshes since 2014.
3 Results
We focus on the morphological evolution of salt marshes (S2-S5) and the variation of the soil surface elevation in association with the inundation frequency, topography, and salt marsh extension. Site S1 is close to the sea dyke and is less affected by tidal currents compared to rainfall and longshore currents. Sites S6-S9 are on the bare flat, where the morphological evolution is dominated by tide currents and storm events. The sedimentation and erosion, however, are less relevant to the salt marsh growth on the bare flat.
3.1 Soil surface elevation
Site S2 locates at the highest elevation of the cross-shore profile. It can only be submerged during high tide between June and November. The overall inundation frequency is extremely low (<0.05 of the overall time in a month, Figure 3B). The maximum variation in the soil surface elevation is 5 cm throughout the period of observations (Figure 3A). This is attributed to the high soil surface elevation and the resultant low inundation frequency. Although the suspended sediment transported to this site is significantly reduced, the change of the soil surface elevation still correlates with inundation frequency (Figures 3A, B). In particular, the soil surface elevation increases slightly with the inundation frequency period from June to November. Low inundation frequency also means less hydrodynamic interaction with the bed at S2. It may allow substrate accretion from the build-up of the local generated organic matter within the salt marsh. On the other hand, there is a time lag between the increase in the soil surface elevation and the inundation frequency. For example, the inundation frequency at this site (S2) increases from September 2014 to October 2014, followed by a drop from October 2014 to November 2014, but the soil surface elevation increases from October 2014 to November 2014, and later decreases subsequently. Our previous measurements have indicated that the variation of the soil surface elevation is alternatively controlled by the consolidation of the subsurface soil and surface sedimentation (Gong et al., 2017). When the inundation frequency is low, the subsurface soil consolidates, and the elevation reduces slightly. During months with increasing inundation frequency, there is suspended sediment transported to this site. The increase in the soil surface elevation is thus explained by surface sedimentation.
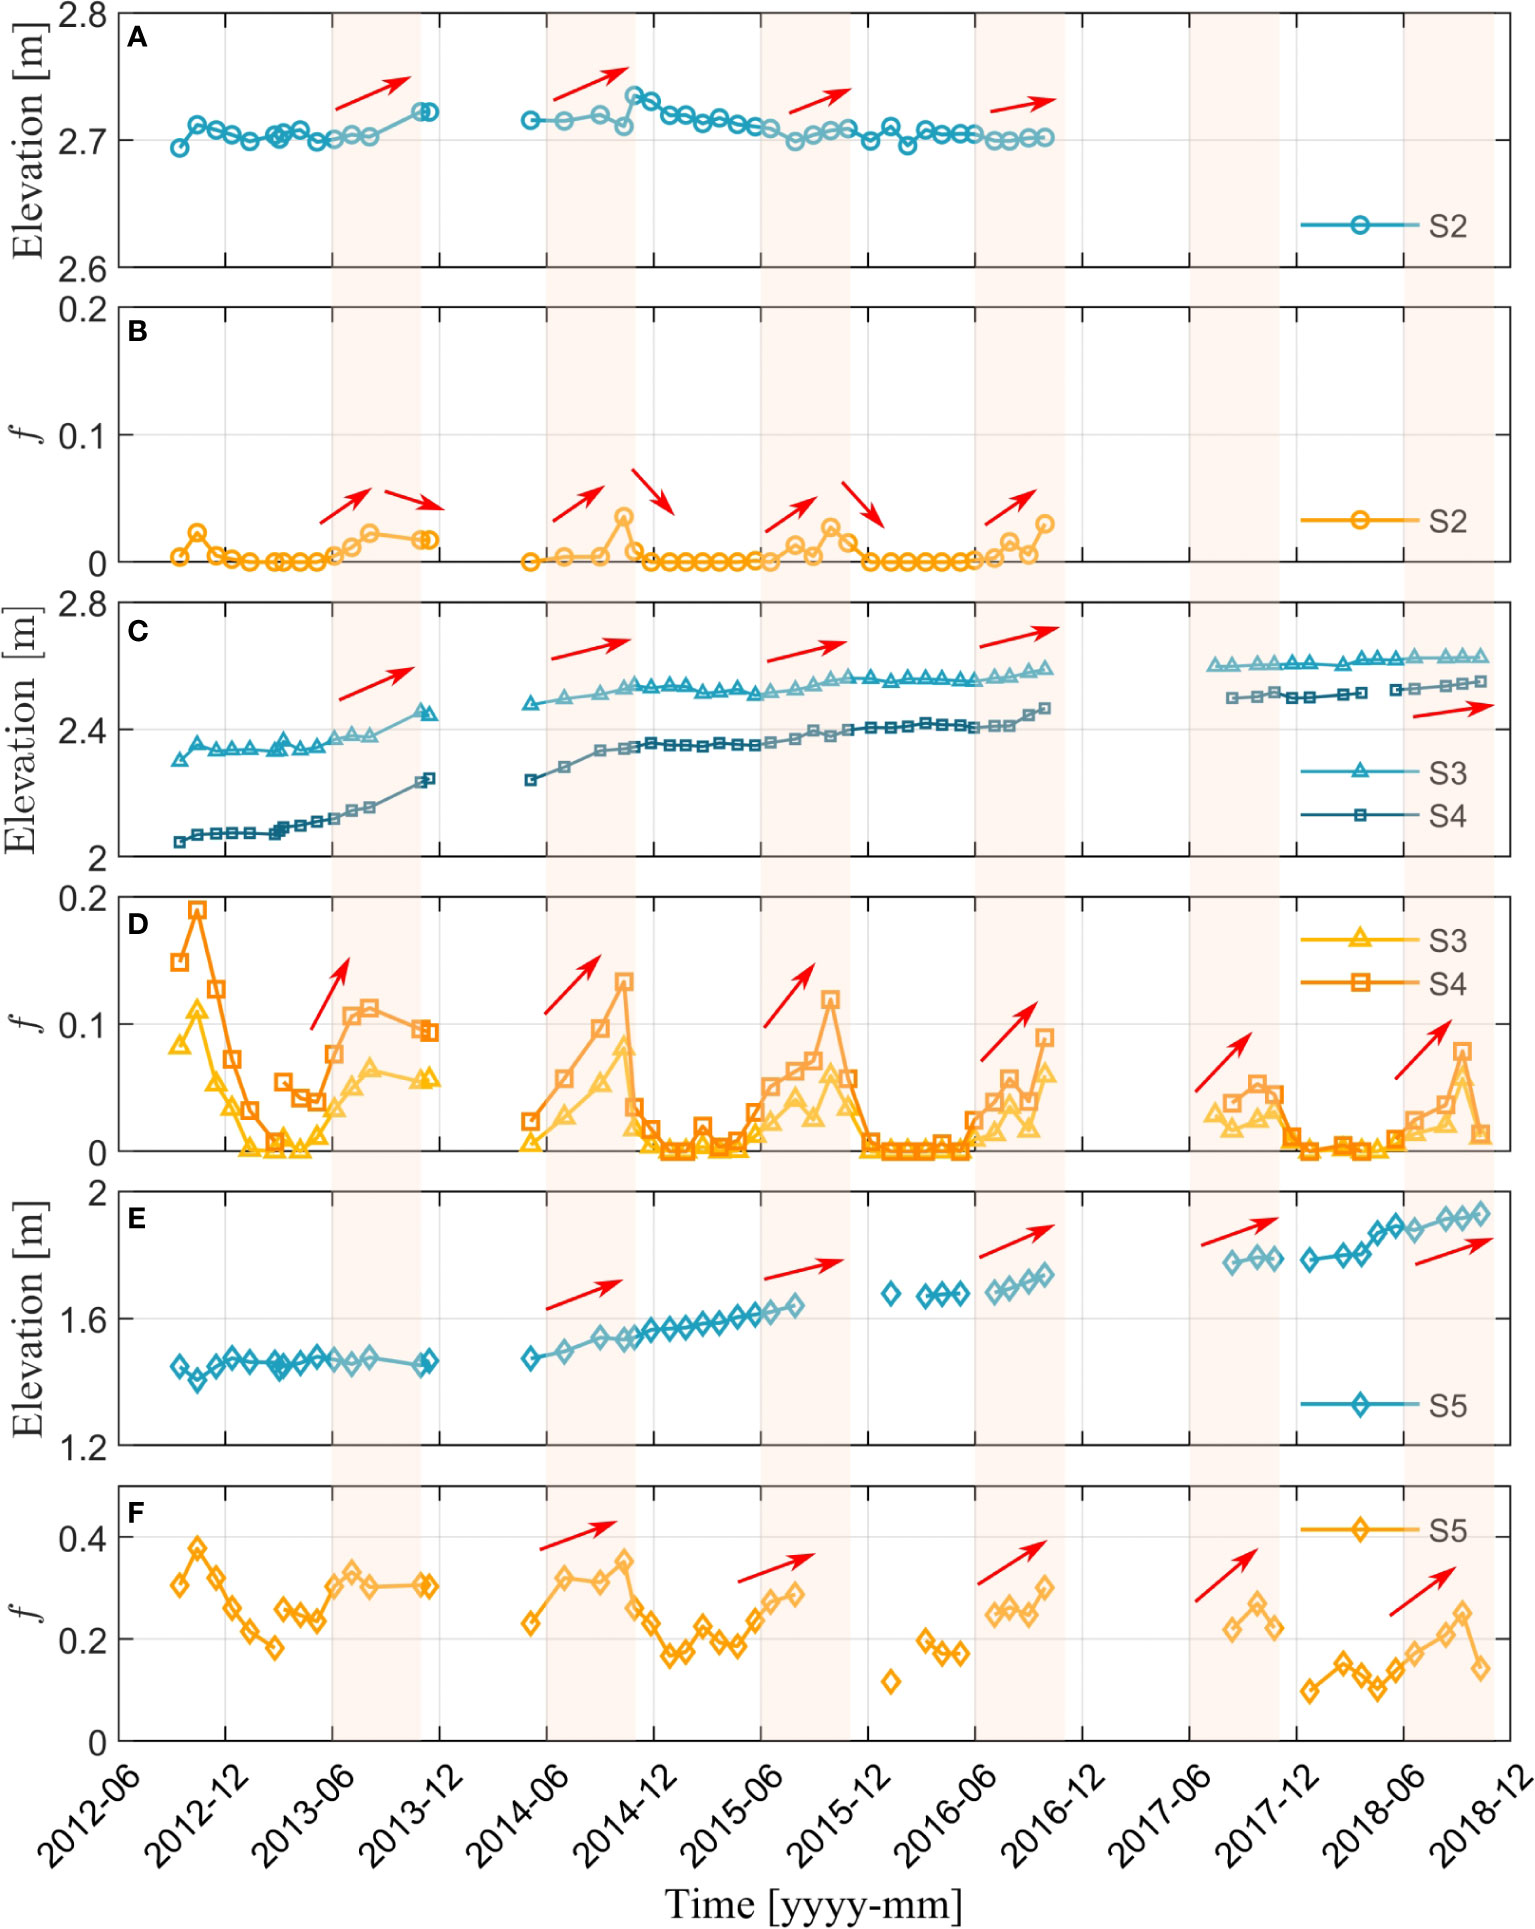
Figure 3 Variation of the soil surface elevation at sites (A) S2, (C) S3 and S4, (E) S5, and (B, D, F) their corresponding inundation frequency. Light yellow shades highlight the months June to November with the increase in the inundation frequency. Red arrows highlight the increasing trend of the soil surface elevation and inundation frequency.
The variation of the soil surface elevation near MHWL is strongly associated with the inundation frequency and salt marsh propagation, and it displays a strong seasonal characteristic. Sites S3 and S4 are located around the MHWL (Figure 1). These two sites are about 1 km and 500 m from the salt marsh edge and covered by the densest salt marshes in the cross-shore profile. In general, the soil surface elevation keeps rising during the period of observations, and the seasonal variation is evident (Figure 3C). The inundation frequency increases from April to November, which corresponds to the increase in the soil surface elevation. During months with decreasing/low inundation frequency, little change in the soil surface elevation is observed (Figure 3D). With the continuous increasing soil surface elevation, the inundation frequency drops correspondingly, which in turn results in the decline in the sedimentation rate. In 2018, both sites reach an elevation that minimizes inundation and so morphological change. The sedimentation rate drops by an order of magnitude, from 0.1-0.2 m/y in 2013 to 0.02-0.04 m/y in 2018 (Figure 4A). This is due to the feedback between the soil surface elevation and inundation frequency (Temmerman et al., 2005; Fagherazzi et al., 2012). High inundation frequency induces large sedimentation in salt marshes. The increase in the soil surface elevation in turn reduces the inundation frequency. Therefore, the sedimentation rate decreases.
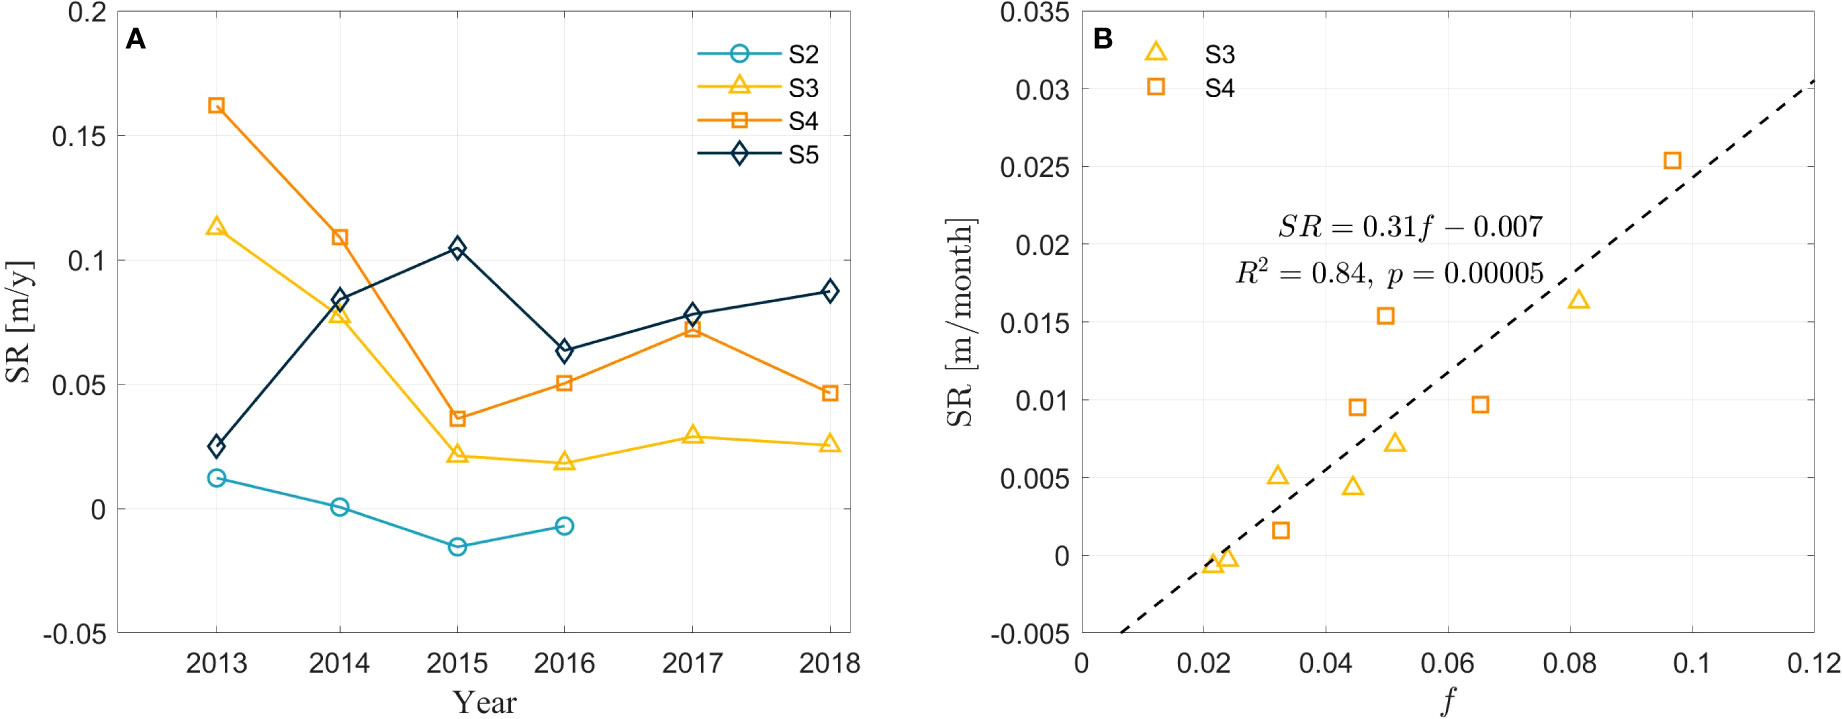
Figure 4 (A) Sedimentation rate at S2 to S5 as a function of time. (B) The relationship between sedimentation rate and averaged inundation frequency from June to Nov at sites S2 to S4.
Sedimentation rates at Site S3 to S4 are highly related to inundation frequency (Figure 4B). We calculate the mean inundation frequency and monthly sedimentation rate from June to November at sites S3 to S4. Clearly, a larger inundation frequency corresponds to a higher sedimentation rate, and the best fitting of these dots is described by a linear function (SR = 0.31f - 0.007, R2 = 0.84, p = 0.00005) can be obtained from the curve fitting. The inundation frequency at S2 is not sensitive to the variation of inundation frequency due to the high elevation and low sedimentation rate (~mm), while the sedimentation rate at Site S3 and S4 has a strong relation to changes in the inundation frequency.
Site S5 was located at the salt marsh edge at the beginning of our field campaign in 2012 (Figure 1). Although its inundation frequency is higher than S3 and S4 due to the lower elevation at this site (Figure 3E), the magnitude of the variation in the soil surface elevation is rather low compared to S3 and S4 since the site is not fully covered by salt marshes (only patches of salt marshes can be found, see pictures in Figure 2). The sedimentation and erosion are almost in balance at this site and there is no evident seasonal variation as in sites S3 and S4. After this site is gradually covered by salt marshes (Figure 2), the soil surface elevation increases by nearly 40 cm from 2014 to 2018 (Figure 3F), with noticeable seasonal variation after 2014. The soil surface elevation is nearly constant before June, while it increases from June to November.
The morphological elevation of the cross-shore profile from 2012 to 2018 is shown in Figure 5. The overall amount of sedimentation increases from S2 to S4 (~0 m to 0.44 m from 2012 to 2018) and then drops from S4 to the marsh edge (See inset of Figure 5). The maximum deposition region occurs around S4, which is about the elevation of MHWL. With the increase in the soil surface elevation, the slope between S3 and S4 reduces. S5 is initially located at the deposition-erosion balance point before 2014 when the nearby flats are not fully colonized by salt marshes. Once S5 is covered by marshes, the deposition-erosion balance point moves gradually seaward direction due to sedimentation but does not change as much as the marsh edge (Figure 5). The bare flat experienced significant erosion during the 6-year field observations. Together with the rapid sedimentation near the marsh edge, the bed slope at the marsh edge (S5 to S6) increases significantly from 0.001 to 0.003. The most severe erosion (about 1.5m) occurs at the lower intertidal flat which can be attributed to the storm events. Site S7 was entirely eroded, and it has not recovered during the past 6 years.
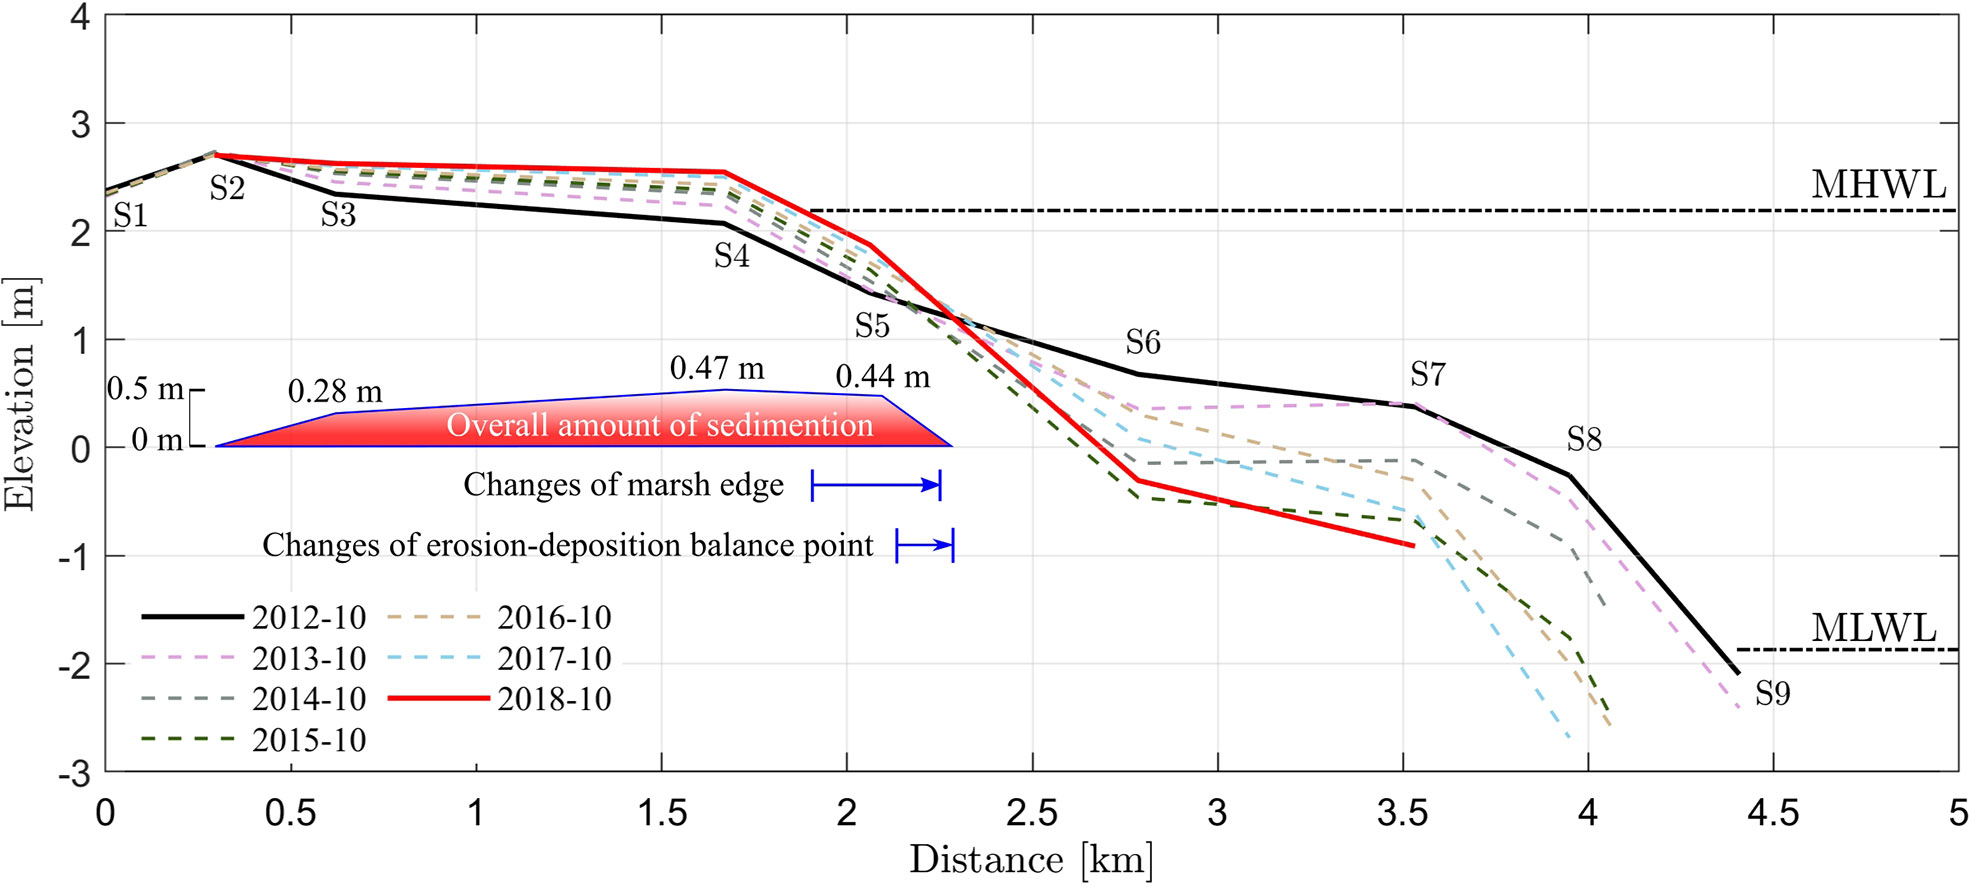
Figure 5 Variation of the cross-shore profile from 2012 to 2018. The shade highlights the changes of the salt marsh edge from 2012 to 2018. The changes of marsh edge and the erosion-deposition balance point is highlighted with the blue arrows.
3.2 The soil surface elevation, salt marsh extension and sedimentation rate
Using remote sensing, we obtained the salt marsh edge and calculated the distance from the salt marsh edge to site S1 in the cross-shore profile (Figure 2). Note that our field measurements cover the time scale from the rapid growth to the relatively steady stage of the salt marsh with minimum seaward growth. From 2012 to 2016, the salt marsh expands and propagates rapidly seaward with an average rate of 92 m/y. The salt marsh edge reached site S5 in 2014. After, the salt marsh extension slows down and displays a slight retreat. The turning point of the salt marsh extension occurs at the end of 2015, which coincides with the major change in the sedimentation rate (Figure 4A). The variation trend of the sedimentation rate changed abruptly at sites S3, S4 and S5 in 2015. The final distance from the salt marsh edge to site S1 is about 2.26 km.
In order to evaluate the amount of sedimentation as a function of distance to the salt marsh edge, we considered the soil surface elevation and the edge of the salt marsh in 2012 as the baseline and displayed the relative soil surface elevation at sites S2-S5 in Figure 6. Since the magnitude of the surface sedimentation/erosion is much higher than the subsurface consolidation/expansion at sites S3-S5, we simply consider the changes in the soil surface elevation as the amount of sedimentation. In 2013, the relative soil surface elevation of sites S2 and S5 is lower than S3 and S4. The maximum amount of sedimentation occurs at about 0.8 km from the edge of the salt marsh. With the extension of the salt marsh edge, the soil surface elevation at sites S3-S5 increases. The most rapid deposition position moves to 0.64 km from the salt marsh edge (Figure 6). Overall, the accumulated sedimentation displays a parabolic relationship with the distance to the salt marsh edge which is consistent with the simulation results of D’Alpaos et al. (2007).
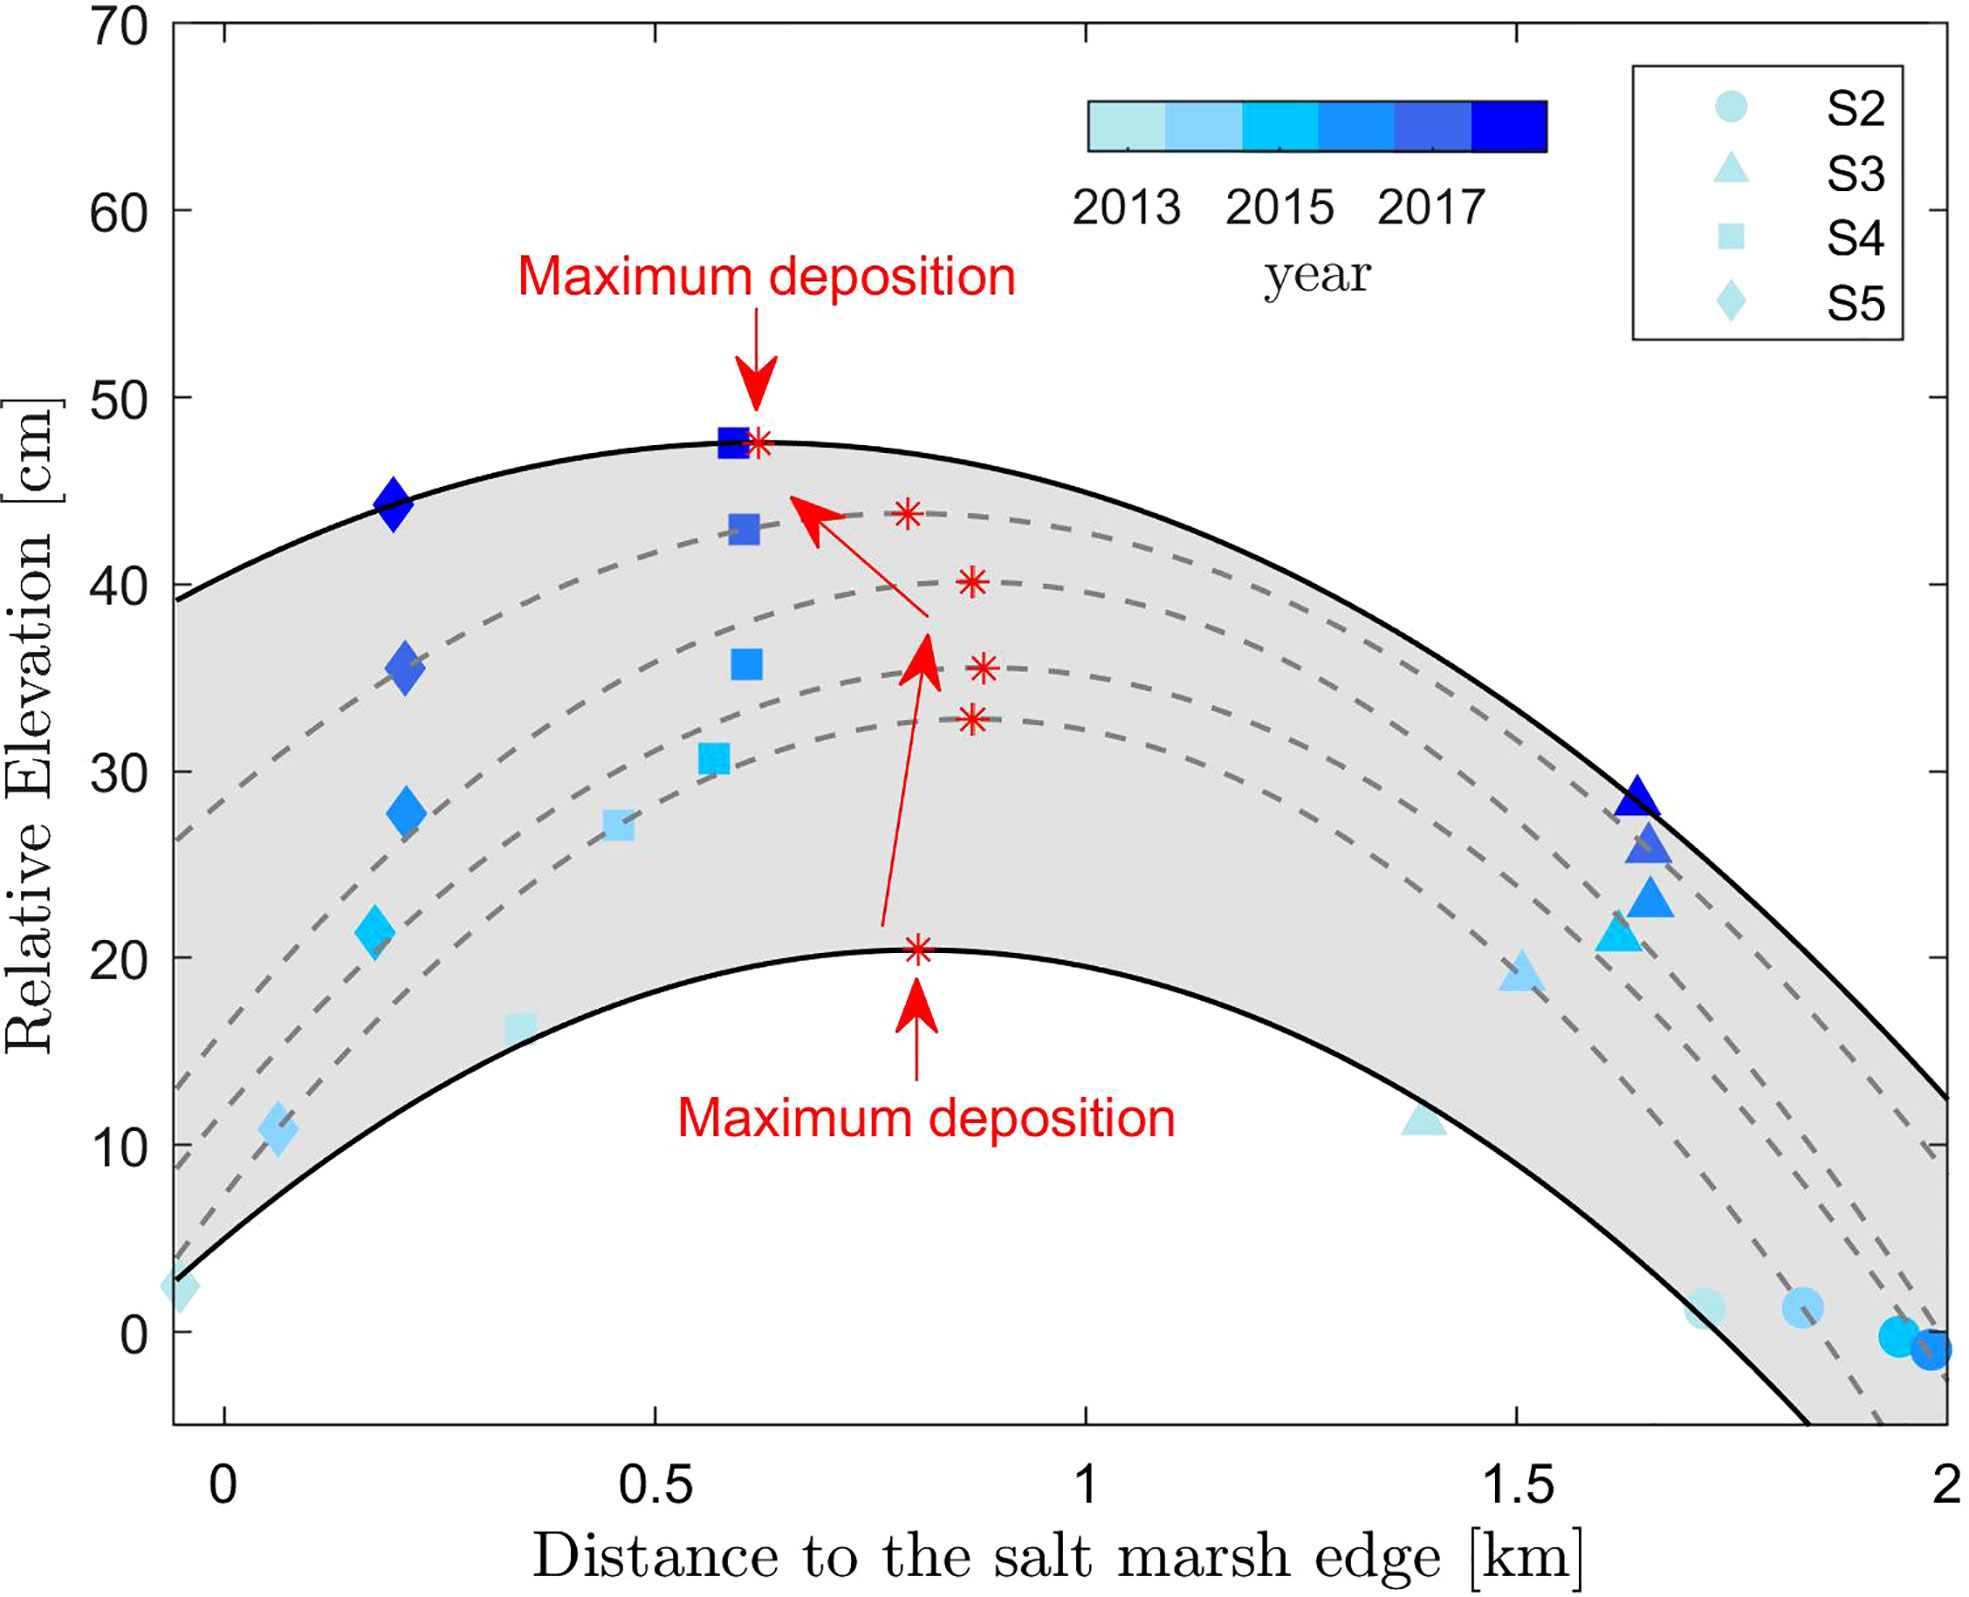
Figure 6 The relative soil surface elevation as a function of distance to the salt marsh edge. The shade highlights the changes in the soil surface elevation from 2012 to 2018 at sites S2-S5. The soil surface elevation is relative to that in 2012. Dashed lines and solid lines show the parabolic fitting of all the relative elevations in each year. Red stars highlight the maximum deposition position in each year and the variation trend is highlighted by red arrows.
The annual sedimentation rate is calculated and quantified as a function of the relative soil surface elevation (relative to the MHWL) (Figure 7A). The overall sedimentation rate displays a parabolic relationship with the soil surface elevation. The maximum sedimentation rate appears near the MHWL (zero on the x-axis, Figure 7A). When only the sites above the MHWL (>0 on the x-axis) are considered, the sedimentation rate follows an exponential relation, which is partly consistent with Temmerman et al. (2003). the sedimentation rate reduces to 0 gradually, with the increase in the soil surface elevation. Figure 7B displays the sedimentation rate as a function of distance to the salt marsh edge. At sites S3 and S4, which are around the MHWL, the sedimentation rate decreases linearly with the propagation of the salt marsh. At the salt marsh edge (site S5), the sedimentation rate first increases and then drops due to the marsh extension following a parabolic relationship. Since S5 locates at the marsh edge and the sedimentation rate is dynamic, here we further plot the normalized SR as a function of non-dimensionalized distance to the marsh edge for sites S2 to S4. SR is normalized by the soil surface elevation (Figure 7C). The distance to the marsh edge is non-dimensionalized by the distance to the marsh edge in 2018 when the salt marsh edge does not expand seaward any further. We note that the dataset congregates indicating that the SR is correlated to both the soil surface elevation and the distance to the marsh edge. With the further extension of the salt marsh edge, Dis/Disend is close to 1. In the meantime, the sedimentation rate reduces but soil surface elevation increases faster, which finally results in the reduction in the normalized SR. Compared to S3 and S4, S5 is more unstable at the marsh edge experiencing an increase to decrease in the sedimentation rate (Figure 7B). The rapid increase in soil surface elevation causes the normalized SR slightly lower than S3 and S4. Overall, a linear fitting well describes the relationship between the normalized SR and the non-dimensionalized distance to the marsh edge. This result might provide a comparison for future observations and numerical simulation of marsh dynamics.
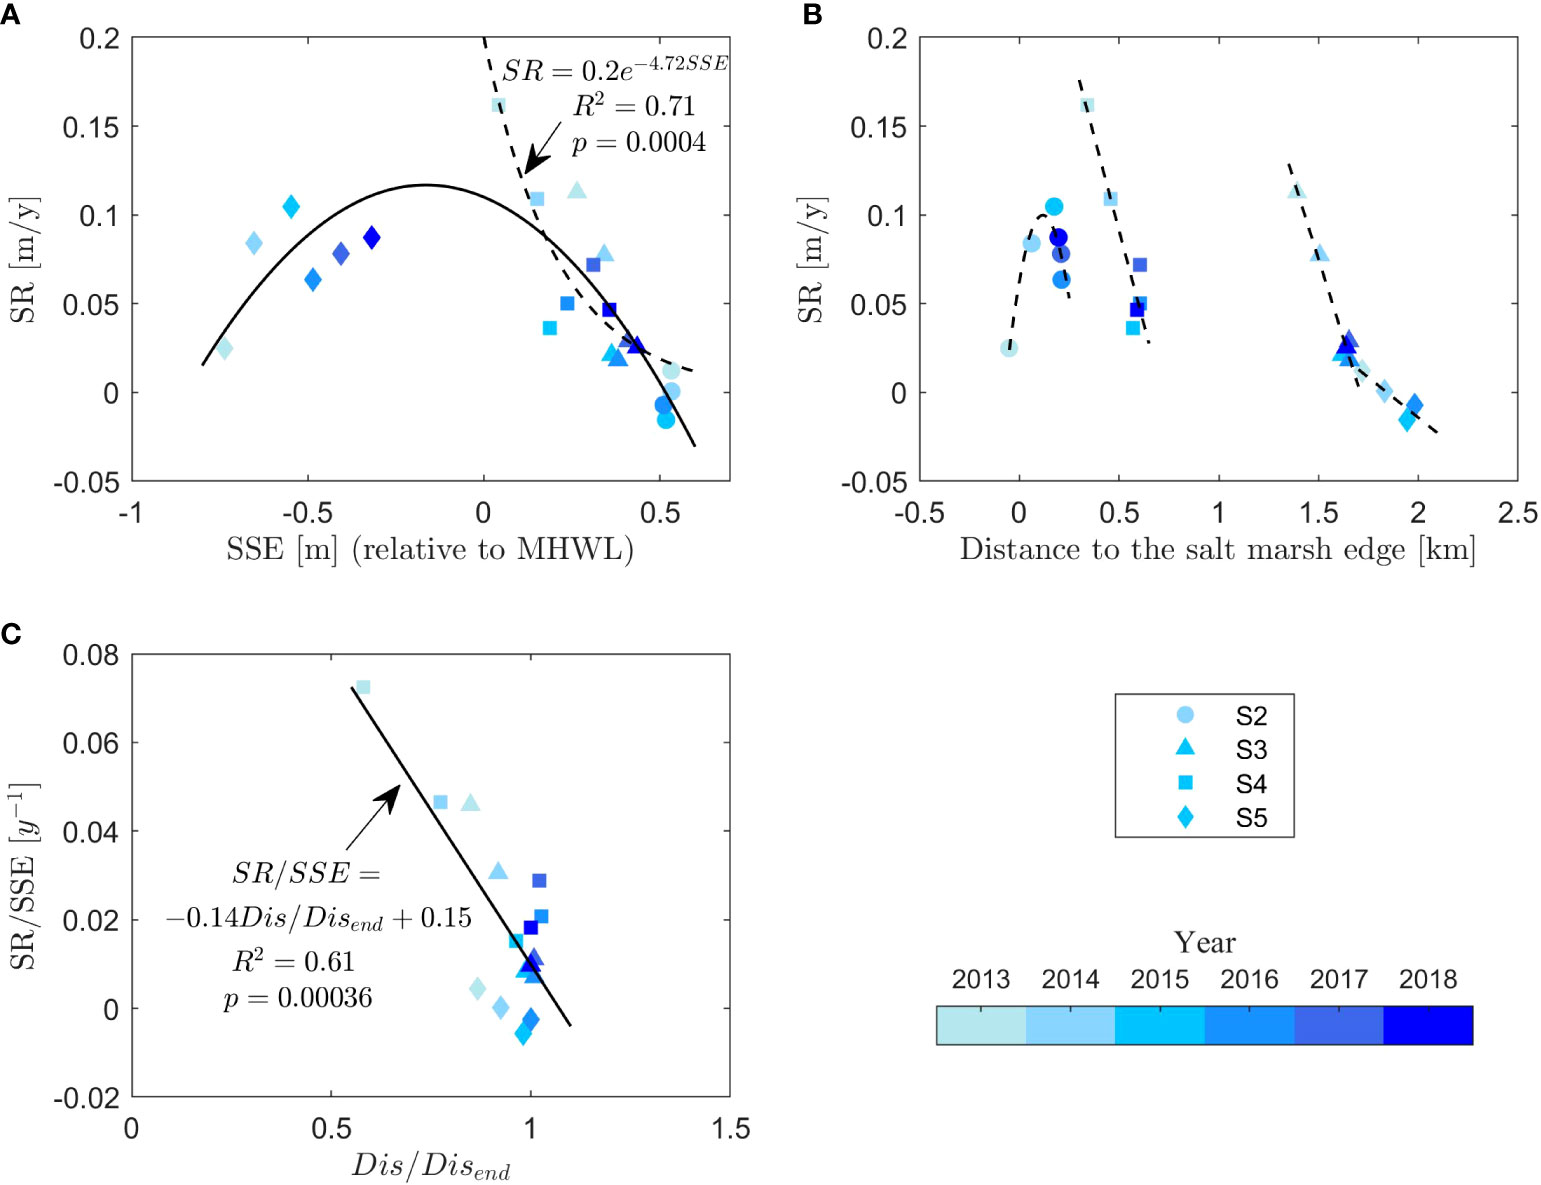
Figure 7 The yearly sedimentation rate as a function of (A) the relative soil surface elevation and (B) the distance from the salt marsh edge. (C) The normalized sedimentation rate by the soil surface elevation (SSE) as a function of the non-dimensionalized distance to the marsh edge (Dis) by the distance to the marsh edge in the year 2018 (Disend).
4 Discussions
Our field observations focused on the morphological evolution of the cross-shore tidal flats and quantified sedimentation rate as a function of the soil surface elevation and the distance to the salt marsh edge.
4.1 Morphological evolution of salt marshes
The morphological evolution of the central Jiangsu coast is mostly controlled by tide inundation, which can be considered as a representative of the tidal forcing (Gong et al., 2017). From June to November, the mean tidal level and inundation frequency increased. High inundation frequency indicates stronger tidal flows and larger suspended sediment concentration transported landward (Fan, 2010). Due to the progressive tidal wave, there is slack at the flood tide which allows sediment to deposit. In the meantime, the strong ability of salt marshes in attenuating wave energy and trapping sediment prevents the further suspension and seaward transport of the settled sediment (Temmerman et al., 2005; Mudd et al., 2010). Therefore, the soil surface elevation increases with inundation frequency. During the remaining months, the soil surface elevation varies slightly due to the low inundation frequency and suspended sediment transported to the salt marsh. This seasonal variation in the salt marsh has also been reported in other estuaries, e.g., meso- to macro-tidal Scheldt estuary (e.g., Temmerman et al., 2003) and Nanhui Mudflat (Fan, 2010). Our study further reveals the variation of the soil surface elevation at the edge of the salt marsh, which has been rarely investigated. When the observation site at the edge is not covered by salt marshes, there is less reduction in the flow velocity, and no significant sedimentation occurs in this region. Such tidal flats are affected by occasional wind-wave action, resulting in the occasional erosion. This could explain the erosion-deposition balance at the salt marsh edge when salt marshes are not present. Additionally, tidal flow-vegetation interactions at the edge of vegetated coastal areas create high turbulent zones that pick up more sediments around the fringe (Norris et al., 2017). When salt marshes are present, strong attenuation of forcing conditions causes rapid sedimentation near the salt marsh edge.
Our field data indicate that the sedimentation rate is a function of the soil surface elevation and the distance to the salt marsh edge. The sedimentation rate above the MHWL follows an exponential relationship. This result is consistent with Temmerman et al. (2003), who reported that the sedimentation rate declines exponentially with the increase of the distance from the salt marsh edge or the marsh soil surface elevation, but slightly different from Cahoon et al. (2011), who obtained that sedimentation rate reduces linearly as the increase in the relative site elevation through 6 years field investigations. However, when we further consider the sedimentation rate at the salt marsh edge, the sedimentation rate follows a parabolic relationship with the soil surface elevation. This can be explained by the development stage of the salt marsh. Before 2015, the salt marsh keeps propagating in the seaward direction. The salt marsh at the edge is sparse and characterized by low height. The density of salt marsh first increases and then drops in the landward direction. It has been previously reported that the local sedimentation rate is a function of the density of salt marsh (Gleason et al., 1979). Therefore, the sedimentation rate is low and unstable at the marsh edge, while it is higher in the more landward direction. When the edge site (S5) is covered by salt marshes, the soil surface elevation increases with a low sedimentation rate. With the further extension of salt marshes, the sedimentation rate increases, but is still not as large as sites around MHWL (Figure 7A). The identified parabolic relationship is generally consistent with the numerical results of D’Alpaos et al. (2007) demonstrating a sharp increase and then gradually drops of the sedimentation rate from the elevation of MWL to MHWL when the salt marsh is dominated by Spartina alterniflora. Since there are no dense observation sites set up near the marsh edge, we are unable to detect a more detailed sedimentation pattern at the very edge region. Our study reports a gentler variation of the sedimentation rate in early stages (before 2015) when salt marshes keep propagating seaward (Figure 6). However, after the edge of the salt marsh reaches a steady status (after 2015), the maximum deposition position shift rapidly towards the marsh edge. This should be explained by the density of the salt marshes at the edge. After reaching the steady status, the low-height and low-density salt marshes could be slowly destroyed leaving the high and dense salt marshes at the edge. In this case, the mean velocity reduces more significantly and more sediment is settled down near the edge. Therefore, the maximum deposition point could shift towards the marsh edge, but more investigation on the marsh density is needed.
4.2 On the limit of the salt marsh growth
Our field observations also reveal the limit of the growth of salt marshes. As it is shown in Figure 2, salt marshes stop propagation in 2015 at this cross-shore tidal flat profile. The final location of the salt marsh edge is 2.27 m from Site S1 where the soil surface elevation is 1.3 m, which is 0.8 m below the MHWL. This is greater than that reported by Morris et al. (2002) that the lowest limit is located at 0.5 - 0.6 m below the MHWL which could be attributed to the larger tidal range. The lowest limit of the marsh edge increases with the tidal range (Mckee and Patrick, 1988). The inundation frequency is 0.32 in 2016 when salt marshes stop further extending in the offshore direction. This is close to values reported by van Belzen et al. (2017) indicating that the maximum inundation frequency for salt marsh recovery is around 40%. Besides the water depth and the inundation frequency which limit the extension of salt marshes, here we further assume that the slope at the salt marsh edge might also be an important parameter affecting the salt marsh growth. With the increase in the soil surface elevation of site S5, the slope at the salt marsh edge increases gradually from 0.001 to 0.003 (Figure 5). When the slope reaches a certain threshold, it will be difficult for the salt marsh seedlings to survive and establish in the seaward direction. Hence the salt marsh cannot propagate any longer.
Previous studies have reported two different types of relationship, parabolic and linear, between the water depth and the biomass. In this study, we did not quantify the biomass, but the density of salt marshes is linearly related to the biomass. According to our field observations, we noted the salt marsh is sparse at the edge before reaching a steady status with minimum changes in the marsh edge, which indicates low biomass at the salt marsh edge with a large water depth. Visually, the density of salt marshes increases and then decreases in the landward direction, indicating that the biomass seemingly follows a parabolic relationship. However, after the salt marsh reaches a steady status, it stops propagating seaward. The sparse salt marsh at the edge is exposed to strong tidal currents and occasional wave conditions and they may not survive or further extend in the offshore direction. This will potentially cause the retreat of the salt marsh, leaving a high and dense salt marsh at the edge. In this situation, the biomass might follow a linear relationship. Overall, our study implies that both models well describe the salt marsh dynamic, but at different developing stages.
4.3 Implications for morphodynamic modelling
We have demonstrated a medium-term temporal and spatial variation of the sedimentation in the marsh region using field observations, which is rarely investigated. Our results further revealed that the sedimentation rate is associated with hydrodynamics, distance to the marsh edge and the soil surface elevation. The outcomes of the relationship between sedimentation rate with the soil surface elevation and the distance to the marsh edge can provide a potential function for large-scale numerical simulations, which might lead to a better prediction of the evolution of tidal flats considering the influence of marsh extension.
The morphological evolution of the tidal flat is an extremely complicated process, and more field observations are imperative to understand the underlying mechanism of sedimentation in the salt marsh region. Even though the adaption to sea level rise can make salt marshes reach equilibrium in the vertical direction (Kirwan et al., 2010), they are inherently unstable in the horizontal direction due to the marsh edge retreat (Feagin et al., 2009; Francalanci et al., 2013; Bendoni et al., 2016; Zhao et al., 2022), leading to a dynamic behavior of marsh border retreat and vegetation colonization. As a result, the feedback between the soil surface elevation, salt marsh expansion, lateral marsh edge retreat and hydrodynamics should be all taken into account. Further investigations are needed to better understand salt marsh dynamics providing robust predictions of the morphological evolution of tidal flats.
5 Conclusions
We performed medium-term field observations of salt marsh elevations in the central part of the Jiang coast (China) and extracted the marsh edge from remote sensing images. Our field observations cover a period of rapid marsh extension until they reach a steady status with a minimum change in the location of the salt marsh edge. The salt marsh edge moved 400 m from 2012 to 2014 in the seaward direction and stopped propagating afterwards. The marsh elevation increases constantly, and the slope becomes steeper at the marsh edge. The soil surface elevation consistently increases with the inundation frequency from June to November. The monthly sedimentation rate is linearly related to the mean inundation frequency. The sedimentation rate changes abruptly in 2015 because of the growth stage of salt marshes. Overall, the spatial sedimentation rate is a function of the distance to the marsh edge and the marsh topography. The sedimentation rate displays a parabolic relationship with the surface topography with the maximum sedimentation rate occurring around MHWL. Meanwhile, the sedimentation rate decreases with the distance to the marsh edge. This study adds to the understanding of the morphological evolution of tidal flats in relation to the salt marsh edge and provides a formidable dataset to test models of biomorphodynamics.
Data availability statement
The original contributions presented in the study are included in the article/Supplementary Material. Further inquiries can be directed to the corresponding author.
Author contributions
CJ: Data visualization, Manuscript writing, Funding support. ZG: Review, Editing, Project administration, Funding support. LS: Field observations, Image processing, Data analysis. KZ: Review and Editing. ROT: Review and editing. JSJ: Review and Editing. LG: Review and Editing. GC: Review and Editing. All authors contributed to the article and approved the submitted version.
Funding
This work is funded by China Postdoctoral Science Foundation (No. 2022M711020) and National Nature Science Foundation (No. 51925905)
Acknowledgments
The authors thank Charlie Emma Louise Thompson and Gerardo M. Perillo for their comments. Chuang Jin acknowledges Huan Li, Qian Zhang, JunCheng Hang and Beibei Xu for contributing to the field observations. Chuang Jin is supported by the funding of China Postdoctoral Science Foundation. Zheng Gong acknowledges the funding of National Nature Science Foundation for the support of field observation work.
Conflict of interest
The authors declare that the research was conducted in the absence of any commercial or financial relationships that could be construed as a potential conflict of interest.
Publisher’s note
All claims expressed in this article are solely those of the authors and do not necessarily represent those of their affiliated organizations, or those of the publisher, the editors and the reviewers. Any product that may be evaluated in this article, or claim that may be made by its manufacturer, is not guaranteed or endorsed by the publisher.
References
Allen J. R. L. (1994). A continuity-based sedimentological model for temperate-zone tidal salt marshes. J. Geol. Soc Lond. 151, 41–49. doi: 10.1144/gsjgs.151.1.0041
Anderson M. E., Smith J. M. (2014). Wave attenuation by flexible, idealized salt marsh vegetation. Coast. Eng. 83, 82–92. doi: 10.1016/j.coastaleng.2013.10.004
Bakker J. P., Esselink P., Dijkema K. S., Van Duin W. E., De Jong D. J. (2002). “Restoration of salt marshes in the Netherlands,” in Ecological restoration ofAquatic and semi-aquatic ecosystems in the Netherlands (NW Europe). Eds. Nienhuis P. H., Gulati R. D. (Dordrecht: Springer Netherlands), 29–51.
Balke T., Stock M., Jensen K., Bouma T. J., Kleyer M. (2016). A global analysis of the seaward salt marsh extent: The importance of tidal range. Water Resour. Res. 52 (5), 3775–3786. doi: 10.1002/2015WR018318
Bendoni M., Mel R., Solari L., Lanzoni S., Francalanci S., Oumeraci H. (2016). Insights into lateral marsh retreat mechanism through localized field measurements. Water Resour. Res. 52 (2), 1446–1464. doi: 10.1002/2015WR017966
Bouma T. J., van Belzen J., Balke T., van Dalen J., Klaassen P., Hartog A. M., et al. (2016). Short-term mudflat dynamics drive long-term cyclic salt marsh dynamics. Limnol. Oceanogr. 61 (6), 2261–2275. doi: 10.1002/lno.10374
Bouma T. J., van Duren L., Temmerman S., Claverie T., Blanco- Garcia A., Ysebaert T., et al. (2007). Spatial flow and sedimentation patterns within patches of epibenthic structures: Combining field, flume and modelling experiments. Cont. Shelf Res. 27, 1020–1045. doi: 10.1016/j.csr.2005.12.019
Brückner M. Z. M., Schwarz C., van Dijk W. M., van Oorschot M., Douma H., Kleinhans M. G. (2019). Salt marsh establishment and eco-engineering effects in dynamic estuaries determined by species growth and mortality. J. Geophys. Res.: Earth Surf. 124 (12), 2962–2986. doi: 10.1029/2019JF005092
Cahoon D. R., Lynch J. C., Hensel P. F., Boumans R., Perez B. C., Segura B., et al. (2002). High-precision measurements of sediment elevation: I. recent improvements to the sediment-erosion table. J. Sediment. Res. 72 (5), 730–733. doi: 10.1306/020702720730
Cahoon D. R., Reed D. J., Day J. W. (1995). Estimating shallow subsidence in microtidal salt marshes of the southeastern united states: Kaye and barghoorn revisited. Mar. Geol. 128 (1–2), 1–9. doi: 10.1016/0025-3227(95)00087-F
Cahoon D. R., White D. A., Lynch J. C. (2011). Sediment infilling and wetland formation dynamics in an active crevasse splay of the Mississippi river delta. Geomorphology 131 (3–4), 57–68. doi: 10.1016/j.geomorph.2010.12.002
Chen Y., Li Y., Thompson C., Wang X., Cai T., Chang Y. (2018). Differential sediment trapping abilities of mangrove and saltmarsh vegetation in a subtropical estuary. Geomorphology 318, 270–282. doi: 10.1016/j.geomorph.2018.06.018
Chen X., Zhang C., Paterson D. M., Townend I. H., Jin C., Zhou Z., et al. (2019). The effect of cyclic variation of shear stress on non-cohesive sediment stabilization by microbial biofilms: the role of ‘biofilm precursors.’. Earth Surf. Process. Land. 44 (7), 1471–1481. doi: 10.1002/esp.4573
D’Alpaos A., Lanzoni S., Marani M., Rinaldo A. (2007). Landscape evolution in tidal embayments: Modeling the interplay of erosion, sedimentation, and vegetation dynamics. J. Geophys. Res. 112, F01008. doi: 10.1029/2006JF000537
Fagherazzi S., Kirwan M. L., Mudd S. M., Guntenspergen G. R., Temmerman S., Rybczyk J. M., et al. (2012). Numerical models of salt marsh evolution: Ecological, geormorphic, and climatic factors. Rev. Geophys. 50 (2011), 1–28. doi: 10.1029/2011RG000359.1.INTRODUCTION
Fan D. (2010). “Open-coast tidal flats,” in Principles of tidal sedimentology. Eds. Davis R. A., Dalrymple R. W. (Dordrecht: Springer Netherlands), 187–229. doi: 10.1007/978-94-007-0123-6_9
Feagin R. A., Lozada-Bernard S. M., Ravens T. M., Möller I., Yeager K. M., Baird A. H. (2009). Does vegetation prevent wave erosion of salt marsh edges? Proc. Natl. Acad. Sci. 106 (25), 10109–10113. doi: 10.1073/pnas.0901297106
Francalanci S., Bendoni M., Rinaldi M., Solari L. (2013). Ecomorphodynamic evolution of salt marshes: Experimental observations of bank retreat processes. Geomorphology 195 (Supplement C), 53–65. doi: 10.1016/j.geomorph.2013.04.026
French J. R. (1993). Numerical-simulation of vertical marsh growth and adjustment to accelerated Sea-level rise, north Norfolk, UK, earth surf. Process. Land. 18, 63–81. doi: 10.1002/esp.3290180105
Friedrichs C. T. (2011). Tidal flat morphodunamics: a synthesis. Earth Syst. Environ. Sci. 3, 137–170. doi: 10.1016/j.nano.2009.07.003
Geng L., D’Alpaos A., Sgarabotto A., Gong Z., Lanzoni S. (2021). Intertwined eco-morphodynamic evolution of salt marshes and emerging tidal channel networks. Water Resour. Res. 57, e2021WR030840. doi: 10.1029/2021WR030840
Gleason M. L., Elmer D. A., Pien N. C., Fisher J. S. (1979). Effects of stem density upon sediment retention by salt marsh cord grass, spartina alterniflora loisel. Estuar. 2, 271–273. doi: 10.2307/1351574
Gong Z., Jin C., Zhang C., Zhou Z., Zhang Q., Li H. (2017). Temporal and spatial morphological variations along a cross-shore intertidal profile, jiangsu, China. Cont. Shelf Res. 144, 1–9. doi: 10.1016/j.csr.2017.06.009
Green M. O., Coco G. (2007). Sediment transport on an estuarine intertidal flat: Measurements and conceptual model of waves, rainfall and exchanges with a tidal creek. Estuar. Coast. Shelf Sci. 72 (4), 553–569. doi: 10.1016/j.ecss.2006.11.006
Hughes A. L. H., Wilson A. M., Morris J. T. (2012). Hydrologic variability in a salt marsh: Assessing the links between drought and acute marsh dieback. Estuar. Coast. Shelf Sci. 111, 95–106. doi: 10.1016/j.ecss.2012.06.016
Hu Z., Stive M. J. F., Zitman T. J., Ye Q. H., Wang Z. B., Luijendijk A., et al. (2011). “Interaction between hydrodynamics and salt marsh dynamics: An example from jiangsu coast,” in 2011 Proceedings of the 6th International Conference. 1079–1087. doi: 10.1142/9789814366489_0128
Jin C., Coco G., Tinoco R. O., Ranjan P., Gong Z., Dutta S., et al. (2022). High-resolution Large eddy simulations of vortex dynamics over ripple defects under oscillatory flow. J. Geophys. Res.: Earth Surf. 127 (3), 1–24. doi: 10.1029/2021jf006328
Jin C., Gong Z., Geng L., Zhao K., Xu B., Coco G. (2018). Observations of surface and subsurface processes on a saltmarsh in the central jiangsu coast (China). J. Coast. Res. 85 (85), 296–300. doi: 10.2112/SI85-060.1
Kirwan M. L., Guntenspergen G. R., D’Alpaos A., Morris J. T., Mudd S. M., Temmerman S. (2010). Limits on the adaptability of coastal marshes to rising sea level. Geophys. Res. Lett. 37 (23). doi: 10.1029/2010GL045489
Kirwan M. L., Temmerman S., Skeehan E. E., Guntenspergen G. R., Fagherazzi S. (2016). Overestimation of marsh vulnerability to sea level rise. Nat. Climate Change 6 (3), 253–260. doi: 10.1038/nclimate2909
Krauss K. W., Cahoon D. R., Allen J. A., Ewel K. C., Lynch J. C., Cormier N. (2010). Surface elevation change and susceptibility of different mangrove zones to Sea-level rise on pacific high islands of Micronesia. Ecosystems 13 (1), 129–143. doi: 10.1007/s10021-009-9307-8
Le Hir P., Roberts W., Cazaillet O., Christie M., Bassoullet P., Bacher C. (2000). Characterization of intertidal flat hydrodynamics. Cont. Shelf Res. 20 (12–13), 1433–1459. doi: 10.1016/S0278-4343(00)00031-5
Lovelock C. E., Adame M. F., Bennion V., Hayes M., Reef R., Santini N., et al. (2015). Sea Level and turbidity controls on mangrove soil surface elevation change. Estuarine, coastal and shelf science. 153, 1–9. doi: 10.1016/j.ecss.2014.11.026
Marani M., D’Alpaos A., Lanzoni S., Santalucia M. (2011). Understanding and predicting wave erosion of marsh edges. Geophys. Res. Lett. 38 (21), L21401. doi: 10.1029/2011gl048995
Mckee K. L., Patrick W. H. (1988). The relationship of smooth cordgrass (Spartina alterniflora) to tidal datums: A review. Estuaries 11 (3), 143–151. doi: 10.2307/1351966
Möller I., Kudella M., Rupprecht F., Spencer T., Paul M., Van Wesenbeeck B. K., et al. (2014). Wave attenuation over coastal salt marshes under storm surge conditions. Nat. Geosci. 7 (10), 727–731. doi: 10.1038/NGEO2251
Morris J. T. (2006). Competition among marsh macrophytes by means of geomorphological displacement in the intertidal zone. Estuar. Coast. Shelf Sci. 69 (3–4), 395–402. doi: 10.1016/j.ecss.2006.05.025
Morris J. T., Sundareshwar P. V., Nietch C. T., Kjerfve B., Cahoon D. R. (2002). Responses of coastal wetlands to rising sea level. Ecol. 83, 2869.e2877. doi: 10.1890/0012-9658(2002)083[2869:ROCWTR]2.0.CO;2
Mudd S. M., D’Alpaos A., Morris J. T. (2010). How does vegetation affect sedimentation on tidal marshes? investigating particle capture and hydrodynamic controls on biologically mediated sedimentation. J. Geophys. Res.: Earth Surf. 115 (F3), F03029. doi: 10.1029/2009JF001566
Mudd S. M., Fagherazzi S., Morris J. T., Furbish D. J. (2004). Flow, sedimentation, and biomass production on a vegetated salt marsh in South Carolina: Toward a predictive model of marsh morphologic and ecologic evolution, in The Ecogeomorphology of Tidal Marshes, Coastal Estuarine Stud., vol. 59, edited by Fagherazzi S., Marani M., Blum L. K., pp. 165–188, AGU, Washington, D. C.
Nepf H. (2012). Flow and transport in regions with aquatic vegetation. Annu. Rev. Fluid Mech. 44, 123–142. doi: 10.1146/annurev-fluid-120710-101048
Norris B. K., Mullarney J. C., Bryan K. R., Henderson S. M. (2017). The effect of pneumatophore density on turbulence: a field study in a sonneratia-dominated mangrove forest, Vietnam. Cont. Shelf Res. 147, 114–127. doi: 10.1016/j.csr.2017.06.002
Pethick J. S. (1981). Long-term accretion rates on tidal marshes. journal of. Sediment. Petrol. 61, 571.e577. doi: 10.1306/212F7CDE-2B24-11D7-8648000102C1865D
Rogers K., Saintilan N., Woodroffe C. D. (2014). Surface elevation change and vegetation distribution dynamics in a subtropical coastal wetland: Implications for coastal wetland response to climate change. Estuar. Coast. Shelf Sci. 149 (0), 46–56. doi: 10.1016/j.ecss.2014.07.009
San Juan J. E., Veliz Carrillo G., Tinoco R. O. (2019). Experimental observations of 3D flow alterations by vegetation under oscillatory flows. Environ. Fluid Mech. 19 (6), 1497–1525. doi: 10.1007/s10652-019-09672-2
Schwarz C., Gourgue O., van Belzen J., Zhu Z., Bouma T. J., van de Koppel J., et al. (2018). Self-organization of a biogeomorphic landscape controlled by plant life-history traits. Nat. Geosci. 11 (9), 672–677. doi: 10.1038/s41561-018-0180-y
Shi B. W., Yang S. L., Wang Y. P., Yu Q., Li M. L. (2014). Intratidal erosion and deposition rates inferred from field observations of hydrodynamic and sedimentary processes: A case study of a mudflat–saltmarsh transition at the Yangtze delta front. Cont. Shelf Res. 90, 109–116. doi: 10.1016/j.csr.2014.01.019
Swales A., Denys P., Pickett V. I., Lovelock C. E. (2016). Evaluating deep subsidence in a rapidly-accreting mangrove forest using GPS monitoring of surface-elevation benchmarks and sedimentary records. Mar. Geol. 380, 205–218. doi: 10.1016/j.margeo.2016.04.015
Temmerman S., Bouma T. J., Govers G., Wang Z. B., De Vries M. B., Herman P. M. J. (2005). Impact of vegetation on flow routing and sedimentation patterns: Three-dimensional modeling for a tidal marsh. J. Geophys. Res.: Earth Surf. 110 (4), 1–18. doi: 10.1029/2005JF000301
Temmerman S., Govers G., Wartel S., Meire P. (2003). Spatial and temporal factors controlling short-term sedimentation in a salt and freshwater tidal marsh, scheldt estuary, Belgium, SW Netherlands. Earth Surf. Process. Land. 28 (7), 739–755. doi: 10.1002/esp.495
Tinoco R. O., Coco G. (2018). Turbulence as the main driver of resuspension in oscillatory flow through vegetation. J. Geophys. Res.: Earth Surf. 123 (5), 981–904. doi: 10.1002/2017JF004504
Tinoco R. O., San Juan J. E., Mullarney J. C. (2020). Simplification bias: lessons from laboratory and field experiments on flow through aquatic vegetation. Earth Surf. Process. Land. 45 (1), 121–143. doi: 10.1002/esp.4743
van Belzen J., van de Koppel J., Kirwan M. L., van der Wal D., Herman P. M. J., Dakos V., et al. (2017). Vegetation recovery in tidal marshes reveals critical slowing down under increased inundation. Nat. Commun. 8 (1), 15811. doi: 10.1038/ncomms15811
van de Koppel J., van der Wal D., Bakker J. P., Herman P. M. J. (2005). Self-organization and vegetation collapse in salt marsh ecosystems. Am. Nat. 165 (1), 1–12. doi: 10.1086/426602
van Eerden M. R., Drent R. H., Stahl J., Bakker J. P. (2005). Connecting seas: Western palaearctic continental flyway for water birds in the perspective of changing land use and climate. Global Change Biol. 11 (6), 894–908. doi: 10.1111/j.1365-2486.2005.00940.x
Wang C., Temmerman S. (2013). Does biogeomorphic feedback lead to abrupt shifts between alternative landscape states?: an empirical study on intertidal flats and marshes. J. Geophys. Res.: Earth Surf. 118 (1), 229–240. doi: 10.1029/2012JF002474
Webb E. L., Friess D. A., Krauss K. W., Cahoon D. R., Guntenspergen G. R., Phelps J. (2013). A global standard for monitoring coastal wetland vulnerability to accelerated sea-level rise. Nat. Climate Change 3 (5), 458–465. doi: 10.1038/nclimate1756
Willemsen P., Borsje B., Hulscher S., van der Wal D., Zhu Z., Oteman B., et al. (2018). Quantifying bed level change at the transition of tidal flat and salt marsh: Can we understand the lateral location of the marsh edge? J. Geophys. Res.: Earth Surf. 23, 2509–2524. doi: 10.1029/2018JF004742
Yang J., Nepf H. (2018). A turbulence-based bed-load transport model for bare and vegetated channels. Geophys. Res. Lett. 45,10, 428–10,436. doi: 10.1029/2018GL079319
Zhang Q., Gong Z., Zhang C., Lacy J., Jaffe B., Xu B., et al. (2021). The role of surges during periods of very shallow water on sediment transport over tidal flats. Front. Mar. Sci. 8. doi: 10.3389/fmars.2021.599799
Zhang Q., Gong Z., Zhang C. K., Townend I., Jin C., Li H. (2016). Velocity and sediment surge: What do we see at times of very shallow water on intertidal mudflats? Cont. Shelf Res. 113, 10–20. doi: 10.1016/j.csr.2015.12.003
Zhao K., Coco G., Gong Z., Darby S. E., Lanzoni S., Xu F., et al. (2022). A review on bank retreat: Mechanisms, observations, and modeling. Rev. Geophys. 60, e2021RG000761. doi: 10.1029/2021RG000761
Zhao K., Lanzoni S., Gong Z., Coco G. (2021). A numerical model of bank collapse and river meandering. Geophys. Res. Lett. 48, e2021GL093516. doi: 10.1029/2021GL093516
Keywords: salt marsh, tidal flat, morphodynamics, sedimentation rate, field observations
Citation: Jin C, Gong Z, Shi L, Zhao K, Tinoco RO, San Juan JE, Geng L and Coco G (2022) Medium-term observations of salt marsh morphodynamics. Front. Mar. Sci. 9:988240. doi: 10.3389/fmars.2022.988240
Received: 07 July 2022; Accepted: 24 August 2022;
Published: 12 September 2022.
Edited by:
Javier Benavente, University of Cádiz, SpainReviewed by:
Charlie Emma Louise Thompson, University of Southampton, United KingdomGerardo M. Perillo, CONICET Instituto Argentino de Oceanografía (IADO), Argentina
Copyright © 2022 Jin, Gong, Shi, Zhao, Tinoco, San Juan, Geng and Coco. This is an open-access article distributed under the terms of the Creative Commons Attribution License (CC BY). The use, distribution or reproduction in other forums is permitted, provided the original author(s) and the copyright owner(s) are credited and that the original publication in this journal is cited, in accordance with accepted academic practice. No use, distribution or reproduction is permitted which does not comply with these terms.
*Correspondence: Zheng Gong, Z29uZ3poZW5nQGhodS5lZHUuY24=