
94% of researchers rate our articles as excellent or good
Learn more about the work of our research integrity team to safeguard the quality of each article we publish.
Find out more
ORIGINAL RESEARCH article
Front. Mar. Sci., 23 August 2022
Sec. Marine Biotechnology and Bioproducts
Volume 9 - 2022 | https://doi.org/10.3389/fmars.2022.986400
This article is part of the Research TopicMarine Microalgal-Derived Polysaccharides: from the Sources to Potential ApplicationsView all 4 articles
 Haiqing Xu1Jinzhi Yang1Xu Wang1Qing Peng1Yanxia Han1Xudong Liu1Kexin Liu1Shijuan Dou1,2Liyun Li1,2Guozhen Liu1,2,3*
 Ming Yang1,2,3*
Microalgae can effectively accumulate starch by using nutritional limitation methods in the context of bioalcohol fuel production. However, relatively few studies have focused on starch accumulation in microalgae and its molecular basis, especially under sulfur limitation conditions. In this study, the starch accumulation dynamics and physiological responses of Chlorella sorokiniana under sulfur starvation (SS) and sulfur replenishment (SR) conditions were investigated, and the genes involved in the transcriptional regulation were explored using RNA-seq. The starch content in C. sorokiniana cells significantly increased from 1.6% to 55.0% of dry weight within 24 h under SS conditions, and then, it decreased to 3.4% within 12 h after transition to SR conditions. However, cell growth was inhibited, and pigment content decreased under SS conditions. Using RNA-seq analysis, a total of 9720 differentially expressed genes (DEGs) induced by sulfur status were obtained. These genes were narrowed down to 454 starvation and replenishment cross-validated (SRV)-DEGs, among which 283 SRV-DEGs were significantly up-regulated and 171 SRV-DEGs were down-regulated under SS conditions, and returned to their previous state under SR conditions. The SRV-DEGs enriched in the sulfate metabolism pathway were all up-regulated under SS conditions after 6 h to speed up the sulfur metabolic cycle, and the transcriptional abundance of a sulfate transporter (SULTR4), cysteine synthase[O-acetylserine(thiol)-lyase] (OASTL), serine acetyltransferase (SAT), and methanethiol oxidase (SELENBP1) increased 8.6-fold, 12.6-fold, 8.7-fold, and 12.4-fold, respectively. Protein synthesis was correspondingly inhibited, which resulted in the reallocation of carbon and elevated the starch synthesis pathway, in which the expressions of glycogen branching enzyme (GBE) and starch synthase (SS) were up-regulated 12.0- and 3.0-fold, respectively. The fatty acid desaturase (FAD) and phosphatidic acid phosphatase (PAP) in the lipid synthesis pathway were strongly up-regulated 8.8- and 16.2-fold, respectively, indicating the competitive synthesis of lipids. The down-regulation of SRV-DEGs associated with carbon fixation, such as those in the Calvin cycle, possibly affected cell growth. The time-resolved transcriptional analysis identified the SRV-DEGs, revealing the underlying starch accumulation mechanism, as well as the relationship with cell growth and lipid synthesis.
Microalgae have been recognized as a potential feedstock for biofuel production, because they can efficiently capture CO2 via photosynthesis and can be continuously cultivated, regardless of the season or climate (Chen et al., 2013; Su et al., 2017). Microalgae accumulate lipids, primarily triacylglycerides (TAGs), which can be used for biodiesel production. Moreover, in the context of bioalcohol fuel production, microalgae can accumulate carbohydrates in the form of starch and cellulose, which can be used for biofuel fermentation (Chen et al., 2013). Importantly, the biomass conversion of microalgae is more effective than that of lignocellulosic materials because of the absence of lignin and its low hemicellulose content (Demuez et al., 2015).
The carbohydrates in microalgae are derived from photosynthesis and carbon fixation metabolism. It has been reported that the content of starch, which is the main form of carbohydrate, accumulated in microalgae varies with species and is dependent on the different culture conditions (Lakatos et al., 2019). In order to generate microalgae biomass with a high starch content, various studies have focused on (1) adjusting the environmental culture conditions, such as irradiance, temperature variation, pH shift, and CO2 supplement (Chen et al., 2013); (2) nutrient (nitrogen, phosphorus, and sulfur) limitations (Ran et al., 2019); and (3) metabolic regulation in carbohydrate synthesis and degradation (Wang et al., 2017).
The manipulation of nitrogen, phosphate, and sulfur supplies has been the most effective strategy for improving starch accumulation in several microalgae species, such as Tetraselmis subcordiformis (Yao et al., 2012; Yao et al., 2018), Parachlorella kessleri (Mizuno et al., 2013), Chlorella vulgaris (Fernandes et al., 2013), and Chlamydomonas reinhardtii (Gardner et al., 2012), in which the starch content was found to reach 37.0-69.3% of the dry biomass. The sulfur limitation (S-limitation) method seemed to be more effective than both the nitrogen and phosphate limitation methods (Brányiková et al., 2011; Ran et al., 2019). It is generally acknowledged that a lack of nutrients can exert stress on microalgae, leading to changes in cellular metabolic processes and the accumulation of energy storage metabolites, such as starch and lipids. However, this also causes oxidative stress, which leads to a decline in photosynthetic activity and, consequently, a reduction in the overall production of storage metabolites (Chen et al., 2013). It has been suggested that the tradeoff between microalgal growth and the production of storage metabolites should be carefully considered in order to optimize the nutrient manipulation strategy (Ran et al., 2019).
To further improve the overall starch accumulation for microalgae-based biofuel production, it is important to determine the parameters of the stress-induced accumulation of starch and the growth inhibition of microalgae, and to elucidate the underlying metabolic mechanisms. In recent years, the responses of microalgae, such as C. reinhardtii, Tetraselmis sp., Dunaliella tertiolecta, and Monoraphidium neglectum, to nutritional stress have been extensively investigated (González-Ballester et al., 2010; Tan et al., 2016; Jaeger et al., 2017; Lim et al., 2017). The gene expression pattern and regulatory mechanism triggered by N or S depletion for lipid production have been investigated, but without focus on the regulation of starch metabolism (Blaby et al., 2013; Tan et al., 2016; Jaeger et al., 2017; Mao et al., 2020). The omics data reported in the literature confirm that most starch biosynthetic enzymes, such as granule‐bound starch synthase, soluble starch synthase, and branching enzyme, were up-regulated with the accumulation of starch under nutrient starvation conditions, and several traditionally recognized starch degradative enzymes, such as starch phosphorylase and amylase, were up-regulated (Ran et al., 2019). The studies conducted using RNA-seq analysis usually obtain a large number of differentially expressed genes (DEGs), and the background is miscellaneous. Thus, starch accumulation in microalgae does not receive much research attention, and the molecular basis for improving starch accumulation and the growth inhibition of nutrient stress, the key factors involved in transcriptional regulation, are largely unclear, especially under sulfur stress conditions.
In this study, Chlorella sorokiniana, a fast-growing, thermotolerant, and high-yielding microalgae strain (Lizzul et al., 2018), was investigated to determine whether it could accumulate a high content of starch under sulfur starvation (SS) conditions. Then, the cells were transferred to sulfur replenishment (SR) conditions to reversely explore the effect of sulfur status on starch accumulation dynamics. Meanwhile, the physiological parameters, namely, cell growth, phenotype, pigment content, and chemical composition, were examined. A time-resolved transcriptome analysis was carried out during the transition of sulfur status, and the sulfur starvation and replenishment cross-validated (SRV)-DEGs were screened to elucidate the underlying mechanisms of starch accumulation and related metabolisms. The potential target genes were identified for the metabolic engineering of C. sorokiniana to further improve the capacity of starch production. The expected results could also provide the research basis for process regulation of marine Chlorella and related marine biofuel production.
C. sorokiniana UTEX1230 was purchased from the Culture Collection of Algae at the University of Texas at Austin (UTEX). The cultivation of C. sorokiniana was conducted in 500 mL triangular flasks on a shaker at 25°C, 100 rpm, and with a constant illumination of 80 μmol m−2 s−1. The normal growth (NG) condition was maintained in Tris-acetate-phosphate (TAP) medium (Harris, 1989). For sulfur starvation (SS) conditions, the MgSO4 in the TAP medium was replaced by MgCl2 at an equal molar concentration. In the second stage, for sulfur replenishment (SR) conditions, 1 mM Na2SO4 was added into the SS culture.
The cell growth of C. sorokiniana was determined by measuring the optical density at 750 nm with a spectrophotometer. The dry biomass yield was calculated based on the dry weight of C. sorokiniana and culture volume. For a pigment analysis, fresh samples (2 mL) were centrifuged at 12000 rpm for 3 min, and the pellet was resuspended in 2 mL dimethyl sulfoxide (DMSO). The mixture was then vortexed, and the suspension was centrifuged at 4000 rpm for 5 min to collect the supernatant. The optical densities of the supernatant were measured, and the contents of chlorophyll (chl) A, chl B, and carotenoid were calculated according to a method described in the literature (Wellburn, 1994).
The carbohydrate content in C. sorokiniana was measured according to the protocol of the National Renewable Energy Laboratory (Wychen and Laurens, 2013). Lyophilized materials weighing 25 mg in dry weight were treated with 72% (w/w) sulfuric acid for 1 h at 30°C in a 15 mL centrifuge tube with a screw cap. The samples were then diluted to 4% sulfuric acid with deionized water and autoclaved for 1 h at 121°C. After cooling, the supernatant was collected for glucose analyses using an SBA 40C bio-sense analyzer (Biology Institute, Shandong Academy of Sciences, China).
The starch content was determined using the enzymic method with thermostable α-amylase and amyloglucosidase (Aladdin, China). Thirty milligrams of lyophilized materials was mixed with 3 mL Na-acetate buffer (pH 5.0), then 0.125 µl α-amylase (2100 u/g) was added, and the solution was heated at 100°C for 60 min. After cooling, 0.125 µl amyloglucosidase (100,000 u/g) was added and heated at 60°C for 60 min. After hydrolysis, the glucose in the supernatant was analyzed using the SBA 40C bio-sense analyzer.
The lipid content was measured using the sulfo-phospho-vanillin (SPV) method (Mishra et al., 2014). The microalgae biomass (3 mg) was suspended in 100 μL water, and 2 mL of concentrated (98%) sulfuric acid was added. The solution was heated for 10 min at 100°C, and it was cooled for 5 min in an ice bath. A total of 5 mL of freshly prepared phospho-vanillin reagent was then added, and the sample was incubated in an incubator shaker for 15 min at 37°C and 200 rpm. The optical density at 530 nm was measured to quantify the lipid content. Corn oil was used to prepare the standard lipid stocks at 50 mg in 50 mL chloroform.
The protein content was measured using a BCA assay kit (Beyotime Institute of Biotechnology, China). Lyophilized microalgal cells were lysed by extraction solution, containing 50 mM Tris (pH 8.1), 1% sodium dodecyl sulfate (SDS), sodium pyrophosphate, β-glycerophosphate, sodium orthovanadate, sodium fluoride, EDTA, and phenylmethanesulfonyl fluoride (PMSF). The supernatant was collected to measure the optical density at 562 nm with the spectrophotometer.
The microalgal cells were fixed overnight in 2.5% glutaraldehyde buffer at 4°C. The cells were washed three times with 0.1 M phosphate buffer (pH7.4). The samples were post-fixed in 1% osmic acid at room temperature in the dark for 2 h, and they were dehydrated in gradient ethanol solutions (30%-50%-70%-80%-95%-100%) and in 100% acetone twice at room temperature. After osmotic embedding, polymerization, ultra-thin sectioning, and dyeing, the cellular structure of the cells was observed using a transmission electron microscope (HT7800/HT7700, HITACHI, Japan).
Total RNA was extracted using the plant RNA extraction kit (Tiangen Biotech Co., Ltd., Beijing, China). A total of 400 ng RNA per sample was used as input material for the RNA sample preparations. Sequencing libraries were generated using NEBNext® UltraTM RNA Library Prep Kit for Illumina® (NEB, USA) following the manufacturer’s recommendations, and index codes were added to attribute sequences to each sample. The procedure has been described in detail in the literature (Zhang et al., 2021). The clustering of the index-coded samples was performed on a cBot Cluster Generation System using TruSeq PE Cluster Kit v3-cBot-HS (Illumina). The RNA sequencing of each sample was conducted using an Illumina Novaseq platform (Novogene Co., Ltd, Tianjin, China), and 150 bp paired-end reads were generated.
The data obtained from the sequencing were first spliced into transcripts and subjected to hierarchical clustering using the corset program. RSEM software was used to calculate the gene expression level from the RNA-seq data. R software was used to perform statistics: Pearson correlation between all samples was calculated. Finally, differentially expressed genes (DEGs) between samples were identified, and clustering was carried out using DEseq2 software. The assembled genes were annotated using the BLASTx with an E-value threshold of 1.0 E−5 using the following databases: NCBI non-redundant protein sequences (NR), Clusters of Orthologous Groups of proteins (COG), Swiss-Prot, euKaryotic Ortholog Groups (KOG), Gene Ontology (GO), Protein Family (PFAM), and NCBI nucleotide sequences (NT).
Nine genes were selected for RT-PCR verification. Gene encoding β-actin was used as the internal control. Primers were designed using Primer CE software (Cao et al., 2010). The primers can be found in Supplementary File 1, Table S1. TransZol Up RNA Kit was used to extract the total RNA of C. sorokiniana. The cDNA template was obtained using reverse transcription and stored at -20°C for PCR analysis. The PCR reaction system was prepared according to the template, primer structure, and target fragment size in order to obtain the target band. The relative gene expression level was quantified using software Image-Pro Plus 6.0.
All experiments were conducted with at least three biological replicates. Experimental results were analyzed using one-way ANOVA with Duncan’s multiple range test (SPPS v. 20).
In order to determine the effect of sulfur status on the growth of C. sorokiniana, the cultures were observed at different time points under normal growth (NG), sulfur starvation (SS), and sulfur replenishment (SR) conditions by taking photos, and the growth rates and pigment content were investigated (Figure 1). In NG conditions, the culture of C. sorokiniana became green as the time increased, but it always maintained a lighter color under SS conditions (Figure 1A). After the transition from SS to SR status, it returned back to its original color within 48 h. The C. sorokiniana cells in the TAP medium maintained normal growth (Figures 1B, C). The OD750 nm value reached 3.2, and a 0.9 g/L dry biomass of C. sorokiniana was accumulated within 48 h. Under SS conditions, growth was significantly inhibited (P<0.01), and the OD value reached 2.7 within 48 h. As expected, the cell growth and biomass accumulation of C. sorokiniana recovered to a certain extent after SR.
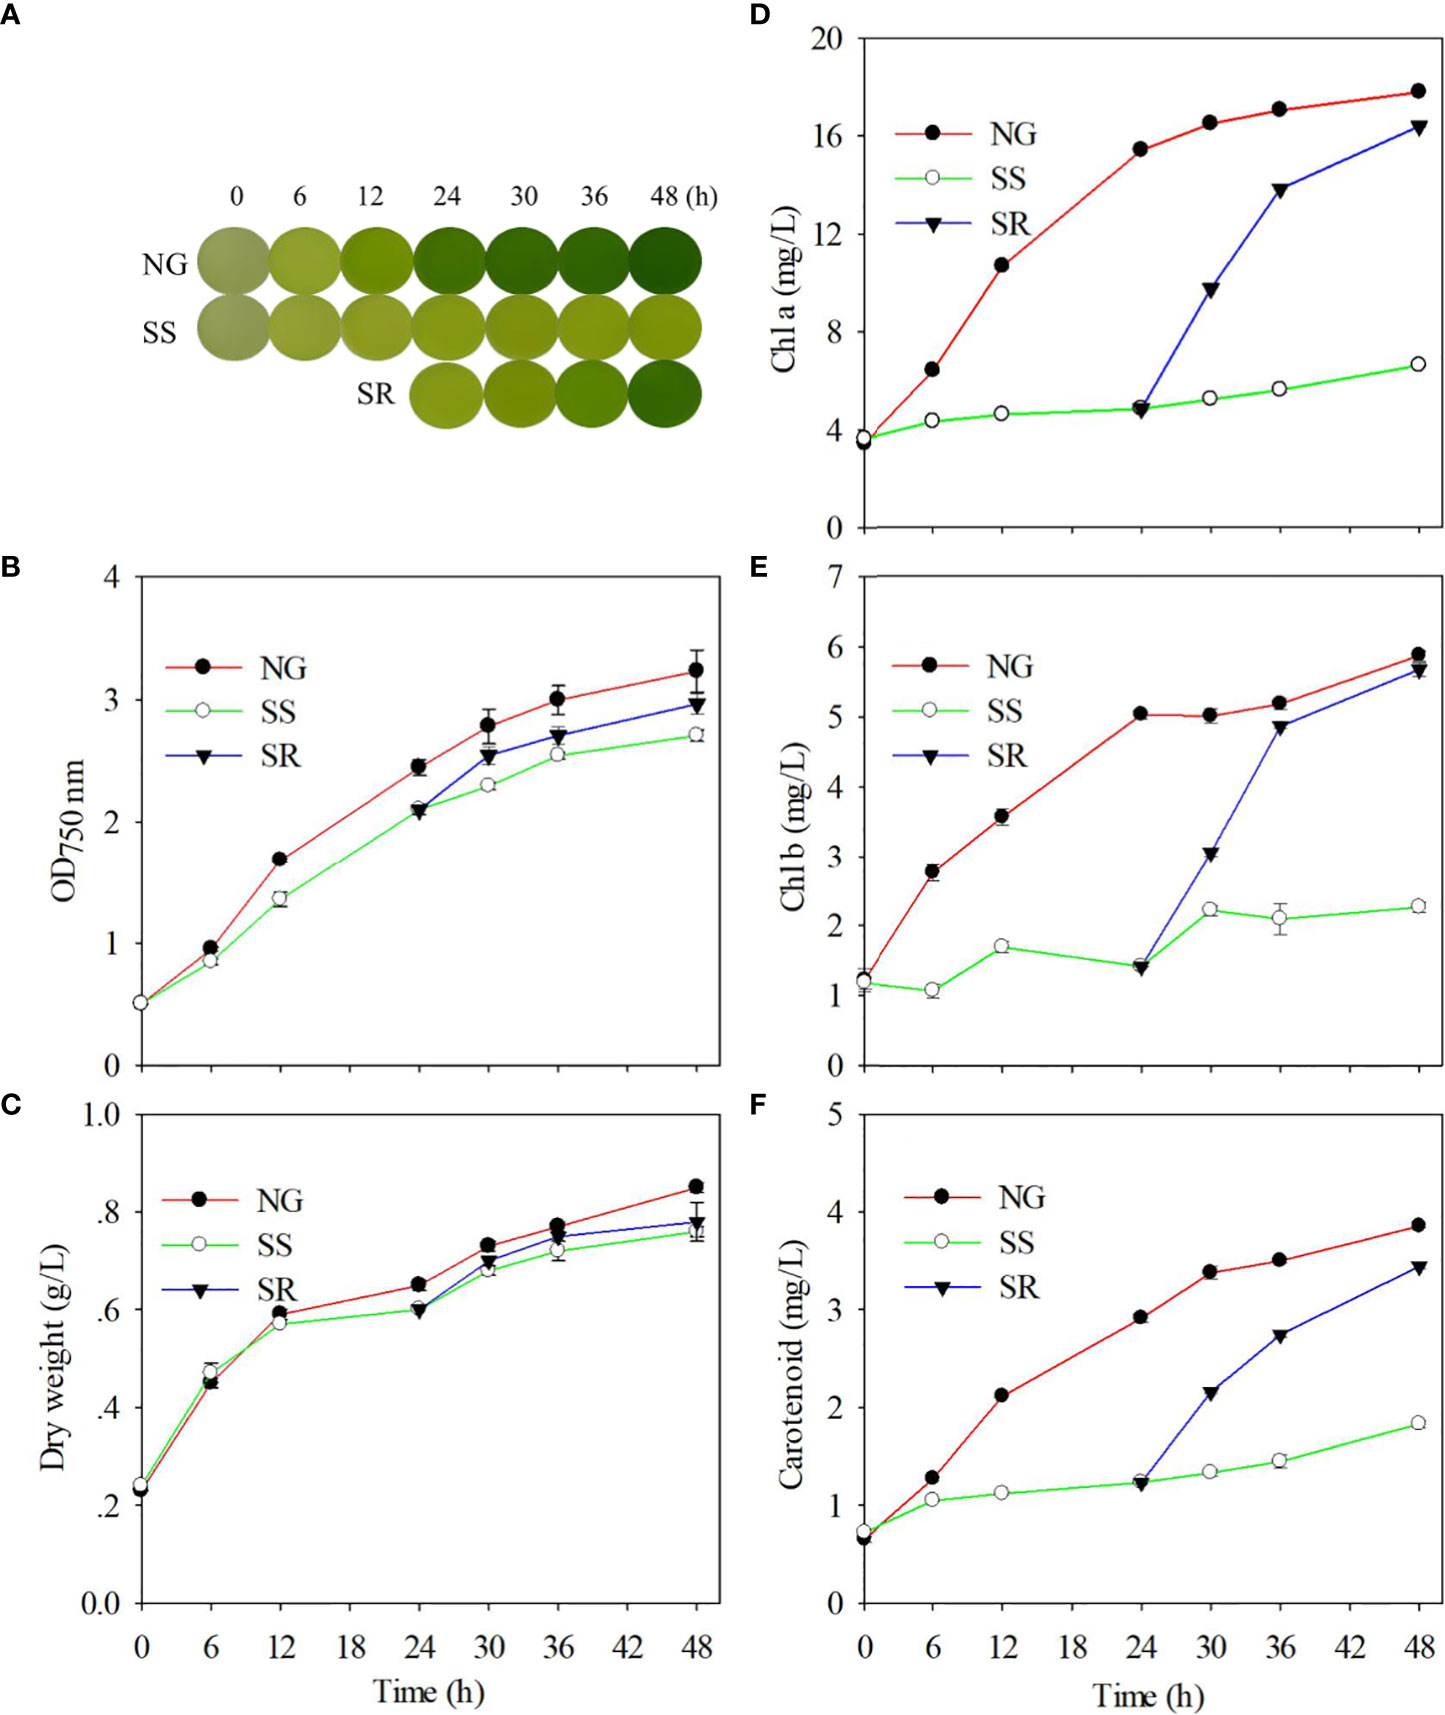
Figure 1 Effect of sulfur nutritional status on phenotype (A); optical density during growth (B); dry biomass accumulation (C); and contents of chl a (D), chl b (E), and carotenoid (F) of C. sorokiniana. NG, normal growth; SS, sulfur starvation; SR, replenishment.
The accumulation of chl a, chl b, and carotenoid in C. sorokiniana cells increased gradually under NG conditions and decreased substantially under SS conditions (P<0.01). Correspondingly, SR significantly increased the chlorophyll content (P<0.01) (Figures 1D–F). The changes in pigment content during the transition of sulfur status are in accordance with the phenotype alteration.
Next, the composition of the C. sorokiniana biomass, namely, carbohydrates, starch, lipids, and proteins, was analyzed (Figure 2). The carbohydrate content slightly increased within 6 h under NG conditions, and then it remained stable up until 48 h (Figure 2A). By comparison, the carbohydrate content under SS conditions was significantly higher than that under NG conditions after 6 h (P<0.01). It increased from 4.5 to 58.3% of dry weight within 24 h, and then it slightly decreased up until 48 h. Under SR conditions, starting from 24 h, the carbohydrate content significantly decreased within 30 h (P<0.01), and then it returned to the same level as that under NG conditions by 36 h. The accumulation dynamics of starch were similar to those of carbohydrates (Figure 2B). The maximum starch content of 55.0% was obtained under SS conditions. Starch accounts for approximately 94.3% of the carbohydrate content.
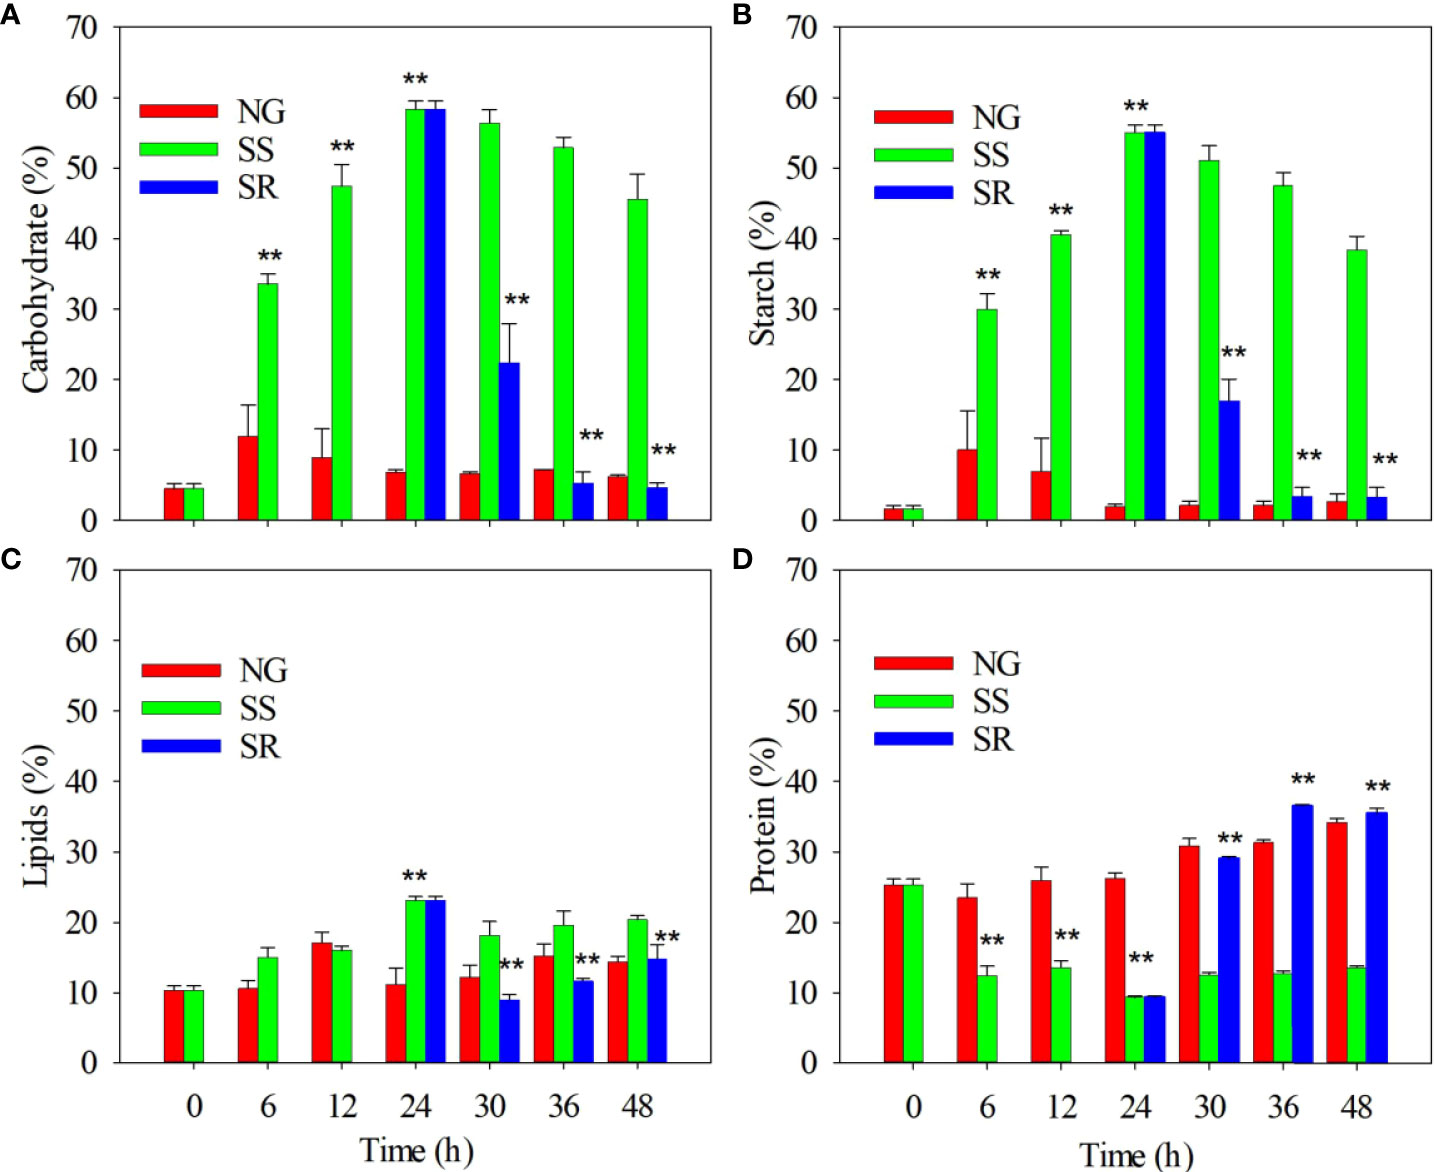
Figure 2 Effect of sulfur nutritional status on accumulation of carbohydrates (A), starch (B), lipids (C), and proteins (D) in C. sorokiniana cells. NG, normal growth; SS, sulfur starvation; SR, replenishment. The ** indicate the significant differences of samples under SS compared to NG conditions from 6 h to 24 h, and the significant differences of samples under SR compared to SS conditions from 30 h to 48 h.
The lipid content also significantly increased from 10.4 to 23.1% within 24 h under SS conditions (P<0.01) and decreased to 11.6% after the SR transition (Figure 2C). The protein content in C. sorokiniana under SS conditions significantly decreased from 27.3 to 9.3% within 24 h (P<0.01), and it slightly increased in up until 48 h. Under SR conditions, after 24 h, the protein content recovered to 36.5%, which is similar to that under NG conditions (Figure 2D).
The cellular morphology of C. sorokiniana was examined under each condition via TEM (Figure 3). It was found that C. sorokiniana cells became smaller in size under NG conditions, and a pyrenoid formed with a starch granule around it. Under SS conditions, the cell size became larger, the pyrenoid disappeared, and the number of starch granules increased. After the transition to SR, the cellular morphology of C. sorokiniana resumed similarity with that of sample NG-24h. This confirms the enhanced accumulation of starch under SS conditions and the reduction in protein synthesis.
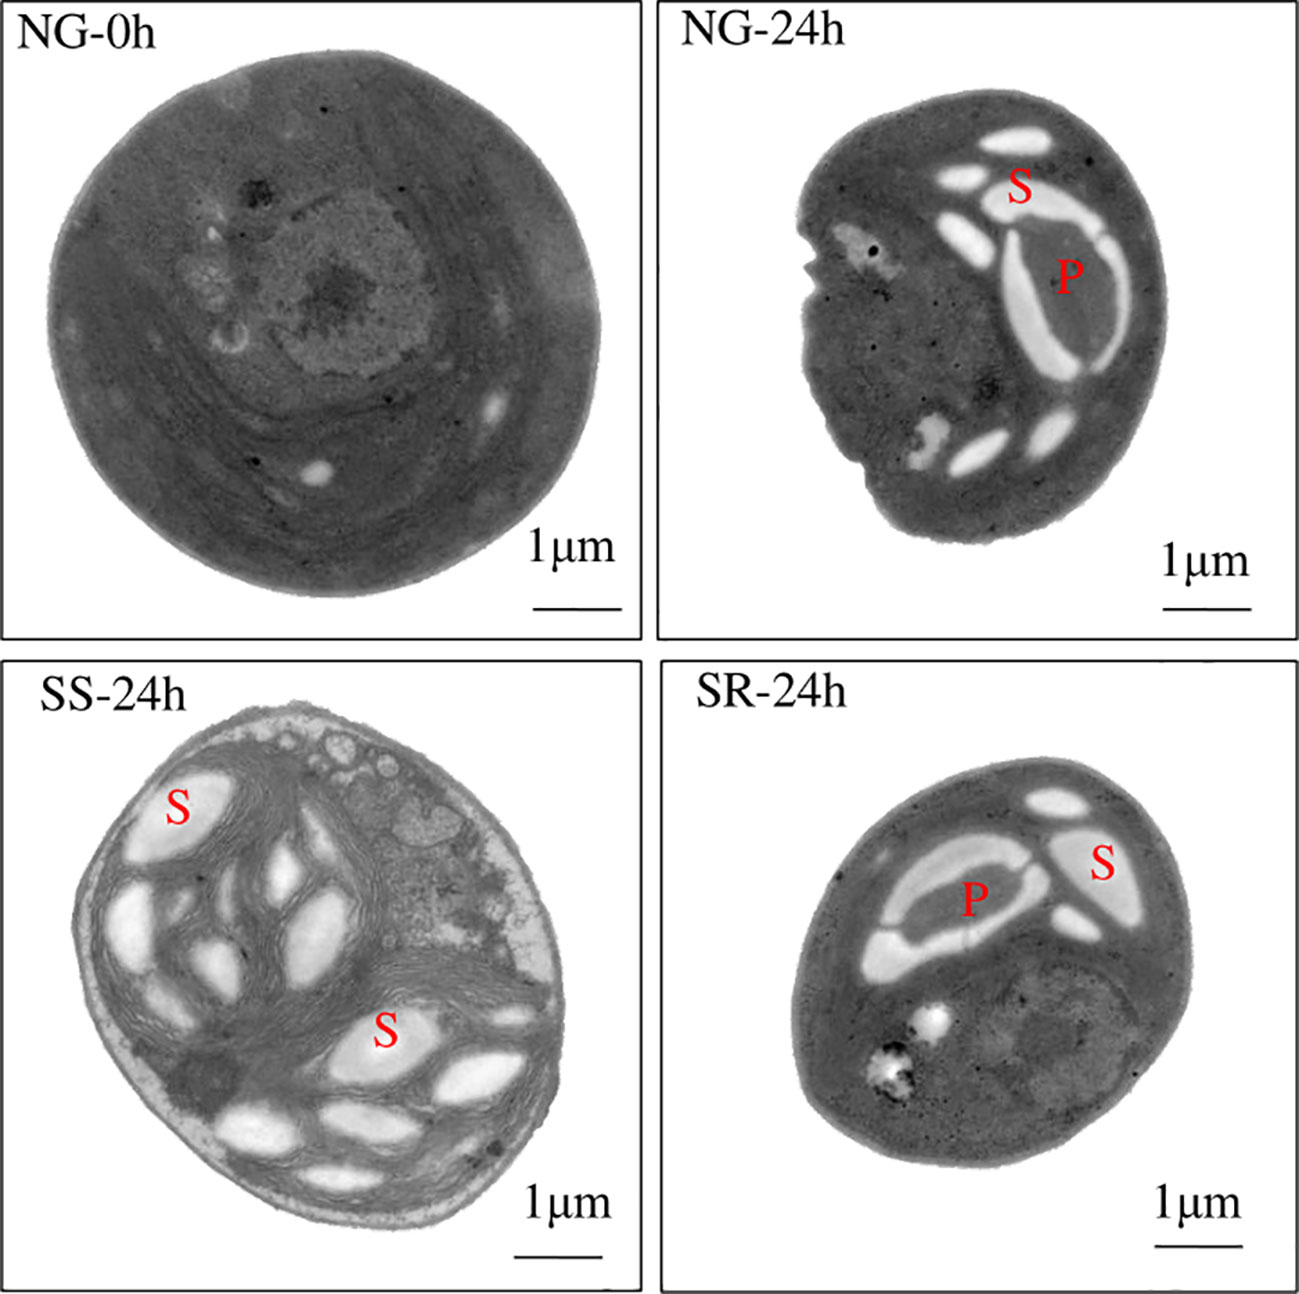
Figure 3 Cellular morphology of C. sorokiniana under different culture conditions observed using transmission electron microscopy. NG, normal growth; SS, sulfur starvation; SR, replenishment. P, pyrenoid; S, starch granule.
To investigate the molecular basis of enhanced starch accumulation, the transcriptomes of C. sorokiniana under NG (0, 6, 12, and 24 h), SS (6, 12, and 24 h), and SR (6, 12, and 24 h) conditions were analyzed using RNA sequencing (Figure 4A).
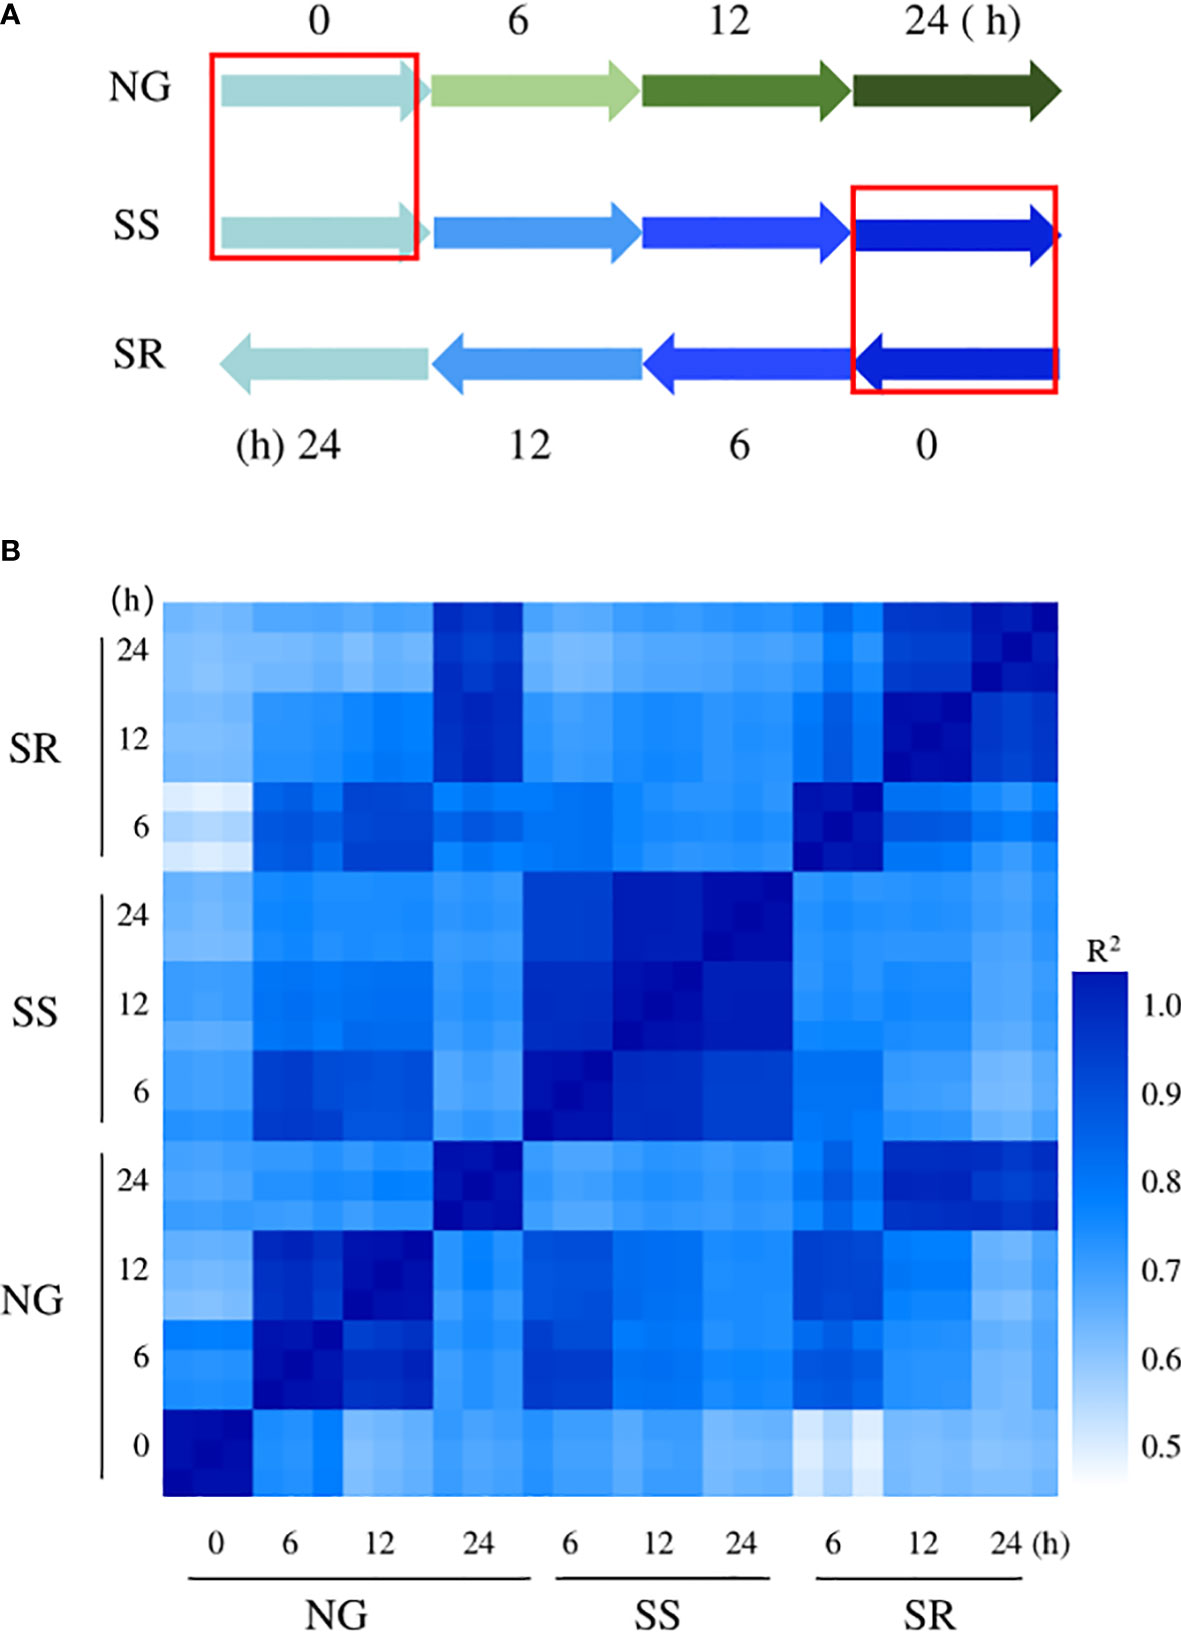
Figure 4 Overview of experimental design for RNA-seq analysis. (A) Treatments and time points of samples used for RNA-seq analysis, the red frame means the same sample used in the two time points; (B) a comparison of all gene expression levels of all samples.
For each sample, approximately 22.6 million clean reads were obtained and mapped onto the reference genome (Table 1). The transcriptome was assembled de novo using trinity, obtaining 61527 transcripts. After assembling the clean reads and eliminating redundancy, 14229 unigenes with an N50 length of 3973 bp were obtained (Supplementary File 2). Subsequently, a final total of 11662 unigenes (81.0%) were annotated in at least one public database, namely, NR, PFAM, GO, Swiss-Prot, NT, KO, and KOG. In total, 86% of the annotations were obtained by alignment with the publicly available data of C. sorokiniana. This high-quality reference transcriptome could be applied in the subsequent analysis of genes’ transcriptomic patterns.
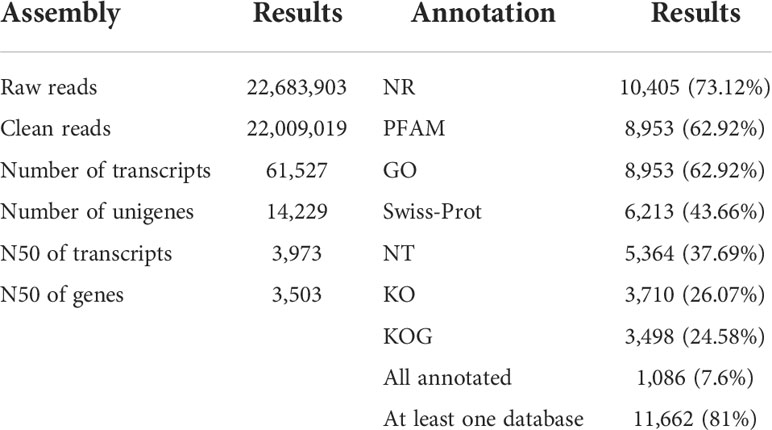
Table 1 The de novo transcriptome assembly and annotation of C. sorokiniana.
According to the Pearson correlation coefficient analysis, the transcription profiles of the 30 samples at ten time points had high repeatability among the three biological replicates (Figure 4B). The changes in transcript abundance relative to sample NG-0h are expressed as log2FoldChange (FC), and the genes with log2FC≥1 or ≤− 1 and Padj ≤ 0.05 were regarded as DEGs. As can be seen, a significant transcriptional change was observed between sample NG-0h and SR-6h, followed by SR-12h, NG-12h, SR-24h, SS-12h, NG-24h, SS-6h, and NG-6h. However, global transcriptional cascades were also observed between NG-0h and NG-6h, -12h, and -24h samples because of the growth-induced DEGs. Thus, the background influence should be eliminated. The transcriptional change between the SR-24h and NG-24h samples showed the least difference, which indicated that the cells returned to a normal metabolic stage after transition to SR conditions.
A total of 9720 DEGs were identified by comparing pairs, which accounted for 48% of the total unigenes (Figure 5). Compared to the NG-0h sample, there were 2002 up-regulated DEGs and 1137 down-regulated DEGs under NG conditions, and there were 2459 up-regulated DEGs and 1801 down-regulated DEGs under SS conditions. To further identify the DEGs associated with sulfur status, the DEGs co-up-regulated and co-down-regulated in NG and SS conditions were subtracted (SS ⊄ NG), and, accordingly, 1056 up-regulated and 971 down-regulated DEGs were identified. However, compared to the SS-24h sample, 842 up-regulated and 1039 down-regulated DEGs were observed under SR conditions. Thus, the up-regulated DEGs in the SS treatment, which were simultaneously down-regulated in SR (∩ SR), were regarded as sulfur starvation and replenishment cross-validated (SRV)-DEGs. Consequently, 454 SRV-DEGs were identified, among which 283 SRV-DEGs were strongly up-regulated under SS conditions after from 6 h and down-regulated following the transition to SR after 6 h, and 171 SRV-DEGs showed the opposite expression pattern (Supplementary File 2). This analysis removed the influence of background genes, thus focusing on the important genes that responded to sulfur status.
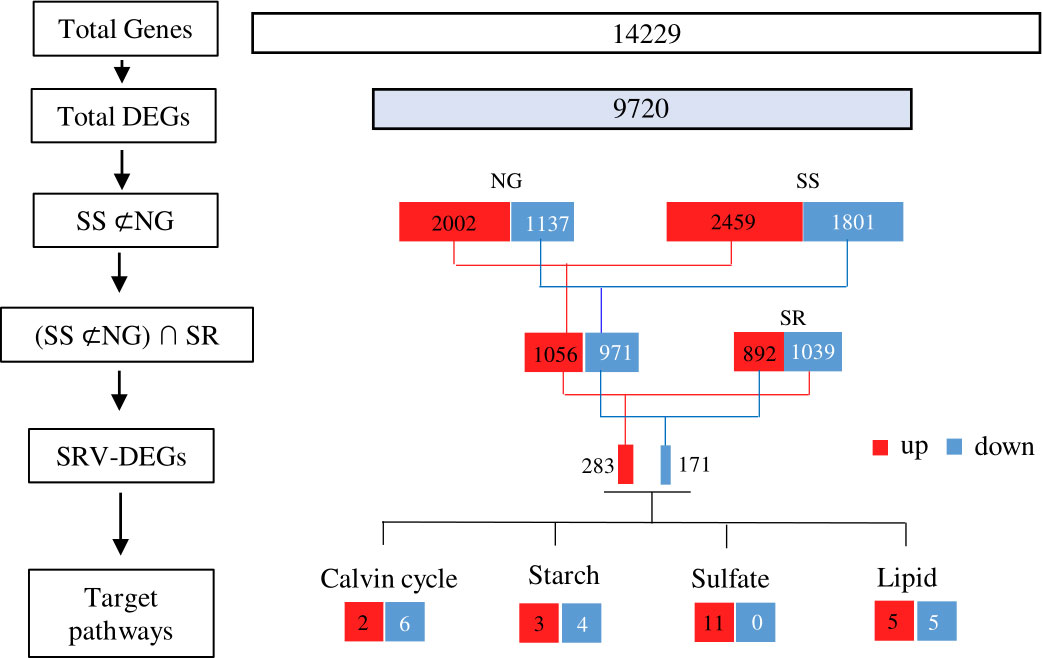
Figure 5 A flow diagram for RNA-seq data analysis. Left side: the set of genes obtained in each step of the analysis; right side: the number of genes in each set and their expression patterns. NG, normal growth; SS, sulfur starvation; SR, replenishment.
These SRV-DEGs were then analyzed using the KEGG database (Supplementary File 1, Figure S1). A total of 137 SRV-DEGs were annotated, and 75 SRV-DEGs were enriched to the KEGG metabolic pathways regarding carbohydrates, lipids, amino acids, and energy metabolism; genetic information processing; and signal transduction. It was speculated that these genes were directly correlated with the physiological and biochemical responses of C. sorokiniana to sulfur status. However, the SRV-DEGs enriched to the KEGG pathway only accounted for 17% of the total SRV-DEGs, and apparently, many genes were ignored. Thus, the 454 SRV-DEGs were further analyzed based on seven public databases, namely, NR, PFAM, GO, Swiss-Prot, NT, KO, and KOG. The results showed that eight SRV-DEGs were identified in Calvin cycle, seven were identified in starch synthesis pathway, eleven of these were in sulfate metabolism pathway, and ten of these were in lipids synthesis pathway.
Finally, to validate the expression levels of the genes, nine genes were randomly selected for RT-PCR analysis (Supplementary File 1, Figure S2). Basically, the relative expression levels of cysteine synthase[O-acetylserine(thiol)-lyase] (OASTL), fructose-bisphosphate aldolase (FBA), cellulose synthase (CesA), pyuvafe kinase (PK), and phosphatidic acid phosphatase (PAP) increased under SS conditions, and decreased after transition from SS to SR conditions. The relative expression levels of RuBP carboxylase/oxygenase (Rubisco), glyceraldehyde 3-phosphate dehydrogenase (GAPDH), and glucose-6-phosphate dehydrogenase (G6PD) decreased under SS conditions, and increased after transition from SS to SR conditions. According to the results, the expression patterns of most of these genes were consistent with the transcriptome data, indicating the data reliability.
The growth of C. sorokiniana is susceptible to sulfur nutritional status. The change in biomass accumulation was consistent with that of cell density, which consequently altered its phenotype. This result is in agreement with that of a previous study of Chromochloris zofingiensis subjected to different sulfur nutritional statuses (Mao et al., 2020). SS exerts stress on C. sorokiniana, which probably inhibits cellular metabolic processes and the normal development of microalgae, as sulfur is an essential macro-nutrient involved in the synthesis of sulfur-containing proteins and lipids; furthermore, it is related to the synthesis of mercaptan compounds (glutathione), vitamins (thiamine, biotin), thioether and thioester compounds (coenzyme A), polysaccharides, and electron transfer carriers (Lakatos et al., 2019).
The photosynthetic system possibly underwent severe damage during the SS stage, which affected the synthesis of pigments. As previously reported, nutritional changes can cause the oxidative stress of microalgae, which leads to a decline in photosynthetic activity (Chen et al., 2013). The main reason for the decreased level of photosynthesis is the generation of reactive oxygen species (ROS) under nutrient depletion conditions, which impairs the photosynthetic apparatus (Srinivasan et al., 2018). ROS have been reported to be signaling molecules for metabolic regulations (Mittler et al., 2011). SS can cause an apparent rise in ROS levels, thus leading to a decline in photosynthetic activity (Mao et al., 2020).
In the Calvin cycle (Figure 6), RuBP carboxylase/oxygenase (Rubisco) catalyzes the fixation of CO2 by incorporating ribulose-1,5-bisphosphate (RuBP), and in this study, its transcript abundance substantially decreased 4.2-fold under SS conditions. Glyceraldehyde 3-phosphate dehydrogenase (GAPDH) catalyzes the conversion of glyceraldehyde-3-phosphate (G3P), which is the common precursor for starch and lipid biosynthesis. G3P is reduced and further converted to fructose-6-phosphate (F6P) by the catalysis of fructose-bisphosphate aldolase (FBA) and fructose 1,6-bisphosphatase (FBPase), and it leaves the Calvin cycle for starch biosynthesis. In this study, the transcriptional levels of GAPDH and FBPase decreased 3.8- and 3.9-fold, respectively. The down-regulated expressions of these enzymes under SS conditions indicate that photosynthesis in the Calvin cycle was reduced, which resulted in the decreased accumulation of pigments (Figures 1D–F). This was probably caused by the oxidative reaction that occurred as the result of sulfur stress (Chen et al., 2017). The decline in photosynthetic activity may be the reason for the inhibition of growth.
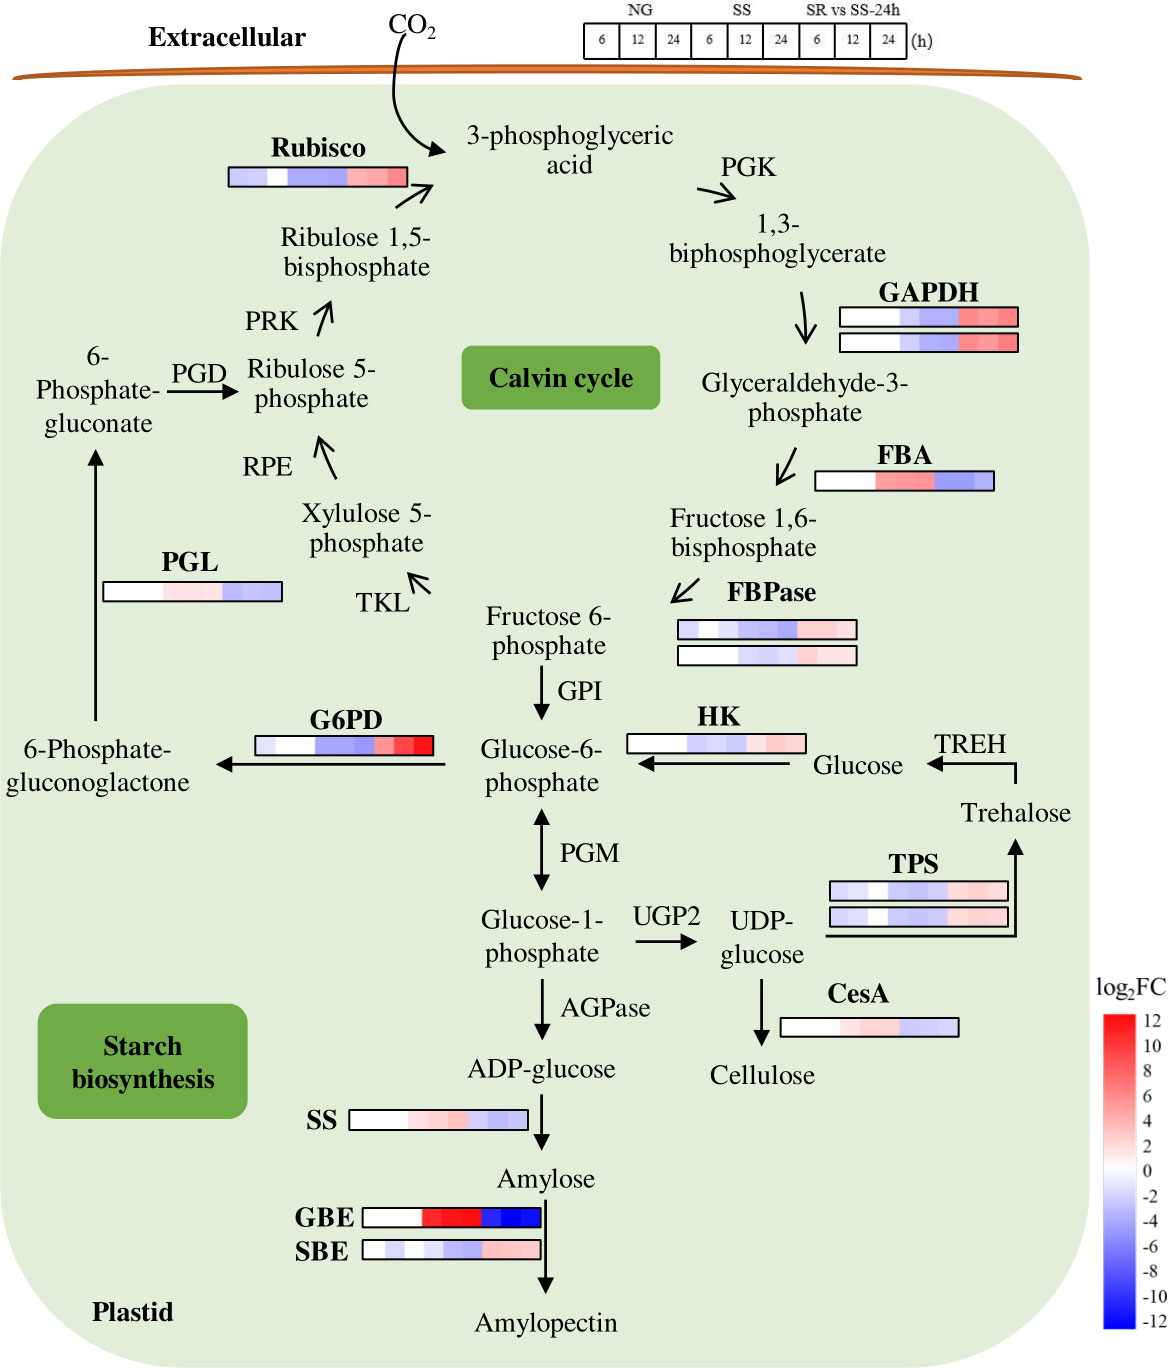
Figure 6 Expression patterns of identified SRV-DEGs in starch synthesis pathway of C. sorokiniana. Rubisco, RuBP carboxylase/oxygenase; PGK, 3-phosphoglycerate kinase; GAPDH, glyceraldehyde 3-phosphate dehydrogenase; FBA, fructose-bisphosphate aldolase; FBPase, fructose 1,6-bisphosphatase; TKL, transketolase; RPE, ribulose 5-phosphate 3-epimerase; PRK, phosphoribulokinase; G6PD, Glucose-6-phosphate dehydrogenas; PGL, 6-phosphogluconolactonase; PGD, phosphogluconate dehydrogenase; GPI, phosphoglucose isomerase; PGM, phosphoglucomutase; AGPase, ADP glucose pyrophosphorylase; SS, starch synthase; GBE, glycogen-branching enzyme; SBE, starch branching enzyme; UGP2: UTP-glucose-1-phosphate uridylyltransferase 2; TPS, alpha-trehalose-phosphate synthase; CesA, cellulose synthase; TREH, alpha-trehalase; HK, Hexokinase. Color legends are shown at the bottom right of the map. The time points of the genes’ expression pattern are shown at the top right of the map.
The starch and protein accumulation in C. sorokiniana was susceptible to sulfur nutritional status. The results concerning the increased starch accumulation of C. sorokiniana under SS conditions are in line with those of previous studies where Chlorella and Parachlorella were subjected to sulfur limitation conditions (Brányiková et al., 2011; Mizuno et al., 2013; Takeshita et al., 2014; Ota et al., 2016). The sulfur status probably led to changes in cellular metabolic processes, which resulted in redirecting carbon flux from protein biosynthesis toward the synthesis of energy storage metabolites, such as starch. The replenishment of sulfate effectively restored the phenotype and the composition of C. sorokiniana within 12 h, which demonstrates the reversible nature of SS-induced metabolic responses.
The starch biosynthesis pathway has been reported in C. reinhardtii (Ball, 2002). It starts from the formation of glucose-1-phosphate (Glc-1-P) from Glc-6-P by the catalysis of phosphoglucomutase (PGM) (Figure 6). Glc-1-P is then converted to ADP-glucose (ADP-Glc) under the catalysis of ADP glucose pyrophosphorylase (AGPase). ADP-Glc serves as the glucose donor for the elongation of the glucan chain to amylose catalyzed by starch synthase (SS). The amylopectin is then formed with the help of repeated branching, elongating, and trimming processes catalyzed by various starch synthetic enzymes, such as glycogen branching enzyme (GBE) and starch branching enzyme (SBE).
In this pathway, the SRV-DEGs encoding SS and GBE were significantly up-regulated 3.0- and 12.0-fold under SS conditions and down-regulated under SR conditions, indicating that these are two key enzymes that contribute to the enhanced formation of amylose and amylopectin and are potential targets for genetic engineering. These results are in agreement with those of a study that reported that most starch biosynthetic enzymes were up-regulated with the accumulation of starch (Ran et al., 2019). The SRV-DEG encoding SBE showed the opposite expression pattern, indicating the dominant function of GBE in the formation of amylopectin under SS conditions. The traditionally recognized starch degradative enzymes, such as starch phosphorylase (SP) and amylase (AMY), have been reported to be up-regulated under nutrient starvation conditions in most microalgae (Ran et al., 2019). A previous study of C. sorokiniana showed that lipid accumulation is largely dependent on starch degradation under N-depleted conditions, and C. sorokiniana cells showed the strategy of rerouting the carbon skeleton from starch to lipids (Li et al., 2015). However, in our study, the identified genes encoding starch degradative enzymes were not included in the SRV-DEGs, which was probably due to the early SS stage where lipid was not considerably accumulated. The reason was also possibly because the different mechanism or DEGs caused by N and S limitations.
In addition, trehalose phosphatesynthase (TPS), which catalyzes the formation of trehalose, was down-regulated 3.2-fold under SS conditions. As previously reported, trehalose levels in plants act as protectants against various abiotic stresses (Kosar et al., 2018). Cellulose synthase (CesA) was up-regulated 2.0-fold, indicating changes in the cell wall formation of C. sorokiniana under SS conditions. Great transcriptional changes in genes in the oxidative pentose phosphate (OPP) pathway were also observed. Glucose-6-phosphate dehydrogenase (G6PD) decreased 4.9-fold, and 6-phosphogluconolactonase (PGL) increased 1.6-fold under SS conditions, indicating the influence of SS on the starch and lipid biosynthesis pathways. It has been reported that G6PD catalyzes the NADPH-producing steps and that the overexpression of G6PD could elevate NADPH content and, consequently, enhance lipid biosynthesis in microalgae (Xue et al., 2017; Xue et al., 2018).
Microalgae require sulfur to produce abundant metabolites, such as sulfur-containing amino acids cysteine and methionine, for cell growth and reproduction (Mao et al., 2020). In general, sulfate is transported by SULTR to plastids and is activated by ATP sulfurylase (ATPS) to form 5-adenylyl sulfate (APS) (Leustek et al., 2000) (Figure 7). APS is then converted to 3’-phosphoadenylyl-sulfate (PAPS) and catalyzed by adenylyl sulfate kinase (APK). APS is reduced to sulfide in a two-step reaction catalyzed by APS reductase (APR) and sulfite reductase (SiR). Cysteine is then synthesized from sulfide and O-acetyl-L-serine (OAS) by the catalysis of cysteine synthase[O-acetylserine(thiol)-lyase] (OASTL) and serine acetyltransferase (SAT), and it is then further converted into methionine and glutathione, in which methionine-gamma-lyase (MGL), methionine aminotransferase (MAT), methanethiol oxidase (SELENBP1), glutathione synthetase (GSS), and glutathione S-transferase (GST) are involved.
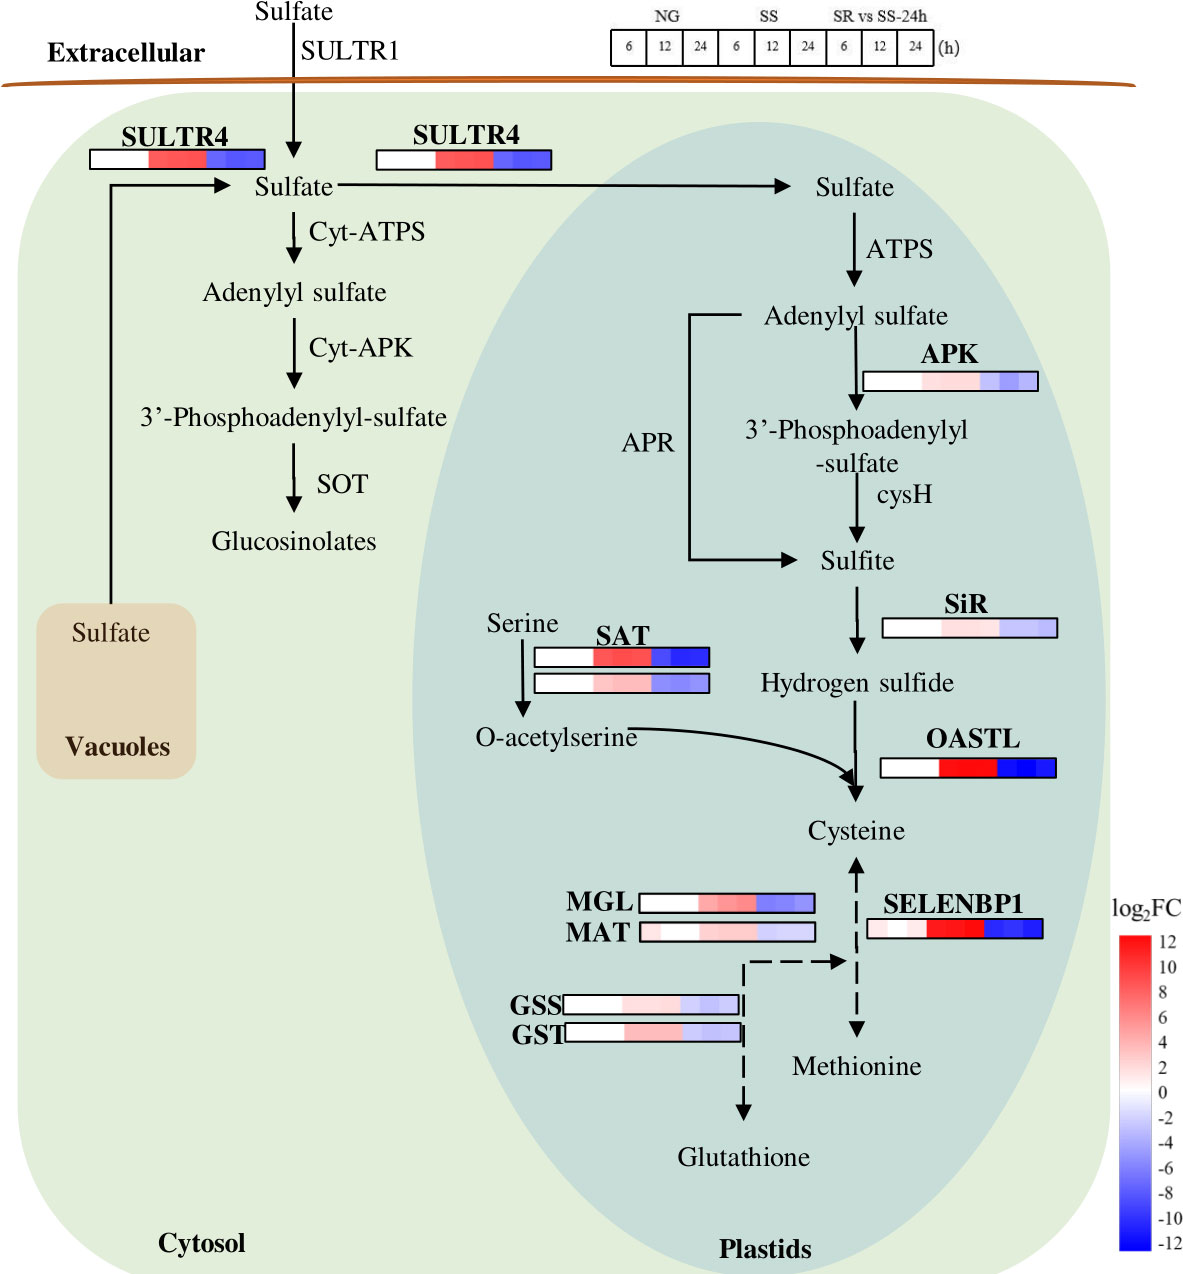
Figure 7 Expression patterns of identified SRV-DEGs in sulfate metabolic pathway of C. sorokiniana. SULTR4, sulfate transporter 4; ATPS, ATP sulfurylase; APK, adenylyl sulfate kinase; cysH, phosphoadenosine phosphosulfate reductase; APR, adenylyl-sulfate reductase; SiR, sulfite reductase; OASTL, cysteine synthase[O-acetylserine(thiol)-lyase]; SELENBP1, methanethiol oxidase 1; SAT, acetyltransferase; MGL, methionine-gamma-lyase; MAT, Methionine aminotransferase; GSS, glutathione synthetase; GST, glutathione S-transferase; Cyt-ATPS, Cytosol ATP sulfurylase; Cyt-APK, Cytosol adenylyl sulfate kinase; SOT, sulfotransferases. Color legends are shown at the bottom right of the map. The time points of the genes’ expression pattern are shown at the top right of the map.
In this pathway, the transcriptional abundance of SULTR4 increased 8.6-fold, suggesting the enhanced transportation of sulfate from the cytosol and vacuole to the plastid in C. sorokiniana cells by inducing the expression of a high-affinity sulfate transporter (SULTR4). As previously reported, in order to adapt to low-sulfur conditions, the expression of SULTR4 could retrieve the sulfate stored in vacuoles and transfer it to the plastids (Nakashita, 2017). Meanwhile, OASTL and SAT were up-regulated 12.6 and 8.8-fold under SS conditions, respectively, and MGL, MAT, SELENBP1, GSS, and GST were up-regulated 5.9, 2.5, 12.4, 3.4, and 1.8-fold, respectively, which indicate that the cells of C. sorokiniana responded distinctly to SS, resulting in intensified formations of cysteine, methionine, and glutathione. These are all likely to be the sensor-like function genes of C. sorokiniana used to identify the S status in the growth environment.
Although the expressions of the SRV-DEGs involved in sulfur metabolism were activated under SS conditions, the quantity of the sulfur-containing amino acids was possibly reduced due to the lack of a sulfur source; this is indicated by the results of protein content in C. sorokiniana biomass (Figure 2). It is acknowledged that sulfur-containing amino acids are important components for protein synthesis. The inhibition of protein synthesis would increase the accumulation of other amino acids, which can be broken down into α-ketonic acids, such as pyruvate, shifting to the starch and lipid metabolism pathway. However, along with sulfur metabolism, many metabolic pathways, such as photosynthesis and carbon assimilation, are also affected by SS. In this study, these influences consequently resulted in a reduction in production yields, as the growth and biomass accumulation of C. sorokiniana both declined.
Lipid is another main storage metabolite in microalgal cells. In order to understand the lipid metabolism of C. sorokiniana at the stage of high starch accumulation induced by SS status, the SRV-DEGs encoding the key enzymes in the TAG biosynthesis pathway were identified (Figure 8).
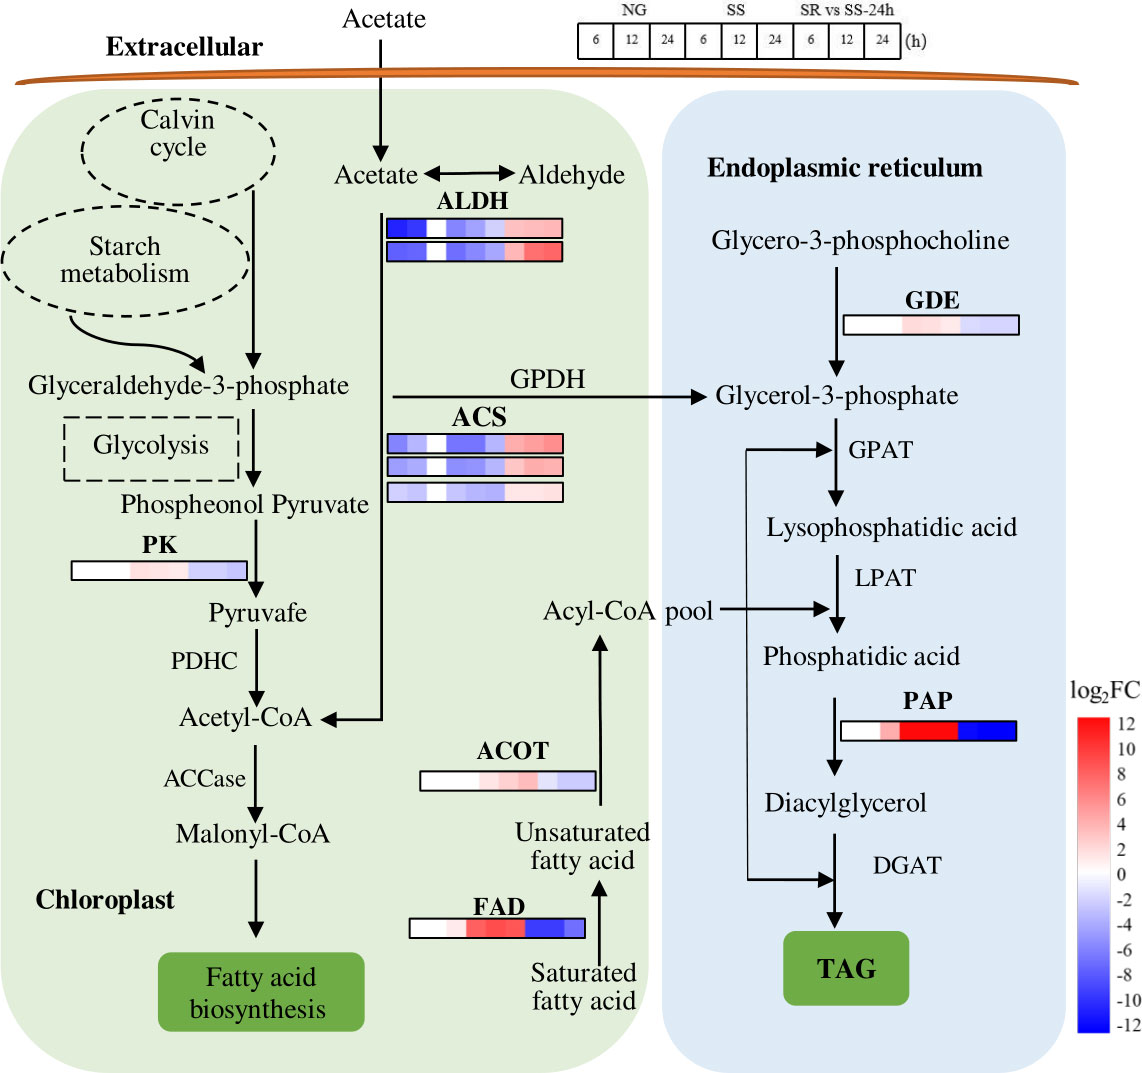
Figure 8 Expression patterns of identified SRV-DEGs in lipid synthesis pathway of C. sorokiniana. ALDH, aldehyde dehydrogenase; ACS, acetyl-CoA synthetase; PK, pyruvate kinase; PDHC, pyruvate dehydrogenase; ACCase, acetyl-CoA carboxylase; FAD, fatty acid desaturase; ACOT, acyl-coenzyme A thioesterase; GPDH, glycerol-3-phosphate dehydrogenase; GDE, glycerophosphodiester phosphodiesterase; GPAT, glycerol-3-phosphate acyltransferase; LPAT, lysophosphatidic acid acyltransferase; PAP, phosphatidic acid phosphatase; DGAT, diacylglycerol acyltransferase. Color legends are shown at the bottom right of the map. The time points of the genes’ expression pattern are shown at the top right of the map.
Lipid biosynthesis includes two steps, namely, de novo fatty acid synthesis and the subsequent glycerolipid assembly (Ran et al., 2019). In the first step, glyceraldehyde-3-phosphate derived from the Calvin cycle or starch metabolism (degradation) is converted to acetyl-CoA via glycolysis (Figure 8). Meanwhile, acetyl-CoA can also be synthesized via the conversion of acetate. The results show that the SRV-DEGs encoding pyruvate kinase (PK), which catalyzes the formation of pyruvate, were up-regulated 2.1-fold under SS conditions. The transcript abundance of SRV-DEGs encoding aldehyde dehydrogenase (ALDH) and acetyl-CoA synthetase (ACS), which catalyzes the conversion of acetate to acetyl-CoA, decreased -7.0 and -6.7-fold, respectively. The transcriptional change in these genes suggests that the sulfur status affected the metabolic flow of acetyl-CoA, which may have contributed to the increased fatty acid accumulation via the glycolysis pathway instead of the conversion from acetate. As previously reported, acetyl-CoA is the precursor for FA synthesis, and the availability of cellular acetyl-CoA plays an important role in TAG accumulation.
In the step of glycerolipid conversion from fatty acids, the SRV-DEGs encoding fatty acid desaturase (FAD), acyl-coenzyme A thioesterase (ACOT), phosphatidic acid phosphatase (PAP), and glycerophosphodiester phosphodiesterase (GDE) were identified. Strong increases in the transcript abundance of FAD (8.9-fold) and PAP (16.2-fold) were observed under SS conditions. However, the generally recognized key genes, such as those encoding glycerol-3-phosphate acyltransferase (GPAT), lysophosphatidate acyltransferase (LPAT), and diacylglycerol acyltransferase (DGAT), were not identified in these SRV-DEGs. As previously reported, the transcription levels of GPAT and LPAT remained unchanged throughout the SS conditions of C. zofingiensis, while the expression of PAP was strongly up-regulated (7.4-fold) (Mao et al., 2020). This suggests that PAP in C. sorokiniana is a key rate-limiting enzyme for TAG synthesis.
The results suggest that lipid synthesis was also affected by SS status, although not as many genes were observed to undergo a great change as reported in the literature. The identified genes, such as those encoding FAD, PAP, ACOT, and PK, may have contributed to the enhanced lipid accumulation in C. sorokiniana under SS conditions. The accumulation of lipids was lower than that of starch (Figure 2), which was probably due to the preference for starch accumulation of C. sorokiniana as the main storage metabolites under stress conditions. The low lipid levels of C. sorokiniana could also be because of the early SS stage; as previously reported, C. sorokiniana showed a sequential accumulation of starch and lipids (Chen et al., 2017). The competitive relationship between starch and lipid synthesis has also been demonstrated in C. reinhardtii and S. obliquus (Li et al., 2010a; Li et al., 2010b; Jaeger et al., 2014). However, the starch-deficient mutants of C. sorokiniana aberrant in isoamylase and starch phosphorylase failed to produce significantly more lipids (Vonlanthen et al., 2015). Thus, there may be more complicated regulatory steps that underlie the partitioning of carbon to these two storage metabolites, and this study provided potential target genes that could be applied in genetic engineering to investigate the relationship between starch and lipid accumulation in C. sorokiniana, guiding the process regulation for biofuels production.
C. sorokiniana accumulated a considerable amount of starch rather than lipids under SS conditions. For the molecular basis investigation, this study developed a strategy to identify the key SRV-DEGs associated with sulfur responses by cross-validation under SS and SR conditions. In total, 454 SRV-DEGs were identified, which accounted for 4.7% of the total DEGs. The sensor-like SRV-DEGs, such as those encoding SULTR, SAT, OASTL, and SELENBP, in the sulfate metabolic pathway were first identified in the SS environment, and then they resulted in the reallocation of carbon and elevated the starch synthesis pathway. The SRV-DEGs encoding GBE and starch synthase (SS) in the starch synthesis pathway serve as the key genes regulating starch accumulation in C. sorokiniana. However, cell growth was inhibited, possibly because of the down-regulation of the genes associated with carbon fixation. An in-depth study of these SRV-DEGs in related metabolic pathways revealed the underlying starch accumulation mechanism, as well as the relationship with cell growth and lipid synthesis. These genes may be potential target genes that could be applied in metabolic engineering to further improve the starch production capacity of C. sorokiniana.
The original contributions presented in the study are included in the article/Supplementary Material. Further inquiries can be directed to the corresponding authors. The sequencing data presented in the study are deposited in the NCBI Bioproject repository, accession number PRJNA814463.
HX: Experiment conduction, data analysis, figures production. JY, XW, QP, YH, XL and KL: Methodology, formal analysis. SD and LL: Review and editing. GL: Conceptualization, supervision, review and editing. MY: Conceptualization, supervision, writing – original draft, writing – review & editing. All authors contributed to the article and approved the submitted version.
This work was supported by the Hebei Natural Science Foundation (B2021204034), the Key Research and Development Program in Hebei Province (21322917D), the Fundamental Research Funds for the Provincial Universities of Hebei (KY2021040), and the Start-up Fund for Introduced Talents of Hebei Agricultural University (YJ201910).
The authors declare that the research was conducted in the absence of any commercial or financial relationships that could be construed as a potential conflict of interest.
All claims expressed in this article are solely those of the authors and do not necessarily represent those of their affiliated organizations, or those of the publisher, the editors and the reviewers. Any product that may be evaluated in this article, or claim that may be made by its manufacturer, is not guaranteed or endorsed by the publisher.
The Supplementary Material for this article can be found online at: https://www.frontiersin.org/articles/10.3389/fmars.2022.986400/full#supplementary-material
Ball S. G. (2002). The intricate pathway of starch biosynthesis and degradation in the monocellular alga Chlamydomonas reinhardtii. Aust. J. Chem. 55, 45–59. doi: 10.1071/CH02052
Blaby I. K., Glaesener A. G., Mettler T., Fitz-Gibbon S. T., Gallaher S. D., Liu B., et al. (2013). Systems-level analysis of nitrogen starvation-induced modifications of carbon metabolism in a chlamydomonas reinhardtii starchless mutant. Plant Cell. 25, 4305–4323. doi: 10.1105/tpc.113.117580
Brányiková I., Marálková B., Doucha J., Brányik T., Bišová K., Zachleder V., et al. (2011). Microalgae-novel highly efficient starch producers. Biotechnol. Bioeng. 108, 766–776. doi: 10.1002/bit.23016
Cao Y. H., Sun J., Zhu J. H., Li L. Y., Liu G. Z. (2010). PrimerCE: designing primers for cloning and gene expression. Mol. Biotechnol. 46, 113–117. doi: 10.1007/s12033-010-9276-3
Chen B. L., Wan C., Mehmood M. A., Chang J. S., Bai F. W., Zhao X. Q. (2017). Manipulating environmental stresses and stress tolerance of microalgae for enhanced production of lipids and value-added products-a review. Bioresour. Technol. 244, 1198–2206. doi: 10.1016/j.biortech.2017.05.170
Chen C. Y., Zhao X. Q., Yen H. W., Ho S. H., Cheng C. L., Lee D. J., et al. (2013). Microalgae-based carbohydrates for biofuel production. Biochem. Eng. J. 78, 1–10. doi: 10.1016/j.bej.2013.03.006
Demuez M., Mahdy A., Tomas-Pejo E., Gonzalez-Fernandez C., Ballesteros M. (2015). Enzymatic cell disruption of microalgae biomass in biorefinery processes. Biotechnol. Bioeng. 112, 1955–1966. doi: 10.1002/bit.25644
Fernandes B., Teixeira J., Dragone G., Vicente A. A., Kawano S., Bišová K., et al. (2013). Relationship between starch and lipid accumulation induced by nutrient depletion and replenishment in the microalga Parachlorella kessleri. Bioresour. Technol. 144, 268–274. doi: 10.1016/j.biortech.2013.06.096
Gardner R. D., Lohman E., Gerlach R., Cooksey K. E., Peyton B. M. (2012). Comparison of CO2 and bicarbonate as inorganic carbon sources for triacylglycerol and starch accumulation in Chlamydomonas reinhardtii. Biotechnol. Bioeng. 110, 87–96. doi: 10.1002/bit.24592
González-Ballester D., Casero D., Cokus S., Pellegrini M., Merchant S. S., Grossman A. R. (2010). RNA-Seq analysis of sulfur-deprived chlamydomonas cells reveals aspects of acclimation critical for cell survival. Plant Cell. 22, 2058–2084. doi: 10.1105/tpc.109.071167
Harris E. H. (1989). The chlamydomonas sourcebook: A comprehensive guide to biology and laboratory use (San Diego, CA: Academic Press).
Jaeger L., Verbeek R. E., Draaisma R. B., Martens D. E., Springer J., Eggink G., et al. (2014). Superior triacylglycerol (TAG) accumulation in starchless mutants of Scenedesmus obliquus: (I) mutant generation and characterization. Biotechnol. Biofuels. 1, 69. doi: 10.1186/1754-6834-7-69
Jaeger D., Winkler A., Mussgnug J. H., Kalinowski J., Goesmann A., Kruse O. (2017). Time-resolved transcriptome analysis and lipid pathway reconstruction of the oleaginous green microalga Monoraphidium neglectum reveal a model for triacylglycerol and lipid hyperaccumulation. Biotechnol. Biofuels. 10, 197. doi: 10.1186/s13068-017-0882-1
Kosar F., Akram N. A., Sadiq M., Qurainy F. A., Ashraf M. (2018). Trehalose: A key organic osmolyte effectively involved in plant abiotic stress tolerance. J. Plant Growth Regul. 38, 606–618. doi: 10.1007/s00344-018-9876-x
Lakatos G. E., Ranglová K., Manoel J. C., Grivalský T., Kopecký J., Masojídek J. (2019). Bioethanol production from microalgae polysaccharides. Folia Microbiol. 64, 627–644. doi: 10.1007/s12223-019-00732-0
Leustek T., Martin M. N., Bick J. A., Davies J. P. (2000). Pathways and regulation of sulfur metabolism revealed through molecular and genetic studies. Annu. Rev. Plant Physiol. Plant Mol. Biol. 51, 141–165. doi: 10.1146/annurev.arplant.51.1.141
Li T. T., Gargouri M., Feng J., Park J. J., Gao D. F., Miao C., et al. (2015). Regulation of starch and lipid accumulation in a microalga Chlorella sorokiniana. Bioresour. Technol. 180, 250–257. doi: 10.1016/j.biortech.2015.01.005
Li Y. T., Han D. X., Hu G. R., Dauvillee D., Sommerfeld M., Ball S., et al. (2010a). Chlamydomonas starchless mutant defective in ADP-glucose pyrophosphorylase hyper-accumulates triacylglycerol. Metab. Eng. 12, 387–391. doi: 10.1016/j.ymben.2010.02.002
Li Y. T., Han D. X., Hu G. R., Sommerfeld M., Hu Q. (2010b). Inhibition of starch synthesis results in overproduction of lipids in Chlamydomonas reinhardtii. Biotechnol. Bioeng. 107, 258–268. doi: 10.1002/bit.22807
Lim D. K. Y., Schuhmann H., Hall S. R. T., Chan K. C. K., Wass T. J., Aguilerab F., et al. (2017). RNA-Seq and metabolic flux analysis of Tetraselmis sp. M8 during nitrogen starvation reveals a two-stage lipid accumulation mechanism. Bioresour. Technol. 244, 1281–1293. doi: 10.1016/j.biortech.2017.06.003
Lizzul A. M., Lekuona-Amundarain A., Purton S., Campos L. C. (2018). Characterization of Chlorella sorokiniana, UTEX 1230. Biology 7, 25. doi: 10.3390/biology7020025
Mao X. M., Lao Y. M., Sun H., Li X. J., Yu J. F., Chen F. (2020). Time resolved transcriptome analysis during transitions of sulfur nutritional status provides insight into triacylglycerol (TAG) and astaxanthin accumulation in the green alga Chromochloris zofingiensis. Biotechnol. Biofuels. 13, 128. doi: 10.1186/s13068-020-01768-y
Mishra S. K., Suh W. I., Farooq W., Moon M., Shrivastav A., Park M. S., et al. (2014). Rapid quantification of microalgal lipids in aqueous medium by a simple colorimetric method. Bioresour. Technol. 155, 330–333. doi: 10.1016/j.biortech.2013.12.077
Mittler R., Vanderauwera S., Suzuki N., Miller G., Tognetti V. B., Vandepoele K., et al. (2011). ROS signaling: the new wave? Trends Plant Sci. 16, 300–309. doi: 10.1016/j.tplants.2011.03.007
Mizuno Y., Sato A., Watanabe K., Hirata A., Takeshita T., Ota S., et al. (2013). Sequential accumulation of starch and lipid induced by sulfur deficiency in chlorella and parachlorella species. Bioresour. Technol. 129, 150–155. doi: 10.1016/j.biortech.2012.11.030
Nakashita A. M. (2017). Metabolic changes sustain the plant life in low-sulfur environments. Curr. Opin. Plant Biol. 39, 144–151. doi: 10.1016/j.pbi.2017.06.015
Ota S., Oshima K., Yamazaki T., Kim S., Yu Z., Yoshihara M., et al. (2016). Highly efficient lipid production in the green alga Parachlorella kessleri: Draft genome and transcriptome endorsed by whole-cell 3D ultrastructure. Biotechnol. Biofuels. 9, 13. doi: 10.1186/s13068-016-0424-2
Ran W. Y., Wang H. T., Liu Y. H., Qi M., Xiang Q., Yao C. H., et al. (2019). Storage of starch and lipids in microalgae: Biosynthesis and manipulation by nutrients. Bioresour. Technol. 291, 121894. doi: 10.1016/j.biortech.2019.121894
Srinivasan R., Mageswari A., Subramanian P., Suganthi C., Chaitanyakumar A., Aswini V., et al. (2018). Bicarbonate supplementation enhances growth and biochemical composition of Dunaliella salina V-101 by reducing oxidative stress induced during macronutrient deficit conditions. Sci. Rep. 8, 6972. doi: 10.1038/s41598-018-25417-5
Su Y. J., Song K. H., Zhang P. D., Su Y. Q., Cheng J., Chen X. (2017). Progress of microalgae biofuel’s commercialization. Renew. Sust. Energ. Rev. 74, 402–411. doi: 10.1016/j.rser.2016.12.078
Takeshita T., Ota S., Yamazaki T., Hirata A., Zachleder V., Kawano S. (2014). Starch and lipid accumulation in eight strains of six chlorella species under comparatively high light intensity and aeration culture conditions. Bioresour. Technol. 158, 127–134. doi: 10.1016/j.biortech.2014.01.135
Tan K. W. M., Lin H., Shen H., Lee Y. K. (2016). Nitrogen-induced metabolic changes and molecular determinants of carbon allocation in Dunaliella tertiolecta. Sci. Rep. 6, 37235. doi: 10.1038/srep37235
Vonlanthen S., Dauvillée D., Purton S. (2015). Evaluation of novel starch-deficient mutants of chlorella sorokiniana for hyper-accumulation of lipids. Algal. Res. 12, 109–118. doi: 10.1016/j.algal.2015.08.008
Wang Y., Ho S. H., Yen H. W., Nagarajan D., Ren N. Q., Li S. F., et al. (2017). Current advances on fermentative biobutanol production using third generation feedstock. Biotechnol. Adv. 35, 1049–1059. doi: 10.1016/j.biotechadv.2017.06.001
Wellburn A. R. (1994). The spectral determination of chlorophylls a and b, as well as total carotenoids, using various solvents with spectrophotometers of different resolution. J. Plant Physiol. 144, 307–313. doi: 10.1016/S0176-1617(11)81192-2
Wychen S. V., Laurens L. M. L.. (2013). Determination of total carbohydrates in algal biomass. (Golden, CO, United States: National Renewable Energy Lab. (NREL)).
Xue J., Balamurugan S., Li D. W., Liu Y. H., Zeng H., Wang L., et al. (2017). Glucose-6-phosphate dehydrogenase as a target for highly efficient fatty acid biosynthesis in microalgae by enhancing NADPH supply. Metab. Eng. 41, 212–221. doi: 10.1186/s12934-019-1214-x
Xue J., Chen T. T., Zheng J. W., Balamurugan S., Cai J. X., Liu Y. H., et al. (2018). The role of diatom glucose-6-phosphate dehydrogenase on lipogenic NADPH supply in green microalgae through plastidial oxidative pentose phosphate pathway. Appl. Microbiol. Biot. 102, 10803–10815. doi: 10.1007/s00253-018-9415-5
Yao C. H., Ai J. N., Cao X. P., Xue S., Zhang W. (2012). Enhancing starch production of a marine green microalga Tetraselmis subcordiformis through nutrient limitation. Bioresour. Technol. 118, 438–444. doi: 10.1016/j.biortech.2012.05.030
Yao C. H., Jiang J. P., Cao X. P., Liu Y. H., Xue S., Zhang Y. K. (2018). Phosphorus enhances photosynthetic storagestarch production in a green microalga (Chlorophyta) Tetraselmis subcordiformis in nitrogen starvation conditions. J. Agr. Food Chem. 66, 10777–10787. doi: 10.1021/acs.jafc.8b04798
Keywords: Chlorella sorokiniana, sulfur-starvation, sulfur-replenishment, transcriptomic dynamics, starch metabolism
Citation: Xu H, Yang J, Wang X, Peng Q, Han Y, Liu X, Liu K, Dou S, Li L, Liu G and Yang M (2022) Starch accumulation dynamics and transcriptome analysis of Chlorella sorokiniana during transition of sulfur nutritional status. Front. Mar. Sci. 9:986400. doi: 10.3389/fmars.2022.986400
Received: 05 July 2022; Accepted: 02 August 2022;
Published: 23 August 2022.
Edited by:
Tao Li, South China Sea Institute of Oceanology, Chinese Academy of Sciences, ChinaReviewed by:
Alexei E. Solovchenko, Lomonosov Moscow State University, RussiaCopyright © 2022 Xu, Yang, Wang, Peng, Han, Liu, Liu, Dou, Li, Liu and Yang. This is an open-access article distributed under the terms of the Creative Commons Attribution License (CC BY). The use, distribution or reproduction in other forums is permitted, provided the original author(s) and the copyright owner(s) are credited and that the original publication in this journal is cited, in accordance with accepted academic practice. No use, distribution or reproduction is permitted which does not comply with these terms.
*Correspondence: Guozhen Liu, Z3pobGl1QGhlYmF1LmVkdS5jbg==; Ming Yang, c2hteW1AaGViYXUuZWR1LmNu
Disclaimer: All claims expressed in this article are solely those of the authors and do not necessarily represent those of their affiliated organizations, or those of the publisher, the editors and the reviewers. Any product that may be evaluated in this article or claim that may be made by its manufacturer is not guaranteed or endorsed by the publisher.
Research integrity at Frontiers
Learn more about the work of our research integrity team to safeguard the quality of each article we publish.