 Mingliang Zhang
 Huawei Qin1†
 Bin Li
94% of researchers rate our articles as excellent or good
Learn more about the work of our research integrity team to safeguard the quality of each article we publish.
Find out more
ORIGINAL RESEARCH article
Front. Mar. Sci., 27 September 2022
Sec. Marine Biogeochemistry
Volume 9 - 2022 | https://doi.org/10.3389/fmars.2022.985548
This article is part of the Research TopicCarbon Dynamics in Freshwater, Coastal and Oceanic Ecosystems in Response to the SDG GoalsView all 12 articles
Macroalgae culture as a marine carbon sequestration strategy has been recently proposed. To understand the potential for carbon sequestration by macroalgae culture, we studied the interaction of dissolved organic carbon (DOC) released by Saccharina japonica, an important cultured kelp species in China, and the bacterial community. We found that S. japonica effectively released DOC containing both labile and refractory components, and the DOC released by S. japonica into the water decreased average molecular weight (Masswa) by 18 Da, meaning it was rich in low molecular weight matter. Degradation of labile DOC components occurred during the initial 2 months of the experiment. The Masswa and molecular diversity of the DOC was increased in turn by bacterial degradation, and the variation in the DOC composition resulted in the succession of the bacterial community. During labile DOC degradation, anaerobic Gammaproteobacteria, Bacteroidia and Campylobacteria were the dominant microbial classes in the water, and aerobic Iodidimonadaceae became the dominant family during the final stage of the experiment. Finally, 5% of the DOC was transformed into refractory DOC. Although the sinking biomass was not involved in the study, the produced refractory DOC through the interaction between releasing DOC and bacterial degradation indicates a potential of carbon sequestration by macroalgae culture.
● The DOC released by S. japonica contained both labile and refractory components.
● Anaerobic and sulfidic bacteria dominated degradation of labile components in the DOC.
● 5% DOC released by S. japonica was transformed to refractory DOC.
● Degradation increased the Masswa and molecular diversity of the DOC.
The ocean accounts for 71% of Earth’s area and is the largest active carbon pool in the world, with 20 and 50 times the carbon stored in either the terrestrial or atmosphere carbon pool, respectively (Post et al., 1990). The ocean also significantly buffers against global warming, by absorbing 23% CO2 released by human activities through industrial activities (Sabine et al., 2004; DeVries et al., 2017). Removing atmospheric CO2 by increasing ocean carbon sequestration is an effective strategy for mitigating global climate change. The most important ocean carbon sequestration strategy is the ‘blue carbon’ project. By protecting and restoring the blue carbon ecosystem (i.e., mangroves, salt marshes, and seagrass beds) particulate organic carbon can be sequestered in the sediments (NASEM, 2019). Although macroalgae is the most productive marine macrophyte, it has been excluded from the ‘blue carbon’ strategic framework initially, mainly because most macroalgae grow on rocks, precluding the burial of organic carbon in sediment (Hill et al., 2015; Dorte and Carlos, 2016). Different to forest in land, organic carbon in macroalgae biomass can be degradation in short time-scale also limited the carbon sequestration of macroalgae. However, macroalgae can indirectly sequester large amounts of carbon in seawater in the form of dissolved organic carbon (DOC) through bacterial degradation of biomass and the extracellular exudate from macroalgae (Chen et al., 2020; Watanabe et al., 2020). A portion of this final product of this bacterial degradation is refractory to further biodegradation. According to the microbial carbon pump theoretical framework, the products of bacterial degradation comprise a refractory dissolved organic carbon (RDOC) pool in the ocean carbon cycle, which can sequester carbon for 5000–6000 years (Jiao et al., 2010; Ortega et al., 2019). Therefore, the indirect production of RDOC by macroalgae provides a positive buffering effect against global warming. For the reason above, macroalgae was proposed as the fourth species of blue carbon in recent years (IPCC, 2020).
Releasing DOC is a basic physiological function for macroalgae. To protect their tissues, more than 20% of the net primary production of macroalgae is released in the form of DOC (Abdullah and Fredriksen, 2004; Wada et al., 2007; Reed et al., 2015; Gao et al., 2021). A large amount of biomass exists in the coastal ocean, and macroalgae DOC is an important component of the coastal DOC pool (Reed et al., 2015; Mahmood et al., 2017; Ortega et al., 2019). For example, in Oura Bay, Japan, 20%–34% of the coastal DOC originates from the Ecklonia cava Kjellman release (Wada and Hama, 2013). Macroalgae DOC provides an important metabolic substrate for bacteria along the coast, and some of the RDOC produced by bacteria indirectly originates from the macroalgae. Around the world, macroalgae indirectly sequester roughly 0.12 Pg C/yr in the form of RDOC, which is 12% of the global annual blue carbon sequestration (Krause-Jensen and Duarte, 2016; NASEM, 2019). The indirect production of RDOC by macroalgae should not be ignored in the global carbon cycle.
Macroalgae culture is a rapid developing industry, producing 34.7 million t/y (FAO, 2021). Besides providing seafood and raw material for industry, macroalgae culture is one of the most effective carbon dioxide removal approaches developed in recent years (NASEM, 2021). The production of macroalgae in China accounts for 58.2% of the global supply (FAO, 2021). Among the species cultured in China, the kelp Saccharina japonica is the most important. Many studies have been conducted on the interaction between natural macroalgae DOC and the bacterial community, but none have focused on cultured macroalgae DOC (Wada et al., 2008; Zhang and Wang, 2017; Chen et al., 2020). Bacterial communities are sensitive to environmental variation. Physical, chemical, and biological factors can all disturb the interaction between macroalgae DOC and bacteria in seawater, and these uncontrollable factors make in situ studies difficult. Nearly all DOC degradation experiments have been performed under laboratory conditions, even though degradation processes in the laboratory can be different from those in the ocean (Wada et al., 2008; Chen et al., 2020; Watanabe et al., 2020; Gao et al., 2021). In this study, the interaction and dynamics of DOC release by the cultured kelp S. japonica and the bacterial community succession is studied in the laboratory.
S. japonica were collected in November 2021 from Chudao (122° 35′ E, 37° 09′ N), Sangou Bay, the most productive kelp bay in northern China. Kelp with intact leaves (each with length 1.2–1.5 m and fresh weight 20–40 g) were picked from culture ropes. Surface water was collected from 1 m below sea level. All samples were transported into laboratory in 4 h. Seawater was immediately filtered through a 0.7 µm-pore Whatman glass fiber filter to eliminate phytoplankton and particulate matter. Kelp leaves were washed five times with filtered seawater to remove particulate matter and any fouling organisms attached to the kelp (Zhang and Wang, 2017).
To gather the DOC released by S. japonica, 800 g fresh kelp biomass was placed into a 100 L glass container. To simulate the actual kelp culture, the biomass density in the collecting process was consistent with the culture density in natural water. After 48 h, when the color of water turned yellowish brown, 30 L water was transferred into degradation containers as the treatment group for the 120 d degradation experiment. Simultaneously, 30 L filtered seawater without enrichment of DOC released by S. japonica was established as the control group. Both groups had three replicates. All degradation containers were covered loosely to avoid contact with the atmosphere. The experiment was kept in dark conditions at room temperature (20–26°C) to reduce the impact of photodegradation and possible growth of picophytoplankton, which may have passed through the filtering process and added DOC to the experiment. During the 120 d degradation process, water samples were collected at different time points for analysis of the concentration and composition of DOC and for determination of dynamic variations in abundance and community structure of planktonic bacteria.
Samples for measuring the concentration of DOC, fluorescent dissolved organic matter (FDOM), bacterial abundance, and community structure were collected on days 0, 2, 4, 8, 16, 24, 30, 45, 60, 75, 90, and 120. Samples for DOC molecular composition were collected on days 0, 60, and 120. Samples (50 mL and 500 mL) were collected from each replicate into brown glass bottles for the analysis of DOC concentration and molecular composition, respectively. The concentration samples were also used for the analysis of FDOM. Meanwhile, 4.5 mL samples with added 5% glutaraldehyde (final concentration) were collected for the analysis of bacterial abundance. All water samples were filtered through 0.22 µm-pore polycarbonate membranes before analysis. Lastly, 500 mL water samples were filtered, and the filters were collected for the analysis of the bacterial community structure. The glass containers in all experiments were acid-washed, rinsed with Milli-Q water, and combusted at 450°C for 8 h.
Concentrations of DOC were measured by the high-temperature catalytic oxidation method using a TOC-VCPH analyzer (Shimadzu, Kyoto, Japan). Potassium hydrogen diphosphate and high-carbon deep sea water produced by Hansell’s laboratory were used as DOC standards. Milli-Q water was used as a blank and was analyzed every ten samples.
Bacterial abundance samples were stained with SYBR Gold Nucleic Acid Gel Stain then measured with a FACSAria flow cytometer (BD Biosciences, Franklin Lakes, NJ, USA). Bacterial abundance was enumerated with Cellquest software.
Components of FDOM were analyzed with an excitation-emission matrix (EEM) using parallel factor (PARAFAC) analysis. EEM was measured with a fluorescence spectrophotometer (Hitachi F-4500, Tokyo, Japan) with scanning speed 1200 nm/min at 950 V. In the scanning process, the excitation (Ex) wavelength ranged from 200 to 500 nm with 5 nm increments, and the emission (Em) wavelength ranged from 250 to 550 nm with 5 nm increments. The raster for both Ex and Em was 5 nm. PARAFAC analysis of the FDOM components was performed with the drEEM toolbox (http://dreem.openfluor.org/) and MATLAB (MathWorks, Natick, MA, USA).
The molecular composition of DOC was analyzed by Fourier transform–ion cyclotron resonance–mass spectrometry (FT-ICR-MS) using a Bruker ultra-high definition FT-ICR mass spectrometer Solarix XR 7.0T (Bruker Daltonics, Bremen, Germany) at China National Analytical Center, Guangzhou. Before the analysis, DOC was solid-phase extracted and eluted using a previously described method (Dittmar et al., 2008). Data analysis and chemical formula assignment were performed with the TRFu algorithm based on the formula criteria of 5 ≤ C ≤ 50, 1 ≤ O, N ≤ 4, S ≤ 2, P ≤ 2, 0 < O/C ≤ 1.2, and 0.3 ≤ H/C ≤ 2.5, within 1.0 ppm (Fu et al., 2020). Once formula assignment for all peaks was accomplished, parameters such as modified aromaticity index (AImod) and double-bond equivalents (DBE) were calculated for each formula. AImod and DBE were calculated according to equations (1) and (2) (Koch and Dittmar, 2006):
AImod = (1 + C – 0.5O – S – 0.5H – 0.5N – 0.5P)/(C – 0.5O – S – N – P) (1)
DBE = 1 + C – O – S – 0.5N – 0.5P – 0.5H (2)
where C, H, O, N, S, and P are the numbers of carbon, hydrogen, oxygen, nitrogen, sulfur, and phosphorus atoms in a molecular formula, respectively. All formulas were divided into six groups according to the values of AImod and H/C. The group with AImod > 0.66 represented polycyclic aromatic compounds. The group with 0.66 ≥ AImod > 0.50 represented highly aromatics compounds. The group with AImod ≤ 0.50 and H/C < 1.5 represented highly unsaturated compounds. The group with AImod ≤ 0.5, 2.0 > H/C ≥ 1.5 and without nitrogen atoms in their molecular formula represented unsaturated aliphatic compounds (N = 0). The group with AImod ≤ 0.5, 2.0 > H/C ≥ 1.5, and with nitrogen atoms in their molecular formula represented nitrogenous unsaturated aliphatic compounds (N > 0). Lastly, the group with AImod ≤ 0.5 and H/C ≥ 2.0 represented saturated fatty and sulfonic acids. To compare the overall characteristics of the samples, the weight average of the molecular weight (Masswa), weight average of oxygen to carbon ratios (O/Cwa), weight average of hydrogen to carbon ratios (H/Cwa), weight average of double-bond equivalents (DBEwa), weight average of carbon to nitrogen ratios (C/Nwa), and weight average of carbon to sulfur ratios (C/Swa) were calculated using a method previously described (Koch et al., 2014).
Three parallel samples at each sampling time point were combined before DNA extraction as per Zhao et al. (2019). Bacterial genomic DNA was extracted using the HiPure Water DNA Kit (D3145-02, MGBio, China). The DNA concentration was verified with a NanoDrop 2000 (Thermo-Fisher, United States) and 1% agarose gel electrophoresis. The 16S rRNA gene was amplified with primers targeting the V3–V4 hypervariable regions: 343F-5′-TACGGRAGGCAGCAG-3′ and 798R-5′-AGGGTATCTAATCCT-3′. Library sequencing and data processing were conducted by OE Biotech Co., Ltd. (Shanghai, China). The raw sequencing data were pre-processed by Cutadapt (version 3.4) to remove the primer sequence (Martin, 2011). The abundance of the amplicon sequence variants (ASV) was obtained by de-noising with Dada 2 (Version 1.8) (Callahan et al., 2016). All representative reads were annotated and BLAST searched against the Silva database (version 138) using QIIME 2 (version 2020.11) (Bolyen et al., 2019)
Statistical significance of differences in the DOC concentration and bacterial abundance were analyzed by one-way analysis of variance (ANOVA). The difference of bacterial communities in ASV’s level was measured by analysis of similarity (ANOSIM). To test the bacterial community succession in the experiment, β-diversity was analyzed using Bray-Curtis distances based on the relative abundance matrices of the ASVs. Hierarchical cluster analysis (HCA) and nonmetric multidimensional scaling (NMDS) were calculated based on the Bray-Curtis distances.
The dynamic variations in DOC concentration and bacterial abundance had different characteristics during the 120-day degradation process. The DOC concentration reached a peak of 65.29 ± 9.58 mg C/L at the start of experiment (day 0) and decreased sharply to 10.36 ± 0.57 mg C/L on day 24 (Figure 1). Over the following 46 d, the DOC concentration declined slowly, reaching 9.46 ± 0.46 mg C/L on day 60. During the last 2 months of the experiment, the DOC concentration remained relatively stable. Based on the variation in the DOC concentration, the entire degradation process was divided into three stages: DOC rapid decline (RD) stage (day 0–24), DOC slow decline (SD) stage (day 24–60), and DOC relatively stable (RS) stage (day 60–120). At the end of the experiment, the DOC concentration in the treatment group was significantly higher than in the control (p < 0.05), and the DOC concentration in the control did not significantly change during the experiment. Similar to the changes in DOC concentration, the bacterial abundance was initially the highest on day 0 at 1.96 ± 0.07 ×10⁸ cells/mL, remained stable on day 1, then smoothly decreased to 2.03 ± 1.2 ×10⁷ cells/mL by day 60. During the next 2 months, bacterial abundance remained relatively stable, similar to the trend in the DOC concentration. Also similar to the variation of DOC in the control, the bacterial abundance in the control did not change significantly during the experiment. The final bacterial abundance in the treatment group was significantly higher (p < 0.05) than in the control.
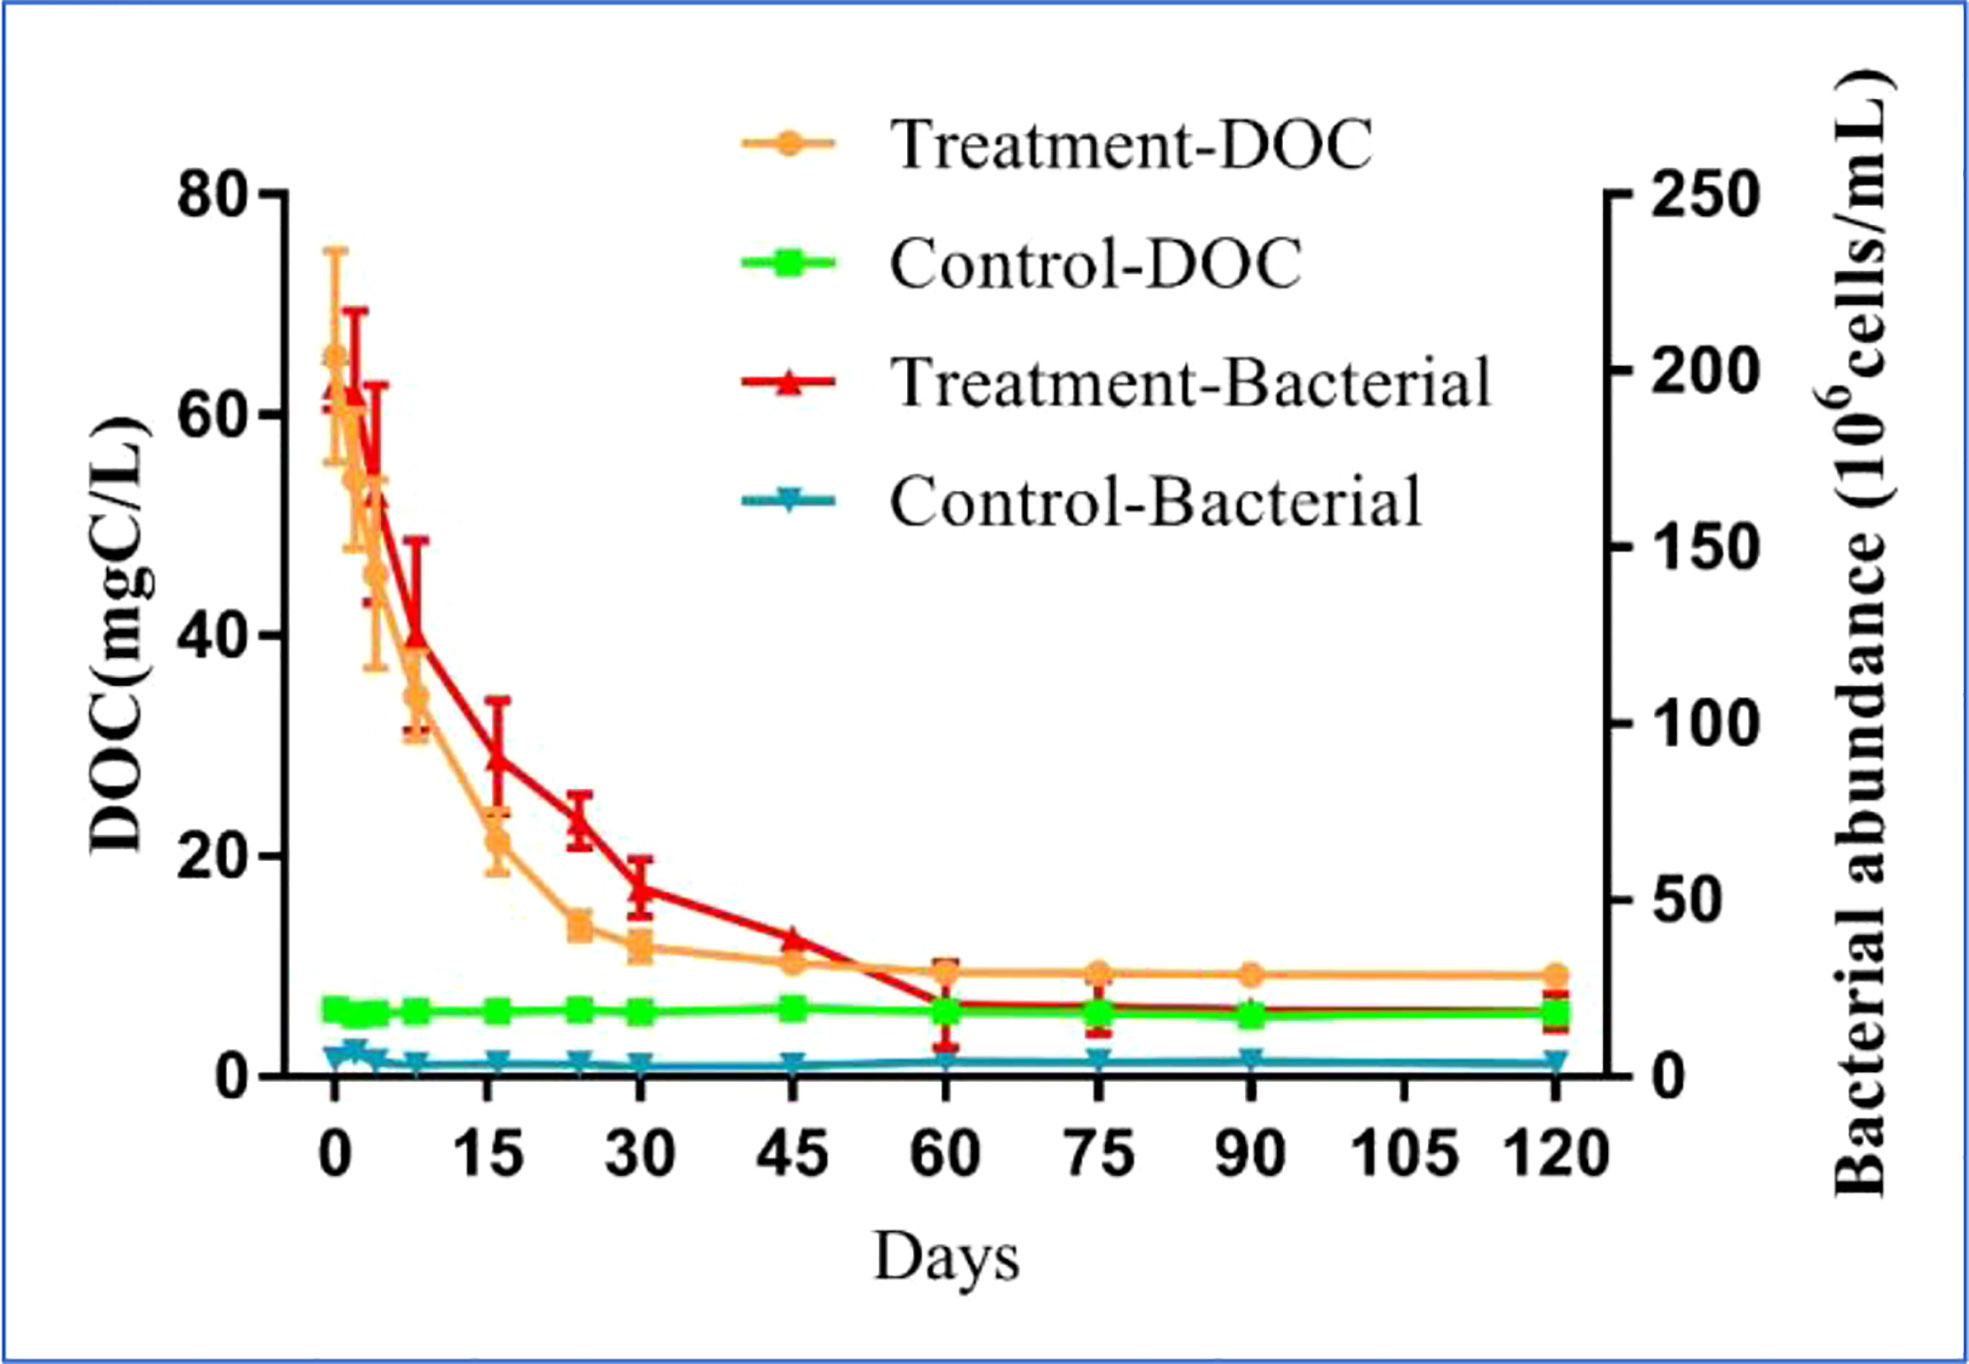
Figure 1 Variations of DOC concentration and bacterial abundance in the 120-day degradation of DOC released by Saccharina japonica and that in natural seawater.
PARAFAC analysis of FDOM and FT-ICR-MS results were used to track the variation in DOC composition during the study. Four FDOM components (i.e., C1–C4) were identified during the 120-day degradation, with Ex|Em wavelengths of 250(310)|400 nm, 260|465 nm, 280|340 nm, and 355|420 nm respectively (Figure S1). According to the Ex|Em wavelengths, C1 and C2 represent humic-like fluorescent components originating from autochthonous production (Gao and Guéguen, 2018; Kulkarni et al., 2018). C3 represents an autochthonous protein-like component (Bittar et al., 2015), and C4 represents humic-like fluorescent components originating from microbial degradation (Amaral et al., 2021). All components had different dynamic variations in fluorescence intensity during the 120-day degradation process (Figure 2). The fluorescence intensity of both C1 and C2 decreased slightly until the end of the experiment. Different from the other humic-like fluorescence components, the fluorescence intensity of C4 increased slowly over the entire degradation process. The fluorescence intensity of C3 declined sharply during the initial 24 days then changed little until the end of experiment. In contrast, the fluorescence intensity of all components in the control group did not change significantly during the experiment.
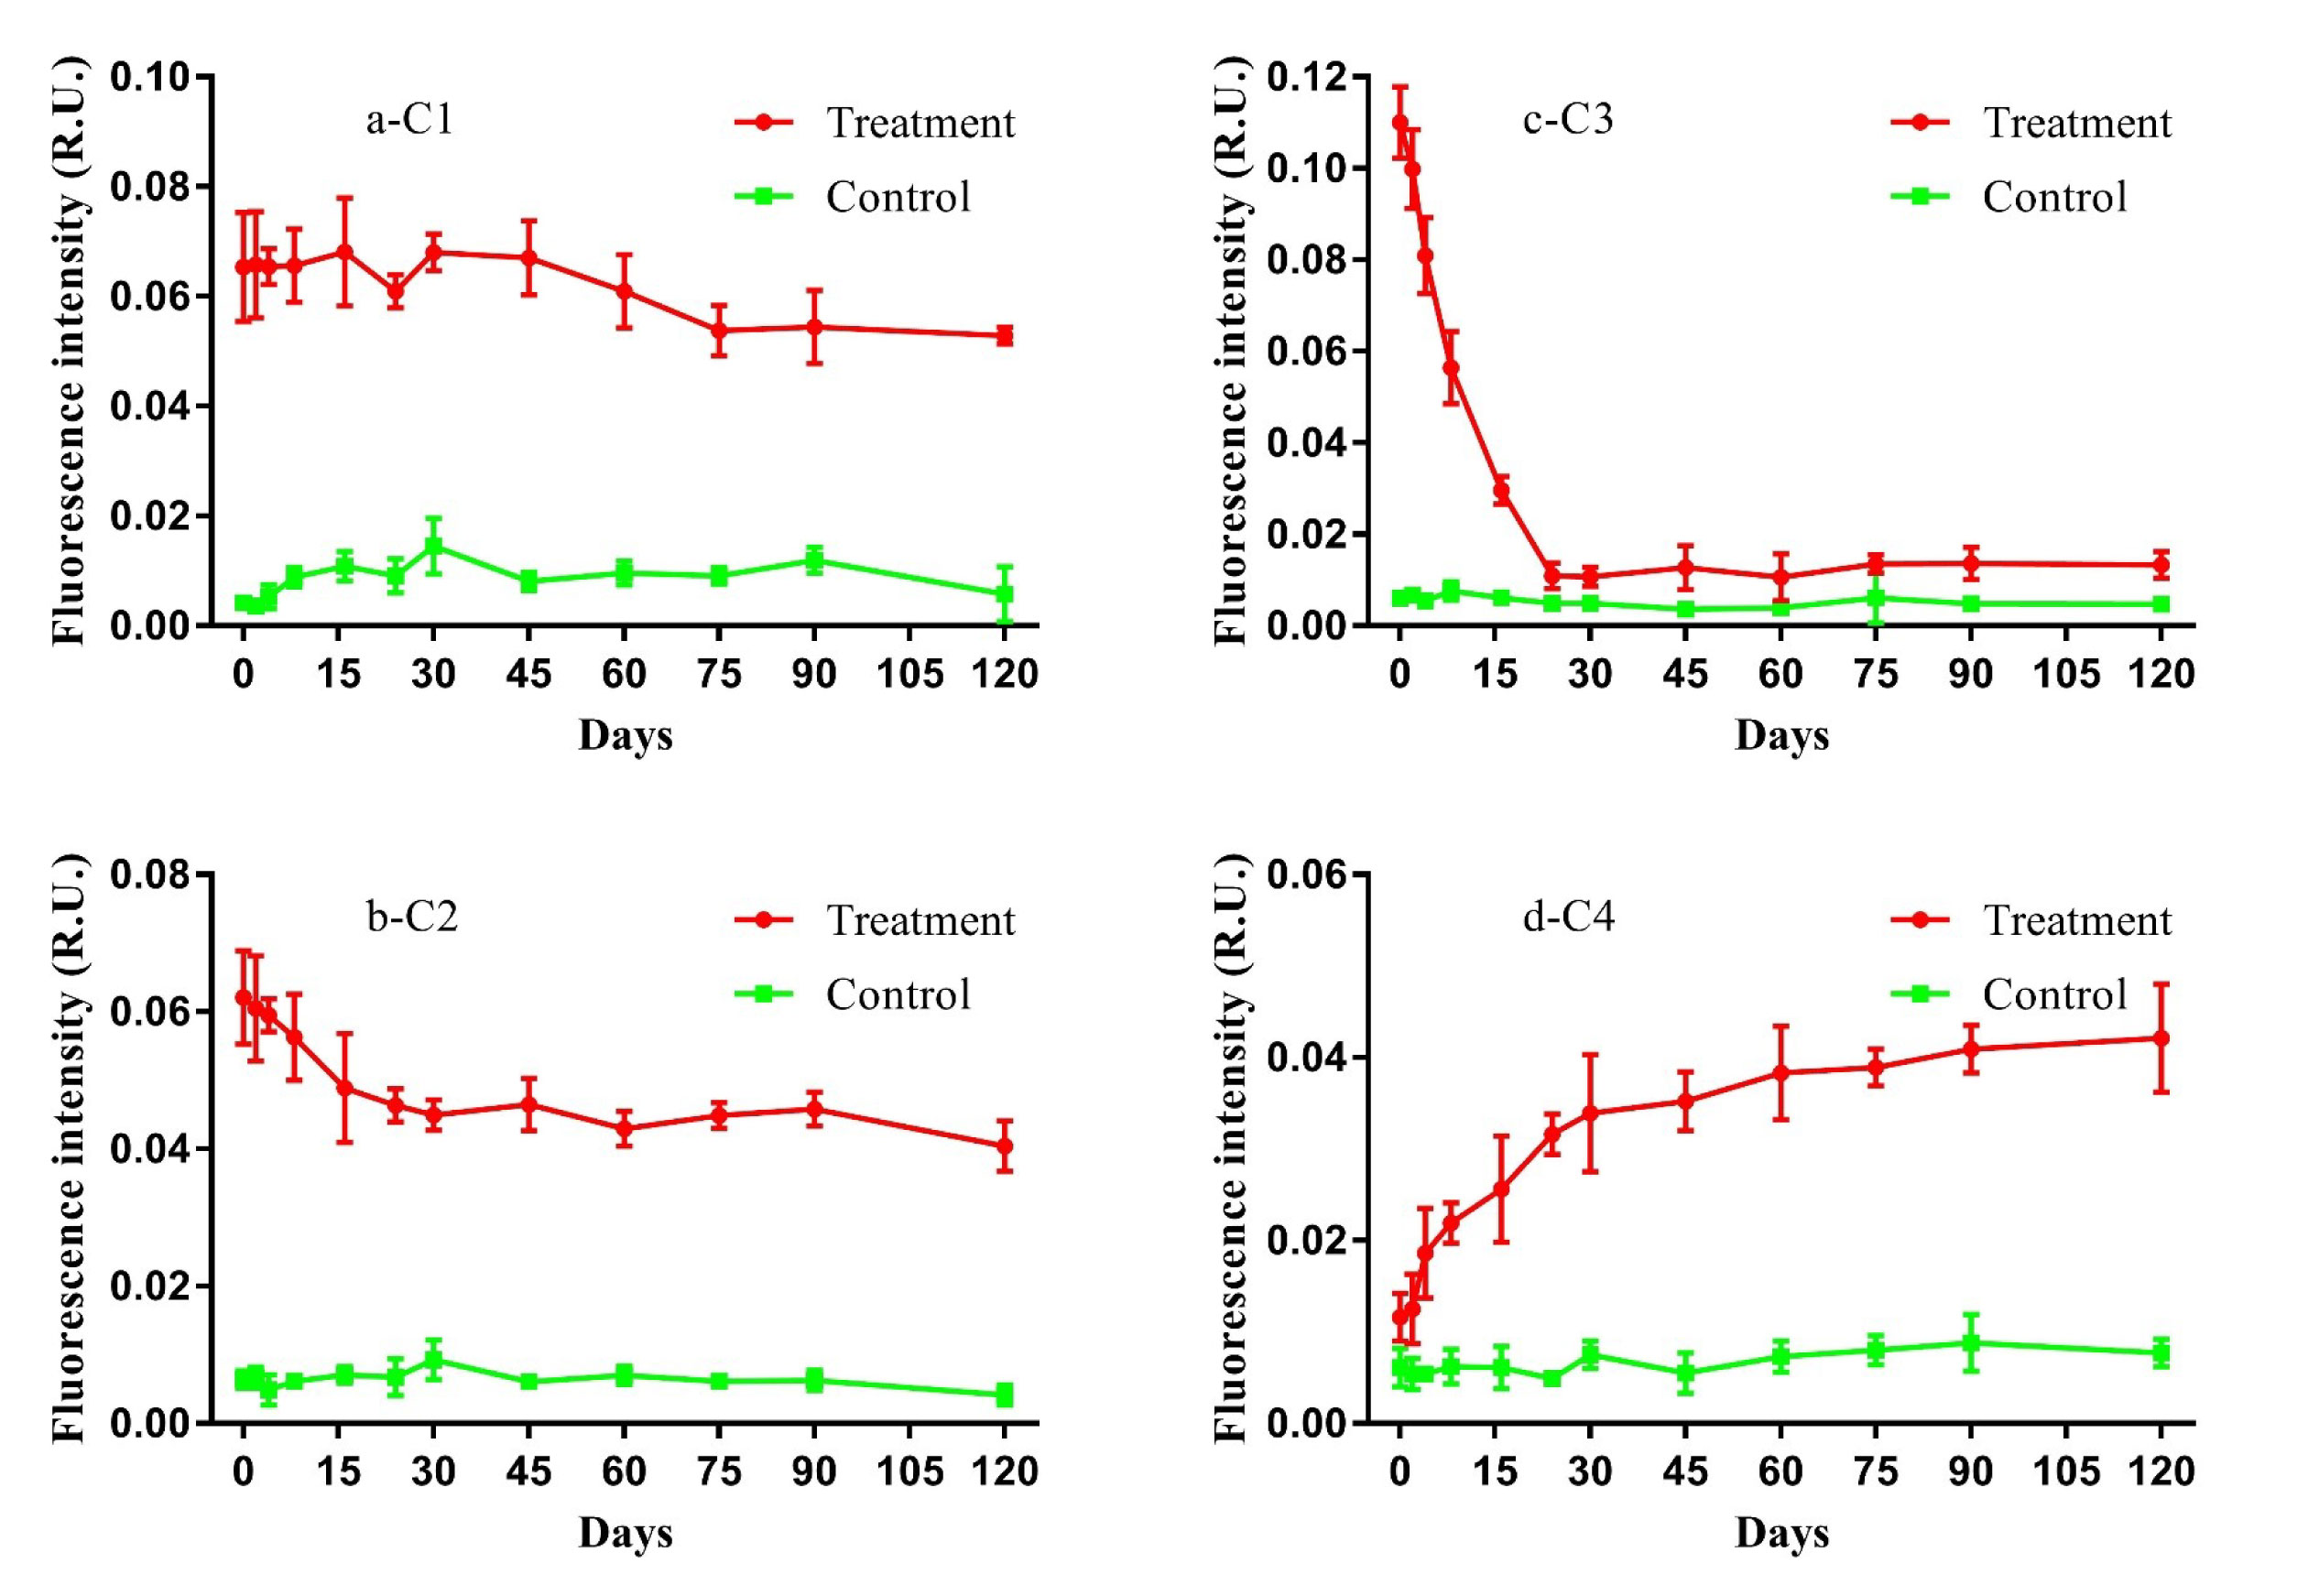
Figure 2 Variations of components (i.e., C1, C2, C3, and C4) of fluorescent dissolved organic matter (FDOM) in the 120-day degradation of DOC released by Saccharina japonica and that in natural seawater.
FT-ICR-MS analysis revealed the variation in DOC composition at the molecular level during the 120-day degradation. Throughout the experiment, a total of 11376 different molecular formulas (MFs) covering a mass range of 109–999 Da (including 13C isotopologs) were identified. Based on the elemental compositions, MFs were classified into five groups, i.e., CHO-, CHON-, CHOS-, CHONS-, and CHOSP-, which represented 95% of the MFs identified in the experiment (Table 1). The MFs changed significantly during the initial 2 months of treatment. In the day 0 treatment (T0) sample, the total number of MFs in the DOC was 32% higher than in the day 0 control (C0) sample. Meanwhile, the number of MFs in the CHON-, CHOS-, CHONS-, and CHOSP- groups were 17%, 75%, 347%, and 58% higher, respectively, in T0 than C0. The relative abundance of unsaturated fatty and sulfonic acids, unsaturated aliphatic compounds (N > 0), and unsaturated aliphatic compounds (N = 0) were 2.4%, 5%, and 15% higher, respectively, in T0 than in C0 (Figure 3). After 60 days degradation, the MFs in the treatment group (T60) increased by 15% compared with T0, and the number of MFs in the CHO-, CHON-, and CHOSP- groups increased by 10%, 28%, and 116%, respectively, between T0 and T60. In contrast, the relative abundance of unsaturated fatty and sulfonic acids, unsaturated aliphatic compounds (N > 0), and unsaturated aliphatic compounds (N = 0) decreased by 3.5%, 4.5%, and 18%, respectively, between T0 and T60. During the last 2 months of the experiment, the MFs and molecular composition changed little in the treatment. In contrast, the variation in the MFs and molecular composition in the control samples was negligible during the entire experiment.
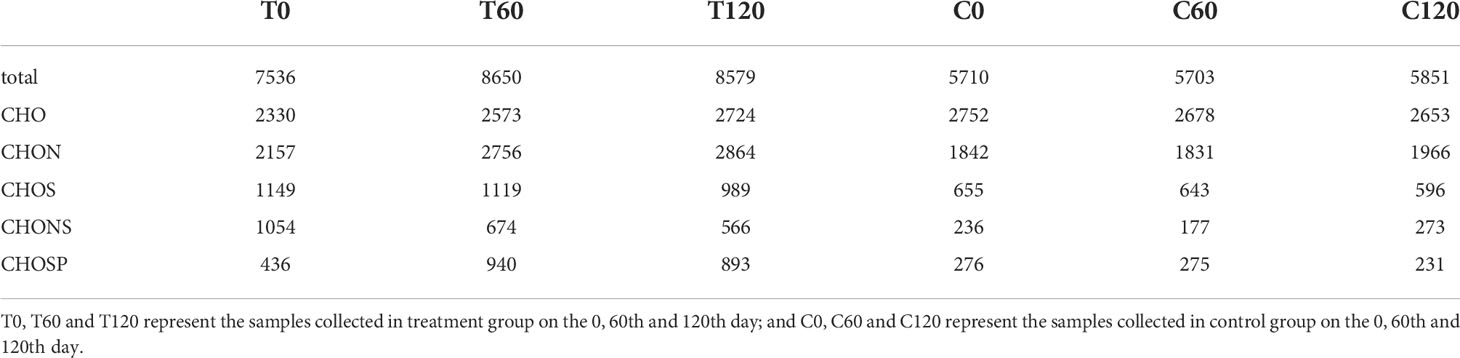
Table 1 The numbers of molecular formulas (MFs) contained in the DOC at different sampling time points during the 120-day degradation.
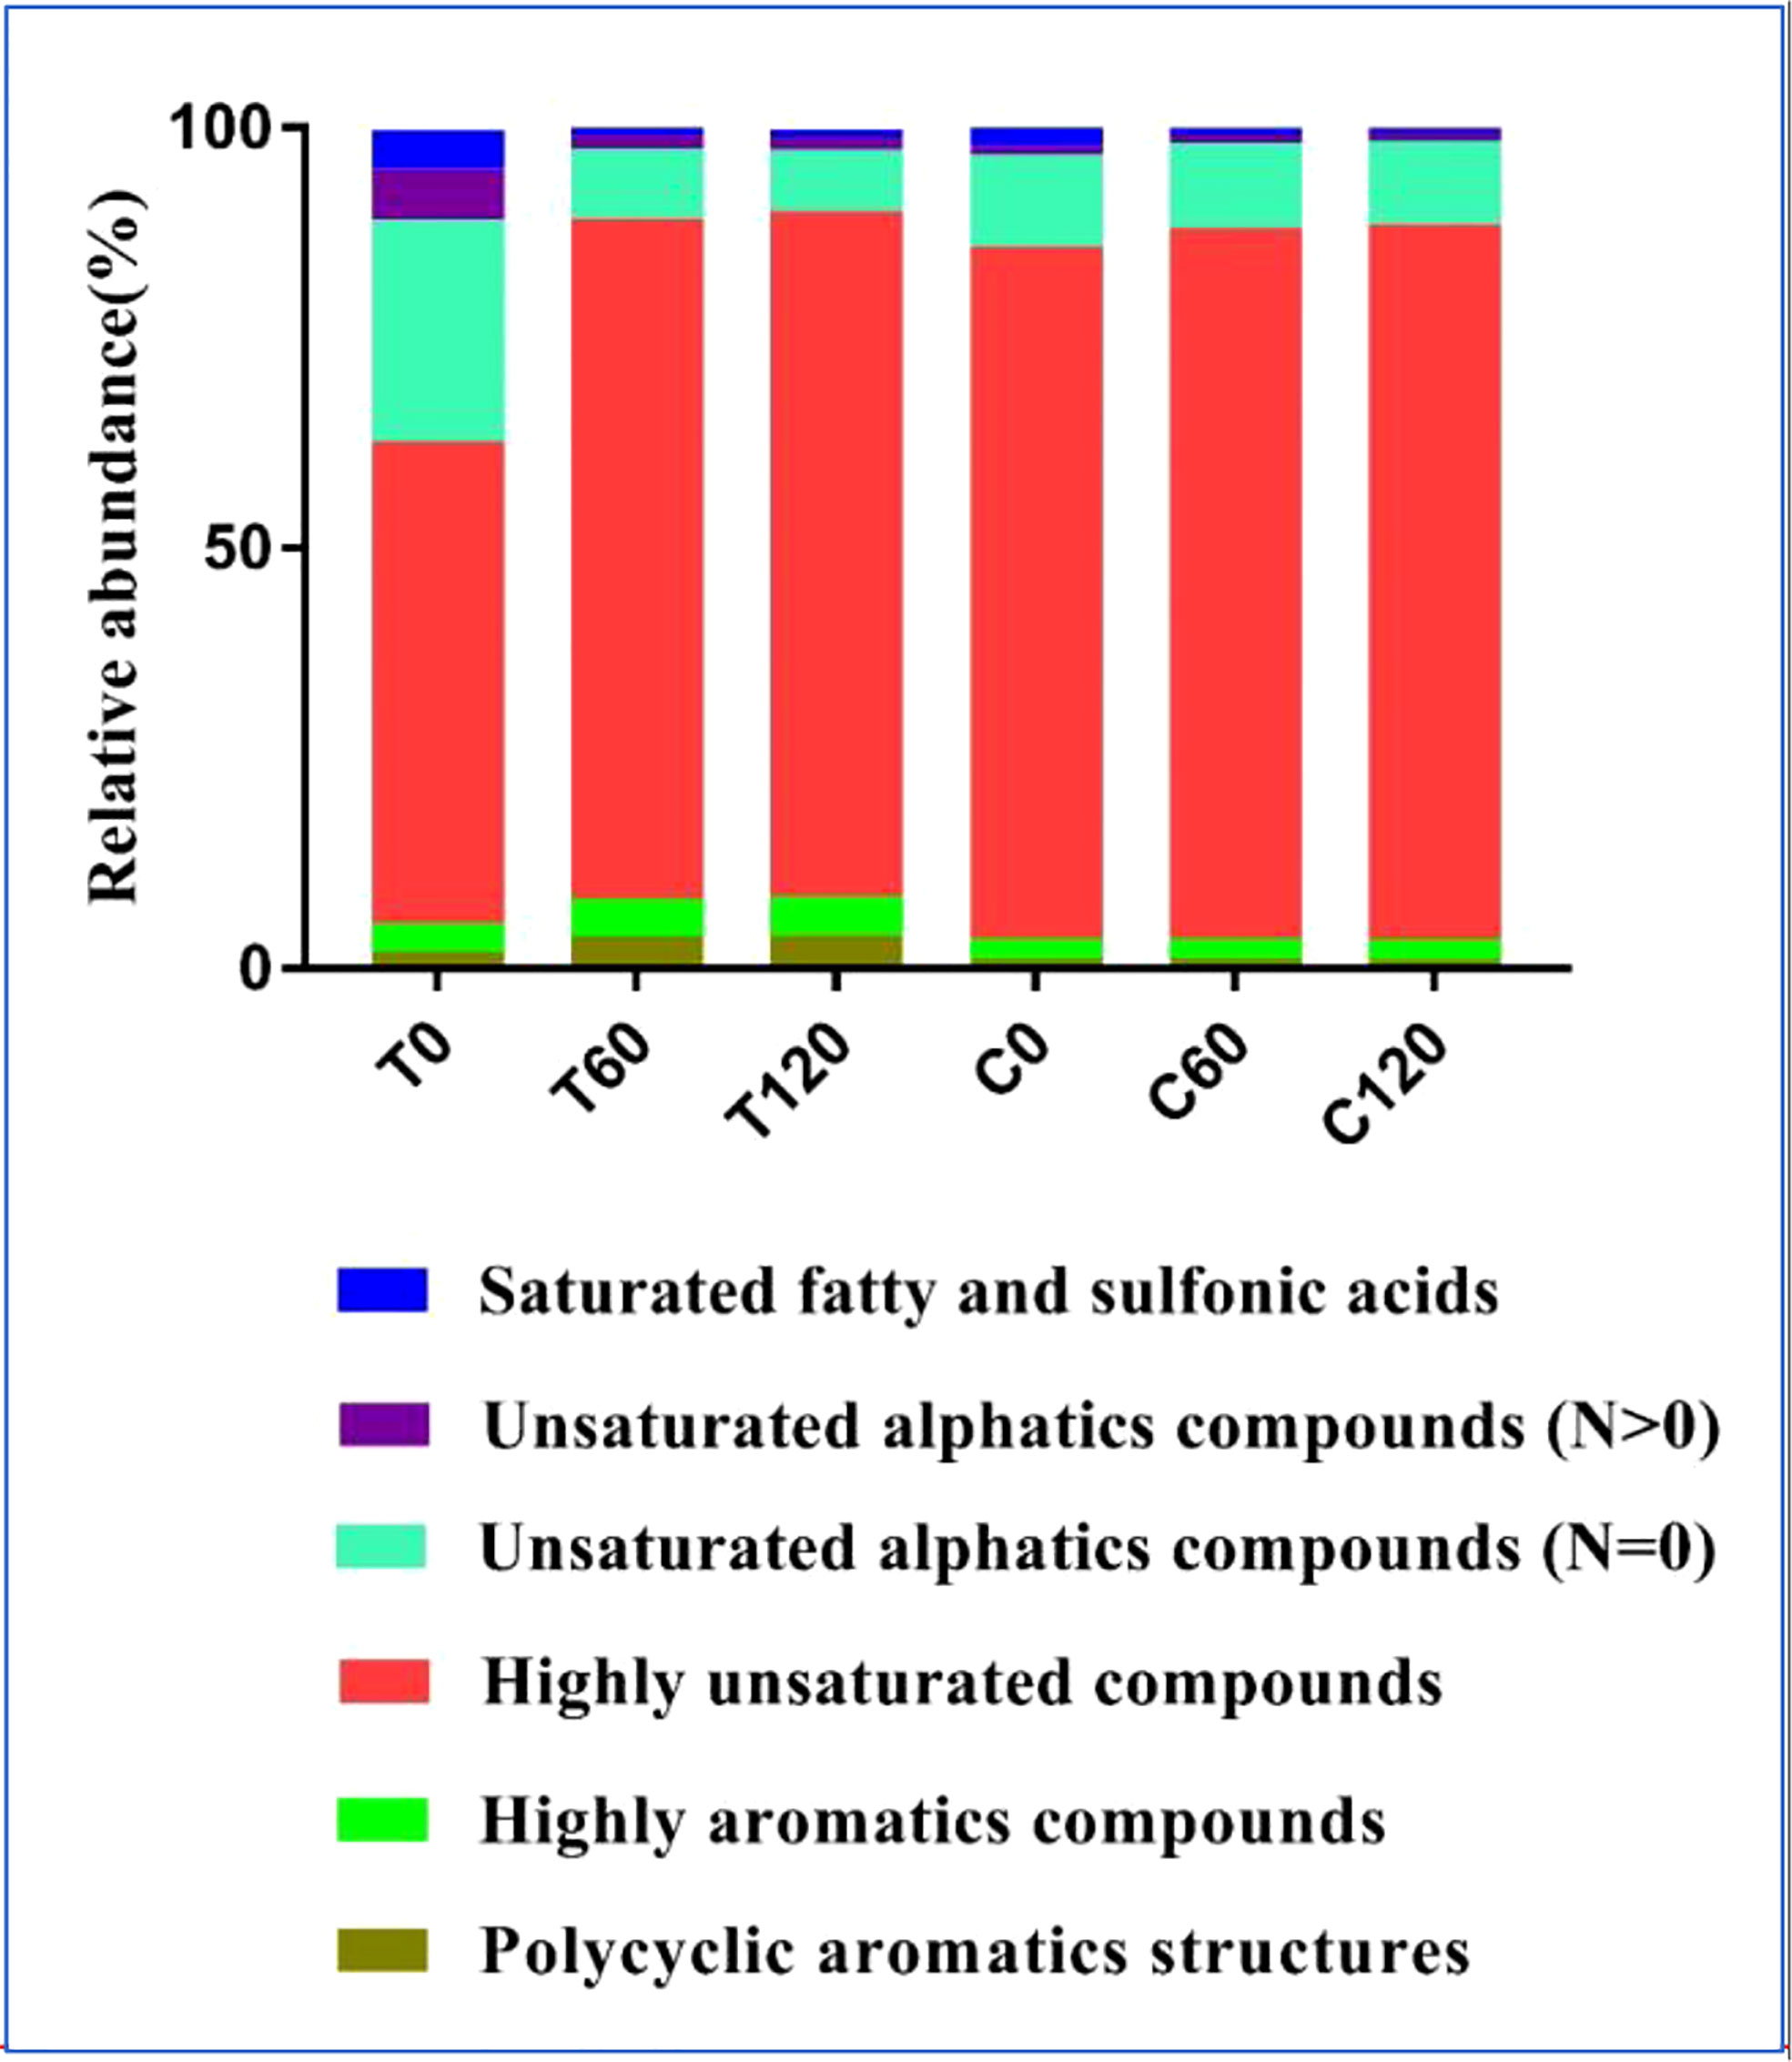
Figure 3 The relative abundance of DOC components identified with threshold criteria of the modified aromaticity index (AImod) values and H/C ratios in the 120-day degradation of DOC released by Saccharina japonica and that in natural seawater.
The average chemical characteristics for the treatment samples also changed significantly during the degradation process (Table 2). The Masswa at T0 was 18 Da lower than in C0 because of the DOC released by S. japonica. DBEwa and Almodwa were 13% and 15% lower, respectively, in T0 than in C0. In contrast, N/Cwa and S/Cwa were 75% and 142% higher, respectively, in T0 than in C0. After 60 days degradation, Masswa in T60 increased by 26 Da compared with T0, and O/Cwa, DBEwa, and Almodwa increased by 20%, 22%, and 28%, respectively, between T0 and T60. However, H/Cwa and N/Cwa decreased by 15% and 18%, respectively, between T0 and T60. There was very little variation in the average chemical characteristics between T60 and T120, except for an increase in Masswa of 10 Da. During the entire degradation process, the changes in average chemical characteristics in the control group were relatively small.

Table 2 The average chemical characteristics at different sampling points in 120-day degradation.
During the experiment, 2228 ASVs were identified. The raw data of ASVs were uploaded into national center for biotechnology information (NCBI) sequence read archive (SRA) database (accession number: PRJNA855139). Only 16% were present in both the treatment and control (Figure S2). The bacterial community in the treatment group was significantly different from the control based on the ANOSIM analysis of ASVs (Table S1). Based on the ASVs, 28 phylum, 56 classes, 147 orders, 241 families, and 419 genera were identified. HCA and NMDS analysis showed significant bacterial community succession during the 120-day degradation. In the treatment group, the bacterial community was divided into three clusters: T-I (T0, T2, T4, and T8), T-II (T16, T24, T30, and T45), and T-III (T60, T75, T90, and T120) (Figure 4; Figure S4). In the control group, the bacterial community was divided into two clusters: C-I (C0, C2 and C4) and C-II (C8, C16, C24, C30, C45, C60, C75, C90, and C120). In adddition, T-I and C-I, T-III, and C-II clustered together. The analysis of AONSIM also revealled the bacterial community succession in treatment and control (Table S1). The dominant classes in cluster T-I were Gammaproteobacteria, Bacteroidia, and Campylobacteria, with relative abundances of each one nearly 30% (Figure 5). Alphaproteobacteria, Gammaproteobacteria, and Bacteroidia were the dominant groups in cluster T-II. The relative abundance of Gammaproteobacteria and Bacteroidia were the same in clusters T-I and cluster T-II. In contrast, the relative abundance of Alphaproteobacteria was 20% higher in cluster T-II than in T-I. Cluster T-III had only two dominant classes: Alphaproteobacteria and Gammaproteobacteria, and the relative abundance of Alphaproteobacteria was nearly 70%. In the control group, Gammaproteobacteria and Alphaproteobacteria were the dominant classes in C-I and C-II respectively, each with a relative abundance of nearly 70%.
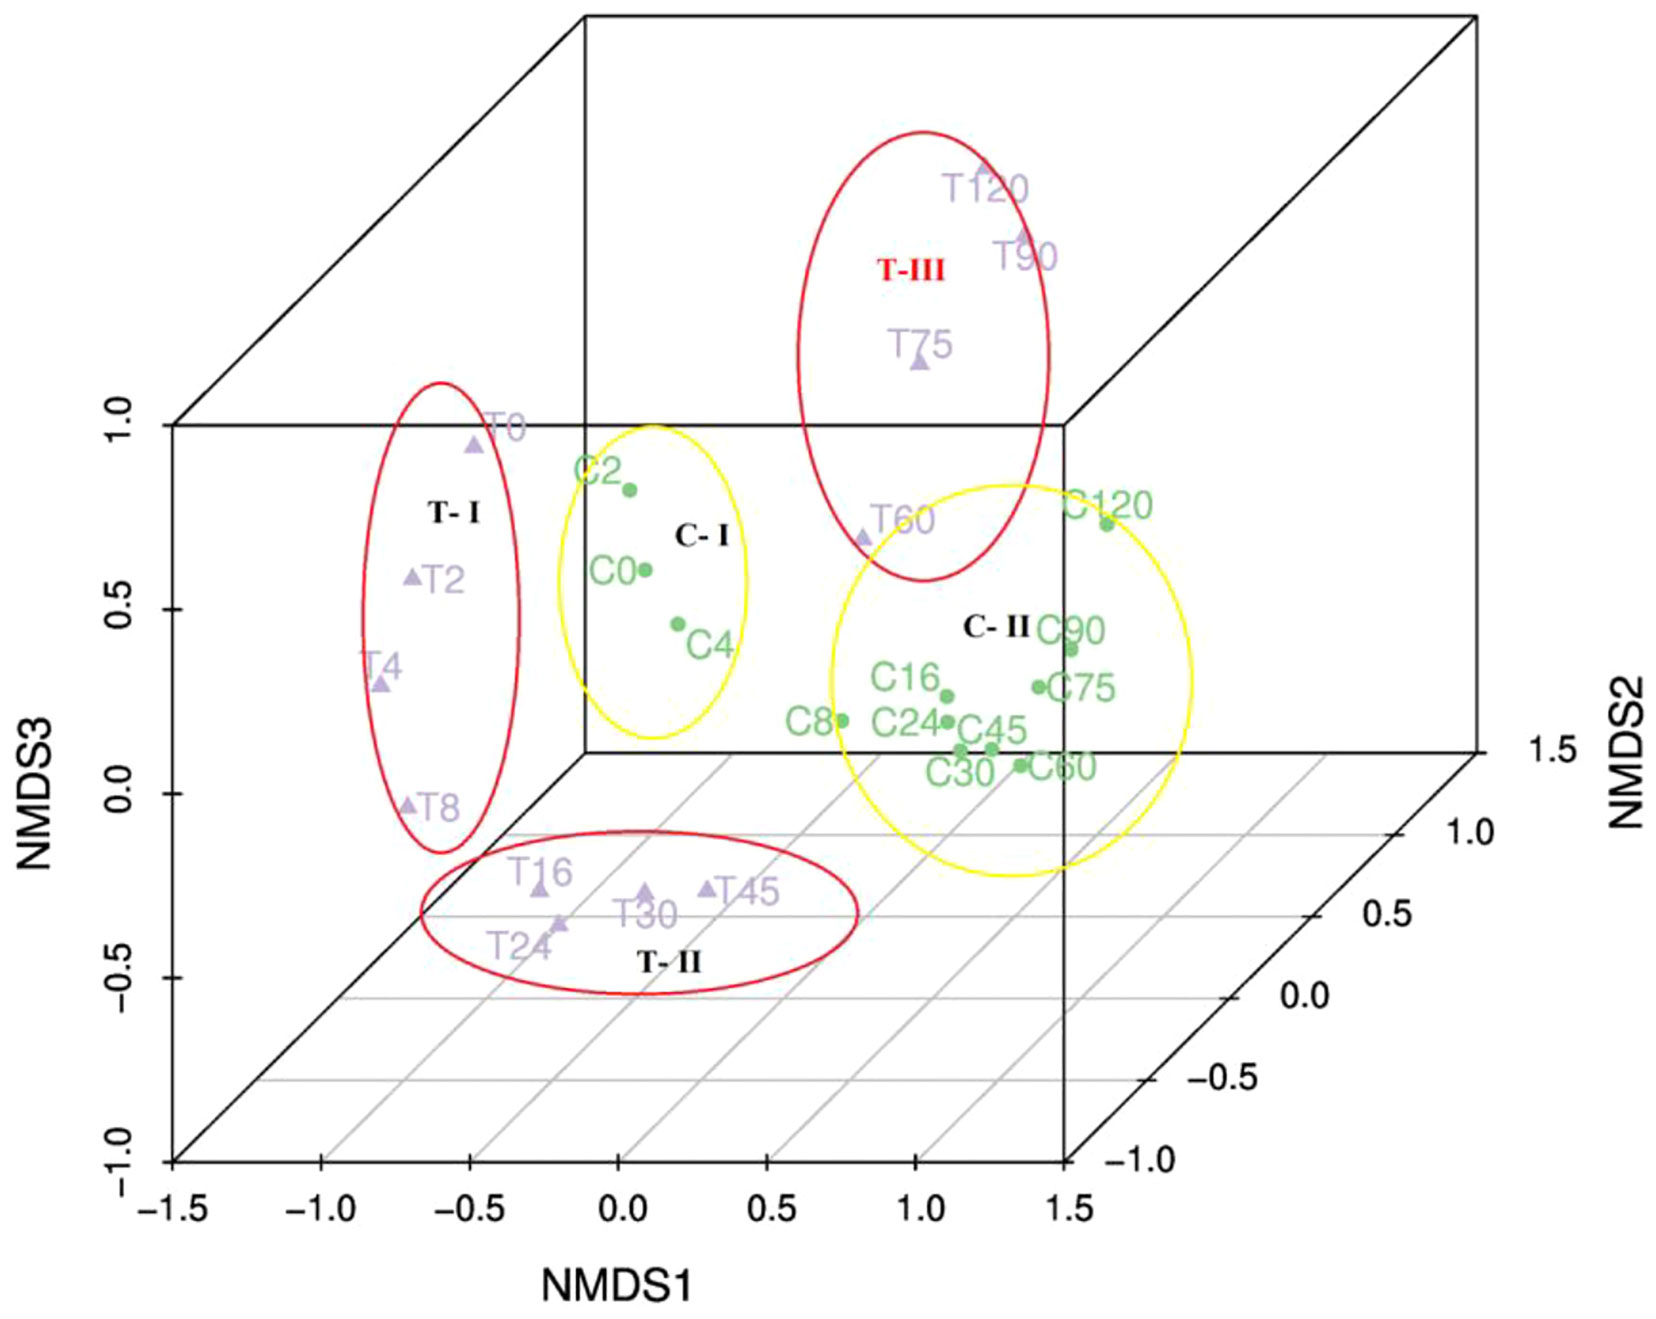
Figure 4 Nonmetric multidimensional scaling ordination of the bacterial communities in the 120-day degradation experiment.
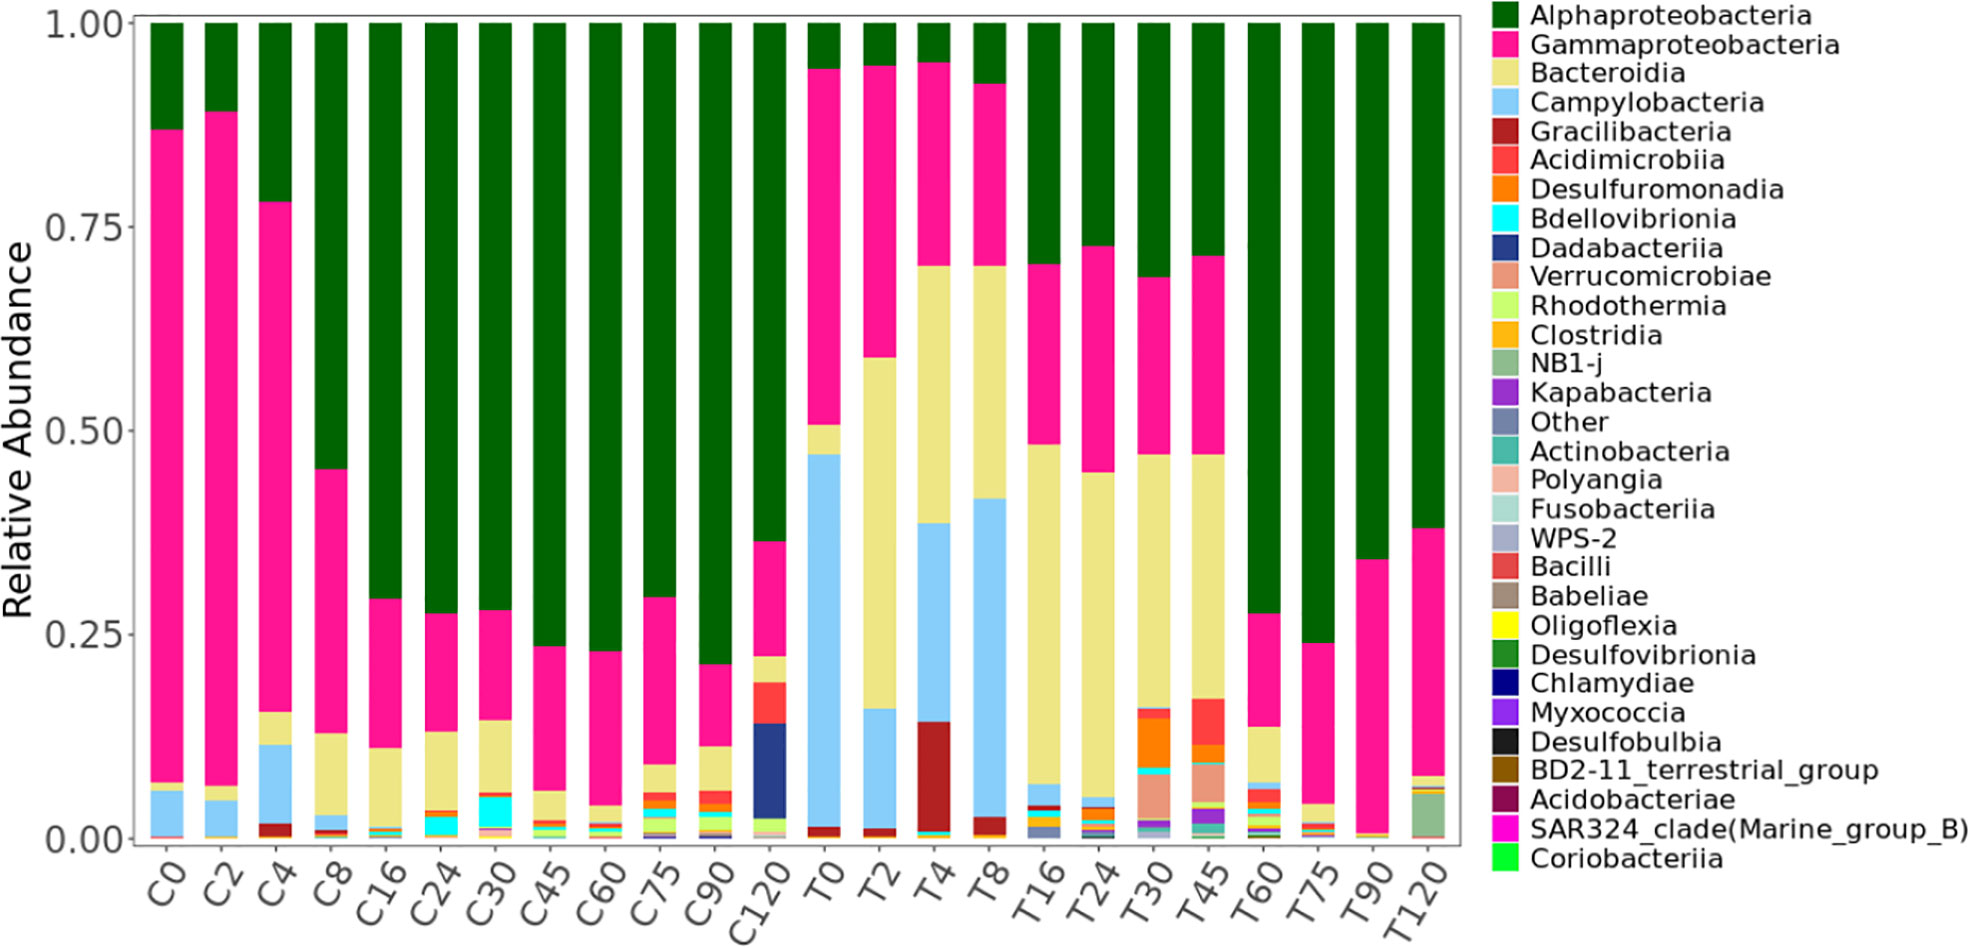
Figure 5 Variations in the bacterial community at the class level during the 120-day degradation of DOC released by Saccharina japonica and that in natural seawater.
Macroalgae culture has been recently proposed as a marine negative emission technique (NASEM, 2021). However, there are no marine carbon sequestration projects using macroalgae culture in operation, mainly because the carbon sequestration ability of macroalgae is controversial (Hill et al., 2015). This study may increase the understanding of carbon sequestration through the release of DOC by macroalgae culture.
After 48 h DOC collection (day 0), the DOC concentration in the treatment group was nearly ten times that of the control, indicating that DOC is effectively released by S. japonica. Bacterial abundance peaked at the same time, indicating that DOC released by S. japonica is strongly favored by bacteria (Wada et al., 2008; Gao et al., 2021). Nearly 90% of the DOC was degraded during the DOC RD stage, and the rest of the decomposition occurred during the DOC SD stage. Bacterial abundance decreased by an order of magnitude in the DOC RD and SD stages, and then remained stable during the DOC RS stage (Figure 1). The variation in the DOC concentration and bacterial abundance indicated that most of the DOC released by S. japonica was decomposed during the initial 2 months of the experiment, similar to observations of previous studies (Wada et al., 2008; Watanabe et al., 2020; Gao et al., 2021; Manikandan et al., 2021). However, the DOC released by phytoplankton can be decomposed within days to weeks (Hama et al., 2004). This indirectly indicates that not only labile DOC components, but also some refractory DOC components are released by kelp (Wada et al., 2008). Comparing the variation in the DOC concentration between treatment and control, 5% of the DOC released by S. japonica was estimated to have remained as RDOC. Considering 20% or more net primary production is released as DOC by kelp (Wada et al., 2007; Gao et al., 2021), we propose that carbon sequestration by macroalgae culture through the interaction between DOC release and bacterial degradation is not negligible.
The variation in the DOC composition revealed the details of the transformation of DOC released by S. japonica to RDOC. Generally, protein-like components are considered an indicator of labile composition in DOC (Yang et al., 2015) and humic-like components are considered a potential tracer of RDOC (Lønborg et al., 2013; Chen et al., 2020). Fluorescence analysis revealed that the labile components (C3) were rapidly exhausted during the DOC RD stage. Interestingly, humic-like components (C1 and C2) were slowly degraded during the entire experiment and did not significantly change the DOC concentration during the last 2 months of the experiment (DOC RS stage). This might represent a small percentage of the refractory components in the DOC released by S. japonica. Meanwhile, the RDOC component (C4) was produced gradually during the degradation process (Figure 2) (Chen et al., 2020). FT-ICR-MS analysis also revealed that both labile and refractory components were present in the DOC released by S. japonica. Generally, the degree of recalcitrance to biodegradation is in the order of polycyclic aromatic compounds > highly aromatics compounds > highly unsaturated compounds > unsaturated aliphatic compounds (N = 0) > unsaturated aliphatic compounds (N > 0) > saturated fatty and sulfonic acids (Schmidt et al., 2011; Cai et al., 2019). By comparing the molecular composition of T0 and C0, we found that labile components such as saturated fatty and sulfonic acids and unsaturated aliphatic compounds (N > 0) increased in relative abundance by 2.4% and 5%, respectively. Meanwhile, refractory components, such as polycyclic aromatic compounds and highly aromatics compounds, increased in relative abundance by 0.8% and 1%, respectively. This indicates that these labile components, and a small amount of refractory components, were present in the DOC released by kelp (Figure 3) (Wada et al., 2008; Watanabe et al., 2020). The relative abundance of labile and refractory components changed little between T60 and T120, suggesting that most degradation was completed during the DOC RD and SD stages.
FT-ICR-MS analysis showed the details of the RDOC production process at the molecular level. The number of MFs was 1826 higher in T0 than in C0, suggesting that DOC released by S. japonica contained new organic matter that does not exist in natural water. In addition, the Masswa was 18 Da lower in T0 than in C0, suggesting that the new matter was mainly low molecular weight organic matter. N/Cwa and S/Cwa were 75% and 143% higher, respectively, and CHON-, CHOS-, CHOSP-, and CHONS- were 17%, 75%, 58%, 347%, higher, respectively, in T0 than in C0 (Table 1). The variation in the molecular composition stated above indicates that the DOC released by S. japonica provided organic molecules containing nitrogen and sulfur (Chen et al., 2020). In nature, organic molecules containing nitrogen and sulfur mainly originate from proteins, amino acid, and polypeptides, and this may be explained by the molecular composition of C3 in FDOM. The DOC released by S. japonica decreased the DBEwa by 18% and Almodwa by 13%; these factors represent the degree of unsaturation and aromaticity, respectively (Table 2). This means that DOC released by S. japonica increased the composition of labile DOC (Wada et al., 2008; Gao et al., 2021). During the degradation in the RD and SD stages, DBEwa and Almodwa increased by 22% and 29%, respectively, meaning that degradation produced refractory components. Meanwhile, H/Cwa decreased by 15% and O/Cwa increased by 20%, which suggested that the degradation process is similar to the chemical reaction of oxidative dehydrogenation. In the initial 2 months of degradation, the number of MFs and Masswa increased by 1442 and 26 Da, respectively, but changed little during the last 2 months of degradation. This suggests that most of the degradation occurred during the initial 2 months. In addition, degradation produced high molecular weight organic matter and increased the molecular diversity in the treatment.
Van Krevelen diagrams reveal more details of the composition variation during oxidative dehydrogenation. S. japonica releasing DOC produced two groups of MFs (O/C > 0.5 and H/C > 1.5), which represented the saturated (refractory component) and reducible (labile component) composition, respectively (Figure 6A) (Cai et al., 2019). As the reducible components were degraded, two more groups of saturated components were produced (O/C > 0.8 and H/C < 1.5) during the initial 2 months (Figure 6B). At the end of the experiment, the increasing peak intensities and declining peak intensities almost overlapped, indicating that degree of saturation in the DOC changed little in the last 2 months of experiment (Figure 6C). Moreover, nearly 80% of the MFs in the DOC were shared between day 60 and day 120 of treatment (Figure S3).
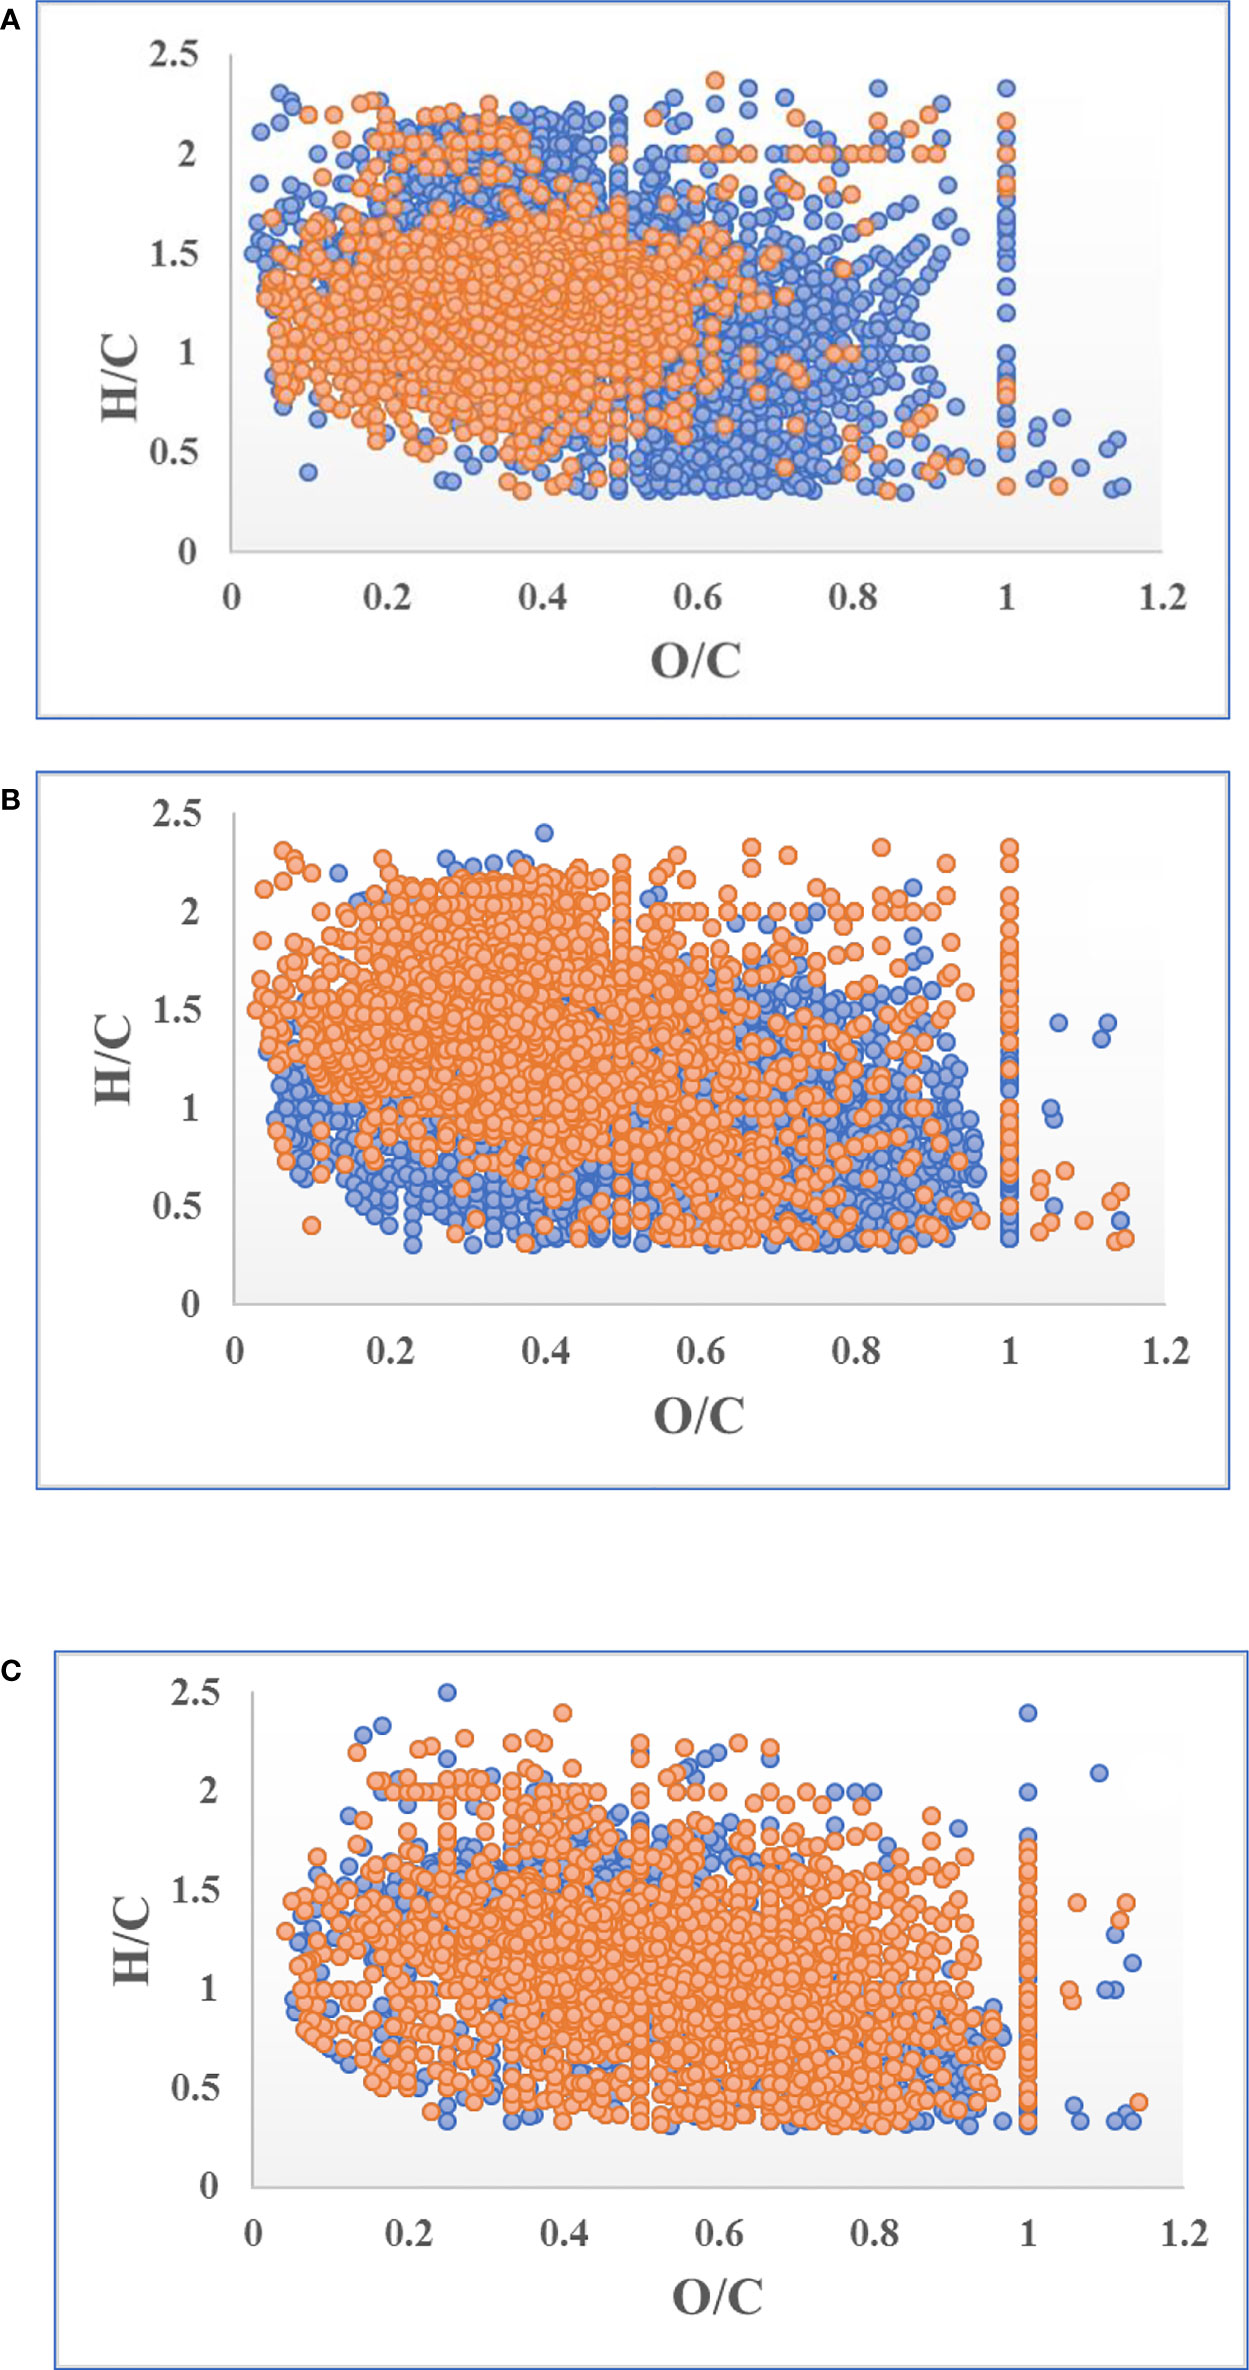
Figure 6 Variation in the normal peak intensity of molecular formulas (MFs) during the 120-day degradation. Blue and orange points represent increased and decreased peak intensities respectively. (A) Variation of MF peak intensity in T0 compared to C0; (B) variation of MF peak intensity in T60 compared to T0; (C) variation of MF peak intensity in T120 compared to T60.
The chemical reaction of oxidative dehydrogenation requires a high temperature, well above 100°C. However, this same reaction can be mediated by bacteria at room temperature and in darkness. The bacterial community succession was divided into 3 groups (T-I, T-II, and T-III) during treatment, but these groups did not completely agree with the stages representing the change in DOC (RD, SD, and RS). The RD stage included all of T-I and a part of T-II. The SD stage included a part of T-II and T-III. Perhaps the bacterial community was extremely sensitive to variations in the environment, such as metabolic substrate and dissolved oxygen (DO) (Sun et al., 2012). At the start of experiment, kelp introduced abundant organic matter containing sulfur (Chen et al., 2020), and maintained 80–100 times more bacterial biomass in treatment compared with the control during the RD stage (Figure 1). The rapid consumption of DOC in the treatment group resulted in depletion of DO (Figure S5). Anaerobic and sulfur-degrading Bacteroidia and Campylobacteria became the dominant classes in T-I (Voordouw et al., 1996; Hu et al., 2016). Continuous degradation of DOC sustained the anaerobic environment in T-II, and Bacteroidia remained the dominant class in T-II. The Alphaproteobacteria class mainly comprised the Rhodobacteraceae family, which is an important sulfur-degrading family, and this class became dominant in T-II (Figure S6) (Pujalte et al., 2014). In T-III, at the completion of DOC degradation, the aerobic Iodidimonadaceae family belonging to the Alphaproteobacteria class became the dominant family (Lino et al., 2016). Generally, bacterial rapidly consume labile DOC components, resulting in an anoxic environment during treatment in T-I and T-II stages (Figure S5), and the bacterial community changes rapidly with variations in the environment (Figure 4; Figures S4, S6). RDOC is the final product of degradation that then remains in the water (Figures 2, 3).
In this experiment, DO was an important factor for the succession of the bacterial community because of the limited air exchange. In contrast, DO may be ample in natural waters as wind and waves increase air exchange. Although the environmental conditions are great different, a reaction similar to oxidative dehydrogenation driven by bacteria was observed in the ocean (Medeiros et al., 2015). In the deep sea, which is the final reservoir for DOC degraded by bacteria, DOC had higher O/Cwa and lower H/Cwa than that in the surface DOC. It may indicate that RDOC producing process by interaction between DOC released by cultured kelp (Saccharina japonica) and the bacterial community is similar as the RDOC producing process in natural condition. This study may help to reveal the potential to increase marine carbon sequestration using macroalgae culture.
The present study shows that DOC released by S. japonica was rapidly degraded into RDOC by bacteria. After 2 months, LDOC components in DOC were degraded completely, and 5% of this DOC was transformed into RDOC. Although culture biomass will be harvested during the actual kelp culturing process, an estimated 1–2% of the net primary production can still be sequestrated as RDOC. This suggests that sequestrating carbon by macroalgae culture is feasible.
The datasets presented in this study can be found in online repositories. The names of the repository/repositories and accession number(s) can be found below: https://www.ncbi.nlm.nih.gov/- PRJNA855139. Further inquiries can be directed to the corresponding authors.
MZ and HQ contributed to data curation, visualization, writing – original draft, validation. ZW and BL performed data curation and visualization. YM contributed to writing – review and editing and resource. All authors contributed to the article and approved the submitted version.
This study was supported by the National Natural Science Foundation of China (42176159) and Yantai Science and Technology Innovation and Development Planning (2020MSGY059).
The authors declare that the research was conducted in the absence of any commercial or financial relationships that could be construed as a potential conflict of interest.
All claims expressed in this article are solely those of the authors and do not necessarily represent those of their affiliated organizations, or those of the publisher, the editors and the reviewers. Any product that may be evaluated in this article, or claim that may be made by its manufacturer, is not guaranteed or endorsed by the publisher.
The Supplementary Material for this article can be found online at: https://www.frontiersin.org/articles/10.3389/fmars.2022.985548/full#supplementary-material
Abdullah M. I., Fredriksen S. (2004). Production, respiration and exudation of dissolved organic matter by the kelp Laminaria hyperborea along the west coast of Norway. J. Mar. Biol. Assoc. Uk 84, 887–894. doi: 10.1017/S002531540401015Xh
Amaral V., Ortega T., Romera-Castillo C., Forja J. (2021). Linkages between greenhouse gases (CO2, CH4, and N2O) and dissolved organic matter composition in a shallow estuary. Sci. Total Environ. 788, 147863. doi: 10.1016/j.scitotenv.2021.147863
Bittar T. B., Vieira A. A., Stubbins A., Mopper K. (2015). Competition between photochemical and biological degradation of dissolved organic matter from the cyanobacteria microcystis aeruginosa. Limnol Oceanogr 60, 1172–1194. doi: 10.1002/lno.10090
Bolyen E., Rideout J. R., Dillon M. R., Bokulich N. A., Abnet C. C., and Al-Ghalith G. A., et al. (2019). Reproducible, interactive, scalable and extensible microbiome data science using QIIME 2. Nat. Biotechnol. 37, 852–857. doi: 10.1038/s41587-019-0209-9
Cai R., Zhou W., He C., Tang K., Guo W., Shi Q., et al. (2019). Microbial processing of sediment-derived dissolved organic matter: implications for its subsequent biogeochemical cycling in overlying seawater. J. Geophys Res-Biogeo 124 (11), 3479–3490. doi: 10.1029/2019JG005212
Callahan B. J., McMurdie P. J., Rosen M. J., Han A. W., Johnson A. J. A., Holmes S. P. (2016). DADA2: High-resolution sample inference from illumina amplicon data. Nat. Methods 13, 581–583. doi: 10.1038/nmeth.3869
Chen J., Li H. M., Zhang Z. H., He C., Shi Q., Jiao N., et al. (2020). DOC dynamics and bacterial community succession during long-term degradation of Ulva prolifera and their implications for the legacy effect of green tides on refractory DOC pool in seawater. Water Res. 185, 116286. doi: 10.1016/j.watres.2020.116268
DeVries T., Holzer M., Primeau F. (2017). Recent increase in oceanic carbon uptake driven by weaker upper-ocean overturning. Nature 542, 215–218. doi: 10.1038/nature21068
Dittmar T., Koch B., Hertkorn N., Kattner G. (2008). A simple and efficient methodfor the solid-phase extraction of dissolved organic matter (SPE-DOM) from seawater. Limnol. Oceanogr. Meth. 6 (6), 230–235. doi: 10.4319/lom.2008.6.230
Dorte K. J., Carlos M. D. (2016). Substantial role of macroalgae in marine carbon sequestration. Nat. Geosci 9, 737–742. doi: 10.1038/ngeo2790
FAO (2021). “FAO yearbook,” in Fishery and aquaculture statistics 2019/FAO annuaire. doi: 10.4060/cb7874t
Fu Q. L., Fujii M., Riedel T. (2020). Development and comparison of formula assignment algorithms for ultrahigh-resolution mass spectra of natural organic matter. Anal. Chim. Acta 1125, 247–257. doi: 10.1016/j.aca.2020.05.048
Gao Z., Guéguen C. (2018). Distribution of thiol, humci substances and colored dissolved organic matter during the 2015 Canadian Arctic GEOTRACES cruises. Mar. Chem. 203, 1–9. doi: 10.1016/j.marchem.2018.04.001
Gao Y., Zhang Y., Du M., Lin F., Jiang W., Li W., et al. (2021). Dissolved organic carbon from cultured kelp Saccharina japonica: production, bioavailability, and bacterial degradation rates. Aquacult Env. Interac 13, 101–110. doi: 10.3354/aei00393
Hama T., Yanagi K., Hama J. (2004). Decrease in molecular weight of photosynthetic products of marine phytoplankton during early diagenesis. Limnol Oceanogr 49, 471–481. doi: 10.4319/lo.2004.49.2.0471
Hill R., Bellgrove A., Macreadie P. I., Petrou K., Beardall J., Steven A., et al. (2015). Can macroalgae contribute to blue carbon? an Australian perspective. LIMNOL OCEANOGR 60, 1689–1706. doi: 10.1002/lno.10128
Hu X., Du H., Ren G., Xu Y. (2016). Illuminating anaerobic microbial community and cooccurrence patterns across a quality gradient in Chinese liquor fermentation pit muds. Appl. Environ. Microb. 82, 8. doi: 10.1128/AEM.03409-15
IPCC (2020) Changing ocean, marine ecosystems, and dependent communities. Available at: https://www.ipcc.ch/srocc/chapter/chapter-5/.
Jiao N. Z., Herndl G. J., Hansell D. A., Benner R., Kattner G., Wilhelm S. W., et al. (2010). Microbial production of recalcitrant dissolved organic matter: long term carbon storage in the global ocean. Nat. Rev. Microbiol. 8, 593–599. doi: 10.1038/nrmicro2386
Koch B. P., Dittmar T. (2006). From mass to structure: an aromaticity index for high-resolution mass data of natural organic matter. Rapid Commun. Mass Sp 20 (5), 926–932. doi: 10.1002/rcm.2386
Koch B. P., Kattner G., Witt M., Passow U. (2014). Molecular insights into the microbial formation of marine dissolved organic matter: recalcitrant or labile? Biogeosciences 11, 4173–4190. doi: 10.5194/bg-11-4173-2014,201
Krause-Jensen D., Duarte C. M. (2016). Substantial role of macroalgae in marine carbon sequestration. Nat. Geosci 9, 737–742. doi: 10.1038/ngeo2790
Kulkarni H., Mladenov N., Datta S. (2018). Effects of acidification on the optical properties of dissolved organic matter from high and low arsenic groundwater and surface water. Sci. Total Environ. 653, 1326–1332. doi: 10.1016/j.scitotenv.2018.11.040
Lønborg C., Middelboe M., Brussaard C. P. (2013). Viral lysis of micromonas pusilla: impacts on dissolved organic matter production and composition. Biogeochemistry 116 (1–3), 231–240. doi: 10.1007/s10533-013-9853-1
Lino T., Ohkuma M., Kamagata Y., Amachi S. (2016). Iodidimonas muriae gen. nov., sp. nov., an aerobic iodide-oxidizing bacterium isolated from brine of a natural gas and iodine recovery facility, and proposals of Iodidimonadaceae fam. nov., Iodidimonadales ord. nov., Emcibacteraceae fam. nov. and Emcibacterales ord. nov. Int. J. Syst. Evol. Micr 66, 12. doi: 10.1099/ijsem.0.001462
Mahmood T., Fang J., Jiang Z., Ying W., Zhang J. (2017). Seasonal distribution, sources and sink of dissolved organic carbon in integrated aquaculture system in coastal waters. Aquacult Int. 25, 71–85. doi: 10.1007/s10499-016-0014-0
Manikandan B., Thomas A. M., Shetye S. S., Balamurugan S., Mohandass C., Nandakumar K. (2021). Macroalgal release of dissolved organic carbon in coral reef and its interaction with the bacteria associated with the coral Porites lutea. Environ. Sci. pollut. R 28, 66998–67010. doi: 10.1007/s11356-021-15096-7
Martin M. (2011). Cutadapt removes adapter sequences from high-throughput sequencing reads. EMBnet. J. 17 (1), 10. doi: 10.14806/ej.17.1.200
Medeiros P. M., Seidel M., Powers L. C., Dittmar T., Hansell D. A., Miller W. L. (2015). Dissolved organic matter composition and photochemical transformations in the northern north pacific ocean. Geophys Res. Lett. 42 (3), 863–870. doi: 10.1002/2014GL062663
NASEM (2019). Negative emissions technologies and reliable sequestration: A research agenda (Washington, DC: The National Academies Press). doi: 10.17226/25259
NASEM (2021). A research strategy for ocean-based carbon dioxide removal and sequestration (Washington, DC: The National Academies Press). doi: 10.17226/26278
Ortega A., Geraldi N. R., Alam I., Kamau A. A., Acinas S. G., Logares R., et al. (2019). Important contribution of macroalgae to oceanic carbon sequestration. Nat. Geosci 12 (9), 748–754. doi: 10.1038/s41561-019-0421-8
Post W. H., Peng T. H., Emanuel W. R., King A. W., Dale V. H., DeAngelis D. L. (1990). The global carbon cycle. Am. Sci. 78(4), 310–326.
Pujalte M. J., Lucena T., María A., et al. (2014). “The family rhodobacteraceae,” in The prokaryotes (Berlin: Springer), 439–512, ISBN: ISBN 978-3-642-30196-4. doi: 10.1007/978-3-642-30197-1_377
Reed D. C., Carlson C. A., Halewood E. R., Nelson J. C., Harrer S. L., Rassweiler A., et al. (2015). Patterns and controls of reef-scale production of dissolved organic carbon by giant kelp Macrocystis pyrifera. limnol oceanogr 60 (6), 1996–2008. doi: 10.1002/lno.10154
Sabine C. L., Feely R. A., Gruber N., Key R. M., Lee K., Bullister J. L., et al. (2004). The oceanic sink for anthropogenic CO2. Science 305, 367–371. doi: 10.1126/science.1097403
Schmidt F., Koch B. P., Elvert M., Schmidt G., Witt M., Hinrichs K. (2011). Diagenetic transformation of dissolved organic nitrogen compounds under contrasting sedimentary redox conditions in the black Sea. Environ. Sci. Technol. 45 (12), 5223–5229. doi: 10.1021/es2003414
Sun M. Y., Dafforn K. A., Brown M. V., Johnston E. L. (2012). Bacterial communities are sensitive indicators of contaminant stress. Mar. pollut. Bull. 64 (5), 1029–1038. doi: 10.1016/j.marpolbul.2012.01.035
Voordouw G., Armstrong S. M., Reimer M. F., Fouts B., Telang A. J., Shen. Y., et al. (1996). Characterization of 16S rRNA genes from oil field microbial communities indicates the presence of a variety of sulfate-reducing, fermentative, and sulfide-oxidizing bacteria. Appl. Environ. Microb. 62 (5), 1623–1629. doi: 10.1128/aem.62.5.1623-1629.1996
Wada S., Aoki M. N., Mikami A., Komatsu T., Tsuchiya Y., Sato T., et al. (2008). Bioavailability of macroalgal dissolved organic matter in seawater. Mar. Ecol. Prog. Ser. 370, 33–44. doi: 10.3354/meps07645
Wada S., Aoki M. N., Tsuchiya Y., Sato T., Shinagawa H., Hama T. (2007). Quantitative and qualitative analyses of dissolved organic matter released from Ecklonia cava kjellman, in oura bay, shimoda, izu peninsula, Japan. J. Exp. Mar. Biol. Ecol. 349, 344–358. doi: 10.1016/j.jembe.2007.05.024
Wada S., Hama T. (2013). The contribution of macroalgae to the coastal dissolved organic matter pool. Estuar. Coast. Shelf S 129, 77–85. doi: 10.1016/j.ecss.2013.06.007
Watanabe K., Yoshida G., Hori M., Umezawa Y., Moki H., Kuwae T. (2020). Macroalgal metabolism and lateral carbon flows can create significant carbon sinks. Biogeosciences 17, 2425–2440. doi: 10.5194/bg-17-2425-2020
Yang L., Chen C. T. A., Hong H., Chang Y. C., Lui H. K. (2015). Mixing behavior and bioavailability of dissolved organic matter in two contrasting subterranean estuaries as revealed by fluorescence spectroscopy and parallel factor analysis. Estuar. Coast. Shelf S 166, 161–169. doi: 10.1016/j.ecss.2014.10.018
Zhang T., Wang X. (2017). Release and microbial degradation of dissolved organic matter (DOM) from the macroalgae Ulva prolifera. Mar. pollut. Bull. 125 (1-2), 192–198. doi: 10.1016/j.marpolbul.2017.08.029
Keywords: macroalgae culture, carbon sequestration, bacterial community, refractory dissolved organic carbon, Saccharina japonica
Citation: Zhang M, Qin H, Wang Z, Li B and Ma Y (2022) The interaction between DOC released by cultured kelp (Saccharina japonica) and the bacterial community reveals the potential for increasing marine carbon sequestration by macroalgae culture. Front. Mar. Sci. 9:985548. doi: 10.3389/fmars.2022.985548
Received: 04 July 2022; Accepted: 12 September 2022;
Published: 27 September 2022.
Edited by:
Jeng-Wei Tsai, China Medical University, TaiwanReviewed by:
Zhanhui Qi, Key Laboratory of South China Sea Fishery Resources Exploitation and Utilization (CAFS), ChinaCopyright © 2022 Zhang, Qin, Wang, Li and Ma. This is an open-access article distributed under the terms of the Creative Commons Attribution License (CC BY). The use, distribution or reproduction in other forums is permitted, provided the original author(s) and the copyright owner(s) are credited and that the original publication in this journal is cited, in accordance with accepted academic practice. No use, distribution or reproduction is permitted which does not comply with these terms.
*Correspondence: Yuanqing Ma, bWF5dWFucWluZ0BzaGFuZG9uZy5jbg==
†These authors have contributed equally to this work and share first authorship
Disclaimer: All claims expressed in this article are solely those of the authors and do not necessarily represent those of their affiliated organizations, or those of the publisher, the editors and the reviewers. Any product that may be evaluated in this article or claim that may be made by its manufacturer is not guaranteed or endorsed by the publisher.
Research integrity at Frontiers
Learn more about the work of our research integrity team to safeguard the quality of each article we publish.