- Department of Ecology and Marine Resources, Instituto de Investigaciones Marinas (CSIC), Vigo, Spain
Stable isotopes can be used to reconstruct diet in fishes, an approach that is particularly useful in threatened or endangered species where lethal sampling needs to be avoided To apply this method stable isotopes need to be measured both in the consumers and dietary sources As turnover rates may largely differ across tissues, the reconstruction should consider the uncertainty associated with sampling timing for both consumers and dietary sources. The present study investigated for the first time the application of a time lag for the estimation of the trophic position and the dietary regime in the greater pipefish Syngnathus acus (Family Syngnathidae). For that, two isotopic (δ13C and δ15N) data sets from dorsal fin-clipped tissues were used, including values in potential sources sampled (a) concomitantly with consumers (Unshifted approach) or (b) in the season sampled preceding consumer sampling (Shifted approach). The results attained indicate that the trophic position of the species was not affected (< 0.6% change) by shifting when analyzed for the annual dataset (global assessment). However, the trophic level estimated in the shifted treatment was ca. 6% higher than in the unshifted approach when the analysis was performed using a seasonal dataset (seasonal assessment including exclusively specimens collected in summer). Regarding the reconstruction of the dietary regime and in comparison to the unshifted approach, the results attained with shifted sampling revealed a higher preference for amphipods (43.7%), isopods (19.5%) and mysidaceans (12.1%), and a reduction in the reconstructed abundance for harpacticoid copepods (5.1%). These findings were similar to those attained for specimens and food web components collected in the same sampling period (seasonal dataset), both in females and males. This study demonstrates (1) the variability of estimates in the reconstruction of diet regimes depending on the data time shifting applied, and (2) the importance of considering adequate time lags in the assessment for syngnathid fishes.
Introduction
The trophic position and dietary regimes of animalscan be analyzed following several approaches, including gut content and fecal material analyses (Hynes, 1950; Hyslop, 1980; Jobling, 1987; Baker et al., 2013), faecal metabarcoding and metagenomics (Barnett et al., 2010; Valentini et al., 2009; Kodama et al., 2020), fatty acid signature analysis (Iverson et al., 2004; Xu et al., 2020), or stable isotope analysis (SIA) (DeNiro and Epstein, 1981; Post, 2002; Caut et al., 2009; Boecklen et al., 2011; McMahon et al., 2011),. The latter is particularly interesting in studies involving vulnerable species, where non-lethal sampling should be achieved, but implies the analysis of target specimens, and their potential dietary resources and baseline resources which are the base of the food web (e.g., particulate organic matter, primary producers, and consumers). Assessments of temporal variation in diets are important for the understanding of the trophic ecology of fishes. Seasonal variation in the relative contribution of dietary resources should be reflected in the isotopic fingerprint of fish fin or muscle tissues.
The advantage of using clips of dorsal fin for SIA is that it is a non-lethal technique, which is highly recommended for vulnerable and endangered species (Sanderson et al., 2009; Valladares and Planas, 2012; Busst et al., 2015). In syngnathids and other fish species, the dorsal fin clips can be used as surrogates of muscle tissues, which provide mid-term information on the composition of the diet (Valladares and Planas, 2012; Valladares et al., 2016). Different tissues respond differently to dietary shifts due to dissimilarities in tissue turnover rates (Tieszen et al., 1983; Madigan et al., 2012; Busst et al., 2015; Vander Zanden et al., 2015). Consequently, isotopic values in fishes do not necessarily mirror their recent dietary regimes. Since different animal tissues incorporate stable isotopes at different rates or in different fractions, the dietary shifts will be reflected differently in tissues (Tieszen et al., 1983; Hobson and Clark, 1992; Dalerum and Angerbjörn, 2005; Jardine et al., 2017). The most straightforward isotopic approach for assessing temporal diet variation is to compare samples from the same type of tissue that has been sampled over time (Dalerum and Angerbjörn, 2005). This approach provides either long (bone, connective tissue, teeth), medium (muscle, scales, fins) or short-term (liver, blood) dietary variation (Tieszen et al., 1983; Madigan et al., 2012; Busst et al., 2015; Vander Zanden et al., 2015). Blood data typically provide the most reliable interpretations for recent diet and migration studies in fishes, whereas white muscle, scales and fins show medium-scale estimates (Guelinckx et al., 2007; Thomas and Crowther, 2015; Davis and Pineda-Munoz, 2016). Hence, available knowledge on the incorporation and turnover rates of stable isotopes in tissues must be considered.
In ecological and experimental studies, the inference of resource usage through stable isotopes is typically estimated from samples of prey and consumers taken concomitantly or over a short time interval. This procedure is often a result of sampling limitations in the field (i.e., time and cost) but might introduce methodological caveat depending on the consumer and the type of tissue used as reference material. Inferring dietary regimes for a fish population from samples collected at different times (i.e., repeated sampling of a proxy over time), concomitantly with source and baseline sampling, might lead to quantitative biases and misrepresentations of diet composition estimates (Possamai et al., 2021). In trophic studies, it is important that the sampling regime effectively captures the temporal and spatial isotopic variation in food sources and target organisms. One of the main uncertainties, when using Bayesian mixing models in diet reconstruction from isotopic data refers, to the periods over which the tissues of interest were synthesized. The consumer tissues have the chance to incorporate and then reflect their isotopic signatures with a delay depending on tissue turnover rates (Hesslein et al., 1993; Martinez del Rio et al., 2009; Wolf et al., 2009). This delay is known as time lag, which also varies depending on the species. The period over which the diet is to be estimated and what tissues best reflect this period are of pivotal importance (Phillips et al., 2014). Time lags are unknown for most species, and they should not be neglected in trophic analyses from isotopic values, especially when assessing seasonal changes (Possamai et al., 2021).
The present study highlights for the first time in syngnathids (Family Syngnathidae) the importance of applying time lags to both isotopic baselines and dietary resources. Incorporating appropriate time lags into stable isotope analyses in trophic studies are important. The time lag applied in the study approximates the isotopic turnover time expected for food assimilation and the incorporation in tissues of small fishes (see Possamai et al., 2021 and references therein).
Isotopic data from wild populations of syngnathids are limited and large isotopic datasets from annual monitoring are almost lacking. Four syngnathid species (Hippocampus guttulatus, Hippocampus hippocampus, Entelurus aequoreus and Syngnathus acus) have been collected in Cíes Archipelago (Piñeiro-Corbeira et al., 2021; Planas et al., 2021). Those species co-occur on some areas in Cíes Archipelago, and display similar trophic features (Piñeiro-Corbeira et al., 2021). However, a seasonal monitoring for two consecutive years only provided a large set of isotopic data for Syngnathus acus Linnaeus, 1758. Hence, this pipefish was selected in this study as representative of syngnathid populations in Cíes Archipelago.
The great pipefish S. acus is the largest European syngnathid. Although the knowledge on the ecology of this species is partially known, its ecology and trophic characteristics have been recently studied for the population inhabiting Cíes Archipelago (Atlantic Islands National Park, NW Iberian Peninsula) (2021; Planas et al., 2020a; Hernández-Urcera et al., 2021; Piñeiro-Corbeira et al., 2021; Planas, 2022). The population inhabiting Cíes Archipelago consists almost exclusively of large adults that migrate by the end of the breeding season, which is typically from mid-spring to summer. The species is a dietary specialist fish foraging mostly near the substrate. This pipefish partially shifts its diet relative to prey availability (Piñeiro-Corbeira et al., 2021; Planas, 2022). Previous studies reported that S. acus is a selective but flexible predatory fish displaying high annual and seasonal trophic plasticity (Planas, 2022), foraging preferentially on amphipods, and, to a lesser extent, on carideans, copepods, isopods, and mysidaceans, in decreasing order. The seasonal fluctuating characteristics of their preferred habitat, including temperature regime, development of the macroalgal beds, structure of epifaunal assemblages, as well as migratory events (Piñeiro-Corbeira et al., 2021) have a strong effect on the availability and characteristics of the dietary resources, which is reflected on their stable isotope profiles (Planas, 2022).
This study considered the aforementioned concerns and potential isotopic mismatches due to different temporal lags between producers and consumers. The investigation evaluated the application of a time lag in the incorporation of stable isotope values between dietary resources and consumers (Syngnathus acus) to enhance (1) trophic position estimates and (2) the reconstruction of relative proportions of dietary resources in the species. Previous studies in the syngnathid H. guttulatus concluded that the isotopic effect of a shift in the dietary regime of adults would be reflected with a delay of about 3 months in either fin tissues or fish larvae (Planas et al., 2020a; Planas et al., 2020b). Since similar studies in other syngnathids are lacking, this study assumes that S. acus display similar tissue turnover rates.
Materials and methods
Study sites
This study was conducted in Cíes Archipelago (42°13’N, 8°54’W) off Galicia (Spain) in the Atlantic Islands Marine National Park (NW Iberian Peninsula, Europe) (Figure 1) (see Fernández et al., 2020 for more information). Based on seaweed cover, substrate characteristics, and exposure level to open water (Piñeiro-Corbeira et al., 2021; Planas et al., 2021; Hernández-Urcera et al., 2021), three subtidal sites (A, B, and C; 2–15 m depth) (Figure 1) located on the east coast of Cíes Archipelago were surveyed (two visual censuses per site and season) in spring, summer, and autumn in 2017 and 2018. The sites were positioned near the coastline on rocky bottoms frequently interrupted by sandy patches. The surveys monitored the occurrence of the greater pipefish S. acus. Sighted specimens were captured for further sampling and the depth and location of the fish collection were annotated. Specific details on sampling methodology are provided by Planas (2022).
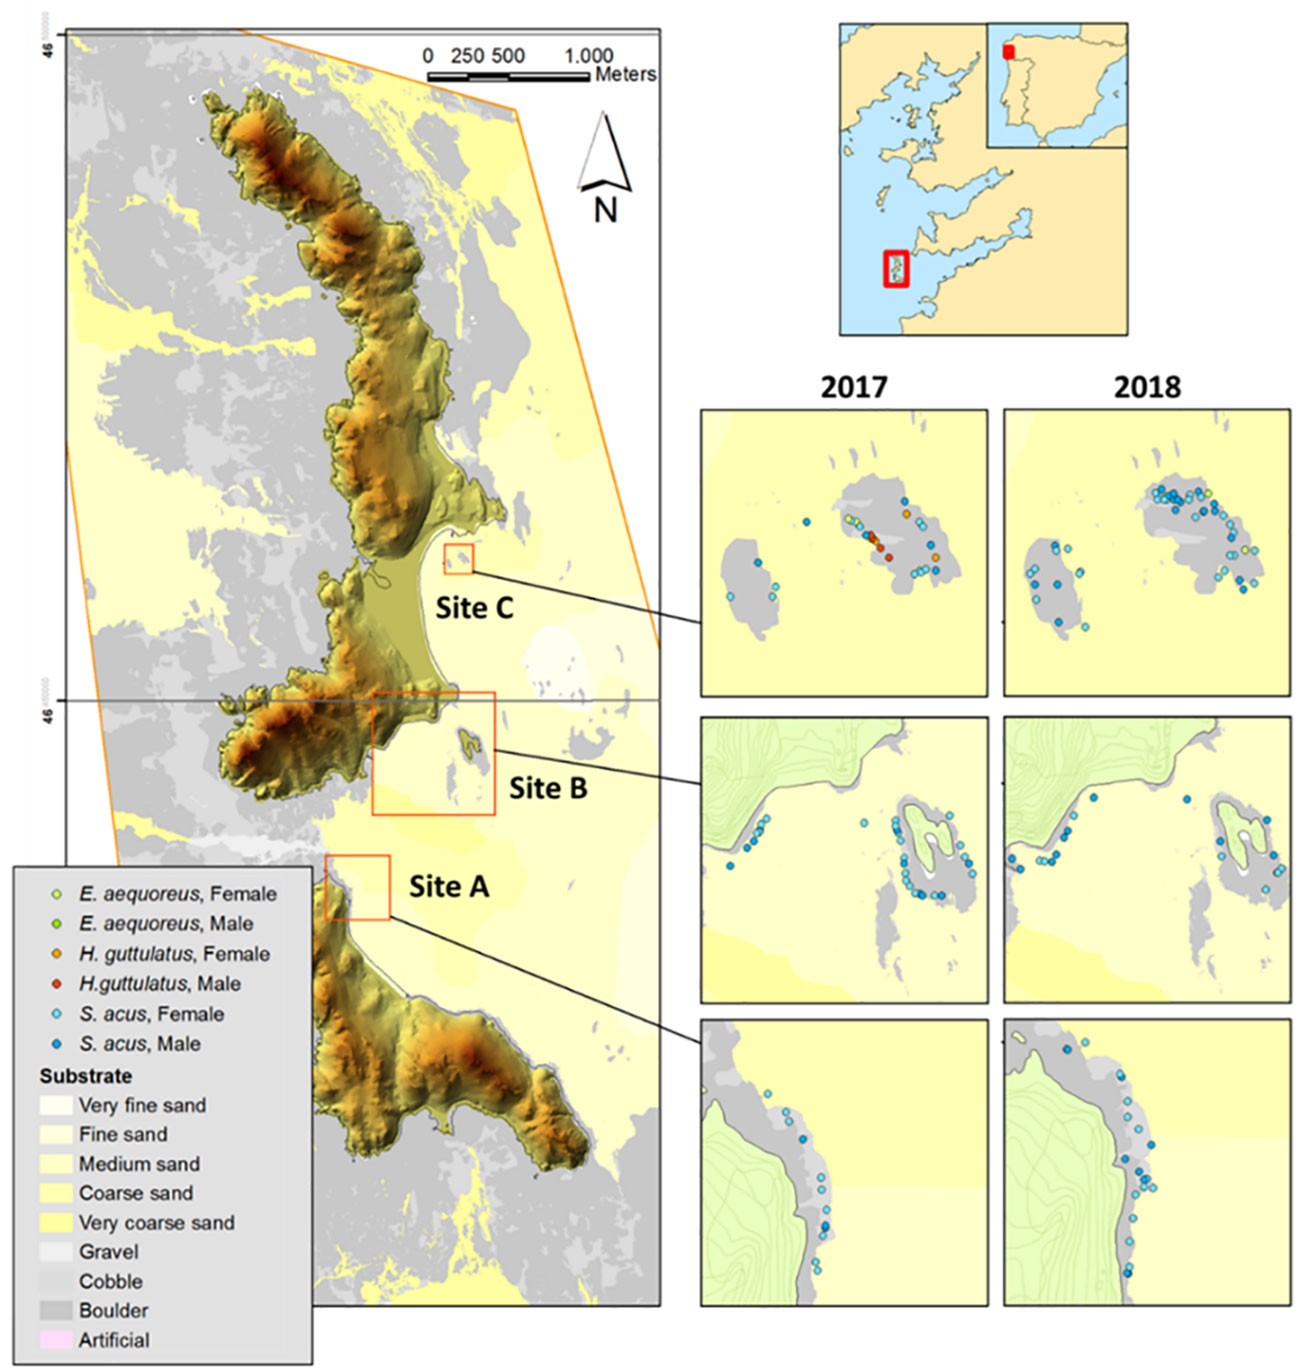
Figure 1 Sites (A), (B), and (C) surveyed for Syngnathus acus monitoring in Cíes Archipelago (Galicia, NW Iberian Peninsula) in spring, summer, and autumn (2017–2018). Substrate characteristics and syngnathids captured (S. acus, Entelurus aequoreus, and Hippocampus guttulatus) are shown.
Fish collection and sampling
Syngnathus acus specimens (93 females and 55 males) were hand-caught, transferred to numbered plastic bags, and moved to a support boat. Subsequently, the fish were anaesthetized with a solution of Ethyl 3-aminobenzoate methane sulfonate (MS-222; 0.1 g L-1; Sigma-Aldrich Co., USA), morphologically identified, weighed (W, g), measured for standard length (SL, cm), and marked subcutaneously using visible implant fluorescent elastomers (VIFE; Northwest Marine Technology Inc., USA). A small portion of the posterior end of the dorsal fin was clipped (Valladares and Planas, 2012), transferred to screw-capped tubes containing 95% ethanol, and conserved at 4°C for stable isotope analysis (SIA). The sex of sampled fishes was determined using the trunk shape and pregnancy. The presence of previous marks (recapture events) was also annotated whenever possible. After sampling, all fishes were transferred and maintained in buckets containing fresh seawater until equilibrium was restored and normal fish activity and respiration were achieved. Fish were subsequently released at the capture site (usually 2-3 h after initial capture).
Samples of potential prey (epifauna and mysidaceans) for S. acus and the bivalve Musculus costulatus as source baseline were collected concomitantly with fish collections for further identification and stable isotope analysis (Piñeiro-Corbeira et al., 2021).
Stable isotopes analysis
For isotopic (δ13C, δ15N) and total C and N analyses, the samples were rinsed with distilled water, oven dried at 60°C for 24 h before being ground into a fine powder in a mortar and pestle, transferred to tin capsules, and weighted (± 1 μg). Ground and dried samples were analyzed at SAI (Servizos de Apoio á Investigación, University of A Coruña, Spain) by continuous-flow isotope ratio mass spectrometry using a FlashEA1112 elemental analyzer (Thermo Finnigan, Italy) coupled to a Delta Plus mass spectrometer (FinniganMat, Germany) through a Conflo II interface. Isotopic values are expressed as permil (‰) in delta notation relative to VPDB (Vienna Pee Dee Belemnite) and atmospheric air. As part of an analytical batch run, a set of international reference materials for δ15N values (IAEA-N-1, IAEA-N-2, and USGS25) and δ13C values (NBS 22, IAEA-CH-6, and USGS24) were analyzed. The precision (standard deviation) of the analysis of the laboratory standard (acetanilide) for δ13C and δ15N was ± 0.15‰. The isotopic analysis procedure fulfils the requirements of the ISO 9001 standard.
Due to the low lipid content in fin samples of fishes (< 5% lipids, C:N < 3.56) (Post, 2002; Post et al., 2007), normalization for lipid correction was not necessary (Valladares and Planas, 2012) Since C:N values in several epifaunal groups revealed a lipid content higher than 5%, specific conversion factors constructed for lipid normalization were applied (conversion factors provided by Piñeiro-Corbeira et al., 2021). Additionally, some epifaunal groups were acidified before SIA (Piñeiro-Corbeira et al., 2021) by adding dilute (10%) HCl drop-by-drop, until CO2 release was no longer observed (Jaschinski et al., 2008; Vafeiadou et al., 2013).
Data analyses
Data and statistical analyses were conducted in R v.3.6.1 (R Core Team, 2019). All means are reported with standard deviations. A P-value threshold of 0.05 was considered significant in all statistical analyses. The graphics were constructed using ggplot2 v3.3.0 (Wickham et al., 2020) and lattice v0.20–41 (Sarkar et al., 2020) packages.
The relative contributions of prey to the diet of S. acus were estimated considering the average isotopic values of potential prey in (a) the same season as consumer sampling (Unshifted) and (b) the previous season (a 3-month interval) of consumer sampling (Shifted). For consumers, two approaches were considered (Figure 2): (a) Global Assessment – including pipefish specimens collected for the entire monitoring period (summer and autumn in 2017 and spring, summer and autumn in 2018), and (b) Seasonal assessment – including specimens collected in summer (2017 and 2018) when the fish were growing. The annual assessment provided global information for a long period (2 years), so that the effect of dietary changes over a limited period (i.e., a season) might not be revealed in the analysis of the annual dataset. On the contrary, the seasonal assessment would reflect explicitly changes over a short period. In the present study, summer was selected for the seasonal analysis, as there were data available for summer-2017 and summer-2018 as well as spring-2017 and spring-2018, which were necessary for the shifted and unshifted approaches.
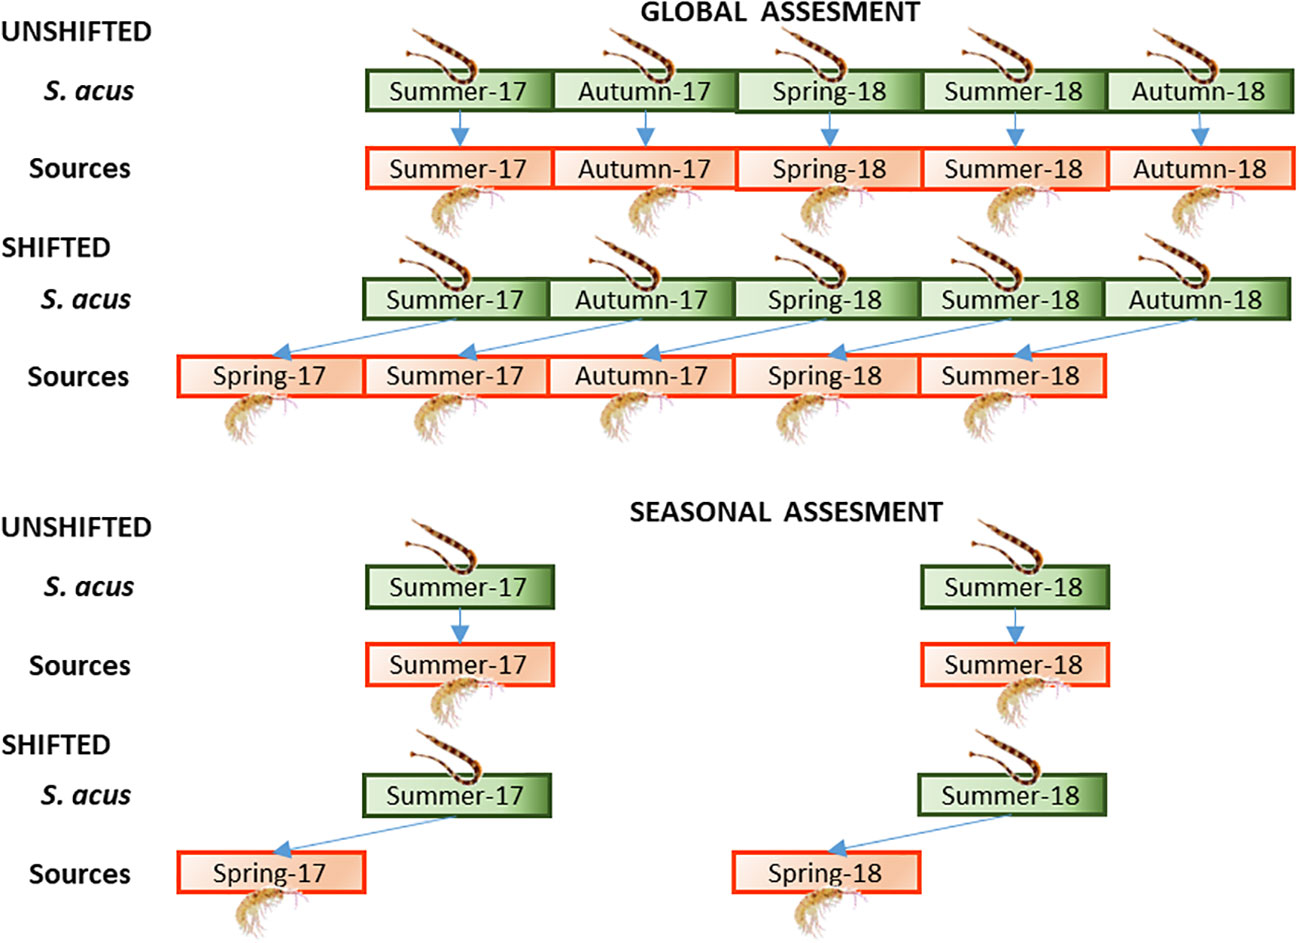
Figure 2 Approaches followed for the assessment of the dietary regime in S. acus. Global assessment – specimens collected for the entire monitoring period (summer and autumn in 2017 and spring, summer and autumn in 2018). Seasonal assessment – specimens collected in summer (2017 and 2018). Treatments: average isotopic values of potential sources sampled (A) concomitantly with consumers (Unshifted), or (B) in the previous season of consumer sampling (Shifted).
Aiming to enhance diet contribution estimates, the shifted approach applied source isotopic data from the previous season of consumer sampling (see Gristina et al., 2017). The choice of baselines is crucial in trophic position estimates using stable isotope data (Post, 2002; Hussey et al., 2014; Possamai et al., 2021). In the global assessment, seasonal δ13C and δ15N values in M. costulatus (Risso, 1826) were used as baselines for each sampling period, whereas δ13C and δ15N values in summer (unshifted approach) or spring (shifted approach) were used as the isotopic baseline.
Fish trophic position (TP) was estimated from the δ13C and δ15N values using tRophicPosition v. 0.7.7 (Quezada-Romegialli et al., 2018), an R package incorporating a Bayesian model for the calculation of consumer TP at the population level. Experimentally derived TDF (Trophic Discriminant Factors) values (2.5 for δ13C; 3.9 for δ15N) for syngnathids were applied (Planas et al., 2020a). δ13C and δ15N values in the bivalve Musculus costulatus (i.e., whole individuals due to their small size, ca. 1-2 mm) were used as trophic baselines (TP = 2) in calculations to estimate TP (Planas et al., 2020a; Piñeiro-Corbeira et al., 2021). In the global assessment, all the M. costulatus were used, but only the bivalves from the season in question were used in the seasonal comparison.
Isotopic niche areas and pairwise niche overlap in S. acus were assessed using a δ13C and δ15N bi-plot as multidimensional niche indicator data. The isotopic niche region was defined as the joint probability density function of the multidimensional niche indicators, at a probability alpha of 95%. The package NicheRover v.1.1.0 was used to assess differences in trophic niche features and to estimate trophic overlaps (Lysy et al., 2014). The method is insensitive to sample size and incorporates statistical uncertainty using Bayesian methods (Swanson et al., 2015).
From the isotopic values in selected potential prey (amphipods, harpacticoid copepods, carideans, isopods, and mysidaceans) (see Planas et al., 2020a for isotopic data) and in the consumer S. acus, the dietary regimes were estimated using Bayesian Mixing Models (SIMM) (Stock and Semmens, 2016), using the MixSIAR package v.3.1.12 (Stock et al., 2018). The SIMM procedure is fully described in Planas et al. (2020a). Briefly, SIMM polygons were constructed with isotopic signatures adjusted for experimentally derived TDFs (2.5‰ for δ13C; 3.9‰ for δ15N) (Planas et al., 2020a) to determine the proportion of consumers that were included inside the mixing polygon bound by all potential sources. Five pipefish specimens with a low probability (< 5%) of being positioned inside the mixing polygon were not included in the subsequent Bayesian models (Smith et al., 2013). The models were run with Markov chain Monte Carlo (MCMC) parameters of three chains of 300,000 iterations, and a burn-in phase of 200,000 (long run). The model included individuals as a random effect, and one error term (process error). Convergence and diagnostic statistics were evaluated using both Gelman–Rubin and Geweke tests. Bayesian model outputs are reported as median ± 95% confidence interval.
Inter-sexual comparisons for trophic position and dietary regimes were run based on previous findings that reported differences in isotopic signatures and niche areas occupied by males and females (Planas, 2022).
Results
Sample and isotopic data descriptors
The average size and weight values in S. acus specimens were 34.4 ± 7.0 cm SL (range: 16.4–49.8 cm) and 33.8 ± 20.4 g (range: 2.8–102.7 g), respectively. The size and weight were higher in males (36.1 ± 7.0 cm SL; 41.3 ± 22.7 g) than in females (33.3 ± 6.8 cm SL; 29.1 ± 17.3 g). Adult specimens larger than 30 cm SL accounted for 77% of the total captures.
Average isotopic values in S. acus specimens were -15.4 ± 0.5‰ for δ13C (-15.5 ± 0.4‰ in males and -15.3 ± 0.5‰ in females) and 11.1 ± 0.6‰ for δ15N (11.3 ± 0.5‰ in males and 10.9 ± 0.6‰ in females) (Table 1). Isotopic values were maximal in autumn for δ13C and in spring for δ15N.
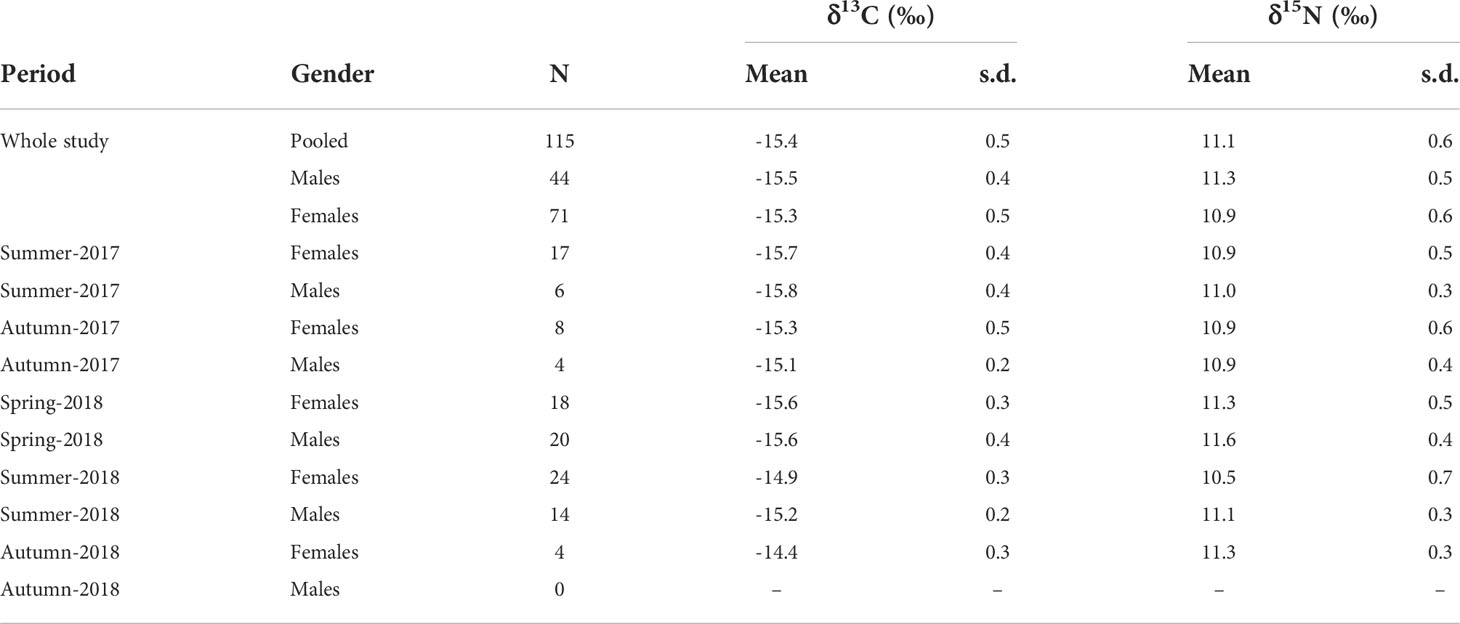
Table 1 Isotopic values (δ13C and δ15N; mean ± sd) in Syngnathus acus specimens collected in Cíes Archipelago from summer-2017 to autumn-2018.
Trophic niche and position
The estimated isotopic niche area was broader in females (5.04 ± 0.63) than in males (3.63 ± 0.55) (Figure 3). The isotopic niche overlap analysis revealed that the posterior probability (a = 0.95) that a female will be included within the niche of males is 80.7%. However, the isotopic trophic niche of males was markedly overlapped by that of females (93.7% overlap).
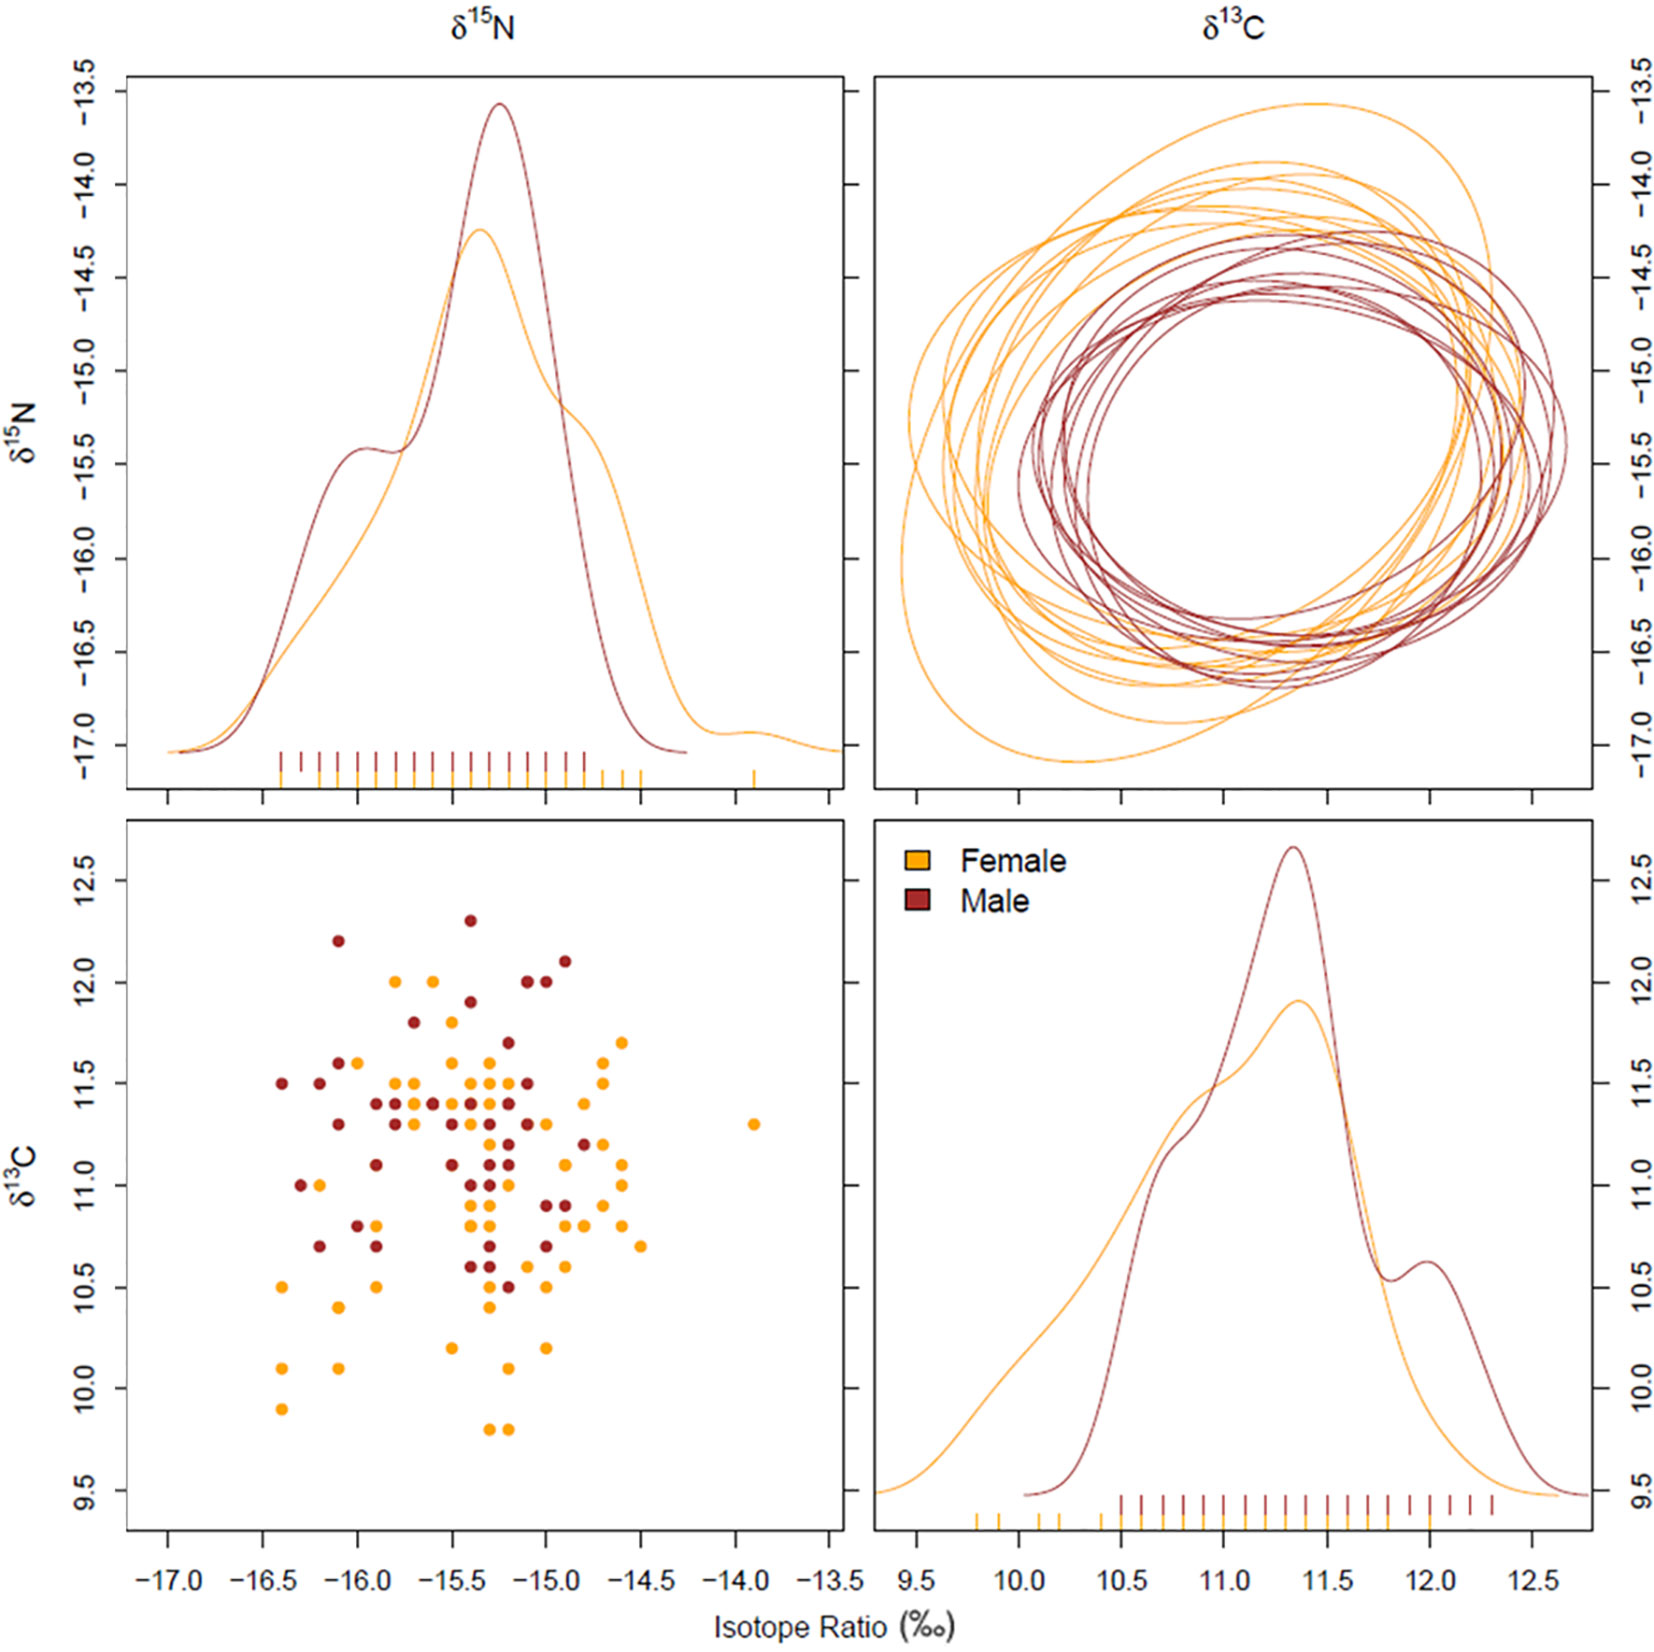
Figure 3 Global assessment – Niche plots (95% alpha) (A - δ15N; D - δ13C), density distributions (B), and raw data (C) for each pairwise combination of isotope (δ13C and δ15N) data for S. acus males and females.
The global baseline (M. costulatus) for the whole study was -17.7± 0.1‰ for δ13C and 5.3 ± 0.3‰ for δ15N. The unshifted approach including all analyzed pipefish revealed that the trophic level of S. acus specimens was 3.40 ± 0.06, being lower in females (3.36 ± 0.05) than in males (3.47 ± 0.06) (P<0.001) (Table 2). Those levels were almost identical to those attained with the shifting approach (< 0.6% change). However, in the seasonal approach, the trophic level in the shifted treatment was 6% higher than in unshifted sampling.

Table 2 Trophic position (mean ± sd) in Syngnathus acus specimens collected in 2017 and 2018 in Cíes Archipelago.
Diet reconstruction
The isotopic values, corrected for trophic discrimination, of individual consumers (2.5‰ for δ13C; 3.9‰ for δ15N), and the means and standard deviations of isotopic values of five candidate dietary sources (Amphipoda, Copepoda, Caridea, Isopoda and Mysidacea) are depicted in Figure 4. Only five out of 115 specimens were positioned outside the 95% confidence interval and they were not included in further analyses.
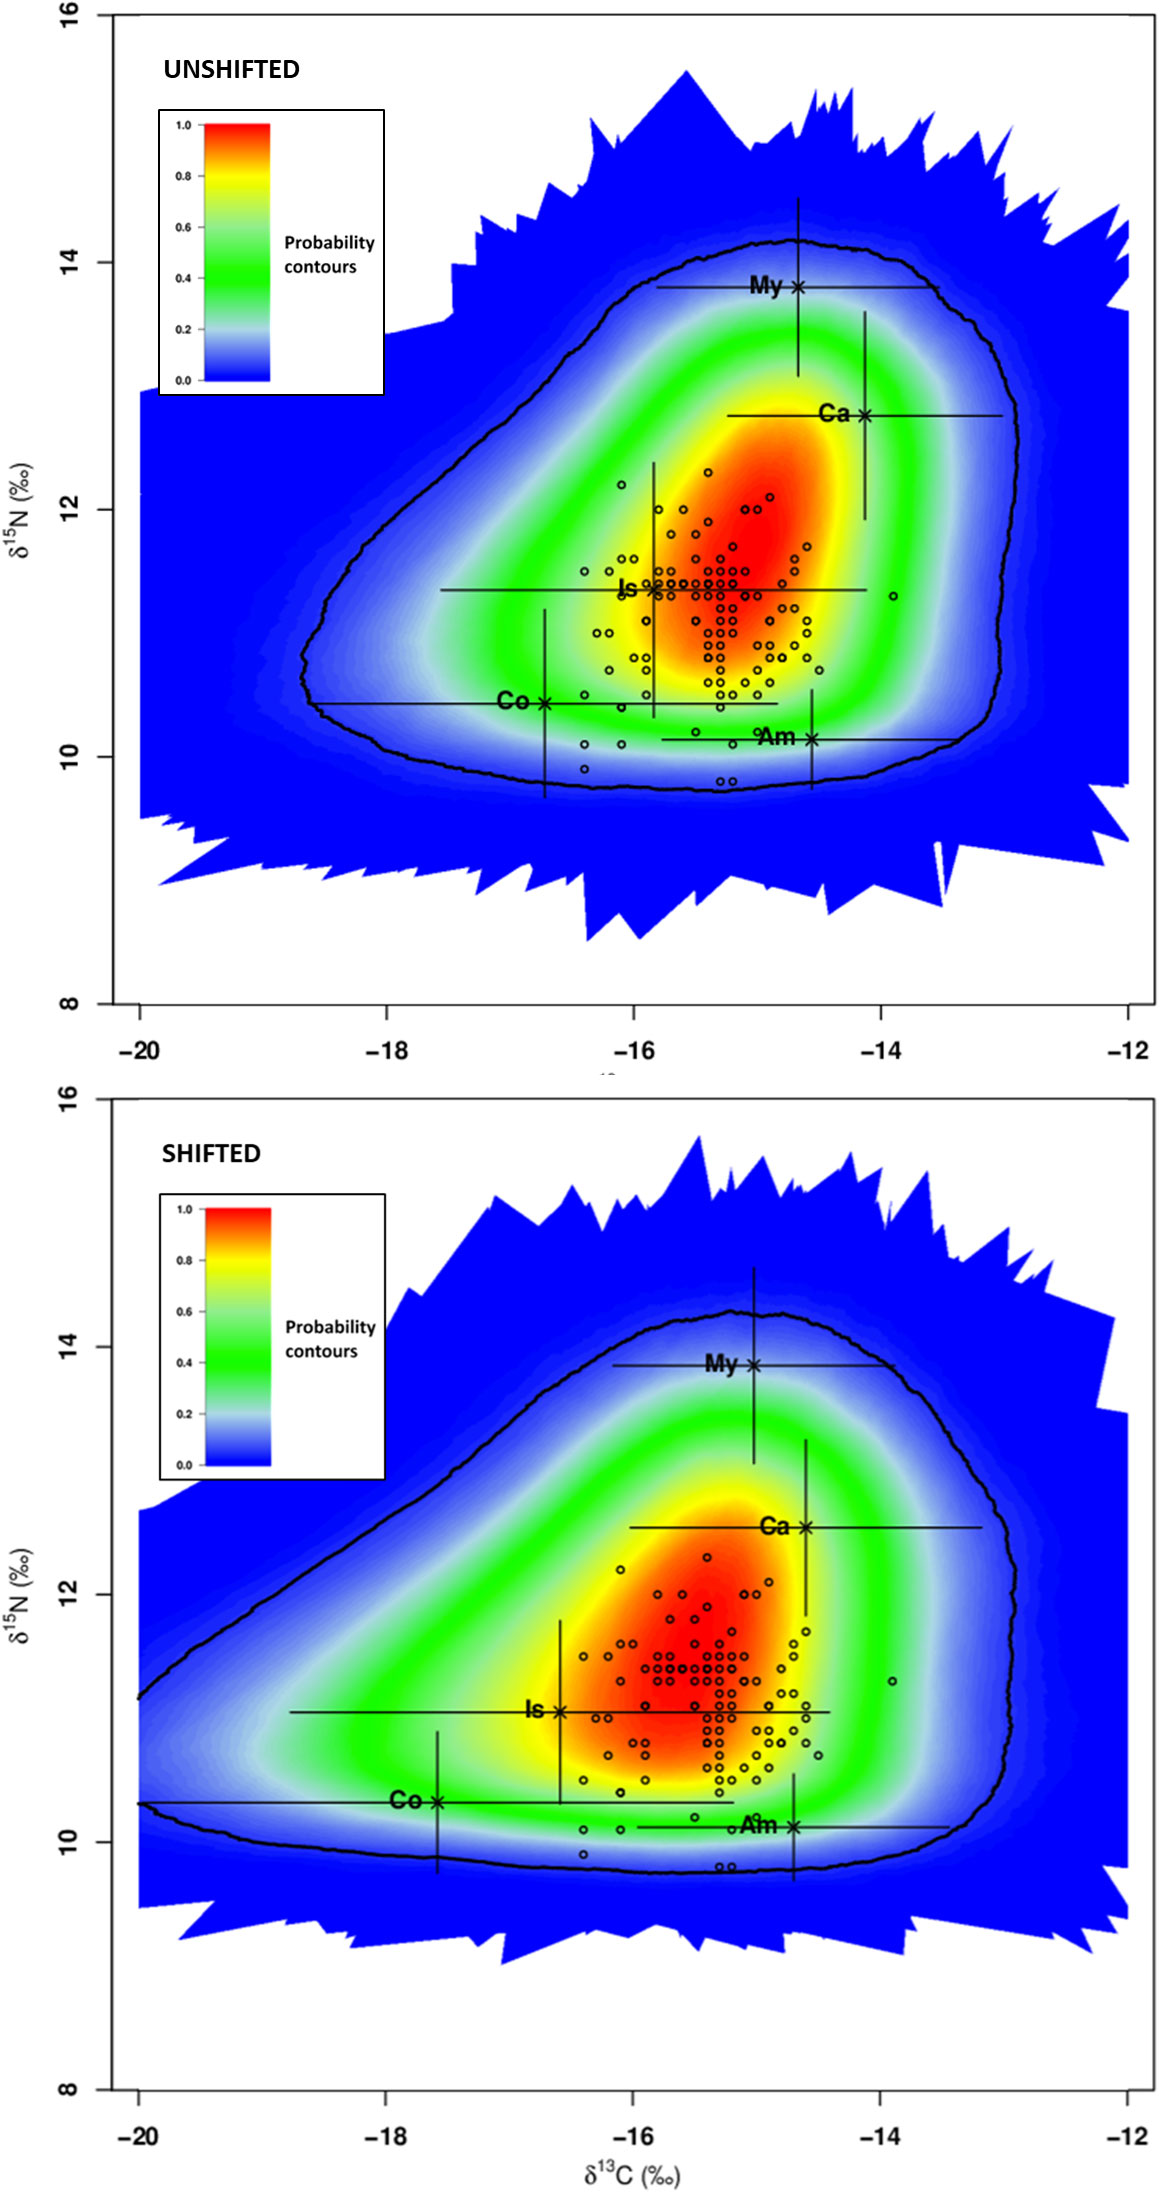
Figure 4 Global assessment - SIMM polygon for Syngnathus acus (n=110; 2017 and 2018 surveys) relative to average δ13C and δ15N signatures of five potential prey sources (mean ± sd; black crosses) adjusted for TDF values and consumers (S. acus; open circles; five outliers not included). Treatments: average isotopic values of potential prey sampled concomitantly with consumers (Unshifted) or in the previous season of consumer sampling (Shifted). The coloured region represents the 95% confidence interval. Probability contours are at the 5% level. Sources: Am - Amphipoda, Co - Copepoda, Ca - Caridea, Is – Isopoda, and My - Mysidacea.
The estimated relative contributions of dietary items from the unshifted treatment were higher for amphipods (30.9%) and copepods (24.8%), followed by carideans (14.3%) and isopods (16.9%). The contribution of mysidaceans was much lower (8.7%) (Figures 5, S1). The analysis carried out with shifted data revealed an overall increased contribution of amphipods (43.7%), isopods (19.5%) and mysidaceans (12.1%), and a reduction in the contribution percent for copepods (5.10%). Regarding temporal changes (from summer 2017 to autumn 2018), the estimated relative contributions of copepods to the mixture were consistently higher in unshifted data (20.5 ± 9.0 percentage points). The estimates for other taxa were highly variable across sampling periods (Figure S2). Amphipods and isopods were the most affected by shifting but did not show any trend.
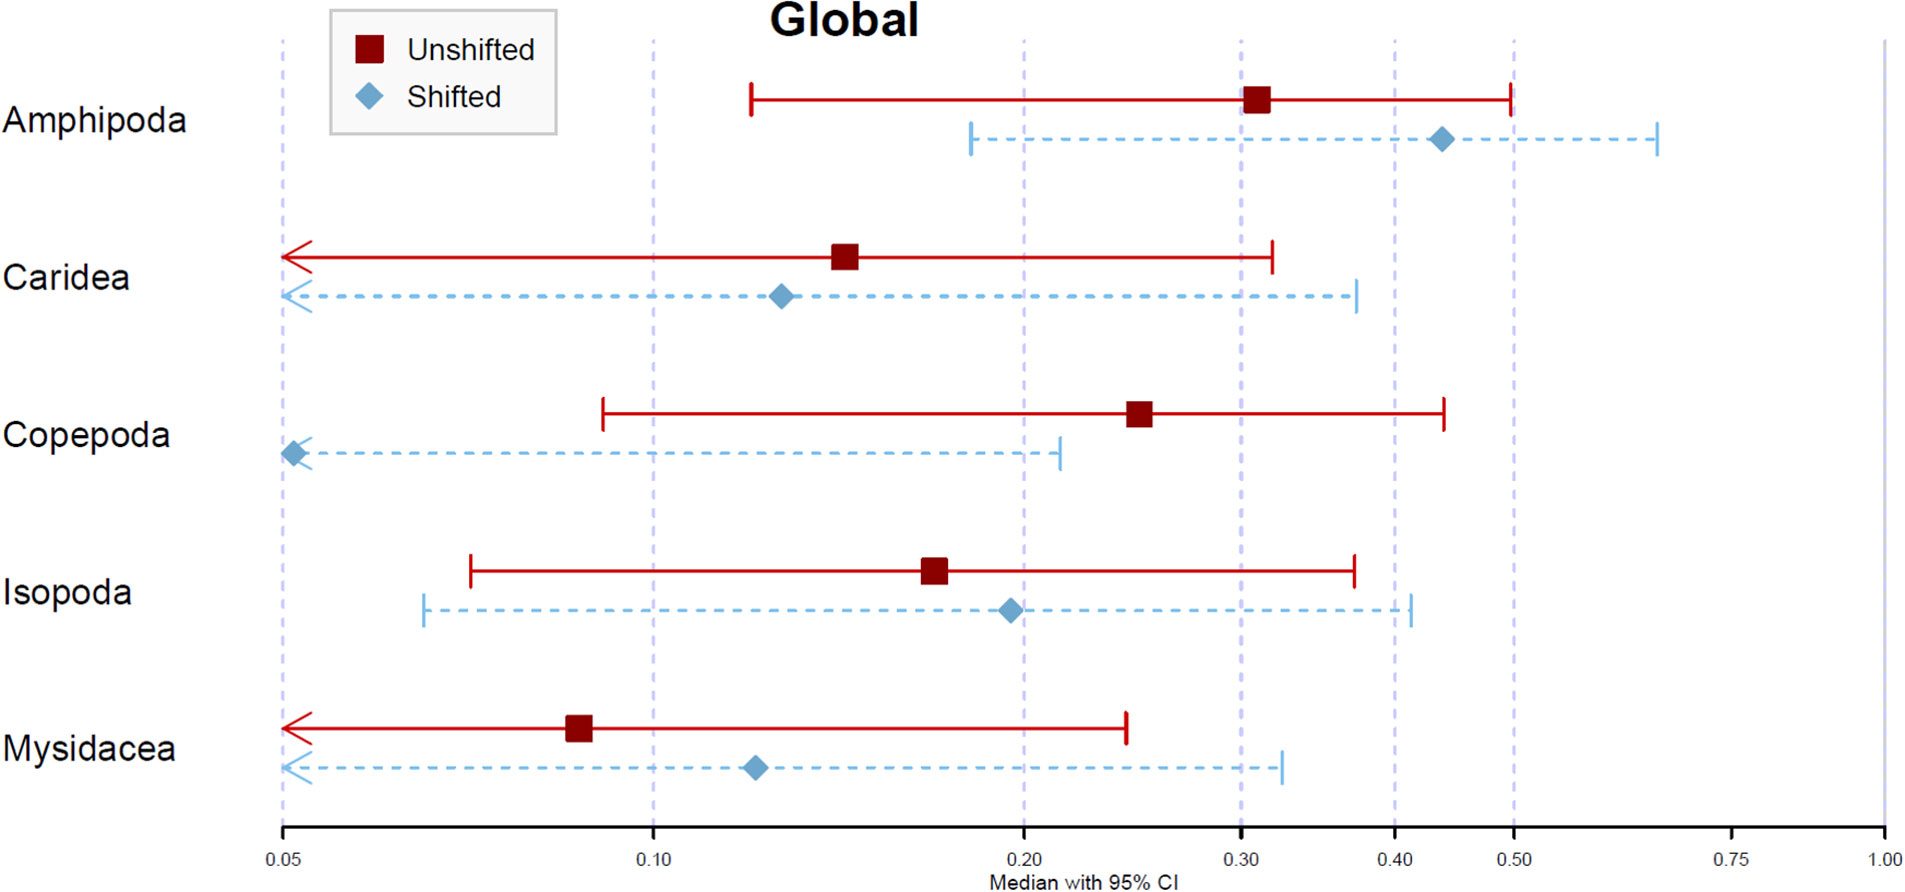
Figure 5 Global assessment – Average posterior proportional contribution for S. acus as estimated by Bayesian Stable Isotope Mixing Model (SIMM). Analyses based on isotopic (δ13C and δ15N) data for dorsal fin tissues of 110 fishes sampled in Cíes Archipelago in 2017 (summer and autumn) and 2018 (spring, summer and autumn). Treatments: average isotopic values of potential sources sampled concomitantly with consumers (Unshifted) or in the previous season of consumer sampling (Shifted). Symbols represent the median contribution of each key source with 95% (lines) credible intervals.
Regarding the seasonal assessment from summer-2017 and summer-2018 specimens, the comparison between unshifted and shifted treatments showed similar effects to those for the global assessment (Figures 6 and S3). The contribution of amphipods to the diet of S. acus was lower in unshifted data (39.0% in females and 23.5% in males) compared to shifted data (54.5% in females and 39.7% in males) in both females and males. Comparatively, copepods contribution was higher with unshifted data (28.1% in females and 34.2% in males) than with shifted data (7.6% in females and 10.7% in males). The assessment of both summer seasons (2017 and 2018) provided results highly similar to those attained with pooled data (Figures S3, S4) but the credible intervals and inter-sex differences for the most contributing source (amphipods) were reduced using shifted data.
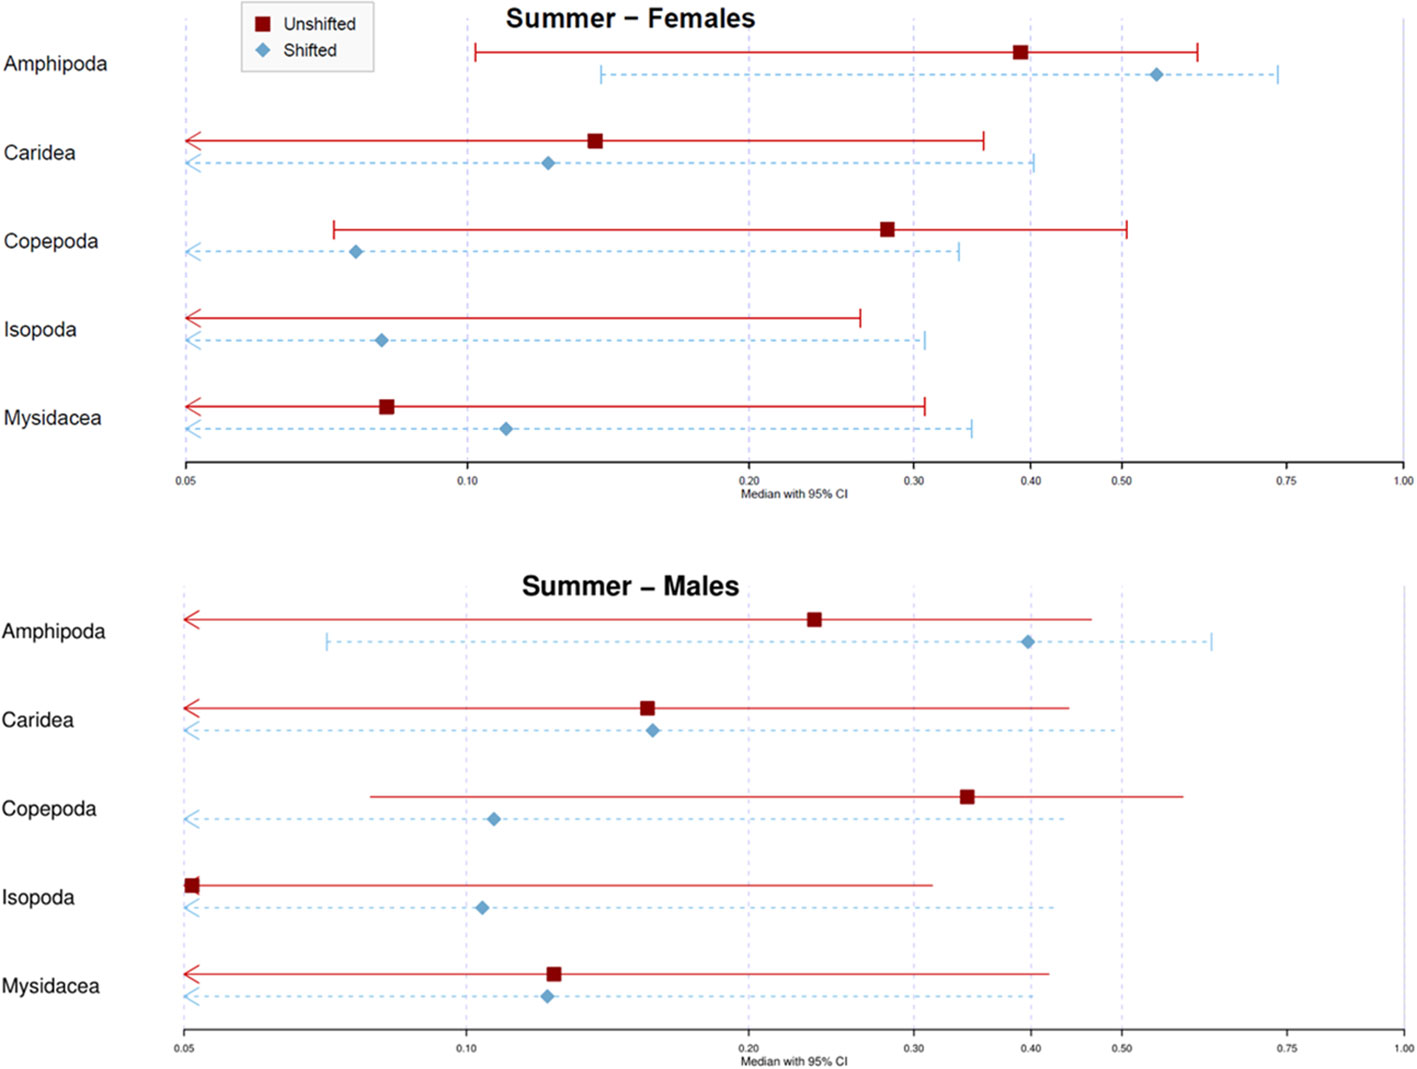
Figure 6 Seasonal assessment - Posterior proportional contribution for Syngnathus acus as estimated by Bayesian Stable Isotope Mixing Model (SIMM). Analyses based on isotopic (δ13C and δ15N) data for dorsal fin tissues of specimens sampled on Cíes Archipelago in summer 2017 and summer 2018 (Pooled samples). Treatments: average isotopic values of potential prey sampled concomitantly with consumers (Unshifted) or in the previous season of consumer sampling (Shifted). Symbols represent the median contribution of each key source with 95% (lines) credible intervals.
Discussion
This study investigated (a) the seasonal variability of potential dietary resources for S. acus in Cíes Archipelago (i.e., reflected in isotopic fluctuations both in resources and baseline organisms), and (b) the use of tissues with moderate turnover rates (i.e., dorsal fin as a proxy of muscle tissue). The results attained highly recommend the application of a time lag in the reconstruction of the diet in S. acus, especially when assessing trophic changes in the short- or mid-term (from weeks to months). The shifted approach revealed that the species mainly feed on a narrower range of taxa than previously reported.
This study pointed out significant differences for some trophic features in the pipefish Syngnathus acus depending on the time lag applied for the assessment of the resources contributing to their biomass. The use of time lags is extremely important but rarely evaluated or applied in trophic studies (Possamai et al., 2021; Ballutaud et al., 2022). The time lag applied in the present study was based on several assumptions (Planas et al., 2020a). Tissue turnover rates and isotopic equilibrium data after a diet shift in syngnathids are only available for the seahorse Hippocampus guttulatus (a species co-occurring with S. acus in Cíes Archipelago). Hence, that information was applied to S. acus in the present study. Previous unpublished isotopic data (S. Valladares et al.) in wild H. guttulatus maintained in captivity for nearly 2 yr at IIM-CSIC facilities showed that the isotopic equilibrium with a new diet was achieved in less than 5 months. Also, Thomas and Crowther (2015) pointed out that consumers are considered to have achieved an isotopic steady-state with a new diet after ca. 3.5 half-lives (about 4 months). Considering this information and the typical shape of the curve fitted to isotopic data following a diet shift (e.g., Hesslein et al., 1993), a time lag of 3 months (i.e., one season) seems to be realistic.
Seasonality determines changes in the structure of seaweed assemblages as well as in the epifauna that supports many species, including syngnathids (Seed et al., 1981; Winkler et al., 2017). In Cíes Archipelago, S. acus preferentially occupies rocky areas dominated by the fucal Gondolaria baccata and to a lesser extent by Codium spp. (Planas et al., 2021). These perennial seaweeds are ideal habitats for pipefishes and other syngnathids, recovering their biomass in spring-summer while recovering from autumn-winter adverse conditions (Piñeiro-Corbeira et al., 2021). The seasonal changes in macroalgae communities are accompanied by fluctuations in epifaunal assemblages. G. baccata provides complex branched secondary structures with high species richness and diversity, especially in summer compared to autumn and spring (Viejo, 1999). Hence, the diversity and abundances of potential dietary sources for S. acus fluctuate seasonally. Gammaridae, Corophidae, and Amphilochidae are amphipods that show high seasonal variability in Cíes, especially in summer and autumn (Piñeiro-Corbeira et al., 2021). Numerically, harpacticoids are the dominant epifauna associated with seaweeds in Cíes, but their relative abundances decrease markedly in autumn. However, the relative abundance of amphipods is notably high, especially in G. baccata. In terms of biomass and energy content and compared to copepods or other small-sized prey, foraging upon amphipods would be highly advantageous to large pipefish such as those from Cíes Archipelago. This statement is supported by the results attained in this study. Even though copepods might be numerically dominant in some periods in the guts of the Aegen Sea specimens (Taşkavak et al., 2010), their high contribution to the diet might rely on their small size (range: 7.3 – 23.2 cm SL) compared to S. acus from Cíes Archipelago (range: 16.4–49.8 cm SL; mean: 34.4 ± 7.0 cm SL). Unfortunately, young or small specimens were not present in Cíes Archipelago, impeding further comparisons with those from the Aegean Sea or to analyze ontogenic patterns in S. acus lifespan.
Syngnathus acus is a secondary consumer that forages primarily upon epifaunal organisms associated with seaweeds (Piñeiro-Corbeira et al., 2021). This is a common feature in many syngnathids (Manning et al., 2019), which is imposed by their tiny mouth at the tip of a long, but narrow snout (de Lussanet and Muller, 2007). In the global assessment, the unshifted and shifted approaches provided similar overall trophic positions for S. acus (3.40 and 3.41, respectively). In the seasonal approach, however, the analysis performed revealed differences in trophic position when using shifted data, revealing a slight but significant increase (6%) in the trophic position compared to unshifted data (3.38 ± 0.07 and 3.25 ± 0.08, respectively). Nevertheless, the isotopic space occupied by the fish was similar in both approaches.
Amphipods are the most preferred prey for many syngnathids (Manning et al., 2019). Previous assessments performed with data of dietary resources sampled concomitantly with consumers (unshifted approach in this study) reported a high contribution of amphipods and a substantial role of copepods in the dietary regime of S. acus (Planas et al., 2020a; Planas, 2022). The increased predation upon amphipods also seems to be common in other areas (e.g., Aegean Sea), as inferred from gut content analysis (Gürkan and Taşkavak, 2019; Gürkan et al., 2021).
The application of isotopic time lags can enhance the estimation of baseline δ15N values and subsequent estimates of consumer trophic position (Possamai et al., 2021). In the present study, a marked effect of time lag was evident in the reconstruction of the dietary regime in S. acus. Hence, the use of time lags in the incorporation of stable isotopes between sources and consumers should provide more accurate modelling results, especially when comparing tissues with medium or slow turnover rates that have been sampled over time.
Globally (annual assessment), the relative contributions of copepods and, to a lesser extent, amphipods to the biomass of S. acus were particularly affected by the application of a time lag. With the unshifted approach, amphipods and copepods were under- and markedly higher overestimated, respectively (29% and 386%, respectively) compared to the shifted approach. The relative contributions of mysidaceans and isopods were also underestimated (28% and 13%, respectively) by the unshifted approach. These differential results seemed to rely largely on seasonal changes in δ13C values, which were more fluctuating than δ15N (Figure 7). In most taxa, δ13C signatures were lower in spring compared to autumn. However, that trend was not followed by the baseline organism M. costulatus, which showed relatively large annual and seasonal variability. The results highlight the importance of characterizing baseline δ13C accurately, whenever possible. The effect of the time lag on amphipods and copepods was also noticed in the seasonal approach, especially for copepods (270% underestimation in the unshifted approach). Hence, stable isotope data suggest that S. acus specimens at the time of capture had likely foraged upon a lower proportion of copepods than that resulting from the unshifted approach. This discrepancy has been highlighted in studies comparing gut content analyses and isotopic data (Hadwen et al., 2007).
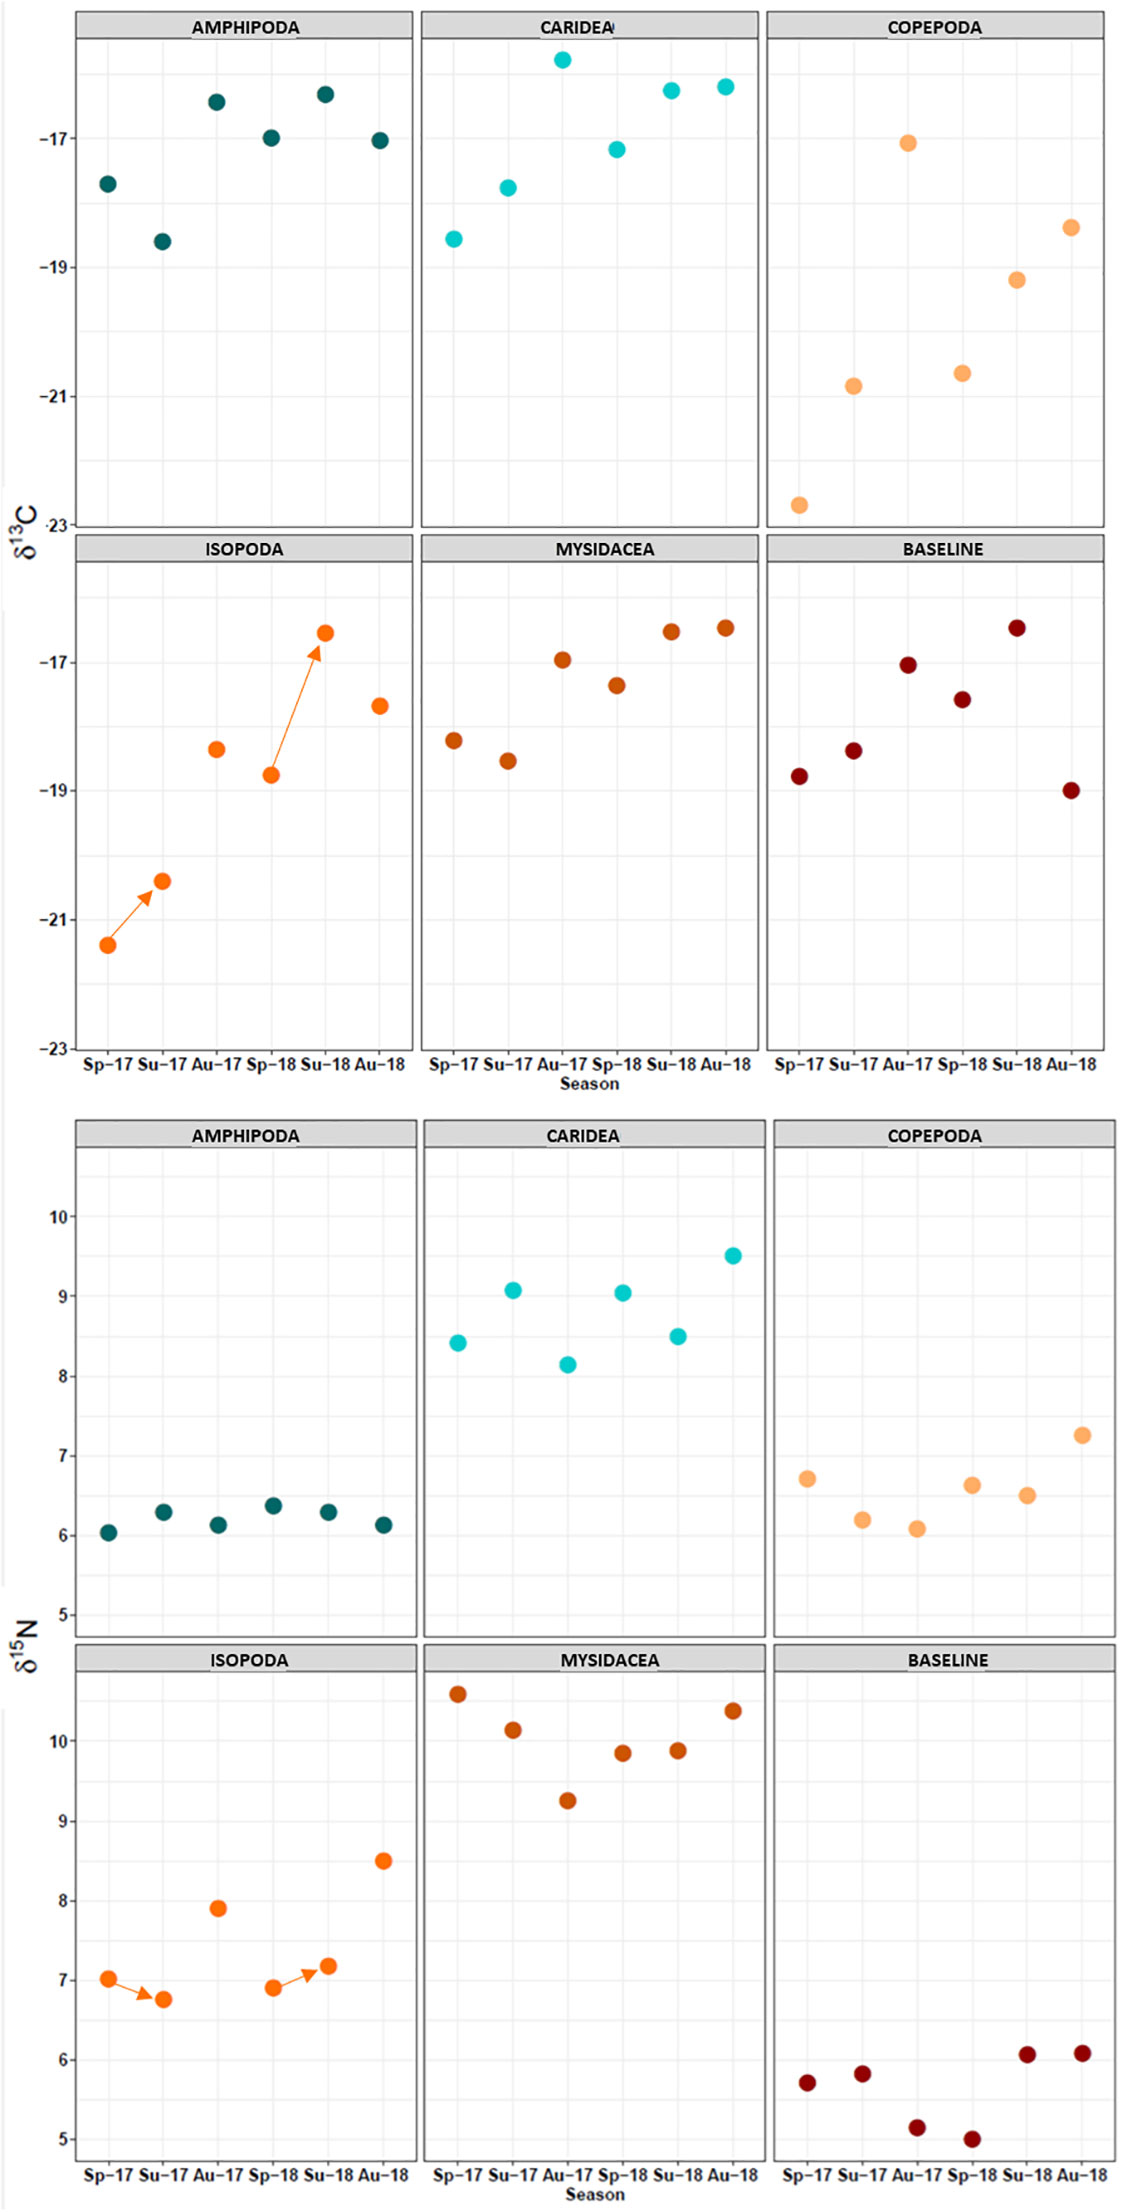
Figure 7 Seasonal changes in δ13C and δ15N values for dietary resources. Arrows: Change from spring to summer values for isopods.
Regarding the potential sources of organic matter for both sexes, the effect of seasonal shifting on dietary reconstruction seemed to affect males and females in a similar manner. This finding was expected considering that S. acus population in Cíes was mostly represented by mature specimens and that trophic differences between sexes were mainly due to the presence of nonovigerous females rather than of mature specimens (Planas, 2022). In contrast to immature females, the high dietary similarity between males (mature and immature) and mature females would reveal long residence periods in the same habitat while feeding on similar resources.
Conclusion
This isotopic study has implications regarding the importance of sources of organic matter to tissues of the pipefish S. acus. The study highlights for the first time the importance of applying time lags to both isotopic baseline and sources in the diet reconstruction of syngnathids, particularly in S. acus. While it is important to consider that the choice of what animal tissue to analyze may influence inferences of organic matter sources, selecting the appropriate time lag will enhance estimates accuracy. To evaluate diet from tissues with medium-time turnover rates and to detect any seasonal shifts in food habits, it is highly recommended whenever possible that those factors be explicitly evaluated considering the target organism. The experimental approach used in this study (i.e., fin tissue as a proxy; time lag: 2-3 months) could be applied to similar studies in other temperate syngnathid species when specific data are unknown.
Data availability statement
The datasets presented in this study can be found in online repositories. The names of the repository/repositories and accession number(s) can be found below: Planas, M. (2022), “Data: Ecological traits and trophic plasticity in the greater pipefish Syngnathus acus in NW Iberian Peninsula”, Mendeley Data, V1, doi: 10.17632/kf3tn3d9j8.1).
Ethics statement
Fish capture, handling, and sampling were conducted in compliance with all bioethics standards on animal experimentation of the Spanish Government (R.D. 1201/2005, 10th October) and the Regional Government Xunta de Galicia (Reference REGA ES360570202001/16/FUN/BIOL.AN/MPO02).
Author contributions
MP: Funding acquisition, Project administration, conceptualization, methodology, stable isotopes, data curation, formal analysis, visualization, writing- original draft preparation, writing - review and editing.
Funding
This study was financially supported by Proyecto Hippoparques (1541S/2015; Organismo Autónomo de Parques Nacionales de España, Ministerio para la Transición Ecológica, Spain). Support of the publication fee by the CSIC Open Access Publication Support Initiative through its Unit of Information Resources for Research (URICI) is also acknowledged.
Acknowledgments
The author acknowledges David Soto and the reviewers for the manuscript review, and A. Chamorro, M.E. Garci, I. Bárbara, V. Peña, P. Díaz-Tapia, R. Chamorro, J. Hernández-Urcera, I. Ferreiro, D. Costas, J. Cremades, K. Nedelec, the staff and keepers of Parque Nacional de las Islas Atlánticas, and the Regional Government Xunta de Galicia for their support in the project. The author also acknowledges the support of the publication fee by the CSIC Open Access Publication Support Initiative through its Unit of Information Resources for Research (URICI).
Conflict of interest
The author declares that the research was conducted in the absence of any commercial or financial relationships that could be construed as a potential conflict of interest.
Publisher’s note
All claims expressed in this article are solely those of the authors and do not necessarily represent those of their affiliated organizations, or those of the publisher, the editors and the reviewers. Any product that may be evaluated in this article, or claim that may be made by its manufacturer, is not guaranteed or endorsed by the publisher.
Supplementary material
The Supplementary Material for this article can be found online at: https://www.frontiersin.org/articles/10.3389/fmars.2022.982883/full#supplementary-material
References
Baker R., Buckland A., Sheaves M. (2013). Fish gut content analysis: robust measures of diet composition. Fish. Fish. 15, 170–177. doi: 10.1111/faf.12026
Ballutaud M., Travers-Trolet M., Marchal P., Dubois S. F., Giraldo C., Parnell A. C., et al. (2022). Inferences to estimate consumer’s diet using stable isotopes: Insights from a dynamic mixing model. PloS One 17 (2), e0263454. doi: 10.1371/journal.pone.0263454
Barnett A., Redd K. S., Frusher S. D., Stevens J. D., Semmens J. M. (2010). Non-lethal method to obtain stomach samples from a large marine predator and the use of DNA analysis to improve dietary information. J. Exp. Mar. Biol. Ecol. 393, 188–192. doi: 10.1016/j.jembe.2010.07.022
Boecklen W. J., Yarnes C. T., Cook B. A., James A. C. (2011). On the use of stable isotopes in trophic ecology. Annu. Rev. Ecol. Evol. Syst. 42, 411–440. doi: 10.1146/annurev-ecolsys-102209-144726
Busst G., Basic T., Britton J. R. (2015). Stable isotope signatures and trophic-step fractionation factors of fish tissues collected as non-lethal surrogates of dorsal muscle. Rapid Commun. Mass Spectrom. 29, 1535–1544. doi: 10.1002/rcm.7247
Caut S., Angulo E., Courchamp F. (2009). Variation in discrimination factors (Delta n-15 and delta c-13): the effect of diet isotopic values and applications for diet reconstruction. J. Appl. Ecol. 46, 443–453. doi: 10.1111/j.1365-2664.2009.01620.x
Dalerum F., Angerbjörn A. (2005). Resolving temporal variation in vertebrate diets using naturally occurring stable isotopes. Oecologia 144, 647–658. doi: 10.1007/s00442-005-0118-0
Davis M., Pineda-Munoz S. (2016). The temporal scale of diet and dietary proxies. Ecol. Evol. 6, 1883–1897. doi: 10.1002/ece3.2054
de Lussanet M. H. C., Muller M. (2007). The smaller your mouth, the longer your snout: Predicting the snout length of Syngnathus acus, Centriscus scutatus and other pipette feeders. J. R. Soc Interface 4, 561–573. doi: 10.1098/rsif.2006.0201
DeNiro M. J., Epstein S. (1981). Influence of diet on the distribution of nitrogen isotopes in animals. Geochim. Cosmochim. Acta 45, 341–351. doi: 10.1016/0016-7037(81)90244-1
Fernández E., Barañano C., Alejo I., Barreiro R., Bellas J., Besada V., et al. (2020). Islas cíes: Un ecosistema en la frontera (Vigo: Concello de Vigo).
Gristina M., Bertrandino S., Cardone F., Mentino D., Corriero G., Scillitani G. (2017). Skin filament recovery after clipping in Hippocampus guttulatus: behavioural and histological aspects. Aquat. Biol. 26, 149–157. doi: 10.3354/ab00680
Guelinckx J., Maes J., Van Den Driessche P., Geysen B., Dehairs F., Ollevier F. (2007). Changes in d13C and d15N in different tissues of juvenile sand goby Pomatoschistus minutus: a laboratory diet-switch experiment. Mar. Ecol. Pro. Ser. 341, 205–215. doi: 10.3354/meps341205
Gürkan Ş., Innal D., Gulle I. (2021). Monitoring of the trophic ecology of pipefish species (Syngnathus abaster, Syngnathus acus) in an alluvial lake habitat (Lake bafa, Turkey). Oceanol. Hydrobiol. Stud. 50, 24–32. doi: 10.2478/oandhs-2021-0003
Gürkan Ş., Taşkavak E. (2019). The relationships between gut length and prey preference of three pipefish (Syngnathus acus, Syngnathus typhle, Nerophis ophidion linnaeus 1758) species distributed in Aegean Sea, Turkey. Iran. J. Fish. Sci. 18, 1093–1100. doi: 10.22092/ijfs.2019.118277
Hadwen W. L., Russell G. L., Arthington A. H. (2007). Gut content- and stable isotope-derived diets of four commercially and recreationally important fish species in two intermittently open estuaries. Mar. Fresh. Res. 58, 363–375. doi: 10.1071/MF06157
Hernández-Urcera J., Murillo F. J., Regueira M., Cabanellas-Reboredo M., Planas M. (2021). Preferential habitats prediction in syngnathids using species distribution models. Mar. Environ. Res. 172, 105488. doi: 10.1016/j.marenvres.2021.105488
Hesslein R. H., Hallard K. A., Ramal P. (1993). Replacement of sulfur, carbon,and nitrogen in tissue of growing broad whitefish (Coregonus nasus) inresponse to a change in diet traced by δ34S, δ13C, and δ15N. Can. J. Fish. Aquat. Sci. 50, 2071–2076. doi: 10.1139/f93-230
Hobson K. A., Clark R. G. (1992). Assessing avian diets using stable isotopes I: turnover of 13C in tissues. Condor 94, 181–188. doi: 10.2307/1368807
Hussey N. E., Macneil M. A., McMeans B. C., Olin J. A., Dudley S. F., Cliff G., et al. (2014). Rescaling the trophic structure of marine food webs. Ecol. Lett. 17 (2), 239–250. doi: 10.1111/ele.12226
Hynes H. B. N. (1950). The food of fresh-water sticklebacks (Gasterosteus aculeatus and Pygosteus pungitius), with a review of methods used in studies of the food of fishes. J. Anim. Ecol. 19, 36–58. doi: 10.2307/1570
Hyslop E. J. (1980). Stomach contents analysis: a review of methods and their application. J. Fish. Biol. 17, 411–429. doi: 10.1111/j.1095-8649.1980.tb02775.x
Iverson S. J., Field C., Don Bowen W., Blanchard W. (2004). Quantitative fatty acid signature analysis: a new method of estimating predator diets. Ecol. Monogr. 74, 211–235. doi: 10.1890/02-4105
Jardine T. D., Hobson K. A., Soto D. X. (2017). “Introduction to stable isotopes in food webs,” in Food forensics: Stable isotopes as a guide to authenticity and origin. Eds. Carter J. F., Chesson L. A. (Boca Ratón: CRC Press).
Jaschinski S., Hansen T., Sommer U. (2008). Effects of acidification in multiple stable isotope analyses. Limnol. Oceanogr. Methods 6, 12–15. doi: 10.4319/lom.2008.6.12
Jobling M. (1987). Marine mammal faeces samples as indicators of prey importance - a source of error in bioenergetics studies. Sarsia 72, 255–260. doi: 10.1080/00364827.1987.10419722
Kodama T., Hirai J., Tawa A., Ishihara T., Ohshimo S. (2020). Feeding habits of the pacific bluefin tuna (Thunnus orientalis) larvae in two nursery grounds based on morphological and metagenomic analyses. Deep Sea Res. Pt. II 175, 104745. doi: 10.1016/j.dsr2.2020.104745
Lysy M., Stasko A. D., Swanson H. K. (2014). “nicheROVER: (Niche) (R)egion and Niche(Over)lap metrics for multidimensional ecological niches,” in R package version 1.1.0. Available at: https://CRAN.R-project.org/package=nicheROVER.
Madigan D. J., Litvin S. Y., Popp B. N., Carlisle A. B., Farwell C. J., Block B. A. (2012). Tissue turnover rates and isotopic trophic discrimination factors in the endothermic teleost, pacific bluefin tuna (Thunnus orientalis). PloS One 7, e49220. doi: 10.1371/journal.pone.0049220
Manning C. G., Foster S. J., Vincent A. C. J. (2019). A review of the diets and feeding behaviours of a family of biologically diverse marine fishes (Family syngnathidae). Rev. Fish. Biol. Fish. 29, 197–221. doi: 10.1007/s11160-019-09549-z
Martinez del Rio C., Wolf N., Carleton S. A., Gannes L. Z. (2009). Isotopic ecology ten years after a call for more laboratory experiments. Biol. Rev. 8491–111. doi: 10.1111/j.1469-185X.2008.00064.x
McMahon K. W., Fogel M. L., Johnson B. J., Houghton L. A., Thorrold S. R. (2011). A new method to reconstruct fish diet and movement patterns from δ13C values in otolith amino acids. Can. J. Fish. Aquat. Sci. 68, 1330–1340. doi: 10.1139/f2011-070
Phillips D. L., Inger R., Bearhop S., Jackson A. L., Moore J. W., Parnell A. C., et al. (2014). Best practices for use of stable isotope mixing models in food web studies. Can. J. Zool. 835, 823–835. doi: 10.1139/cjz-2014-0127
Piñeiro-Corbeira C., Iglesias L., Nogueira R., Campos S., Jiménez A., Regueira M., et al. (2021). Structure and trophic niches in mobile epifauna assemblages associated with seaweeds and habitats of syngnathid fishes in cíes archipelago (Atlantic islands marine national park, NW Iberia). Front. Mar. Sci. 8. doi: 10.3389/fmars.2021.773367
Planas M. (2022). Ecological traits and trophic plasticity in the greater pipefish Syngnathus acus in the NW Iberian peninsula. Biology 11, 712. doi: 10.3390/biology11050712
Planas M., Chamorro A., Paltrinieri A., Campos S., Nedelec K., Hernández−Urcera J. (2020a). Effect of diet on breeders and inheritance in syngnathids: Application of isotopic experimentally derived data to field studies. Mar. Ecol. Prog. Ser. 650, 107–123. doi: 10.3354/meps13315
Planas M., Olivotto I., González M. J., Laurà R., Zarantoniello M. (2020b). A multidisciplinary experimental study of the effects of breeders diet on newborn seahorses (Hippocampus guttulatus). Front. Mar. Sci. 7. doi: 10.3389/fmars.2020.00638
Planas M., Piñeiro-Corbeira C., Bouza C., Castejón-Silvo I., Vera M., Regueira M., et al. (2021). A multidisciplinary approach to identify priority areas for the monitoring of a vulnerable family of fishes in Spanish marine national parks. BMC Ecol. Evol. 21, 4. doi: 10.1186/s12862-020-01743-z
Possamai B., Hoeinghaus D. J., Garcia A. M. (2021). Shifting baselines: Integrating ecological and isotopic time lags improves trophic position estimates in aquatic consumers. Mar. Ecol. Prog. Ser. 666, 19–30. doi: 10.3354/meps13682
Post D. M. (2002). Using stable isotopes to estimate trophic position: models, methods, and assumptions. Ecology 83, 703–718. doi: 10.2307/3071875
Post D. M., Layman C. A., Arrington G., Takimoto J., Quatrocchi J., Montaña C. G. (2007). Getting to the fat of the matter: models, methods and assumptions for dealing with lipids in stable isotope analyses. Oecologia 152, 179–189. doi: 10.1007/s00442-006-0630-x
Quezada-Romegialli C., Jackson A. L., Hayden B., Kahilainen K. K., Lopes C., Harrod C. (2018). tRophicPosition, an r package for the Bayesian estimation of trophic position from consumer stable isotope ratios. Methods Ecol. Evol. 9, 1592–1599. doi: 10.1111/2041-210X.13009
R Core Team (2019). R: A language and environment for statistical computing (Vienna, Austria: R Foundation for Statistical Computing). Available at: https://www.R-project.org.
Sanderson B. L., Tran C. D., Coe H. J., Pelekis V., Steel E. A., Reichert W. L. (2009). Nonlethal sampling of fish caudal fins yields valuable stable isotope data for threatened and endangered fishes. Trans. Am. Fish. Soc 138, 1166–1177. doi: 10.1577/T08-086.1
Sarkar D., Andrews F., Wright K., Klepeis N., Murrell P. (2020) Lattice: Trellis graphics for r. Available at: https://cran.r-project.org/web/packages/lattice/index.html.
Seed R., Elliott M. N., Boaden P. J. S., O'Connor R. J. (1981). The composition and seasonal changes amongst the epifaunal associted with Fucus serratus l. @ in strangford lough, northern Ireland. Cah. Biol. Mar. 22, 243–266.
Smith J. A., Mazumder D., Suthers I. M., Taylor M. D. (2013). To fit or not to fit: Evaluating stable isotope mixing models using simulated mixing polygons. Methods Ecol. Evol. 4, 612–618. doi: 10.1111/2041-210X.12048
Stock B. C., Jackson A. L., Ward E. J., Parnell A. C., Phillips D. L., Semmens B. X. (2018). Analyzing mixing systems using a new generation of Bayesian tracer mixing models. PeerJ 6, e5096. doi: 10.7717/peerj.5096
Stock B., Semmens B. (2016) MixSIAR GUI user manual. version 3. Available at: https://github.com/brianstock/MixSIAR.
Swanson H. K., Lysy M., Power M., Stasko A. D., Johnson J. D., Reist J. D. (2015). A new probabilistic method for quantifying n-dimensional ecological niches and niche overlap. Ecology 96, 318–324. doi: 10.1890/14-0235.1
Taşkavak E., Gürkan Ş., Severa T. M., Akalına S., Özaydına O. (2010). Gut contents and feeding habits of the great pipefish, Syngnathus acus linnaeus 1758, in izmir bay (Aegean Sea, Turkey). Zool. Middle East 50, 75–82. doi: 10.1080/09397140.2010.10638414
Thomas S. M., Crowther T. W. (2015). Predicting rates of isotopic turnover across the animal kingdom: a synthesis of existing data. J. Anim. Ecol. 84, 861–870. doi: 10.1111/1365-2656.12326
Tieszen L. L., Boutton T. W., Tesdahl K. G., Slade N. A. (1983). Fractionation and turnover of stable carbon isotopes in animal tissues: implications for δ13C analysis of diet. Oecologia 57, 32–37. doi: 10.1007/BF00379558
Vafeiadou A. M., Adão H., De Troch M., Moens T. (2013). Sample acidification effects on carbon and nitrogen stable isotope ratios of macrofauna from a zostera noltii bed. Mar. Freshw. Res. 64, 741–745. doi: 10.1071/MF12169
Valentini A., Pompanon F., Taberlet P. (2009). DNA Barcoding for ecologists. Trends Ecol. Evol. 24, 110–117. doi: 10.1016/j.tree.2008.09.011
Valladares S., Planas M. (2012). Non-lethal dorsal fin sampling for stable isotope analysis in seahorses. Aquat. Ecol. 46, 363–370. doi: 10.1007/s10452-012-9407-y
Valladares S., Soto D. X., Planas M. (2016). Dietary composition of endangered seahorses determined by stable isotope analysis. Mar. Fresh Res. 68, 831–839. doi: 10.1071/MF16013
Vander Zanden M. J., Clayton M. K., Moody E. K., Solomon C. T., Weidel B. C. (2015). Stable isotope turnover and half-life in animal tissues: a literature synthesis. PloS One 10, e0116182. doi: 10.1371/journal.pone.0116182
Viejo R. M. (1999). Mobile epifauna inhabiting the invasive Sargassum muticum and two local seaweeds in northern Spain. Aquat. Bot. 64, 131–149. doi: 10.1016/S0304-3770(99)00011-X
Wickham H., Chang W., Henry L., Pedersen T. L., Takahashi K., Wilke C., et al. (2020) Ggplot2: Create elegant data visualisations using the grammar of graphics. Available at: https://CRAN.R-project.org/package=ggplot2.
Winkler N. S., Pérez-Matus A., Villena A. A., Thiel M. (2017). Seasonal variation in epifaunal communities associated with giant kelp (Macrocystis pyrifera) at an upwelling-dominated site. Austral Ecol. 42, 132–144. doi: 10.1111/aec.12407
Wolf N., Carleton S. A., Martínez del Rio C. (2009). Ten years of experimental animal isotopic ecology. Funct. Ecol. 23, 17–26. doi: 10.1111/j.1365-2435.2008.01529.x
Keywords: Syngnathidae, pipefish, Syngnathus acus, trophic niche, dietary regime, stable isotopes, time lag
Citation: Planas M (2022) Was that my meal? Uncertainty from source sampling period in diet reconstruction based on stable isotopes in a syngnathid fish. Front. Mar. Sci. 9:982883. doi: 10.3389/fmars.2022.982883
Received: 30 June 2022; Accepted: 05 October 2022;
Published: 20 October 2022.
Edited by:
Pedro Morais, Florida International University, United StatesReviewed by:
Jaclyn Hill, Fisheries and Oceans Canada (DFO), CanadaSule Gurkan, Ege University, Turkey
Malte Willmes, University of California, Santa Cruz, United States
Copyright © 2022 Planas. This is an open-access article distributed under the terms of the Creative Commons Attribution License (CC BY). The use, distribution or reproduction in other forums is permitted, provided the original author(s) and the copyright owner(s) are credited and that the original publication in this journal is cited, in accordance with accepted academic practice. No use, distribution or reproduction is permitted which does not comply with these terms.
*Correspondence: Miquel Planas, bXBsYW5hc0BpaW0uY3NpYy5lcw==
 Miquel Planas