 Yingrui Song
 Yuhong Lei1,2*
 Likuan Zhang
 Ming Cheng
 Chao Li
- 1Key Laboratory of Petroleum Resources Research, Institute of Geology and Geophysics, Chinese Academy of Sciences, Beijing, China
- 2Innovation Academy for Earth Science, Chinese Academy of Sciences, Beijing, China
- 3University of Chinese Academy of Sciences, Beijing, China
It is of great significance to study the spatial-temporal variations of the thickness of the gas hydrate stability zone (GHSZ) to understand the decomposition, migration, accumulation and dissipation of gas hydrate, the corresponding relationship between bottom-simulating reflectors (BSRs) and gas hydrate, and the distribution of heterogeneous gas hydrate. We selected the Dongsha region in the South China Sea (SCS) as the research object to calculate the spatial-temporal variation of the GHSZ since 10 Ma, analyzed the main factors affecting the thickness of the GHSZ, discussed the dynamic accumulation processes of gas hydrate, and proposed an accumulation model of gas hydrate in the Dongsha region. The results show that the thicknesses of the GHSZ in the study area were between 0 m and 100 m from 10 to 5.11 Ma, and the relatively higher bottom water temperature (BWT) was the key factor leading to the thinner thickness of the GHSZ during this period. From 5.11-0 Ma, the thickness of the GHSZ gradually increased but showed several fluctuations in thickness due to changes in the geothermal gradient, seawater depth, BWT, and other factors. The decrease in the BWT was the main factor leading to GHSZ thickening from 5.11 to 0 Ma. The thicknesses of the GHSZ are between 110 m and 415 m at present. The present spatial distribution features show the following characteristics. The GHSZ in the deep canyon area is relatively thick, with thicknesses generally between 225 m and 415 m, while the GHSZ in other areas is relatively thin, with thicknesses between 110 m and 225 m. Based on the characteristics of the GHSZ, two hydrate accumulation models are proposed: a double-BSRs model due to thinning of the GHSZ and a multilayer hydrate model due to thickness changes of the GHSZ, with single or multiple BSRs.
1 Introduction
The gas hydrate stable zone (GHSZ), as a necessary condition for hydrate accumulation, is of great significance for gas hydrate exploration and exploitation (Kvenvolden, 1993; Sloan and Koh, 2008; Collett, 2009; Lei et al., 2021). The GHSZ is the range of thermodynamic equilibrium of three- phases of compounds composed of natural gas hydrate (NGH), water and gas (Rempel and Buffett, 1997), and its distribution characteristics are mainly affected by temperature, pressure, gas composition and pore water salinity. Changes in these parameters lead to changes in the thickness and spatial-temporal distribution characteristics of the GHSZ (Foucher et al., 2002; Haacke et al., 2007; Zander et al., 2017).
Researchers have shown that the spatial-temporal variations of the GHSZ are closely related to the origin and mechanism of multiple bottom-simulating reflectors (BSRs), the BSR and the dynamic accumulation process of gas hydrate. Therefore, studying the spatial-temporal variation of the GHSZ can help us understand the dynamic decomposition, migration, accumulation and dissipation of gas hydrate, and the spatial distribution characteristics of gas hydrate (Bangs et al., 2005; Haacke et al., 2007; Pecher et al., 2017; Lei et al., 2021; Song et al., 2022; Zhang et al., 2022).
Previous studies have shown that the formation mechanism of some multiple BSRs is the thinning of the GHSZ due to the rise in the formation temperature, decrease in pressure, shallow seawater depth, tectonic uplift and other reasons. The hydrate formed in the early stage migrates out of the GHSZ, decomposes the gas hydrate and leaves the lower paleo-BSR. The decomposed gas and the newly migrated gas migrate upward to the new GHSZ and form hydrate accumulation and new BSR in the upper layer (Foucher et al., 2002; Bangs et al., 2005; Haacke et al., 2007; Pecher et al., 2017; Zander et al., 2017; Song et al., 2022). In the multiple BSRs that have this origin, no gas hydrates are present above the lower BSR, while there are gas hydrates above the upper BSR in the present GHSZ (Foucher et al., 2002; Bangs et al., 2005; Haacke et al., 2007; Pecher et al., 2017; Zander et al., 2017). In addition, the development of vertical multilayer gas hydrate and its relationship with BSR in the GHSZ may be closely related to the variation of the GHSZ and the multistage accumulation and damage of hydrates (Majumdar et al., 2016; Lei et al., 2021; Song et al., 2022). Therefore, the study of the spatial-temporal evolution of the GHSZ plays an important role in understanding the formation mechanism of the double\multiple BSRs.
At present, previous studies on the dynamic accumulation process of BSR and current hydrate mainly explain the correlation between BSR and current hydrate accumulation based on the fine anatomy of high-resolution seismic data and the characteristics of current hydrate accumulation (Horozal et al., 2017; Zhang et al., 2020; Zhang et al., 2022). However, these studies did not consider that the area of stable hydrate accumulation, the GHSZ, may change as the change of external environment. Due to the uncertainty of the GHSZ, the relationship between BSR and dynamic hydrate accumulation will also change. In recent years, the spatial-temporal evolution of the GHSZ and the dynamic accumulation relationship between BSR and hydrates was began to explore (Piñero et al., 2014; Burwicz et al., 2017; Wang et al., 2017a; Kroeger et al., 2019; Song et al., 2022). Piñero (2014), Burwicz (2017), Wang (2017a) and Kroeger (2019) specially considered the characteristics of the GHSZ with times in their model about dynamic hydrate accumulation. Song (2022) studied the spatial-temporal variation of the GHSZ and the relationship between double BSRs in the Shenhu area of the South China Sea (SCS), and elaborated the possible relationship between the evolution of the GHSZ and the GHSZ (Song et al., 2022). Recent studies have shown that the spatial-temporal variation of GHSZ plays an important role in understanding the dynamic accumulation process of BSR and gas hydrate.
Therefore, it is of great significance to study the spatial-temporal variation of the thickness of the GHSZ, and to understand the origin of BSR; the corresponding relationship between BSR and gas hydrate; the dynamic decomposition, migration, accumulation and dissipation of gas hydrate; and the hydrate accumulation models and to improve the exploration effect of gas hydrate.
Based on this information, this paper chose the Taixinan Basin of the northern South China Sea (SCS) as the research object, selected the appropriate methods and parameters; simulated the spatial-temporal variations of the GHSZ and distribution characteristics in the study area; discussed the dynamic decomposition, migration, accumulation and dissipation of gas hydrates related to the change in the GHSZ; and proposed a model of gas hydrate accumulation in the Dongsha region. This study provides a reference and inspiration for understanding the distribution pattern of gas hydrate and reducing the multiple solution of BSRs in the Dongsha region.
2 Geological background
The area of gas hydrate development in the Dongsha region is located in the continental margin of the Taixinan Basin in the northeast SCS (Figure 1A). The Taixinan Basin experienced three tectonic variation stages: the late Paleocene–early Oligocene continental margin rifting stage, late Oligocene–middle Miocene continental margin depression stage and late Miocene–Holocene passive continental margin rifting stage (Yi et al., 2007). Therefore, a tectonic pattern of north–south zones and east–west blocks was formed in the study area (Zhang, 2016).
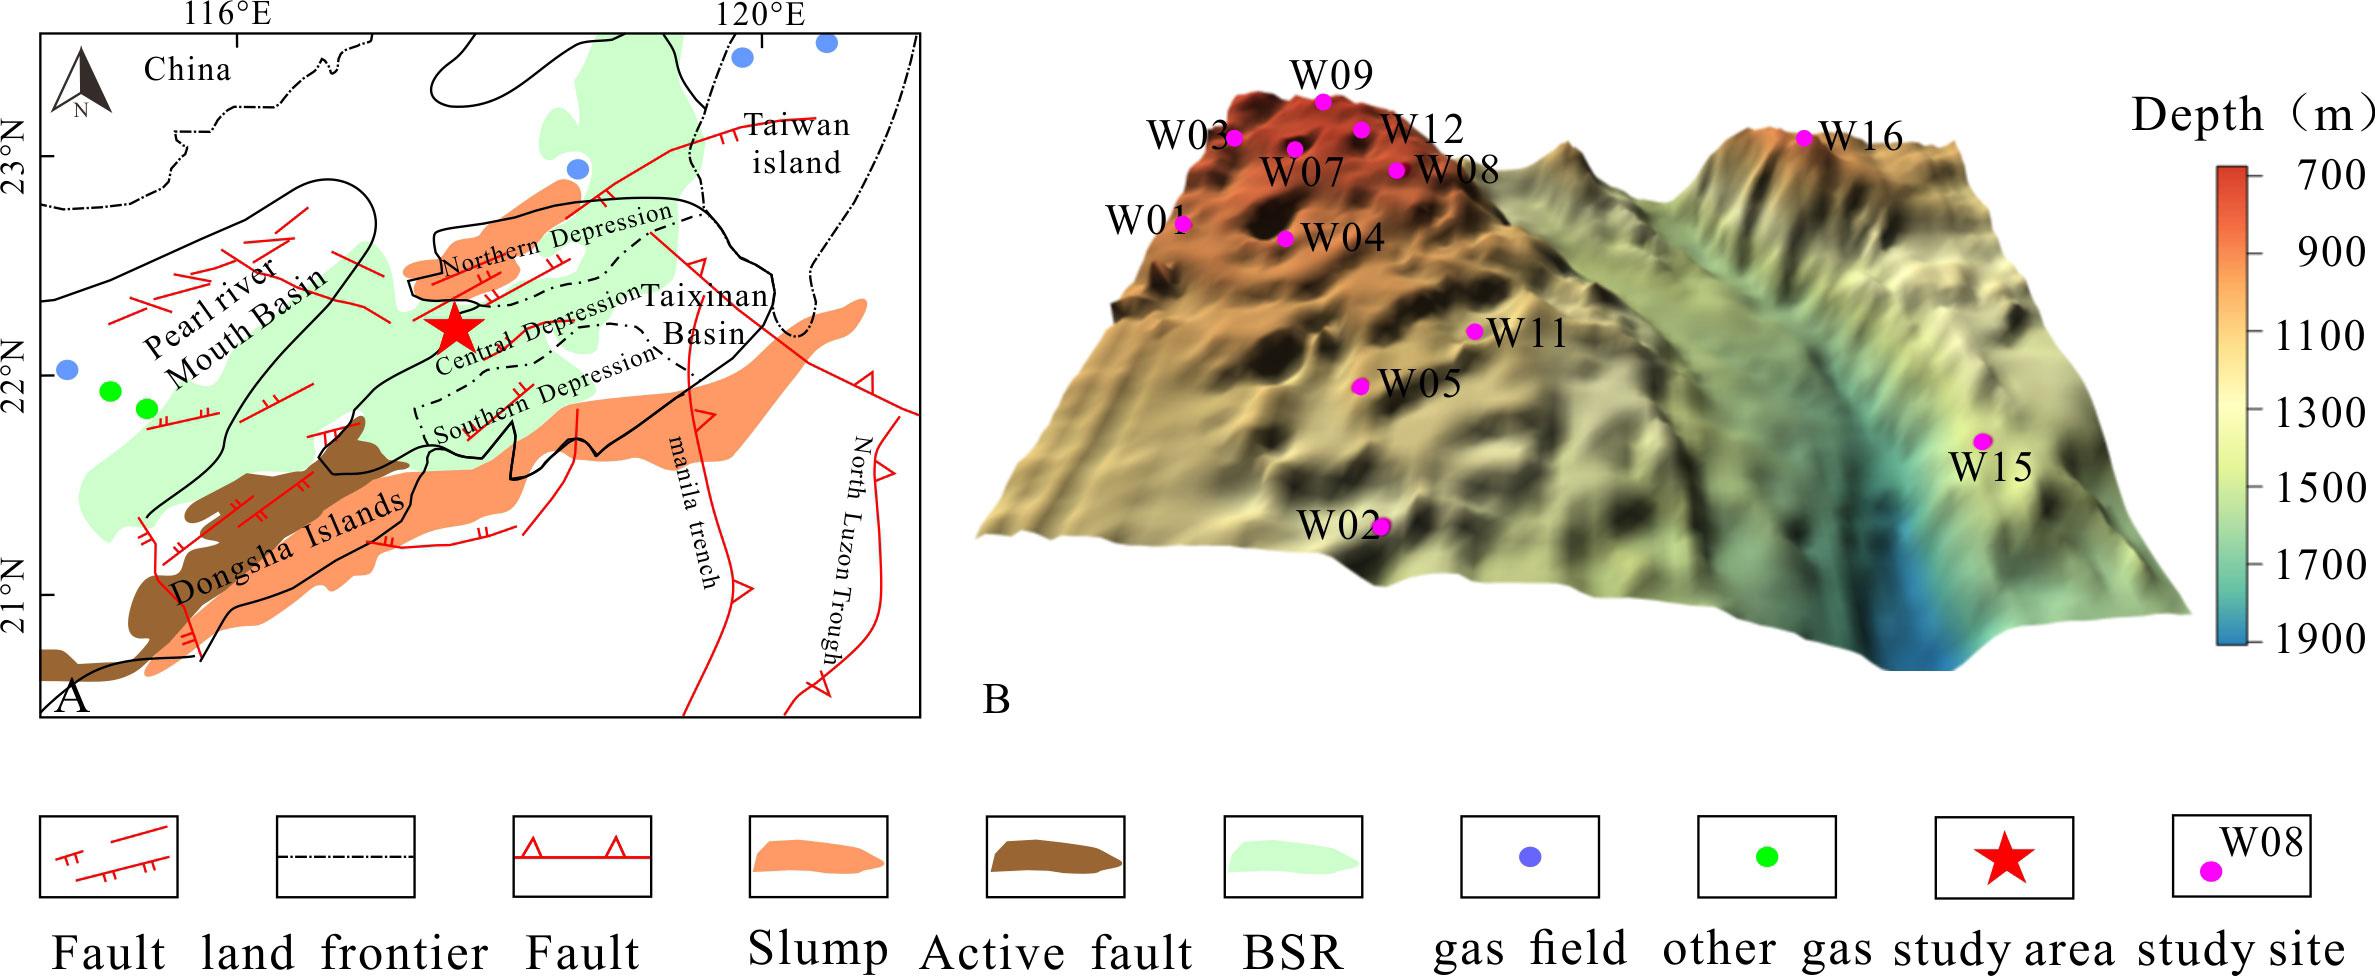
Figure 1 Geographic location and coring site characteristics of the Dongsha region. (A) Tectonic units of the southwest Taiwan Basin (data resource: Li et al., 2020). (B) Seawater depth and location characteristics of coring sites in the Dongsha region.
Multiple sets of source rocks of Jurassic, Cretaceous, Paleogene and Neogene ages are present in the Taixinan Basin (Zhang, 2016). The total organic carbon (TOC) contents of Jurassic and Cretaceous offshore terrestrial shale ranges from 0.7% to 2.4%, and the organic matter maturities range from 0.5% to 1.39% (Wang, 2016). The TOC contents of coal measure strata from upper Oligocene to lower Miocene deposits range from 0.5% to 2.0%, and organic matter maturities range from 0.56% to 1.03% (Wang, 2016; Zhang, 2016). These three sets of strata are important source rocks of thermogenic hydrocarbons in the Taixinan Basin. The marine mudstone strata of the upper Miocene and Quaternary are good biogenic source rocks (Gong et al., 2017; Li et al., 2021) with TOC contents ranging from 0.42% to 1.13% and organic maturities ranging from 0.2% to 0.6% (He et al., 2013).
Migration channels such as faults and mud diapirs are present in the Dongsha region (He and Liu, 2008). NW–NWW and NNE–NEE faults are the main faults in the study area (Yi et al., 2007) (Figure 1A). NW–NWW faults were formed during the continental margin rifting period from 56 to 17 Ma (Gong et al., 2008; Wang, 2016), and NNE–NEE faults were formed during the Dongsha movement which began at 10.2 Ma (Zhao et al., 2012; Li et al., 2015). In addition, a large number of cone-shaped, dome-shaped and even elongated gas chimneys are present near the fault active zone in the Dongsha region (Zhang, 2016; Sha et al., 2019). These faults and mud diapirs communicate with gas source stoves and the GHSZ, which are important channels for upward gas migration to the GHSZ in the Dongsha region (Zhang, 2016).
The present seawater depths in the Dongsha region are between 700 m and 1900 m (Zhang et al., 2014a). The pressures at the drilling sites range from 7.4 MPa to 17.7 MPa (Wang, 2016). The geothermal gradients range from 40°C/km to 90°C/km (Li et al., 2015). The heat flow values range from 60 Mw/m2 to 90 Mw/m2 (Sha et al., 2015a). The bottom water temperatures (BWTs) range from 2°C to 5°C. The sedimentation rates in the Dongsha region have been between 3.1 cm/ka and 7.4 cm/ka since the middle Pleistocene (Sha et al., 2019). Consequently, the Dongsha region has the temperature and pressure conditions conductive to the formation and preservation of gas hydrate. In 2013, the Guangzhou Marine Geological Survey (GMGS), Ministry of Land and Resources and China Geological Survey (CGS) drilled 13 stations in the research area, and hydrate was found in the cores from 5 stations (Zhang et al., 2014a; Zhang et al., 2014b; Sha et al., 2015b). NGHs occur in silty clays in massive, nodular, nodular, vein-like and dispersed forms (Zhang et al., 2014b). The thicknesses of the hydrate layer in this region are between 6 m and 37 m, the porosities of the sediments are between 55% and 65%, and the saturation values of the hydrate are approximately 45% to 100% (Zhang et al., 2014b). Sufficient gas sources, widely distributed migration channels, appropriate temperature and pressure conditions and drilling results indicate that the research area is a favorable gas hydrate exploration area.
3 Methodology and parameters
3.1 Methodology
The GHSZ is the range where the three phases of NGH, water and gas reach thermodynamic equilibrium, which is mainly limited by temperature, pressure and salinity (Figure 2) (Kvenvolden, 1993; Rempel and Buffett, 1997). The intersection of the geothermal gradient and temperature−pressure phase equilibrium boundary below the seafloor is the bottom boundary of the GHSZ, the bottom is the top boundary of the GHSZ, and the vertical distance between the top and bottom boundary is the thickness of the GHSZ. Therefore, the thickness of the GHSZ can be calculated by using the temperature and pressure phase balance formula of gas hydrate combined with the geothermal gradient curve (Dickens and Quinby-Hunt, 1994; Bishnoi and Dholabhai, 1999; Sloan and Koh, 2008).
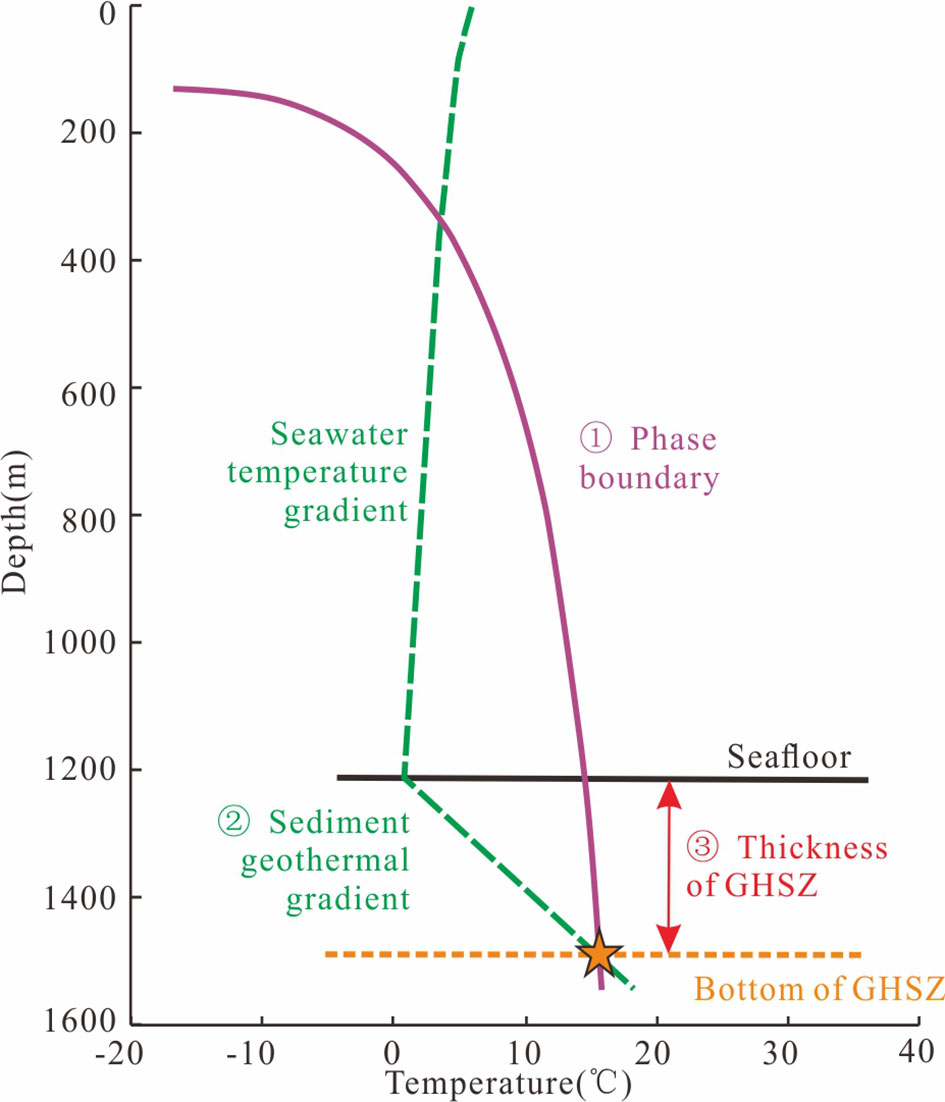
Figure 2 Calculation diagram of the GHSZ thickness controlled by ocean temperature (T) and pressure (P).
When calculating the thickness of the GHSZ, it is assumed that the gas consists entirely of methane. The boundary of the methane hydrate phase under temperature–depth control can be derived from the equilibrium formula of the hydrate phase (Formula 1) and the transformation equation of pressure and depth (Formula 2) to obtain the relationship between the temperature and depth of the hydrate phase boundary. The methane GHSZ is a function of depth (pressure) and temperature (Max, 1990; Miles, 1995). Here, the hydrate phase equilibrium formula fitted by Miles (1995) based on laboratory data of methane hydrate was used to calculate the thickness of the GHSZ (Equation. 1):
where P is the pressure, in MPa, and T is the temperature, in °C.
According to the liquid pressure equation, the conversion relationship between pressure and depth can be obtained as follows (Equation 2):
where Patm is atmospheric pressure, with a value of 0.101325 MPa; D is the present seawater depth, in m; 𝜌 is seawater density, with a value of 1035 kg/m3; g is gravity, with a value of 9.81 m/s2, and h is the thickness of the GHSZ, in m.
The calculation formula of the geothermal gradient is Equation 3:
where T is the BWT, in °C; Ti is the sediment temperature at point i, in °C; hi is the vertical distance to the seafloor at point i, in m; and G is the geothermal gradient, in °C/m.
According to the above formula, the hydrate phase boundary formula related to temperature and depth is obtained by using hydrate phase equilibrium formula and liquid pressure formula. The distance from the intersection point of the geothermal gradient to the seafloor sediment is the thickness of the GHSZ. At present, the Colorado School of Mines Hydrate program (CSMHYD) is a mainstream software to calculate the thickness of the GHSZ. However, this program cannot be used for batch calculation, and can not meet the needs of large-scale area research.
In this study, a program for calculation the thickness of GHSZ was written according to the above theoretical formulas. This procedure chose C language as the programming language, which can realize the fast mass calculation. The 100 rows (W-E direction) * 68 columns (N-S direction) nodes, totaling 6400 total nodes, will be set on the plane for the characteristics of the 3D plane GHSZ in the study area. The areas without control points are interpolated using the Kriging interpolation technique in the Surfer software. The characteristic of 1D and 2D GHSZ is obtained by intercepting the 3D plane, which is convenient for comparison and analysis with the actual profile.
3.2 Parameters
3.2.1 Present parameters
Present parameters include the present formation water pressure, present BWT, and present geothermal gradient and density. The present measured drilling pressure in the study area shows that the shallow formation is under hydrostatic pressure (Wang, 2016). Therefore, the present seawater depth (D) can be used to calculate the present formation water pressure. The present seawater depths in the study area are approximately 700 ~1900 m (Figure 1B) (Zhang et al., 2014a). The seawater depths west of Sites W15-W16 and to the east of Sites W08-W11 are large, ranging from 1350 m to 1900 m. The seawater depths in other areas are relatively shallow, mainly varying from 700 m to 1350 m (Figure 1B). The present BWT data are derived from the fitting formula (Equation 4) of the BWT (Ts) and seawater depth (D) established by Zhu (2007) (Figure 3). The results show that the BWTs are is between 2.83°C and 5.66°C in the study area. The present geothermal gradient refers to the plane distribution map of the present geothermal gradient in the Dongsha region according to the measured geothermal gradient in the Dongsha region drawn by Li et al. (2015). In addition, it is assumed that the seawater density (ρ) in the study area is always constant, and the value is 1.035g/m3 (Wang et al., 2013).
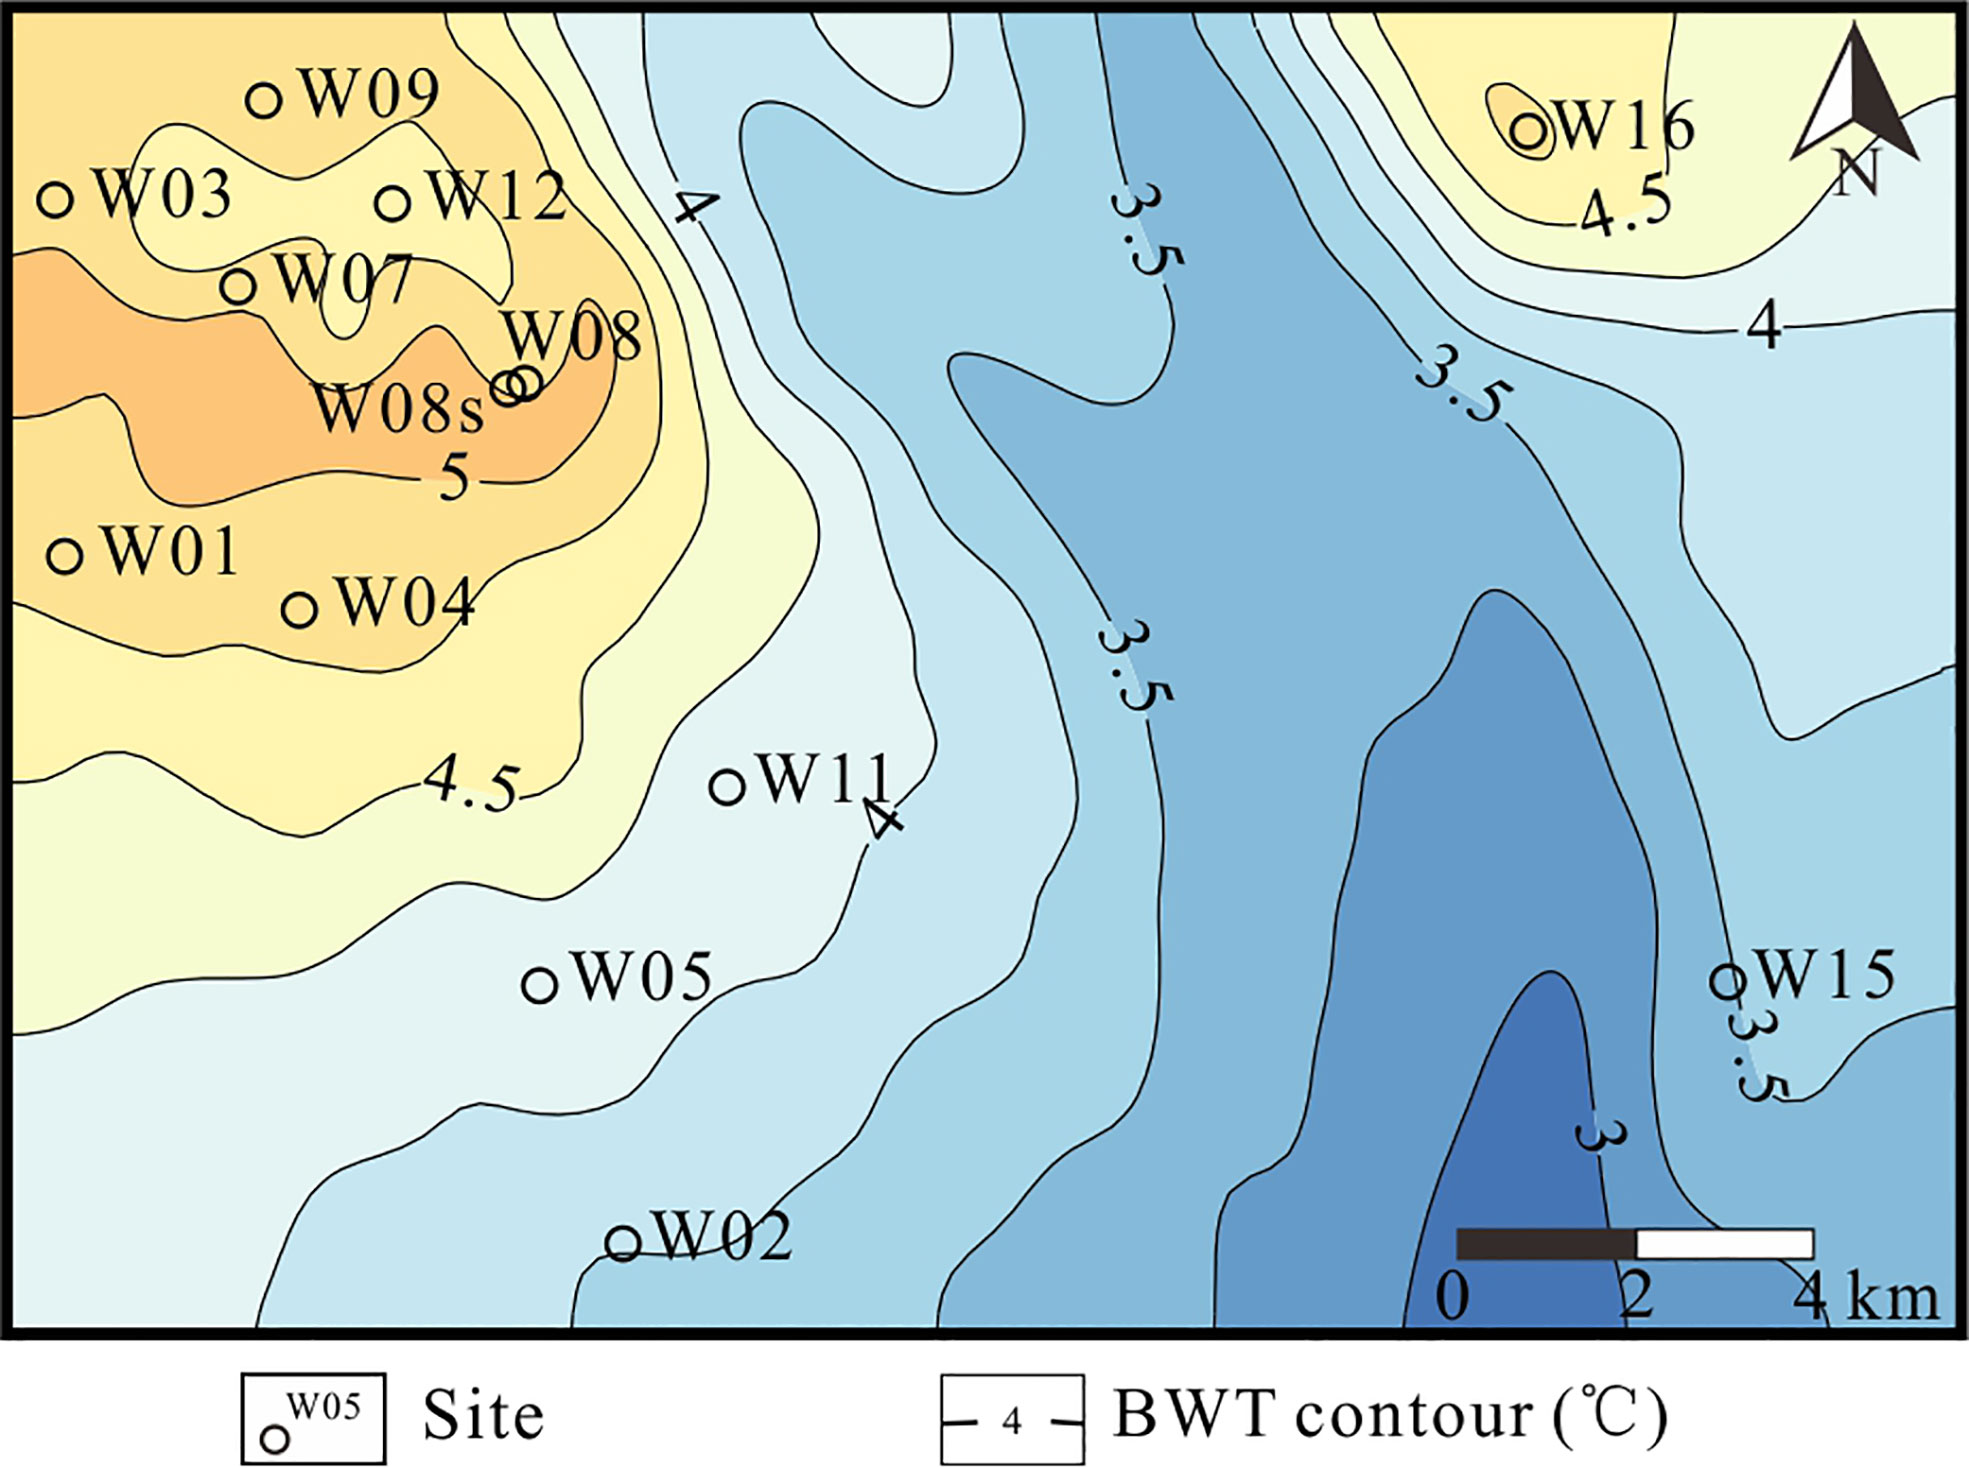
Figure 3 BWT characteristics in the Dongsha region, northern SCS.
where Ts is the BWT, in °C.
3.2.2 Paleo-parameters
On the premise that atmospheric pressure and seawater density do not change, the paleo-calculated parameters include the paleo-seawater depth, paleo-BWT and paleo-geothermal gradient. The relative trend of the adopted paleo-parameters is shown in Figure 4.
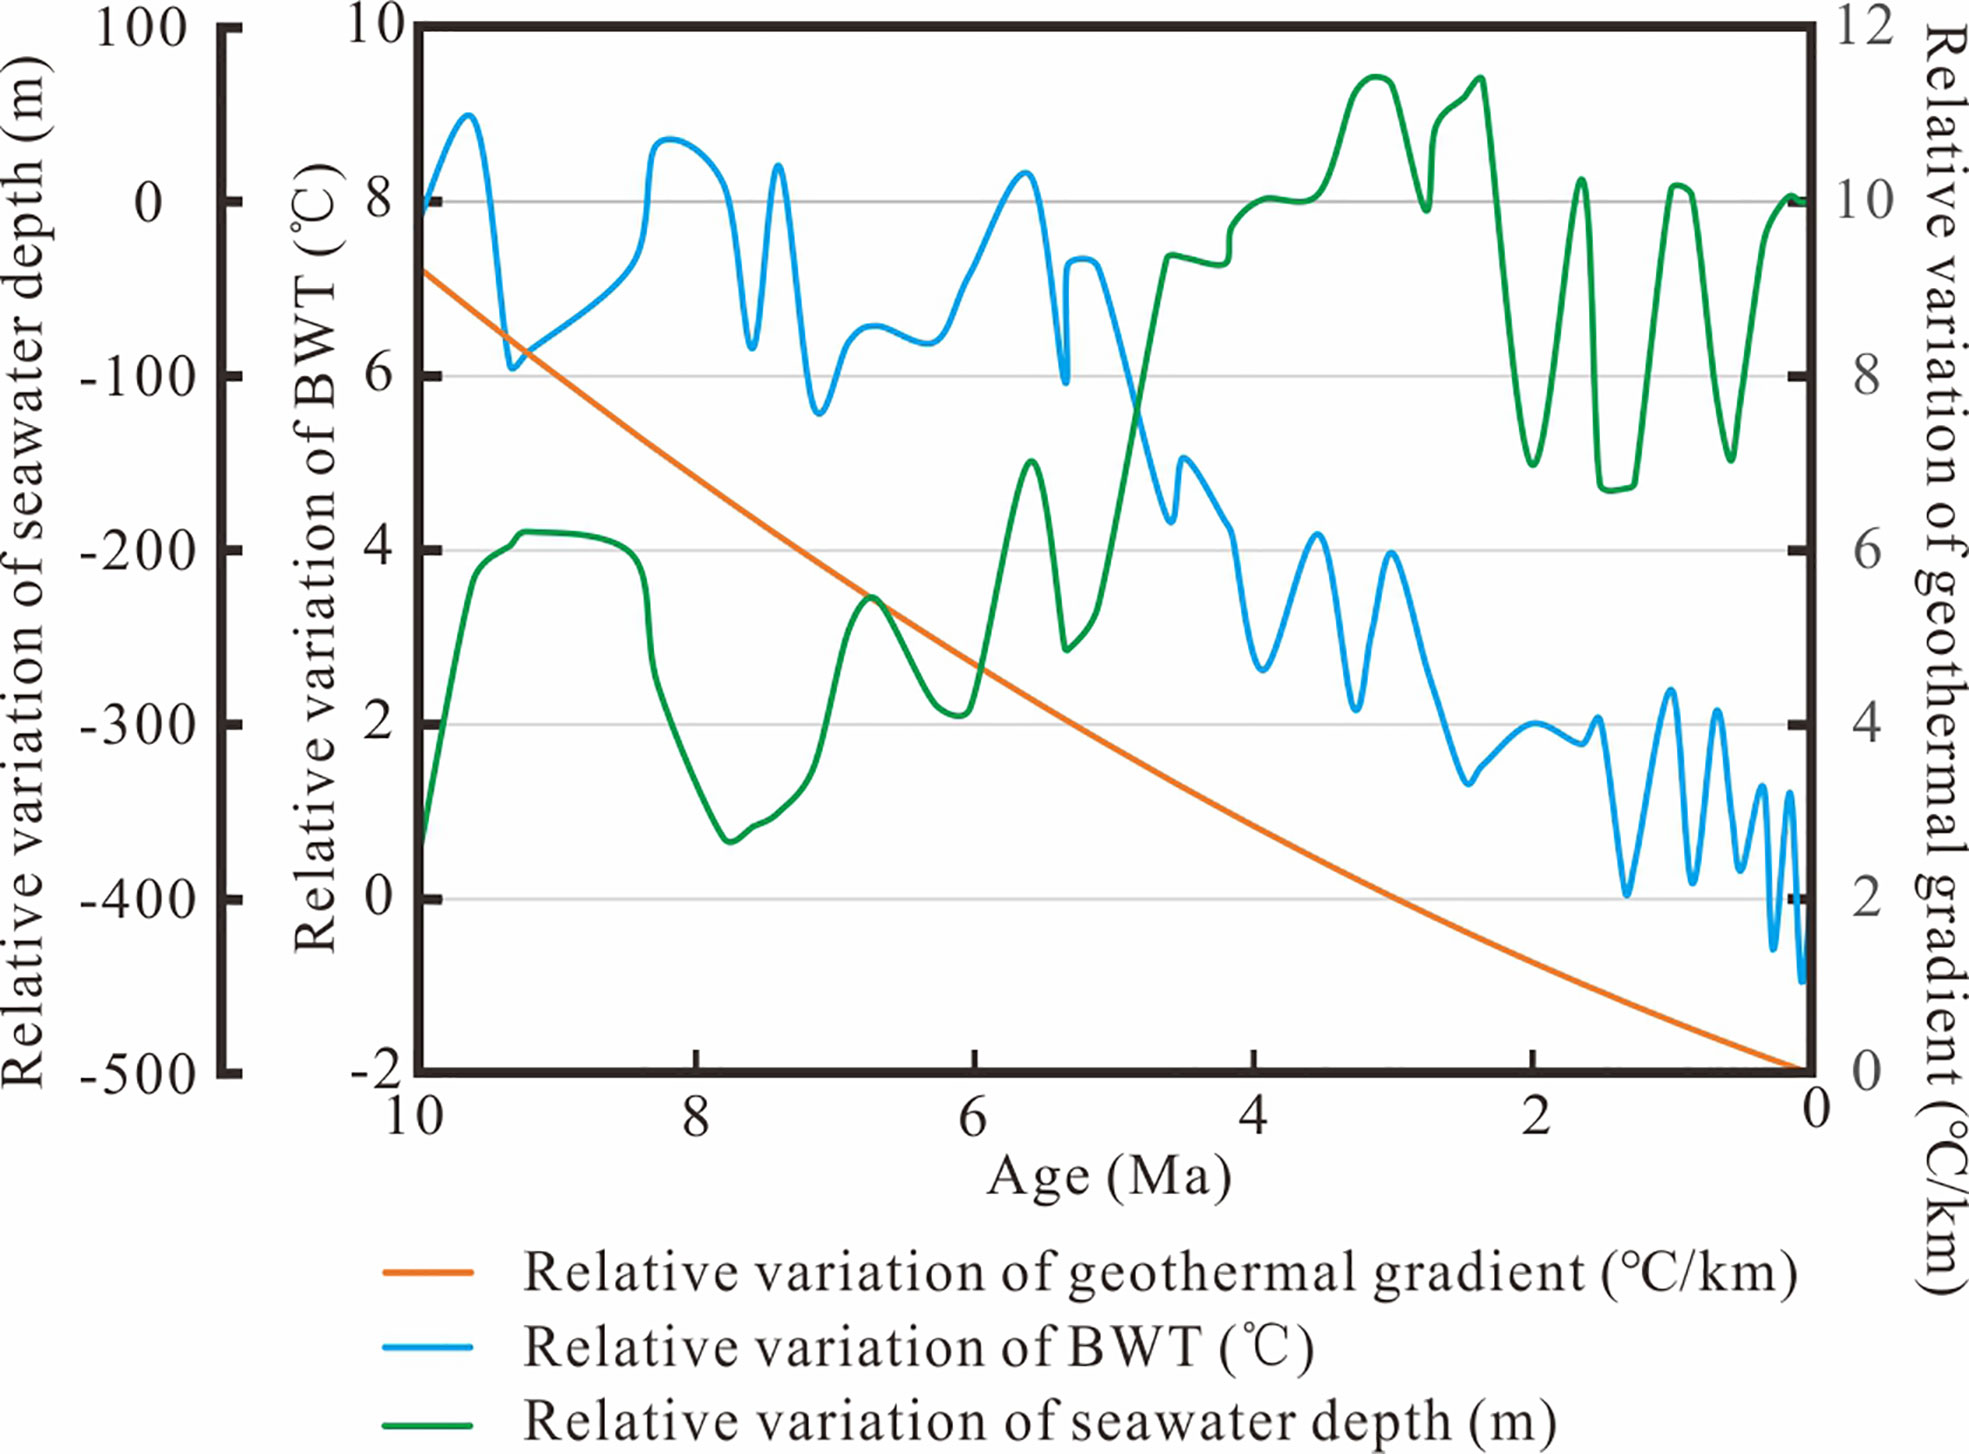
Figure 4 Relative trend of the paleo-parameters used to simulate the historical variation in the GHSZ.
The depth of paleo-seawater is an important parameter to calculate the thickness of the paleo-GHSZ. Paleo-seawater depth (Dp) is a function of the present seawater depth (D), relative sea level variation (ρH1) and seafloor subsidence (ρH2) (Formula 5). Changes in the relative sea level over time (ρH1) reference the research results of Pang et al. (2007) on the history of changes in relative sea level in the Pearl River Mouth Basin; the changes in submarine subsidence over time (ρH2) and the changes in depositional thickness over time (ρH3) reference the research results of Hu et al. (2019) on the history of seabed burial subsidence in the northern SCS. The changes in relative sea level over time (ρH1), seafloor subsidence over time (ρH2) and changes in depositional thickness over time (ρH3) are the changes in paleo-seawater depth, and the values are shown in Figure 4.
where Dp is the paleo-seawater depth, in m; ρH1 is the history of relative sea level fluctuation, in m; ρH2 is the history of seafloor subsidence, in m; and ρH3 is the history of the depositional thickness, in m.
Lear et al. (2015) used δ18O and Mg/Ca values of benthic forams to estimate the variation in the paleo-BWTs since 17 Ma at ODP Site 806 in the adjacent study area. The relative characteristics of the parameters are shown in Figure 4. The change in the geothermal gradient refers to the variation in the geothermal gradient of Liu et al. (2018), and the characteristics of the relative change are shown in Figure 4.
4 Results
Using the above methods and parameters, the variation processes of the thickness of the GHSZ since 10 Ma in the Dongsha area were calculated, and the results are shown in Figures 5–7.
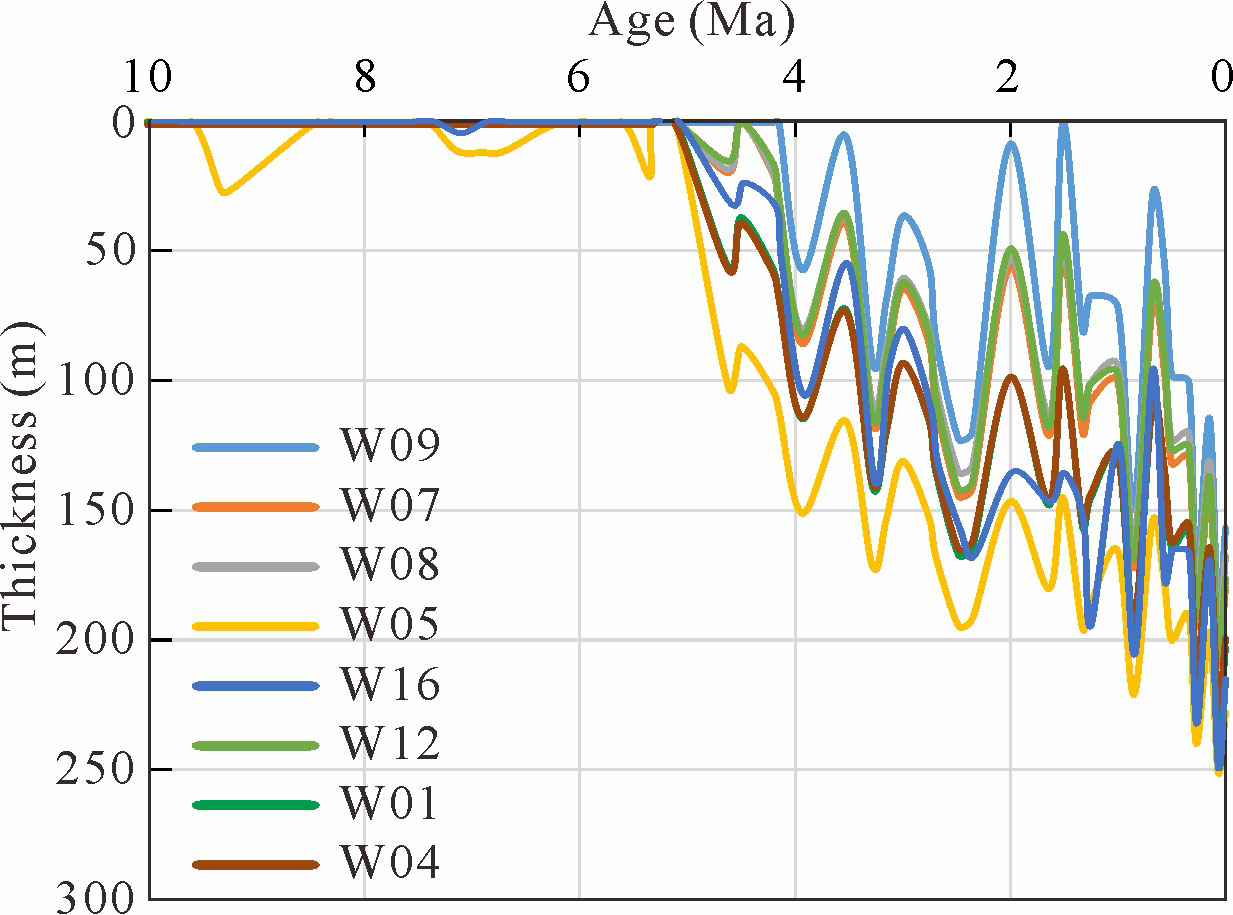
Figure 5 Characteristics of the GHSZ at different sites since 10 Ma.
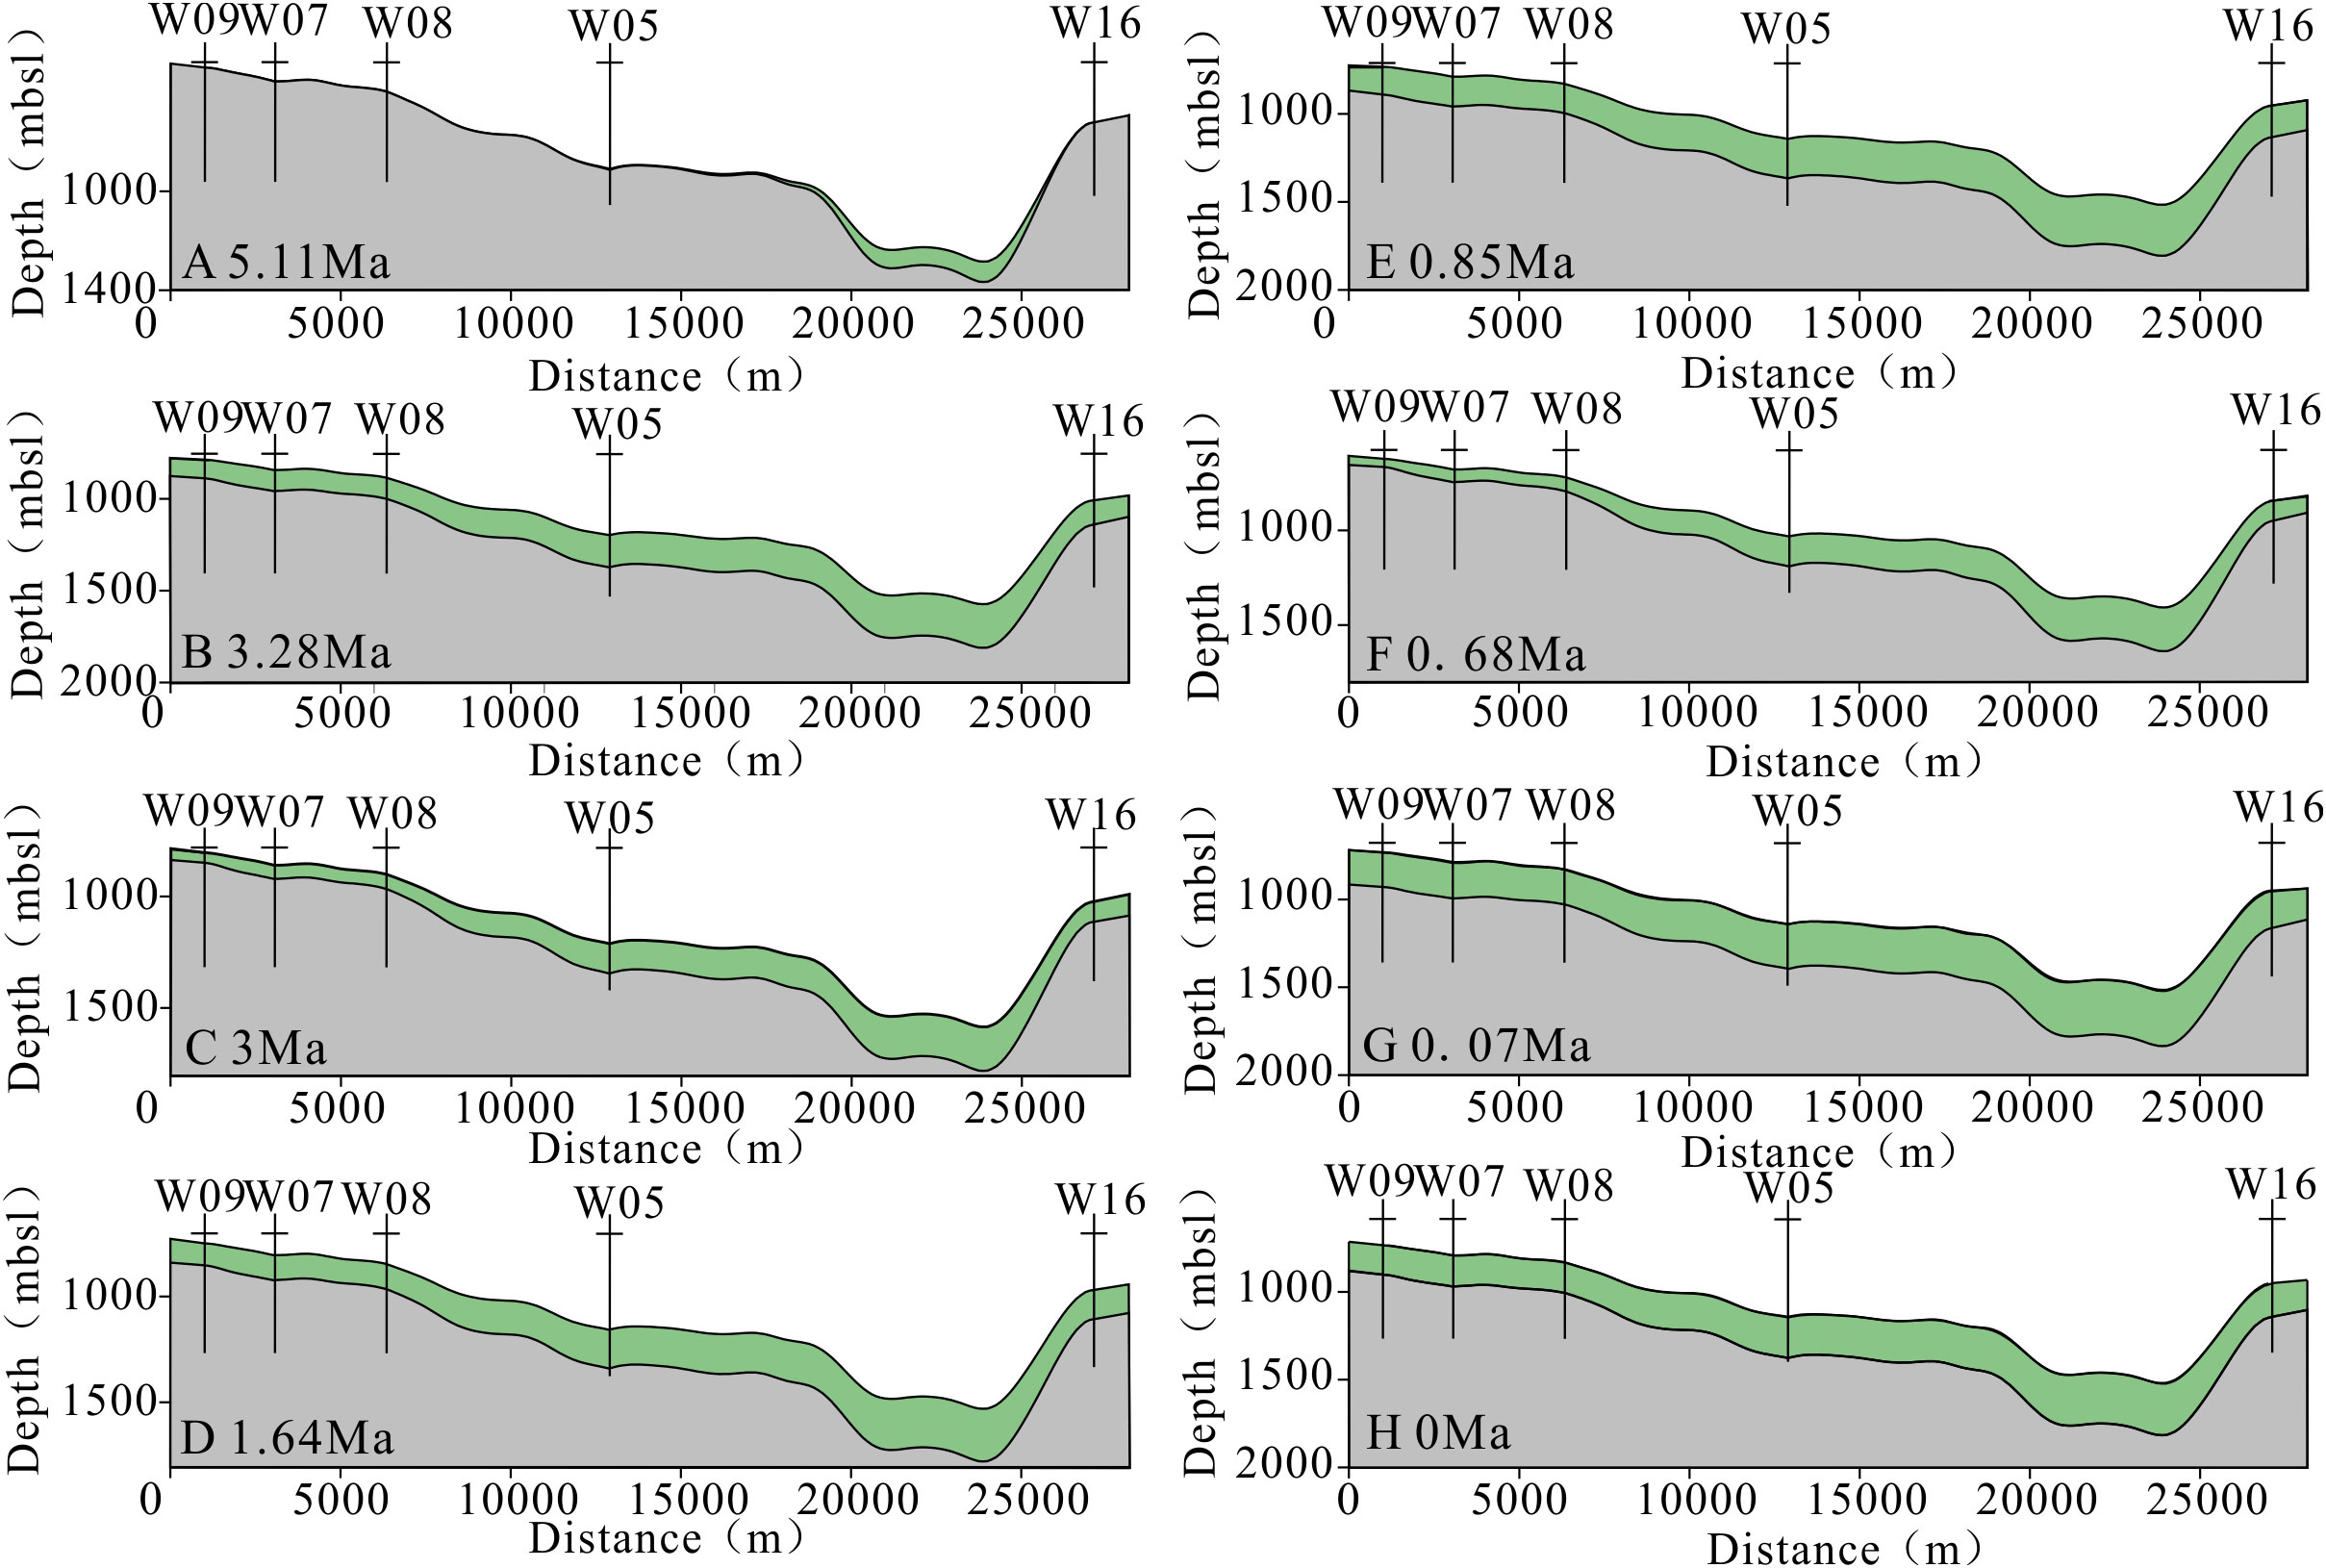
Figure 6 Characteristics of the GHSZ in the 2D profile. (A) 5.11 Ma, (B) 3.28 Ma, (C) 3 Ma, (D) 1.64 Ma, (E) 0.85 Ma, (F) 0.68 Ma, (G) 0.07 Ma, (H) 0 Ma.
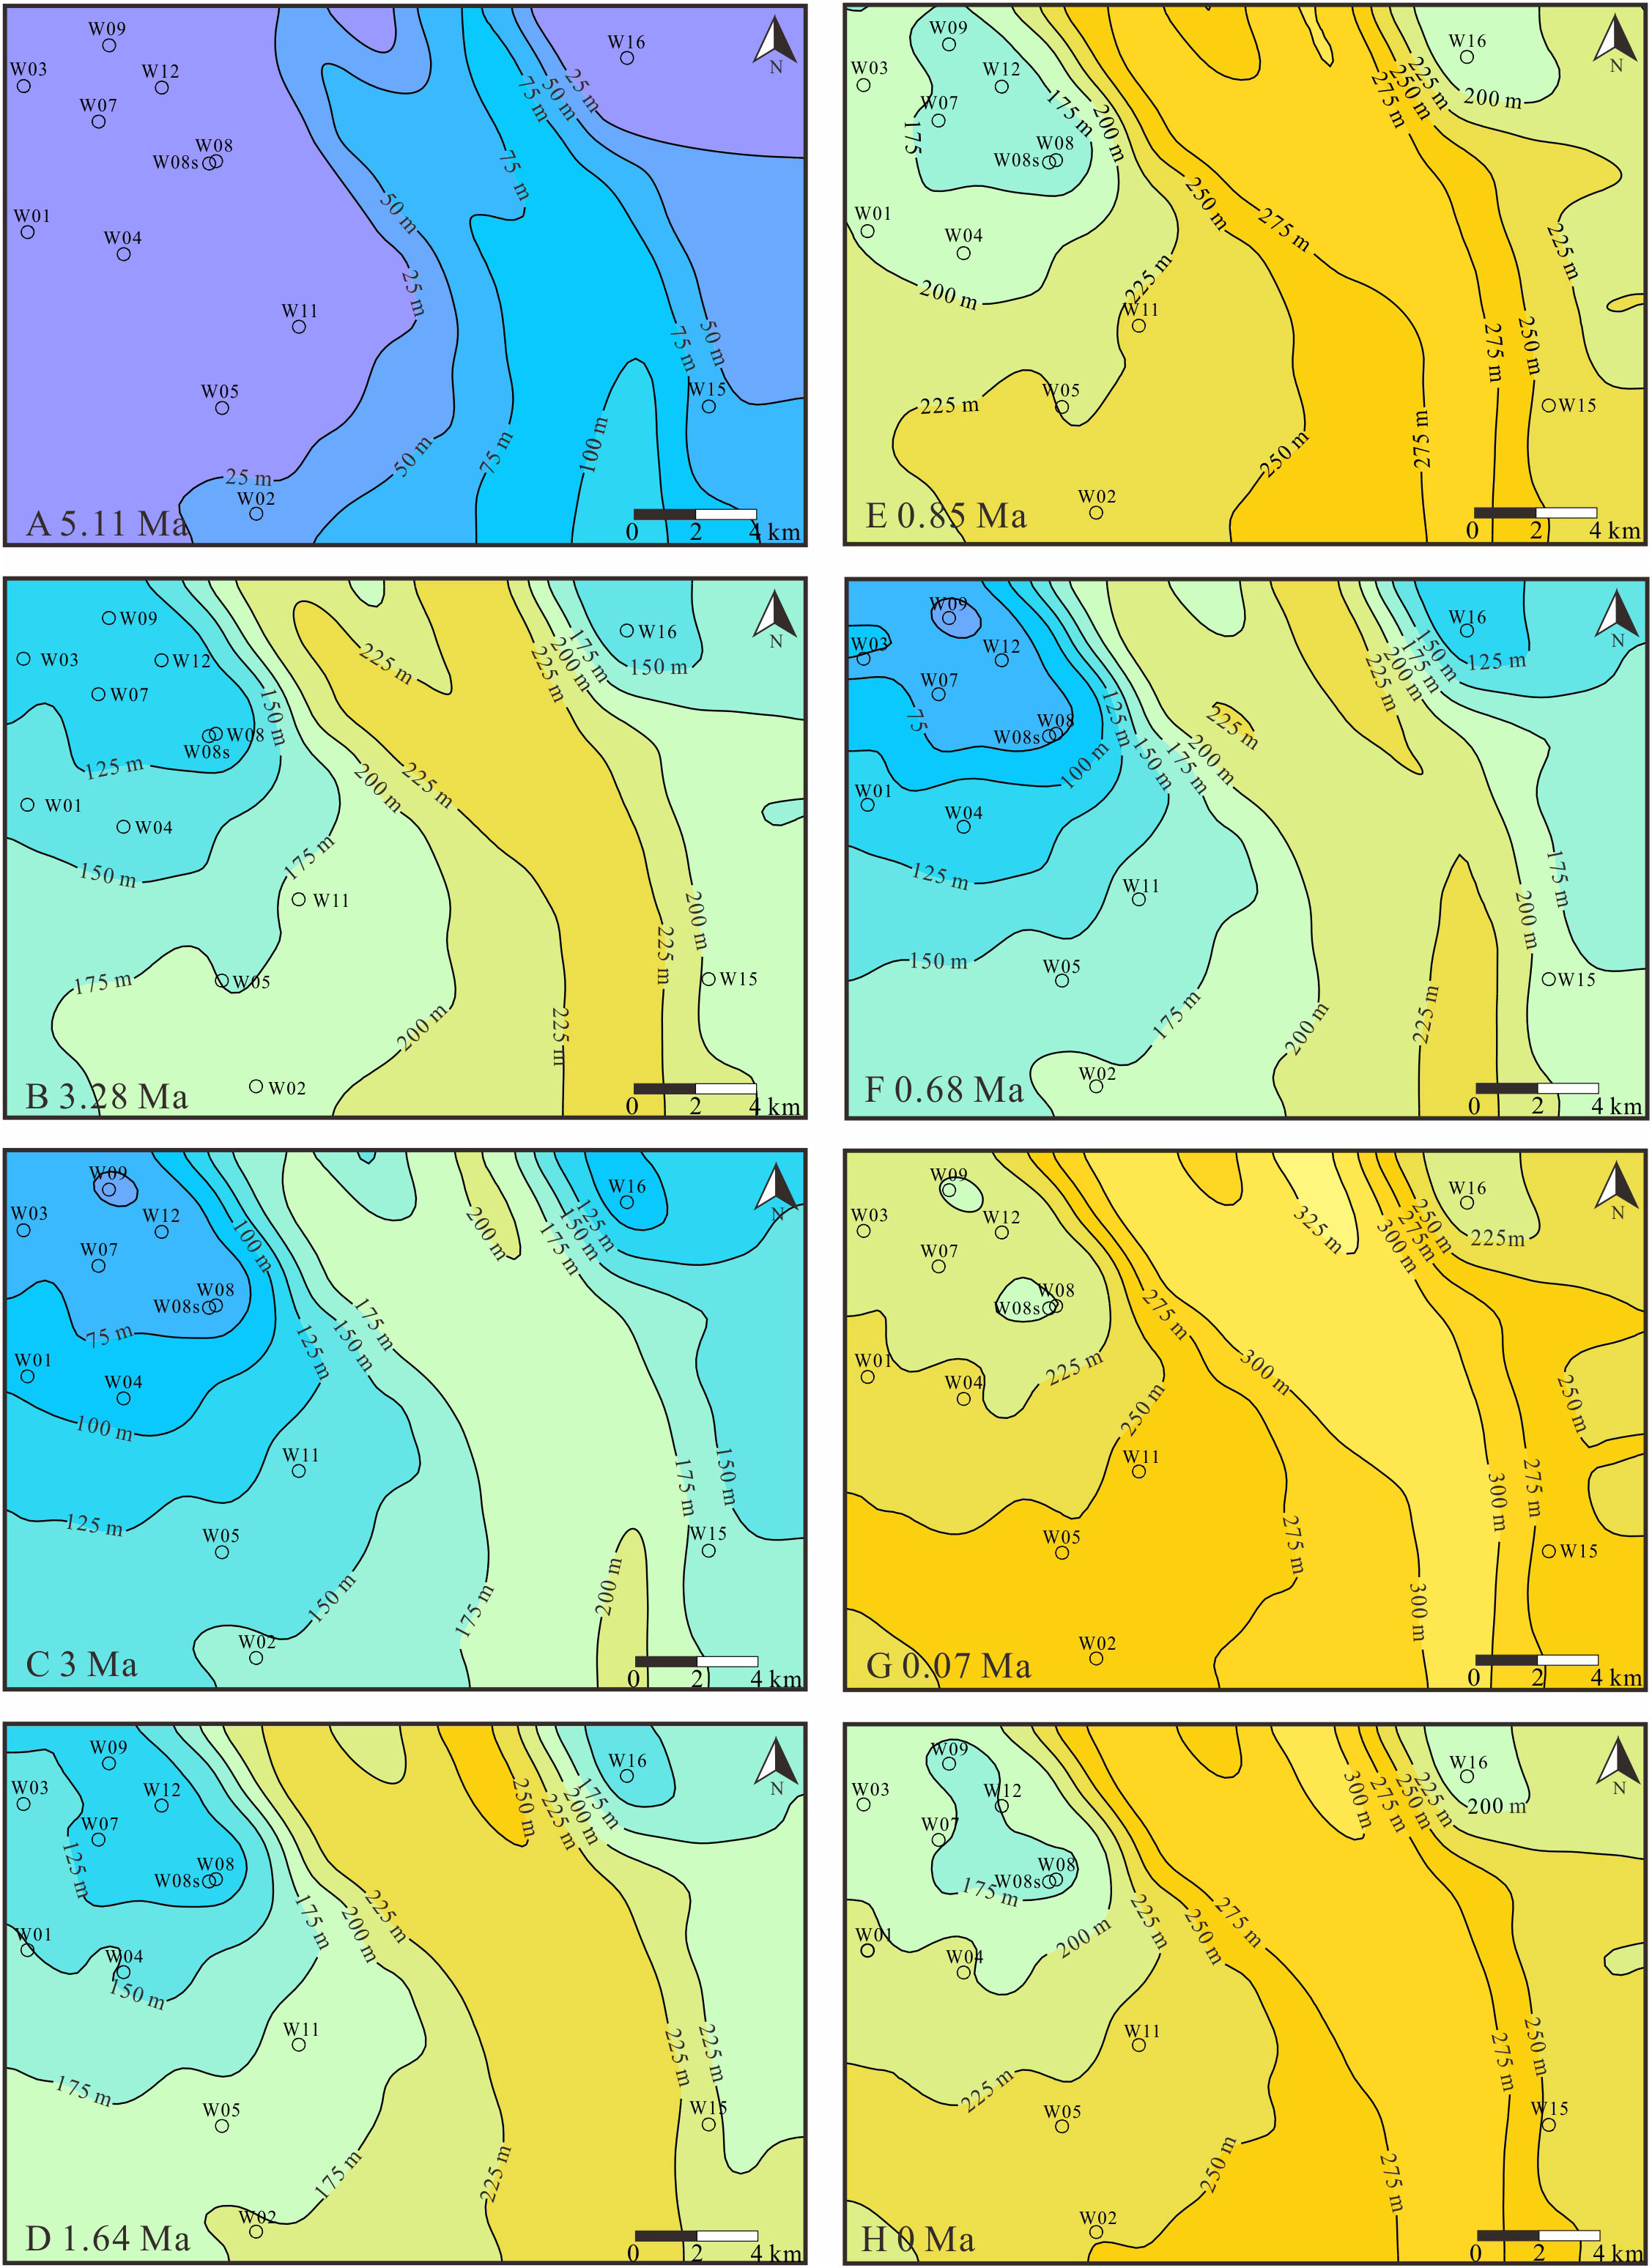
Figure 7 Characteristics of the GHSZ in the Dongsha region. (A) 5.11 Ma, (B) 3.28 Ma, (C) 3 Ma, (D) 1.64 Ma, (E) 0.85 Ma, (F) 0.68 Ma, (G) 0.07 Ma, (H) 0 Ma.
The thickness characteristics of gas hydrate in the GHSZ at a single site since 10 Ma show the following characteristics. From 10 to 5.11 Ma, the thicknesses of the GHSZ on the east and west sides of the study area were very thin, generally less than 25 m. From 5.11 to 0 Ma, the thicknesses of the GHSZ gradually thickened, but there were several fluctuations in thickness processes due to temperature, pressure, seawater depth and other factors (Figure 5).
The thickness characteristics of the GHSZ in the 2D section at Sites W09, W07, W08, W05 and W16 are shown in Figure 6. The thicknesses of the GHSZ from 10 to 5.11 Ma were generally less than 10 m. At 5.11 Ma, the thicknesses of the GHSZ in the deep canyon area between W05 and W16 were relatively large, with values ranging from 70 m to 80 m. The thicknesses of the GHSZ in other areas were generally less than 10 m (Figure 6A). At 3.28 Ma, the thicknesses of the GHSZ increased significantly. The GHSZ in the deep canyon area between Sites W05 and W16 was approximately 230 m, and the thicknesses of the GHSZ in other areas were between 90 m and 180 m (Figure 6B). At 3 Ma, compared with 3.28 Ma, the thickness of the GHSZ was reduced. The thickness of the GHSZ in the deep canyon was approximately 200 m, and the thicknesses of the GHSZ on both sides of the canyon were between 50 m and 140 m (Figure 6C). Compared to 3 Ma, the GHSZ thickened significantly at 1.64 Ma. The thickness of the GHSZ in the deep canyon area between Sites W05 and W16 increased to approximately about 240 m, while the thicknesses of the GHSZ in other areas varied between 100 m and 220 m (Figure 6D). At 0.85 Ma, the thickness of the GHSZ in the deep canyon zone increased to 300 m, and the thicknesses of the GHSZ in other areas ranged from 120 m to 230 m (Figure 6E). At 0.68 Ma, the thickness of the GHSZ obviously decreased. The thickness of the GHSZ between Sites W05 and W16 in the deep canyon zone decreased to 220 m, and the thicknesses of the GHSZ in other areas were approximately 40 m to 210 m. The thickness of GHSZ between Sites W08 and W09 decreased the most, mainly between 40 m and 70 m (Figure 6F). At 0.07 Ma, the thicknesses of the GHSZ increased significantly. The thickness of the GHSZ in the deep canyon zone increased to 320 m, and the thicknesses of the GHSZ in other areas also increased, ranging from 180 m to 260 m (Figure 6G). Compared to 0.07 Ma, the thickness of the GHSZ at 0 Ma was slightly reduced. The thickness of the GHSZ in the canyon area with deep water was approximately 300 m, and the thicknesses of the GHSZ in other areas were approximately 170 m to 260 m (Figure 6H).
The plane distribution maps showing the thickness of the GHSZ in the Dongsha region in different geological periods is given (Figure 7). Since 5.11 Ma, several thinning processes of gas hydrate in the GHSZ have occurred in the study area with the trend of increasing overall thickness. At 5.11 Ma, the thicknesses of the GHSZ in the study area were relatively thin, ranging from 0 m to 100 m. The thicknesses of the GHSZ at Site W16 in the western, northwestern and northeastern parts of the study area were generally less than 10 m, and the thicknesses of the GHSZ in the southeastern parts of the study area were relatively thick (Figure 7A). Compared to 5.11 Ma, the thickness distribution of the GHSZ at 3.28 Ma was significantly thicker, and the thicknesses ranged from 90 m to 310 m (Figure 7B). At 3 Ma, the thickness of the GHSZ became thinner overall, and the thicknesses ranged from 0 m to 258 m (Figure 6C). At 1.64 Ma, the GHSZ thickened obviously, with thicknesses between 90 m and 330 m (Figure 7D). The thickness of the GHSZ at 0.85 Ma continued to increase, and the thickness values were between 110 m and 390 m (Figure 7E). The thicknesses of the GHSZ at 0.68 Ma were thinner, ranging from 0 m to 306 m (Figure 7F), and the thicknesses of the GHSZ at 0.07 Ma were thicker, ranging from 125 m to 470 m (Figure 7G). At 0 Ma, the GHSZ became thinner, and the thicknesses ranged from 110 m to 415 m (Figure 7H). The present spatial distribution characteristics of the thickness of the GHSZ in the Dongsha region are as follows: the thickness of the GHSZ in the northeastern and northwestern regions is the thinnest. The thicknesses of the deep canyon between W11, W12, W16 and W15 are thicker, generally between 225 m and 415 m, while the thicknesses of the GHSZ in other areas are thinner, between 110 m and 225 m. The thickness distribution of the GHSZ at different ages is consistent with that at the present, but the thickness of the GHSZ is different at different times.
5 Discussion
5.1 Main factors affecting the thickness changes of the GHSZ
Previous studies have shown that the seawater depth, geothermal gradient, and BWT are all important factors influencing the GHSZ (Collett, 2009). In these previous studies, the relationship between the parameters and the thickness of the GHSZ was determined by ansatze method (Paull et al., 1991; Milkov and Sassen, 2003; Wang and Lau, 2020) or linear correlation coefficient analysis (Wang et al., 2017b; Xiao et al., 2020). Then the influence of the parameters changes on the dynamic accumulation of hydrate was obtained. However, due to the lack of consideration of the time variation process of each parameter, the discussion results usually cannot accurately match the previous variation of the thickness of GHSZ. Therefore, these methods cannot get an accurate conclusion of how much the parameter changes affect the dynamic accumulation process of hydrate.
The single-factor sensitivity analysis method can provide a more accurate analysis of the impact of the change of a single uncertain factor on the results. Apply the true changing values of these paraments. The actual variation value of the thickness of GHSZ is calculated. Taking Site W16 as an example, the single-factor sensitivity analysis method is used to analyze the factors affecting the thickness of the GHSZ. Under the condition in which all other factors remain unchanged, the influence of the change in one factor on the thickness of the GHSZ is discussed.
Figure 5 shows the thickness characteristics of the GHSZ at Site W16. The thickness of the GHSZ is less than 10 m from 10 to 5.11 Ma. When other conditions remain unchanged, the geothermal gradient decreases from 44.05 °C/km at 10 Ma to 38.53 °C/km at 5.11 Ma, and the GHSZ thickens by 28.78 m. Similarly, the depth of seawater decreases from 464.20 m at 10 Ma to 885.00 m at 5.11 Ma, and the GHSZ thickens by 207.49 m. When other conditions remain unchanged, the temperature of the BWT decreases from 12.80 °C at 10 Ma to 12.58°C at 5.11 Ma, and the thickness of the GHSZ remains unchanged at 0.57 m. In conclusion, only when the BWT changes does the thickness of the GHSZ always change less than 10 m, which is the most consistent with the actual situation, in which the thickness of the GHSZ is less than 10 m. The higher BWT is the main reason for the thickness of the GHSZ being less than 10 m, which occurred from10 to 5.11 Ma.
According to the thickness characteristics of the GHSZ at Site W16 (Figure 4), from 5.11 to 0 Ma, the GHSZ thickens from 0.52 m to 214.70 m. As shown in Figure 8, when other conditions remain unchanged, the geothermal gradient decreases from 38.53°C/km at 5.11 Ma to 34.70°C/km at 10 Ma, and the GHSZ thickens by 26.56 m. When other conditions remain unchanged, the depth of seawater decreases from 464.20 m at 5.11 Ma to 885.00 m at 0 Ma, and the thickness of the GHSZ decreases by 3.75 m. When other conditions remain constant, the BWT increases from 12.58 °C at 5.11 Ma to 5.34°C at 0 Ma, and the GHSZ thickens from 0.58 m to 214.70 m. In conclusion, only when the BWT changes is the thickness change of the GHSZ (214.12 m) close to that of the actual GHSZ (214.18 m). The higher BWT is the main reason for the GHSZ thickening to 214.70 m from 5.11 to 0 Ma.
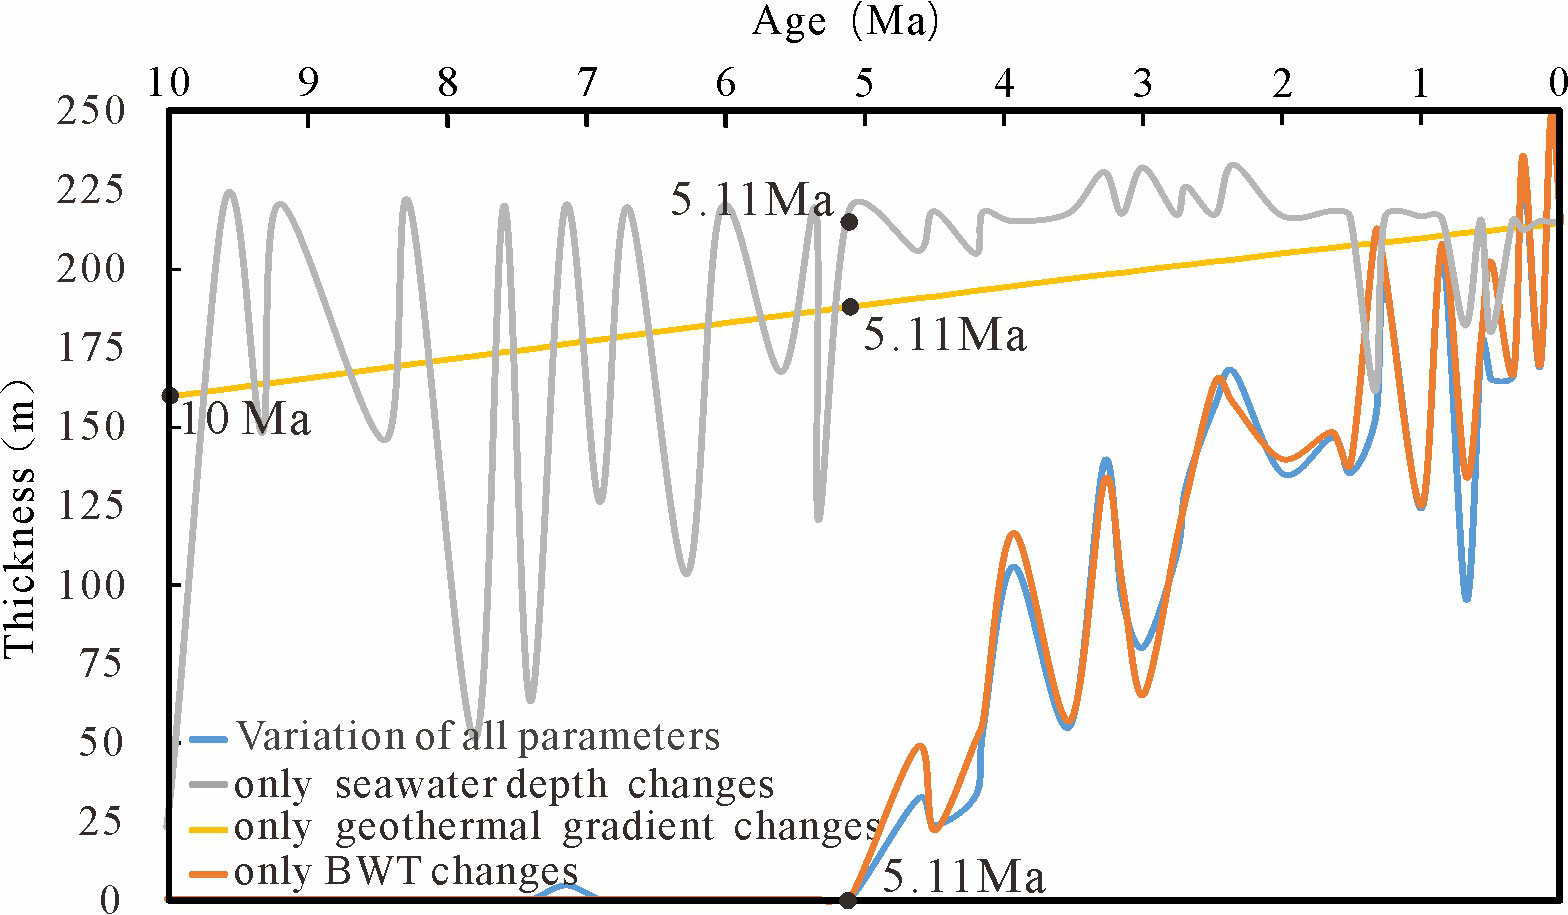
Figure 8 Effects of the geothermal gradient, BWT and seawater depth on the thickness of the GHSZ since 10 Ma.
5.2 Hydrate accumulation models related to GHSZ variation
NGHs revealed by seismic data and drilling in the Dongsha region have complex spatial distribution rules and strong heterogeneity. Double BSRs, different correspondences between NGHs and BSRs, and vertical multilayer NGHs are developed at some sites (Figure 9) (Zhang et al., 2014a; Zhang et al., 2014b; Li et al., 2015; Zhang et al., 2015). The heterogeneity of the spatial distribution of gas hydrates and the complexity of the relationship between gas hydrates and BSRs are closely related to the dynamic decomposition, migration, accumulation and dissipation of gas hydrates caused by the change in the thickness of the GHSZ and the coupling relationship between the GHSZ, gas source and migration channels. According to Zhang et al. (2017), the gas hydrates in the Dongsha region experienced at least three hydrate accumulation stages (0.78-0.357 Ma, 0.357-0.107 Ma and 0.107-0.063 Ma) and two hydrate destruction stages (0.33-0.107 Ma and 0.063-0.0466 Ma). Based on the analysis of the thickness characteristics of the GHSZ mentioned above, this section analyzes the dynamic accumulation processes and model of gas hydrate in the Dongsha region in combination with the seismic data and the geological age of gas hydrates formation revealed by drilling.
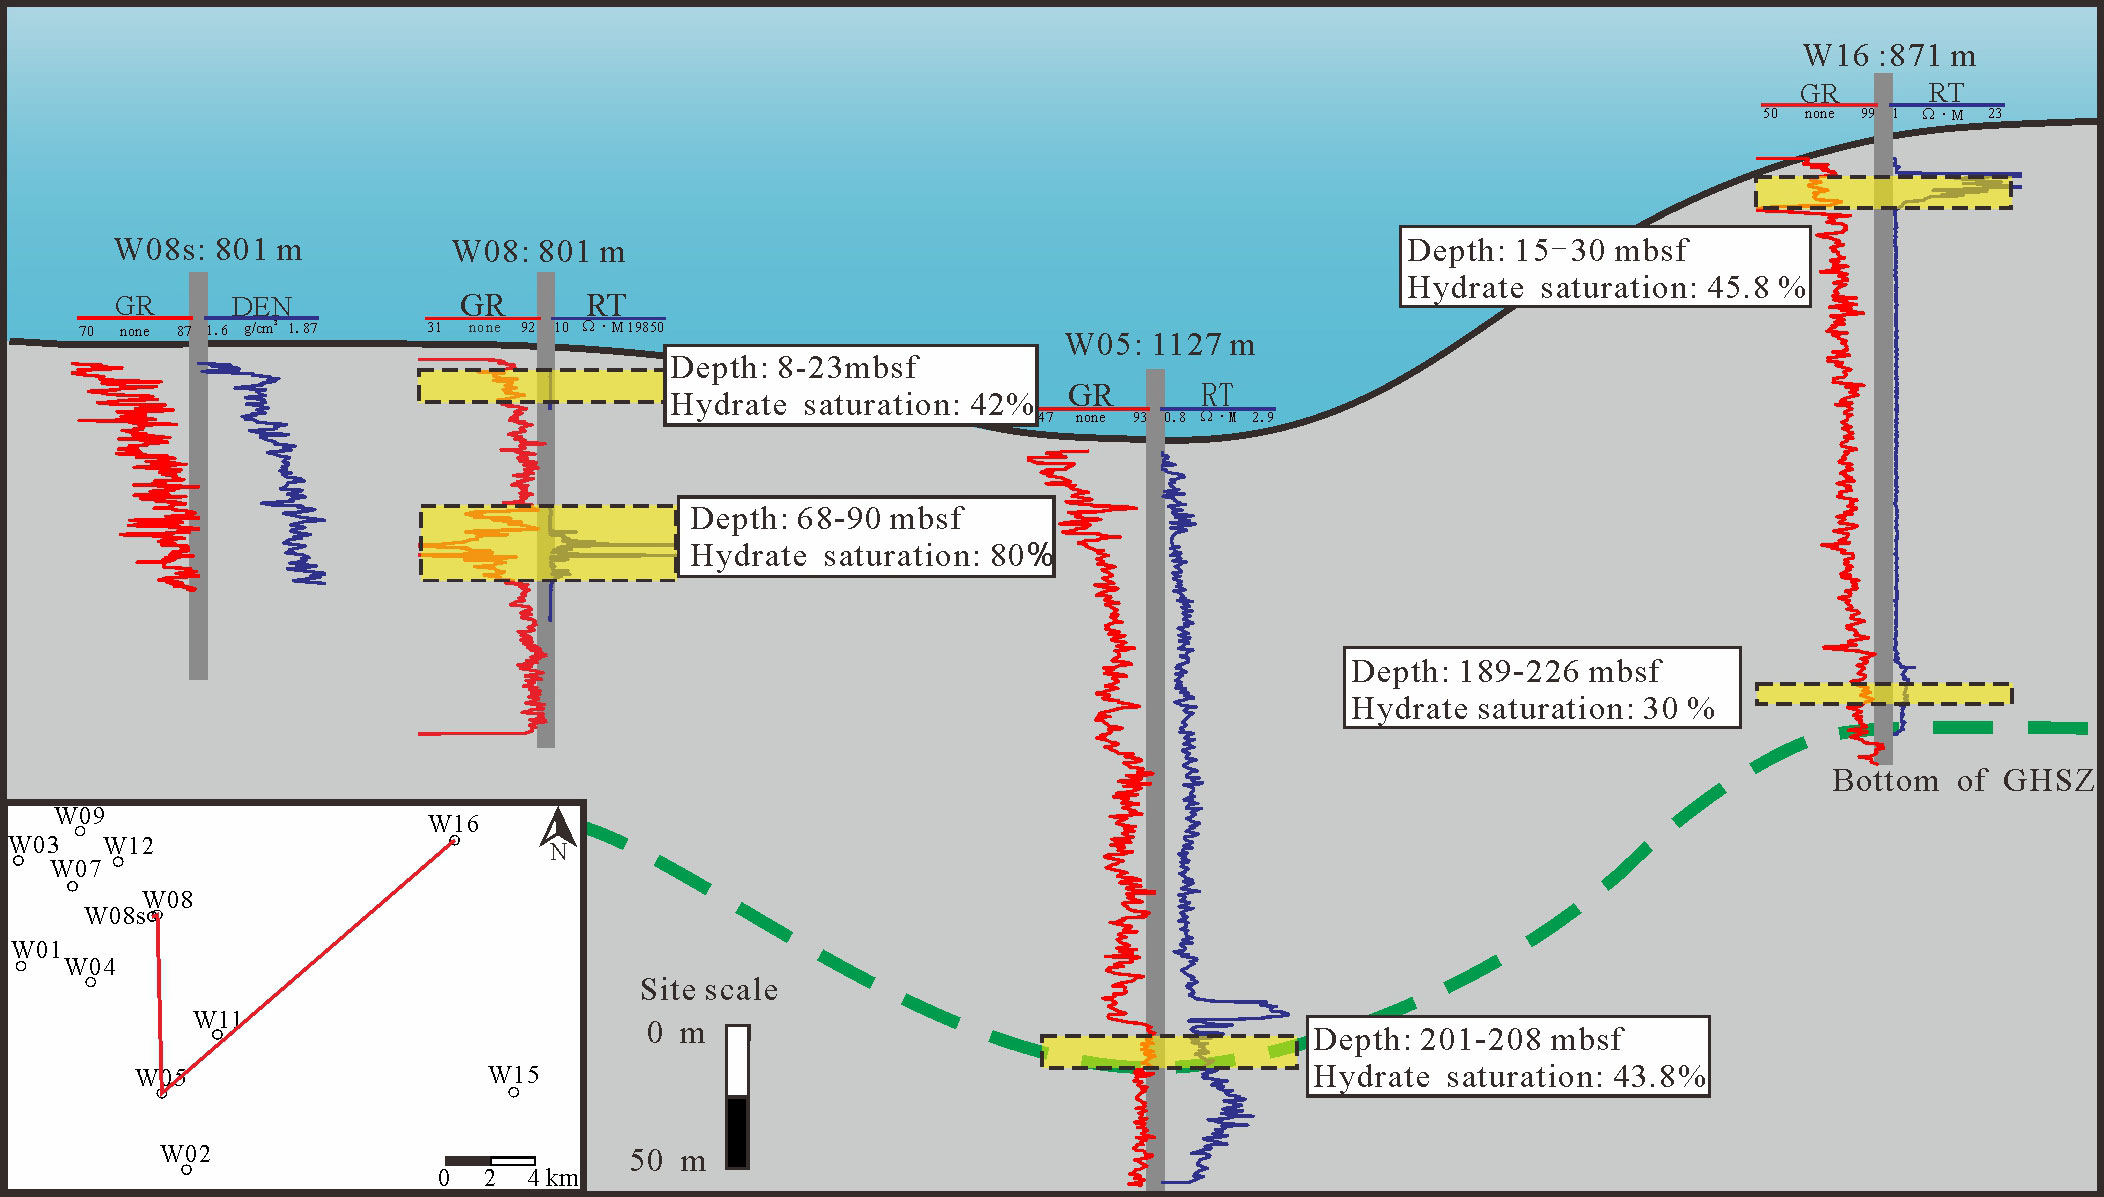
Figure 9 Distribution characteristics of single site hydrate in the Dongsha region (data resource: Zhang et al., 2014b; Wang, 2016).
Point A near Site W08 in the Dongsha region shows obvious double BSRs (Figure 10A) (Li et al., 2015). The seawater depth at this point is 1118 m, and the upper BSR (BSR-1) is located1327 meters below sea level (mbsl) (209 meters below the seafloor (mbsf)), while the lower BSR (BSR-2) is located at 1419 mbsl (301 mbsf) (Li et al., 2015). According to the present BWT (4.22°C), geothermal gradient (50 °C/km), seawater depth (1118 m) and formation pore water salinity (3.5% NaCl), the thickness of the present GHSZ at point A is 203 m, that is, the bottom boundary of the GHSZ at point A is basically consistent with the position of BSR-1. BSR-2 is located 92 m below BSR-1, and its possible formation mechanisms are as follows: one mechanism is the formation of gas hydrate above BSR-2 from deep thermogenic gas or a mixture of thermogenic gas and biogenic gas. The other mechanism may be due to the thinning of the GHSZ and the migration of NGH from the early stage to the bottom of the GHSZ, resulting in the resolution and escape of the hydrate and the residual paleo-BSR. The organic geochemical analysis results of the gas hydrate analytical gas at Site W08 show that the proportions of CH4 in the total hydrocarbon gas range from 99.94% to 99.96%, and the proportions of C2H6 in the total hydrocarbon gas range from 0.03% to 0.06%, δ13C1 values range from -68.4 ‰ to -71.2 ‰, and δD1 values range from -182 ‰ to -184 ‰. These results indicate that it is a typical biogenic gas (Sha et al., 2019). The schematic diagram of the hydrate phase equilibrium curve of different gas components (Figure 11) shows that if BSR-2 is a BSR formed by thermogenic gas components, namely, only 98% CH4+2% C3H8, or 80% CH4 and 20% C2H6, then the thickness of the bottom boundary of the GHSZ is consistent with that of BSR-2, and the thickness of the GHSZ is approximately 203 m, as calculated from the gas hydrate gas composition at Site W08, which is consistent with that of BSR-1. Therefore, BSR-2 near point A was not formed due to the existence of thermal gas but was more likely to be the residual paleo-BSR caused by the destruction of the NGH that was formed due to the thinning of the GHSZ.
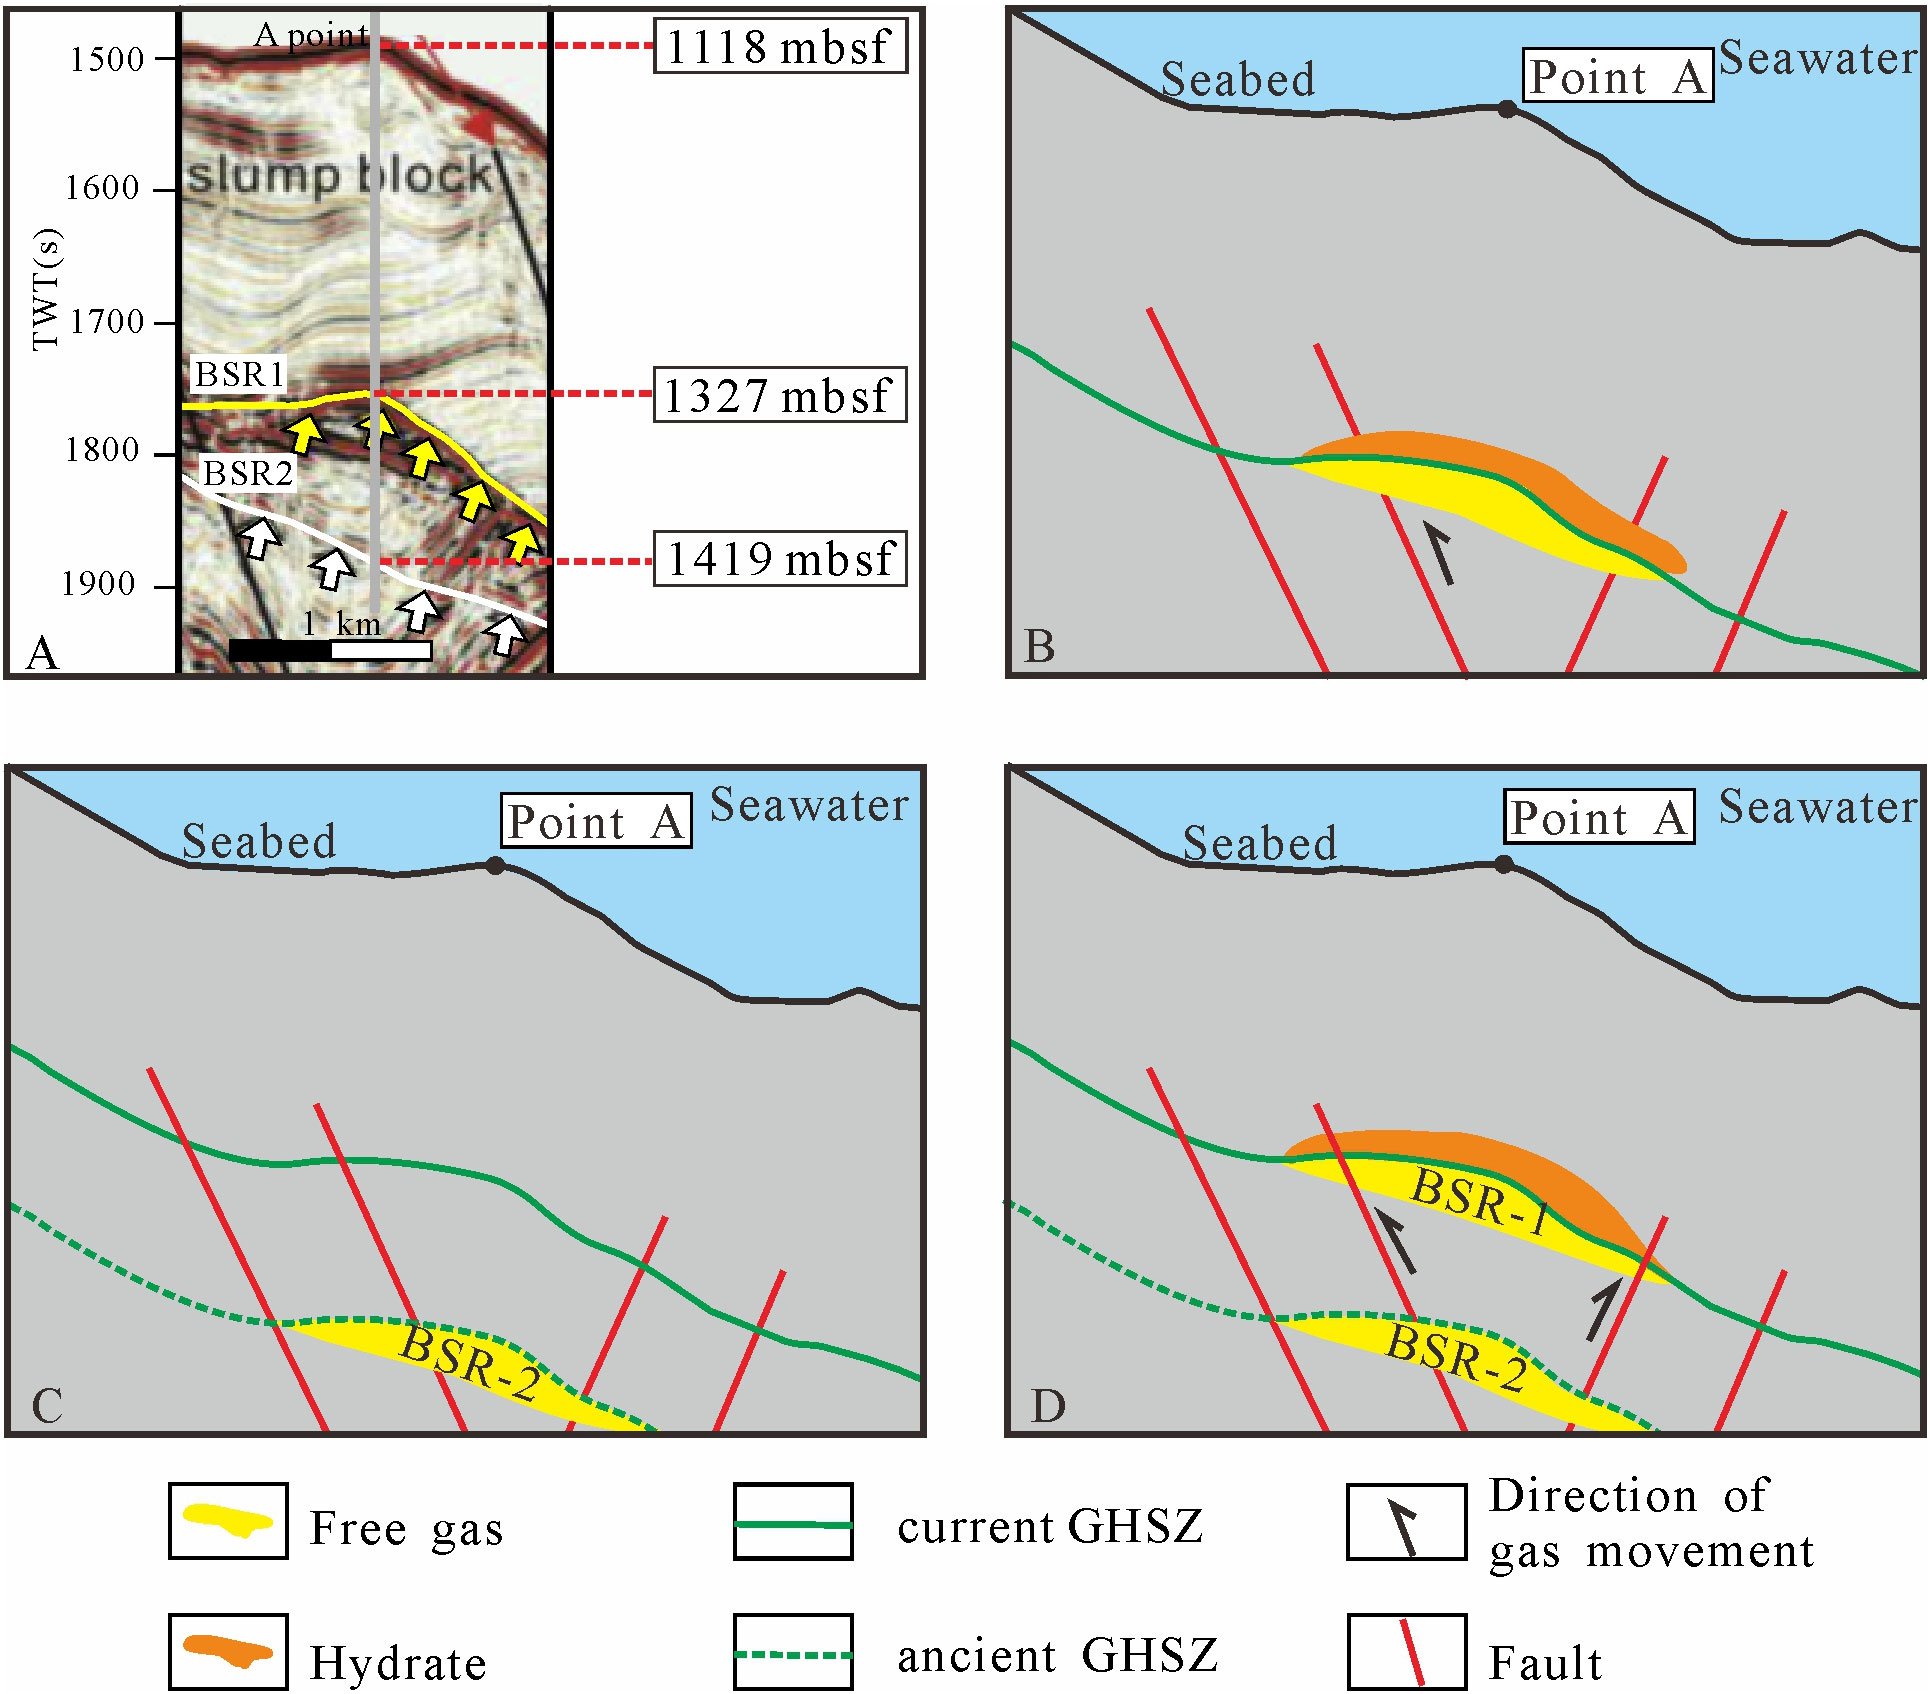
Figure 10 (A) Seismic refection characteristics of double BSRs across point A at Site W08 (modified from: Li et al., 2015). (B–D) Hydrate accumulation model of a double BSRs model due to thinning of the GHSZ at point A at Site W08.
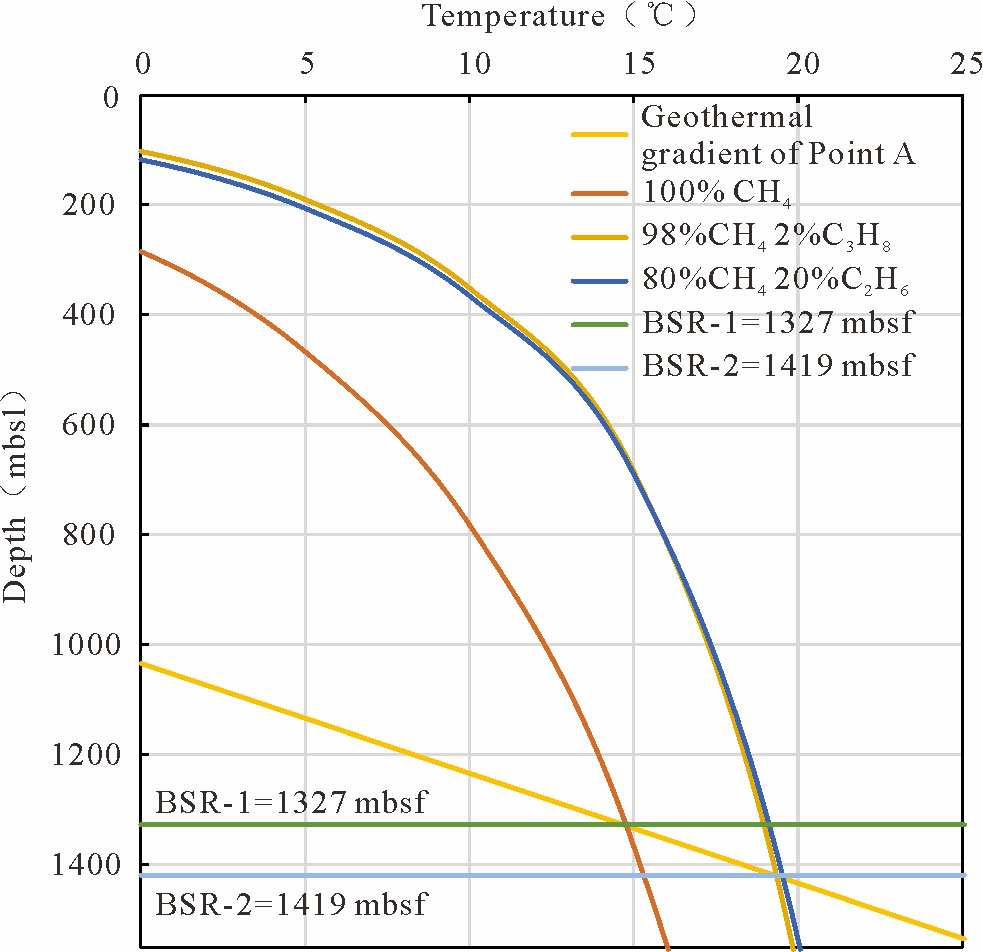
Figure 11 Calculation of the GHSZ with different hydrate gas compositions at point A at Site W08.
According to the factors of BSR-1 and BSR-2 at point A near Site W08, combined with the natural gas source, the variation of the GHSZ and the stages of hydrate accumulation and dissipation, the hydrate accumulation model of a double BSRs model due to thinning of the GHSZ at point A is proposed (Figure 10). Before 0.357 Ma, biogenic gas migrated to the GHSZ through faults, mud volcanoes and other channels to form gas hydrate and formed the early BSR (BSR-1) (Figure 10B). During 0.33-0.107 Ma, the thickness of the GHSZ at point A was reduced due to changes in the geothermal gradient and BWT. The formed hydrate and BSR (BSR-2) moved below the bottom boundary of the GHSZ, and the hydrate was destroyed (Figure 10C). If the permeability of the formation surrounding the early NGH was very low or there was little convection, and a large amount of free gas still existed in the original hydrate reservoir, the early BSR-2 did not disappear. During 0.107-0 Ma, biogenic gas generated in the late period of the hydrocarbon source range migrated to the GHSZ along faults and mud volcanoes, forming new hydrates and new BSR (BSR-1) (Figure 10D). The abovementioned characteristics of gas hydrate decomposition, migration, accumulation and dissipation due to the thickness change of the GHSZ and multistage biogas migration along the channel led to the formation of no gas hydrate above the deep BSR-2 at point A and the development of gas hydrate at the upper part of shallow BSR-1.
Sites W07, W08, W09 and W16 in the Dongsha region all contain multilayer hydrate development, as shown by drilling (Zhang et al., 2014b), and the formation of multilayer gas hydrate at some sites is also related to the variation of the GHSZ. For example, two hydrate layers were drilled at Site W16, the shallow hydrate layers were distributed 15 m to 30 m below the seafloor, and no obvious BSR was found below the hydrate. Hydrate existed in argillaceous siltstones and sandstones as nodules, and the saturation value were between 32% and 65%. Hydrate is distributed in the deeper layer 189 m to 226 m below the seafloor. Hydrate occurs in mud in dispersive and vein-like forms, and the saturation values are 24% to 36% (Zhang et al., 2014b; Wang, 2016; Zhang et al., 2017). A geochronological analysis of gas hydrate in this area shows that the shallow gas hydrate at Site W16 formed between 0.063 and 0.107 Ma, and the lower gas hydrate formed between 0.78 and 0.357 Ma (Zhang et al., 2017).
Combined with the historical variations of the GHSZ at Site W16, the hydrate accumulation model of a multilayer hydrate model due to the thickness change of the GHSZ at Site W16 is proposed (Figure 12). From 0.78 to 0.357 Ma, biogenic gas migrated to the GHSZ along faults, mud volcanoes and other channels and formed NGHs and BSRs (Figure 12A). After hydrate formation, the thickness of the GHSZ became thicker due to the decrease in the geothermal gradient, deeper seawater depth and lower BWT. Meanwhile, due to formation subsidence and deposition of new strata, the relative relationship between the GHSZ and formation changed, and the depth of hydrate occurrence became deeper (Figure 12B). During the period from 0.357 to 0.107 Ma, the thickness of the GHSZ first thickened, then became thinner, and then thickened due to the decrease, increase, and decrease in the BWT. However, the gas hydrate formed in the early stage was still located in the GHSZ (Figure 12C). Due to the decrease in the geothermal gradient and BWT, the thickness of the GHSZ became thinner, reaching to 214.70 m. At this time, the biogas generated by hydrocarbon source stokes migrated to the GHSZ along faults, mud volcanoes and other channels to generate new gas hydrates. If the free gas content in the lower part of the hydrate is high and the properties of the hydrate reservoir and underlying layer are different, a new BSR may also be formed. Otherwise, there may be no obvious BSR in the lower part of the hydrate (Figure 12D).
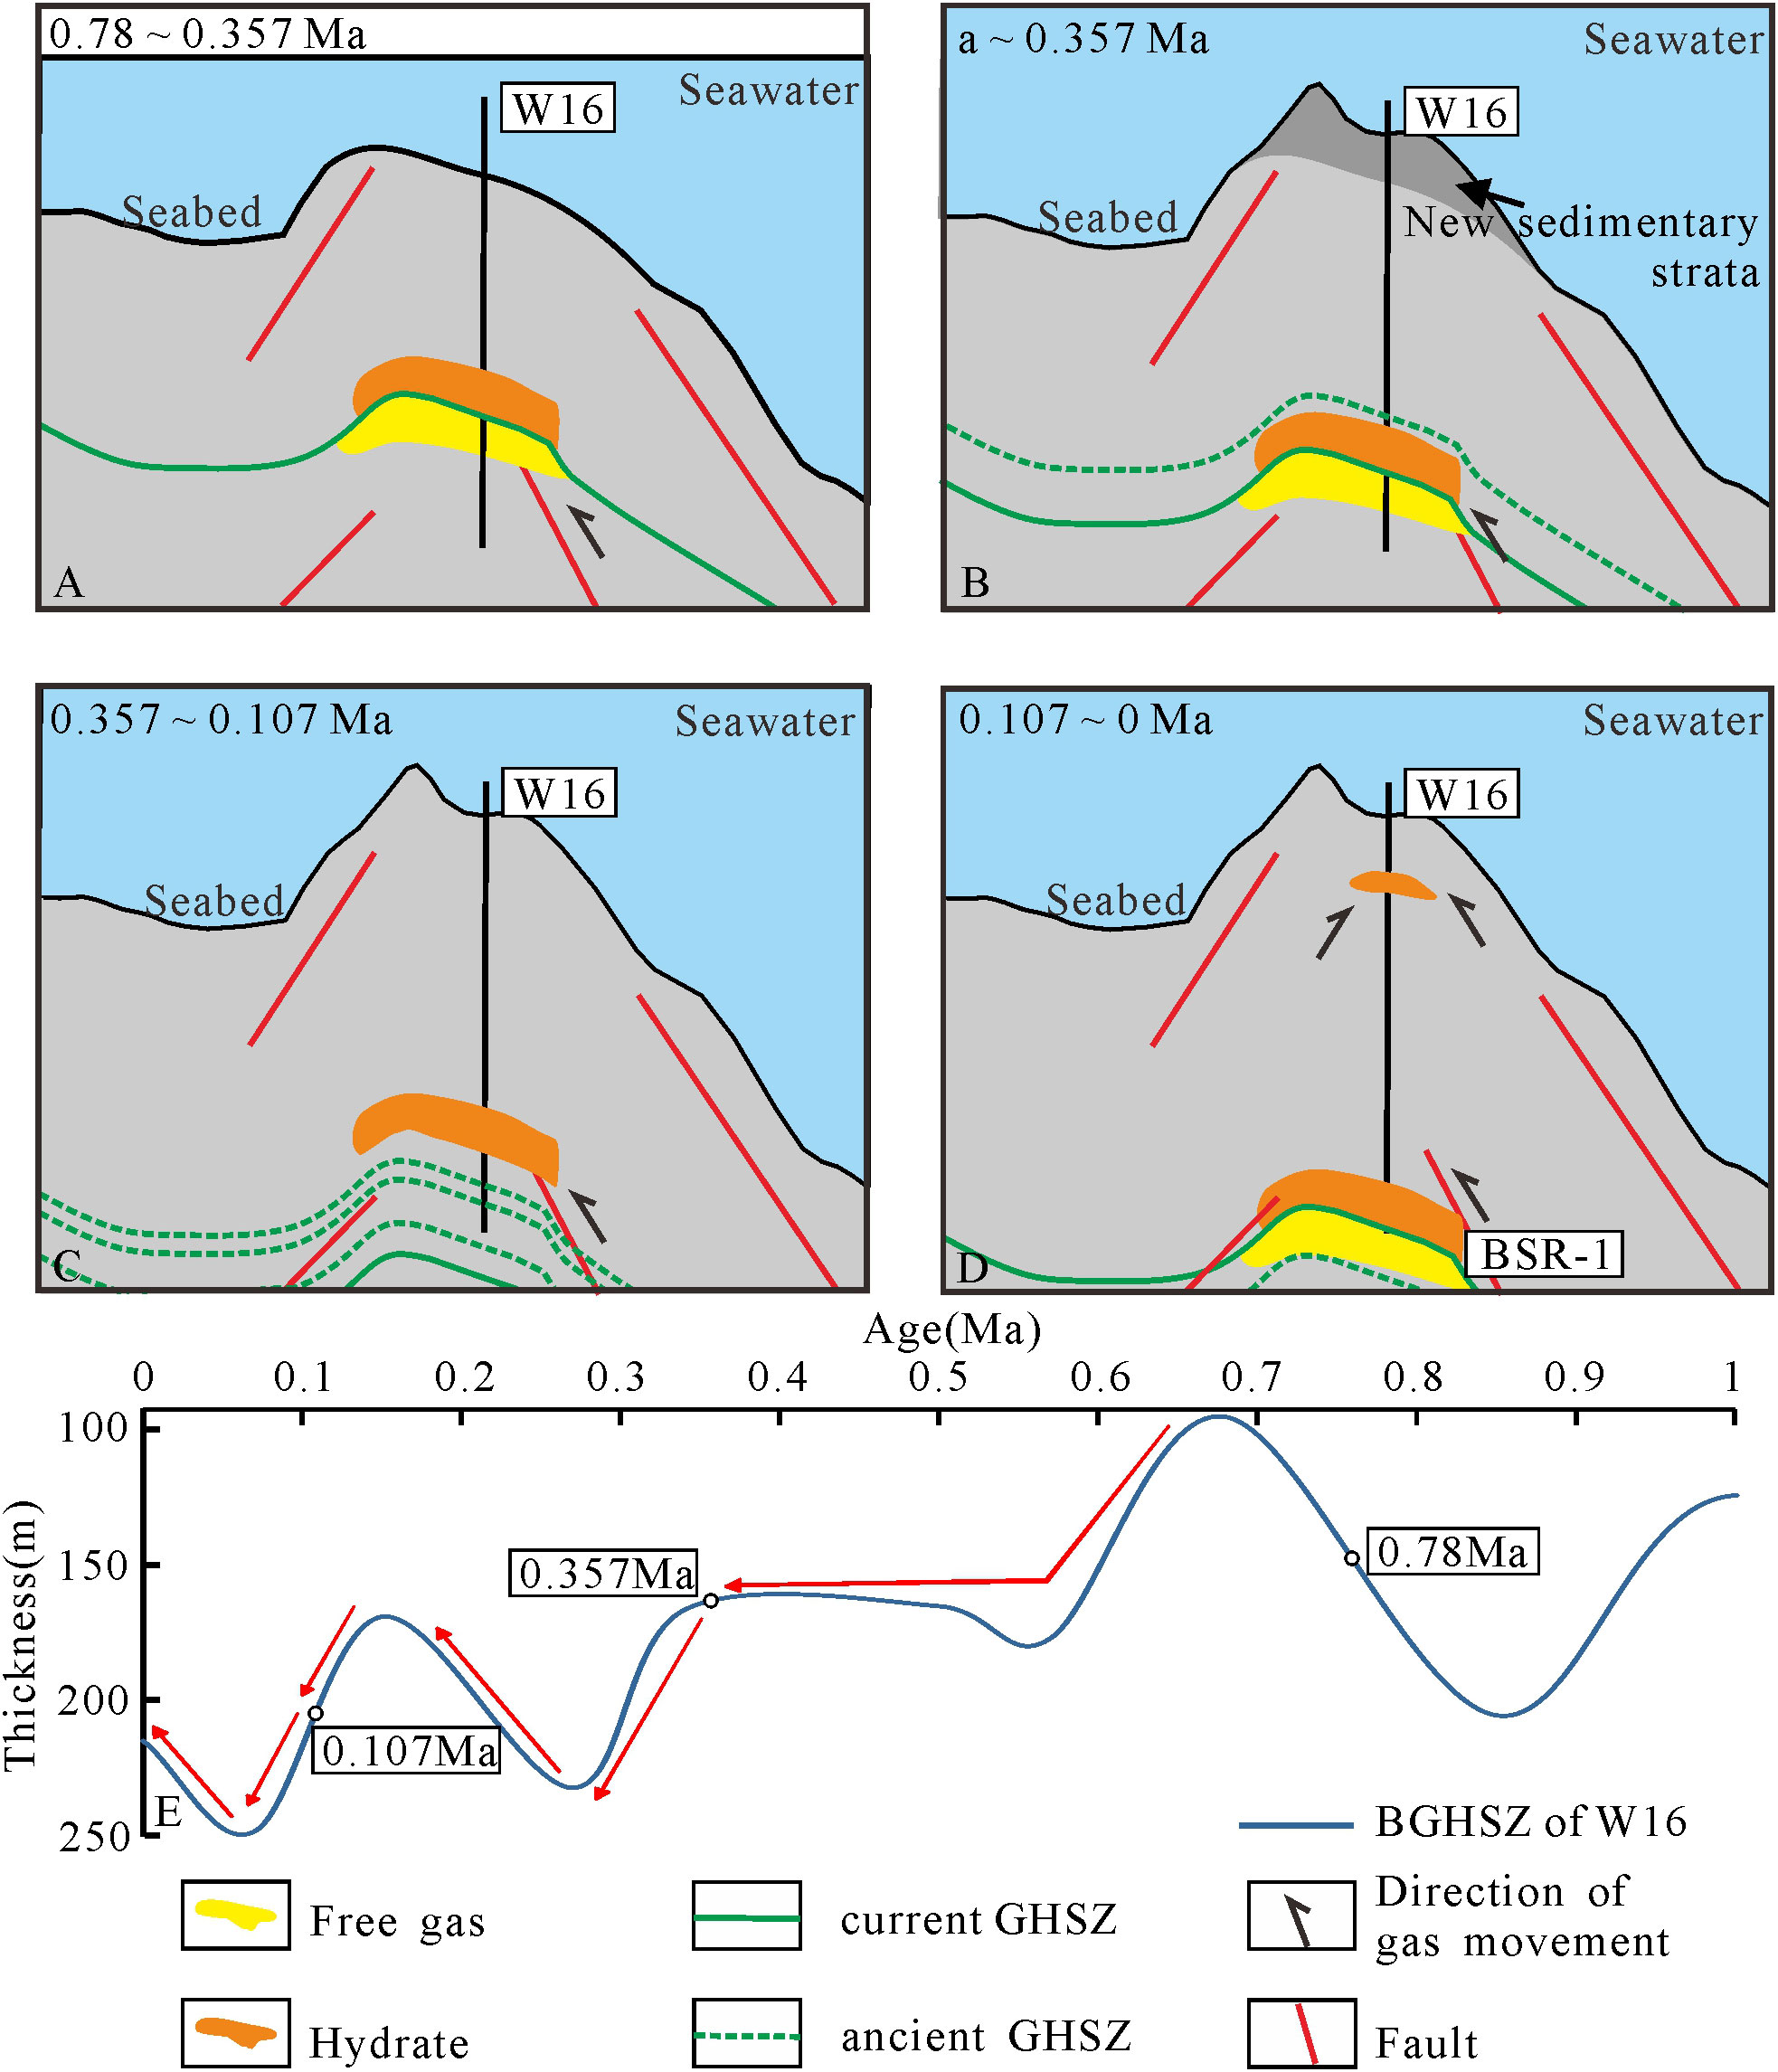
Figure 12 (A–D) Hydrate accumulation in a multilayer hydrate model due to thickness change in the GHSZ at Site W16. (E) Thickness variation in the GHSZ at W16 since 1 Ma.
The above analysis shows that the thickening, thinning and thickening process of the GHSZ is closely related to the dynamic accumulation processes of gas hydrate decomposition, migration, accumulation and dissipation due to changes in external conditions, such as the geothermal gradient and seawater depth. By understanding the processes of the GHSZ, the combination of hydrate formation time and geologic time, the gas source, the migration channel coupling relationship of the GHSZ, etc., which help in clarifying the dynamic accumulation processes of gas hydrate and to further understanding the hydrate and free gas, the spatial distribution pattern of BSRs, hydrates and corresponding relationship with the BSR is of great significance.
6 Conclusions
Based on the variations in seawater depth, BWT, geothermal gradient and other parameters in the Dongsha region, Taixinan Basin, South China Sea, the thickness variations of the GHSZ in the Dongsha region are studied, and two hydrate accumulation models of gas hydrate related to the thickness changes of the GHSZ are discussed.
1. During the period of 10 to 5.11 Ma, the thickness of the GHSZ in the study area was thin, with values ranging from 0 m to 100 m. The higher BWT was the key factor leading to the thinner thickness of the 10-5.11 Ma GHSZ. From 5.11 to 0 Ma, the GHSZ generally showed a trend of gradually thickening. However, due to the changes in the seawater depth, BWT, geothermal gradient and other factors, several fluctuations in thickness occurred. The decrease in the BWT was the key factor leading to GHSZ thickening during the period of 5.11 to 0 Ma. The thickness of the GHSZ reached a maximum at approximately 0.07 Ma, with values ranging from 125 m to 470 m. The thicknesses of the GHSZ are between 110 m and 415 m in the Dongsha region at present. The thickness of the GHSZ in the northeastern and northwestern regions is the thinnest. The present spatial distribution features of the GHSZ in the deep canyon area are thicker, with thicknesses generally between 225 m and 415 m, while the GHSZ in other areas is thinner, with thicknesses between 110 m and 225 m.
2. Two hydrate dynamic accumulation models related to the variation in the GHSZ in the Dongsha region, northern SCS. The first hydrate accumulation model is a double BSRs model that shows the formation as due to the thickness change in the GHSZ. The thinning of the GHSZ leads to the migration of the early hydrate and BSR out of the GHSZ to form the residual BSR in the lower part, and there is no hydrate development above the BSR. The gas in the late migration to the new GHSZ reaccumulates hydrate and forms a new BSR. The second hydrate accumulation model is a multilayer hydrate model, with single or multiple BSRs due to the general change in the thickness of the GHSZ.
Data availability statement
The original contributions presented in the study are included in the article material, further inquiries can be directed to the corresponding authors.
Author contributions
YS: Writing—review and editing, Visualization. YL: Make important revisions to the paper, Investigation, Supervision. LZ: Investigation, Supervision. MC: Conceptualization, Visualization, Investigation. LM: Make important revisions to the paper, Investigation. CL: Methodology, Investigation. NL: Formal analysis, Resources. All authors contributed to the article and approved the submitted version.
Acknowledgments
This study was supported by the Key Research Program of the Institute of Geology and Geophysics, CAS (IGGCAS-201903), National Natural Science Foundation of China (42030808), Strategic priority Research Program of the Chinese Academy of Sciences (XDA14010202). The authors would like to thank Professor D. Oppo and two reviewer for their constructive comments and suggestions.
Conflict of interest
The authors declare that the research was conducted in the absence of any commercial or financial relationships that could be construed as a potential conflict of interest.
Publisher’s note
All claims expressed in this article are solely those of the authors and do not necessarily represent those of their affiliated organizations, or those of the publisher, the editors and the reviewers. Any product that may be evaluated in this article, or claim that may be made by its manufacturer, is not guaranteed or endorsed by the publisher.
References
Bangs N. L. B., Musgrave R. J., Tréhu A. M. (2005). Upward shifts in the southern hydrate ridge gas hydrate stability zone following postglacial warming, offshore Oregon. J. Geophys. Res. 110 (3), 1–13. doi: 10.1029/2004JB003293
Bishnoi P. R., Dholabhai P. D. (1999). Equilibrium comditions for hydrate formation for a ternary mixture of methane, propane and carbon dioxide, and a natural gas mixture in the presence of electrolytes and methanol. Fluid Phase Equilibria 158-160 (5), 821–827. doi: 10.1016/S0378-3812(99)00103-X
Burwicz E., Reichel T., Wallmann K., Rottke W., Haeckel M., Hensen C.. (2017). 3-d basin-scale reconstruction of natural gas hydrate system of the green canyon, gulf of Mexico. Geochemistry Geophysics Geosystems 18 (5), 1959–1985. doi: 10.1002/2017GC006876
Collett T. S. (2009). “Gas hydrate petroleum systems in marine and Arctic permafrost environments,” in Unconventional energy resources: Making the unconventional conventional: 29th annual GCSSEPM proceedings (Houston, Texas: Gulf Coast Section of the Society of Economic Paleontologists and Mineralogists Foundation), 6–30. doi: 10.5724/gcs.09.29.0006
Dickens G. R., Quinby-Hunt M. S. (1994). Methane hydrate stability in sea water. Geophysical Res. Lett. 21 (19), 2115–2118. doi: 10.1029/94GL01858
Foucher J. P., Nouzé H., Henry P. (2002). Observation and tentative interpretation of a double BSR on the nankai slope. Mar. Geology 187, 161–175. doi: 10.1016/S0025-3227(02)00264-5
Gong J. L., Sun X. M., Lin Z. Y., Lu H. F., Lu Y. J. (2017). Geochemical and microbial characters of sediment from the gas hydrate area in the taixinan basin, south China Sea. Acta Oceanol. Sin. 36 (9), 52–64. doi: 10.1007/s13131-017-1111-2
Gong Y. H., Wu S. G., Zhang G. X., Wang H. B., Liang J. Q., Guo Y. Q., et al. (2008). Relation between gas hydrate and geologic structures in dongsha islands sea area of south China Sea. Mar. Geology& Quaternary Geology 28 (1), 99–104. doi: 10.16562/j.cnki.0256-1492.2008.01.013
Haacke R. R., Westbrook G. K., Hyndman R. D. (2007). Gas hydrate, fluid flow and free gas: Formation of the bottom-simulating reflector. Earth Planetary Sci. Letters. 261, 407–420. doi: 10.1016/j.epsl.2007.07.008
He J. X., Liu H. L. (2008). Petroleum geology and prospecting area of NSCS. 1st ed. (Beijing: Petropub), 34–67.
He J. X., Yan W., Zhu Y. H., Zhang W., Gong F. X., Liu S. L., et al. (2013). Bio-genetic and sub-biogenetic gas resource potential and genetic types of natural gas hydrates in the northern marginal basins of south China Sea. Natural Gas industry. 33 (6), 121–134. doi: 10.3787/j.issn.1000-0976.2013.06.023
Horozal S., Bahk J. J., Urgeles R., Kim G. Y., Cukur D., Kim S. P., et al. (2017). Mapping gas hydrate and fluid flow indicators and modeling gas hydrate stability zone (GHSZ) in the ulleung basin, East (Japan) Sea: Potential linkage between the occurrence of mass failures and gas hydrate dissociation. Mar. Petroleum Geology 80, 171–191. doi: 10.1016/j.marpetgeo.2016.12.001
Hu S. B., Long Z. L., Zhu J. Z., Hu D., Huang Y. P., Shi Y. L., et al. (2019). Characteristics of geothermal field and the tectonic-thermal evolution in pearl river mouth basin. Acta Petrol. Sin. 40 (S1), 178–187. doi: 10.7623/syxb2019S1015
Kroeger K. F., Crutchley G. J., Kellett R., Barnes P.M. (2019). A 3-d model of gas generation, migration, and gas hydrate formation at a young convergent margin (Hikurangi margin, new Zealand). Geochemistry Geophysics Geosystems 20 (11), 5126–5147. doi: 10.1029/2019GC008275
Kvenvolden K. A. (1993). Gas hydrates–geological perspective and global change. Rev. Geophysics 31 (2), 173–187. doi: 10.1029/93RG00268
Lear C. H., Coxall H. K., Foster G. L., Lunt D. J., Mawbey E. M., Rosenthal Y., et al. (2015). Neogene ice volume and ocean temperatures: Insights from infaunal foraminiferal Mg/Ca paleothermometry. Paleoceanography. 30, 1437–1454. doi: 10.1002/2015PA002833
Lei Y. H., Song Y. R., Zhang L. K., Miao L. C., Cheng M., Liu N. G. (2021). Research progress and development direction of reservoir-forming system of marine gas hydrates. Acta Petrolei Sin. 42 (06), 801–820. doi: 10.7623/syxb202106009
Li Y., Fang Y. X., Zhou Q. Z., Xu X. P., Liu J. Z., Zhou Y. G., et al. (2021). Geochemical insights into contribution of petroleum hydrocarbons to the formation of hydrates in the taixinan basin, the south China Sea. Geosci. Fronties 12, 100974. doi: 10.1016/j.gsf.2020.03.006
Li L., Liu H. J., Zhang X., Lei X. H., Sha Z. B. (2015). BSRs, estimated heat flow, hydrate-related gas volume and their implications for methane seepage and gas hydrate in the dongsha region, northern south China Sea. Mar. Petroleum Geology. 67, 785–794. doi: 10.1016/j.marpetgeo.2015.07.008
Liu P., Zhang X. T., Du J. Y., Cheng W., Tao W. F., Tao Y. (2018). Tectonic-thermal evolution process and the petroleum geological significance of relatively low geothermal gradient in a rift basin: An example from xijiang main sag in pearl river mouth basin. Geological Sci. Technol. Information. 37 (2), 146–156. doi: 10.19509/j.cnki.dzkq.2018.0221
Li Y., Zhou Q. Z., Xu X. P., Liu J. Z., Zhou G. Y., Fang Y. X., et al. (2020). Porewater geochemical and lipid biomarker signatures for anaerobic methane oxidation in the hydrate-bearing system from the taixinan basin, the south China Sea. J. Asian Earth Sci. 203, 104559. doi: 10.1016/j.jseaes.2020.104559
Majumdar U., Cook A. E., Shedd W., Frye M. (2016). The connection between natural gas hydrate and bottom- simulating reflectors. Geophysical Res. Lett. 43 (13), 7044–7051. doi: 10.1002/2016GL069443
Max M. D. (1990). Gas hydrates and acoustically laminated sediments: potential environmental cause of nomalously low acoustic bottom loss in deep ocean sediments. U.S. Naval Res. Lab. Rep. 9235, 68. Available at: https://apps.dtic.mil/sti/pdfs/ADA218418.pdf.
Miles P. R. (1995). Potential distribution of methane hydrate beneath the European continental margins. Geophysical Res. Letters. 20 (23), 3179–3182. doi: 10.1029/95GL03013
Milkov A. V., Sassen R. (2003). Two-dimensional modeling of gas hydrate decomposition in the northwestern gulf of Mexico: significance to global change assessment. Global Planetary Change. 36, 31–46. doi: 10.1016/S0921-8181(02)00162-5
Pang X., Chen C. M., Peng D. J., Zhu M., Shu Y., He M., et al. (2007). Sequence stratigraphy of deep-water fan system of pearl river, south China Sea. Earth Sci. Frontiers. 14 (1), 220–229. doi: 10.1016/S1872-5791(07)60010-4
Paull C. K., Ussler W. III, Dillon W. P. (1991). Is the extent of glaciation limited by marine gas-hydrates? Geophysical Res. Lett. 18, 432–434. doi: 10.1029/91GL00351
Pecher I. A., Villinger H., Kaul N., Crutchley G. J., Mountjoy J. J., Huhn K., et al. (2017). A fluid pulse on the hikurangi subduction margin: Evidence from a heat flux transect across the upper limit of gas hydrate stability. Geophysical Res. Lett. 44 (12), 385–395. doi: 10.1002/2017GL076368
Piñero E., Hensen C., Haeckel M., Wallmann K., Rottke W., Fuchs T., et al. (2014). “Gas hydrate accumulations at the Alaska north sloge: total assessment based on 3D petroleum system modeling,” in Proceedings of the 8th international conference on gas hydrate (ICGH8-2014) (Beijing, China: China Geological Survey and Chinese Academy of Sciences).
Rempel A. W., Buffett B. A. (1997). Formation and accumulation of gas hydrate in porous media. J. Geophysical Res. 102, 151–164. doi: 10.1029/97JB00392
Sha Z. B., Liang J. Q., Su P. B., Zhang G. X., Lu J. A., Wang J. L. (2015a). Natural gas hydrate accumulation elements and drilling results analysis in the eastern part of the pearl river mouth basin. Earth Sci. Front. 22 (06), 125–135. doi: 10.13745/j.esf.2015.06.009
Sha Z. B., Liang J., Zhang G. X., Yang S. X., Lu J. A., Zhang Z. J., et al. (2015b). A seepage gas hydrate system in northern south China Sea: seismic and well log interpretations. Mar. Geology 366, 69–78. doi: 10.1016/j.margeo.2015.04.006
Sha Z. B., Xu Z. Q., Fu S. Y., Liang J. Q., Zhang W., Su P. B., et al. (2019). Gas sources and its implications for hydrate accumulation in the eastern pearl river mouth basin. Mar. Geology& Quaternary Geology 39 (4), 116–125. doi: 10.16562/j.cnki.0256-1492.2019010902
Sloan E. D., Koh C. A. (2008). Clathrate hydrates of the natural gases. 3rd ed (Boca Raton, FL: CRC Press).
Song Y. R., Lei Y. H., Zhang L. K., Cheng M., Li C., Liu N. G. (2022). Spatial-temporal evolution of the gas hydrate stability zone and accumulation patterns of double BSRs formation in the shenhu area. Front. Earth Sci. 10. doi: 10.3389/feart.2022.880933
Wang Y. L. (2016). Accumulation conditions and distribution controlling factors of natural gas hydrate in dongsha prospect (Beijing: China University of Petroleum). doi: 10.3969/j.issn.1006-7175.2013.11.001
Wang H., Crutchley G. J., Stern T. (2017a). Gas hydrate formation in compressional, extensional and un-faulted structural settings-examples from new zealand’s hikurangi margin. Mar. Petroleum Geology 88, 69–80. doi: 10.1016/j.marpetgeo.2017.08.001
Wang J. J., Lau H. C. (2020). Thickness of gas hydrate stability zone in permafrost and marine gas hydrate deposits: Analysis and implications. Fuel. 282, 118784. doi: 10.1016/j.fuel.2020.118784
Wang Y. M., Liu S. W., Hao F. F., Zhao Y. L., Hao C. Y. (2017b). Geothermal investigation of the thickness of gas hydrate stability zone in the north continental margin of the south China Sea. Acta Oceanol. Sin. 36 (4), 72–79. doi: 10.1007/s13131-017-1014-2
Wang C., Lu J. H., Zhu R., Yu W. T. (2013). Validation on the applicability of TEOS-10 equation in the SCS based on WOA09 thermohaline data Vol. 19 (Water Conservancy Science and Technology and Economy), 9 (11), 1–6.
Xiao K., Zou C. C., Yang Y. X., Zhang H., Li H. X., Qin Z. (2020). A preliminary study of the gas hydrate stability zone in a gas hydrate potential region of China. Energy Sci. &Engineering. 8 (4), 1080–1091. doi: 10.1002/ese3.569
Yi H., Zhong G. J., Ma J. F. (2007). Fracture characteristics and basin evolution of the taixinan basin in Cenozoic. Petroleum Geology Experiment 29 (6), 560–564. doi: 10.3969/j.issn.1001-6112.2007.06.006
Zander T., Haeckel M., Berndt C., Chi W., Klaucke I., Bialas J., et al. (2017). On the origin of multiple BSRs in the Danube deep-sea fan, black Sea. Earth Planetary Sci. Lett. 462, 15–25. doi: 10.1016/j.epsl.2017.01.006
Zhang W. (2016). Research on the development and evolution of mud Diapir/Mud volcano and their relationship with migration and accumulation of petroleum and natural gas-hydrate in major basins, northern south China Sea (Guangzhou: University of Chinese Academy). doi: 10.3799/dqkx.2010.008
Zhang G. X., Chen F., Sha Z. B., Liang J. Q., Su X., Lu H. F. (2017). The geological evolution process of natural gas hydrate reservoirs in the northeastern south China Sea. Earth Sci. Front. 24 (4), 015–023. doi: 10.13745/j.esf.yx.2016-12-27
Zhang G. X., Liang J. Q., Lu J. A., Yang S. X., Zhang M., Holland M., et al. (2015). Geological features, controlling factors and potential prospects of the gas hydrate occurrence in the east part of the pearl river mouth basin, south China Sea. Mar. Petroleum Geology. 67, 356–367. doi: 10.1016/j.marpetgeo.2015.05.021
Zhang G. X., Liang J. Q., Lu J. A., Yang S. X., Zhang M., Su X., et al. (2014b). Characteristics of natural gas hydrate reservoirs on the northeastern slop of the south China Sea. Natural Gas Industry 11 (34), 1–10. doi: 10.3787/j.issn.1000-0976.2014.11.001
Zhang W., Liang J. Q., Qiu H. J., Deng W., Meng M. M., He Y. L., et al. (2022). Double bottom simulating reflectors and tentative interpretation with implications for the dynamic accumulation of gas hydrates in the northern slope of the qiongdongnan basin, south China Sea. J. Asian Earth Sci. 229, 105151. doi: 10.1016/j.jseaes.2022.105151
Zhang W., Liang J. Q., Wan Z. F., Su P. B., Huang W., Wang L. F., et al. (2020). Dynamic accumulation of gas hydrates associated with the channel-levee system in the shenhu area, northern south China Sea. Mar. Petroleum Geology. 117, 104354. doi: 10.1016/j.marpetgeo.2020.104354
Zhang G. X., Yang S. X., Zhang M., Liang J. Q., Lu J. A., Holland M., et al. (2014a). GMGS2 expedition investigates rich and complex gas hydrate environment in the south China Sea Vol. 14 (NETL), 1–5. Available at: https://www.netl.doe.gov/oil-gas/natural-gas-resources. Fire in the Ice (Methane Hydrate Newsletter).
Zhao S. J., Wu S. G., Shi H. S., Dong D. D., Chen D. X., Wang Y. (2012). Structures and dynamic mechanism related to the dongsha movement at the northern margin of south China Sea. Prog. Geophysics 27 (03), 1008–1019. doi: 10.6038/j.issn.1004-2903.2012.03.022
Keywords: the South China Sea, the Dongsha region, gas hydrate, gas hydrate stability zone, accumulation model
Citation: Song Y, Lei Y, Zhang L, Cheng M, Miao L, Li C and Liu N (2022) Spatial-temporal variations of the gas hydrate stability zone and hydrate accumulation models in the Dongsha region, China. Front. Mar. Sci. 9:982814. doi: 10.3389/fmars.2022.982814
Received: 30 June 2022; Accepted: 27 September 2022;
Published: 21 October 2022.
Edited by:
Davide Oppo, University of Louisiana at Lafayette, United StatesReviewed by:
Zenggui Kuang, Guangzhou Marine Geological Survey, ChinaFerdinando Cilenti, University of Louisiana at Lafayette, United States
Copyright © 2022 Song, Lei, Zhang, Cheng, Miao, Li and Liu. This is an open-access article distributed under the terms of the Creative Commons Attribution License (CC BY). The use, distribution or reproduction in other forums is permitted, provided the original author(s) and the copyright owner(s) are credited and that the original publication in this journal is cited, in accordance with accepted academic practice. No use, distribution or reproduction is permitted which does not comply with these terms.
*Correspondence: Yuhong Lei, bGVpeWhAbWFpbC5pZ2djYXMuYWMuY24=