 Leah B. Reidenbach
 Steve R. Dudgeon
 Janet E. Kübler
94% of researchers rate our articles as excellent or good
Learn more about the work of our research integrity team to safeguard the quality of each article we publish.
Find out more
ORIGINAL RESEARCH article
Front. Mar. Sci., 16 December 2022
Sec. Marine Ecosystem Ecology
Volume 9 - 2022 | https://doi.org/10.3389/fmars.2022.980657
This article is part of the Research TopicMacroalgal Blooms in a Global Change ContextView all 6 articles
Introduction: The coastal macroalgal genus, Ulva, is found worldwide and is considered a nuisance algal genus due to its propensity for forming vast blooms. The response of Ulva to ocean acidification (OA) is of concern, particularly with nutrient enrichment, as these combined drivers may enhance algal blooms because of increased availability of dissolved inorganic resources.
Methods: We determined how a suite of physiological parameters were affected by OA and ammonium (NH4+) enrichment in 22-day laboratory experiments to gain a mechanistic understanding of growth, nutrient assimilation, and photosynthetic processes. We predicted how physiological parameters change across a range of pCO2 and NH4+ scenarios to ascertain bloom potential under future climate change regimes.
Results: During the first five days of growth, there was a positive synergy between pCO2 and NH4+ enrichment, which could accelerate initiation of an Ulva bloom. After day 5, growth rates declined overall and there was no effect of pCO2, NH4+, nor their interaction. pCO2 and NH4+ acted synergistically to increase NO3- uptake rates, which may have contributed to increased growth in the first five days. Under the saturating photosynthetically active radiation (PAR) used in this experiment (500 μmol photon m-2 s-1), maximum photosynthetic rates were negatively affected by increased pCO2, which could be due to increased sensitivity to light when high CO2 reduces energy requirements for inorganic carbon acquisition. Activity of CCMs decreased under high pCO2 and high NH4+ conditions indicating that nutrients play a role in alleviating photodamage and regulating CCMs under high-light intensities.
Discussion: This study demonstrates that OA could play a role in initiating or enhancing Ulva blooms in a eutrophic environment and highlights the need for understanding the potential interactions among light, OA, and nutrient enrichment in regulating photosynthetic processes.
Coastal regions are affected by anthropogenic activities due to the close interaction among the sea, land, and atmosphere. Marine macroalgae in coastal regions are subject to many anthropogenically driven changes to the environment including nutrient enrichment and ocean acidification (OA). If historical trends of increased human population density in coastal zones are sustained into the future, increased nutrient supply to estuaries and lagoons is likely (Smith et al., 2003; Crossett et al., 2004; Bricker et al., 2008). Macroalgae in nutrient enriched coastal areas have attributes that contribute to rapid growth rates, such as high nutrient uptake and storage capacities, giving rise to a prolific abundance of macroalgal biomass (Valiela et al., 1997; Smetacek and Zingone, 2013).
The green, bloom-forming seaweed from the genus Ulva is an indicator of nutrient enriched systems and is considered a nuisance when large blooms occur. Conspicuous reoccurring green tide blooms on the coasts of the Yellow Sea, China, and on the beaches of Brittany, France have received attention due to their massive size and adverse effects on the ecosystem, tourism, and economy (Smetacek and Zingone, 2013). Green tide blooms are experienced on many coastlines in temperate and tropical ecosystems and the observed extent of blooms has expanded with increasing coastal nutrient enrichment (Morand and Briand, 1996; Teichberg et al., 2010; Ye et al., 2011). The consequences of such blooms can negatively affect marine and coastal ecosystems, particularly during the decomposition of thick algal mats that can lead to anoxia and toxic sulfide accumulation causing the mortality of seagrass and fauna (Viaroli et al., 2001; Holmer and Nielsen, 2007).
Macroalgal growth is typically limited by nitrogen, or co-limited by nitrogen and phosphorous concentrations, in marine ecosystems (Pedersen and Borum, 1996; Elser et al., 2007). Nitrate (NO3-) is the most abundant form of dissolved inorganic nitrogen (DIN) in the ocean and is typically found in concentrations of 0-30 μM in coastal waters while NH4+ concentrations are typically lower (ca. 3 μM) (Sharp, 1983). Most macroalgae favor uptake of NH4+, despite its relatively scarce availability, because it is less energetically demanding to assimilate than NO3- (Miflin and Lea, 1976). Southern California, one of the most densely populated regions in the United States, has estuaries with the highest nitrogen concentrations in the world (Kennison and Fong, 2014). High concentrations of NO3- and NH4+ suggest nitrogen is not limiting and supports the dominance of opportunistic species from the green algal genus Ulva (Fong and Zedler, 2000; Fry et al., 2003; Boyle et al., 2004; Kennison and Fong, 2014). Ulva spp. are the dominant algae in reported green tides and can form multispecies assemblages of the same genus (Fletcher, 1996; Guidone and Thornber, 2013). Ulva morphology contribute to their ability to obtain light and nutrients (Littler and Littler, 1980). They have a distromatic thallus (two cell layers) and a large surface area to volume ratio which is favorable for high nutrient uptake rates (Pedersen and Borum, 1997). The well-developed carbon concentrating mechanism (CCM) in Ulva is among the best understood and makes them an important taxon for studying the effects of OA on macroalgae (Maberly, 1990; Raven et al., 2014).
A gap in our understanding is how opportunistic, bloom-forming algal species, such as Ulva lactuca L., respond to dual environmental drivers of NH4+ enrichment and OA. OA, caused by increased absorption of CO2 from the atmosphere into seawater, is expected to increase total dissolved inorganic carbon (DIC) by increasing pCO2, bicarbonate (HCO3-), and carbonic acid (H2CO3) concentrations while decreasing carbonate (CO32-) concentrations and pH (Raven et al., 2005). Most DIC in seawater is in the form of HCO3- (ca. 90%) while dissolved CO2 makes up less than 1% (Feely et al., 2009). OA affects the speciation of nutrients in seawater and declining pH increases the NH4+ to NH3 ratio, making it more available for passive uptake by macroalgae (Raven et al., 2005). Macroalgae that exclusively use CO2 as a carbon source for photosynthesis may respond positively in terms of growth with OA, as they are presently DIC limited (Kübler et al., 1999; Kübler and Dudgeon, 2015). However, many macroalgae, including Ulva spp. use carbon concentrating mechanisms (CCMs), which enable utilization of HCO3- from seawater for photosynthesis and maintain a constant concentration of inorganic carbon inside the chloroplasts, regardless of the external pCO2 (Giordano et al., 2005).
Conversion of HCO3- to CO2 by Ulva spp. is catalyzed by carbonic anhydrase (CA) (Björk et al., 1993). CA can be utilized externally (CAext) followed by CO2 uptake or intracellularly (CAint) on HCO3- in the internal DIC pools (Fernandez et al., 2014). Either method of DIC utilization requires the use of nutrients and energy to synthesize CA proteins from amino acids (Mitsuhasi et al., 2000). CCM-using algae are CO2-saturated at present day pCO2, but increased passive uptake of CO2 with OA could result in downregulation of the production of CA resulting in energetic savings that could be diverted to enhanced growth and reproduction, fueling the initiation and duration of algal blooms (Raven, 1997; Giordano et al., 2005; Hepburn et al., 2011; Raven et al., 2011; Cornwall et al., 2012; Young and Gobler, 2016; van der Loos et al., 2019; Dudgeon and Kübler, 2020). The increased availability of NH4+ and CO2 for passive uptake in macroalgae with OA could lead to synergistic increases in growth rates through energetic cost savings in acquiring those nutrients required for growth.
Carbon and nitrogen metabolisms are linked processes, as products of photosynthetic pathways are used for the synthesis of amino acids (Turpin, 1991). Thus, metabolic processes downstream of carbon uptake, such as carbon and nitrogen metabolism, could be affected by OA and may lead to interacting effects when OA and nitrogen enrichment occur simultaneously. Light reactions from photosynthesis provide the ATP and NADPH for the Calvin cycle where the enzyme ribulose bisphosphate carboxylase/oxygenase (RUBISCO) fixes CO2 into triose phosphate (TP). Then, TP can be stored as starch or converted into pyruvate, which is used in the citric acid cycle where 2-oxoglutanate (2-OG) is synthesized and used for N-assimilation via the glutamine synthetase-glutamine: 2-oxoglutarate aminotransferase (GS/GOGAT) pathway (Turpin, 1991). Thus, photosynthesis is critical for stimulating N-assimilation (Thacker and Syrett, 1972), therefore limitation in the passive uptake of CO2 may be limiting growth, photosynthesis, and nutrient uptake and assimilation in nutrient replete macroalgae at present day pCO2 levels. Because carbon and nitrogen metabolisms are intricately linked, it is important to understand the potential effects of the interaction between OA and nitrogen enrichment on macroalgae.
With OA and nutrient enrichment co-occurring with increasing frequencies along coastlines, we want to understand how a bloom-forming green alga, Ulva lactuca, from Southern California, will respond to several weeks of exposure (ca. 22 days) to a range of pCO2 and NH4+ concentrations. We hypothesized that (1) U. lactuca growth and maximum photosynthetic rates (Pmax) would respond positively to increasing pCO2 and NH4+ and that there would be a synergistic response where elevated pCO2 increases the nutrient uptake and synthesis abilities of this opportunistic alga, (2) under carbon and nitrogen sufficiency, nitrogen storage would shift from intracellular pools to stored protein because of the increase in upstream photosynthetic processes and (3) carbon concentrating mechanisms will decrease with increasing pCO2 (as indicated by the increased discrimination of carbon stable isotopes (Δ13C)), resulting in energetic savings that can be diverted towards growth under nutrient sufficiency. Understanding the physiological mechanisms of nutrient and carbon uptake and utilization, which are evolutionarily conserved among species in the genus Ulva, under shifting environmental conditions can provide insight into predicting relative risk of Ulva bloom formation under various pCO2 and NH4+ scenarios.
Ulva sp. (morphologically identified as Ulva lactuca) was collected from a rocky beach in Malibu, CA (34°02’29.0”N 118°34’03.2” W) on May 26, 2016 for trial 1 and July 5, 2016 for trial 2. Morphological identification of U. lactuca was considered sufficient given that the physiological mechanisms of DIC and DIN uptake and operation are evolutionarily conserved above the species level in Ulva (Turpin, 1991; Raven, 1997). Nevertheless, dried samples are available for DNA sequence analyses. Thalli were collected from boulders in the intertidal zone, placed in re-sealable plastic bags with seawater and transported to the laboratory in a cooler, on ice, within two hours. Once in the lab, thalli were held in aerated, autoclaved seawater with Provasoli Enriched Seawater (PES) media (Provasoli, 1968) at approximately 17°C under 500 μmol photon m-2 s-1 light with 12-hour light, 12-hour dark cycle. PES media was supplied every two to three days for a period of ten to eleven days. This allowed thalli to grow to sizes large enough for the experiment and the PES media assured that samples were nutrient replete at the start of the experiment. The light sources used during the experiment were Apache Tech 120 LED light panels (Apache Tech LED, Santa Clara, CA, USA) with a 3:1 white:blue light ratio with a 14° angle lens intended to simulate shallow marine environments. Light intensity was measured using a Li-Cor LI-250 flat, cosine-corrected quantum sensor (Li-Cor, Lincoln, NE, USA) held on the chamber bottom by a leveling device thereby positioning it in media in the middle of the chamber, directed upwards towards the light source.
The effects of pCO2 across 20 different levels of pCO2 (ranging from [minimum] 177-1376 ppm [maximum]) on Ulva lactuca growth, nutrient, and photosynthetic physiology were evaluated across a range of NH4+ concentrations in two 22-day trials (Table S1). Values across this range of pCO2 were desired to characterize the physiological response of Ulva to representative historical, present and projected future levels of pCO2 under eutrophic conditions. We used a multiple regression design with the measured values of pCO2 and NH4+ in each culture pot as predictor variables because our interest was in characterizing the functional relationship of physiological responses across a range of each predictor variable. Each culture pot served as an independent replicate (20 in total). For each response variable there was only a single datum per culture pot (combination of pCO2 and NH4+); observations from more than one plant per pot (i.e., subsamples) for all response variables were averaged to provide the estimate for the pot. In the case of growth estimates, biomass of all plants were summed to estimate growth for each pot in batch culture between each time interval.
Two separate trials of the experiment were done because logistical constraints of setting up the complete range of pCO2 levels with gas mixing systems in the temperature controlled growth chamber prevented setting up all treatments contemporaneously as a single trial. The power of regression analyses to detect effects caused by predictor variables is proportional to the number of levels of predictor variables, hence we sought to maximize the number of levels of predictor variables. Additionally, examining variation among trials done at different times provides insight into how responses of subjects to hypothesized predictors may depend on current physiological state influenced by recent environmental history and current environmental conditions. We sought this information about the potential context dependence of effects. Trials of 22 days were conducted because our prior work with Ulva and other macroalgae indicates that phenotypic responses to experimental environments are manifest typically 8 to 21 days following initiation (e.g., Dudgeon et al., 1990).
Each culture tank was aerated with a specific ratio of mixed gases (N2, O2, and CO2) from a mass flow controlled (MFC) gas mixing system (Qubit Systems, Ontario, Canada). One mixing system delivered mixed gas to four culture tanks each (Figure 1). However, the final pCO2 level differed in each culture tank due to variability in airflow rates, mixing, bubble sizes, and seaweed biomass to seawater volume ratios (Figure S1). Peristaltic pumps delivered autoclaved seawater with modified PES from header tanks to each 3 L cylindrical culture tank. Each culture tank was randomly assigned to a MFC gas mixer and NH4+ concentration (ambient or high). Modifications to the PES media included using 1/50 strength nitrate and phosphate and replacement of ferrous ammonium sulfide with iron (III) chloride (see Provasoli, 1968). PES modification was necessary to manipulate levels of NH4+, while providing adequate nitrogen concentrations in the form of NO3- to ambient NH4+ treatments. Completely removing nitrogen did not allow for long-term culture of U. lactuca in preliminary trials. A stock solution of ammonium chloride was added to the NH4+ enriched header tanks to a final NH4+ concentration of 20 μM. Culture tanks contained a volume of 3 L each, and as new seawater was delivered using peristaltic pumps, wastewater spilled out of tubing at the surface of the water, creating a flow-through system. Prior to the start of the experiments, the flow-through system was checked with fluorescent dye to verify that incoming media was well mixed with the seawater in the container before wastewater spilled out. On average, culture tank seawater was completely replaced every 36 hours. The entire culture system was maintained in a cold room with a set air temperature of 17°C. Water temperature in the tanks varied throughout the light cycle reaching up to 19.9°C during the light cycle and 15.3°C during the dark cycle (Figure S2).
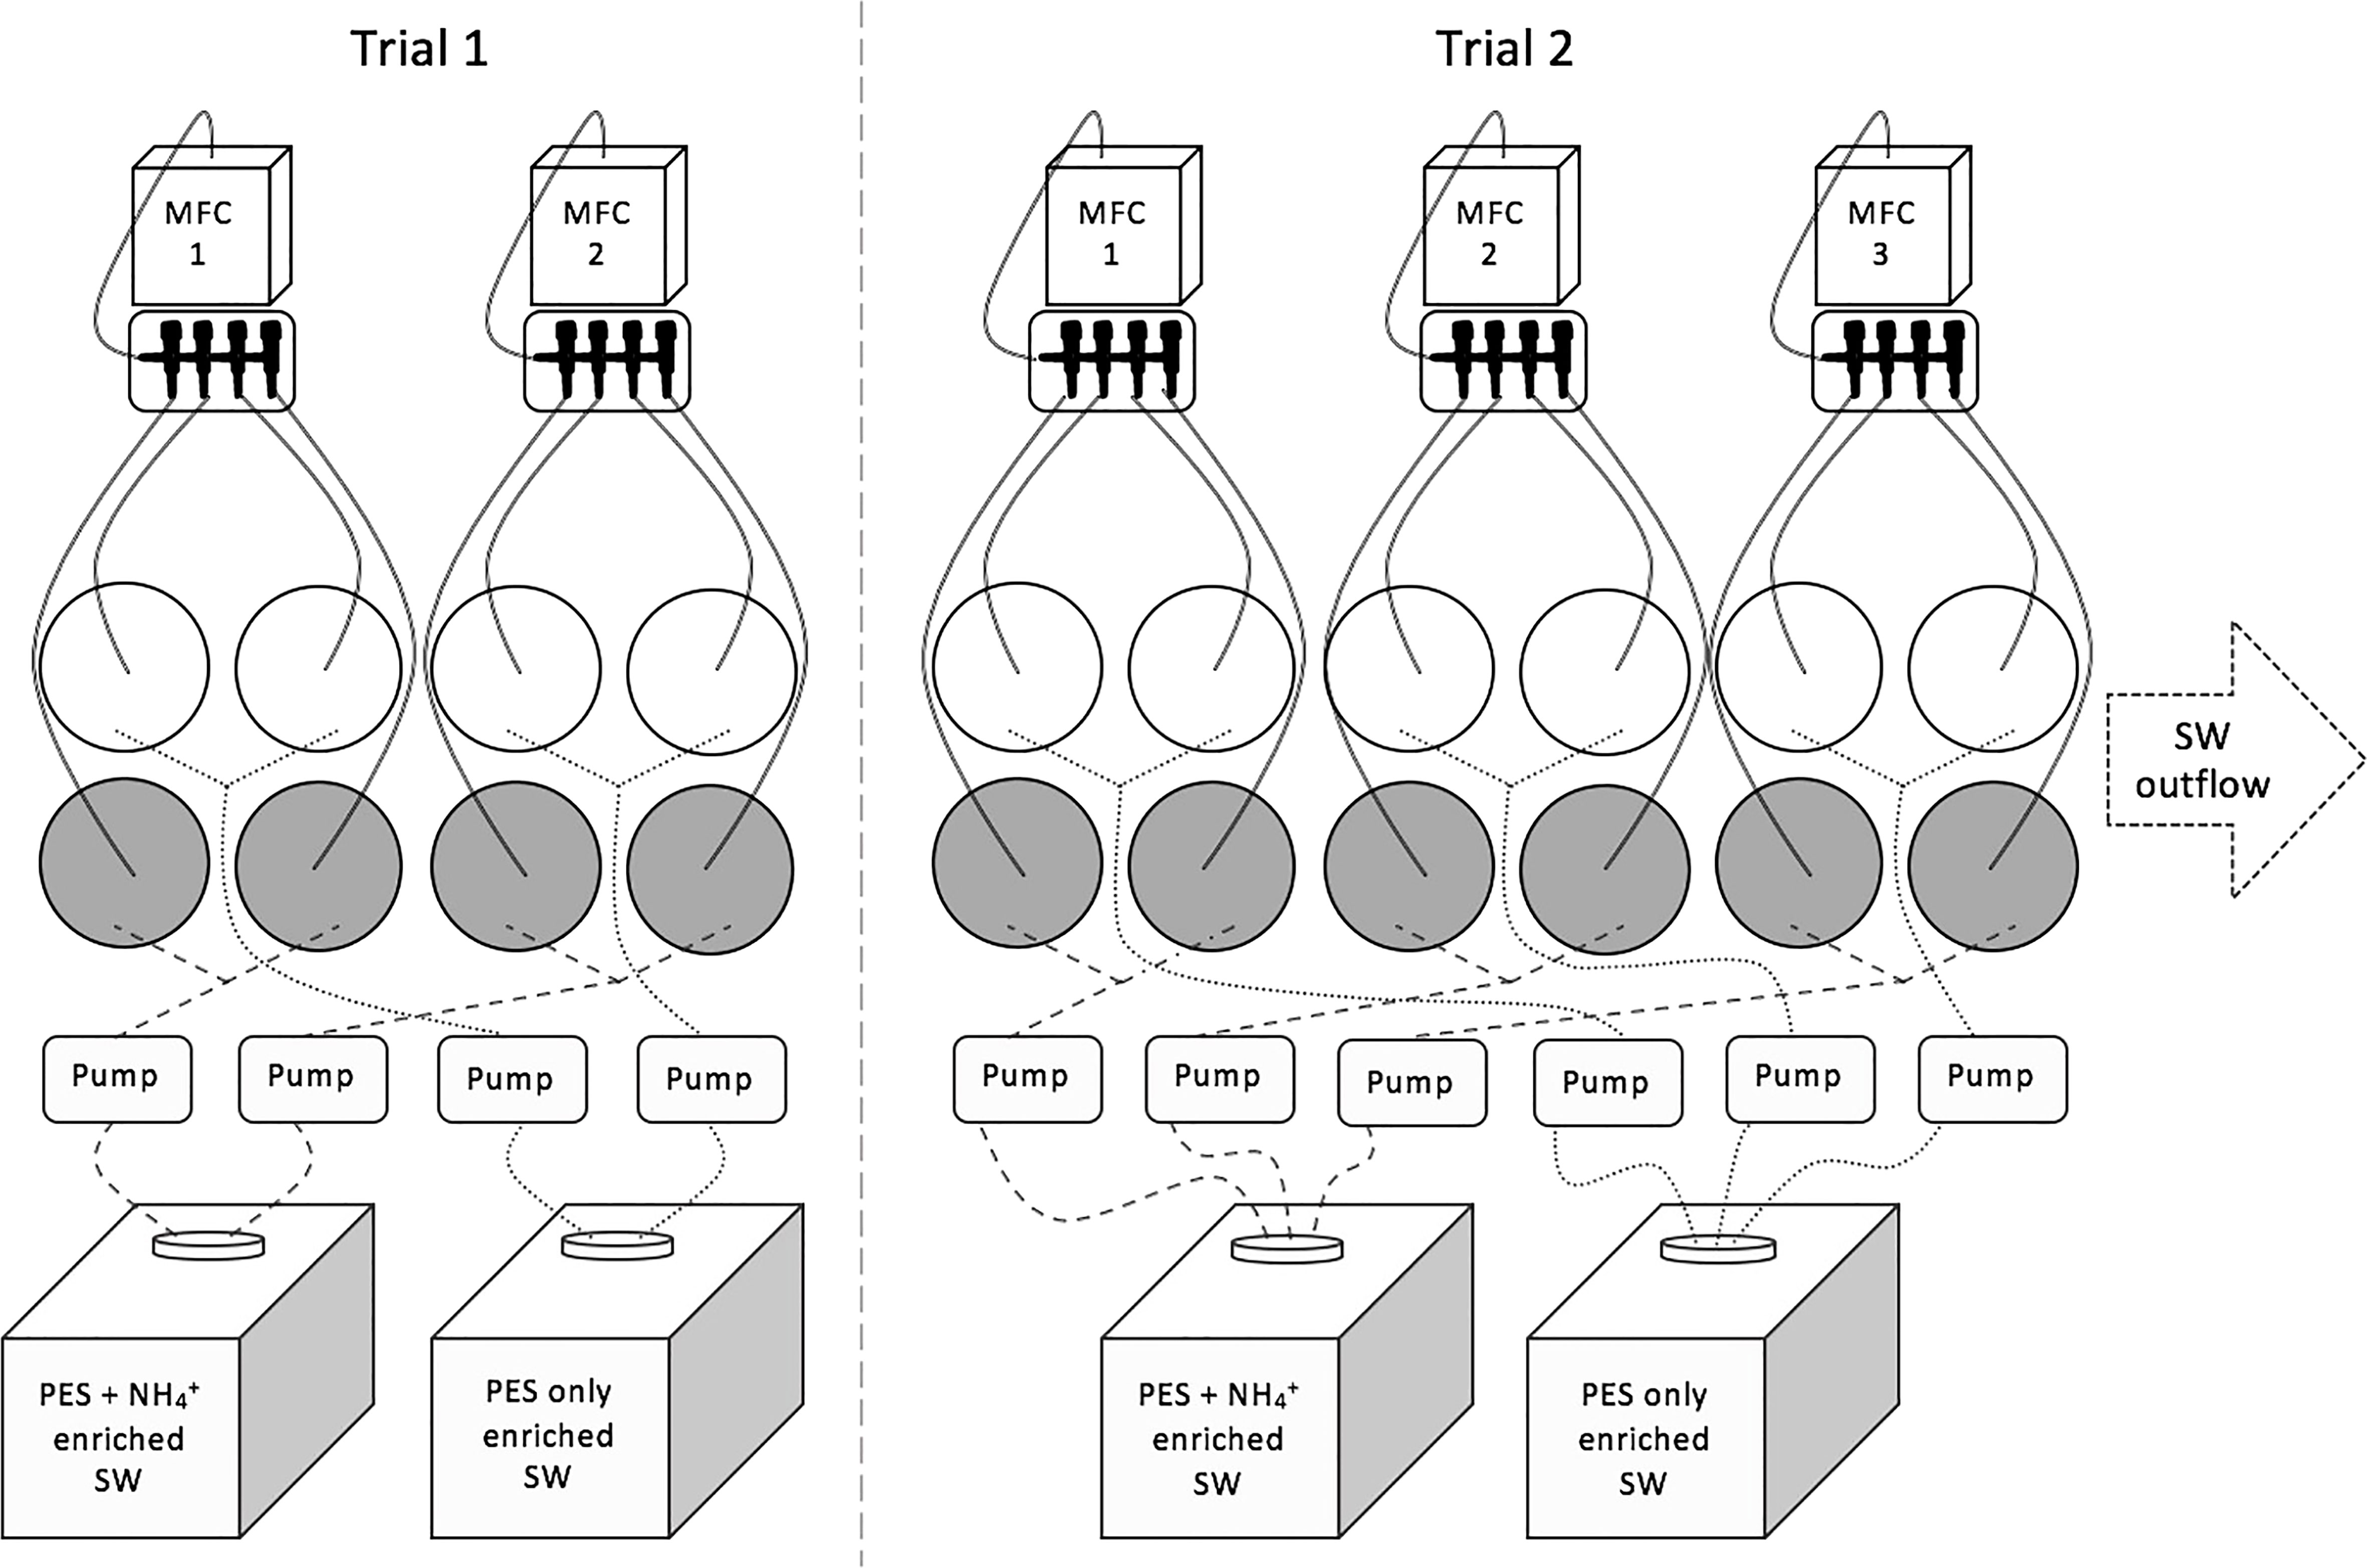
Figure 1 Conceptual diagram of experimental set-up. Mass flow controllers were connected to N2, O2, and CO2 gases. Each mass flow controller aerated four culture tanks (grey circles = NH4+ enriched, white circle = non-NH4+ enriched). Header tanks with 20 L of seawater (SW) with modified PES and either NH4+ enriched or not, connected to peristaltic pumps that delivered the SW medium to culture tanks. Each culture tank was connected to seawater outflow (connections not shown). Connections to mass flow controllers and headers tanks were randomly selected.
Six Ulva lactuca thalli with a total fresh weight of 0.41 ± 0.06 g (mean ± SEM) were grown in each culture tank for 22 days under 500 μmol photon m-2 s-1 light with a 12-hour light, 12-hour dark cycle. The biomass to seawater ratio maintained in each culture tank was ~0.14 g fresh weight of Ulva per liter of seawater. Six thalli were used to ensure that there was sufficient material available for all variables being measured and to help maintain the biomass to volume ratio. Using a sterile razor blade, pieces of thalli were removed weekly from the culture tanks to restore seaweed biomass to seawater volume ratio. The six thalli in each pot were small (each ~65-70 mg fresh weight) and easily carried by water motion in each pot. Water motion provided by a large cubic air stone in the middle, bottom of each culture pot produced tiny bubbles of mixed gases in streams around the periphery of the pot that circulated the thalli continuously in batch culture, thereby minimizing shading among thalli. Photosynthetic characteristics were measured during the last week of each three-week trial and samples for physiological measurements were collected during the last three days of each trial.
Carbonate chemistry parameters were calculated multiple times during each trial using measurements of pH and total alkalinity (AT) (Table S1). AT samples were collected in 50 mL Falcon tubes, stored wrapped in Parafilm at 4°C in the dark, and analyzed within two weeks by potentiometric titration coupled to a pH electrode (Mettler Toledo DGi-115-SC with T5 Rondolino) and thermometer. Most AT samples were measured on the day of sampling. The performance of the machine was checked with each measurement using certified reference material (CRM) from the Dickson laboratory at the Scripps Oceanographic Institute and the pH electrode was calibrated using TRIS buffer (Dickson et al., 2007). A spectrophotometric technique using m-cresol as an indicator dye was used to determine pHT (pH total scale). AT was calculated using potentiometric titration data and pHT using spectrophotometric data in the R-package Seacarb V 3.0.14 (Lavigne et al., 2011).
pHT was calculated from daily measurements of conductivity, salinity, and temperature (Thermo scientific, OrionStar A329) 3 hours after the start of the light cycle (Figure S3). The conductivity meter was calibrated with TRIS buffer. Daily pHT monitoring allowed us to adjust MFC rates to target set points as Ulva lactuca thalli grew, increasing the seaweed biomass to seawater volume ratio, which in turn, altered pCO2 levels.
20 mL scintillation vials were used to collect water samples throughout a trial. Measurements were taken 1-2 times per week (including measurements from the nutrient uptake measurements on day 20). Vials were cleaned with Milli-q water, dried, and then soaked in orthophthaldialdehyde (OPA) for 24-48 hours to remove NH4+ residue adhered to the glass (Holmes et al., 1999). Then, each vial was rinsed with Milli-q water to remove OPA residue and air-dried. Samples were collected with a 5 mL pipette using new pipette tips. First, the vial was rinsed with 10 mL of the seawater sample, and then 15 mL were collected and frozen at 0°C until analysis for NH4+ and NO3- concentrations.
NH4+ concentrations in the culture tanks were measured with a fluorometric method using OPA (Holmes et al., 1999) with the suggested modifications of Taylor et al. (2007), which included using an improved method for measuring background fluorescence. The raw fluorescence measurement of a sample was calibrated to a standard curve of an NH4+ stock solution using the standard additions protocol I of Taylor et al. (2007) which accounts for matrix effects that can alter fluorescence measurements.
NO3- concentrations in the culture tanks were determined from samples sent to the University of California, Santa Barbara Marine Science Institute Analytical Lab and were analyzed using a Lachat Instruments flow injection analysis instrument (QuikChem 8000) that determine NO3- + NO2- concentrations. NO2- is typically found in seawater as the oxidized form NO3- therefore the NO3- + NO2- concentrations were a proxy for the NO3- concentrations.
The fresh weights of the Ulva lactuca thalli were used to determine the relative growth rates (RGR). Measurements were taken on days 0, 5, 10, and 20, and the RGR was determined for each period (days 0-5, 5-10, and 10-20). Plants were blotted with tissue paper to remove excess water. The RGR was calculated using the following formula:
Where FWi is the initial fresh weight, FWf is the final fresh weight, and ∆t is the time interval. This formula expresses the growth per day as a percentage of the initial weight of the algae at the start of each interval. Biomass of all plants were summed to estimate growth for each pot in batch culture between each time interval, including masses of trimmed portions of thalli during the experiment.
Photosynthetic O2 evolution was measured using the Qubit systems O2 electrode in a water-jacketed cuvette connected to a laptop using a LabPro™ interface. Small pieces of Ulva lactuca (1-2 cm2) were cut from thalli at least one hour prior to measurements. The pieces were placed in 20 mL of culture water at 16°C in a 2 cm2 mesh bag which held the pieces at a 90° angle to the Qubit LED light source. A photosynthesis-photon flux density (P-E) curve was generated using various photon flux densities from 0-700 μM photons m-2 s-1 for 200 seconds each, following a 200 second dark period to measure dark respiration rate. The maximum photosynthetic rate (Pmax), light saturation point (Ek), and photosynthetic efficiency (the initial slope of the P-I curve, α) were determined from the P-E curves.
Chlorophyll a was extracted in dimethylsulfoxide (DMSO) and methanol according to the methods of Duncan and Harrison, 1982. Pieces of Ulva lactuca tissue (0.5 g FW) were placed in 1.25 mL of 80% DMSO for 10 minutes, and then suspended in two sequential 3 mL solutions of methanol for 10 min each to complete the extraction. The absorbance of the DMSO and methanol were measured using a spectrophotometer at the wavelengths indicated in the formulas below. The absorbance at each wavelength, volume of solvent, and the fresh weight of a fragment were used to calculate the concentration of Chl a from each solvent using the following formulae:
The Chl a concentration was the sum of the concentrations of the DMSO and methanol extracts.
Internal NH4+ and NO3- pools were measured using the boiling water method (Hurd et al., 1996). One piece (0.04 ± 0.02 g FW, mean ± SEM) from each treatment was rinsed with deionized water to remove salt and nutrients on the surface. The pieces were placed in test tubes with 15 mL of deionized water and placed in a boiling water bath for 40 minutes. The water was decanted and analyzed for NH4+ and NO3-. This process was repeated on the same algal piece three times and the concentrations of internal soluble NH4+ and NO3- pools were calculated using the sum of the NH4+ and NO3- concentrations of the three water samples of each algal piece.
Uptake rates of NH4+ and NO3- were measured in situ on day twenty of the trials 8-10 hours into the light cycle for a period of one hour. The formula for chemostat nutrient uptake by Carmona et al. (1996) was used to determine nutrient uptake rates:
where Ci and Cout = concentrations of nitrogen in the inflow and the outflow of the system (μmol), respectively; V = volume (L), Q = flow rate (L d-1); B = total biomass (g DW L-1), and ∆t = time in days. To preserve algal tissue for subsequent physiological measurements, subsamples were used to determine the total dry weight for each culture tank. The total fresh weight was measured for each culture tank. Then, the fresh weight to dry weight ratio was determined using the average of three pieces (0.03 ± 0.003 g FW, mean ± SEM) from each treatment and used to estimate the dry weight (DW) for the algal tissue in each culture tank.
An in vivo assay of nitrate reductase activity (NRA) was done according to the methods of Thompson and Valiela (1999). The incubation medium consisted of a spike of NO3-, a permeabilizer (propanol) which enhances the entry of NO3- and exit of NO2- to and from the reduction site in cells, and a potassium phosphate buffer to optimize NRA pH (Corzo and Niell, 1991). First, 5 mL of the incubation medium (equal parts 60 mM KNO3, 5% propanol, 0.1 M KH2PO4 and deionized water; pH 8.0) was flushed with N2 gas for 2 minutes. Ulva lactuca pieces (0.12 ± 0.07 g, mean ± SEM) from each treatment were placed in the incubation medium and were flushed again for 2 minutes with N2 gas. After a 60 min incubation period in the dark at 23°C, 1 mL of the sample was added to a stop buffer (0.5 mL 0.1% napthylethylene diamine, 0.5 mL 5% sulfanilamide, and 2 mL distilled water) resulting in a colorimetric reaction with NO2- produced via NRA under dark, anoxic conditions. Absorbance was measured at 540 nm. Readings were calibrated against a nitrite (NO2-) standard curve. NRA is reported as μmol NO2- g-1 FW h-1.
Pieces of Ulva lactuca tissue (0.04 ± 0.004 g FW, mean ± SEM) were ground in a mortar and pestle in 2 mL of a β-mercaptoethanol buffer, pH 7.5 and stored at 4°C for up to 72 hours. The extract was centrifuged at 16,000 g for 5 minutes. Soluble proteins and carbohydrates were determined spectrophotometrically (Milton Roy Spectronic Genesys 5) using the supernatant fraction. Soluble proteins were determined according to Bradford (1976) and soluble carbohydrates were determined using the phenol-sulfuric acid method according to Kochert (1978).
Samples for tissue organic carbon and nitrogen content, tissue stable carbon isotopes, and seawater carbon stable isotopes were collected on day 20. Tissue samples were dried for 24 hours at 60°C. Dried samples were prepared for analysis by homogenizing samples using a metal laboratory scoop, cleaned with ethanol between each sample, which resulted in a fine power. Then, approximately 3 mg of the Ulva lactuca tissue powder was measured using an analytical balance (Mettler Toledo XP205) into a tin capsule and carefully enclosed with clean forceps. The tin capsules were put into 96-well tray plates and sent to the University of California, Davis Stable Isotope Facility (UCD-SIF). The samples were analyzed for δ15N and δ13C using the elemental analysis – isotope ratio mass spectrometry technique, which also provides results for tissue C and N content.
Seawater samples for δ13C of dissolved inorganic carbon (DIC) were stored in 20 mL glass vials with cone lids to exclude air from samples. Samples were stored at room temperature in low light until prepared for analysis using the exetainer gas evolution technique for DIC (Li et al., 2007). Then, the samples were sent to the UCD-SIF for analysis using the GasBench – isotope ratio mass spectrometry technique. The discrimination of carbon stable isotopes (Δ13C) was determined by correcting the tissue δ13C for the δ13C of the source gas using the formula Δ13C = (δ13Csource - δ13Cplant)/(1 + δ13Cplant). Furthermore, Δ13C was used for determining if CCMs respond to increasing pCO2 and NH4+ enrichment (Raven et al., 2002).
Statistical analyses reflected the experimental design described above. We used 1 Y per X multiple regression with measured pCO2 and NH4+ values as predictors in analyses of each response variable. In addition to the linear effects, we included a second order polynomial term for pCO2 because we hypothesized it was important as in prior work with other taxa, and we included the interaction between pCO2 and NH4+ as a predictor as this was the principal hypothesis tested in this study. Each culture tank was designated a specific pCO2 and NH4+ concentration which was used for all analyses. The pCO2 treatment of each culture tank was denoted by the average pCO2 over the entire trial (or days 0-5 and days 5-10 for respective RGR measurements). Instantaneous measurements of nutrients in water samples are not suitable indications of the bioavailability of nitrogen to Ulva spp. (Fong et al., 1998; Barr, 2007). Therefore, the NH4+ concentration of each culture tank was determined by the average difference between header tank NH4+ concentration and culture tank NH4+ concentration, assuming that difference was the NH4+ removed by the algae.
General linear mixed models (GLMM) were used to evaluate the physiological responses of Ulva lactuca to the range of pCO2 and NH4+ concentrations. pCO2, NH4+, and the interaction were evaluated as fixed effects, and trial was a random effect. Models were also evaluated that included NH4+ and/or pCO2 as a random effect across trials with correlated or uncorrelated slopes and intercepts. The fixed and random factors were used to develop a set of 23 candidate models a priori (Table S2). Variation due to random effects was described by variance components. The data for each response variable were evaluated for normality using a Shapiro-Wilk test and were transformed, if necessary. The data were standardized using z-scores in order to assess the effects of pCO2 and NH4+ using standardized regression coefficients. Akaike’s Information Criterion, corrected for small-sample bias (AICc) was used to rank the candidate models (Anderson, 2008). Models with ΔAICc < 3 were considered as models that best represent full reality given the present data set.
Effect sizes were calculated using weighted model-averaged parameter estimates for the fixed effects from the aforementioned analyses. Information from the entire a priori model set was used to determine effects sizes, so as not to lose information from lower ranked models (Anderson, 2008), but estimates for the main effects did not include models that had the interaction term. Effect sizes were considered strong when the 95% confidence intervals did not overlap zero.
In a manner similar to the aforementioned analyses, the unstandardized, untransformed data were analyzed using GLMM. Conventional regression coefficients were calculated using weighted, model-averaged parameter estimates using the same a priori developed model set. Then, the data were used to make predictions using the linear expression y = β0 + β1* x1 + β2* x2 + β3*(x1* x2), where x1 = pCO2 and x2 = NH4+. Mesh plots of the fitted surface responses were overlaid with the data from the experiment. Data analysis was done in R using the lme4 (Bates et al., 2015) and AICcmodavg packages (Mazerolle, 2017).
The coefficients reported in the results section come from the standardized effect sizes (Table 1 and Figure 2) for ease of comparison among factors and variables, unless otherwise stated. The coefficients from the conventional model are listed in Table 2 and presented in Figures 3–5.
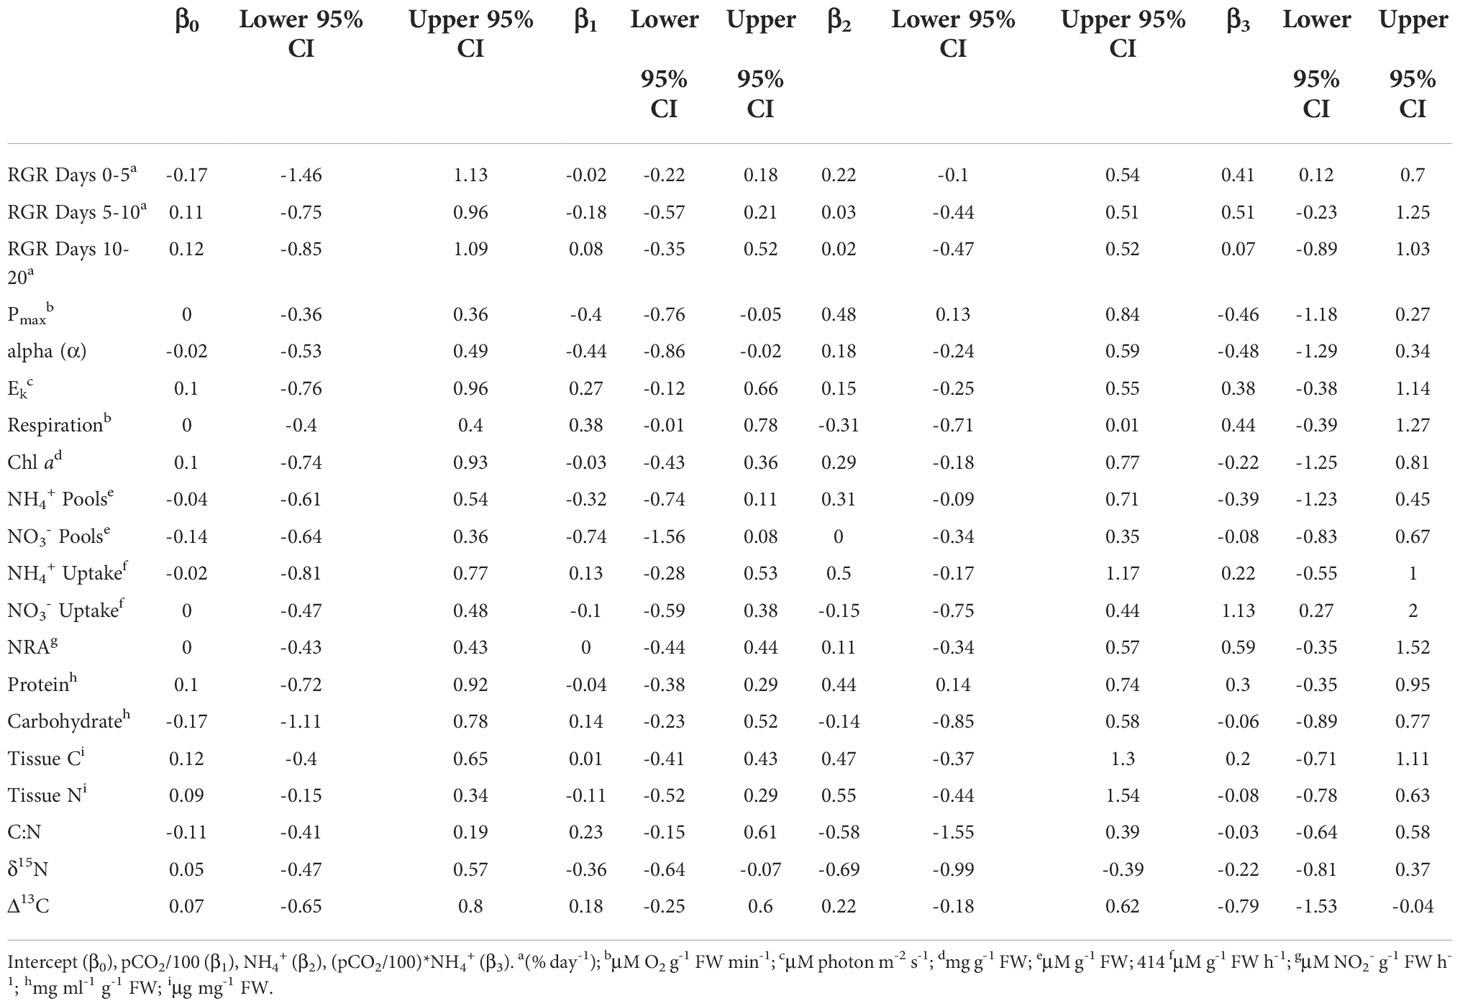
Table 1 Weighted, model-averaged estimates of standardized regression coefficients and 95% confidence interval (CI) for each experimental parameter.
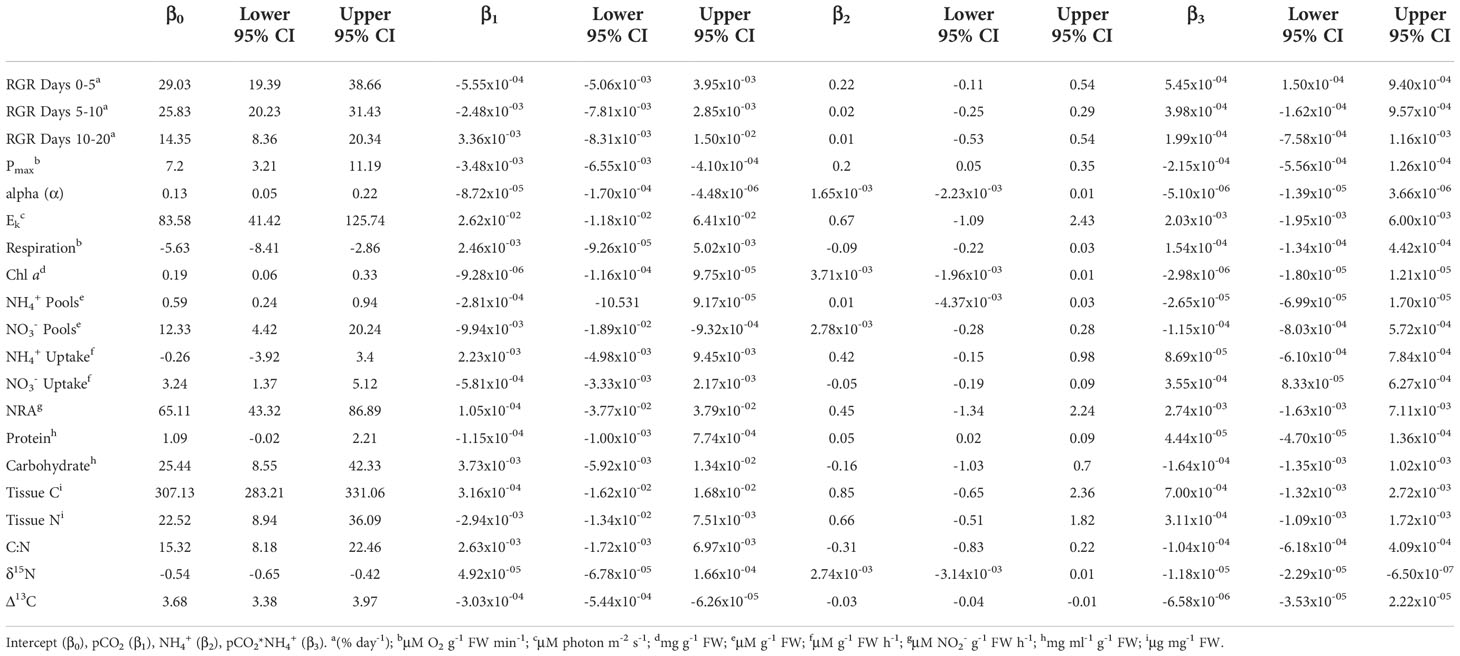
Table 2 Weighted, model-averaged estimates of conventional regression coefficients and 95% confidence interval (CI) for each experimental parameter.
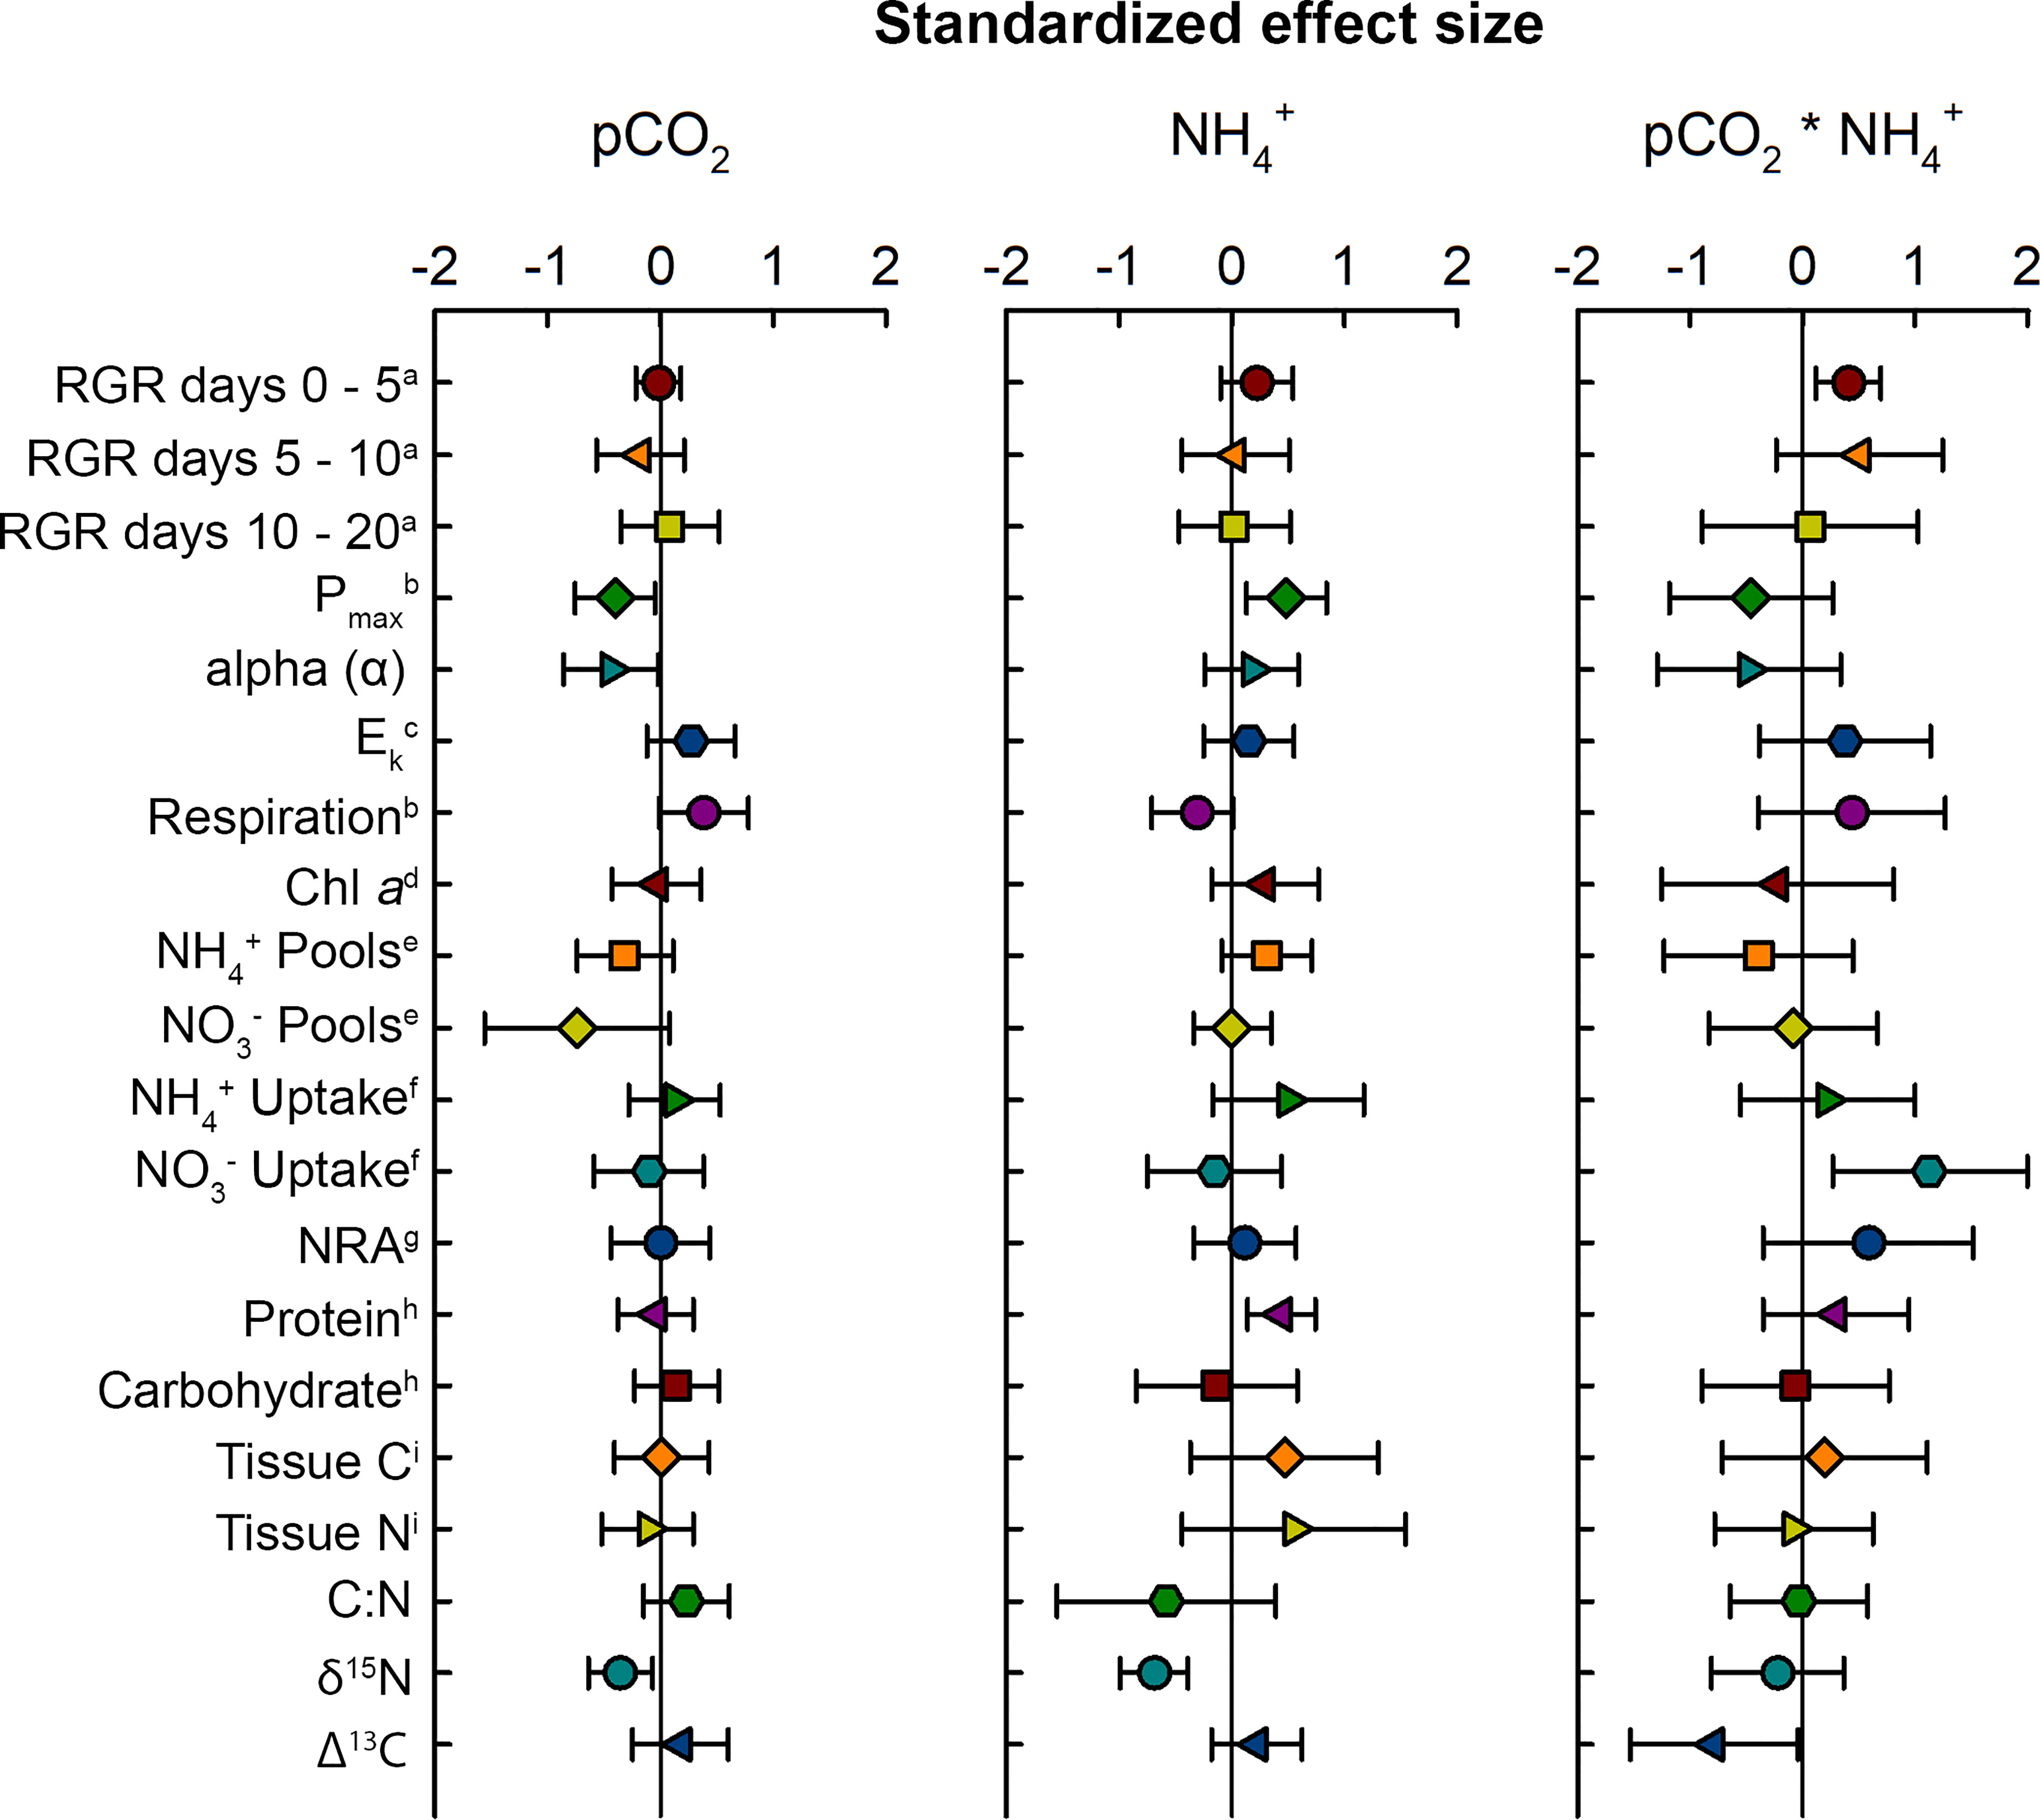
Figure 2 Standardized effect sizes for physiological responses of Ulva lactuca to pCO2 and NH4+ enrichment. The effect sizes were calculated as the weighted average of standardized coefficients from each model in the set where the term appears. Error bars are 95% confidence intervals. a(% day-1); bμM O2 g-1 FW min-1; cμM photon m-2 s-1; dmg g-1 FW; eμM g-1 FW; fμM g-1 FW h-1; gμM NO2- g-1 FW h-1; hmg ml-1 g-1 FW; iμg mg-1 FW.
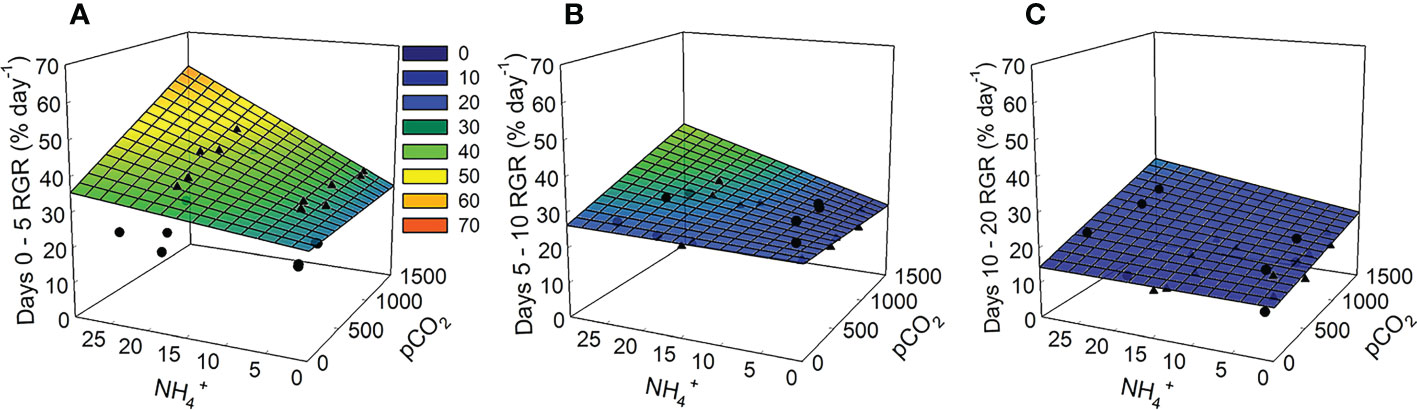
Figure 3 Modeled relative growth rates for Ulva lactuca over time based on responses to pCO2 and NH4+ treatments in laboratory experiments. (A) Days 0-5 (B) Days 5-10 (C) Days 10-20. The linear expression y=β0+(β1*x1)+(β2*x2)+(β3*(x1*x2)), where x1 = pCO2 and x2 = NH4+, was used to fit model surface with conventional regression coefficients using weighted model-averaging (see Table 2). Overlaying the modeled mesh plots are the RGRs (% day-1) from each trial where trial 1 is represented by circles and trial 2 is represented by triangles.
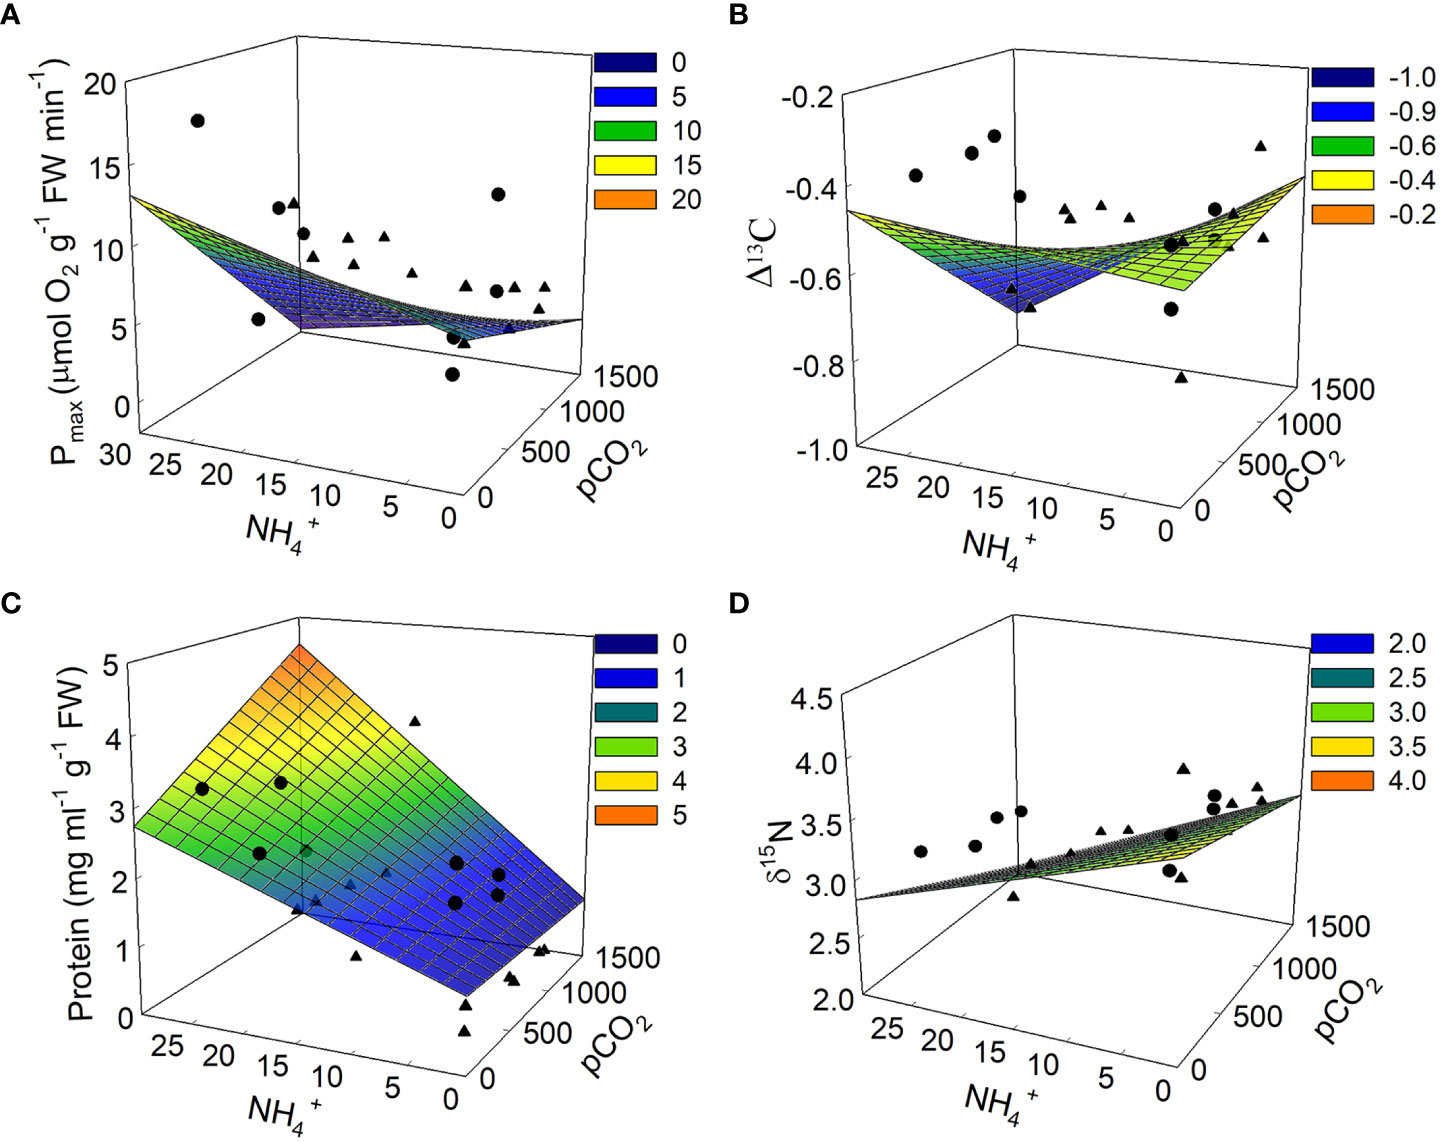
Figure 4 Modeled physiological responses for Ulva lactuca based on responses to pCO2 and NH4+ treatments in laboratory experiments. (A) Pmax (B) Δ13C (C) Soluble protein concentrations and (D) δ15N. The linear expression y=β0+(β1*x1)+(β2*x2)+(β3*(x1*x2)), where x1 = pCO2 and x2 = NH4+, was used to fit model surface with conventional regression coefficients using weighted model-averaging (see Table 2). Overlaying the modeled mesh plots are the date from each trial where trial 1 is represented by circles and trial 2 is represented by triangles.
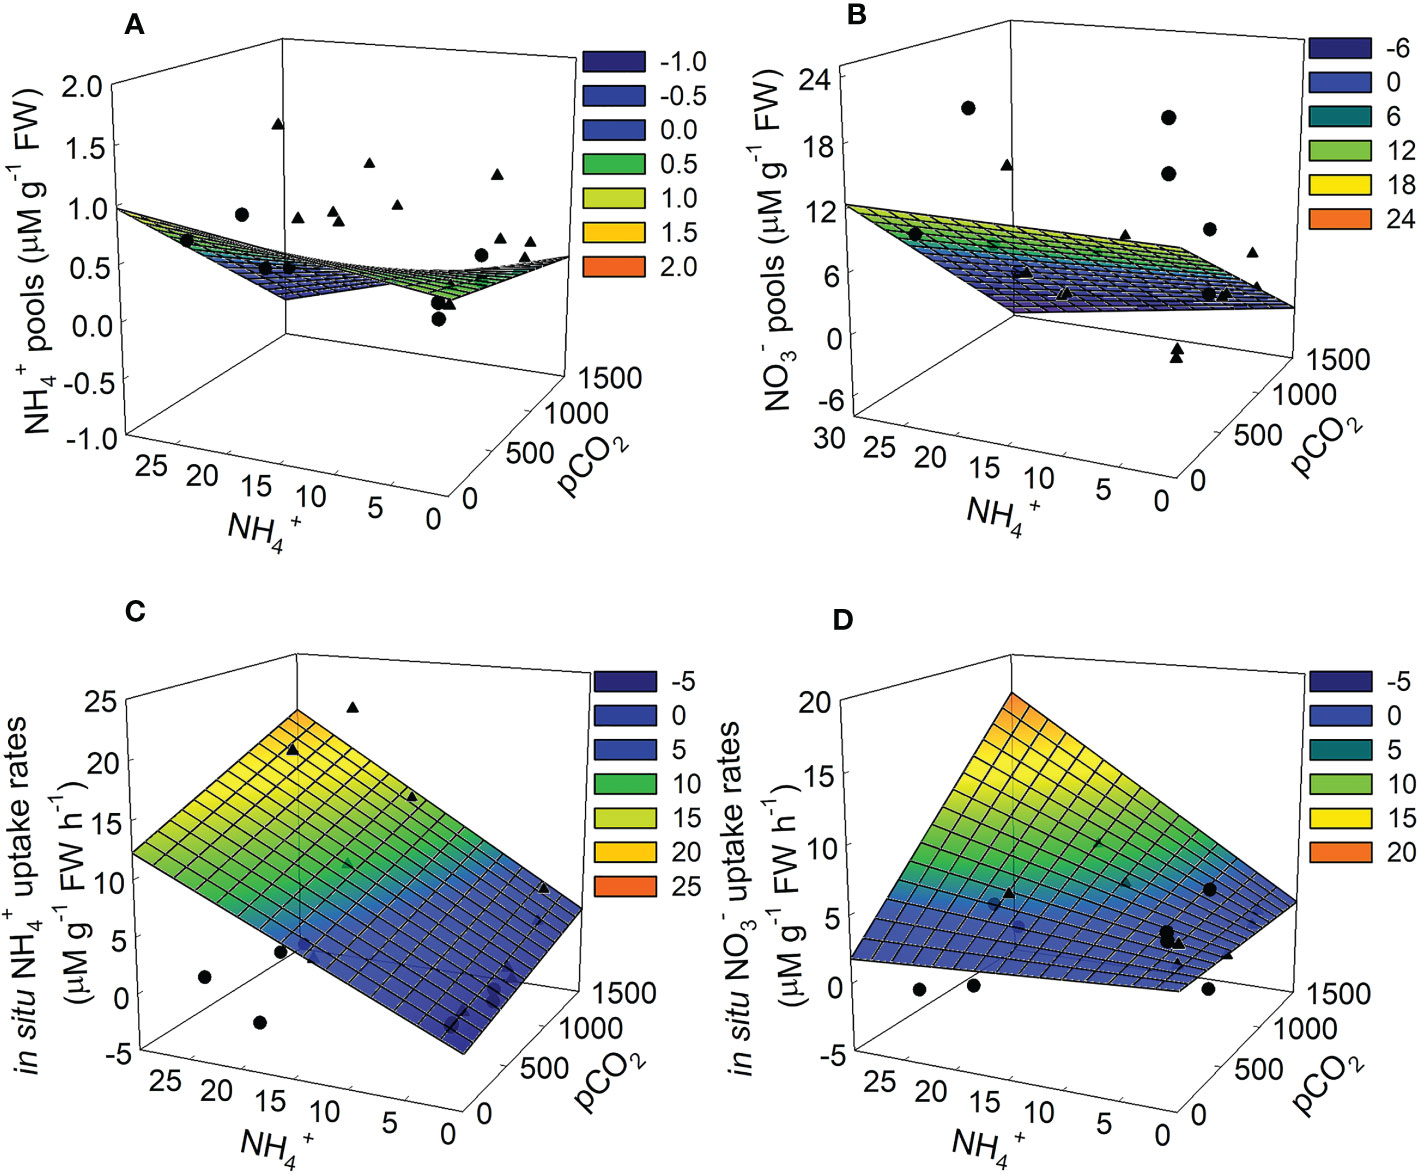
Figure 5 Modeled physiological responses for Ulva lactuca based on responses to pCO2 and NH4+ treatments in laboratory experiments. (A) NH4+ pools (B) NO3- pools rates (C) in situ NH4+ uptake and (D) in situ NO3- uptake rates. The linear expression y=β0+(β1*x1)+(β2*x2)+(β3*(x1*x2)), where x1 = pCO2 and x2 = NH4+, was used to fit model surface with conventional regression coefficients using weighted model-averaging (see Table 2). Overlaying the modeled mesh plots are the date from each trial where trial 1 is represented by circles and trial 2 is represented by triangles.
The effect that pCO2 and NH4+ had on growth of Ulva varied over the time course of experimental trials. During the first 5 days of the experiment, pCO2 and NH4+separately, and their interaction were parameters included among the set of models that best explained the data (Table 3). Synergy between pCO2 and NH4+ during this period enhanced the growth rate of Ulva (Figures 2, 3A) having approximately twice as strong an effect as NH4+ alone (0.41 vs. 0.22; Table 1). NH4+ contributed 6% of the variance in growth between trials during days 0-5. The effect of pCO2 alone was negligible.
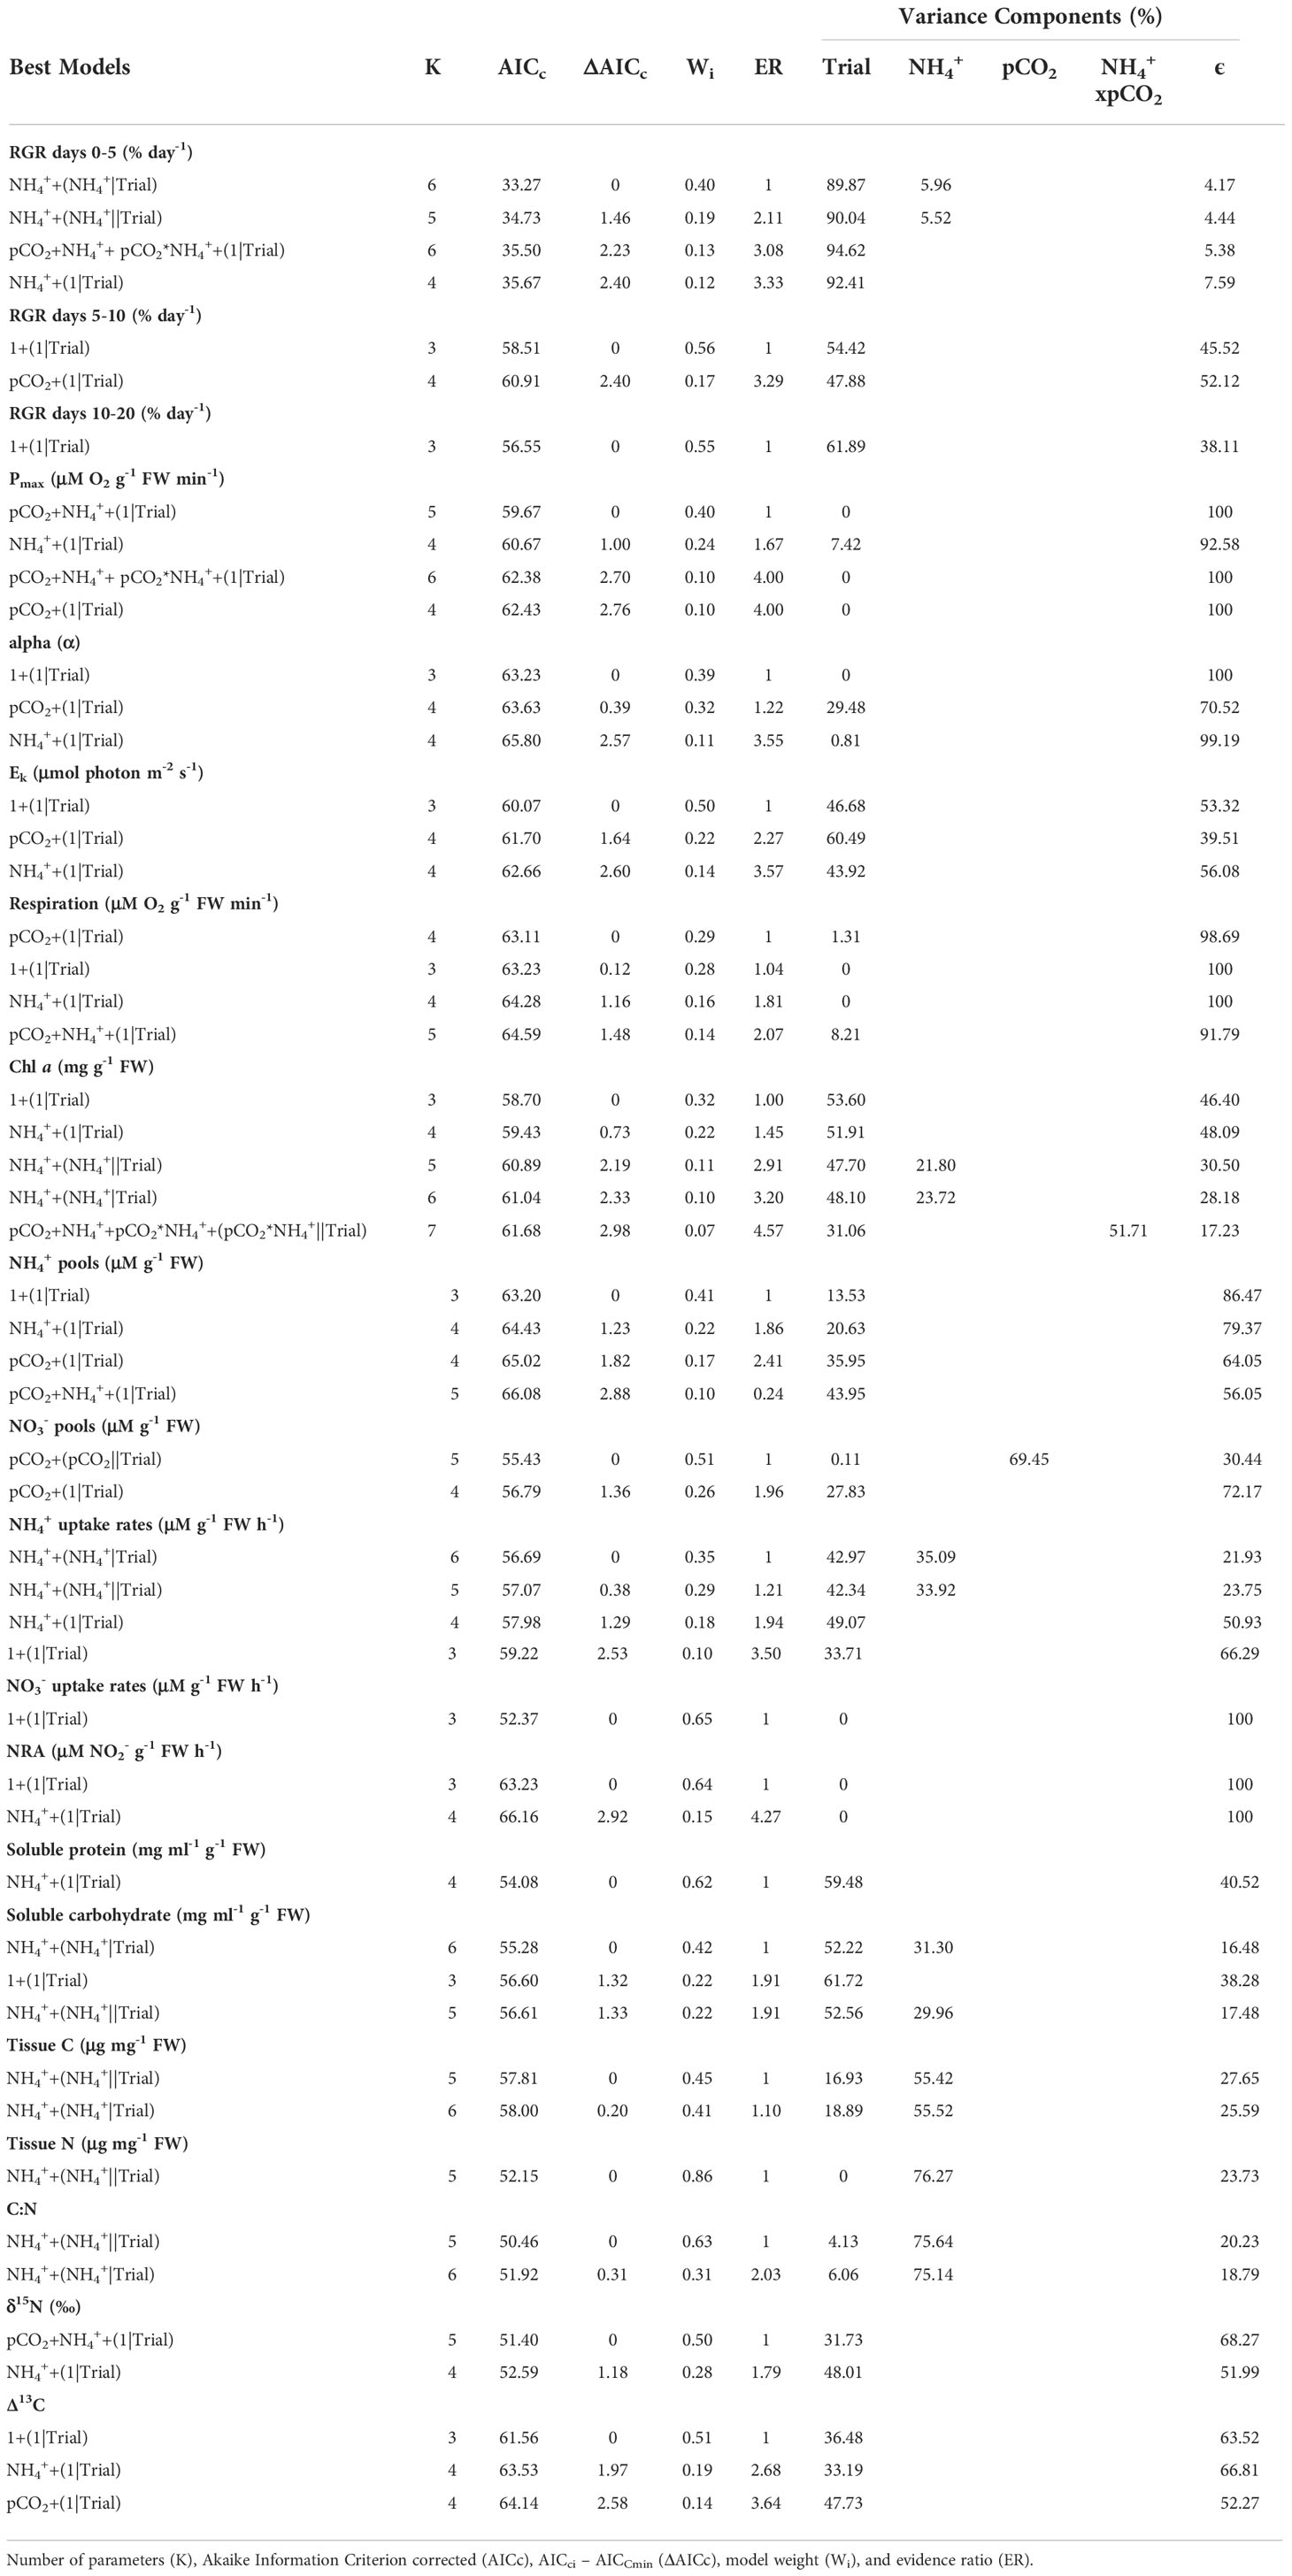
Table 3 Summary of most supported models (ΔAICc ≤ 3) and variance components.
In the latter two intervals of measurements (days 5-10 and 10-20), pCO2 and its interaction with NH4+ had antagonistic and highly variable effects on growth. Overall, growth rates dampened from rates approaching 30% per day between days 5 and 10 to 17% per day between days 10 and 20 largely unaffected by pCO2, NH4+, and their interaction (Figures 2, 3B, C). Besides the temporally variable effects of pCO2 and NH4+, overall growth rates differed between the two trials accounting for 90% of the total variance in growth observed.
Effects of pCO2 and NH4+ on photosynthetic parameters of Ulva were markedly different from their effects on growth. Pmax ranged between 3.29 – 13.18 μM O2 g-1 FW min-1 in the ambient NH4+ treatments and between 4.25 – 17.44 μM O2 g-1 FW min-1 in the enriched NH4+ treatments. pCO2 and NH4+ had similar magnitudes, but antagonistic, effects on Pmax. Pmax declined with increasing pCO2 but increased with increasing NH4+ (Figure 4A).
The magnitude of the interaction between them was similarly antagonistic, but variable relative to either predictor variable alone (Figure 2 and Table 1). Photosynthetic rates varied little between trials accounting for ≤7% of the variation.
Light-harvesting efficiency of photosynthesis (alpha (α)) ranged between 0.03 – 0.34, and also declined a similar magnitude with increasing pCO2 and in response to the interaction between pCO2 and NH4+ (Figure 2 and Table 1). The effect of NH4+ alone was much weaker and both NH4+ and the pCO2*NH4+ interaction were weak as a result of large variability. Chlorophyll a concentration ranged between 0.06 – 0.44 mg g-1 FW and shows the same qualitative patterns as both Pmax and alpha (α) with respect to responses to pCO2, NH4+, and their interaction. However, the effect sizes were weak and variable, especially with respect to the effect of NH4+ between trials that contributed ~22% of the variation in chlorophyll a (Table 3). Trial alone typically accounted for 50% of the variation in chlorophyll a concentrations observed throughout the experiment. The light saturation intensity, Ek, responded weakly to pCO2 and NH4+ (Figure 2 and Table 1) with an overall range of 32.73 – 183.89 uM photon m-2 s-1. Much of the variation observed in Ek was that between the two trials (Table 3).
Respiration was similarly sensitive to pCO2 and NH4+, increasing with pCO2 and its interaction with NH4+and decreasing with NH4+ alone (Figure 2 and Table 1), though those effects were highly variable. Overall respiration was between 2.18 – 11.56 μM O2 g-1 FW min-1. Like photosynthetic rates, respiration varied little between trials.
As expected, NH4+ pools positively covaried with NH4+ concentration. NH4+ pools ranged between 0.22 – 1.15 mg NH4+ g-1 FW in the ambient NH4+ treatments and between 0.12 – 1.65 mg NH4+ g-1 FW in the enriched NH4+ treatments. In contrast, NO3- pools were unaffected by NH4+ concentration (Figures 2, 5A, B), with an overall range of 0.00 – 22.07 mg NO3- g-1 FW. Both NH4+ and NO3- pools declined with increasing pCO2 and its interaction with NH4+, though the variability in both cases was high (Table 1). The effect of pCO2 alone on NO3- pools was more than double its effect on NH4+ pools (-0.74 vs. -0.32). The patterns suggest that OA may stimulate N assimilation in Ulva lactuca, which could result in a reduction of intracellular N storage. Overall, NH4+ pools were less concentrated in Ulva lactuca than NO3- pools.
As predicted, uptake of NH4+ increases in response to increasing NH4+, pCO2 and their interaction, though estimated effect sizes are highly variable (Figure 2). Concentration of NH4+ showed the strongest effect (0.50) more than twice that of the pCO2*NH4+ interaction and nearly 4-fold that of pCO2 alone (Figure 2 and Table 1). NH4+ uptake rates ranged between -0.74 – 5.34 uM NH4+ g-1 FW h-1 in the ambient NH4+ treatments and between -2.18 – 22.75 uM NH4+ g-1 FW h-1 in the enriched NH4+ treatments. In the two best models, NH4+ uptake rate varied between trials (i.e, acted as a random effect), contributing 33.92 – 35.09% of the variation in in vivo NH4+ uptake rates. The plot of the data points about the predicted steep response surface derived from the conventional regression illustrates the pattern of a potentially strong, yet highly variable, positive effect on in situ NH4+ uptake rates (Figure 5C).
Neither pCO2 nor NH4+ affected in situ NO3- uptake rates individually, yet they synergistically combined to yield a relatively large positive interaction (β3std = 1.13, 95% CI = 0.27 – 2.00) (Table 1 and Figure 2). The overall range of NO3- uptake rates was between -0.96 – 6.80 uM NO3- g-1 FW h-1. However, models including the interaction were weakly supported relative to the null model (ωi = 0.65) and the highest ranking model with the interaction had a ΔAICc = 7.05 (not included on Table 3), so this result should be regarded with caution. Furthermore, 100% of the variance was due to random error in the best-supported model. Likewise, there were neither effects of pCO2, NH4+, nor their interaction on NRA (ranging between 22.78 – 155.47 um NO2- g-1 FW) and the null model was the best model with similar support (ωi = 0.64) (Table 3 and Figure 2).
Soluble protein concentrations increased with NH4+ (β2std = 0.44, 95% CI = 0.14 – 0.74) showing a strong effect that was more than 10-fold that of pCO2 and 1.5-fold that of their interaction (Tables 2, 3 and Figures 2, 4C). Soluble protein concentrations ranged between 0.13 – 2.62 mg/ml g-1 FW in the ambient NH4+ treatments and between 0.32 – 3.56 mg/ml g-1 FW in the enriched NH4+ treatments. The random effect of trial contributed 59.48% of the variation in the data for protein concentrations (Table 3).
Carbohydrate concentrations ranged from 10.45 – 46.99 mg/ml g-1 FW. NH4+ had a variable, but weakly negative effect on soluble carbohydrate concentrations among trials (β2std = -0.14, 95% CI = -0.23 – 0.52) (Table 1). NH4+ appeared in two of the three best models (best and third best models; ∑ωi = 0.64) estimating soluble carbohydrate concentrations, and its effect varied approximately 30% among trials (Table 3).
NH4+ was the best predictor for tissue C (ranging between 287.15 – 340.01 ug C mg-1 DW), tissue N (ranging between 12.17 – 50.58 ug N mg-1 DW), and C:N ratios (ranging between 6.36 – 23.66) and its effects were relatively large but were associated with high variability (β2std = 0.47, 95% CI = -0.37 – 1.30, β2std = 0.55, 95% CI = -0.44 – 1.54, and β2std = -0.58, 95% CI = -1.55 – 0.39, respectively) (Tables 1, 2, and Figure 2). NH4+ acting as a random effect contributed ~55% of the variance in tissue C, 76.27% of the variance in tissue N and ~75% of the variance in the C:N ratio across trials. In contrast, standardized coefficients for pCO2 and pCO2*NH4+ were near zero and variable.
δ15N ranged between 2.71 – 4.10 and was significantly reduced with elevated pCO2 or NH4+ (β1std=-0.36, 95% CI = -0.64 – -0.07 and β2std=-0.69, 95% CI = -0.99 – -0.39), in an additive fashion (i.e., no interaction between them; Table 1 and Figure 4D). δ15N values were twice as sensitive to NH4+ than pCO2.The best supported model included both pCO2 and NH4+ (ωi = 0.50) (Table 3). There was little change in discrimination, Δ13C, by U. lactuca due to either pCO2 or NH4+, independently, but together they reduced Δ13C (β3std= -0.79, 95% CI = -1.53 – -0.04) (Figure 2). The overall range of Δ13C was -0.78 – -0.32. Discrimination values varied by 33-50% between trials. The best supported model for Δ13C was the intercept-only model (ωi = 0.51) and other candidate models implied pCO2 or NH4+ act independently.
The most strongly supported results were the positive interaction between pCO2 and NH4+ on growth rate between days 0 and 5 (Figure 3A), the positive effect of NH4+ on protein concentrations (Figure 4C) and Pmax (Figure 4A), the negative effect of NH4+ on δ15N (Figure 4D), and the negative effect of pCO2 on Pmax (Figure 4A), α (Figure 2), and δ15N (Figure 5D). In other cases, there was less certainty such as when the effect size was significant for a parameter, but the parameter was not included in the best model set. This occurred with the interactive effect of pCO2 and NH4+ on NO3- uptake rates and Δ13C (Figure 2 and Table 3). These effects warrant further investigation. The variance components in the best model sets show that for some parameters, such as RGRs, a relatively high proportion of the variability could be attributed to differences among trials. This indicates there may be temporal variability in the response due to differences in the physiological states of the algae which could be caused by natural environmental factors including changes in temperature, light, and nutrients.
This research contributes to the developing understanding of the effects of OA and nutrient pollution on the growth of bloom forming seaweeds, Ulva spp. and provides insight into the physiology driving growth patterns. Ocean acidification and eutrophication (pCO2 and NH4+) interacted to increase Ulva growth rate during the initial period of the experiment on days 0-5, but growth decreased, and the interaction weakened during the proceeding growth periods. While the physiological parameters measured at the end of the experiment may not fully explain mechanisms that increased growth at the beginning of the experiment, they do provide insight into how OA affects photosynthetic processes and nitrogen metabolism. Possible mechanisms for the synergistic effect of OA and NH4+ enrichment on growth during days 0-5 include increased NO3- metabolism, changes in intracellular N storage and assimilation, and the downregulation of CCMs.
We found that the main factors, pCO2 and NH4+ did not affect the RGR throughout the experiment. Similar results have been reported in a variety of macroalgal species from tropical and temperate environments, including Ulva (Israel and Hophy, 2002; Bender-Champ et al., 2017; Reidenbach et al., 2017). Ulva spp. are an opportunistic algal species (Littler and Littler, 1980) and typically demonstrate higher growth rates with nitrogen enrichment (Fong et al., 2004), but the nutrient history of macroalgae can alter this response (Fujita, 1985; Naldi and Viaroli, 2002; Fong et al., 2003; Kennison et al., 2011). For example, the growth rate of U. lactuca in response to NO3- or NH4+ enrichment was greater, relative to control treatments, from sites with relatively low DIN in the water column when compared to algae from eutrophic sites (Teichberg et al., 2008). The U. lactuca in this study were collected from a eutrophic environment and kept under nutrient enriched conditions prior to the experiment, possibly dampening their response to further nutrient addition.
The response of photosynthesis to OA may be context-dependent and high light intensity has been observed to inhibit photosynthesis with increased pCO2 in Ulva spp. (Xu and Gao, 2012; Gao et al., 2016; Gao et al., 2018) and in microalgae (Gao et al., 2012). Gao et al. (2016) found a negative interactive effect on Pmax in U. linza under high-light (600 μmol photons m-2 s-1) and high pCO2 conditions. Photoprotective processes, such as an increase in non-photosynthetic quenching (NPQ), and a decrease in reliance on CCMs and under high-light and high pCO2 conditions, led to a decreased Pmax in U. linza and increased sensitivity to light under high pCO2 conditions (Gao et al., 2016). A reduction in photosynthetic efficiency (α) and maximum quantum yield (Fv/Fm) under high pCO2 conditions were observed under high solar irradiation at noon in outdoor mesocosms in U. rigida, but only when nitrogen was limiting (Figueroa et al., 2020). In the present study, under high light conditions (500 μmol photons m-2 s-1), increasing pCO2 reduced Pmax, demonstrating that pCO2 can negatively affect photosynthetic performance under certain conditions.
Increased pCO2 levels and low-light intensities are two processes that can result in a down-regulation or loss of CCMs (Hepburn et al., 2011; Raven et al., 2011; Cornwall et al., 2012; Dudgeon and Kübler, 2020). Hepburn et al. (2011) found that conspecific macroalgal species grown in low-light habitats had a higher reliance on CO2 diffusion than those grown at high-light habitats suggesting that under high-light intensities CCMs are necessary for keeping up with demand for inorganic carbon for photosynthesis. In our experiment, there was no indication of alterations in CCMs as indicated by Δ13C with pCO2 alone and this could be due to the high-light intensity used in this experiment. Therefore, the mechanisms underlying the decrease in Pmax and α under OA in our experiment are uncertain but may be related to increased sensitivity to light under high pCO2 conditions.
In our experiment, NH4+ enrichment resulted in a down-regulation of CCMs at high pCO2 (Figure 4B), which may have supported nitrogen assimilation. δ15N decreased under NH4+ enrichment reflecting the stable isotope signature of the NH4Cl used to enrich the medium, which was incorporated into algal tissue with growth (Figure 4D). δ15N also decreased with increasing pCO2 suggesting integration of NH4+ incorporation with increasing pCO2. NH4+ enrichment significantly increased protein concentrations (Figure 4C), without strong effects on internal inorganic N pools or uptake rates. This suggests that the increase in protein concentrations (due to increased N assimilation) may have occurred during the initial period of the study (days 0-5) when growth rate was the highest.
NO3- pools in plants indicate the occurrence of a surplus of inorganic N that has yet to be reduced to organic N, so a reduction in NO3- pools with higher pCO2 may indicate that pCO2 increased nitrogen assimilation into proteins and amino acids (Figure 5B) (Stitt and Krapp, 1999). This effect has been reported with Pyropia haitanensis (Liu and Zou, 2015), Ulva rigida (Gordillo et al., 2001), and the seagrass Zostera noltii (Alexandre et al., 2012). In this experiment, pCO2 had a relatively stronger effect on NO3- pools than NH4+ pools.
There was a strong positive interaction between pCO2 and NH4+ on NO3- uptake rates (Figure 5D), indicating a stronger response of NO3- metabolism to pCO2 compared to NH4+ metabolism (Figure 5C). While NH4+ is typically known to suppress NO3- assimilation in macroalgae, including Ulva (McGlathery et al., 1996; Cohen and Fong, 2004; Ale et al., 2011), there was a positive, but weak interactive effect on NRA (Figure 2). This, coupled to increased carbon availability, may lead to downstream increases in NO3- uptake as seen here, despite NH4+ possibly dampening this effect. Alternatively, the availability of NO3- in the PES media may have caused a preference for NO3- uptake (Fan et al., 2014) and the energetic requirement for NO3- assimilation could be more easily met with enhanced CO2. More researched is needed to understand how OA affects nutrient uptake and storage preferences in algae. Increased NH4+ and pCO2 stimulating the energetic process of NO3- metabolism would lead to increased growth as seen in days 0-5 (Turpin, 1991).
Short term effects of nitrogenous nutrient and pCO2 enrichment were also observed in much higher density, batch cultures of Ulva rigida (Figueroa et al., 2021). For several reasons, the results of that study and this are not directly comparable, though some coincident patterns are of interest. NO3- uptake is an active process, requiring energetic cost, unlike NH4+ uptake. Speciation of NH4+ is dependent on pH over the near future expected pH range, making it more biologically available as the pH decreases, a direct chemical synergy between increasing NH4+ and pCO2 which would not occur between increasing NO3- and pCO2. The relative magnitudes of changes in Pmax observed in the two studies, in response to changing CO2 and N addition were different which is not unexpected as the differences in range of CO2 partial pressures in the two studies differed as well as the nitrogen sources used. Figueroa et al. (2021) compared two pCO2 levels, 380 and 700 ppm, whereas this study used a range from 190 to nearly 1400 ppm. Our response surface shows a weak negative slope with increasing pCO2 and a pronounced decline in photosynthetic rate at pCO2 levels > 1000 ppm. Figueroa et al. (2021) also observed that photosynthetic rates were reduced at high pCO2 compared to low pCO2 in their low [NO3-] treatments. Photosynthetic rate was much more sensitive to [NH4+] than pCO2, increasing rapidly with increasing nitrogen availability, as in Figueroa et al. (2021) for added NO3-. Both studies showed an antagonistic relationship between pCO2 and their respective nitrogen source concentrations. The strength of response to increasing NH4+ was far greater than that to nitrate and pCO2. It has been previously shown that the effect of warming is also generally greater than the effect of increasing pCO2 on Ulva sp. (Dudgeon and Kübler, 2020).
OA and nutrient enrichment are global phenomena and may increase the likelihood of bloom initiation in Ulva by accelerating the growth rate during the earliest stages with the potential to cause protracted blooms under certain environmental conditions. At the population level, the continual turnover of algae could maintain the bloom. For example, in a sheltered bay or shallow coastal area a bloom would be self-limiting due to high growth and nutrient uptake rates, self-shading, and the creation of anoxic zones within a dense algal mat (Bartoli et al., 2005). The subsequent decline in the physiological state of the algae and their release of labile organic compounds could provide an endogenous source of nutrients available to reinitiate and maintain the bloom. Large scale population studies would be required to better understand nutrient regeneration within an active bloom under OA. Data from this experiment used algae from one of the most eutrophic coastal areas in the world and may be applicable to other systems that already experience chronic mild to severe nutrient enrichment and green tide blooms. Records of macroalgal blooms began increasing worldwide in the 1960s and 1970s with increased development of industry, agriculture, and urbanization that contribute to increased nitrogen loading in coastal waters (Morand and Briand, 1996; Paerl, 1997). Ulva blooms can have dramatic impacts on coastal ecosystems due to their substantial biomass including the uptake of nutrients and dissolved gasses, large variations in seawater pH due to CO2 uptake during photosynthesis and CO2 production during respiration at night, the release of harmful chemicals, and creating hypoxic zones during decomposition (Van Alstyne et al., 2015; Zhang et al., 2019). Green tide blooms can result in great economic losses in aquaculture, tourism, and in clean-up efforts (Ye et al., 2011).
Green macroalgal blooms are common on southern Californian coasts where nutrient enrichment is high due to dense human populations (Kennison and Fong, 2014). The results of this experiment show that with respect to growth, there are short-term, positive interactive effects of pCO2 and NH4+ enrichment during short-term exposure. After 5 days there was no interaction and OA did not benefit U. lactuca in terms of growth rate. Increased pCO2 under experimental high-light intensities was found to be detrimental to maximum photosynthetic rates. U. lactuca may be sensitive to high-light intensities under OA, but in a bloom scenario self-shading may mitigate this sensitivity.
From an ecosystem management perspective, the interaction of OA and nutrient enrichment on the RGRs on days 0-5 are of critical importance, as this suggests that bloom initiation and intensity may be more severe under OA. Understanding the mechanistic and physiological processes that ultimately cause changes in growth rates provides insight that can allow for the basis of comparison across species and ecosystems, as well as a platform for developing hypotheses for future experiments. Understanding the links between carbon and nitrogen metabolism with OA can provide useful information for interdisciplinary research involving the use of macroalgae in aquaculture for removing nutrients and possibly CO2 from coastal ecosystems.
The datasets presented in this study can be found in online repositories. The names of the repository/repositories and accession number(s) can be found below: https://www.bco-dmo.org/dataset/861111.
LR, SD, and JK contributed to conception and design of the study, manuscript revision and read and approved the submitted version. LR maintained experimental mesocosms and collected data. LR and SD performed the statistical analysis. LR wrote the first draft of the manuscript. All authors contributed to the article and approved the submitted version.
This work was funded by a grant from the National Science Foundation Ocean Sciences Program OCE-1316198 to Janet Kübler and Steve Dudgeon.
We are grateful for the assistance provided by Lissandra Gonzalez who helped maintain the flow-through system and assisted with measurements of NH4+ and NO3- pools and Courtney Button who assisted with chlorophyll extractions. We are also grateful to Samuel Scoma for his help in maintaining the flow-through system.
The authors declare that the research was conducted in the absence of any commercial or financial relationships that could be construed as a potential conflict of interest.
All claims expressed in this article are solely those of the authors and do not necessarily represent those of their affiliated organizations, or those of the publisher, the editors and the reviewers. Any product that may be evaluated in this article, or claim that may be made by its manufacturer, is not guaranteed or endorsed by the publisher.
The Supplementary Material for this article can be found online at: https://www.frontiersin.org/articles/10.3389/fmars.2022.980657/full#supplementary-material
Ale M. T., Mikkelsen J. D., Meyer A. S. (2011). Differential growth response of Ulva lactuca to ammonium and nitrate assimilation. J. Appl. Phycol. 23 (3), 345–351. doi: 10.1007/s10811-010-9546-2
Alexandre A., Silva J., Buapet P., Björk M., Santos R. (2012). Effects of CO2 enrichment on photosynthesis, growth, and nitrogen metabolism of the seagrass Zostera noltii. Ecol. Evol. 2 (10), 2625–2635. doi: 10.1002/ece3.333
Anderson D. R. (2008). Model based inference in the life sciences: a primer on evidence (New York: Springer). doi: 10.1007/978-0-387-74075-1
Barr N. G. (2007). Aspects of nitrogen metabolism in the green alga Ulva; developing an indicator of seawater nitrogen loading. [PhD dissertation] (Auckland, New Zealand: University of Auckland), 1–219.
Bartoli M., Nizzoli D., Vezzulli L., Naldi M., Fanciulli G., Viaroli P., et al. (2005). Dissolved oxygen and nutrient budgets in a phytotreatment pond colonised by Ulva spp. Hydrobiologia 550 (1), 199–209. doi: 10.1007/s10750-005-4379-8
Bates D., Mächler M., Bolker B., Walker S. (2015). Fitting linear mixed-effects models using lme4. J. Stat. Software 67 (1), 1–48. doi: 10.18637/jss.v067.i01
Bender-Champ D., Diaz-Pulido G., Dove S. (2017). Effects of elevated nutrients and CO2 emission scenarios on three coral reef macroalgae. Harmful Algae 65, 40–51. doi: 10.1016/j.hal.2017.04.004
Björk M., Haglund K., Ramaznov Z., Pedersén M. (1993). Inducible mechanisms for HCO3- utilisation and repression of photorespiration in protoplasts and thalli of three species of Ulva (Chlorophyta). J. Phycol. 29 (2), 166–173. doi: 10.1111/j.0022-3646.1993.00166.x
Boyle K. A., Kamer K., Fong P. (2004). Spatial and temporal patterns in sediment and water column nutrients in a eutrophic southern California estuary. Estuaries 27 (3), 378–388. doi: 10.1007/BF02803530
Bradford M. M. (1976). A rapid and sensitive method for the quantitation of microgram quantities of protein utilizing the principle of protein-dye binding. Analytical Biochem. 72 (1–2), 248–254. doi: 10.1016/0003-2697(76)90527-3
Bricker S. B., Longstaff B. J., Dennison W., Jones A., Boicourt K., Wicks C., et al. (2008). Effects of nutrient enrichment in the nation’s estuaries: a decade of change. Harmful Algae 8 (1), 21–32. doi: 10.1016/j.hal.2008.08.028
Carmona R., Vergara J. J., Pérez-Lloréns J. L., Figueroa F. L., Niell F. X. (1996). Photosynthetic acclimation and biochemical responses of Gelidium sesquipedale cultured in chemostats under different qualities of light. Mar. Biol. 127 (1), 25–34. doi: 10.1007/BF00993640
Cohen R. A., Fong P. (2004). Nitrogen uptake and assimilation in Enteromorpha intestinalis (L.) link (Chlorophyta): Using 15N to determine preference during simultaneous pulses of nitrate and ammonium. J. Exmerimental Mar. Biol. Ecol. 309 (1), 67–77. doi: 10.1016/j.jembe.2004.03.009
Cornwall C. E., Hepburn C. D., Pritchard D., Currie K. I., McGraw C. M., Hunter K. A., et al. (2012). Carbon-use strategies in macroalgae: differential responses to lowered pH and implications for ocean acidification. J. Phycol. 48 (1), 137–144. doi: 10.1111/j.1529-8817.2011.01085.x
Corzo A., Niell F. X. (1991). Determination of nitrate reductase activity in Ulva rigida c. agardh by the in situ method. J. Exp. Mar. Biol. Ecol. 146 (2), 181–191. doi: 10.1016/0022-0981(91)90024-Q
Crossett K. M., Culliton T. J., Wiley P. C., Goodspeed T. R. (2004). “Population trends along the coastal united states: 1980-2008,” in Coastal Trends Report Series. NOAA, National Ocean Service Management and Budget Office, Special Projects. (Silver Spring, MD).
Dickson A. G, Sabine C. L., Christian J. R (Eds.) (2007). Guide to best practices for ocean CO2 measurements. PICES Special Publ. 3, 1–191.
Dudgeon S. R., Davison I. R., Vadas R. L. (1990). Freezing tolerances in the red algae chondrus crispus and Mastocarpus stellatus: relative importance of acclimation and adaptation. Mar. Biol. 106, 427–436. doi: 10.1007/BF01344323
Dudgeon S. R., Kübler J. E. (2020). A multistressor model of carbon acquisition regulation for macroalgae in a changing climate. Limnol. Oceanogr. 65, 2541–2555. doi: 10.1002/lno.11470
Duncan M. J., Harrison P. J. (1982). Comparison of solvents for extracting chlorophylls from marine macrophytes. Botanica Marina 25 (9), 445–447. doi: 10.1515/botm.1982.25.9.445
Elser J. J., Bracken M. E. S., Cleland E. E., Gruner D. S., Harpole W. S., Hillebrand H., et al. (2007). Global analysis of nitrogen and phosphorus limitation of primary producers in freshwater, marine and terrestrial ecosystems. Ecol. Lett. 10 (12), 1135–1142. doi: 10.1111/j.1461-0248.2007.01113.x
Fan X., Xu D., Wang Y., Zhang X., Cao S., Mou S., et al. (2014). The effect of nutrient concentrations, nutrient ratios and temperature on photosynthesis and nutrient uptake by Ulva prolifera: implications for the explosion in green tides. J. Appl. Phycol. 26 (1), 537–544. doi: 10.1007/s10811-013-0054-z
Feely R. A., Doney S. C., Cooley S. R. (2009). Ocean acidification: present conditions and futrue changes in a high CO2 world. Oceanography 22 (4), 36–47. doi: 10.1289/ehp.scied008a
Fernández P. A., Hurd C. L., Roleda M. Y. (2014). Bicarbonate uptake via an anion exchange protein is the main mechanism of inorganic carbon acquisition by the giant kelp Macrocystis pyrifera (Laminariales, phaeophyceae) under variable pH. J. Phycol. 50 (6), 998–1008. doi: 10.1111/jpy.12247
Figueroa F. L., Bonomi-Barufi J., Celis-Plá P. S. M., Nitschke U., Arenas F., Connan S., et al. (2020). Short-term effects of increased CO2, nitrate and temperature on photosynthetic activity in Ulva rigida (Chlorophyta) estimated by different pulse amplitude modulated fluorometers and oxygen evolution. J. Exp. Botany72 (2), 491–509. doi: 10.1093/jxb/eraa473
Figueroa F. L., Bonomi-Barufi J., Celis-Plá P. S., Nitschke U., Arenas F., Connan S., et al. (2021). Short-term effects of increased CO2, nitrate and temperature on photosynthetic activity in Ulva rigida (Chlorophyta) estimated by different pulse amplitude modulated fluorometers and oxygen evolution. J. Exp. Botany72 (2), 491–509. doi: 10.1093/jxb/eraa473
Fletcher R. L. (1996). The occurrence of “Green tides”— a review. In: Schramm W, Nienhuis PH Marine benthic vegetation: recent changes and the effects of eutrophication (Berlin: Springer) Vol. 123. 7–43. doi: 10.1007/978-3-642-61398-2_2
Fong P., Boyer K. E., Kamer K., Boyle K. (2003). Influence of initial tissue nutrient status of tropical marine algae on response to nitrogen and phosphorus additions. Mar. Ecol. Prog. Ser. 262, 111–123. doi: 10.3354/meps262111
Fong P., Boyle K., Zedler J. B. (1998). Developing an indicator of nutrient enrichment in coastal estuaries and lagoons using tissue nitrogen content of the opportunistic alga, Enteromorpha intestinalis (L. link). J. Exp. Mar. Biol. Ecol. 231 (1), 63–79. doi: 10.1016/S0022-0981(98)00085-9
Fong P., Fong J. J., Fong C. R. (2004). Growth, nutrient storage, and release of dissolved organic nitrogen by Enteromorpha intestinalis in response to pulses of nitrogen and phosphorus. Aquat. Bot. 78 (1), 83–95. doi: 10.1016/j.aquabot.2003.09.006
Fong P., Zedler J. B. (2000). Sources, sinks, and fluxes of nutrients (N + p) in a small highly modified urban estuary in southern California. Urban Ecosyst. 4 (2), 125–144. doi: 10.1023/A:1011359311384
Fry B., Gace A., McClelland J. W. (2003). Chemical indicators of anthropogenic nitrogen-loading in four pacific estuaries. Pacific Sci. 57 (1), 77–101. doi: 10.1353/psc.2003.0004
Fujita R. M. (1985). The role of nitrogen status in regulating ammonium transient uptake and nitrogen storage by macroalgae. J. Exp. Mar. Biol. Ecol. 92 (2–3), 283–301. doi: 10.1016/0022-0981(85)90100-5
Gao G., Beardall J., Bao M., Wang C., Ren W., Xu J. (2018). Ocean acidification and nutrient limitation synergistically reduce growth and photosynthetic performances of a green tide alga Ulva linza. Biogeosciences 15, 3409–3420. doi: 10.5194/bg-15-3409-2018
Gao G., Liu Y., Li X., Feng Z., Xu J. (2016). An ocean acidification acclimatised green tide alga is robust to changes of seawater carbon chemistry but vulnerable to light stress. PLoS One 11 (12), 1–16. doi: 10.1371/journal.pone.0169040
Gao K., Xu J., Gao G., Li Y., Hutchins D. A., Huang B., et al. (2012). Rising CO2 and increased light exposure synergistically reduce marine primary productivity. Nat. Climate Change 2 (7), 519–523. doi: 10.1038/nclimate1507
Giordano M., Beardall J., Raven J. A. (2005). CO2 concentrating mechanisms in algae: mechanisms, environmental modulation, and evolution. Annu. Rev. Plant Biol. 56, 99–131. doi: 10.1146/annurev.arplant.56.032604.144052
Gordillo F. J. L., Niell F. X., Figueroa F. L. (2001). Non-photosynthetic enhancement of growth by high CO2 level in the nitrophilic seawed Ulva rigida c. agardh (Chlorophyta). Planta 213 (1), 64–70. doi: 10.1007/s004250000468
Guidone M., Thornber. C. S. (2013). Examination of Ulva bloom species richness and relative abundance reveals two cryptically co-occurring bloom species in Narragansett bay, Rhode island. Harmful Algae 24, 1–9. doi: 10.1016/j.hal.2012.12.007
Hepburn C. D., Pritchard D. W., Cornwall C. E., McLeod R. J., Beardall J., Raven J. A., et al. (2011). Diversity of carbon use strategies in a kelp forest community: Implications for a high CO2 ocean. Global Change Biol. 17 (7), 2488–2497. doi: 10.1111/j.1365-2486.2011.02411.x
Holmer M., Nielsen R. M. (2007). Effects of filamentous algal mats on sulfide invasion in eelgrass (Zostera marina). J. Exp. Mar. Biol. Ecol. 353 (2), 245–252. doi: 10.1016/j.jembe.2007.09.010
Holmes R. M., Aminot A., Kérouel R., Hooker B. A., Peterson B. J. (1999). A simple and precise method for measuring ammonium in marine and freshwater ecosystems. Can. J. Fisheries Aquat. Sci. 56 (10), 1801–1808. doi: 10.1139/f99-128
Hurd C. L., Harrison P. J., Druehl L. D. (1996). Effect of seawater velocity on inorganic nitrogen uptake by morphologically distinct forms of Macrocystis integrifolia from wave-sheltered and exposed sites. Mar. Biol. 126 (2), 205–214. doi: 10.1007/BF00347445
Israel A., Hophy M. (2002). Growth, photosynthetic properties and rubisco activities and amounts of marine macroalgae grown under current and elevated seawater CO2 concentrations. Global Change Biol. 8 (9), 831–840. doi: 10.1046/j.1365-2486.2002.00518.x
Kennison R. L., Fong P. (2014). Extreme eutrophication in shallow estuaries and lagoons of California is driven by a unique combination of local watershed modifications that trump variability associated with wet and dry seasons. Estuaries Coasts 37 (Suppl 1), 164–179. doi: 10.1007/s12237-013-9687-z
Kennison R. L., Kamer K., Fong P. (2011). Rapid nitrate uptake rates and large short-term storage capacities may explain why opportunistic green macroalgae dominate shallow eutrophic estuaries. J. Phycol. 47 (3), 483–494. doi: 10.1111/j.1529-8817.2011.00994.x
Kochert G. (1978). “Carbohydrate determination by the phenol sulfuric acid method,” in Handbook of phycological methods: Physiological and biochemical methods. Eds. Hellbust J. A., Craigie J. S. (Cambridge: Cambridge University Press), 95–97.
Kübler J. E., Dudgeon S. R. (2015). Predicting effects of ocean acidification and warming on algae lacking carbon concentrating mechanisms. PLoS One 10 (7), 1–19. doi: 10.1371/journal.pone.0132806
Kübler J. E., Johnston A. M., Raven J. A. (1999). The effects of reduced and elevated CO2 and O2 on the seaweed Lomentaria articulata. Plant Cell Environ. 22 (10), 1303–1310. doi: 10.1046/j.1365-3040.1999.00492.x
Lavigne H., Epitalon J. M., Gattuso J. P. (2011) Seacarb: seawater carbonate chemistry with R. R package version 3.0. Available at: http://CRAN.R-project.org/package=seacarb.
Li Z.-P., Tao M.-X., Li L.-W., Wang Z.-D., Du L., Zhang M.-F. (2007). Determination of isotope composition of dissolved inorganic carbon by gas-chromatography-conventional isotope-ratio mass spectrometry. Chin. J. Analytical Chem. 35 (10), 1455–1458. doi: 10.1016/s1872-2040(07)60089-9
Littler M. M., Littler D. S. (1980). The evolution of thallus form and survival strategies in benthic marine macroalgae: Field and laboratory tests of a functional form model. Am. Nat. 116 (1), 25–44. doi: 10.1086/283610
Liu C., Zou D. (2015). Effects of elevated CO2 on the photosynthesis and nitrate reductase activity of Pyopia haitanensis (Bangiales, rhodophyta) grown at different nutrient levels. Chin. J. Oceanol. Limnol. 33 (2), 419–429. doi: 10.1007/s00343-015-4057-2
Maberly S. C. (1990). Exogenous sources of inorganic carbon for photosynthesis by marine macroalgae. J. Phycol. 26, 439–449. doi: 10.1111/j.0022-3646.1990.00439.x
Mazerolle M. J. (2017) Model selection and multimodel inference based on (Q)AIC(c). R package, version 2.1-1. In: . Available at: http://CRAN.R-project.org/package=AICcmodavg.
McGlathery K. J., Pedersen M. F., Borum J. (1996). Changes in intracellular nitrogen pools and feedback controls on nitrogen uptake in Chaetomorpha linum (Chlorophyta). J. Phycol. 32 (3), 393–401. doi: 10.1111/j.0022-3646.1996.00393.x
Miflin B. J., Lea P. J. (1976). The pathway of nitrogen assimilation in plants. Phytochemistry 15 (6), 873–885. doi: 10.1016/S0031-9422(00)84362-9
Mitsuhashi S., Mizushima T., Yamashita E., Yamamoto M., Kumasaka T., Moriyama H., et al. (2000). X-Ray structure of β-carbonic anhydrase from the red alga, Porphyridium purpureum, reveals a novel catalytic site for CO2 hydration. J. Biol. Chem. 275 (8), 5521–5526. doi: 10.1074/jbc.275.8.5521
Morand P., Briand X. (1996). Excessive growth of macroalgae: A symptom of environmental disturbance. Botanica Marina 39 (1–6), 491–516. doi: 10.1515/botm.1996.39.1-6.491
Naldi M., Viaroli P. (2002). Nitrate uptake and storage in the seaweed Ulva rigida C. agardh in relation to nitrate availability and thallus nitrate content in a eutrophic coastal lagoon (Sacca di goro, po river delta, Italy). J. Exp. Mar. Biol. Ecol. 269 (1), 65–83. doi: 10.1016/S0022-0981(01)00387-2
Paerl H. W. (1997). Coastal eutrophication and harmful algal blooms: Importance of atmospheric deposition and groundwater as new nitrogen and other nutrient sources. Limnol. Oceanogr. 42 (5, part 2), 1154–1165. doi: 10.4319/lo.1997.42.5_part_2.1154
Pedersen M. F., Borum J. (1996). Nutrient control of algal growth in estuarine waters. nutrient limitation and the importance of nitrogen requirements and nitrogen storage among phytoplankton and species of macroalgae. Marine ecology progress series 142, 261–272. doi: 10.3354/meps142261
Pedersen M., Borum J. (1997). Nutrient control of estuarine macroalgae: Growth strategy and the balance between nitrogen requirements and uptake. Mar. Ecol. Prog. Ser. 161, 155–163. doi: 10.3354/meps161155
Provasoli L. (1968). Media and prospects for the cultivation of marine algae. in A. Watanabe & A. Hattori (Eds), Cultures and collections of algae (Proc. U.S.- Japan conf., hakone). Jpn Soc. Plant Physiol., 63–75.
Raven J. A. (1997). Putting the C in phycology. Eur. J. Phycol. 32 (4), 319–333. doi: 10.1017/s0967026297001388
Raven J. A., Beardall J., Giordano. M. (2014). Energy costs of carbon dioxide concentrating mechanisms in aquatic organisms. Photosynthesis Res. 121, 111–124. doi: 10.1007/s11120-013-9962-7
Raven J. A., Caldeira K., Elderfield H., Hoegh-Guldberg O., Liss P., Riebesell U., et al. (2005).Ocean acidification due to increasing atmospheric carbon dioxide. (London: The Royal Society).
Raven J. A., Giordano M., Beardall J., Maberly S. C. (2011). Algal and aquatic plant carbon concentrating mechanisms in relation to environmental change. Photosynthesis Res. 109 (1–3), 281–296. doi: 10.1007/s11120-011-9632-6
Raven J. A., Johnston A. M., Kübler J. E., Korb R., McInroy S. G., Handley L. L., et al. (2002). Mechanistic interpretation of carbon isotope discrimination by marine macroalgae and seagrasses. Funct. Plant Biol. 29 (2–3), 335–378. doi: 10.1071/PP01201
Reidenbach L. B., Fernandez P. A., Leal P. P., Noisette F., McGraw C. M., Revill A. T., et al. (2017). Growth, ammonium metabolism, and photosynthetic properties of Ulva australis (Chlorophyta) under decreasing pH and ammonium enrichment. PLoS One 12 (11), 1–20. doi: 10.1371/journal.pone.0188389
Sharp J. H. (1983). “The distributions of inorganic nitrogen, and dissolved and particulate organic nitrogen in the sea,” in Nitrogen in the marine environment. Eds. Carpenter E. J., Capone D. G. (New York: Academic Press), 1–35.
Smetacek V., Zingone A. (2013). Green and golden seaweed tides on the rise. Nature 504, 84–88. doi: 10.1038/nature12860
Smith S. V., Swaney D. P., Talaue-McManus L., Bartley J. D., Sandhei P. T., McLaughlin C. J., et al. (2003). Humans, hydrology, and the distribution of inorganic nutrient loading to the ocean. BioScience 53 (3), 235. doi: 10.1641/0006-3568(2003)053[0235:HHATDO]2.0.CO;2
Stitt M., Krapp A. (1999). The interaction between elevated carbon dioxide and nitrogen nutrition: the physiological and molecular background. Plant Cell Environ. 22 (6), 553–621. doi: 10.1046/j.1365-3040.1999.00386.x
Taylor B. W., Keep C. F., Hall R. O., Koch B. J., Tronstad L. M., Flecker A. S., et al. (2007). Improving the fluorometric ammonium method: matrix effects, background fluorescence, and standard additions. J. North Am. Benthological Soc. 26 (2), 167–177. doi: 10.1899/0887-3593(2007)26[167:ITFAMM]2.0.CO;2
Teichberg M., Fox S. E., Aguila C., Olsen Y. S., Valiela I. (2008). Macroalgal responses to experimental nutrient enrichment in shallow coastal waters: Growth, internal nutrient pools, and isotopic signatures. Mar. Ecol. Prog. Ser. 368, 117–126. doi: 10.3354/meps07564
Teichberg M., Fox S. E., Olsen Y. S., Valiela I., Martinetto P., Iribarne O., et al. (2010). Eutrophication and macroalgal blooms in temperate and tropical coastal waters: nutrient enrichment experiments with Ulva spp. Global Change Biol. 16 (9), 2624–2637. doi: 10.1111/j.1365-2486.2009.02108.x
Thacker A., Syrett P. J. (1972). The assimilation of nitrate and ammonium by Chlamydomonas reinhardi. New Phytol. 71 (3), 423–433. doi: 10.1111/j.1469-8137.1972.tb01942.x
Thompson S. M., Valiela I. (1999). Effect of nitrogen loading on enzyme activity of macroalgae in estuaries in waquoit bay. Botanica Marina 42 (6), 519–529. doi: 10.1515/BOT.1999.059
Turpin D. H. (1991). Effects of inorganic n availability on algal photosynthesis and carbon metabolism. J. Phycol. 27 (1), 14–20. doi: 10.1111/j.0022-3646.1991.00014.x
Valiela I., McClelland J., Hauxwell J., Behr P. J., Hersh D., Foreman K. (1997). Macroalgal blooms in shallow estuaries: Controls and ecophysiological and ecosystem consequences. Limnol. Oceanogr. 42 (5, part 2), 1105–1118. doi: 10.4319/lo.1997.42.5_part_2.1105
Van Alstyne K. L., Nelson T. a., Ridgway R. L. (2015). Environmental chemistry and chemical ecology of “green tide” seaweed blooms. Integr. Comp. Biol. 55 (3), 518–532. doi: 10.1093/icb/icv035
van der Loos L. M., Schmid M., Leal P. P., McGraw C. M., Britton D., Revill A. T., et al. (2019). Responses of macroalgae to CO2 enrichment cannot be inferred solely from their inorganic carbon uptake strategy. Ecol. Evol 9, 125–140. doi: 10.1002/ece3.4679
Viaroli P., Azzoni R., Bartoli M., Giordani G., Tajé L. (2001). “Evolution of the trophic conditions and dystrophic outbreaks in the sacca di goro lagoon (Northern Adriatic Sea),” in Mediterranean Ecosystems. Eds. Faranda F. M., Guglielmo L., Spezie G. (Milano: Springer). doi: 10.1007/978-88-470-2105-1_59
Xu J., Gao K. (2012). Future CO2-induced ocean acidification mediates the physiological performance of a green tide alga. Plant Physiol. 160 (4), 1762–1769. doi: 10.1104/pp.112.206961
Ye N., Zhang X., Mao Y., Liang C., Xu D., Zou J., et al. (2011). “Green tides” are overwhelming the coastline of our blue planet: Taking the world’s largest example. Ecol. Res. 26, 477–485. doi: 10.1007/s11284-011-0821-8
Young C. S., Gobler C. J. (2016). Ocean acidification accelerates the growth of two bloom-forming macroalgae. PLoS One 11 (5), 1–21. doi: 10.1371/journal.pone.0155152
Keywords: carbon metabolism, growth, macroalgal physiology, nitrogen metabolism, nutrient enrichment, ocean acidfication, photosynthesis, Ulva
Citation: Reidenbach LB, Dudgeon SR and Kübler JE (2022) Ocean acidification and ammonium enrichment interact to stimulate a short-term spike in growth rate of a bloom forming macroalga. Front. Mar. Sci. 9:980657. doi: 10.3389/fmars.2022.980657
Received: 28 June 2022; Accepted: 16 November 2022;
Published: 16 December 2022.
Edited by:
Ricardo Bermejo, University of Malaga, SpainReviewed by:
Vaibhav Ajit Mantri, Central Salt & Marine Chemicals Research Institute (CSIR), IndiaCopyright © 2022 Reidenbach, Dudgeon and Kübler. This is an open-access article distributed under the terms of the Creative Commons Attribution License (CC BY). The use, distribution or reproduction in other forums is permitted, provided the original author(s) and the copyright owner(s) are credited and that the original publication in this journal is cited, in accordance with accepted academic practice. No use, distribution or reproduction is permitted which does not comply with these terms.
*Correspondence: Leah B. Reidenbach, bHJlaWRlbmJhY2hAc2NjZi5vcmc=
Disclaimer: All claims expressed in this article are solely those of the authors and do not necessarily represent those of their affiliated organizations, or those of the publisher, the editors and the reviewers. Any product that may be evaluated in this article or claim that may be made by its manufacturer is not guaranteed or endorsed by the publisher.
Research integrity at Frontiers
Learn more about the work of our research integrity team to safeguard the quality of each article we publish.