- 1State Key Laboratory of Tropical Oceanography, South China Sea Institute of Oceanology, Chinese Academy of Sciences, Guangzhou, China
- 2School of Geographic and Oceanographic Sciences, Nanjing University, Nanjing, China
- 3Department of Earth Sciences Utrecht University, Utrecht, Netherlands
This paper performs a comparative analysis of the spatiotemporal variations of the statistical characteristics of both atmospheric heatwaves over the land (AHWs) in eastern China and marine heatwaves (MHWs) in adjacent seas using a unified heatwave definition. The multi-year average total days and frequency of MHWs during 1982-2019 were 5 and 2 times higher than those of AHWs, respectively, while the mean intensities of AHWs and MHWs were unchanged. The future frequency and duration of AHWs will continue to increase, leading to a superimposed increase in AHW total days. The decreasing frequency and increasing duration of MHWs will result in nearly year-round MHWs from 2060. Under the control of high-pressure systems, clear skies dominate the summer weather conditions in eastern China and its adjacent seas, which will trigger heatwaves. Heatwaves in turn can release substantial ocean latent heat. Enhanced convection and heating will further drive a stronger anticyclone over the western North Pacific, leading to a stronger and more westward-extending western North Pacific subtropical high (WNPSH). Moreover, super El Niño can promote an anomalous WNPSH in decaying summer, which may cause more serious heatwaves. The multi-year average persons affected by AHWs (PAHWs) during 1982-2019 were larger in the North China Plain, Yangtze River Delta, and Sichuan Basin with the regional sum exceeding 3 million. The future maximum PAHWs under SSP2-4.5 and SSP5-8.5 scenarios will be 3.9 billion in 2076 and 4.7 billion in 2085, respectively. Marine ecosystems like artificial ranches and coral reefs will be more threatened by longer-lasting MHWs.
1 Introduction
Since the mid-20th century, changes in extreme weather and climate events have been observed globally and regionally, posing increasing threats to human societies and natural ecosystems (IPCC, 2014). Heatwaves, characterized by intense and persistent high-temperature anomalies, are recognized as one of the most devastating extreme events (Perkins, 2015; Wang et al., 2017; Deng et al., 2019; Oliver et al., 2019; Pershing et al., 2019). In recent decades, atmospheric heatwaves over the land (AHWs) and marine heatwaves (MHWs) have substantially increased and garnered widespread attention worldwide (Meehl and Tebaldi, 2004; Lau and Nath, 2012; Frölicher et al., 2018; Oliver et al., 2018). For example, a massive AHW struck France in Western Europe in August 2003, accompanied by over 15,000 deaths (Fouillet et al., 2006). In the summer of 2010, severe AHWs occurred in Eastern Europe and Western Russia, with adverse impacts exceeding the previous hottest summer in 2003 (Barriopedro et al., 2011; Dole et al., 2011). Regarding the marine counterpart, the Tasman Sea experienced its longest and most intense MHW during 2015-2016, which lasted for 251 days and reached a maximum intensity of 2.9 °C/count (Oliver et al., 2017). The long-lasting extreme warming phenomenon in the northeastern Pacific during 2013-2015, named ‘Blob’, caused massive mortality of planktivorous seabirds (Bond et al., 2015; Di Lorenzo and Mantua, 2016; Jones et al., 2018). Furthermore, the frequency and intensity of both AHWs and MHWs on the global scale are projected to continue to increase in the 21st century, even under the strictly managed 1.5 °C global-warming scenario (Dosio et al, 2018; Frölicher et al., 2018; Oliver et al., 2018; Li et al., 2019; Pfleiderer et al., 2019).
A heatwave event is typically defined as a period of consecutive days during which the temperature persists above an anomaly threshold (Perkins and Alexander, 2013; Hobday et al., 2016). Various definitions for AHWs have been proposed based on different heatwave indexes and temperature metrics, including the use of fixed or relative thresholds, various durations (from 2 to 6 days), and other metrics (Xu et al., 2016; You et al., 2017). Contrastingly, the consensus has been achieved on the definition of MHWs as the periods when the daily sea surface temperature (SST) is above the 90th percentile of its seasonal variations for at least five consecutive days (Hobday et al., 2016; Oliver et al., 2017).
So far, AHWs and MHWs have been studied extensively but separately. However, over 90% of the heat energy from global warming is accumulated in the ocean, and the warming of the upper ocean has accelerated (Cheng et al., 2017; Cheng et al., 2019). The abnormal SST becomes an important factor for inducing AHWs through atmospheric blocking and teleconnections (Trenberth and Fasullo, 2012; Wang et al., 2017; Chen and Zhou, 2018; Sparrow et al., 2018; Deng et al., 2019; Wei et al., 2020). Moreover, Rodrigues et al. (2019) proposed that atmospheric blocking can cause persistent anticyclone circulation which not only leads to severe droughts associated with AHWs but also generates MHWs in the adjacent oceans, indicating that AHWs and MHWs are closely related. Owing to the propagating AHWs across eastern Australia, the SST warming near the coast is extended and amplified (Karnauskas, 2020). Therefore, AHWs and MHWs have similarities, differences, and interactions in the context of global warming. Examining and quantifying the changes in AHWs and MHWs collectively and comparatively will be important for the comprehensive understanding of climate change in and across spheres under the dual impact of natural conditions and human activities. However, systematic research is lacking owing to challenges in heatwave definitions and confined interests separately in atmosphere and ocean research communities. It is thus necessary to find a way to break the boundaries of AHWs and MHWs and make hindcasting and forecasting comparisons for the past, present, and future climates since the 1980s in the Anthropocene.
China is an area intensively impacted by human activities and sensitive to global climate change (IPCC, 2014), and the warming rate in China is faster than that of the global average. The mean near-surface air temperature in China has risen by 1.3-1.7 °C since 1900, whereas that of the global average has risen by 0.9-1.1 °C during the same period (Xu et al., 2018; Yun et al., 2019; Yan et al., 2020). The warming rate in Chinese coastal seas is 0.15 °C decade-1 during 1958-2014 (Cai et al., 2016), which is higher than the rate of 0.1 °C decade-1 in the global upper oceans at the 75-m depth during 1971-2010 (Rhein et al., 2013). Besides, the SST in the East China Sea increased by 0.3 °C decade-1 in winter and 0.1-0.2 °C decade-1 in summer during 1954-2016 (Cai et al., 2017). Under this intense warming context, China has experienced frequent AHWs and MHWs in recent decades (X. Ding et al., 2010; Ren and Zhou, 2014; Luo and Lau, 2017; Chen and Zhou, 2018; Deng et al., 2019; Li et al., 2019), which have caused severe negative impacts on agricultural ecosystems, aquaculture production, and the local economy (Sun et al., 2014; Yang et al., 2017; Yang J. et al., 2019; Shen et al., 2020; Yao et al., 2020). Therefore, a comprehensive understanding of AHWs and MHWs in this region would help to better interpret global environmental changes and their impacts.
In this study, we performed a comparative analysis on the spatiotemporal characteristics of AHWs in eastern China and MHWs in the adjacent seas since 1982. Therefore, a unified heatwave definition is used. Furthermore, we explored the connection of heatwaves to large-scale influence factors and underlying mechanisms operating in this region. The results provide a detailed understanding of the historical and future heatwaves since the 1980s in the Anthropocene under the context of global warming and intra- and inter-actions across the land, atmosphere, and ocean, which will have implications for making effective warming-mitigation strategies regionally and globally.
2 Data and methods
2.1 Study area
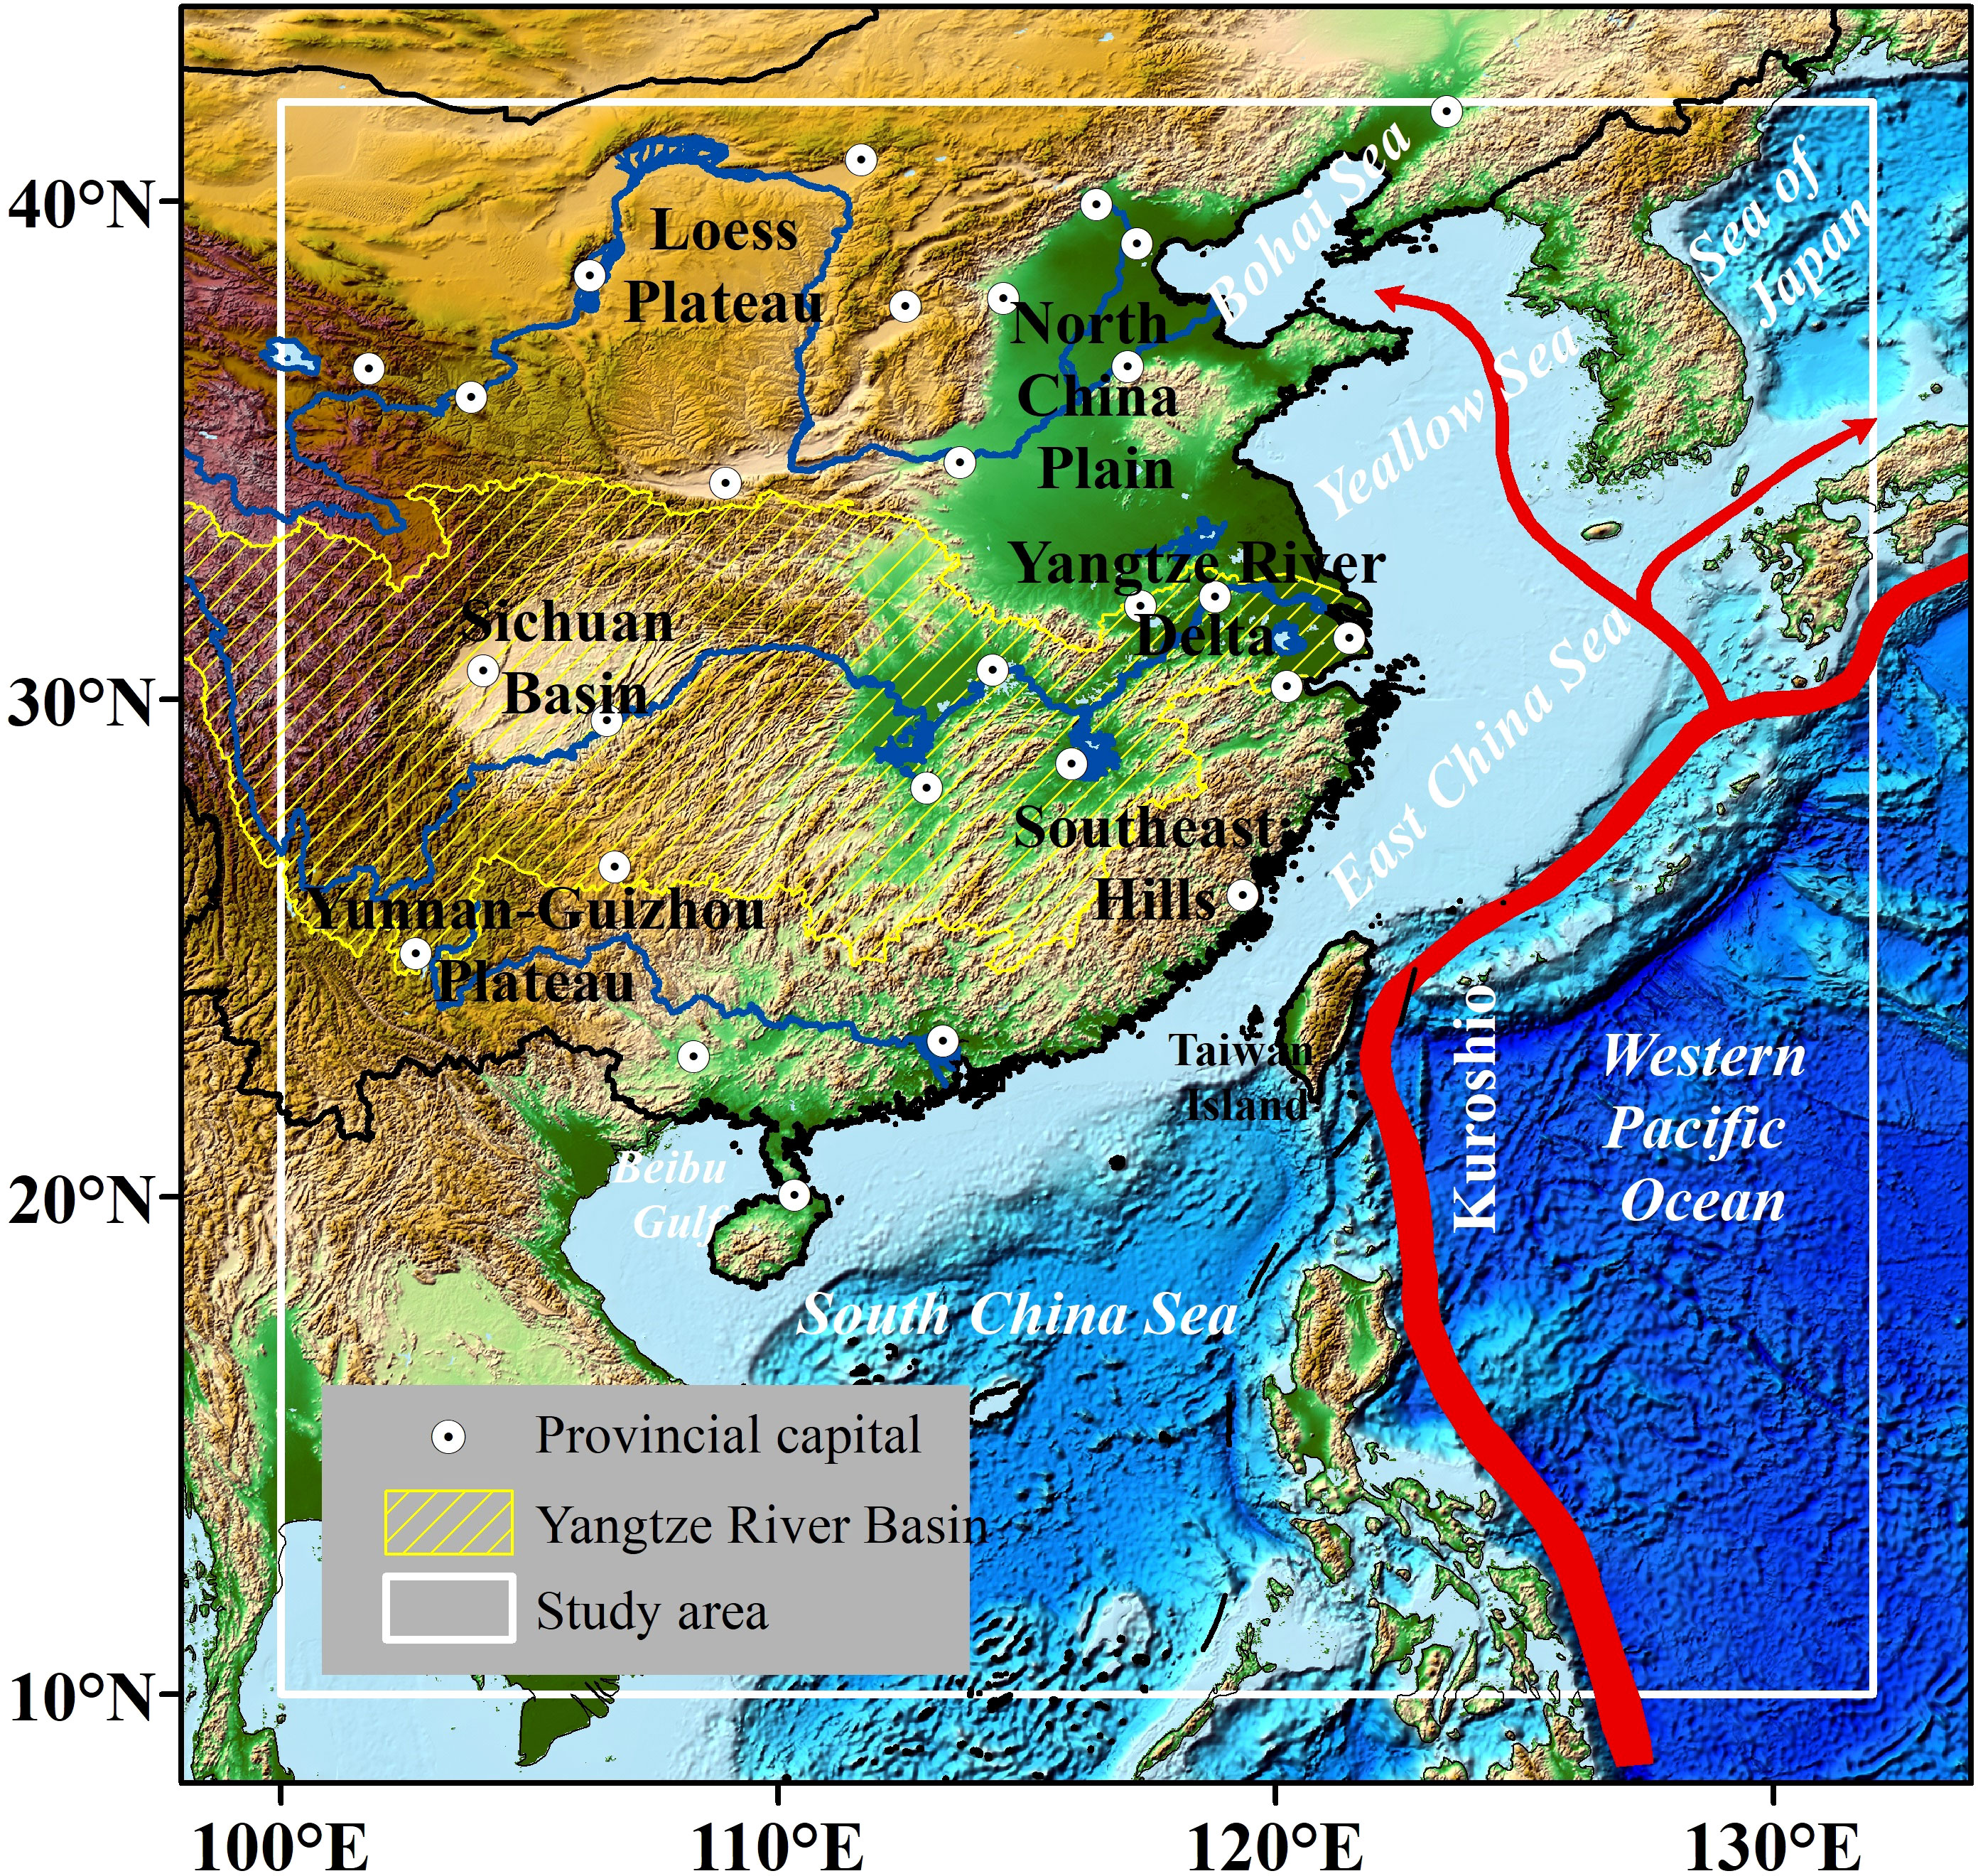
Our study area (10°N-42°N and 100°E-132°E, Figure 1) includes most of the central and eastern land area of China and its adjacent seas, i.e., four marginal seas that border China (including Bohai Sea, Yellow Sea, East China Sea, and South China Sea), part of the Sea of Japan, and part of the western Pacific Ocean. The land area is densely populated and characterized by accelerated urbanization and large-scale agriculture and aquaculture (FAO, 2019). Therefore, China has become a hotspot area for AHWs in recent years (Wang et al., 2017), with several “furnace cities” located in the Yangtze River Basin. The sea area displays various geographical, hydrological, and ecological properties and details were presented in a previous study (Yao et al., 2020).
2.2 Data sources
2.2.1 Observational and reanalysis data
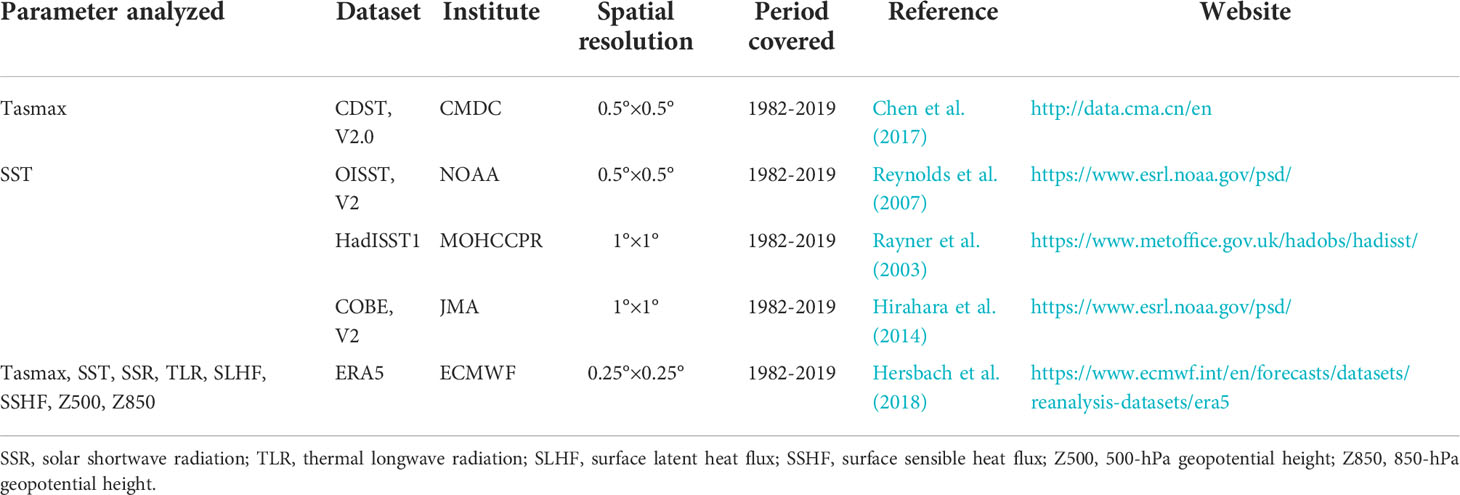
Table 1 presents the observational and reanalysis datasets used in this study. The daily near-surface (2 m above the land surface) maximum air temperature (Tasmax) was obtained from the China Daily Surface Temperature Dataset (CDST, V2.0) released by the China Meteorological Data Service Center (CMDC) based on observations from 2472 surface meteorological stations in China (Chen et al., 2017). The daily satellite SST data were obtained from the Optimum Interpolation Sea Surface Temperature (OISST) High-Resolution Dataset Version 2 (V2) produced by the National Oceanic and Atmospheric Administration (NOAA) (Reynolds et al., 2007). The OISST V2 data were interpolated into a 0.5° × 0.5° spatial resolution in consistency with CDST V2.0. Data from the Hadley Centre Sea Ice and Sea Surface Temperature Dataset Version 1 (HadISST1) developed by the Met Office Hadley Centre for Climate Prediction and Research (MOHCCPR) (Rayner et al., 2003) and Centennial In Situ Observation‐Based Estimates of the variability of Sea Surface Temperature (COBE) Dataset Version 2 (V2) released by the Japan Meteorological Agency (JMA) (Hirahara et al., 2014) were also used to verify the linear variation trend of OISST.
We also used data from the fifth-generation global atmospheric reanalysis dataset of ERA5 released by the European Centre for Medium-Range Weather Forecasts (ECMWF) to provide hourly estimates for abundant atmospheric, land, and ocean variables since 1979 and investigate the dominant drivers of heatwaves (Hersbach et al., 2018). The variables used in this study include the daily Tasmax, SST, solar shortwave radiation, thermal longwave radiation, surface latent heat flux, surface sensible heat flux, and 500-hPa/850-hPa geopotential height fields.
2.2.2 Future data from the CMIP6 models
The daily Tasmax and SST outputs of the Coupled Model Intercomparison Project Phase 6 (CMIP6) models were used to project heatwaves for the future period 2021-2100 (Eyring et al., 2016) (Tables S1 and S2). The future scenarios in CMIP6 projections use the consensus-based Shared Socioeconomic Pathways (SSPs) (O'Neill et al., 2016). In this study, we analyzed two SSP scenarios for the 21st century, i.e., the medium-emission SSP2-4.5 and high-emission SSP5-8.5. The modeling data were interpolated into a 0.5° × 0.5° spatial resolution for consistency.
To examine the performance of the models used, we first compared the historical simulations by 27 atmospheric models and 20 ocean models with observation datasets in terms of the root mean square error (RMSE) and correlation coefficient (Figure S1), and then compared the linear trends of the historical simulations of models that meet the above two requirements with the observation data (Figure S2). The results showed that three atmospheric models (FGOALS-g3, NorESM2-LM, and NorESM2-MM) and four ocean models (ACCESS-ESM1-5, BCC-CSM2-MR, IPSL-CM6A-LR, and EC-Earth3) have better performance. Besides, the method of the multi-model ensemble mean with equal weight across models was employed to reduce model uncertainty.
2.2.3 Population data
We utilized the grid-based yearly population data in combination with the observed yearly number of AHWs to evaluate the yearly persons affected by AHWs (PAHWs) in the past and future. The 1 km × 1 km grid spatial distributions of the population density of China for the years 1990, 1995, 2000, 2005, 2010, and 2015 were obtained from the Data Center for Resources and Environmental Sciences, Chinese Academy of Sciences (RESDC) (Xu, 2017). The future provincial population of China per year for the period 2010-2100 projected under the consensus-based SSPs were obtained from Chen et al. (2020) and downscaled to the same spatial resolution of 1 km × 1 km. The PAHWs per grid were thus calculated as the population density multiplied by the corresponding number of AHWs per year.
2.3 Methods
2.3.1 Definition of heatwaves
In general, heatwave is defined as a period of several consecutive days with daily temperature measures exceeding a specific (absolute or relative) threshold (Yang J. et al., 2019). The temperature measures used for AHW definitions remain diverse in studies around the world (D'Ippoliti et al., 2010; Wang et al., 2012; Chen et al., 2015; Zhang et al., 2015). According to China Meteorological Administration, an AHW is defined as a period for at least three consecutive days with daily Tasmax over 35°C (Tan et al., 2010). An MHW is usually defined as a period with daily SST exceeding the 90th percentile of its seasonal variations for at least five consecutive days (Hobday et al., 2016). Considering the significant difference in the regional climatology and the need for a consistent and comparable definition of heatwaves, a relative threshold for heatwaves was adopted in this study. Heatwave events are identified as the periods when daily Tasmax or SST are above their 90th percentile for at least five consecutive days (Hobday et al., 2016; Chen et al., 2017; Freychet et al., 2017). Since damage to humans, flora and fauna are frequently reported to accompany the extreme high-temperature events on land (Jun et al., 2013; Xu et al., 2016; Yang J. et al., 2019; Chen et al., 2022), while marine pelagic life are able to move to cooler areas/depths at the hottest moment but could be negatively impacted by all-day-long persisting warm seawater conditions (Jacox et al., 2020), we use daily Tasmax for AHWs and SST for MHWs in consistence with the common heatwave definitions. This helps to maximize the comparability and reference significance of this study to other heatwave-related studies. The 90th percentile was calculated for each calendar day using daily temperature data within an 11-day window centered on the data across all years within the climatology period, and then smoothed by applying a 31‐day moving average. This seasonally varying relative threshold enables the identification of heatwave events throughout the year (Hobday et al., 2016). The fixed climatology baseline in our study is 1982-2019.
2.3.2 Heatwave indexes
Based on previous studies (Hobday et al., 2016; Oliver et al., 2017; Oliver et al., 2018), we used four indexes to describe the characteristics of AHWs and MHWs, i.e., the yearly number of heatwaves (HWN), yearly total days of heatwaves (HWT), average duration of heatwaves within a year (HWDU), and average intensity of heatwaves within a year (HWI). Their definitions are listed in Table 2. To clarify the air-sea interaction with the dominant modes of AHWs/MHWs, an integral index of heatwave total intensity (HWTI), calculated as HWT × HWI, was used to explore the AHWs and MHWs’ principal modes (Yao and Wang, 2021).
In addition, we also used the empirical orthogonal function analysis to obtain the leading modes of AHW and MHW variability. The significance level (p) was calculated using the Mann-Kendall test.
3 Results
3.1 Spatial and temporal characteristics of AHWs and MHWs during 1982-2019
Figure 2 shows the spatial distributions of the metrics of AHWs in eastern China and MHWs in the adjacent seas during 1982-2019. On the land, the multi-year average HWT of AHWs is high in the Yangtze River Basin and Yunnan-Guizhou Plateau in the southwestern part of the land area, ranging 8-14 days yr-1; that of MHWs is high in the western Sea of Japan, east of the Taiwan Island, and Beibu Gulf in the northern South China Sea, ranging 25-30 days yr-1 (Figure 2A). The spatial distribution of the multi-year average HWN of AHWs is similar to that of HWT, with high values of 1.2-1.9 counts yr-1; the HWN of MHWs is high in the southern Yangtze River Estuary, Taiwan Strait, and the northern South China Sea, ranging 2.4-2.7 count yr-1 (Figure 2B). The multi-year average HWDU of AHWs is high in the Yunnan-Guizhou Plateau in the southwestern area, with values of 7.0-8.6 days/count; that of MHWs is high in the western Sea of Japan, on the east of the Taiwan Island, and in the southern South China Sea, with values of 16.0-18.3 days/count (Figure 2C). High multi-year average HWI of AHWs is observed in the southern and middle Yangtze River Basin and generally exceeds 6°C/count; high multi-year average HWI of MHWs appears in the Bohai Sea, Yellow Sea, and the Sea of Japan, with an increasing trend from low-latitude to high-latitude seas (Figure 2D).
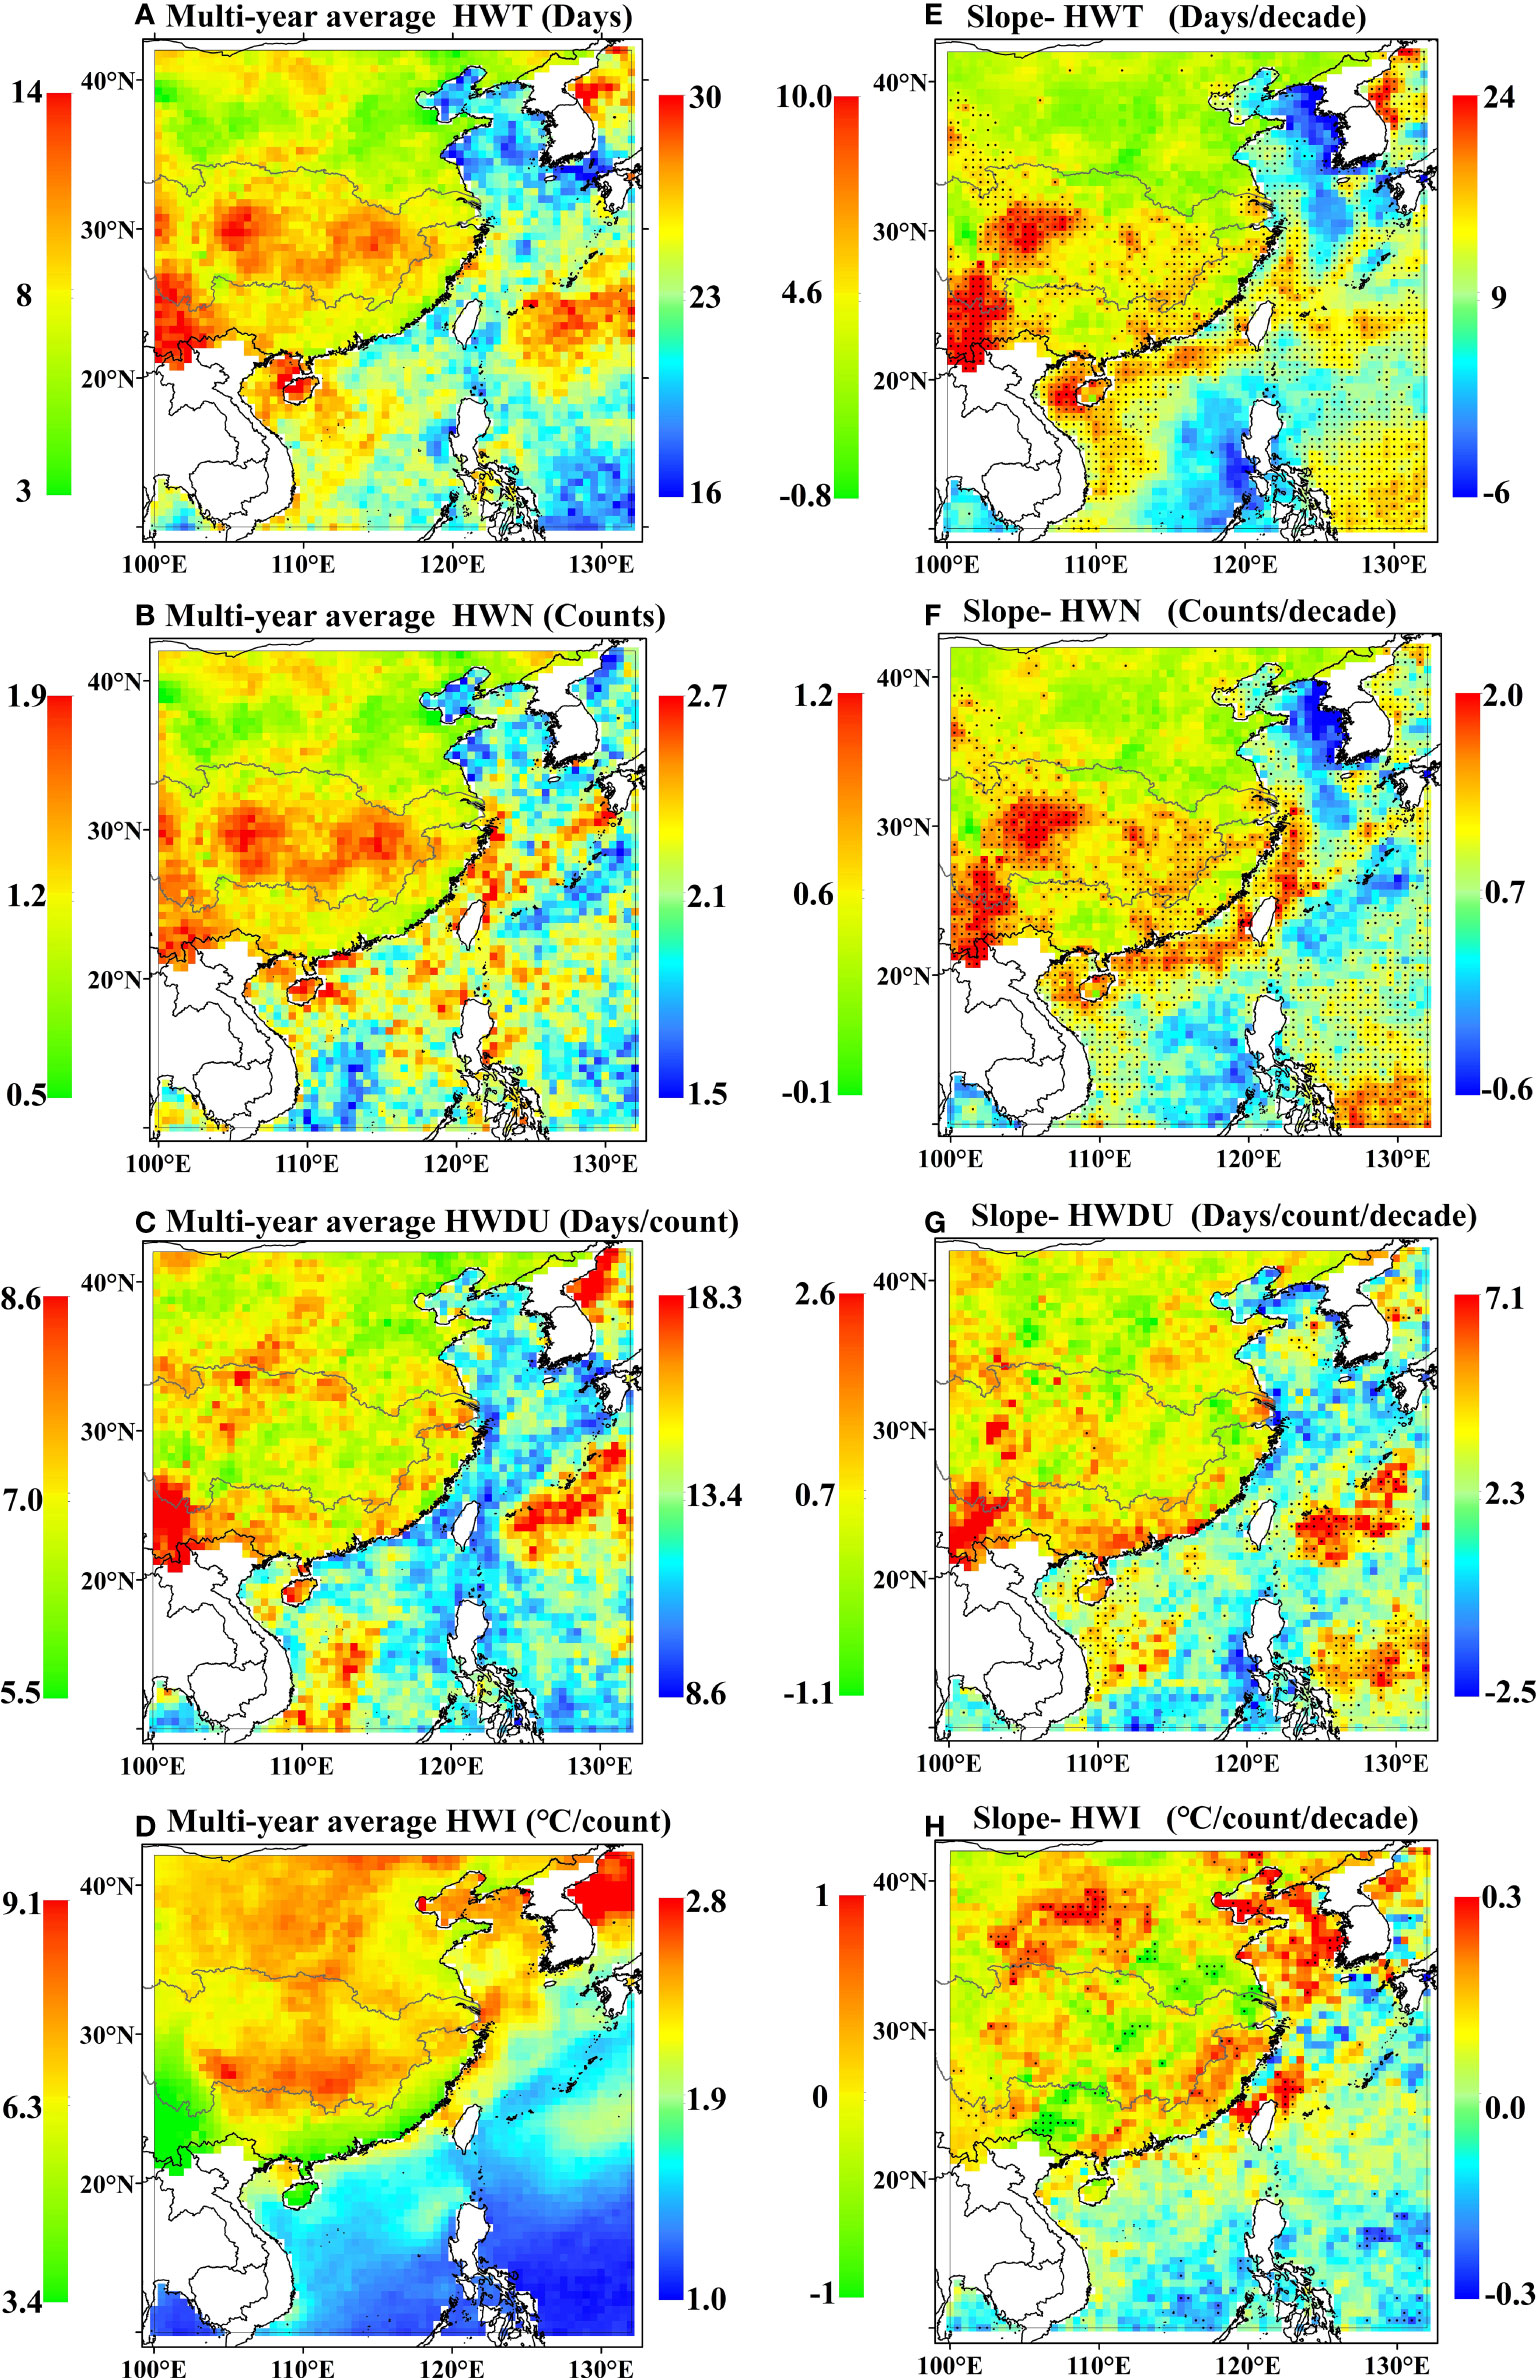
Figure 2 Spatial distributions of the multi-year averages (left column) and linear variation trends (right column) of the analyzed indexes of AHWs in eastern China and MHWs in adjacent seas during 1982-2019: (A, E) HWT, (B, F) HWN, (C, G) HWDU, and (D, H) HWI. The inland area bordered by the gray line represents the Yangtze River Basin. Left legends are for AHWs and right legends are for MHWs. In the figures on the right, the dots indicate grids with a confidence level > 99%.
The spatial distribution patterns of the increased linear trends of the HWT and HWN during 1982-2019 are similar. In the Yangtze River Basin and Yunnan-Guizhou Plateau in the southwestern area, the HWT and HWN of AHWs increase rapidly by 5-10 days decade-1 and 0.6-1.2 count decade-1, respectively (Figures 2E, F). The most rapid increases in the HWT and HWN of MHWs appear in the western Sea of Japan, Chinese nearshore waters, and east of the Philippine Islands, with increase rates of 15-24 days decade-1 and 1-2 counts decade-1, respectively. The most rapid increase in the HWDU of AHWs appears in the Yunnan-Guizhou Plateau with an increase rate of 1.5-2.6 days/count decade-1, and that of MHWs appear in the east of Taiwan Island and the Philippine Islands, with an increase rate of 3.0-7.1 days/count decade-1 (Figure 2G). The HWI shows an increasing trend across most of the land and sea, and its rapid increases appear in the northern and southeastern land areas for AHWs (with rates of 0.5-1.0 °C/count decade-1) and the Bohai Sea, Yellow Sea, and northern Taiwan Strait for MHWs (with rates of 0.2-0.3 °C/count decade-1), respectively. The decreased linear trends of the HWT and HWN for AHWs mainly occur in the north of the Yangtze River Basin, while the decreased linear trends for MHWs are mainly in the Bohai Sea and East China Sea, such as HWT and HWN metrics (Figures 2E, F).
The regionally averaged (area-weighted) HWT and HWN of AHWs increase rapidly with increase rates of 1.5 days decade-1 and 0.2 counts decade-1, respectively (p< 0.01). The increase rates of the HWT and HWN of MHWs are nearly five-fold and two-fold higher than those of AHWs, respectively. The regionally averaged HWDU of MHWs increases with a rate of 1.2 days/count decade-1 (p< 0.01; Figure 3C). The regionally averaged HWI of AHWs and MHWs remain almost unchanged (Figure 3D).
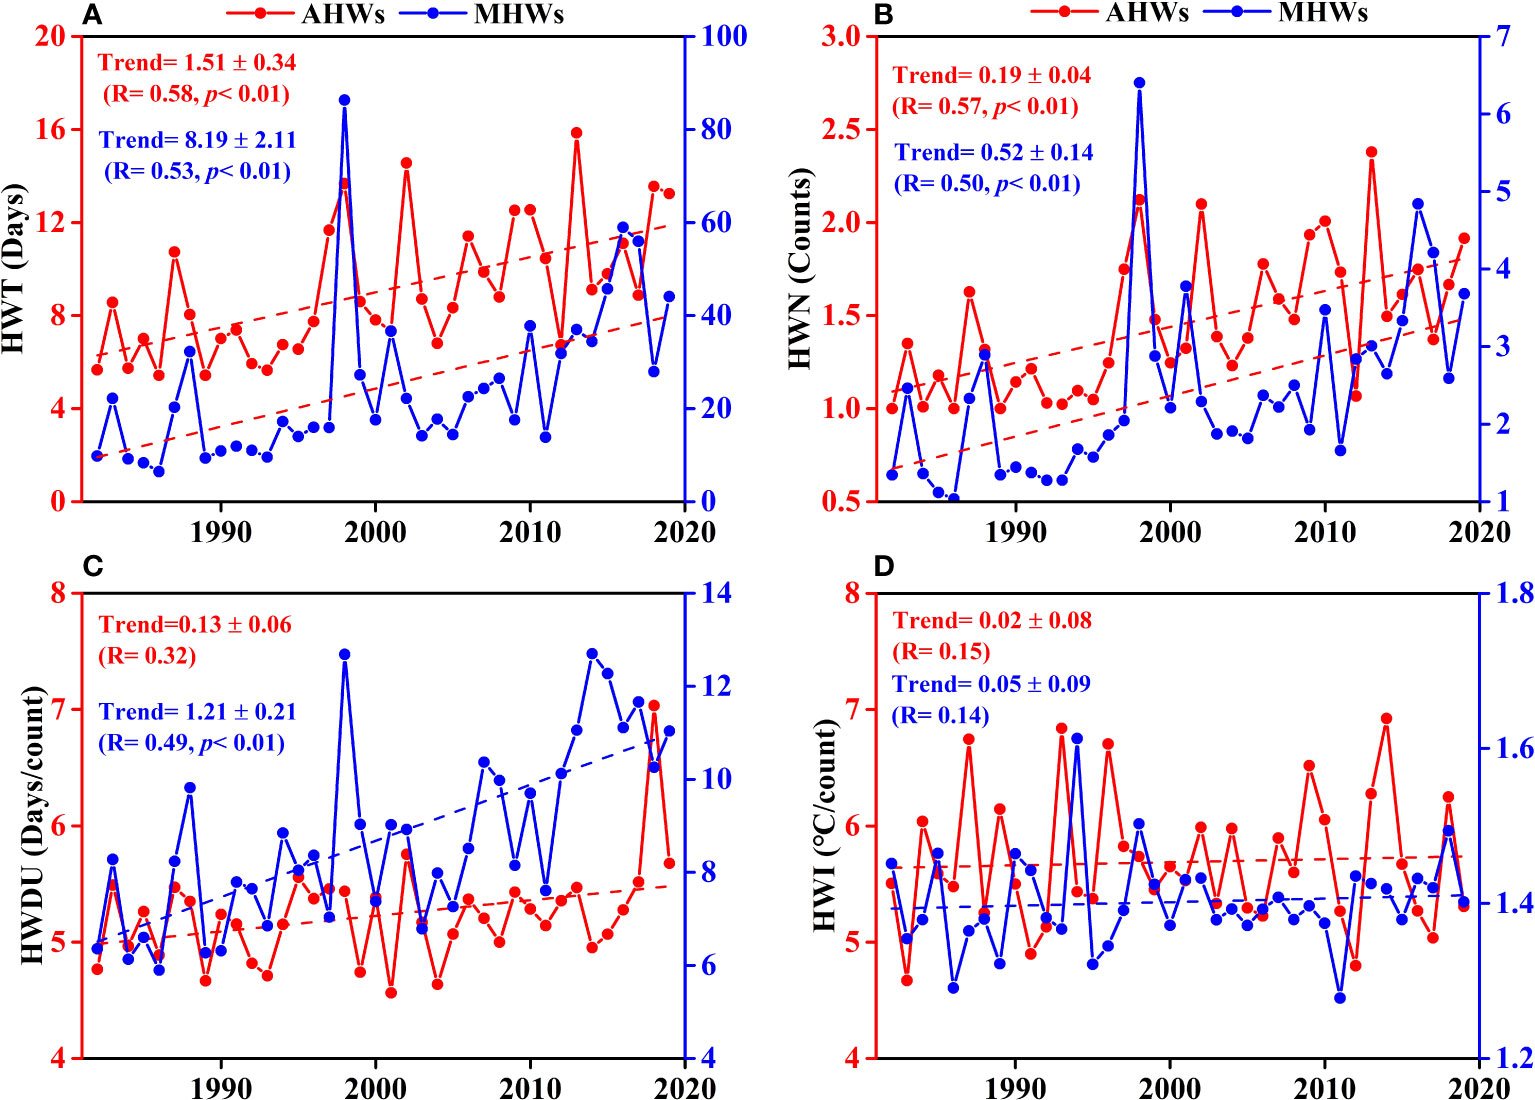
Figure 3 Temporal variations of the regionally averaged (A) HWT, (B) HWN, (C) HWDU, and (D) HWI of AHWs in eastern China and MHWs in the adjacent seas during 1982-2019. The dashed lines represent the linear variation trends of the indexes of AHWs and MHWs. Trends in the figures indicate the variation rates of the heatwave metrics per decade.
3.2 Spatial characteristics of AHWs and MHWs for the period 2020-2100
During 2020-2100 under SSP2-4.5, the multi-year average HWT of AHWs will be high in the south and west of eastern China, ranging 50-80 days yr-1, and that of MHWs will be high in the Bohai Sea, Yellow Sea, and east of the Philippine Islands, ranging 280-320 days yr-1 (Figure 4A). The high multi-year average HWN of 6-10 counts yr-1 for AHWs will occur in the south and west of the eastern Chinese land and that of 4.5-6.5 counts yr-1 for MHWs will occur in the Bohai and Laizhou Bays of the Bohai Sea, near Taiwan Island and in the nearshore area of the South China Sea. An opposite spatial correspondence is observed between the multi-year average HWN and HWT for MHWs (Figure 4B). The high multi-year average HWDU values of 8-11 days/count for AHWs and 160-200 days/count for MHWs will appear in the areas with also high HWTs (Figure 4C). Despite different spatial patterns of the multi-year average HWT, HWN, and HWDU of AHWs during the historical period (Figure 2), their spatial patterns will be similar during the future period under SSP2-4.5. The multi-year average HWI of AHWs will exceed 6°C/count in most areas but will be lower in the south and west of eastern China, where the HWT and HWN will be higher. The multi-year average HWI of MHWs will be high in the Bohai Sea, Yellow Sea, and the Sea of Japan, with obvious differences between the tropical and temperate seas (Figure 4D).
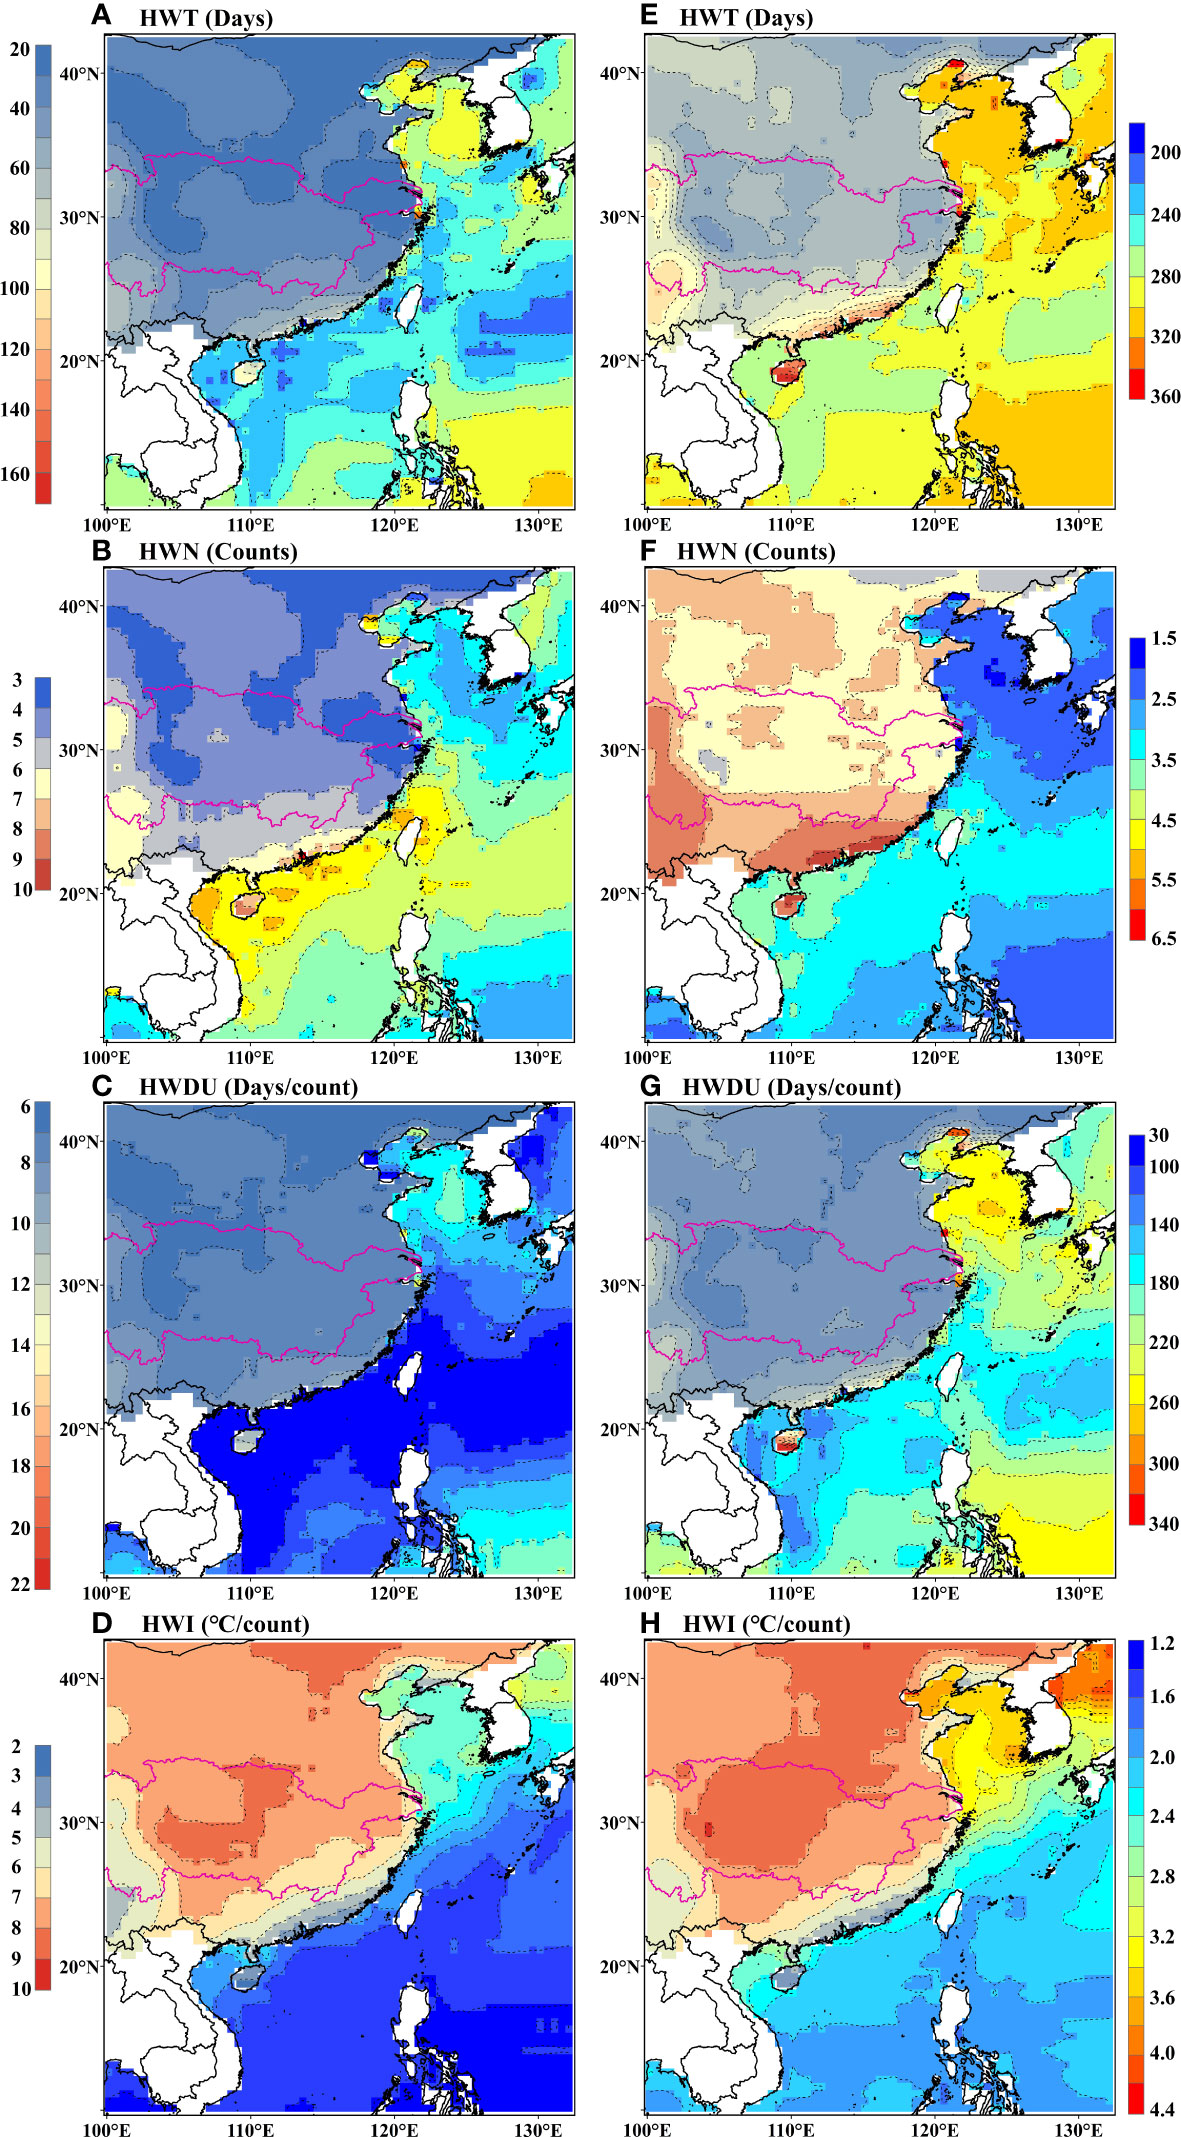
Figure 4 Projected spatial distributions of the multi-year average (A, E) HWT, (B, F) HWN, (C, G) HWDU, and (D, H) HWI of AHWs in eastern China and MHWs in the adjacent seas during 2020-2100 under SSP2-4.5 (left column) and SSP5-8.5 (right column) using the multi-model ensemble mean method. Left legends are for AHWs and right legends are for MHWs; the pink line represents the boundary of the Yangtze River Basin.
Contrary to those under SSP2-4.5, the metrics of AHWs and MHWs during 2020-2100 under SSP5-8.5 will be much higher. The high multi-year average HWT of 90-170 days yr-1 for AHWs will occur in the south and west of eastern China while that of 280-340 days yr-1 for MHWs will occur across most of the sea area except part of the South China Sea and Western Pacific. In the Liaodong Bay and the central Bohai Sea, the multi-year average HWT of MHWs is even close to 365 days (Figure 4E). The multi-year average HWN of AHWs will be high in western and southern China, ranging from 7 to 10 counts yr-1. The spatial pattern of the multi-year average HWN of MHWs will be opposite to those of the HWT and HWDU and the multi-year average HWN will be high in the South China Sea and central Western Pacific Ocean, reaching 3.0-4.5 counts yr-1 (Figure 4F). The spatial distribution pattern of the multi-year average HWDU will be similar to that of the multi-year average HWT, and the highest multi-year average HWDU will range from 11-22 days/count for AHWs and 240-320 days/count for MHWs (Figure 4G). The multi-year average HWI of AHWs will be high in most of eastern China, especially in the central and northern areas, reaching 7-10 °C/count. The multi-year average HWI of MHWs will show an obvious north-to-south differentiation pattern across the sea area with high values of 3.2-4.4 °C/count in the Bohai Sea, Yellow Sea, and the Sea of Japan (Figure 4H).
3.3 Temporal characteristics of AHWs and MHWs for the period 2020-2100
For AHWs, the regionally averaged metrics show rapid increasing trends both under SSP2-4.5 and SSP5-8.5 (Figures 5A–H). For example, the HWT reached 60 days yr-1 (under SSP2-4.5) and 160 days yr-1 (under SSP5-8.5) by the end of the 21st century with increase rates of 6.58 ± 0.35 and 22.51 ± 0.65 days decade-1, respectively. The increase rates of the regionally averaged HWT and HWN will be ~4 times higher during 2020-2100 under SSP2-4.5 than during 1982-2019, respectively (Table S3). The increase rates of the regionally averaged metrics (HWT, HWN, HWDU and HWI) of AHWs will be much higher under SSP5-8.5 during 2020-2100 and equal to 3.4, 2.4, 4.0, and 3.0 times those under SSP2-4.5, respectively (Table S3).
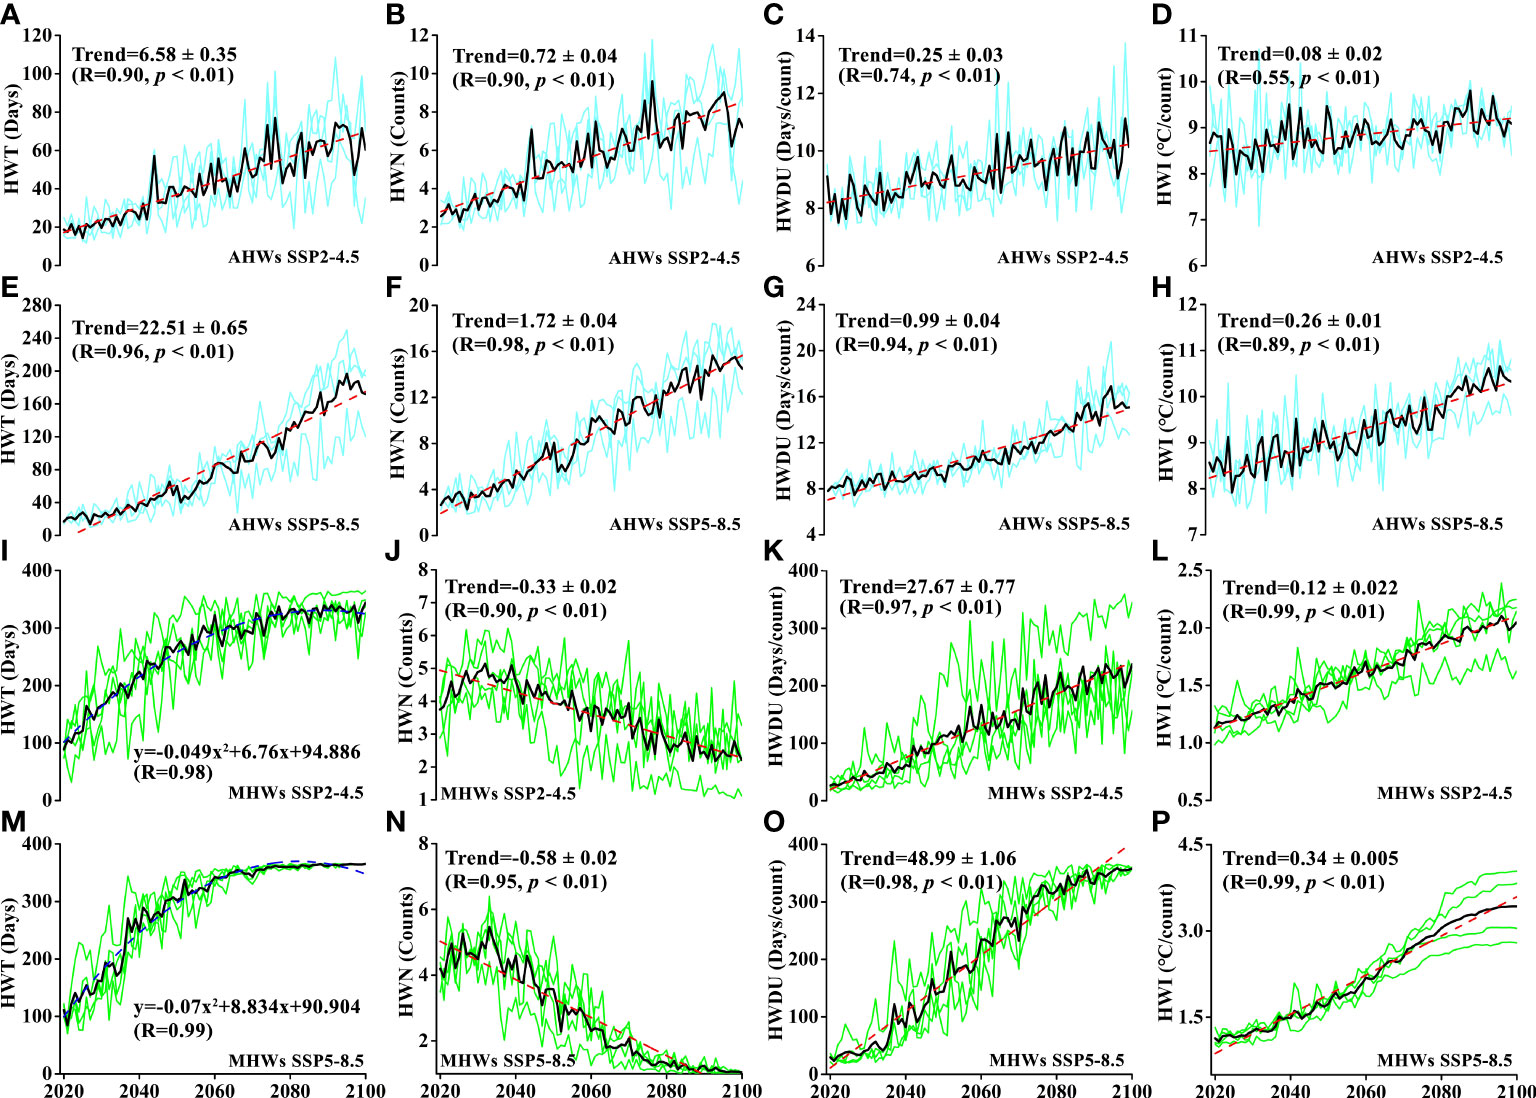
Figure 5 Temporal variation trends of the regionally averaged HWT (first column), HWN (second column), HWDU (third column), and HWI (fourth column) of AHWs in eastern China (A–H) and MHWs in the adjacent seas (I–P) during 2020-2100 under SSP2-4.5 (A–D, I–L) and SSP5-8.5 (E–H, M–P). The black lines represent the data, the dashed red and blue lines represent the linear trends and quadratic fits, respectively. Trends in the figures indicate the variation rates of the heatwave metrics per decade.
For MHWs, the regionally averaged HWT will increase rapidly before 2060 and the increase will stagnate afterwards under both SSP2-4.5 and SSP5-8.5 (Figures 5I, M). The regionally averaged HWDU and HWI will both increase rapidly under SSP2-4.5 and SSP5-8.5 (Figures 5K, O, L, P). Despite a short-term increase before 2035, the future regionally averaged HWN will show a decreasing trend with rates of -0.33 ± 0.02 counts decade-1 under SSP2-4.5 and -0.58 ± 0.02 counts decade-1 under SSP5-8.5 (Figures 5J, N). Compared with the historical period of MHW metrics, the increase rates of the HWDU and HWI will be 23 times and 24 times higher under SSP2-4.5, respectively. However, the variation rate of HWN will shift from positive to negative and decrease faster under SSP5-8.5 than SSP2-4.5 (Table S3). Overall, the biggest difference between future AHWs in eastern China and MHWs in the adjacent seas is that MHWs will become nearly year-round events after 2060 (less frequent but longer lasting), while AHWs will become more and more severe with a faster increase trend.
3.4 Surface net heat flux and air-sea interaction during summer heatwaves
According to the method of classifying the local air-sea relationship proposed by Cayan (1992a, 1992b), if the surface net heat flux (upward as positive) anomaly is positively correlated with the SST variation trend, the sea has a forcing effect on the atmosphere, and vice versa. Here we focus on the extended summer (June to September) to explore the air-sea interaction because the occurrence areas of AHWs and MHWs are relatively large (Figure S6) and have the greatest threats to ecosystems and resident health. The three principal modes account for 25%, 13%, and 9% of the total variance of the HWTI for AHWs during 1982-2019, respectively (Figures 6A–F). The first mode exhibits a general mono-sign pattern over most of eastern China and the corresponding principal component (PC1) displays an increasing trend with interannual variations (p< 0.01; Figures 6A, D). For the HWTI of MHWs, the three principal modes account for 34%, 20%, and 9% of the total variance during 1982-2019, respectively (Figures 6G–L). The spatial pattern of the first mode also exhibits a general mono-sign pattern over the seas, and the corresponding PC1 displays an increasing trend (p< 0.01; Figures 6G, J). Since both AHWs and MHWs show clear positive values in the whole region, we use PC1 of AHWs/MHWs to do the next air-sea interaction analysis.
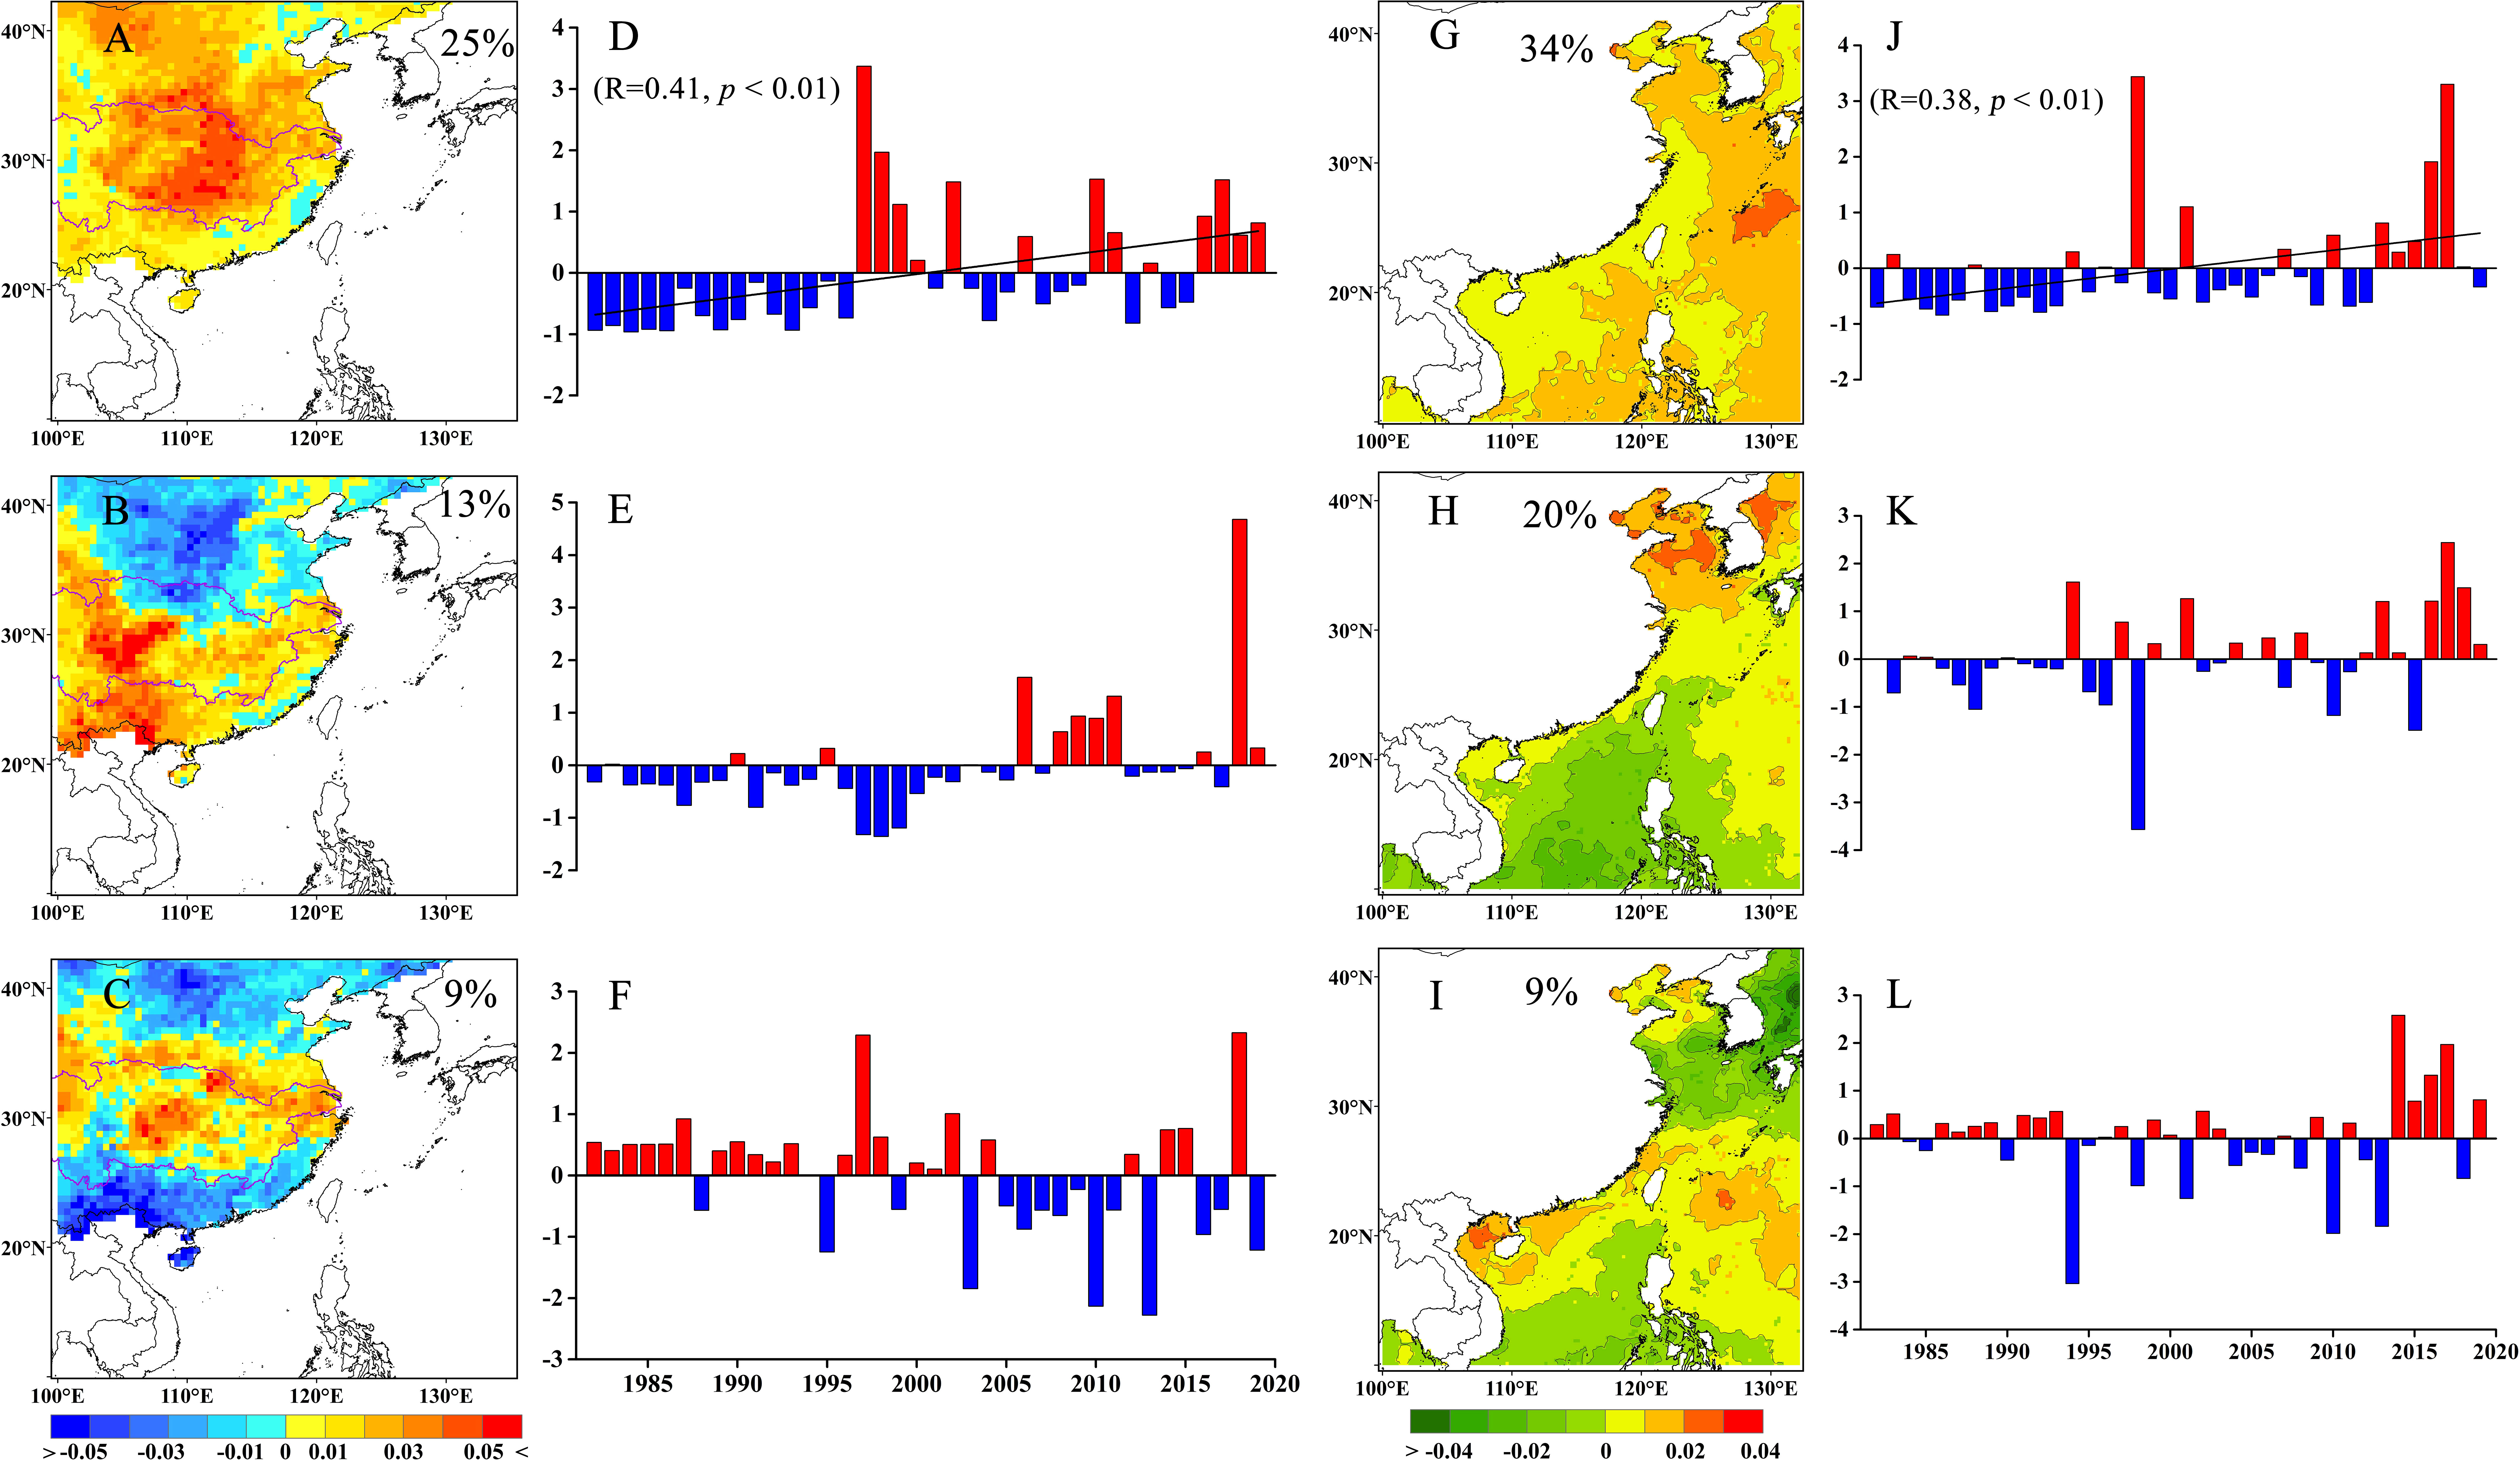
Figure 6 Spatial patterns of HWTI (A–C, G–I) and corresponding principal components (D–F, J–L) for the first three modes of AHWs in eastern China (the left two columns) and MHWs in adjacent seas (the right two columns) during 1982-2019. The numbers in Figure 6 (A–C, G–I) indicate the fractional variance of the EOF modes. The confidence levels of p-values are calculated using the Mann-Kendall trend test.
In the anomalous field corresponding to PC1 of MHWs, the net surface heat flux shows an upward anomaly (p< 0.01) in the coastal seas and northwestern Pacific (20°N-40°N), where the high HWT and HWN of MHWs are also high (Figure 7A). Thus, when MHWs occur, the air-sea interaction in this area is dominated by the forcing effect of the ocean on the atmosphere. In the anomalous field corresponding to PC1 of AHWs, the net surface heat flux in the coastal seas and mid-low latitudes of the western Pacific also shows an upward anomaly (p< 0.01), which suggests that oceans play an important role in the occurrence of summer AHWs (Figure 7B). Furthermore, we performed a regression analysis on each surface flux component separately to explore their roles in the formation of MHWs/AHWs. Significant downward solar shortwave radiation and upward thermal longwave radiation anomalies (p< 0.05) are observed in the tropical and subtropical ocean surface (0°N-20°N, 125°E-180°E), with values of -4~-6 W/m2 and 0.4~1.6 W/m2, respectively (Figures 8A, B). A downward net surface heat flux anomaly is also observed in this region (Figure 7A), which indicates that the atmosphere heats the ocean mainly through the increase in solar shortwave radiation during summer MHWs. Upward surface latent heat flux anomalies are observed in the coastal seas and middle-low latitudes of the western North Pacific, which indicates that the sea heats the atmosphere through the release of latent heat during summer MHWs (Figure 8C). However, the surface sensible heat flux changes little (Figure 8D). Our findings are consistent with the increase in the oceanic surface latent heat flux in the middle and low latitudes of the Pacific in recent decades (Li et al., 2011a; Li et al., 2011b). When summer AHWs occur in eastern China, we can also observe downward solar shortwave radiation and upward surface latent heat flux anomalies, similar to summer MHWs (p< 0.05; Figures S7).
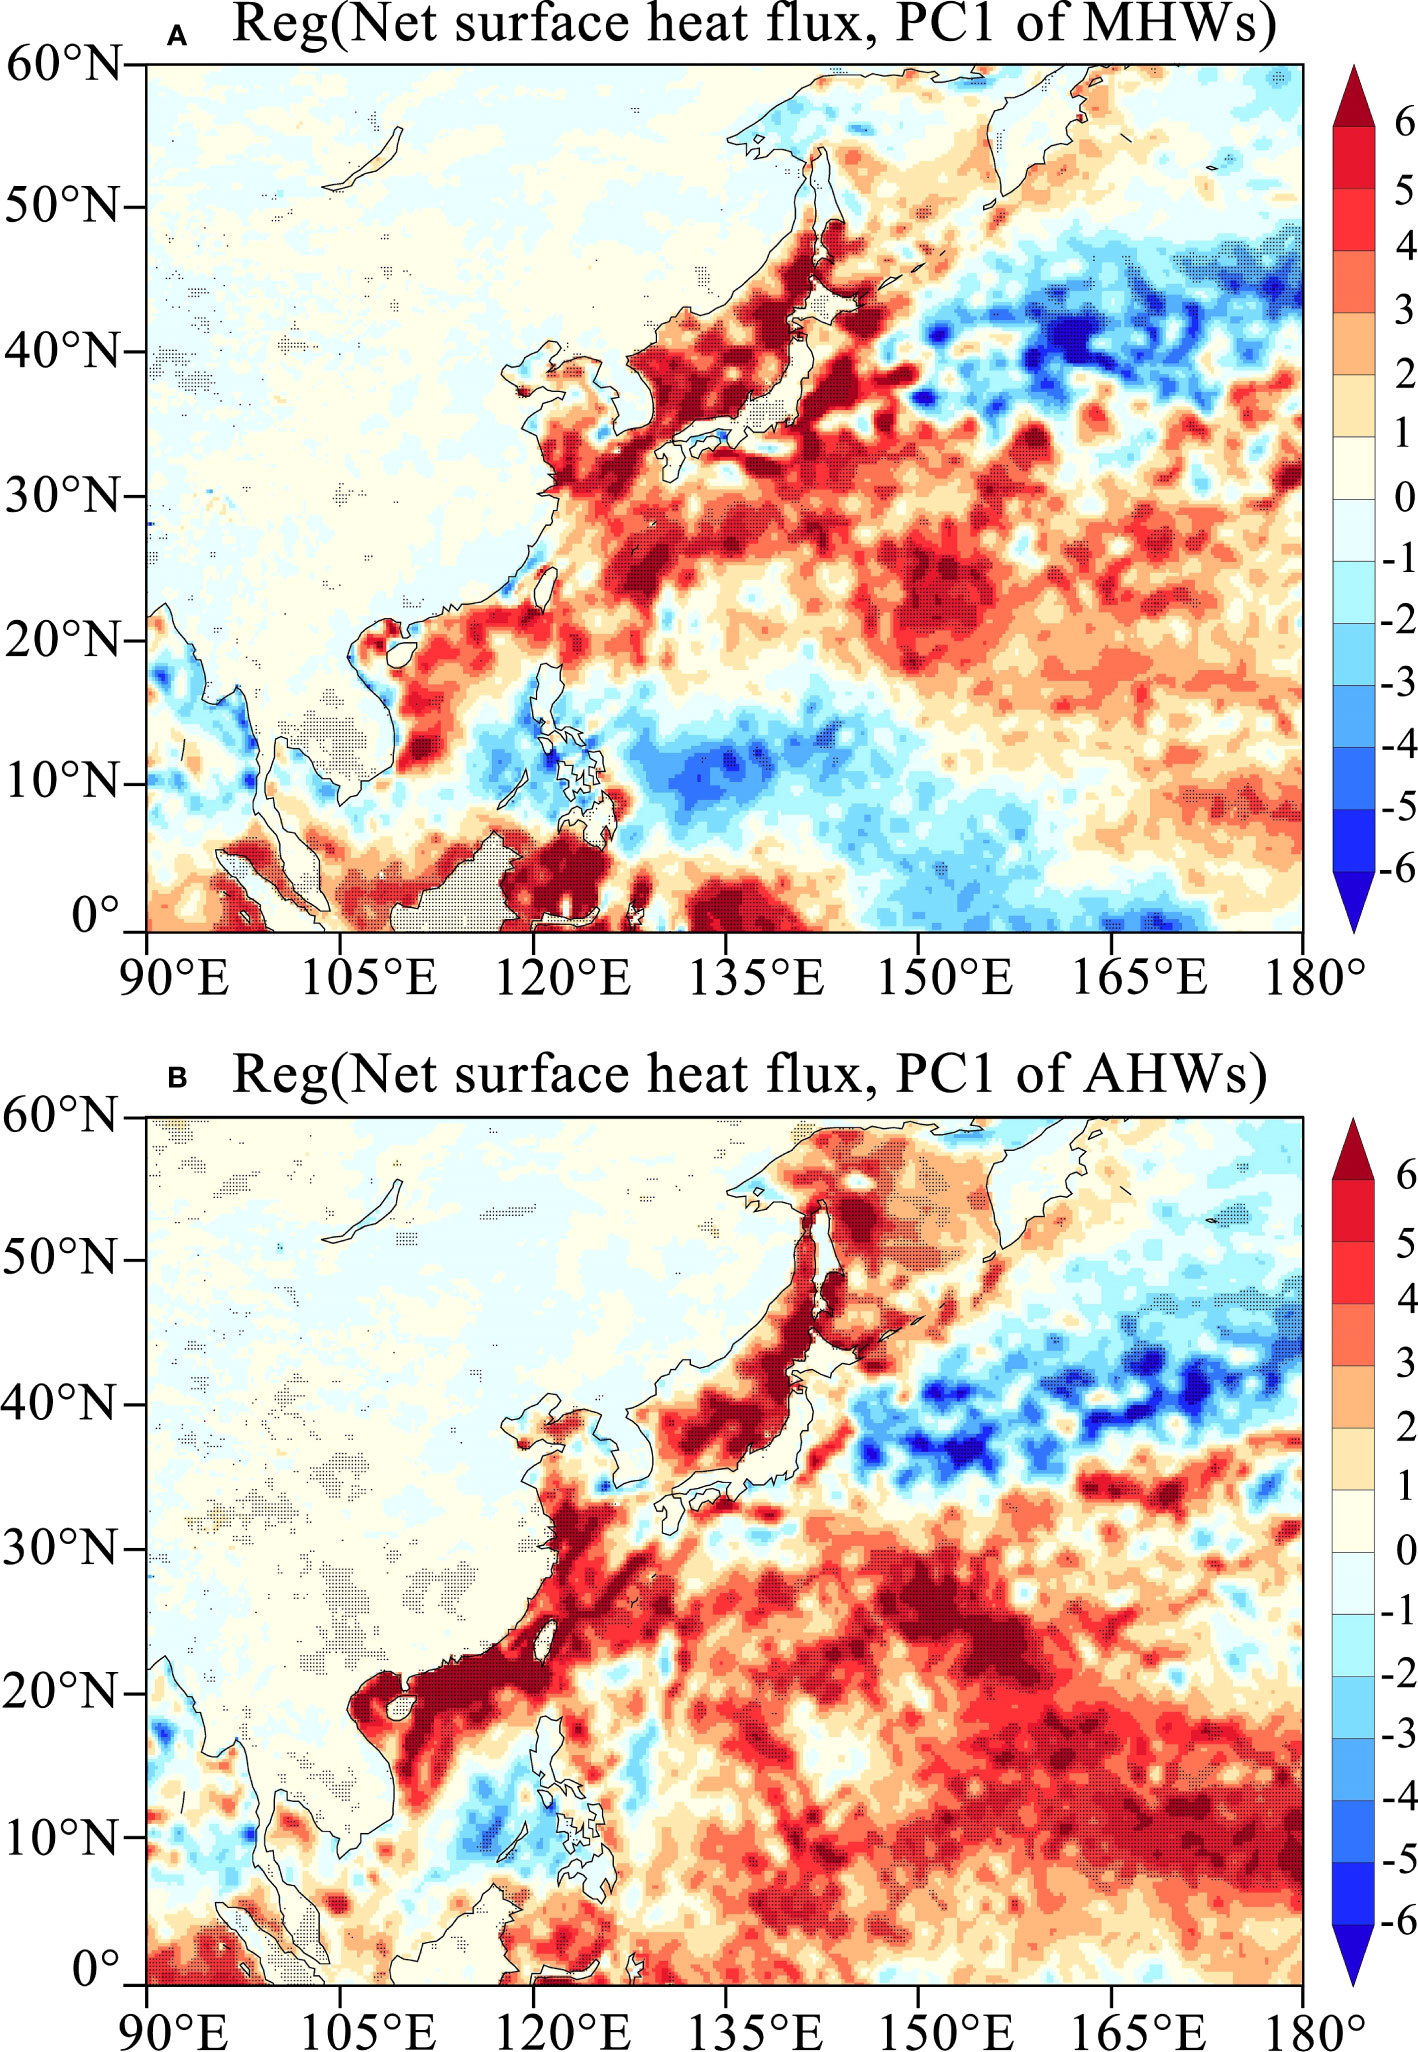
Figure 7 Anomalous summer average net surface heat flux fields (unit: W/m2, upward being positive, with legends on the right) regressed onto time series of the first principal component (PC1) of the HWTI during 1982-2019: (A) for MHWs and (B) for AHWs. The dots indicate grids with a confidence level > 99%.
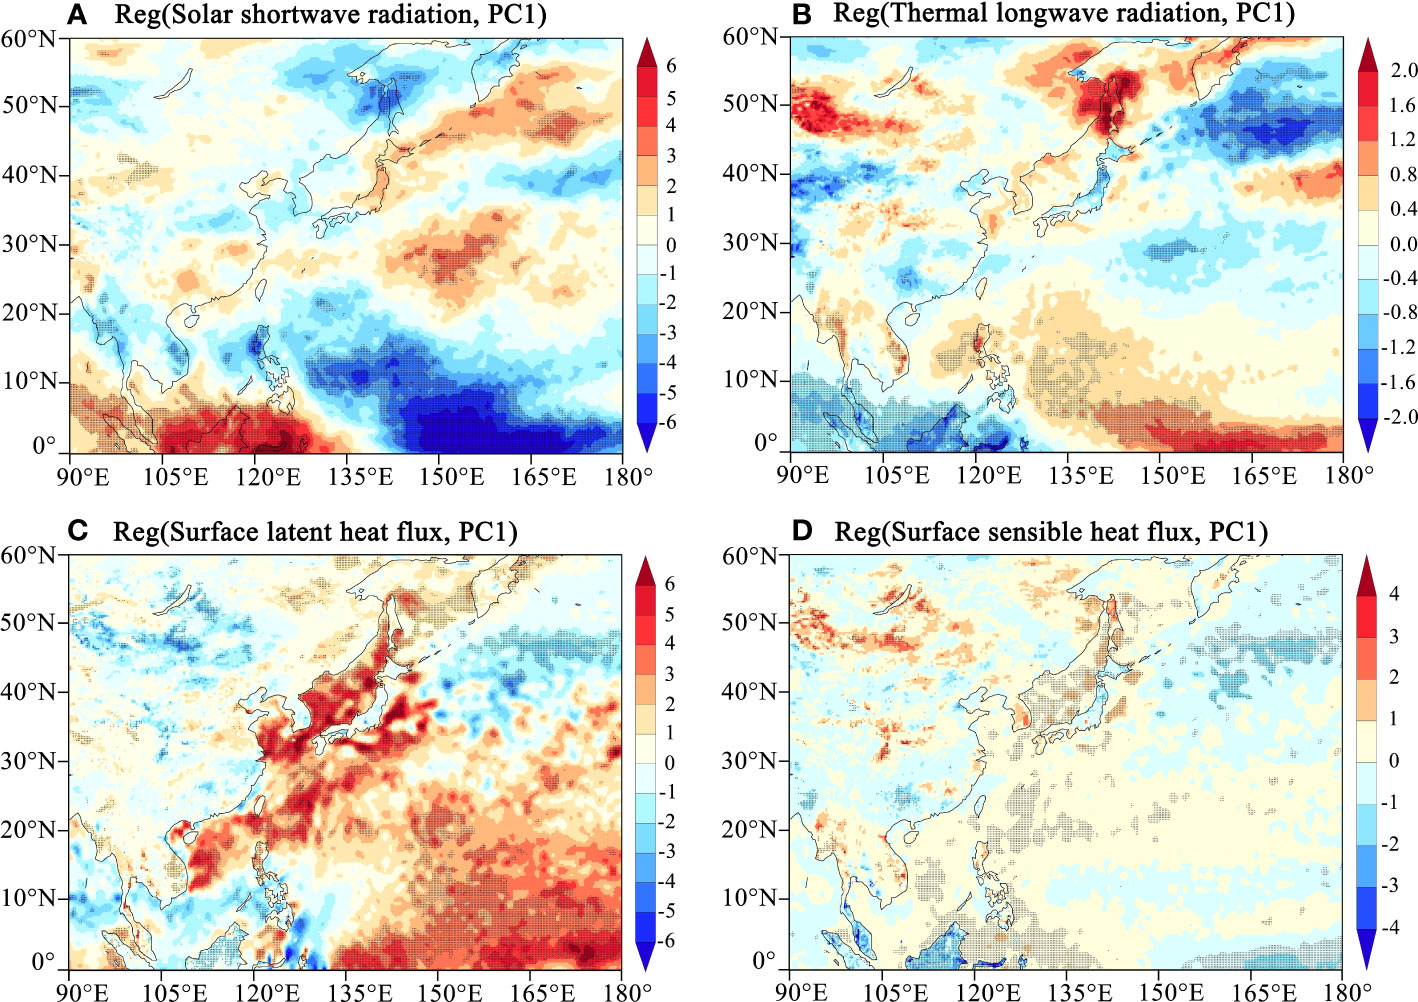
Figure 8 Anomalous summer average fields of (A) solar shortwave radiation, (B) thermal longwave radiation, (C) surface latent heat flux, and (D) surface sensible heat flux (unit: W/m2, upward being positive, with legends on the right) regressed onto the first principal component (PC1) of the HWTI for MHWs during 1982-2019. The dots indicate grids with a confidence level > 99%.
4 Discussions
4.1 Global warming drivers of AHW and MHW trends
Previous studies have documented the significant influence of human-induced global warming on heatwave variability in both atmospheric and oceanic systems and indicated that AHWs and MHWs will worsen with continuous warming (Sun et al., 2014; Zhou et al., 2014; Frölicher et al., 2018; Oliver et al., 2018). In summer (June to August), eastern China has experienced significant warming and the warming rates in the Yangtze River Basin and southwest China even reach 0.3-0.5 °C decade-1; the warming rates of Chinese marginal seas and Sea of Japan are 0.2-0.4 °C decade-1 (p< 0.01; Figure S3A). In winter (December to February), a significant warming trend is observed in eastern China, especially the western region with a rate of 0.4-0.5 °C/decade (p< 0.01); the warming rate of the East China Sea, South China Sea, and Western Pacific Ocean reaches 0.3-0.4 °C/decade (p< 0.01; Figure S3C), which is consistent with the result from Cai et al. (2017). Besides, the temperature from ERA5, COBE, and HadISST1 datasets also verifies the rapidly warming trend in both the summer and winter with high confidence levels (Figures S3 and 4). The significant warming trends in eastern China and its adjacent coastal seas are consistent with the rapid increases in the HWT and HWN of AHWs and MHWs, respectively. Furthermore, the interannual variations of the Tasmax, SST, and HWT anomalies are well correlated, which also means that the variations of MHWs and AHWs are mainly affected by temperature anomalies (Figure S5).
Figure 3 shows that the AHWs and MHWs show significant interannual variations with the higher HWT values usually in strong El Niño years (e.g., 1982-1983, 1997-1998, and 2015-2016; Figure 3A). Previous studies have demonstrated that ENSO influences heatwave likelihood on interannual timescales (Perkins, 2015; Holbrook et al., 2019; Holbrook et al., 2020). Although ENSO can modulate the interannual variation of MHWs (Holbrook et al., 2019; Holbrook et al., 2020), the mechanisms of how it affects AHWs are complex (Wang et al., 2017; Zhou et al., 2019).
4.2 Potential connection between AHWs and MHWs in summer
The anomalous anticyclone over the western North Pacific during the summer with decaying El Niño is an important atmospheric bridge linking ENSO and abnormal climate over East Asia (He et al., 2022). When summer MHWs/AHWs occur, we can find significantly positive correlations between 500-hPa geopotential height and PC1 as well as an anomalous anticyclone appearing in the northern Philippines at 850-hPa field (p< 0.05; Figure 9). Corresponding to the anomalous anticyclone over the northern Philippines is the strengthened western North Pacific subtropical high (WNPSH) in the upper atmosphere. Atmospheric blocking will reduce cloud cover, enhances insolation, and suppresses surface winds, resulting in hot, dry weather (Holbrook et al., 2019; Rodrigues et al., 2019). Many of the AHWs and MHWs are associated with persistent high-pressure systems over the ocean and their resulting air-sea interactions (Li et al., 2015; Wang et al., 2016; Holbrook et al., 2020; Oliver et al., 2020). Notably, El Niño’s decaying summers during the positive phases of the Pacific decadal oscillation will bring more westward extension of a stronger WNPSH (Liu et al., 2019).
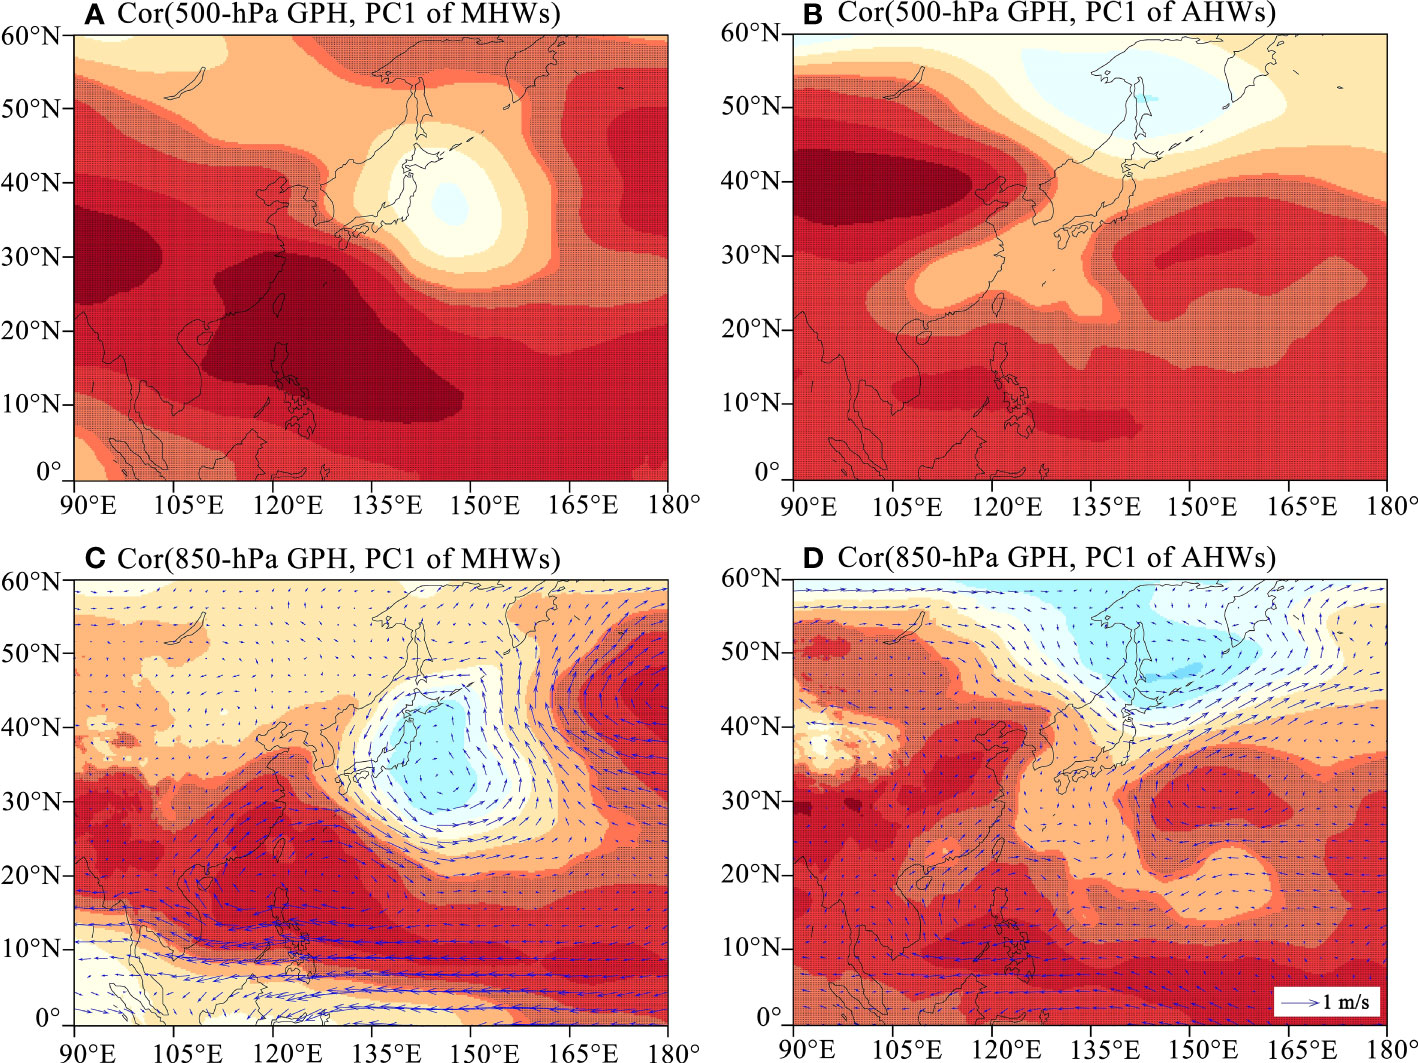
Figure 9 Spatial distribution of the correlation coefficient between summer average atmospheric circulation fields and the first principal component (PC1) of (A, C) MHWs and (B, D) AHWs during 1982-2019: (A, B) 500-hPa geopotential height (GPH) and (C, D) 850-hPa GPH. Vectors indicate anomalous wind (unit: m/s) field regressed onto PC1. The dots indicate grids with a confidence level > 99%.
According to the heatwave drivers discussed above, the possible mechanism of the summer heatwaves in eastern China and its adjacent seas can be illustrated in Figure 10. Under the control of anomalous high-pressure systems (such as WNPSH), eastern China is dominated by clear-sky weather. The near-surface warming due to increased solar radiation will trigger AHWs, which in turn stimulates the release of ocean latent heat. The MHWs induced by increased solar radiation in the sea can also release a large amount of latent heat. Enhanced convection and heating will further drive a stronger anticyclone over the western North Pacific, leading to a stronger and more westward-extending WNPSH. In addition, super El Niño can promote an anomalous WNPSH in decaying summer and release large of ocean heat from the subsurface layer of the tropical northwestern Pacific, which in return increase the global average surface temperature (Yin et al., 2018). Under the combined effects of these processes and the complex local conditions, more serious AHWs and MHWs will emerge.
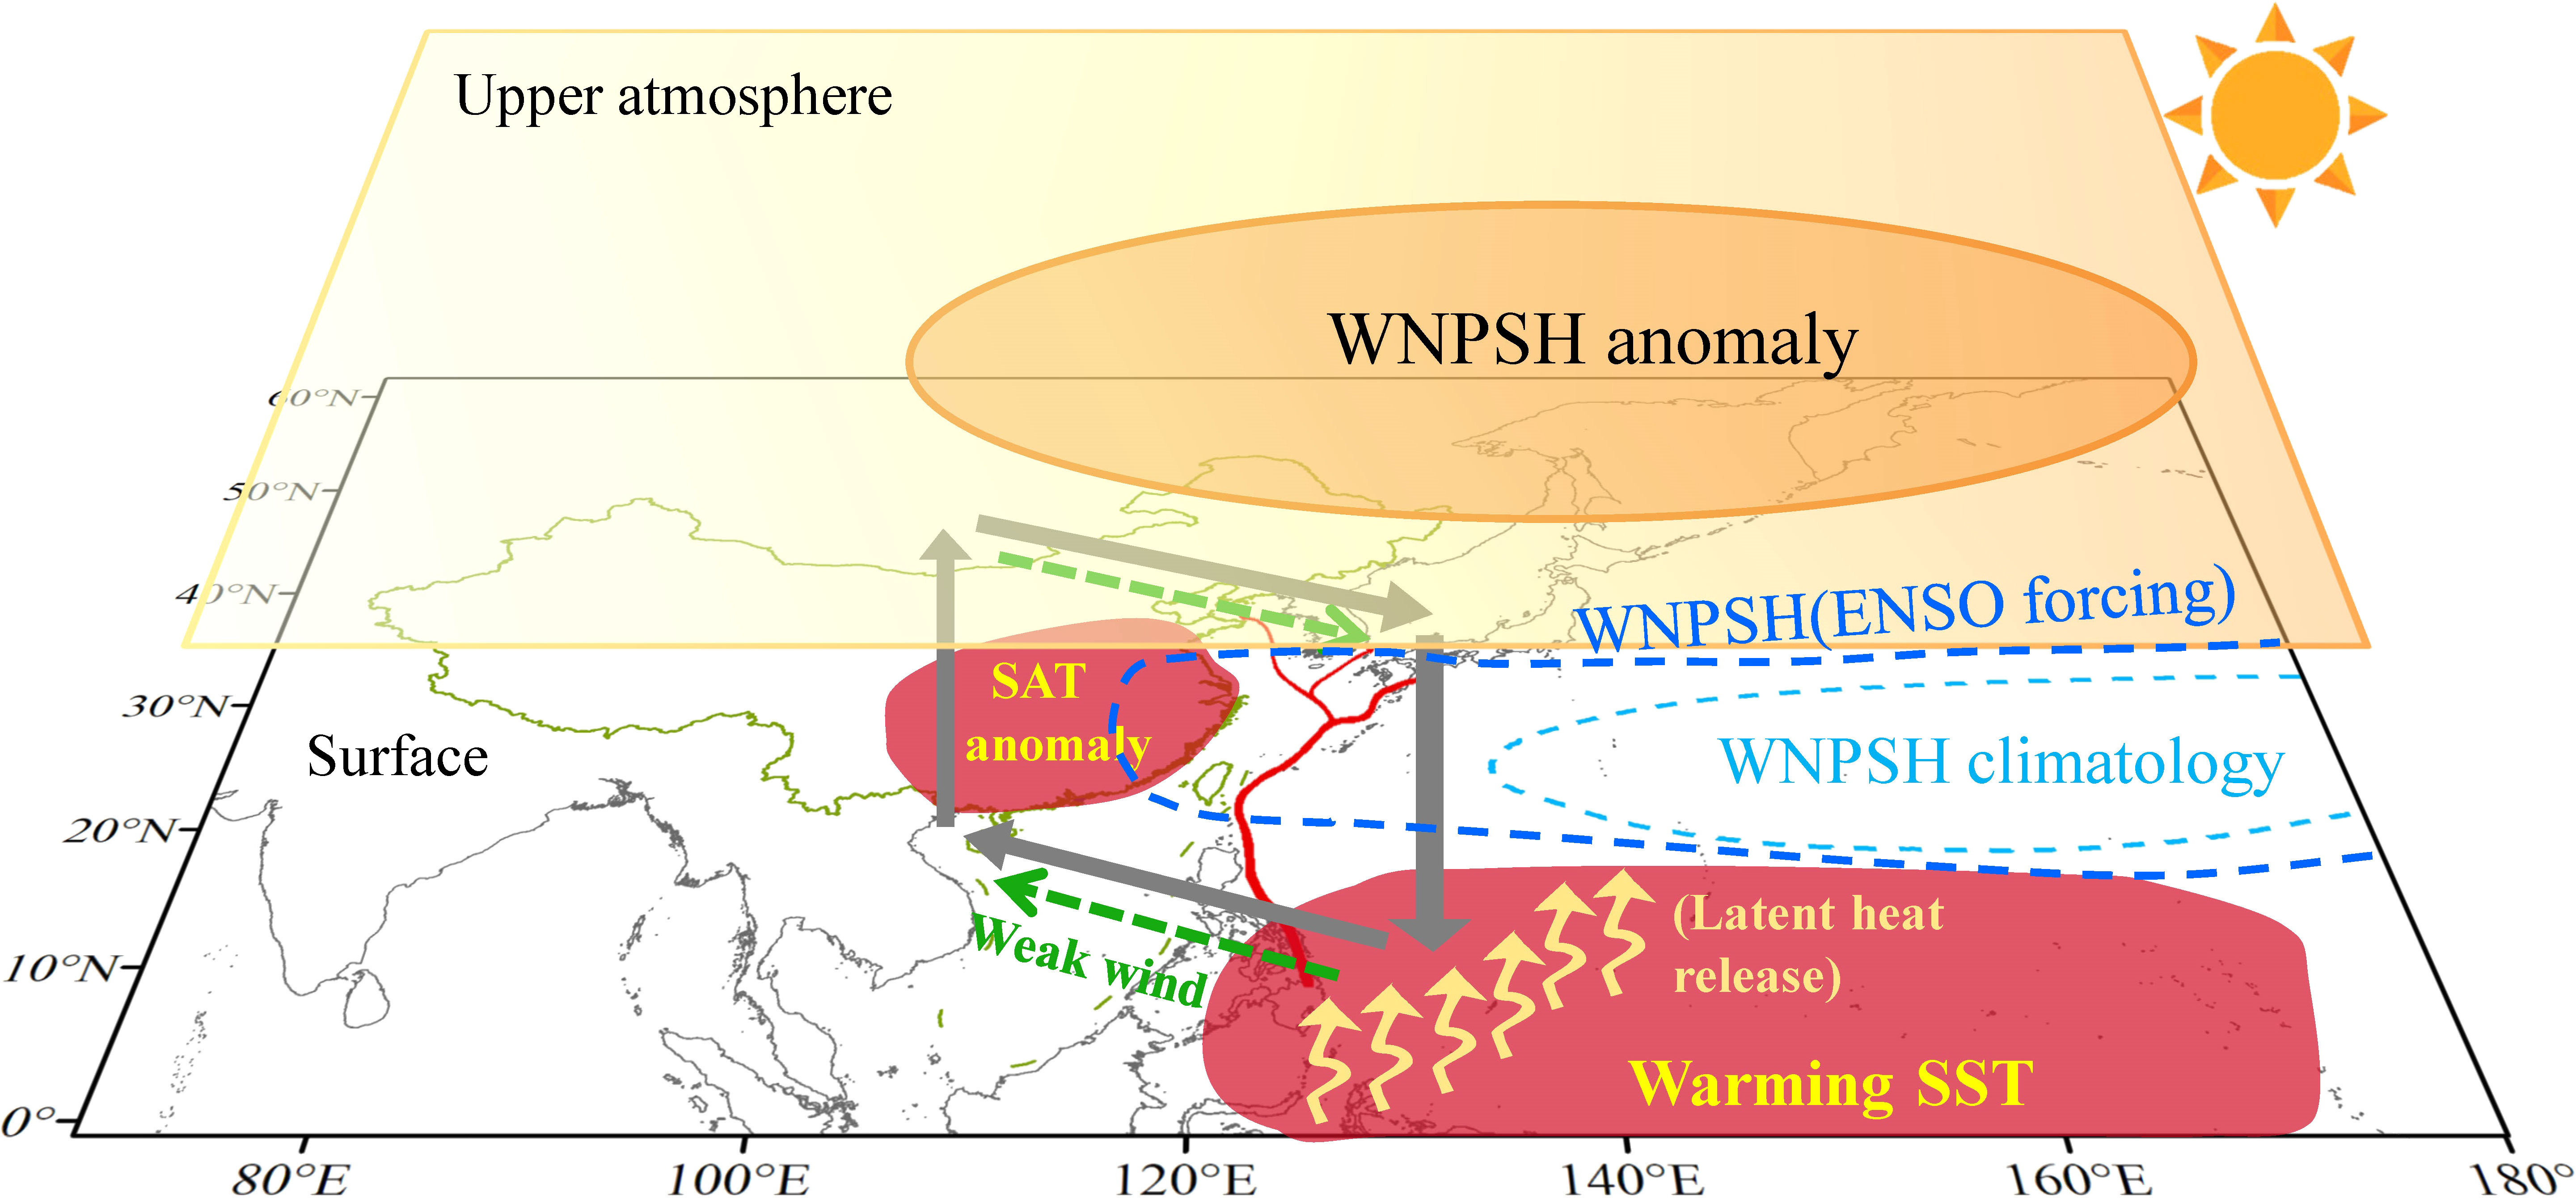
Figure 10 Sketch map of the possible physical mechanism linking AHWs and MHWs in summer in eastern China and its adjacent seas.
4.3 Potential socioeconomic and ecological impacts of heatwaves
AHWs and MHWs have become one of the most serious extreme event types in recent decades globally and regionally, posing increasing threats to both human systems and ecosystems (Otto et al., 2012; Sun et al., 2014; Oliver et al., 2017; Jones et al., 2018; Smale et al., 2019; Wang et al., 2022). AHWs may lead to increases in various diseases such as cardiovascular and respiratory diseases (Tan et al., 2007; Huang et al., 2010; Ren and Zhou, 2014; Yang et al., 2017; Yang J. et al., 2019) and are therefore an important factor of mortality in elderly populations, especially in large cities. The multi-year average PAHWs are high in the North China Plain, Yangtze River Delta, and Sichuan Basin, with their regional sum exceeding 3 million (Figure 11A). During 1982-2019, the regionally averaged PAHWs in eastern China significantly increased with a rate of 300 million decade-1 (p< 0.01; Figure 11B). As the increase in the HWN of AHWs is expected to continue in the future (Figure 3), the PAHWs will range from 1 to 2 billion before the year 2040 under both SSP2-4.5 and SSP5-8.5. Furthermore, the PAHWs will increase rapidly with the peak value of 4.7 billion in around 2085 under SSP5-8.5 and 3.9 billion in around 2076 under SSP2-4.5 (Figure 11C).
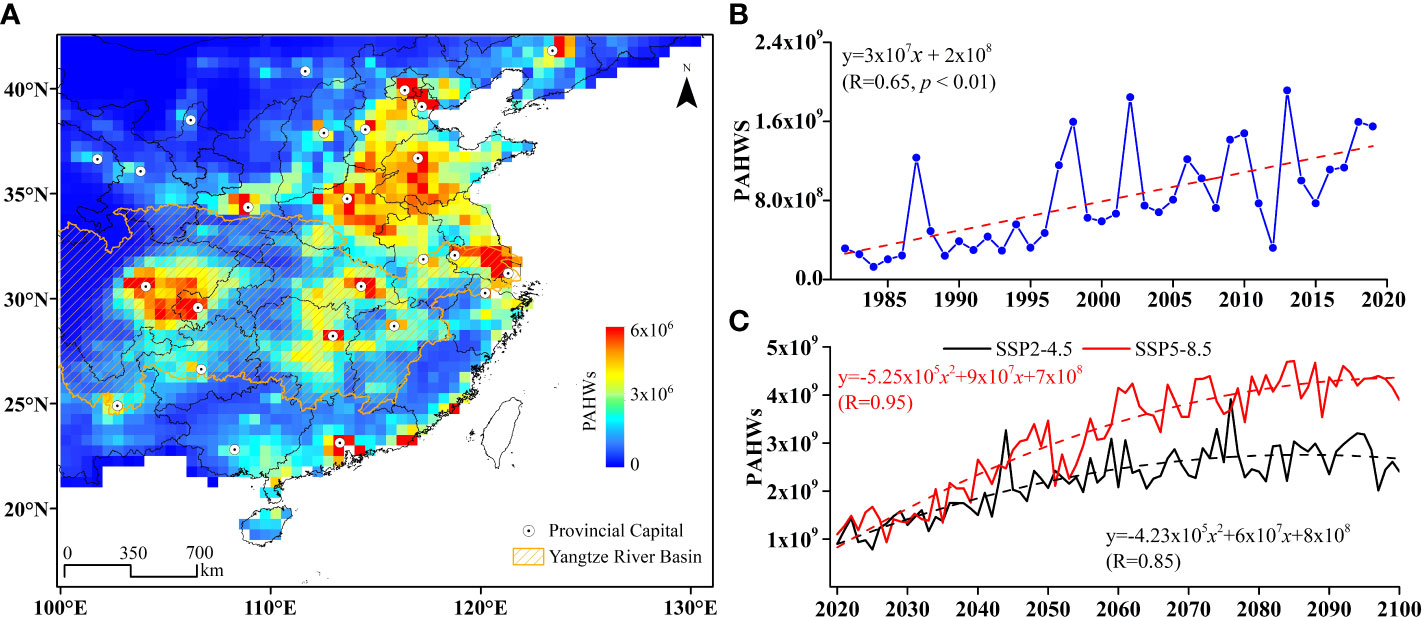
Figure 11 (A) Spatial distribution of the multi-year average PAHWs during 1982-2019 in eastern Chinese mainland. (B) Time series of the regionally averaged PAHWs in eastern Chinese mainland during 1982-2019 and (C) projections of the future regionally averaged PAHWs in eastern Chinese mainland during 2020-2100 under SSP2-4.5 and SSP5-8.5 scenarios. The dashed lines represent the linear trend (B) and quadratic fit(C).
Negative impacts on marine ecosystems have also been observed due to high SST and the accompanied low-oxygen levels and ocean acidification under the warming background (Yang H. et al., 2019). Substantial cucumber deaths have been recorded in the Bohai Sea and Yellow Sea during summer in recent years (Huo et al., 2019a; Huo et al., 2019b; Yao et al., 2020). Furthermore, the MHWs may threaten the coral reef ecosystems in the South China Sea and induce coral bleaching (Hughes et al., 2017; Yao and Wang, 2021). In a 160-km buffer zone along China’s coastline, the multi-year average HWDU of MHWs is very high and exceeds 13 days/count (Figure 12). Many constructed and planned national marine ranch sites for marine fishery and ecosystem restoration are located in this buffer zone with intense MHWs (China, 2017; Yang H. et al., 2019). In the future, the multi-year average HWT of MHWs tends to be higher in high-latitude areas in this buffer zone, with maximums in the Bohai Sea of ~250 days yr-1 under SSP2-4.5 and 300 days yr-1 under SSP5-8.5 (Figure 12). Therefore, marine ranching will thus face higher threats from future MHWs with higher HWDU and HWT.
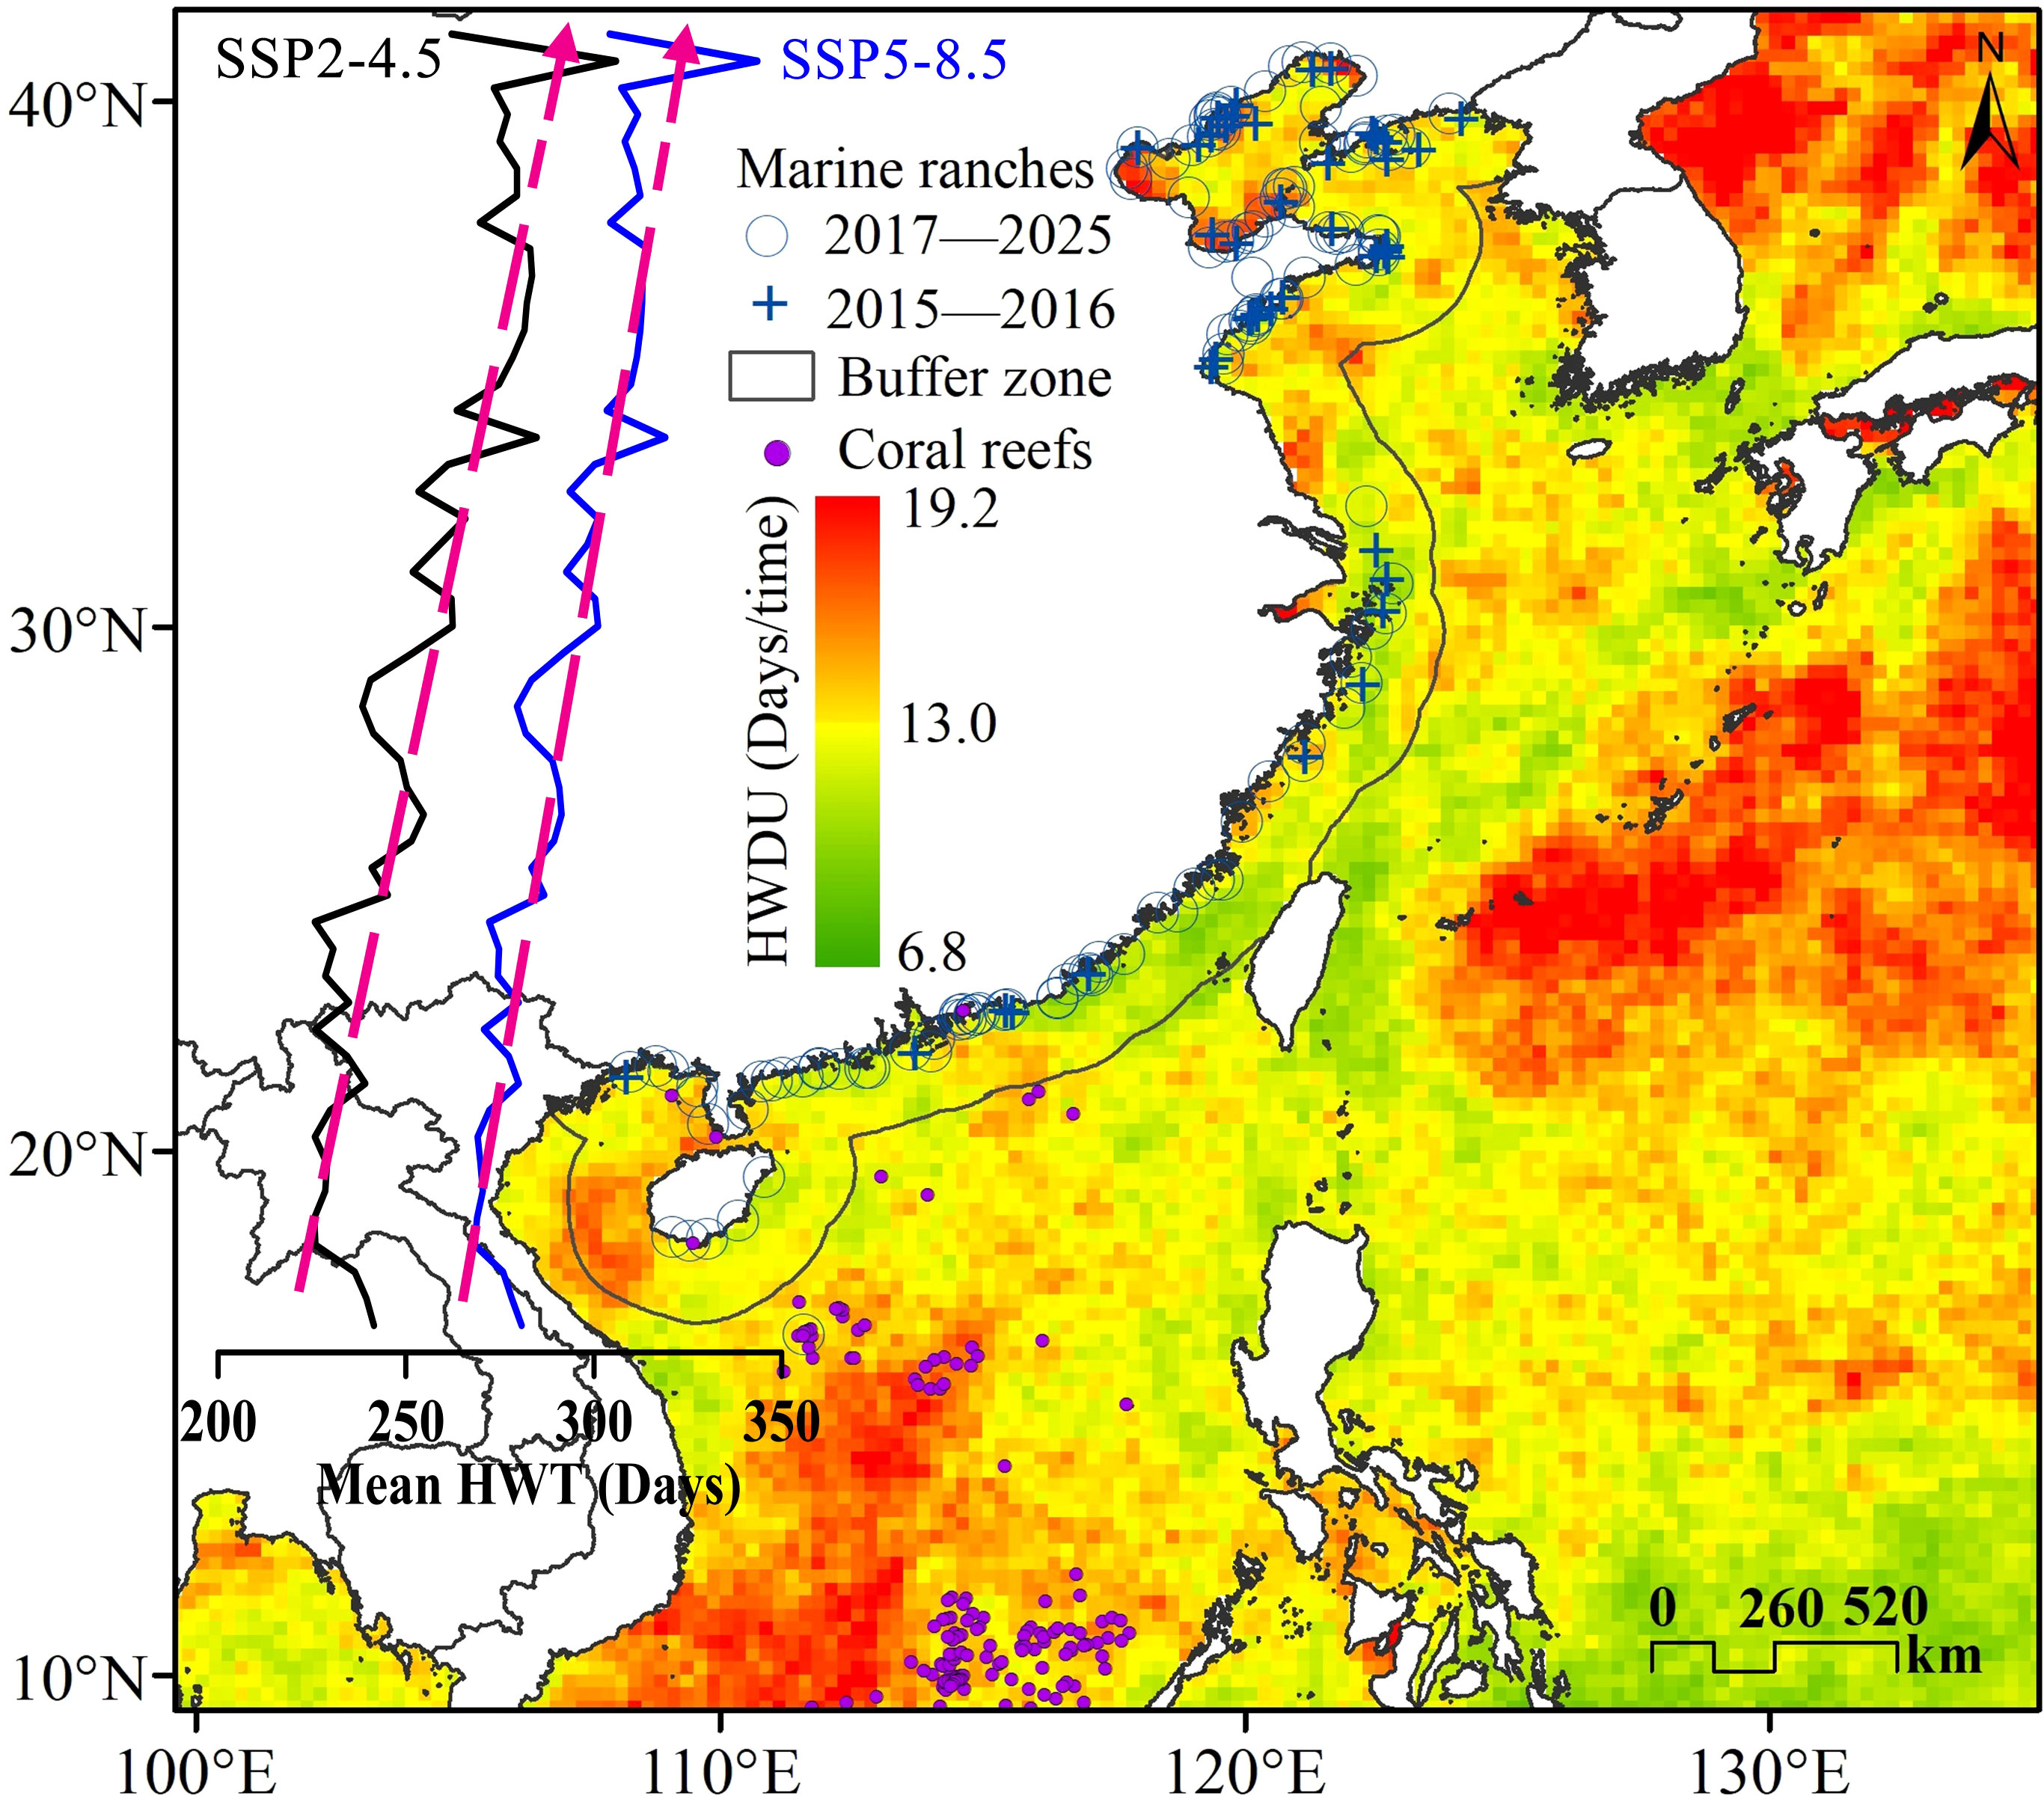
Figure 12 Spatial distribution of the multi-year average HWDU of MHWs in China’s adjacent seas during 1982-2019, together with the distribution of constructed or planned marine ranches. The gray line in the sea area depicts a buffer zone within a 160-km distance from the coastline, and the black and blue solid lines represent the future latitudinal variations in the regionally averaged HWT of MHWs in the buffer zone during 2020-2100 under SSP2-4.5 and SSP5-8.5, respectively. The dashed red lines represent the linear variation trends.
It should be noted that in this study, we use heatwave definitions based on a fixed baseline to explore the potential impacts of the past, present and future AHWs and MHWs on humans and ecosystems in general. The results will be particularly important for flora and fauna species or human groups vulnerable to extreme climate events (e.g., elderly or with diseases), and thus conservation of biodiversity (IPCC, 2022). However, some species may adapt to the warming climate rapidly. Studies focusing on examining the impacts of MHWs on marine species with strong adaptability to warming climates or a strong capacity of escaping to other cooler areas/waters should consider using a moving climatology baseline to eliminate the long-term warming trends (Holbrook et al., 2020; Oliver et al., 2020; Wang et al., 2022).
5 Conclusions
We used a unified heatwave definition and compared the spatial and temporal characteristics of AHWs in eastern China and MHWs in the adjacent seas in the past four decades and the future under different SSP scenarios. We also discussed the physical mechanisms of summer heatwaves in this area.
We find that spatially, the high values and significant growth of the HWT and HWN of AHWs are distributed in the Yangtze River Basin and Yunnan-Guizhou Plateau; those of MHWs are mainly distributed in the Sea of Japan, the sea east of Taiwan Island, and the northern South China Sea. The HWT of AHWs tends to depend on the HWN while the HWT of MHWs mainly depends on HWDU. Temporally, all heatwave metrics of AHWs will continue to increase in the future, whereas the HWT and HWN of MHWs will decrease.
The severe summer heatwaves in eastern China and its adjacent seas seem to be driven by the interaction of a couple of factors. Under the control of high-pressure systems, clear skies dominate the summer weather conditions in eastern China and its adjacent seas, which will trigger heatwaves. Heatwaves in turn can release a large amount of ocean latent heat. Enhanced convection and heating will further drive a stronger anticyclone over the western North Pacific, leading to a stronger and more westward-extending WNPSH.
With the rapidly increasing AHWs during 1982-2019, the PAHWs have increased and are larger in the North China Plain, Yangtze River Delta, and Sichuan Basin. The future PAHWs will reach maximum values in 2076 under the SSP2-4.5 scenario and in 2085 under the SSP5-8.5 scenario. Marine ecosystems like artificial ranches and coral reefs will be exposed to higher threats from nearly year-round MHWs.
Data availability statement
The original contributions presented in the study are included in the article/Supplementary Material. Further inquiries can be directed to the corresponding author.
Author contributions
YY, primary writing, data processing, and calculations. JW and XZ, discussion, writing-review, and editing. All authors contributed to the article and approved the submitted version.
Funding
This research is supported by the National Natural Science Foundation of China (42192562), the National Key R&D Program of China (2019YFA0606701), the National Natural Science Foundation of China (41731173 and 42106202), China Postdoctoral Science Foundation (2021M693242), the Independent Research Project Program of State Key Laboratory of Tropical Oceanography (LTOZZ2102 and LTOZZ2201), and the Dutch Ministry of Education, Culture and Science through the Netherlands Earth System Science Center (NESSC), and the Innovation Project of Marine Science and Technology of Jiangsu Province (JSZRHYKJ202001).
Conflict of interest
The authors declare that the research was conducted in the absence of any commercial or financial relationships that could be construed as a potential conflict of interest.
Publisher’s note
All claims expressed in this article are solely those of the authors and do not necessarily represent those of their affiliated organizations, or those of the publisher, the editors and the reviewers. Any product that may be evaluated in this article, or claim that may be made by its manufacturer, is not guaranteed or endorsed by the publisher.
Supplementary material
The Supplementary Material for this article can be found online at: https://www.frontiersin.org/articles/10.3389/fmars.2022.979391/full#supplementary-material
References
Barriopedro D., Fischer E. M., Luterbacher J., Trigo R. M., García-Herrera R. (2011). The hot summer of 2010: Redrawing the temperature record map of Europe. Science 332 (6026), 220–224. doi: 10.1126/science.1201224
Bond N. A., Cronin M. F., Freeland H., Mantua N. (2015). Causes and impacts of the 2014 warm anomaly in the NE pacific. Geophysical Res. Lett. 42 (9), 3414–3420. doi: 10.1002/2015gl063306
Cai R., Tan H., Kontoyiannis H. (2017). Robust surface warming in offshore China seas and its relationship to the East Asian monsoon wind field and ocean forcing on interdecadal time scales. J. Climate 30 (22), 8987–9005. doi: 10.1175/jcli-d-16-0016.1
Cai R., Tan H., Qi Q. (2016). Impacts of and adaptation to inter-decadal marine climate change in coastal China seas. Int. J. Climatology 36 (11), 3770–3780. doi: 10.1002/joc.4591
Cayan D. R. (1992a). Latent and sensible heat flux anomalies over the northern oceans: Driving the sea surface temperature. J. Phys. Oceanography 22 (8), 859–881. doi: 10.1175/1520-0485(1992)022<0859:LASHFA>2.0.CO;2
Cayan D. R. (1992b). Latent and sensible heat flux anomalies over the northern oceans: The connection to monthly atmospheric circulation. J. Climate 5 (4), 354–369. doi: 10.1175/1520-0442(1992)005<0354:LASHFA>2.0.CO;2
Chen K., Bi J., Chen J., Chen X., Huang L., Zhou L. (2015). Influence of heat wave definitions to the added effect of heat waves on daily mortality in nanjing, China. Sci. Total Environ. 506, 18–25. doi: 10.1016/j.scitotenv.2014.10.092
Cheng L., Abraham J., Hausfather Z., Trenberth K. E. (2019). How fast are the oceans warming? Science 363 (6423), 128–129. doi: 10.1126/science.aav7619
Cheng L., Trenberth K. E., Fasullo J., Boyer T., Abraham J., Zhu J. (2017). Improved estimates of ocean heat content from 1960 to 2015. Sci. Adv. 3 (3), e1601545. doi: 10.1126/sciadv.1601545
Chen Y., Guo F., Wang J., Cai W., Wang C., Wang K. (2020). Provincial and gridded population projection for China under shared socioeconomic pathways from 2010 to 2100. Sci. Data 7 (1), 1–13. doi: 10.1038/s41597-020-0421-y
Chen Y., Hu Q., Yang Y., Qian W. (2017). Anomaly based analysis of extreme heat waves in Eastern China during 1981–2013. Int. J. Climatology 37 (1), 509–523. doi: 10.1002/joc.4724
Chen H., Zhao L., Dong W., Cheng L., Cai W., Yang J., et al. (2022). Spatiotemporal variation of mortality burden attributable to heatwaves in China 1979–2020. Sci. Bull. 67 (13), 1340–1344. doi: 10.1016/j.scib.2022.05.006
Chen X., Zhou T. (2018). Relative contributions of external SST forcing and internal atmospheric variability to July–august heat waves over the Yangtze river valley. Climate Dynamics 51 (11), 4403–4419. doi: 10.1007/s00382-017-3871-y
China. (2017) Notice of the ministry of agriculture on printing and distributing the national marine ranching demonstration zone construction plan, (2017–2025). Available at: http://jiuban.moa.gov.cn/zwllm/tzgg/tz/201712/t20171204_5961857.htm.
D'Ippoliti D., Michelozzi P., Marino C., de'Donato F., Menne B., Katsouyanni K., et al. (2010). The impact of heat waves on mortality in 9 European cities: Results from the EuroHEAT project. Environ. Health 9 (1), 1–9. doi: 10.1186/1476-069X-9-37
Deng K., Yang S., Ting M., Zhao P., Wang Z. (2019). Dominant modes of China summer heat waves driven by global Sea surface temperature and atmospheric internal variability. J. Climate 32 (12), 3761–3775. doi: 10.1175/jcli-d-18-0256.1
Di Lorenzo E., Mantua N. (2016). Multi-year persistence of the 2014/15 north pacific marine heatwave. Nat. Climate Change 6 (11), 1042–1047. doi: 10.1038/nclimate3082
Ding T., Qian W., Yan Z. (2010). Changes in hot days and heat waves in China during 1961–2007. Int. J. Climatology 30 (10), 1452–1462. doi: 10.1002/joc.1989
Dole R., Hoerling M., Perlwitz J., Eischeid J., Pegion P., Zhang T., et al. (2011). Was there a basis for anticipating the 2010 Russian heat wave? Geophysical Res. Lett. 38 (6), L06702. doi: 10.1029/2010gl046582
Dosio A., Mentaschi L., Fischer E. M., Wyser K. (2018). Extreme heat waves under 1.5 c and 2 c global warming. Environ. Res. Lett. 13 (5), 054006. doi: 10.1088/1748-9326/aab827
Eyring V., Bony S., Meehl G. A., Senior C. A., Stevens B., Stouffer R. J., et al. (2016). Overview of the coupled model intercomparison project phase 6 (CMIP6) experimental design and organization. Geoscientific Model. Dev. 9 (5), 1937–1958. doi: 10.5194/gmd-9-1937-2016
FAO. (2019) FAOSTAT database collections. Available at: http://www.fao.org/faostat/en/#data.
Fouillet A., Rey G., Laurent F., Pavillon G., Bellec S., Guihenneuc-Jouyaux C., et al. (2006). Excess mortality related to the august 2003 heat wave in France. Int. Arch. Occup. Environ. Health 80 (1), 16–24. doi: 10.1007/s00420-006-0089-4
Freychet N., Tett S., Wang J., Hegerl G. (2017). Summer heat waves over Eastern China: dynamical processes and trend attribution. Environ. Res. Lett. 12 (2), 024015. doi: 10.1088/1748-9326/aa5ba3
Frölicher T. L., Fischer E. M., Gruber N. (2018). Marine heatwaves under global warming. Nature 560 (7718), 360–364. doi: 10.1038/s41586-018-0383-9
He C., Cui Z., Wang C. (2022). Response of Western north pacific anomalous anticyclones in the summer of decaying El niño to global warming: Diverse projections based on CMIP6 and CMIP5 models. J. Climate 35 (1), 359–372. doi: 10.1175/jcli-d-21-0352.1
Hersbach H., de Rosnay P., Bell B. (2018). Operational global reanalysis: progress, future directions and synergies with NWP: European centre for medium range weather forecasts. ERA Report Series no.27, ECMWF, Reading, UK. doi: 10.21957/tkic6g3wm
Hirahara S., Ishii M., Fukuda Y. (2014). Centennial-scale sea surface temperature analysis and its uncertainty. J. Climate 27 (1), 57–75. doi: 10.1175/JCLI-D-12-00837.1
Hobday A. J., Alexander L. V., Perkins S. E., Smale D. A., Straub S. C., Oliver E. C., et al. (2016). A hierarchical approach to defining marine heatwaves. Prog. Oceanography 141, 227–238. doi: 10.1016/j.pocean.2015.12.014
Holbrook N. J., Gupta A. S., Oliver E. C., Hobday A. J., Benthuysen J. A., Scannell H. A., et al. (2020). Keeping pace with marine heatwaves. Nat. Rev. Earth Environ. 1 (9), 482–493. doi: 10.1038/s43017-020-0068-4
Holbrook N. J., Scannell H. A., Gupta A. S., Benthuysen J. A., Feng M., Oliver E. C., et al. (2019). A global assessment of marine heatwaves and their drivers. Nat. Commun. 10 (1), 1–13. doi: 10.1038/s41467-019-10206-z
Huang W., Kan H., Kovats S. (2010). The impact of the 2003 heat wave on mortality in shanghai, China. Sci. Total Environ. 408 (11), 2418–2420. doi: 10.1016/j.scitotenv.2010.02.009
Hughes T. P., Kerry J. T., Álvarez-Noriega M., Álvarez-Romero J. G., Anderson K. D., Baird A. H., et al. (2017). Global warming and recurrent mass bleaching of corals. Nature 543 (7645), 373–377. doi: 10.1038/nature21707
Huo D., Sun L., Zhang L., Ru X., Liu S., Yang H. (2019a). Metabolome responses of the sea cucumber apostichopus japonicus to multiple environmental stresses: heat and hypoxia. Mar. pollut. bulletin 138, 407–420. doi: 10.1016/j.marpolbul.2018.11.063
Huo D., Sun L., Zhang L., Ru X., Liu S., Yang X., et al. (2019b). Global-warming-caused changes of temperature and oxygen alter the proteomic profile of sea cucumber apostichopus japonicus. J. Proteomics 193, 27–43. doi: 10.1016/j.jprot.2018.12.020
IPCC. (2014). Climate change 2014: synthesis report. contribution of working groups I, II and III to the fifth assessment report of the intergovernmental panel on climate change (IPCC). Geneva, Switzerland, 151 pp.
IPCC. (2022). Climate change 2022: Impacts, adaptation, and vulnerability. contribution of working group II to the sixth assessment report of the intergovernmental panel on climate change Cambridge University Press. Cambridge University Press, Cambridge, UK and New York, NY, USA, 3056 pp.
Jacox M. G., Alexander M. A., Bograd S. J., Scott J. D. (2020). Thermal displacement by marine heatwaves. Nature 584 (7819), 82–86. doi: 10.1038/s41586-020-2534-z
Jones T., Parrish J. K., Peterson W. T., Bjorkstedt E. P., Bond N. A., Ballance L. T., et al. (2018). Massive mortality of a planktivorous seabird in response to a marine heatwave. Geophysical Res. Lett. 45 (7), 3193–3202. doi: 10.1002/2017GL076164
Jun Y., Liu H. Z., Ou C. Q., Lin G. Z., Yan D., Qin Z., et al. (2013). Impact of heat wave in 2005 on mortality in guangzhou, China. Biomed. Environ. Sci. 26 (8), 647–654. doi: 10.3967/0895-3988.2013.08.003
Karnauskas K. B. (2020). Physical diagnosis of the 2016 great barrier reef bleaching event. Geophysical Res. Lett. 47 (11), e2019GL086177. doi: 10.1029/2019GL086177
Lau N.-C., Nath M. J. (2012). A model study of heat waves over north America: Meteorological aspects and projections for the twenty-first century. J. Climate 25 (14), 4761–4784. doi: 10.1175/JCLI-D-11-00575.1
Li J., Ding T., Jia X., Zhao X. (2015). Analysis on the extreme heat wave over China around Yangtze river region in the summer of 2013 and its main contributing factors. Adv. Meteorology. 2015(15), 1–15. doi: 10.1155/2015/706713
Li Y., Ren G., Wang Q., You Q. (2019). More extreme marine heatwaves in the China seas during the global warming hiatus. Environ. Res. Lett. 14 (10), 104010. doi: 10.1088/1748-9326/ab28bc
Li G., Ren B., Yang C., Zheng J. (2011a). Revisiting the trend of the tropical and subtropical pacific surface latent heat flux during 1977–2006. J. Geophysical Research: Atmospheres 116 , D10115. doi: 10.1029/2010JD015444
Li G., Ren B., Zheng J., Yang C. (2011b). Trend singular value decomposition analysis and its application to the global ocean surface latent heat flux and SST anomalies. J. Climate 24 (12), 2931–2948. doi: 10.1175/2010JCLI3743.1
Liu Q., Zhou T., Mao H., Fu C. (2019). Decadal variations in the relationship between the western pacific subtropical high and summer heat waves in East China. J. Climate 32 (5), 1627–1640. doi: 10.1175/JCLI-D-18-0093.1
Luo M., Lau N.-C. (2017). Heat waves in southern China: Synoptic behavior, long-term change, and urbanization effects. J. Climate 30 (2), 703–720. doi: 10.1175/JCLI-D-16-0269.1
Meehl G. A., Tebaldi C. (2004). More intense, more frequent, and longer lasting heat waves in the 21st century. Science 305 (5686), 994–997. doi: 10.1126/science.1098704
O'Neill B. C., Tebaldi C., Vuuren D. P., Eyring V., Friedlingstein P., Hurtt G., et al. (2016). The scenario model intercomparison project (ScenarioMIP) for CMIP6. Geoscientific Model. Dev. 9 (9), 3461–3482. doi: 10.5194/gmd-9-3461-2016
Oliver E. C., Benthuysen J. A., Bindoff N. L., Hobday A. J., Holbrook N. J., Mundy C. N., et al. (2017). The unprecedented 2015/16 Tasman Sea marine heatwave. Nat. Commun. 8 (1), 1–12. doi: 10.1038/ncomms16101
Oliver E. C., Benthuysen J. A., Darmaraki S., Donat M. G., Hobday A. J., Holbrook N. J., et al. (2020). Marine heatwaves. Annu. Rev. Mar. Sci. 13, 313–342. doi: 10.1146/annurev-marine-032720-095144
Oliver E. C., Burrows M. T., Donat M. G., Sen Gupta A., Alexander L. V., Perkins-Kirkpatrick S. E., et al. (2019). Projected marine heatwaves in the 21st century and the potential for ecological impact. Front. Mar. Sci. 6, 734. doi: 10.3389/fmars.2019.00734
Oliver E. C., Donat M. G., Burrows M. T., Moore P. J., Smale D. A., Alexander L. V., et al. (2018). Longer and more frequent marine heatwaves over the past century. Nat. Commun. 9 (1), 1–12. doi: 10.1038/s41467-018-03732-9
Otto F. E., Massey N., van Oldenborgh G. J., Jones R. G., Allen M. R. (2012). Reconciling two approaches to attribution of the 2010 Russian heat wave. Geophysical Res. Lett. 39 (4), L04702. doi: 10.1029/2011GL050422
Perkins S. E. (2015). A review on the scientific understanding of heatwaves–their measurement, driving mechanisms, and changes at the global scale. Atmospheric Res. 164, 242–267. doi: 10.1016/j.atmosres.2015.05.014
Perkins S. E., Alexander L. V. (2013). On the measurement of heat waves. J. Climate 26 (13), 4500–4517. doi: 10.1175/JCLI-D-12-00383.1
Pershing A. J., Record N. R., Franklin B. S., Kennedy B. T., McClenachan L., Mills K. E., et al. (2019). Challenges to natural and human communities from surprising ocean temperatures. Proc. Natl. Acad. Sci. 116 (37), 18378–18383. doi: 10.1073/pnas.1901084116
Pfleiderer P., Schleussner C.-F., Kornhuber K., Coumou D. (2019). Summer weather becomes more persistent in a 2 c world. Nat. Climate Change 9 (9), 666–671. doi: 10.1038/s41558-019-0555-0
Rayner N., Parker D. E., Horton E., Folland C. K., Alexander L. V., Rowell D., et al. (2003). Global analyses of sea surface temperature, sea ice, and night marine air temperature since the late nineteenth century. J. Geophysical Research: Atmospheres 108 (D14), 4407. doi: 10.1029/2002JD002670
Ren G., Zhou Y. (2014). Urbanization effect on trends of extreme temperature indices of national stations over mainland China 1961–2008. J. Climate 27 (6), 2340–2360. doi: 10.1175/JCLI-D-13-00393.1
Reynolds R. W., Smith T. M., Liu C., Chelton D. B., Casey K. S., Schlax M. G. (2007). Daily high-resolution-blended analyses for sea surface temperature. J. Climate 20 (22), 5473–5496. doi: 10.1175/2007JCLI1824.1
Rodrigues R. R., Taschetto A. S., Gupta A. S., Foltz G. R. (2019). Common cause for severe droughts in south America and marine heatwaves in the south Atlantic. Nat. Geosci. 12 (8), 620–626. doi: 10.1038/s41561-019-0393-8
Shen H., Chen Y., Hu Y., Ran L., Lam S. K., Pavur G. K., et al. (2020). Intense warming will significantly increase cropland ammonia volatilization threatening food security and ecosystem health. One Earth 3 (1), 126–134. doi: 10.1016/j.oneear.2020.06.015
Smale D. A., Wernberg T., Oliver E. C., Thomsen M., Harvey B. P., Straub S. C., et al. (2019). Marine heatwaves threaten global biodiversity and the provision of ecosystem services. Nat. Climate Change 9 (4), 306–312. doi: 10.1038/s41558-019-0412-1
Sparrow S., Su Q., Tian F., Li S., Chen Y., Chen W., et al. (2018). Attributing human influence on the July 2017 Chinese heatwave: The influence of sea-surface temperatures. Environ. Res. Lett. 13 (11), 114004. doi: 10.1088/1748-9326/aae356
Sun Y., Zhang X., Zwiers F. W., Song L., Wan H., Hu T., et al. (2014). Rapid increase in the risk of extreme summer heat in Eastern China. Nat. Climate Change 4 (12), 1082–1085. doi: 10.1038/nclimate2410
Tan J., Zheng Y., Song G., Kalkstein L. S., Kalkstein A. J., Tang X. (2007). Heat wave impacts on mortality in shanghai 1998 and 2003. Int. J. Biometeorology 51 (3), 193–200. doi: 10.1007/s00484-006-0058-3
Tan J., Zheng Y., Tang X., Guo C., Li L., Song G., et al. (2010). The urban heat island and its impact on heat waves and human health in shanghai. Int. J. Biometeorol 54 (1), 75–84. doi: 10.1007/s00484-009-0256-x
Trenberth K. E., Fasullo J. T. (2012). Climate extremes and climate change: The Russian heat wave and other climate extremes of 2010. J. Geophysical Research: Atmospheres 117, D17103. doi: 10.1029/2012JD018020
Wang X. Y., Barnett A. G., Yu W., FitzGerald G., Tippett V., Aitken P., et al. (2012). The impact of heatwaves on mortality and emergency hospital admissions from non-external causes in Brisbane, Australia. Occup. Environ. Med. 69 (3), 163–169. doi: 10.1136/oem.2010.062141
Wang S., Jing Z., Wu L., Wang H., Shi J., Chen Z., et al. (2022). Changing ocean seasonal cycle escalates destructive marine heatwaves in a warming climate. Environ. Res. Lett. 17 (5), 054024. doi: 10.1088/1748-9326/ac6685
Wang P., Tang J., Sun X., Wu J. (2017). Heat waves in China: Definitions, leading patterns, and connections to Large-scale atmospheric circulation and SSTs. J. Geophysical Res. Atmospheres. 122(20), 10,679–10,699. doi: 10.1002/2017JD027180
Wang W., Zhou W., Li X., Wang X., Wang D. (2016). Synoptic-scale characteristics and atmospheric controls of summer heat waves in China. Climate Dynamics 46 (9-10), 2923–2941. doi: 10.1007/s00382-015-2741-8
Wei J., Wang W., Shao Q., Yu Z., Chen Z., Huang Y., et al. (2020). Heat wave variations across China tied to global SST modes. J. Geophysical Research: Atmospheres 125 (6), e2019JD031612. doi: 10.1029/2019JD031612
Xu X. (2017) The 1 km grid dataset of china's population spatial distribution. Available at: http://www.resdc.cn/DOI/DOI.aspx?DOIid=32.
Xu Z., Fitzgerald G., Guo Y., Jalaludin B., Tong S. (2016). Impact of heatwave on mortality under different heatwave definitions: A systematic review and meta-analysis. Environ. Int., 193–203. doi: 10.1016/j.envint.2016.02.007
Xu W., Li Q., Jones P., Wang X. L., Trewin B., Yang S., et al. (2018). A new integrated and homogenized global monthly land surface air temperature dataset for the period since 1900. Climate Dynamics 50 (7), 2513–2536. doi: 10.1007/s00382-017-3755-1
Yan Z., Ding Y., Zhai P., Song L., Cao L., Li Z. (2020). Re-assessing climatic warming in China since 1900. J. Meteorological Res. 34, 243–251. doi: 10.1007/s13351-020-9839-6
Yang X., Ruby Leung L., Zhao N., Zhao C., Qian Y., Hu K., et al. (2017). Contribution of urbanization to the increase of extreme heat events in an urban agglomeration in east China. Geophysical Res. Lett. 44 (13), 6940–6950. doi: 10.1002/2017gl074084
Yang J., Yin P., Sun J., Wang B., Zhou M., Li M., et al. (2019). Heatwave and mortality in 31 major Chinese cities: Definition, vulnerability and implications. Sci. Total Environ. 649, 695–702. doi: 10.1016/j.scitotenv.2018.08.332
Yang H., Zhang S., Zhang X., Chen P., Tian T., Zhang T. (2019). Strategic thinking on the construction of modern marine ranching in China. J. Fisheries China 43 (4), 1255–1262. doi: 10.11964/jfc.20190211670
Yao Y., Wang C. (2021). Variations in summer marine heatwaves in the south China Sea. J. Geophysical Research: Oceans 126, e2021JC017792. doi: 10.1029/2021JC017792
Yao Y., Wang J., Yin J., Zou X. (2020). Marine heatwaves in china's marginal seas and adjacent offshore waters: Past, present, and future. J. Geophysical Research: Oceans 125 (3), e2019JC015801. doi: 10.1029/2019jc015801
Yin J., Overpeck J., Peyser C., Stouffer R. (2018). Big jump of record warm global mean surface temperature in 2014–2016 related to unusually large oceanic heat releases. Geophysical Res. Lett. 45 (2), 1069–1078. doi: 10.1002/2017GL076500
You Q., Jiang Z., Kong L., Wu Z., Bao Y., Kang S., et al. (2017). A comparison of heat wave climatologies and trends in China based on multiple definitions. Climate Dynamics 48 (11), 3975–3989. doi: 10.1007/s00382-016-3315-0
Yun X., Huang B., Cheng J., Xu W., Qiao S., Li Q. (2019). A new merge of global surface temperature datasets since the start of the 20th century. Earth System Sci. Data 11 (4), 1629–1643. doi: 10.5194/essd-11-1629-2019
Zhang K., Chen T.-H., Begley C. E. (2015). Impact of the 2011 heat wave on mortality and emergency department visits in Houston, Texas. Environ. Health 14 (1), 1–7. doi: 10.1186/1476-069X-14-11
Zhou T., Ma S., Zou L. (2014). Understanding a hot summer in central eastern China: summer 2013 in context of multimodel trend analysis. Bull. Am. Meteorol. Soc. 95, S54. doi: 10.1175/1520-0477-95.9.S1.1
Keywords: atmospheric heatwaves, marine heatwaves, comparative analysis, rapid changes, future projections
Citation: Yao Y, Wang J and Zou X (2022) Rapid changes in heatwaves pose dual challenge in Eastern China and its adjacent seas. Front. Mar. Sci. 9:979391. doi: 10.3389/fmars.2022.979391
Received: 27 June 2022; Accepted: 15 August 2022;
Published: 05 September 2022.
Edited by:
Shin-ichi Ito, The University of Tokyo, JapanReviewed by:
Haiqing Yu, Shandong University, ChinaHiroshi Kuroda, Japan Fisheries Research and Education Agency (FRA), Japan
Toru Miyama, Japan Agency for Marine-Earth Science and Technology, Japan
Copyright © 2022 Yao, Wang and Zou. This is an open-access article distributed under the terms of the Creative Commons Attribution License (CC BY). The use, distribution or reproduction in other forums is permitted, provided the original author(s) and the copyright owner(s) are credited and that the original publication in this journal is cited, in accordance with accepted academic practice. No use, distribution or reproduction is permitted which does not comply with these terms.
*Correspondence: Junjie Wang, ai53YW5nM0B1dS5ubA==; Xinqing Zou, em91eHFAbmp1LmVkdS5jbg==
 Yulong Yao
 Junjie Wang
 Xinqing Zou