 Melilotus Thyssen1*
 Gérald Grégori1
 Véronique Créach2
 Soumaya Lahbib1
 Mathilde Dugenne3
 Hedy M. Aardema4
 Luis-Felipe Artigas5
 Bangqin Huang6
 Aude Barani1Laureen Beaugeard7Amel Bellaaj-Zouari8Alfred Beran9
 Raffaella Casotti10
 Yolanda Del Amo11
 Michel Denis1
 George B.J. Dubelaar12
 Sonja Endres13
 Lumi Haraguchi14
 Bengt Karlson15
 Christophe Lambert16
 Arnaud Louchart5
 Dominique Marie17
 Gwenaëlle Moncoiffé18David Pecqueur19
 François Ribalet20
 Machteld Rijkeboer21
 Tina Silovic22Ricardo Silva23
 Sophie Marro3
 Heidi M. Sosik24
 Marc Sourisseau25
 Glen Tarran26Nicolas Van Oostende27
 Li Zhao28
 Shan Zheng28
- 1Aix Marseille Université, Université de Toulon, CNRS, IRD, MIO, Marseille, France
- 2Centre for Environment, Fisheries and Aquaculture, Lowestoft, United Kingdom
- 3Sorbonne Université, CNRS, UMR 7093, Laboratoire d’Océanographie de Villefranche-sur-Mer (LOV), Villefranche-sur-Mer, France
- 4Department of Climate Geochemistry, Max Plank Institute for Chemistry, Mainz, Germany
- 5Université du Littoral Côte d’Opale, Université de Lille, IRD, CNRS, UMR 8187, LOG, Laboratoire d’Océanologie et de Géosciences, Wimereux, France
- 6National Observation and Research Station for the Taiwan Strait Marine Ecosystem, State Key Laboratory of Marine Environmental Science, Xiamen University, Xiamen, China
- 7Laboratoire LIENSs Littoral, Environnement et Sociétés, UMR 7266 Université de La Rochelle - CNRS, La Rochelle, France
- 8Institut National des Sciences et Technologies de la Mer, INSTM, Salammbô, Tunisia
- 9Physical Oceanography Group, National Institute of Oceanography and Applied Geophysics – OGS, Trieste, Italy
- 10Stazione Zoologica Anton Dohrn, Department of Integrative Marine Ecology, Napoli, Italy
- 11Université de Bordeaux-CNRS, UMR 5805, Environnement"s et Paléoenvironnements Océaniques et Continentaux (EPOC), Arcachon, France
- 12Cytobuoy b.v., Woerden, Netherlands
- 13Alfred Wegener Institute Helmholtz Centre for Polar and Marine Research, Project Polarstern II, Bremerhaven, Germany
- 14Marine Research Centre, Finnish Environment Institute, Helsinki, Finland
- 15Swedish Meteorological and Hydrological Institute, Oceanographic Research, Västra Frölunda, Sweden
- 16CNRS, Univ Brest, IRD, Ifremer, LEMAR, Plouzane, France
- 17Sorbonne University, UPMC Univ Paris 06, CNRS, UMR 7144, Roscoff, France
- 18National Oceanography Centre, British Oceanographic Data Centre, Liverpool, United Kingdom
- 19Sorbonne Université, CNRS, Observatoire Océanologique de Banyuls s/mer, Banyuls sur Mer, France
- 20School of Oceanography, University of Washington, Seattle, WA, United States
- 21Laboratory for Hydrobiological Analysis, Rijkswaterstaat (RWS), Lelystad, Netherlands
- 22Mercator Ocean International, Ramonville Saint - Agne, France
- 23Instituto Nacional de Investigación y Desarrollo Pesquero (INIDEP), Buenos Aires, Argentina
- 24Biology Department, Woods Hole Oceanographic Institution, Biology Department, Woods Hole, MA, United States
- 25IFREMER, DYNECO, Pelagos Laboratory, Plouzané, France
- 26Plymouth Marine Laboratory, Plymouth, United Kingdom
- 27Department of Geosciences, Princeton University, Princeton, NJ, United States
- 28Key Laboratory of Marine Ecology and Environmental Sciences, Institute of Oceanology, Chinese Academy of Sciences, Qingdao, China
The recent development of biological sensors has extended marine plankton studies from conducting laboratory bench work to in vivo and real-time observations. Flow cytometry (FCM) has shed new light on marine microorganisms since the 1980s through its single-cell approach and robust detection of the smallest cells. FCM records valuable optical properties of light scattering and fluorescence from cells passing in a single file in front of a narrow-collimated light source, recording tens of thousands of cells within a few minutes. Depending on the instrument settings, the sampling strategy, and the automation level, it resolves the spatial and temporal distribution of microbial marine prokaryotes and eukaryotes. Cells are usually classified and grouped on cytograms by experts and are still lacking standards, reducing data sharing capacities. Therefore, the need to make FCM data sets FAIR (Findability, Accessibility, Interoperability, and Reusability of digital assets) is becoming critical. In this paper, we present a consensus vocabulary for the 13 most common marine microbial groups observed with FCM using blue and red-light excitation. The authors designed a common layout on two-dimensional log-transformed cytograms reinforced by a decision tree that facilitates the characterization of groups. The proposed vocabulary aims at standardising data analysis and definitions, to promote harmonisation and comparison of data between users and instruments. This represents a much-needed step towards FAIRification of flow cytometric data collected in various marine environments.
Introduction
The biological understanding of the marine environment starts with the unicellular world of microorganisms. Unicellular marine microorganisms, including autotrophic, heterotrophic, and mixotrophic prokaryotes and eukaryotes, as well as viruses, are the principal biogeochemical actors of the oceans (Pomeroy, 1974, Worden et al., 2012). They play a crucial role in the marine environment, and by extension, the Earth climate, due to their physiological capacity to oxidize and reduce elements (essentially carbon) through photosynthesis, respiration and exudation, setting the ecological and trophic status of marine ecosystems. Unicellular autotrophic prokaryotes and eukaryotes, hereafter called phytoplankton, produce up to half of the oxygen and organic matter on Earth (Field et al., 1998), and form the base of the marine food webs. Unicellular heterotrophic prokaryotes are ubiquitous and play a key role in biogeochemical cycles (Fenchel et al., 2012) including the recycling of organic matter and nutrient regeneration. Unicellular heterotrophic and mixotrophic eukaryotes consume phytoplankton and heterotrophic prokaryotes and, depending on their cell size, facilitate the transfer of the produced organic matter to higher trophic levels (Azam et al., 1983) or its recycling by marine heterotrophic prokaryotes (Ducklow et al., 1986). Marine viruses as well are indirectly responsible for facilitating nitrogen cycling and therefore phytoplankton growth and for reducing carbon dioxide release into the atmosphere. They are also a major driver of evolution by increasing genetic diversity (Suttle, 2005). In addition to this high biological and functional diversity, their dynamics and distribution are characterised by high spatio-temporal heterogeneity, making studies of their activity challenging.
Observations and modelling of plankton dynamics and functionality traits (Dubelaar et al., 1999; Quéré et al., 2005; Litchman et al., 2007; Fontana et al., 2018; Lévy et al., 2018) highlight the importance of fine spatio-temporal and functional resolutions when assessing the role of microorganisms in marine ecosystems. The most accurate way to study the distribution, composition, dynamics, and functions of microorganisms is to resolve them at their unit scale, i.e., the single cell. This is possible with FCM, widely used in oceanography since the 1980s (Yentsch & Yentsch, 1979; Trask et al., 1982; Yentsch et al., 1983; Olson et al., 1985). FCM has revolutionised marine microbiology by accessing the abundance distribution of plankton size classes (PSCs) and several existing phytoplankton functional types (PFTs) or functional groups (PFGs) (Salmaso et al., 2015). FCM also helped in the discovery of unexpectedly small organisms (< 1 μm) playing an important role in the trophic web and the marine carbon cycle such as Prochlorococcus (Chisholm et al., 1988) and Ostreococcus (Courties et al., 1994). The power of conventional FCM relies on the hydrodynamic focusing of a laminar flow where particles are lined up and separated. Their intersection with a laser beam generates light scattering which can be used as a proxy of cell diameter or cell structure, and fluorescence from pigments or user-applied dyes. The identification of photosynthetic microorganisms does not require any staining due to the auto-fluorescence of chlorophylls and accessory pigments. Those auto-fluorescence properties, combined with size and structure, make it possible to separate photosynthetic cell populations from other marine particles. Heterotrophic microorganisms and viruses require specific staining (usually of Nucleic Acids) to distinguish them from the detrital organic matter pool (Grégori et al., 2001; Zubkov et al., 2001; Christaki et al., 2011). Automated staining systems dedicated to heterotrophic micro-organisms high-frequency observation were set up and deployed, either for drinking waters (Hammes et al., 2012), or marine environments (Brownlee et al., 2016; Silovic et al., 2017) monitoring. Flow cytometers can be equipped with lasers emitting light at different wavelengths to measure signals from various chromophores.
Over the last 20 years, automated systems (i.e. systems that can be operated autonomously for months or years and remotely controlled) such as CytoSense/Sub/Buoy (Dubelaar et al., 1999), FlowCytobot and Imaging FlowCytobot (Olson et al., 2003; Olson & Sosik, 2007), SeaFlow (Swalwell et al., 2011), have produced highly resolved spatial and temporal datasets of numerous phytoplankton groups, including relatively large and rare groups thanks to increasing sample volume analysed. These instruments can be deployed in situ and underwater (Sosik et al., 2003; Thyssen et al., 2008b; Peacock et al., 2014; Hunter-Cevera et al., 2016), on a ship (Li et al., 1995; Thyssen et al., 2009; Bonato et al., 2015; Thyssen et al., 2015; Marrec et al., 2018; Aardema et al., 2019; Ribalet et al., 2019; Fowler et al., 2020; Louchart et al., 2020) or a buoy (Thyssen et al., 2014). Imaging in flow systems can be combined with flow cytometry acquisition, affording additional taxonomic identification for microplankton size range. The investigation of machine learning approaches for generating automatic recognition of microorganisms at individual or cluster levels in marine samples has been explored (Malkassian et al., 2011; Ribalet et al., 2011; Hyrkas et al., 2016; Olusoji et al., 2021; Fuchs et al., 2022), and will benefit from medical field research for additional computational processes and data analysis workflow (Aghaeepour et al., 2013), promising to ensure near real-time data availability.
The worldwide increase in marine FCM datasets provides evidence of the technique’s utility and reliability in marine research. Indeed, FCM datasets are now widely accepted as a core parameter and a common reference in oceanographic cruises (Manti et al., 2012). Unfortunately, the datasets collected are, in most cases, maintained in local data stores and are not routinely set up for open access through international data portals, despite the need for sharing and disseminating valuable information on ocean plankton functional-group distribution. Consequently, scientists are facing the difficult challenge of handling a large amount of data which needs to be processed rapidly and harmonised before being stored in databases to be accessible to scientific and environmental management communities. Best practices in data management (Boss et al., 2018) have received relatively little attention despite the need for a data flow framework to follow the Findability, Accessibility, Interoperability, and Reusability (FAIR) principles (Wilkinson et al., 2016). In 2016, the SeaDataCloud project (H2020 EU, ID: 730960) supported a first initiative to harmonise FCM datasets via an interoperable vocabulary for the most common phytoplankton and heterotrophic prokaryotic groups. This first step was a valuable attempt to gather input from a large and international panel of FCM experts, but needed maturation as the names of groups first suggested as standards referred to some vague taxonomic descriptions. In addition, the definitions of those groups lacked precision. This paper stems from this common initiative, aiming to promote accessibility to the marine FCM datasets, proposing a consensus vocabulary and its definition for microbial groups discriminated by FCM in marine environments. The virus and microzooplankton groups were excluded from this exercise as they are not yet routinely analysed by these instruments.
Standardized vocabulary and definition
Authors of this manuscript provide a commonly agreed standardized vocabulary with definitions of marine microbial groups observed by FCM, resulting from the consultation among FCM users and experts (co-authors of this manuscript) and a literature review spanning the period 1983-2020 (Annex 1 in Supplementary material). Datasets in which FCM groups are identified by the experts are highly informative and are compatible with a consensus nomenclature, unlike raw data which are saved in various binary formats (e.g. cyz for the CytoSense, adc for the Imaging FlowCytobot, evt for the SeaFlow, fcs for more conventional flow cytometers). The interoperable vocabulary needs to apply to a variety of groups present in many marine environments while being specific enough to reveal the functional diversity observed with any flow cytometer.
From this consultation, a total of 13 groups are identified and defined in the look-up Table 1. The last column presents some examples collected in the literature and extracted from Annex 1, revealing the diversity of names given for a specific group. In the literature, they are either named using the known and referenced, or supposed, taxonomic nomenclature, such as bacteria, Synechococcus, Prochlorococcus, prochlorophytes, cryptophytes, Crocosphaera, coccolithophorids, or by using a classification based on their size-class or cellular structure, such as picophytoplankton, picoeukaryotes, picocyanobacteria, ultraphytoplankton, nanophytoplankton, nanoeukaryotes, microphytoplankton, among others. Several identified groups share the same descriptions as well as similar optical properties or position on a cytogram, yet are assigned a different nomenclature (photosynthetic picoeukaryotes or PPE, picoEuk, picophytoplankton) or can be spread into sub-groups (like picocyanobacteria and picophytoplankton, that both include Synechococcus and Prochlorococcus). Additionally, some groups were identified by sorting (Ostreococcus sp., Courties et al., 1994; Richiella sp., Zhao et al., 2012) or image acquisition (Phaeocystis sp., Rutten et al., 2005) as their light scattering and fluorescence signatures are not specific enough to be resolved at a taxonomical level from cytograms only. As said before, these groups are named on a basis of post-treatment procedures by expert’s, and should appear in any interoperable database in line with a consensual and interoperable vocabulary. As a best practice recommendation, any manuscript dealing with marine FCM results should use the standardised common vocabulary or include a correspondence table that lists the groups or subgroups identified by a flow cytometry user with the standards, as in Table 1, and referenced to their sources (Uniform Resource Identifier (URI)). The URIs (e.g. http://vocab.nerc.ac.uk/collection/F02/current/F0200002/) are the only reliable, machine-readable and persistent identifiers of the concepts defined in the F02 vocabulary.
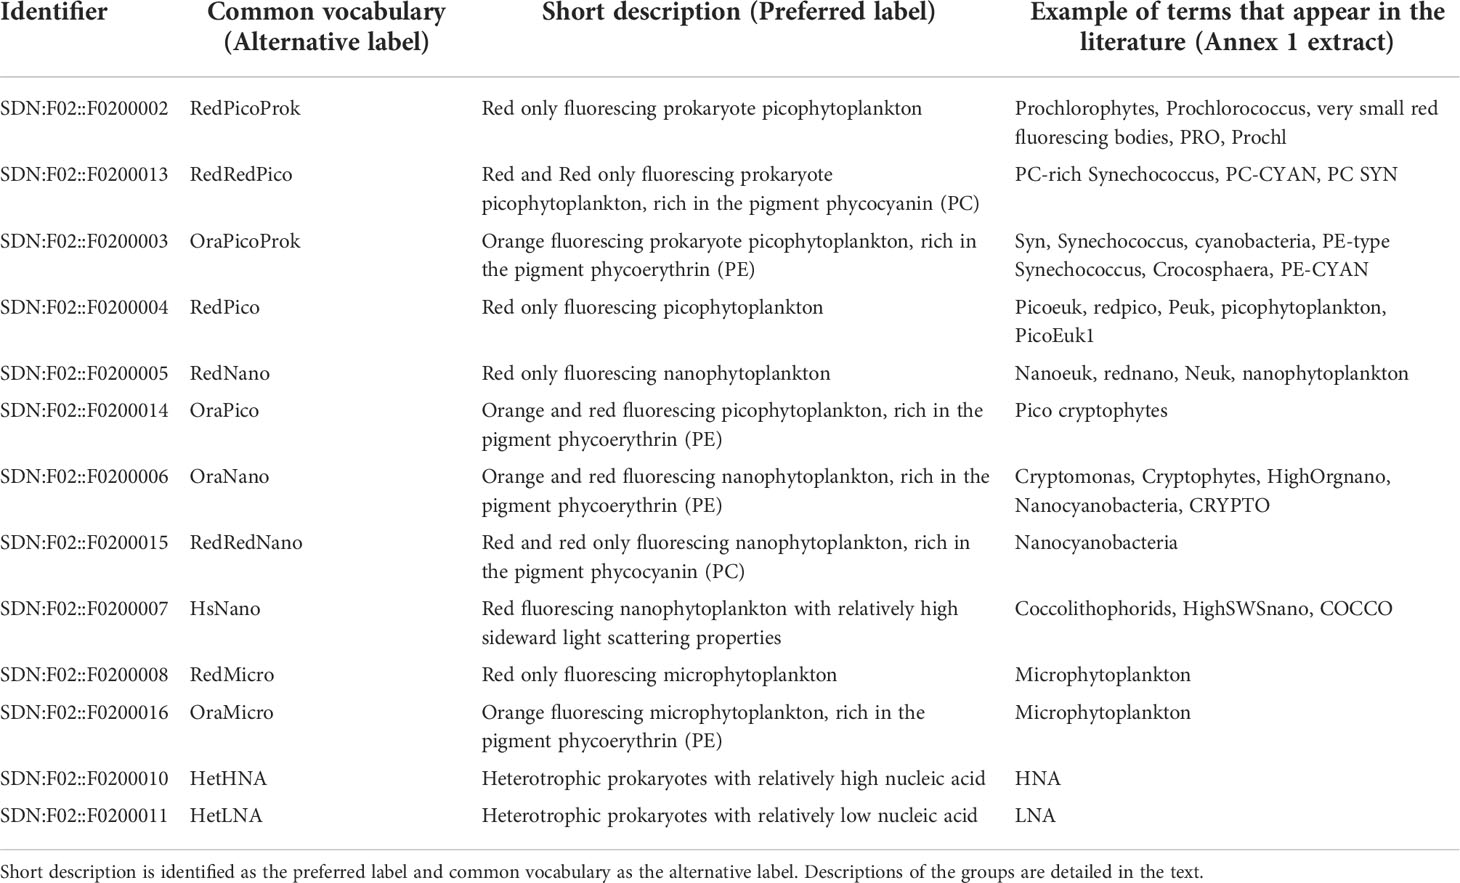
Table 1 Look-up table between terms identifying the main FCM groups that appear in the literature (extracted from Annex 1), and the common nomenclature findable in the https://vocab.nerc.ac.uk/collection/F02/current/.
The proposed interoperable vocabulary combines all the existing FCM groups found in the literature so far into a unique framework defined by arbitrary optical parameters and size classes. Defining the FCM groups relies on their position on cytograms using relative proxies. Indeed, optical signatures of the recorded particles are modulated by the instrument settings, the instrument types, as well as the environmental conditions affecting cell physiology. As an example, daily cell cycle and depth affect cell size and fluorescence signals, by increasing cellular biovolume before division (Jacquet et al., 1998; Sosik et al., 2003; Thyssen et al., 2008b; Ribalet et al., 2015), by adaptation to light availability with depth (Vaulot et al., 1995; Partensky et al., 1999), or by variable incident irradiance favouring non-photochemical quenching (Brunet et al., 2008). These effects might impact the group position within cytograms over time. This is observed when sampling at short time intervals (e.g. hourly) to cover diel cycles, or when sampling in the water column, or in different ecosystems. Furthermore, the inference of cell diameter from light scattering measurements is challenging due to the difficulties in estimating the refractive index of micro-organisms. For example, the standard pico-nano size cut-off, originally defined using 2 µm filters, is not accurately estimated using calibrating standards (e.g. Polystyrene (PS) beads, cultures of known sizes) light scattering, and may separate otherwise well-defined pico-size clusters whose size fluctuate around 2 µm due to their cell cycle (Jacquet et al., 2001) or specific composition. This issue is a source of ambiguity and may lead to large uncertainties in the enumeration of both pico- and nano planktonic groups, and their size (Green et al., 2003; Duforêt-Gaurier et al., 2015; Ribalet et al., 2019), or even their carbon quota, using known conversion factors (Buitenhuis et al., 2012). In our document, we have used the forward scatter of 3 µm silica beads to separate pico from nano groups (Vaulot et al., 2008).
We do not provide a standard vocabulary for the optical parameters collected by flow cytometry, such as fluorescence or scatter, as these values are arbitrary. The relative units and the different configurations and settings of the instruments make the recorded optical values per cell not comparable. The conversion into quantitative values such as the conversion between FSC and SSC and size, or the conversion of the FLR into chlorophyll a concentration requires some comparison with in situ collected data from conventional methods (Haraguchi et al., 2017) or additional sorting (Bock et al., 2022).
Definition section = detailed description of the groups
Red only fluorescing prokaryotic picophytoplankton: RedPicoProk
The RedPicoProk are commonly identified as the unicellular photosynthetic cyanobacteria Prochlorococcus spp., sized on average 0.6 μm (Partensky et al., 1999). Due to their auto-fluorescence, staining is not required to detect them by FCM. When excited by a blue laser, their forward scatter (FSC or FWS) and red auto-fluorescence (FLR) emitted by chlorophylls (divinyl chlorophyll a for the prochlorophytes) allow their discrimination from the background noise. These are the smallest known photosynthetic marine microorganisms (Chisholm et al., 1988) and their detection requires sensitive photodetectors or high-power lasers (optimally at 445 nm wavelength). Due to their strong photo-acclimation properties, their red autofluorescence is at times too dim to be detected by FCM, especially on the surface in the summer, hence some cells may be lost in the background noise depending on the instrument’s sensitivity. At depth, RedPicoProk often shows a bimodal distribution of the FLR, due to the co-occurrence of two different ecotypes with different photo physiological properties (Campbell and Vaulot, 1993; van den Engh et al., 2017).
In samples incubated with a DNA-staining fluorescent dye and excited with a blue laser to enumerate heterotrophic prokaryote analyses, Prochlorococcus group(s) can sometimes be distinguished using sideward scattering (SSC or SWS) vs FLR or FLR vs green fluorescence emitted by DNA-staining fluorescent dye.
Orange fluorescing prokaryote picophytoplankton, rich in the pigment phycoerythrin: OraPicoProk
The OraPicoProk, usually identified as Synechococcus spp. cells are unicellular photosynthetic cyanobacteria with forward scatter (FSC) and sideward scatter (SSC) signatures larger than those of most marine heterotrophic bacteria and of RedPicoProk. Depending on the instrument settings, their optical signatures can span nearly two decades of signal sensitivity range (Vaulot et al., 1995). Staining is not required to distinguish them by FCM due to the presence of photosynthetic pigments. When excited by a blue laser, the OraPicoProk cluster displays higher FSC and FLR signatures than RedPicoProk at any given depth. They contain phycoerythrin, and have a distinct FLO signature, which can be excited by either 488 or 561 nm wavelength lasers. Depending on the optical band pass filters for fluorescence detection, the OraPicoProk cluster is well resolved in red vs green (FLR/FLG) and/or in FLR/FLO cytograms.
Red and Red only fluorescing prokaryote picophytoplankton, rich in the pigment phycocyanin: RedRedPico
The RedRedPico is a group mainly identified as the phycocyanin (PC)-containing picocyanobacteria (i.e. Synechococcus or Crocosphaera). This group can only be resolved using a red laser (615-640 nm). These PC-rich species are expected to be more abundant in turbid estuaries, as PC is optimized for orange-red light, whereas phycoerythrin (PE) pigments present in some other Synechococcus are optimally tuned to the blue-green light present in clear waters (Stomp et al., 2007). These RedRedPico overlap with RedPicoProk or RedPico on a FLO vs FLR cytogram when excited by a blue laser (Liu et al., 2014).
Red-only fluorescing picophytoplankton: RedPico
The RedPico is a polyphyletic group. Based on the literature, this group is defined by chlorophyll-containing cells with a diameter <3 μm (Buitenhuis et al., 2012 and references therein) with higher scatter than RedPicoProk and can include RedRedPico when only a blue laser is used. Staining is not required to distinguish them by FCM due to the presence of chlorophyll. RedPico exhibit a well-defined FCM signature when excited with a blue laser, with scatter signals (FSC or SSC) and FLR signals larger than those of RedPicoProk, but smaller than those of the RedNano (below). The FSC signal of either 2 or 3 µm fluorescent beads is widely used as an optical standard to localize this group, even though polystyrene beads are not a reliable indicator of cell size due to their refractive index higher than the one of cells. When possible, size-fractionated by sequential gravity filtration or cultures should be used to define this group (Green et al., 2003; Mojica et al., 2016; Ribalet et al., 2019).
Red only fluorescing nanophytoplankton: RedNano
The RedNano group is also a polyphyletic group, including phytoplankton cells with a size between approximately 3 and 20 µm. They auto-fluoresce red when excited by a blue laser due to the presence of chlorophyll. They differ from RedPico due to their higher FLR, SSC, and FSC. RedNano cells are distinguished from PE-containing cells as they lack orange fluorescence. This group may include the RedRedNano if the instrument used does not have a red laser to separate those phycocyanin-containing cells.
Orange and red fluorescing picophytoplankton, rich in the pigment phycoerythrin: OraPico
The OraPico group consists of ~3 µm auto-fluorescing prokaryotes or eukaryotes that contain the pigment PE and fluorescing in the orange and in the red. When excited by a blue laser, their SSC and FSC signatures are larger than those of OraPicoProk but with a FLR signature similar to the RedPico. This group includes cyanobacteria such as Crocosphaera spp. (Wilson et al., 2017) and cryptophytes.
Orange and red fluorescing nanophytoplankton, rich in the pigment phycoerythrin: OraNano
The OraNano group belongs to the size class of nanoplankton (3-20 µm). They are auto-fluorescing in the FLR due to the presence of chlorophyll. They contain PE and may also contain PC that can be excited by a red laser beam (615-640 nm). When excited by a blue laser, they exhibit FSC signatures similar to the RedNano but with a high FLO, often observed above the OraPico group in FLO vs FLR cytograms. If the OraNano cells contain both PE and PC and are excited by a blue laser beam they will emit a higher FLR signal compared to RedNano (due to the energy transfer to FLR, (Bazzani et al., 1992)). This group includes larger cyanobacteria (e.g. large-size Crocosphaera, Richelia), red algae and cryptophytes.
Red and red only fluorescing nanophytoplankton, rich in the pigment phycocyanin: RedRedNano
The RedRedNano group belongs to the nanoplankton size class (3-20 µm) and its cells emit red light when excited by a red laser (615-640 nm), due to PC (Read et al., 2014), but no or little in the orange when excited by a blue laser, due to lack of PE. Their FSC and FLR signatures are similar to RedNano. They include cryptophytes and some cyanobacteria, especially when they form small colonies (Wiśniewska et al., 2021).
Red fluorescing nanophytoplankton with relatively high sideward light scattering properties: HsNnano
The HsNano group consists of photosynthetic, mostly eukaryotic cells, that have a high SSC signal when excited by a blue laser, compared to the RedNano and OraNano groups, but similar FSC and FLR signatures. These cells also display a high depolarization ratio (parallel and vertical polarized forward light scatter). This optical property is very useful to identify coccolithophores that are covered with coccoliths made of CaCO3 (Green et al., 1996; Von Dassow et al., 2012), as well as some autotrophs and armoured dinoflagellates.
Red only fluorescing microphytoplankton: RedMicro
The RedMicro group is a polyphyletic group defined by cells or chains > 20 µm in size. When excited by a blue laser, this auto-fluorescing group is discriminated by its FSC and FLR signals, which are the largest observed by FCM. Due to the small sample volumes usually analysed by traditional FCM (less than 1 cm3 in most cases), counts for this group can have high uncertainties (due to their typically low concentrations). When FSC is calibrated with appropriate standards or phytoplankton cultures, it enables microphytoplankton to be distinguished from nanophytoplankton with a size of about 20 µm. Chains or colony-forming cells may be too large for FCM analysis depending on instrument characteristics (tubing size, flow cell dimension, pulse shape recording or not).
Orange fluorescing microphytoplankton: OraMicro
The OraMicro group consist of cells or chains > 20 µm. They display higher FSC and FLO signals than OraNano and a high FLO/FLR compared to the RedMicro group. Cells have a high PE content and may also contain PC that can be excited by a red laser. In this case, when a laser beam with a wavelength of approximately 533 nm (green) excites cells, they will emit a higher FLR signal compared to chlorophyll a only containing-cells due to the energy transfer to the pigment PC that will also emit fluorescence in the FLR channel. This group can include cryptophytes of > 20 µm, colonial cyanobacterial filaments, but also mixotrophic dinoflagellates and ciliates, according to their pigmentation. Due to the small volumes usually analysed by FCM (typically less than 1 cm3), counts for this group can have high uncertainties when cells are not abundant enough. When FSC is calibrated with appropriate standards or phytoplankton cell cultures, it is possible to distinguish microphytoplankton from nanophytoplankton cells with a size close to 20 µm. Chains or colonies may be too large for FCM analysis, depending on instrument characteristics (tubing inner diameter, flow cell dimensions, pulse shape recording or not).
Heterotrophic prokaryotes (Heterotrophic prokaryotes with relatively high nucleic acid= HetHNA and Heterotrophic prokaryotes with relatively low nucleic acid= HetLNA)
Heterotrophic prokaryotes include both Bacteria and Archaea. To be detected by FCM, staining is necessary. While initial studies have used nucleic acid-stained dyes like DAPI and Hoechst 33342 (Monger and Landry, 1993), nowadays a visible-light green-emitting dye is the most common choice. Blue laser excitation enables heterotrophic prokaryotes to be distinguished due to their SSC (or FSC) and green fluorescence (FLG) signatures. Cells with a lower FLG correspond to heterotrophic prokaryotes with a relatively lower nucleic acid content (HetLNA) and cells with a higher FLG correspond to heterotrophic prokaryotes with a relatively high nucleic acid content (HetHNA). Their scatter signals (FSC, SSC) are equal to or lower than those of OraPicoProk and RedPico and may overlap those of RedPicoProk. The LNA and HNA are apparent nucleic acid contents. By creating a cytogram of FLO vs FLG of the cells, it is possible to discriminate small size autotrophs (such as RedPicoProk) from heterotrophic prokaryotes in the same sample to be subtracted to get accurate heterotrophic prokaryote abundances.
Discrimination on cytograms: A conceptual view
The classification of phytoplankton and heterotrophic prokaryotes from FCM raw data is based on several two-parameter cytograms presenting scatter and fluorescence intensities (arbitrary units) on a log scale. On such cytograms, the selection of FCM groups relies on manually gating density distribution following higher densities in the centre and well separated from other groups on at least two optical parameters. When a FCM group is not abundant enough to estimate its distribution, or when a group has a multimodal distribution, the manual separation into individual groups relies on a-priori knowledge by experts. Output intercomparing between instruments is complex but can be facilitated by standard beads as a reference for approximating relative positions of groups and signal intensities. Despite the differences between flow cytometers and the physiological influences affecting optical properties, the relative positions of the 13 marine microbial groups defined in this paper follow a common pattern, leading to an agreement between FCM experts. Abundance comparison between instruments is then possible with high accuracy (Thyssen et al., 2014; Marrec et al., 2018). Conceptual cytograms are proposed in Figure 1 to help discriminate the most commonly observed plankton groups in seawater and a decision tree (Figure 2) inspired by Olson et al. (1989) illustrates the steps in identifying the red and orange fluorescing particles when using a blue laser. The yellow/green fluorescence has not been illustrated in the conceptual cytograms for the common phytoplankton identification, as it is not used to identify them.
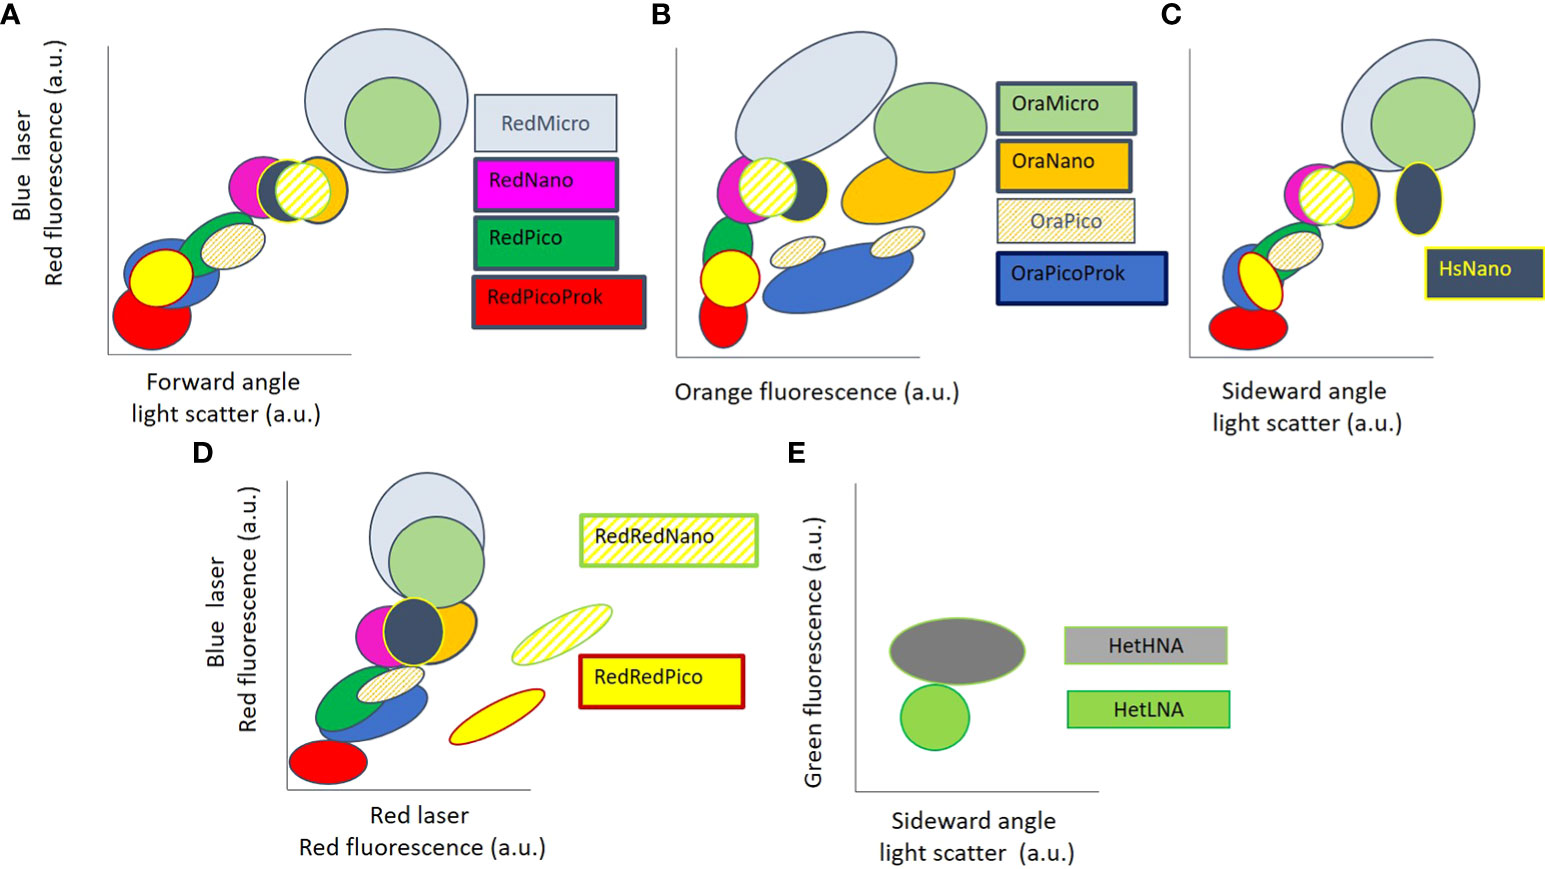
Figure 1 Conceptual cytograms depicting the relative position of the most commonly observed groups in marine waters. Axes are in log vs. log scale. (A) Relationship between forward light scatter (FSC), a proxy for cell size, and chlorophyll a FLR from a blue laser. (B) Phytoplankton group separation based on phycoerythrin orange fluorescence and chlorophyll a fluorescence. (C) Relationship between sideward angle light scatter (SSC), a proxy for cell surface roughness, and chlorophyll a FLR from a blue laser. (D) Relationship between chlorophyll a and phycocyanin FLR from a red laser, and chlorophyll a FLR from a blue laser. (E) HetHNA and HetLNA are evidenced after DNA staining with a green emission dye such as SybrGreen I® and are separated on a green fluorescence vs (SSC) with a blue laser. Group denomination and fluorescence terminology are further defined in the main text.
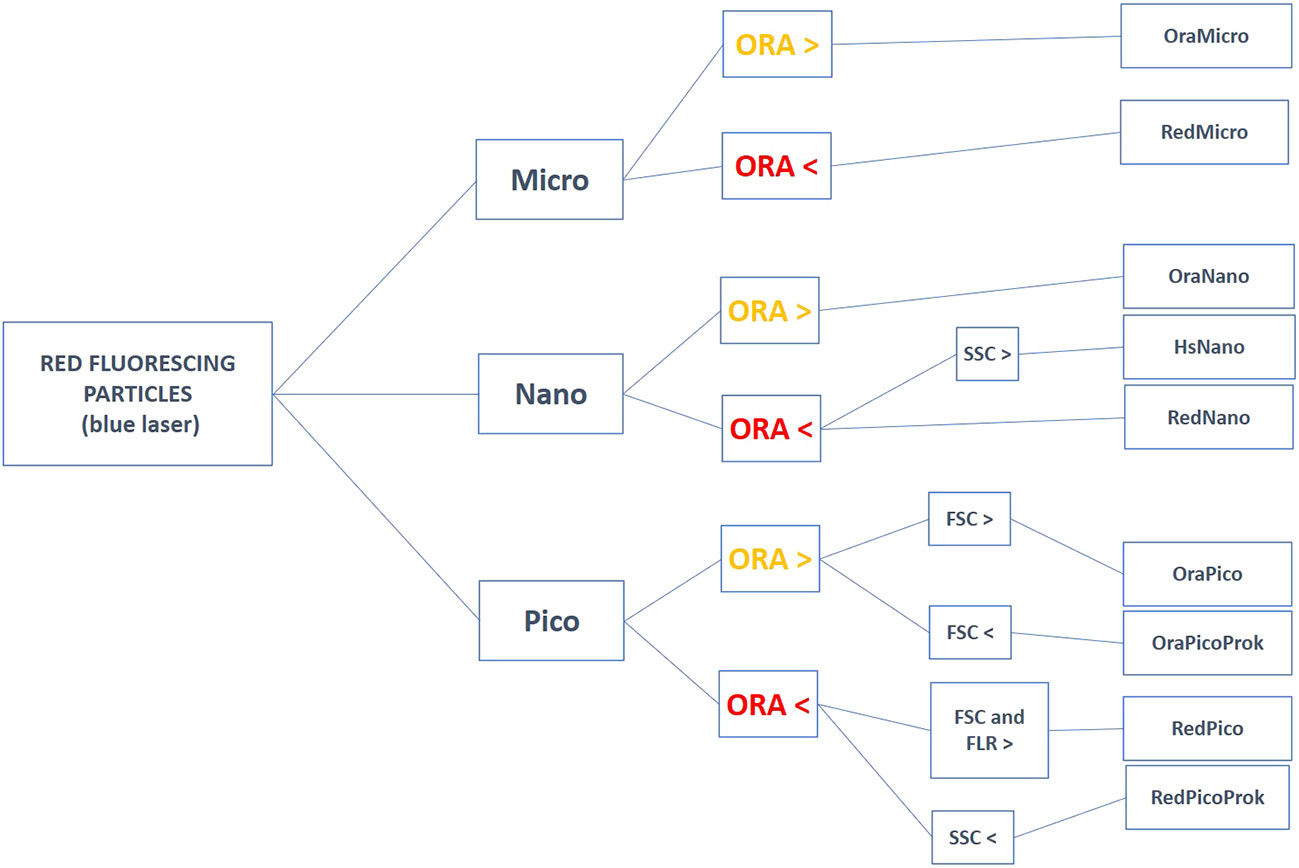
Figure 2 Decision tree for helping in the group’s discrimination on cytograms for unstained natural red fluorescing particles excited with a blue laser. Red fluorescing particles corresponding to the phytoplankton groups are selected above a threshold that corresponds to the lowest limit of detection of the FCM. The lowest limit of detection is defined when the optical noise and the signature of the detritus in the sheath signal are well identified and do not affect the smallest resolved phytoplankton group the FCM can count (at best, the RedPicoProk). FSC= Forward scatter, FLR= Red fluorescence, FLO= Orange fluorescence, SSC= Sideward scatter. The groups RedRedPico and RedRedNano (discriminated with a red laser), as well as the HetHNA and HetLNA, are not presented here.
In summary, RedPicoProk (Figures 1, 2) which includes Prochlorococcus spp. (Table 1) is usually very close to the instrument noise and the non-fluorescing particles when they come from well-lit waters (Gérikas Ribeiro et al., 2016). RedPico and RedNano (Figures 1, 2) belong to pico and nanophytoplankton size classes, 3 µm sized beads used as an internal standard may help in separating one from the other (Figure 2). OraPicoProk has a specific signature in the FLO (Figure 1B) due to phycoerythrin. The group typically presents an elongated ellipse signature in the red vs orange fluorescence, belonging in most cases to the Synechococcus genus (Olson et al., 1985, Figure 2). The OraPico (Figures 1A, B) has been found to belong to picoplanktonic cryptophytes (Metfies et al., 2010; Hamilton et al., 2017), but can also include, depending on the size and the environment, cyanobacteria such as Crocosphaera spp. They can share similar or higher orange fluorescence intensity as OraPicoProk, but with higher scatter signatures, similar to the RedPico group (Figure 1A). HsNano cells (Figure 1C) have a FSC signal similar to RedNano cells but are separated by their SSC signals. These are identified as coccolithophorids with coccoliths that generate high SSC signatures by light scatter (Green et al., 1996; Jacquet et al., 2002). RedMicro and OraMicro are only adequately counted when sample volume is high enough (several cm3) or by integrating several samples when collected within an appropriate time interval (Thyssen et al., 2008a) or if there is a high concentration of algal cells such as during bloom events. Their size class can be estimated from collected images when available, or after light scattering calibration using algal cultures or size fractionated filtration. RedRedPico and RedRedNano cells are only distinguished using a red laser with emission collected > 650 nm. The RedRedNano group is barely found in marine samples although it could include nanocyanobacteria or chain-forming cyanobacteria most often found in brackish and freshwaters (Read et al., 2014). The distribution of heterotrophic prokaryotes (HetLNA and HetHNA) is based on the fluorescence of the nucleic acid-stained intensity, with generally two groups observed, one over the other, in terms of intensity. HetHNA can also have a higher SSC signature (Gasol et al., 1999).
Vocabulary setup and governance
The FCM vocabulary is hosted on the NERC (Natural Environment Research Council) Vocabulary Server (NVS, https://vocab.nerc.ac.uk). The NVS is a dedicated semantic repository for terminologies used in the marine and related domains. It is managed by the British Oceanographic Data Centre (BODC) at the National Oceanography Centre in the United Kingdom. The NVS publishes terminologies like the FCM vocabulary, in standardized formats using the World Wide Web Consortium’s (W3C) Simple Knowledge Organization System (SKOS, https://www.w3.org/2004/02/skos/) to represent knowledge in a format that is understandable by both computers and humans. As part of the SeaDataCloud project, the terms and definitions needed to represent the commonly agreed FCM groups were converted into SKOS concepts and added to a SKOS collection. For the FCM concepts, a new collection had to be created. It was given its collection identifier (F02) to form its unique Uniform Resource Identifier (URI) https://vocab.nerc.ac.uk/collection/F02/. Within the collection, the SKOS concepts are made of an identifier, a mandatory preferred label, an optional alternative label, and an optional description field. The SKOS identifier enables each concept to be individually and uniquely accessible through its URI.
The technical governance of the FCM vocabulary is entirely managed by the NVS team at BODC while the content governance is currently coordinated by the authors of this paper. A GitHub repository (https://github.com/nvs-vocabs/F02) was set up to enable any interested person to propose changes, or additions or ask questions about the new vocabulary in a publicly open forum. The management of a vocabulary within a formal semantic repository infrastructure such as the NVS means that several guarantees are given to the users. One of these guarantees is that a term will never be deleted or modified in such a way that its meaning changes. Instead, terms that are no longer considered valid are deprecated meaning that their unique URI will remain valid but the concept will be marked as “deprecated” and, unless requested specifically, they will be, by default, filtered out of the BODC’ NVS search tool (https://vocab.nerc.ac.uk/search_nvs/F02/).
Discussion
Large and curated datasets of fundamental ecological traits and abundances of marine pelagic microorganisms should be made available worldwide, given their relevance in balancing Earth’s climate, controlling food webs, and affecting the ecological status of the oceans. FCM is a powerful tool to provide such datasets as it allows fast and reliable access to phytoplankton and heterotrophic prokaryotes abundance with a relatively good separation into important ecological traits such as size and pigment classes. Consequently, a wider scientific community and managers became interested in implementing FCM data more routinely in monitoring programmes (e.g., Benedetti-Cecchi et al., 2018; Delpy et al., 2018; Eriksen et al., 2019) increasing the FCM datasets in different pelagic habitats. However, homogenisation of datasets is as far as we know, not existing, preventing integration of knowledge at large scales. These datasets are undervalued and seldom integrated into global studies, due to a lack of sharing facilities and interoperability solutions. Without establishing a standardization framework also referred to as Ocean Best Practices (Pearlman et al., 2019), the FCM datasets cannot be shared worldwide, preventing their fundamental contribution to Essential Ocean Variables (EOVs) and Essential Biodiversity Variables (EBVs) for calculating indicators of biodiversity and ecosystems status and trends. During the last 10 years, steps towards best practices and quality control procedures for sample collection, calibration, standardization procedures and data management (including international ISO standards) have been started and discussed in national and international programs such as SOMLIT (https://www.somlit.fr/en/), Dymaphy (http://www.dymaphy.eu/), SeaDataCloud (H2020 EU project, ID: 730960; https://www.seadatanet.org/About-us/SeaDataCloud), JERICO-NEXT and JERICO-S3 (H2020 EU projects, ID: 654410/871153; https://www.jerico-ri.eu/) by a network of experts. Besides building best practices to make the handling of the flow cytometers similar between users, historically widely discussed and treated in the frame of immunology and medical use (Pachón et al., 2012), one of the first outcomes of these collaborative efforts is the establishment of the 13 groups of autotrophic (including mixotrophic) and heterotrophic microorganisms categorized and quantified based on a common non-taxonomic vocabulary. A second reason for building such a vocabulary is the continued development of machine learning and other techniques for interpreting the ever-growing number of studies involving multiparametric FCM analysis of marine samples, especially with the increasing use and diversity of autonomous high frequency sensors. Indeed, inter-laboratory data analysis based on manual classification of the FCM groups can be affected by strong variability, especially for the dimmest and the least concentrated groups such as the RedPicoProk, the HsNano or the RedMicro and OraMicro groups (Fuchs et al., 2022), and for data generated by different instruments (Peperzak et al., 2020). Annotation of groups based on a consensus definition will facilitate the process of building the workflow from the original dataset to the interoperable database. It will also strengthen and guide the users, by inferring and assessing the expected outcomes from marine water analyses. This step is one of several to proceed toward FAIR data, and it also paves the way for European (EMODnet; https://www.emodnet-biology.eu/) and global (OBIS; https://obis.org/) databases to consider trait-based biological information from FCM with high spatial and temporal resolution as valuable as and complementary to taxonomical data for developing EBVs for future policy requirements. However, by applying standards and trained neural networks dedicated to the recognition of the described groups presented in this manuscript, we advise it could hide some interesting groups not specifically recognised by the training set. Indeed, rare events or sub-groups should find their place in one of the 13 groups described here, still, it will belong to the scientist dealing with his instrument to make the choice on which level of complexity its study should focus on.
A similar effort on inter-laboratory validations and guidelines to ensure optimization of the settings for an instrument in observing marine microorganisms is urgently required. This can be supported by training, using similar standards such as reference beads and fixed samples. The need for large volume analyses to count rare groups is an unresolved problem, and limitations are strongly instrument-dependent. Harmonizing sample and data acquisition procedures should be assessed at the international level by sharing knowledge between experts. Open forums for discussions are a powerful source of success, enhancing collaborations (https://marinecytometry.slack.com). In addition, great efforts are done to sample and analyse viruses, heterotrophic flagellates, microzooplankton and/or microphytoplankton, via automatic staining or large volumes combined with cameras that allow some taxonomic identification for particles > 10 µm (Sosik and Olson, 2007; Lombard et al., 2019; Fragoso et al., 2019).
Data availability statement
The original contributions presented in the study are included in the article/Supplementary Material. Further inquiries can be directed to the corresponding author.
Author contributions
SL initiated the vocabulary standardization procedures with the sustain of GM. MT and GG wrote the first definition of each group. MT and VC wrote the first draft of the paper. The validation and rewriting of the definitions and the standard vocabulary were decided by all co-authors. MT lead the paper and all co-authors participated in the manuscript redaction. All authors contributed to the article and approved the submitted version.
Funding
Funding originated from the CHROME Project (Excellence Initiative of Aix-Marseille University – A*MIDEX, a French “Investissements d’Avenir” program), the SeaDataCloud (H2020 EU project, ID: 730960) and the JERICO-NEXT and JERICO-S3 (H2020 EU projects, ID: 654410/871153) projects, HMS gratefully acknowledges funding from the U.S National Science Foundation (OCE-1655686) and the Simons Foundation (561126).
Acknowledgments
We thank the BODC to store and maintain the standard vocabulary. We thank the JERICO projects to facilitate meetings for building the first discussion on the vocabulary. We thank all users and future users who will integrate this vocabulary into their datasets to make them accessible to the scientific community.
Conflict of interest
Author GD was employed by Cytobuoy b.v.
The remaining authors declare that the research was conducted in the absence of any commercial or financial relationships that could be construed as a potential conflict of interest.
The Reviewer AK declared a shared affiliation with the author SE to the handling Editor at the time of review.
Publisher’s note
All claims expressed in this article are solely those of the authors and do not necessarily represent those of their affiliated organizations, or those of the publisher, the editors and the reviewers. Any product that may be evaluated in this article, or claim that may be made by its manufacturer, is not guaranteed or endorsed by the publisher.
Supplementary material
The Supplementary Material for this article can be found online at: https://www.frontiersin.org/articles/10.3389/fmars.2022.975877/full#supplementary-material
References
Aardema H. M., Rijkeboer M., Lefebvre A., Veen A., Kromkamp J. C. (2019). High-resolution underway measurements of phytoplankto n photosynthesis and abundance as an innovative addition to water quality monitoring programs. Ocean Sci. 15, 1267–1285. doi: 10.5194/os-15-1267-2019
Aghaeepour N., Finak G., Hoos H., Mosmann T. R., Brinkman R., Gottardo R., et al. (2013). Critical assessment of automated flow cytometry data analysis techniques. Nat. Methods 10, 228–238. doi: 10.1038/nmeth.2365
Azam F., Fenchel T., Field J. G., Gray J., Meyer-Reil L., Thingstad F. (1983). The ecological role of water-column microbes in the sea. Mar. Ecol. Prog. Ser. 10, 257–263. doi: 10.3354/meps010257
Bazzani M., Breschi B., Cecchi G., Pantani L., Tirelli D., Valmori G., et al. (1992). Phytoplankton monitoring by laser-induced fluorescence. EARSeL Adv. Remote Sens 1, 106–110.
Bock N., Subramaniam A., Juhl A. R., Montoya J., Duhamel S. (2022). Quantifying per-cell chlorophyll a in natural picophytoplankton populations using fluorescence-activated cell sorting. Front. Mar. Sci. 9. doi: 10.3389/fmars.2022.850646
Bonato S., Christaki U., Lefebvre A., Lizon F., Thyssen M., Artigas L. F. (2015). High spatial variability of phytoplankton assessed by flow cytometry, in a dynamic productive coastal area, in spring: The eastern English channel. Estuar. Coast. Shelf Sci. 154, 214–223. doi: 10.1016/j.ecss.2014.12.037
Boss E., Waite A., Muller-Karger F., Yamazaki H., Wanninkhof R., Uitz J., et al. (2018). Beyond chlorophyll fluorescence: The time is right to expand biological measurements in ocean observing programs. Limnol. Oceanogr. Bull. 27, 89–90. doi: 10.1002/lob.10243
Brownlee E. F., Olson R. J., Sosik H. M. (2016). Microzooplankton community structure investigated with imaging flow cytometry and automated live-cell staining. Mar. Ecol. Prog. Series. 550, 65–81. doi: 10.3354/meps11687
Brunet C., Casotti R., Vantrepotte V. (2008). Phytoplankton diel and vertical variability in photobiological responses at a coastal station in the Mediterranean Sea. J. Plankton Res. 30, 645–654. doi: 10.1093/plankt/fbn028
Buitenhuis E. T., Li W. K. W., Vaulot D., Lomas M. W., Landry M. R., Partensky F., et al. (2012). Picophytoplankton biomass distribution in the global ocean. Earth Syst. Sci. Data 4, 37–46. doi: 10.5194/essd-4-37-2012
Campbell L., Vaulot D. (1993). Photosynthetic picoplankton community structure in the subtropical north pacific ocean near Hawaii (station ALOHA). Deep Sea Res. Part Oceanogr. Res. Pap. 40, 2043–2060. doi: 10.1016/0967-0637(93)90044-4
Chisholm S. W., Olson R. J., Zettler E. R., Goericke R., Waterbury J. B., Welschmeyer N. A. (1988). A novel free-living prochlorophyte abundant in the oceanic euphotic zone. Nature 334, 340–343. doi: 10.1038/334340a0
Christaki U., Courties C., Massana R., Catala P., Lebaron P., Gasol J. M., et al. (2011). Optimized routine flow cytometric enumeration of heterotrophic flagellates using SYBR green I. Limnol. Oceanogr. Methods 9, 329–339. doi: 10.4319/lom.2011.9.329
Courties C., Vaquer A., Troussellier M., Lautier J., Chrétiennot-Dinet M. J., Neveux J., et al. (1994). Smallest eukaryotic organism. Nature 370, 255–255. doi: 10.1038/370255a0
Delpy F., Serranito B., Jamet J.-L., Grégori G., LePoupon C., Jamet D. (2018). Pico- and nanophytoplankton dynamics in two coupled but contrasting coastal bays in the NW Mediterranean Sea (France). Estuaries Coasts 41, 2039–2055. doi: 10.1007/s12237-018-0412-9
Dubelaar G. B. J., Gerritzen P. L., Beeker A. E. R., Jonker R. R., Tangen K. (1999). Design and first results of CytoBuoy: A wireless flow cytometer for in situ analysis of marine and fresh waters. Cytometry 37, 247–254. doi: 10.1002/(SICI)1097-0320(19991201)37:4<247::AID-CYTO1>3.0.CO;2-9
Ducklow H. W., Purdie Duncan A., Williams P. J. L., Davies John M. (1986). Bacterioplankton: A sink for carbon in a coastal marine plankton community. Science 232, 865–867. doi: 10.1126/science.232.4752.865
Duforêt-Gaurier L., Moutier W., Guiselin N., Thyssen M., Dubelaar G., Mériaux X., et al. (2015). Determination of backscattering cross-section of individual particles from cytometric measurements: a new methodology. Opt. Express 23, 31510–31533. doi: 10.1364/OE.23.031510
Eriksen R. S., Davies C. H., Bonham P., Coman F. E., Edgar S., McEnnulty F. R., et al. (2019). Australia’s long-term plankton observations: The integrated marine observing system national reference station network. Front. Mar. Sci. 6. doi: 10.3389/fmars.2019.00161
Fenchel T., King G. M., Blackburn T. H. (2012) “Chapter 1 - bacterial metabolism,” in Bacterial biogeochemistry, 3rd ed. Eds. Fenchel T., King G. M., Blackburn T. H. (Boston: Academic Press), 1–34. doi: 10.1016/B978-0-12-415836-8.00001-3
Field C. B., Behrenfeld M. J., Randerson J. T., Falkowski P. (1998). Primary production of the biosphere: Integrating terrestrial and oceanic components. Science 281, 237–240. doi: 10.1126/science.281.5374.237
Fontana S., Thomas M. K., Moldoveanu M., Spaak P., Pomati F. (2018). Individual-level trait diversity predicts phytoplankton community properties better than species richness or evenness. ISME J. 12, 356–366. doi: 10.1038/ismej.2017.160
Fowler B. L., Neubert M. G., Hunter-Cevera K. R., Olson R. J., Shalapyonok A., Solow A. R., et al. (2020). Dynamics and functional diversity of the smallest phytoplankton on the northeast US shelf. Proc. Natl. Acad. Sci. 117, 12215–12221. doi: 10.1073/pnas.1918439117
Fragoso G. M., Poulton A. J., Pratt N. J., Johnsen G., Purdie D. A. (2019). Trait-based analysis of subpolar north Atlantic phytoplankton and plastidic ciliate communities using automated flow cytometer. Limnol. Oceanogr. 64, 1763–1778. doi: 10.1002/lno.11189
Fuchs R., Thyssen M., Creach V., Dugenne M., Izard L., Latimier M., et al. (2022). Automatic recognition of flow cytometric phytoplankton functional groups using convolutional neural networks. Limnol. Oceanogr. Methods 20, 387–399. doi: 10.1002/lom3.10493
Gasol J. M., Zweifel U. L., Peters F., Fuhrman J. A., Hagström A. (1999). Significance of size and nucleic acid content heterogeneity as measured by flow cytometry in natural planktonic bacteria. Appl. Environ. Microbiol. 65, 4475–4483. doi: 10.1128/AEM.65.10.4475-4483.1999
Gérikas Ribeiro C., Marie D., Lopes dos Santos A., Pereira Brandini F., Vaulot D. (2016). Estimating microbial populations by flow cytometry: Comparison between instruments. Limnol. Oceanogr. Methods 14, 750–758. doi: 10.1002/lom3.10135
Green J. C., Course P. A., Tarran G. A. (1996). The life-cycle of emiliania huxleyi: A brief review and a study of relative ploidy levels analysed by flow cytometry. J. Mar. Syst. 9, 33–44. doi: 10.1016/0924-7963(96)00014-0
Green R. E., Sosik H. M., Olson R. J., DuRand M. D. (2003). Flow cytometric determination of size and complex refractive index for marine particles: comparison with independent and bulk estimates. Appl. Opt. 42, 526–541. doi: 10.1364/AO.42.000526
Grégori G., Colosimo A., Denis M. (2001). Phytoplankton group dynamics in the bay of Marseilles during a 2-year survey based on analytical flow cytometry. Cytometry 44, 247–256. doi: 10.1002/1097-0320(20010701)44:3<247::AID-CYTO1117>3.0.CO;2-Z
Hamilton M., Hennon G. M. M., Morales R., Needoba J., Peterson T. D., Schatz M., et al. (2017). Dynamics of teleaulax-like cryptophytes during the decline of a red water bloom in the Columbia river estuary. J. Plankton Res. 39, 589–599. doi: 10.1093/plankt/fbx029
Hammes F., Broger T., Weilenmann H.-U., Vital M., Helbing J., Bosshart U., et al. (2012). Development and laboratory-scale testing of a fully automated online flow cytometer for drinking water analysis. Cytometry Part A 81A (6), 508–516. doi: 10.1002/cyto.a.22048
Haraguchi L., Jakobsen H., Lundholm N., Carstensen J. (2017). Monitoring natural phytoplankton communities : A comparison between traditional methods and pulse-shape recording flow cytometry. Aquat. Microbial. Ecol. 80, 7792. doi: 10.3354/ame01842
Hunter-Cevera K. R., Neubert M. G., Olson R. J., Solow A. R., Shalapyonok A., Sosik H. M. (2016). Physiological and ecological drivers of early spring blooms of a coastal phytoplankter. Science 354, 326–329. doi: 10.1126/science.aaf8536
Hyrkas J., Clayton S., Ribalet F., Halperin D., Virginia Armbrust E., Howe B. (2016). Scalable clustering algorithms for continuous environmental flow cytometry. Bioinformatics 32, 417–423. doi: 10.1093/bioinformatics/btv594
Jacquet S., Heldal M., Iglesas-Rodriguez D., Larsen A., William W., Bratbak G. (2002). Flow cytometric analysis of an emiliana huxleyi bloom terminated by viral infection. Aquat. Microb. Ecol. 27, 111–124. doi: 10.3354/ame027111
Jacquet S., Lennon J.-F., Marie D., Vaulot D. (1998). Picoplankton population dynamics in coastal waters of the northwestern Mediterranean Sea. Limnol. Oceanogr. 43, 1916–1931. doi: 10.4319/lo.1998.43.8.1916
Jacquet S., Partensky F., Lennon J.-F., Vaulot D. (2001). Diel patterns of growth and division in marine picoplankton in culture. J. Phycol. 37, 357. doi: 10.1046/j.1529-8817.2001.037003357.x
Lévy M., Franks P. J. S., Smith K. S. (2018). The role of submesoscale currents in structuring marine ecosystems. Nat. Commun. 9, 4758. doi: 10.1038/s41467-018-07059-3
Li W. K. W., Jellett J. F., Dickie P. M. (1995). DNA Distributions in planktonic bacteria stained with TOTO or TO-PRO. Limnol. Oceanogr. 40, 1485–1495. doi: 10.4319/lo.1995.40.8.1485
Litchman E., Klausmeier C. A., Schofield O. M., Falkowski P. G. (2007). The role of functional traits and trade-offs in structuring phytoplankton communities: scaling from cellular to ecosystem level. Ecol. Lett. 10, 1170–1181. doi: 10.1111/j.1461-0248.2007.01117.x
Liu H., Jing H., Wong T. H. C., Chen B. (2014). Co-Occurrence of phycocyanin- and phycoerythrin-rich synechococcus in subtropical estuarine and coastal waters of Hong Kong. Environ. Microbiol. Rep. 6, 90–99. doi: 10.1111/1758-2229.12111
Lombard F., Boss E., Waite A. M., Vogt M., Uitz J., Stemmann L., et al. (2019). Globally consistent quantitative observations of planktonic ecosystems. Front. Mar. Sci. 6. doi: 10.3389/fmars.2019.00196
Louchart A., Lizon F., Lefebvre A., Didry M., Schmitt F. G., Artigas L. F. (2020). Phytoplankton distribution from Western to central English channel, revealed by automated flow cytometry during the summer-fall transition. Cont. Shelf Res. 195, 104056. doi: 10.1016/j.csr.2020.104056
Malkassian A., Nerini D., van Dijk M. A., Thyssen M., Manté C., Grégori G. (2011). Functional analysis and classification of phytoplankton based on data from an automated flow cytometer. Cytometry A 79 (4), 263. doi: 10.1002/cyto.a.21035
Manti A., Papa S., Boi P. (2012). "What flow cytometry can tell us about marine micro-organisms – current status and future applications." in Flow cytometry - Recent perspectives. (London, United Kingdom:IntechOpen) Available at: https://www.intechopen.com/chapters/37421
Marrec P., Grégori G., Doglioli A. M., Dugenne M., Penna A. D., Bhairy N., et al. (2018). Coupling physics and biogeochemistry thanks to high-resolution observations of the phytoplankton community structure in the northwestern Mediterranean Sea. Biogeosciences 15, 1579–1606. doi: 10.5194/bg-15-1579-2018
Metfies K., Gescher C., Frickenhaus S., Niestroj-Pahl R., Wichels A., Gerdts G., et al. (2010). Contribution of the class cryptophyceae to phytoplankton structure in the German bight. J. Phycol. 46, 1152–1160. doi: 10.1111/j.1529-8817.2010.00902.x
Mojica K. D. A., Huisman J., Wilhelm S. W., Brussaard C. P. D. (2016). Latitudinal variation in virus-induced mortality of phytoplankton across the north Atlantic ocean. ISME J. 10, 500–513. doi: 10.1038/ismej.2015.130
Monger B. C., Landry M. R. (1993). Flow cytometric analysis of marine bacteria with hoechst 33342. Appl. Environ. Microbiol. 59, 905–911. doi: 10.1128/aem.59.3.905-911.1993
Benedetti-Cecchi L., Boehme L., Boero F., Christensen A., Grémare A., Hernandez F., et al. (2018). Strengthening Europe’s Capability in Biological Ocean Observations.Muñiz Piniella Á., Kellett P., Larkin K., Heymans J. J. Future Science Brief 3 of the European Marine Board, Ostend (Belgium), 76. ISBN: 9789492043559 ISSN: 2593–5232
Olson R. J., Shalapyonok A., Sosik H. M. (2003). An automated submersible flow cytometer for analyzing pico- and nanophytoplankton: FlowCytobot. Deep Sea Res. Part Oceanogr. Res. Pap. 50, 301–315. doi: 10.1016/S0967-0637(03)00003-7
Olson R. J., Sosik H. M. (2007). A submersible imaging-in-flow instrument to analyze nano-and microplankton: Imaging FlowCytobot. Limnol. Oceanogr. Methods 5, 195–203. doi: 10.4319/lom.2007.5.195
Olson R. J., Vaulot D., Chisholm S. W. (1985). Marine phytoplankton distributions measured using shipboard flow cytometry. Deep Sea Res. Part Oceanogr. Res. Pap. 32, 1273–1280. doi: 10.1016/0198-0149(85)90009-3
Olson R. J., Zettler E. R., Anderson O. K. (1989). Discrimination of eukaryotic phytoplankton cell types from light scatter and autofluorescence properties measured by flow cytometry. Cytometry 10, 636–643. doi: 10.1002/cyto.990100520
Olusoji O. D., Spaak J. W., Holmes M., Neyens T., Aerts M., De Laender F. (2021). cyanoFilter: An r package to identify phytoplankton populations from flow cytometry data using cell pigmentation and granularity. Ecol. Model. 460, 109743. doi: 10.1016/j.ecolmodel.2021.109743
Pachón G., Caragol I., Petriz J. (2012). Subjectivity and flow cytometric variability. Nat. Rev. Immunol. 12, 396–396. doi: 10.1038/nri3158-c1
Partensky F., Blanchot J., Vaulot D. (1999). “Differential distribution and ecology of Prochlorococcus and Synechococcus in oceanic waters: A review”. in Marine Cyanobacteria. Eds. Charpy L., Larkum A. (Monaco: Musée Océanographique), 457–476.
Peacock E., Sosik H., Olson R. (2014). Parasitic infection of the diatom guinardia delicatula, a recurrent and ecologically important phenomenon on the new England shelf. Mar. Ecol. Prog. Ser. 503, 1–10. doi: 10.3354/meps10784
Pearlman J., Bushnell M., Coppola L., Karstensen J., Buttigieg P. L., Pearlman F., et al. (2019). Evolving and sustaining ocean best practices and standards for the next decade. Front. Mar. Sci. 6. doi: 10.3389/fmars.2019.00277
Peperzak L., Zetsche E.-M., Gollasch S., Artigas L. F., Bonato S., Creach V., et al. (2020). Comparing flow cytometry and microscopy in the quantification of vital aquatic organisms in ballast water. J. Mar. Eng. Technol. 19, 68–77. doi: 10.1080/20464177.2018.1525806
Pomeroy L. R. (1974). The ocean’s food web, a changing paradigm. BioScience 24, 499–504. doi: 10.2307/1296885
Quéré C. L., Harrison S. P., Colin Prentice I., Buitenhuis E. T., Aumont O., Bopp L., et al. (2005). Ecosystem dynamics based on plankton functional types for global ocean biogeochemistry models. Glob. Change Biol. 11, 2016–2040. doi: 10.1111/j.1365-2486.2005.1004.x
Read D., Bowes M., Newbold L., Whiteley A. (2014). Weekly flow cytometric analysis of riverine phytoplankton to determine seasonal bloom dynamics. Environ. Sci. Process. Impacts 16, 594–603. doi: 10.1039/c3em00657c
Ribalet F., Berthiaume C., Hynes A., Swalwell J., Carlson M., Clayton S., et al. (2019). SeaFlow data v1, high-resolution abundance, size and biomass of small phytoplankton in the north pacific. Sci. Data 6, 277. doi: 10.1038/s41597-019-0292-2
Ribalet F., Schruth D. M., Armbrust E. V. (2011). flowPhyto: enabling automated analysis of microscopic algae from continuous flow cytometric data. bioinforma. Oxf. Engl. 27, 732–733. doi: 10.1093/bioinformatics/btr003
Ribalet F., Swalwell J., Clayton S., Jiménez V., Sudek S., Lin Y., et al. (2015). Light-driven synchrony of prochlorococcus growth and mortality in the subtropical pacific gyre. Proc. Natl. Acad. Sci. 112 (26), 8008–8012. doi: 10.1073/pnas.1424279112
Rutten T. P. A., Sandee B., Hofman A. R. T. (2005). Phytoplankton monitoring by high performance flow cytometry: A successful approach? Cytometry A 64 (1), 16–26. doi: 10.1002/cyto.a.20106
Salmaso N., Naselli-Flores L., Padisák J. (2015). Functional classifications and their application in phytoplankton ecology. Freshw. Biol. 60, 603–619. doi: 10.1111/fwb.12520
Silovic T., Grégori G., Dugenne M., Thyssen M., Calendreau F., Cossart T., et al. (2017). “A new automated flow cytometer for high frequency in situ characterisation of heterotrophic microorganisms and their dynamics in aquatic ecosystems,” in Proceedings IMEKO international conference on metrology for the sea. (Naples, Italy), 58–61.
Sosik H. M., Olson R. J. (2007). Automated taxonomic classification of phytoplankton sampled with imaging-in-flow cytometry. Limnology Oceanogr.: Methods 5, 204–216. doi: 10.4319/lom.2007.5.204
Sosik H. M., Olson R. J., Neubert M. G., Shalapyonok A., Solow A. R. (2003). Growth rates of coastal phytoplankton from time-series measurements with a submersible flow cytometer. Limnol. Oceanogr. 48, 1756–1765. doi: 10.4319/lo.2003.48.5.1756
Stomp M., Huisman J., Vörös L., Pick F. R., Laamanen M., Haverkamp T., et al. (2007). Colourful coexistence of red and green picocyanobacteria in lakes and seas. Ecol. Lett. 10, 290–298. doi: 10.1111/j.1461-0248.2007.01026.x
Swalwell J. E., Ribalet F., Armbrust E. V. (2011). SeaFlow: A novel underway flow-cytometer for continuous observations of phytoplankton in the ocean. Limnol. Oceanogr. Methods 9, 466–477. doi: 10.4319/lom.2011.9.466
Thyssen M., Alvain S., Lefebvre A., Dessailly D., Rijkeboer M., Guiselin N., et al. (2015). High-resolution analysis of a north Sea phytoplankton community structure based on in situ flow cytometry observations and potential implication for remote sensing. Biogeosciences 12, 4051–4066. doi: 10.5194/bg-12-4051-2015
Thyssen M., Garcia N., Denis M. (2009). Sub Meso scale phytoplankton distribution in the north East Atlantic surface waters determined with an automated flow cytometer. Biogeosciences 6, 569–583. doi: 10.5194/bg-6-569-2009
Thyssen M., Grégori G. J., Grisoni J.-M., Pedrotti M. L., Mousseau L., Artigas L. F., et al. (2014). Onset of the spring bloom in the northwestern Mediterranean Sea: influence of environmental pulse events on the in situ hourly-scale dynamics of the phytoplankton community structure. Front. Microbiol. 5, 387. doi: 10.3389/fmicb.2014.00387
Thyssen M., Mathieu D., Garcia N., Denis M. (2008b). Short-term variation of phytoplankton assemblages in Mediterranean coastal waters recorded with an automated submerged flow cytometer. J. Plankton Res. 30, 1027–1040. doi: 10.1093/plankt/fbn054
Thyssen M., Tarran G. A., Zubkov M. V., Holland R. J., Grégori G., Burkill P. H., et al. (2008a). The emergence of automated high-frequency flow cytometry: revealing temporal and spatial phytoplankton variability. J. Plankton Res. 30, 333–343. doi: 10.1093/plankt/fbn005
Trask B. J., van den Engh G. J., Elgershuizen J. H. B. W. (1982). Analysis of phytoplankton by flow cytometry. Cytometry 2, 258–264. doi: 10.1002/cyto.990020410
van den Engh G. J., Doggett J. K., Thompson A. W., Doblin M. A., Gimpel C. N. G., Karl D. M. (2017). Dynamics of prochlorococcus and synechococcus at station ALOHA revealed through flow cytometry and high-resolution vertical sampling. Front. Mar. Sci. 4. doi: 10.3389/fmars.2017.00359
Vaulot D., Eikrem W., Viprey M., Moreau H. (2008). The diversity of small eukaryotic phytoplankton (≤3 μm) in marine ecosystems. FEMS Microbiol. Rev. 32, 795–820. doi: 10.1111/j.1574-6976.2008.00121.x
Vaulot D., Marie D., Olson R. J., Chisholm S. W. (1995). Growth of prochlorococcus, a photosynthetic prokaryote, in the equatorial pacific ocean. Science 268, 1480–1482. doi: 10.1126/science.268.5216.1480
Von Dassow P., van den Engh G., Iglesias-Rodriguez D., Gittins J. (2012). Calcification state of coccolithophores can be assessed by light scatter depolarization measurements with flow cytometry. J. Plankton Res. 34, 1011–1027. doi: 10.1093/plankt/fbs061
Wiśniewska K., Śliwińska-Wilczewska S., Lewandowska A., Konik M. (2021). The effect of abiotic factors on abundance and photosynthetic performance of airborne cyanobacteria and microalgae isolated from the southern Baltic Sea region. Cells 10, 103. doi: 10.3390/cells10010103
Wilkinson M. D., Dumontier M., Ij. J., Appleton G., Axton M., Baak A., et al. (2016). The FAIR guiding principles for scientific data management and stewardship. Sci. Data 3, 160018. doi: 10.1038/sdata.2016.18
Wilson S. T., Aylward F. O., Ribalet F., Barone B., Casey J. R., Connell P. E., et al. (2017). Coordinated regulation of growth, activity and transcription in natural populations of the unicellular nitrogen-fixing cyanobacterium crocosphaera. Nat. Microbiol. 2, 17118. doi: 10.1038/nmicrobiol.2017.118
Worden A. Z., Janouskovec J., McRose D., Engman A., Welsh R. M., Malfatti S., et al. (2012). Global distribution of a wild alga revealed by targeted metagenomics. Curr. Biol. 22, R675–R677. doi: 10.1016/j.cub.2012.07.054
Yentsch C. M., Horan P. K., Muirhead K., Dortch Q., Haugen E., Legendre L., et al. (1983). Flow cytometry and cell sorting: A technique for analysis and sorting of aquatic particles1. Limnol. Oceanogr. 28, 1275–1280. doi: 10.4319/lo.1983.28.6.1275
Yentsch C. S., Yentsch C. M. (1979). Fluorescence spectral signatures: the characterization of phytoplankton populations by the use of excitation and emission spectra. J. Mar. Res. 37, 471–483.
Zhao L., Denis M., Barani A., Beker B., Manté C., Xiao T., et al. (2012). Possible bloom of free trichomes in the bay of marseille, NW Mediterranean Sea: an anomaly evidenced by flow cytometry. J. Plankton Res. 34, 711–718. doi: 10.1093/plankt/fbs038
Keywords: flow cytometry, marine microorganisms, standardization, vocabulary, FAIR principle interoperable vocabulary for marine flow cytometry
Citation: Thyssen M, Grégori G, Créach V, Lahbib S, Dugenne M, Aardema HM, Artigas L-F, Huang B, Barani A, Beaugeard L, Bellaaj-Zouari A, Beran A, Casotti R, Del Amo Y, Denis M, Dubelaar GBJ, Endres S, Haraguchi L, Karlson B, Lambert C, Louchart A, Marie D, Moncoiffé G, Pecqueur D, Ribalet F, Rijkeboer M, Silovic T, Silva R, Marro S, Sosik HM, Sourisseau M, Tarran G, Van Oostende N, Zhao L and Zheng S (2022) Interoperable vocabulary for marine microbial flow cytometry. Front. Mar. Sci. 9:975877. doi: 10.3389/fmars.2022.975877
Received: 22 June 2022; Accepted: 01 November 2022;
Published: 18 November 2022.
Edited by:
Johannes Karstensen, Helmholtz Association of German Research Centres (HZ), GermanyReviewed by:
Alex C. Kraberg, Alfred Wegener Institute Helmholtz Centre for Polar and Marine Research (AWI), GermanyStéphane PESANT, European Bioinformatics Institute (EMBL-EBI), United Kingdom
J.Paul Robinson, Purdue University, United States
Copyright © 2022 Thyssen, Grégori, Créach, Lahbib, Dugenne, Aardema, Artigas, Huang, Barani, Beaugeard, Bellaaj-Zouari, Beran, Casotti, Del Amo, Denis, Dubelaar, Endres, Haraguchi, Karlson, Lambert, Louchart, Marie, Moncoiffé, Pecqueur, Ribalet, Rijkeboer, Silovic, Silva, Marro, Sosik, Sourisseau, Tarran, Van Oostende, Zhao and Zheng. This is an open-access article distributed under the terms of the Creative Commons Attribution License (CC BY). The use, distribution or reproduction in other forums is permitted, provided the original author(s) and the copyright owner(s) are credited and that the original publication in this journal is cited, in accordance with accepted academic practice. No use, distribution or reproduction is permitted which does not comply with these terms.
*Correspondence: Melilotus Thyssen, bWVsaWxvdHVzLnRoeXNzZW5AbWlvLm9zdXB5dGhlYXMuZnI=