 Xiaomei Xu1
 Jianhua Gao1,2*
 Yong Shi1Xiaodong Wu3Jixuan Lv1Shuo Zhang1Shengjing Liu1Tao Liu1Guang Yang1
- 1School of Geography and Ocean Science, Ministry of Education Key Laboratory for Coast and Island Development, Nanjing University, Nanjing, China
- 2Laboratory for Marine Geology, Qingdao National Laboratory for Marine Science and Technology, Qingdao, China
- 3School of Oceanography, Shanghai Jiao Tong University, Shanghai, China
Ocean fronts are widespread on the eastern China shelf, especially in winter and early spring. Previous studies have shown that sediments on the northern coast of the Shandong Peninsula could penetrate the coastal fronts and deposit on the southern coast of the Liaodong Peninsula, and this cross-front transport process is closely related to winter storms. However, the detailed mechanisms of cross-front transport remain unclear. In this study, through realistic numerical modeling and physical mechanism analysis, a dynamic mechanism involving cross-front transport triggered by winter storms was proposed, and two locations with the highest probability of frontal instability around the Shandong Peninsula were identified. In detail, forced by winter storms, the Lubei Coastal Current significantly intensifies first and causes frontal inertial instability in the early stage of the winter storm, favoring cross-front exchange between both sides of the front. Then, serving as a compensation current, the Yellow Sea Warm Current intensifies in the late stage of the winter storm, leading to the northward transport of the materials out of the front. Furthermore, the intensity, distance, and path of the cross-front transport under varying winter storms are also investigated. The winter storm, with longer duration, greater wind speed, and westward wind direction, tends to trigger stronger cross-front transport and longer transport distance. Transport paths also differ under different winter storms. This study provides a theoretical explanation for cross-front transport and analyzes the role of winter storms in it, providing some new ideas for nearshore materials dispersal to the sea, which is of great significance for future studies on pollutant diffusion, nutrient distribution, and sediment transport in coastal areas.
1. Introduction
An ocean front is a narrow zone where different water masses meet, creating enhanced horizontal gradients of water properties like temperature, salinity, and nutrients (Belkin, 2002). Ocean fronts are widespread and play an important role in marine ecosystems (Olson et al, 1994; Longhurst, 2010; Baltar et al, 2016). Most ocean fronts have the feature of surface convergence which contributes to the high biological productivity (Johnston et al., 2011; Omand et al., 2015; Liu et al., 2018) and high concentrations of pollutants (Belkin et al., 2009; Lohmann and Belkin, 2014). In the absence of external forces, the front is equivalent to a barrier, limiting the exchange of materials across the front (Danchenkov et al., 2006; Zhang et al., 2016; Zang et al., 2017). However, a strong external disturbance like river runoff and strong winds will arouse frontal instabilities, resulting in water movement across the front (Li et al., 2003; Castelao et al., 2008; Peterson & Peterson, 2009; Nencioli et al., 2016). Cross-front transport can regulate the fluxes of nutrients and sediments, as well as the dispersion of pollutants, which strongly influences ecological conditions and material circulations in both the coastal regions and the open ocean. Therefore, improving our understanding of the physical processes and mechanisms of cross-front transport is of great significance for future studies in coastal areas.
Ocean fronts are widespread on the eastern China shelf, especially in winter and early spring while the fronts are peaking with features of high intensity and a stable morphology (Wang & Liu, 2009; Liu et al., 2018). In winter, a strong and cold northwesterly monsoon (the East Asian Winter Monsoon) rapidly decreases the sea surface temperature and drives coastal water southwards to form the cold coastal currents (Huang et al., 2010; Luo et al., 2017; Shi et al, 2022). Meanwhile, the offshore currents (Taiwan Warm Current and Yellow Sea Warm Current) move northward. The confluence of these two totally different currents favors the ocean fronts along Chinese coasts. These coastal fronts play a critical role in the formation and evolution of estuary-coast-shelf sedimentary systems (Dong et al., 2011; Liu et al., 2018; Shi et al., 2019). For the coastal mud deposits, they were established by alongshore transport and the coastal fronts usually controlled their extension and morphology. For the offshore mud deposits, the process of cross-front transport of coastal sediments plays a vital role, which is quite complex and still controversial (Yang et al., 2003; Li et al., 2014; Wang et al., 2014b). Recently, many scientists focused on the study of cross-front transport and found that winter storms (bursts of the East Asian Winter Monsoon) were crucial to the transport of materials across the frontal areas on the eastern China shelf (Liu et al., 2018). However, there is still a lack of sufficient understanding of the dynamic mechanisms between the winter storm and cross-front transport.
In this study, the North Yellow Sea (NYS) was selected to explore the mechanisms of cross-front transport, as in winter this area is rarely affected by large rivers and the winter storm is the most important external forcing. The NYS is the northern part of the Yellow Sea, a shallow semi-enclosed marginal sea bounded by the Korean Peninsula, the Shandong Peninsula, and the Liaodong Peninsula (Figure 1A). In winter, the central area experiences the northward Yellow Sea Warm Current (YSWC), and the surrounding areas are encircled by southward coastal currents like Korean Coastal Current (KCC) and Lubei Coastal Current (LBCC) (Figure 1A). The confluence of northward warm subtropical water (YSWC) with southward cold coastal water (LBCC) around the Shandong Peninsula facilitates the generation of a remarkable curved front system, which is a combination of a strong thermal, salinity, and shear front (Riedlinger & Jacobs, 2000; Liu et al., 2015; Gao et al., 2016; Zang et al., 2017; Shi et al., 2019), and this front is usually regarded as a transport barrier for the propagation of coastal water to the offshore areas. As the distal deposition of the Yellow River materials, the formation and evolution of mud deposits around the Shandong Peninsula have attracted broad attention (Alexander et al., 1991; Liu et al., 2001; Liu et al., 2007; Yang and Liu, 2007; Wu et al., 2019), and the general view is that the barrier effect of this front system has played a very important role in it, especially in the formation of the Omega-shaped mud patch on the eastern coast of the Shandong Peninsula (Gao et al., 2016; Zang et al., 2017).
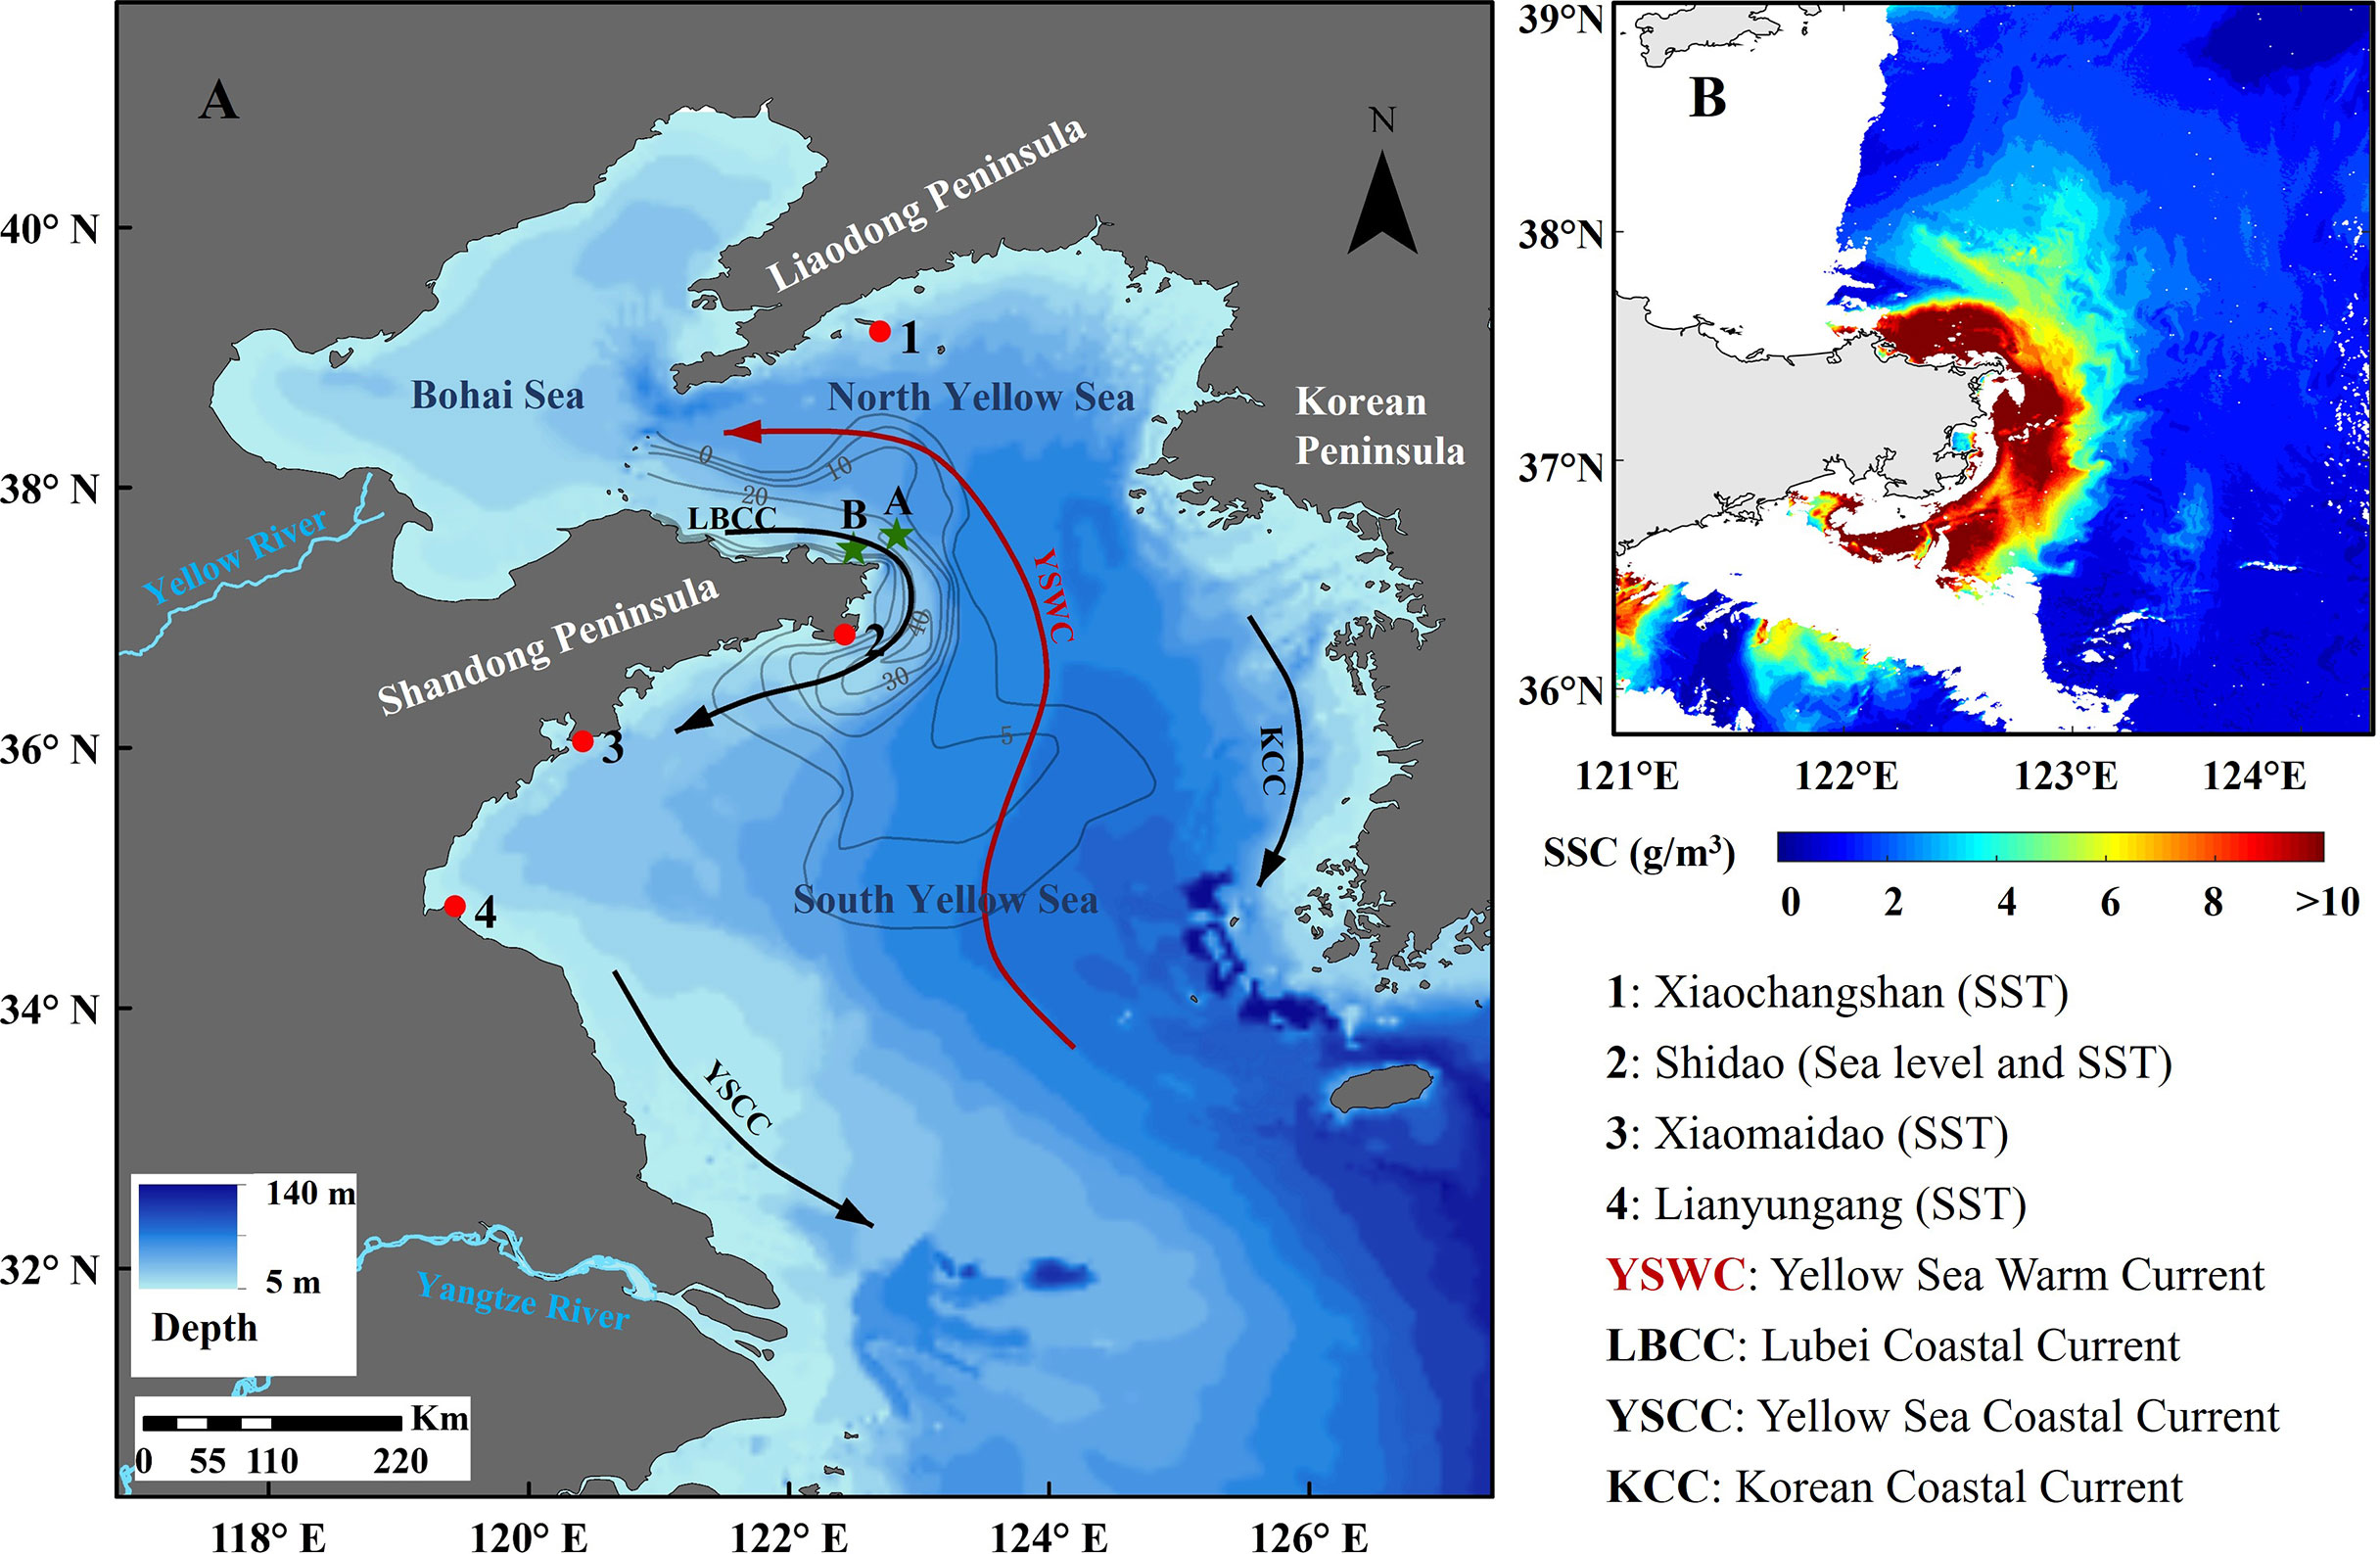
Figure 1 (A) Topography of Bohai Sea, North Yellow Sea and South Yellow Sea and locations of coastal observation stations (red dots, 1-4) and mooring stations (green stars, A, B). The grey lines indicate the isopach of mud deposits (unit: m, from Yang and Liu, 2007); (B) Cross-front sediment transport captured by remote sensing imagery (GOCI) on February 14, 2017.
However, according to some studies, this barrier is not persistent. In the northern part of the Shandong Peninsula, there is a mud deposit outside this front that bulge to the north, reaching a thickness of 10 m (Yang & Liu, 2007; Figure 1A). The geochemical analysis of sediments in this deposit shows that sediments derived from the Yellow River could penetrate the front (Shi et al., 2019). Cross-front transport of coastal sediments has also been captured by remote sensing imagery during winter storms (Shi et al., 2022; Figure 1B). These studies all indicate the existence of the front instability and cross-front transport. Recently Buckingham (2021) examined the effects of curvature on the frontal instabilities, including the inertial and symmetrical instabilities. However, the physical mechanism for front instability and cross-front transport still remains to be resolved. Exploring the relationship between ocean fronts and winter storms is essential for studying material transport patterns in coastal areas. In addition, the intensity and frequency of winter storms are changing significantly with global climate change, and the impact on cross-front transport deserves much more attention.
In this paper, we investigate the northward transport of coastal water across the frontal area during the winter storm period and diagnose the physical dynamic mechanisms of front instability and cross-front transport. Coastal fronts and shelf circulation are simulated using a numerical model, validated against in-situ observations. The study is of great significance for future studies on pollutant diffusion, nutrient distribution, and sediment transport in coastal areas.
2. Materials and methods
2.1 Field observations
We conducted a 2‐week (December 20, 2020 to January 2, 2021) hydrographic survey in the North Yellow Sea. During the observation, a surveying tripod at the seabed and a shipboard vertical profile were established simultaneously. The measurements were successively taken out at station A (46 m; December 20-22, 2020) and station B (24 m; December 25, 2020 to January 2, 2021) (Figure 1A). The settings of some used instruments are shown in Supplementary Table 1. The up-looking AD2CP (Nortek, Norway) and down-looking ADCP (Teledyne RD, USA) were used to record velocity profiles and the ADV (Nortek, Norway) was used to record one-point velocity variation. We also collected four coastal station observation data from the National Marine Data Center of China (http://mds.nmdis.org.cn/) including water level and sea surface temperature (SST). Locations and data types of these stations are marked as 1, 2, 3, and 4 in Figure 1A. All the data above were used to validate the numerical model.
2.2 Model setup and configurations
The Regional Ocean Modeling System (ROMS) is widely used to explore the coastal and regional ocean dynamics (Shchepetkin & McWilliams, 2005; Wandres et al., 2017; Wang et al., 2019; Astudillo et al., 2019; Wang et al., 2020). In this study, ROMS was used to simulate the characteristics and dynamics of shelf circulation in the study area. The model domain extended to cover the Bohai Sea and the Yellow Sea (including the North Yellow Sea and the South Yellow Sea), meridionally from 30°N to 42°N, zonally from 117°E to 128°E (Figure 1A). The horizontal resolution is around 3 km × 3 km with 20 layers in the vertical dimension in the terrain-following coordinate. The model bathymetry is interpolated from the 15 arc-second resolution topography data of the General Bathymetric Chart of the Oceans (GEBCO, https://www.gebco.net). The maximum depth is 138 m and the minimum depth is set to 5 m. The atmospheric forcing data are interpolated from the European Center for Medium-Range Weather Forecasts (ECMWF, https://www.ecmwf.int) ERA5 data with 0.25°×0.25° spatial resolution and 3-hr interval, including surface winds, mean sea-level pressure, air temperature, relative humidity, precipitation and net radiation (short wave and long wave). The surface forcing is calculated inside ROMS using the bulk flux formulae (Taylor and Yelland, 2001; Oost et al., 2002; Fairall et al., 2003). The initial conditions and two open boundary conditions (south and east every 12 hours) are from the HYCOM + NCODA Global 1/12° Analysis data (GLBy0.08/expt_93.0, https://www.hycom.org), including three‐dimensional temperature, salinity, and subtidal current fields. Eight principal tidal constituents (M2, S2, N2, K2, K1, O1, P1, and Q1) including sea surface tidal elevation and barotropic tidal currents derived from the TPXO9 tidal model (Egbert et al., 1994; Egbert & Erofeeva, 2002) are used as tidal forcing along the open boundaries. The model ran from December 2020 to January 2021, and the model results from December 20, 2020 to January 13, 2021 were analyzed.
3 Results
3.1 Observation results and model validation
To validate the model results, the hourly tidal sea level, vertically averaged current speed, and current direction from the model were compared with observed time-series data from coastal stations of the Yellow Sea and Bohai Seas. Model results were evaluated with the coefficient of determination (R2) and the root-mean-square error (RMSE). The model-generated time series results correspond well with observed data, which means the model appears to be reasonably reproducing the regional sea level and currents (Figure 2).
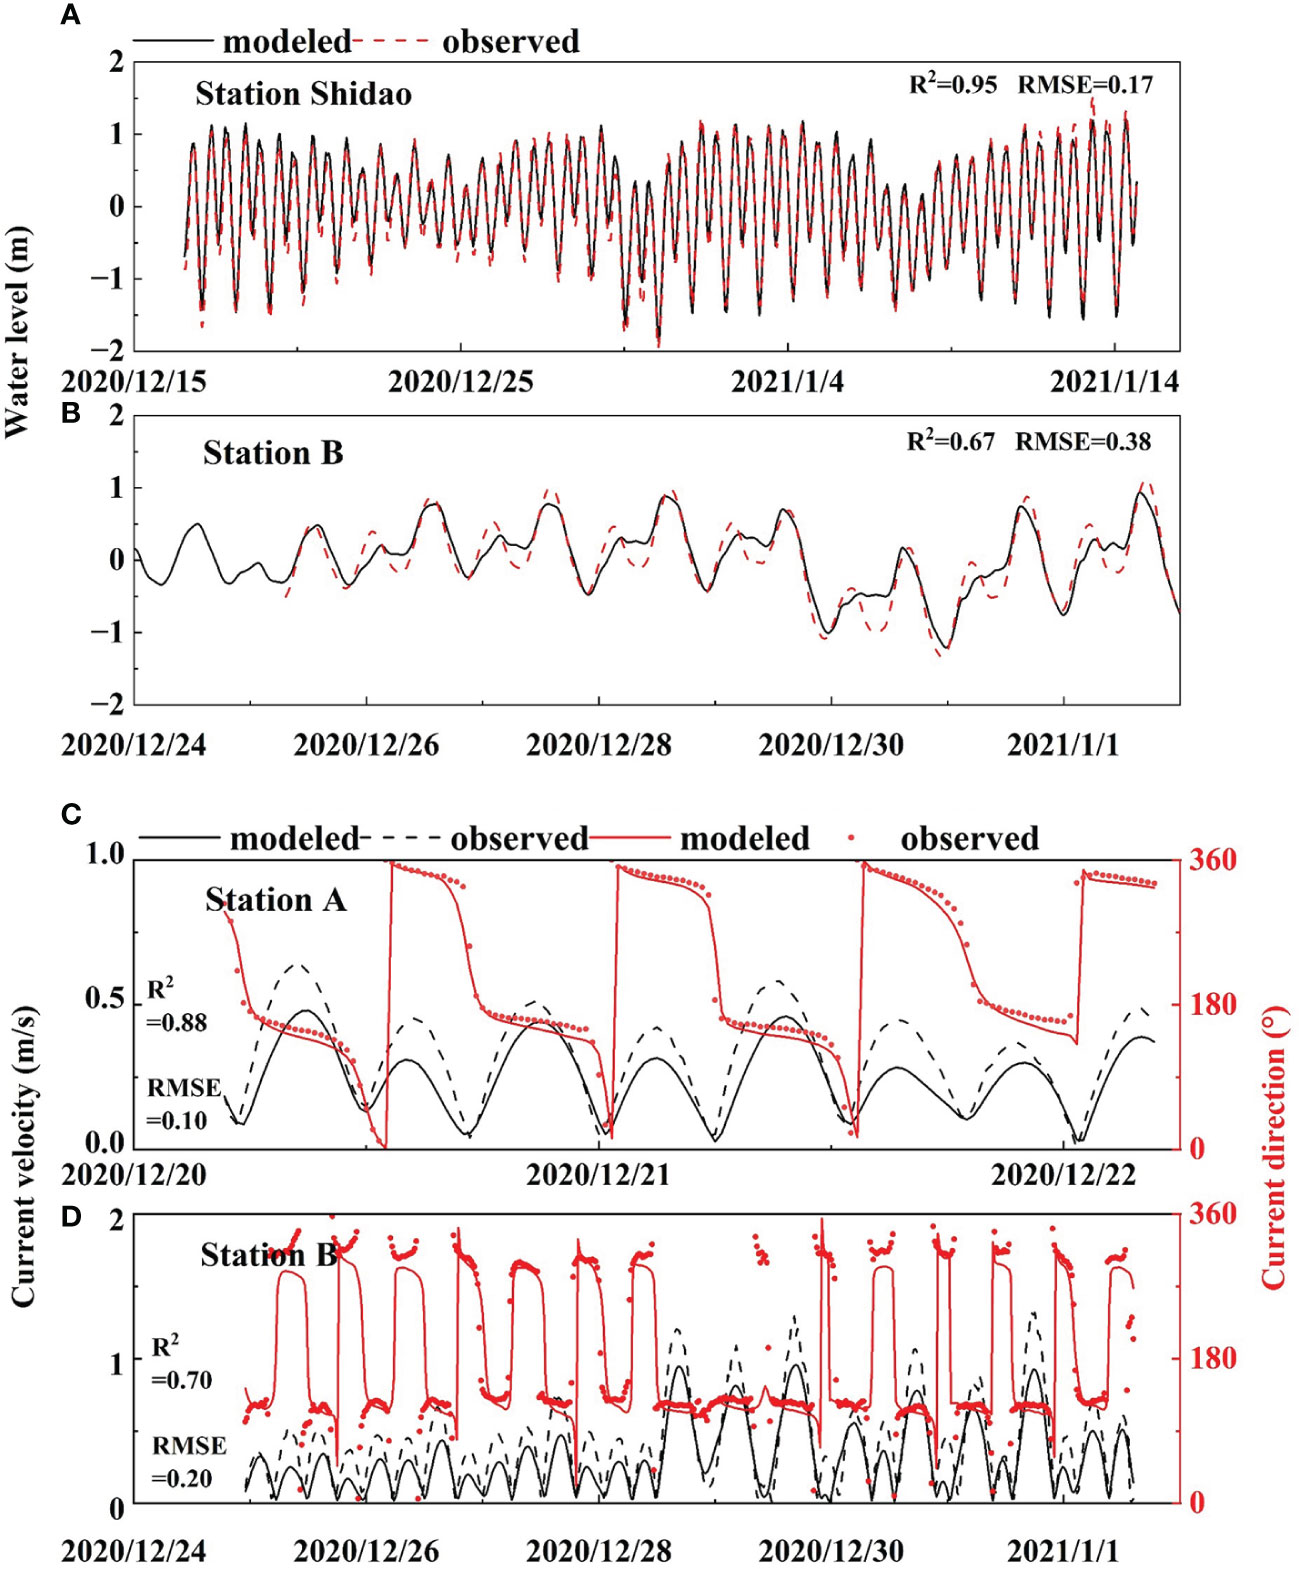
Figure 2 Comparisons of modeled and observed (A, B) tidal sea levels and (C, D) vertically averaged current speed, and current direction at the coastal stations in Figure 1A. The correlation coefficients (R2) and root mean square errors (RMSE) are also shown in the Figure.
As for sea surface temperature (SST), we used both satellite-derived data and observed time-series data to evaluate. The monthly mean model-simulated SST was validated by Moderate Resolution Imaging Spectroradiometer (MODIS) 4 km data in December 2020 (Figure 3). The satellite SST is distributed by the Asia-Pacific Data-Research Center of IPRC (APDRC; http://apdrc.soest.hawaii.edu/index.php). The simulated temperature fields generally match the observations well (Figure 3). The pattern of high SST in the central YS and low SST near the coastal region from the model results agree well with that of the satellite data during the two winter months. The northwestward intrusion of the warm tongue west of Cheju and the warm water intrusion into the Bohai Sea in the model-simulated SST are consistent with the satellite data. Also, the whole SST decreasing from December 2020 to January 2021 agreed well. The model is also compared with observations of SST in the coastal stations, and the model-generated time series results match the observed data well (Supplementary Figure S1).
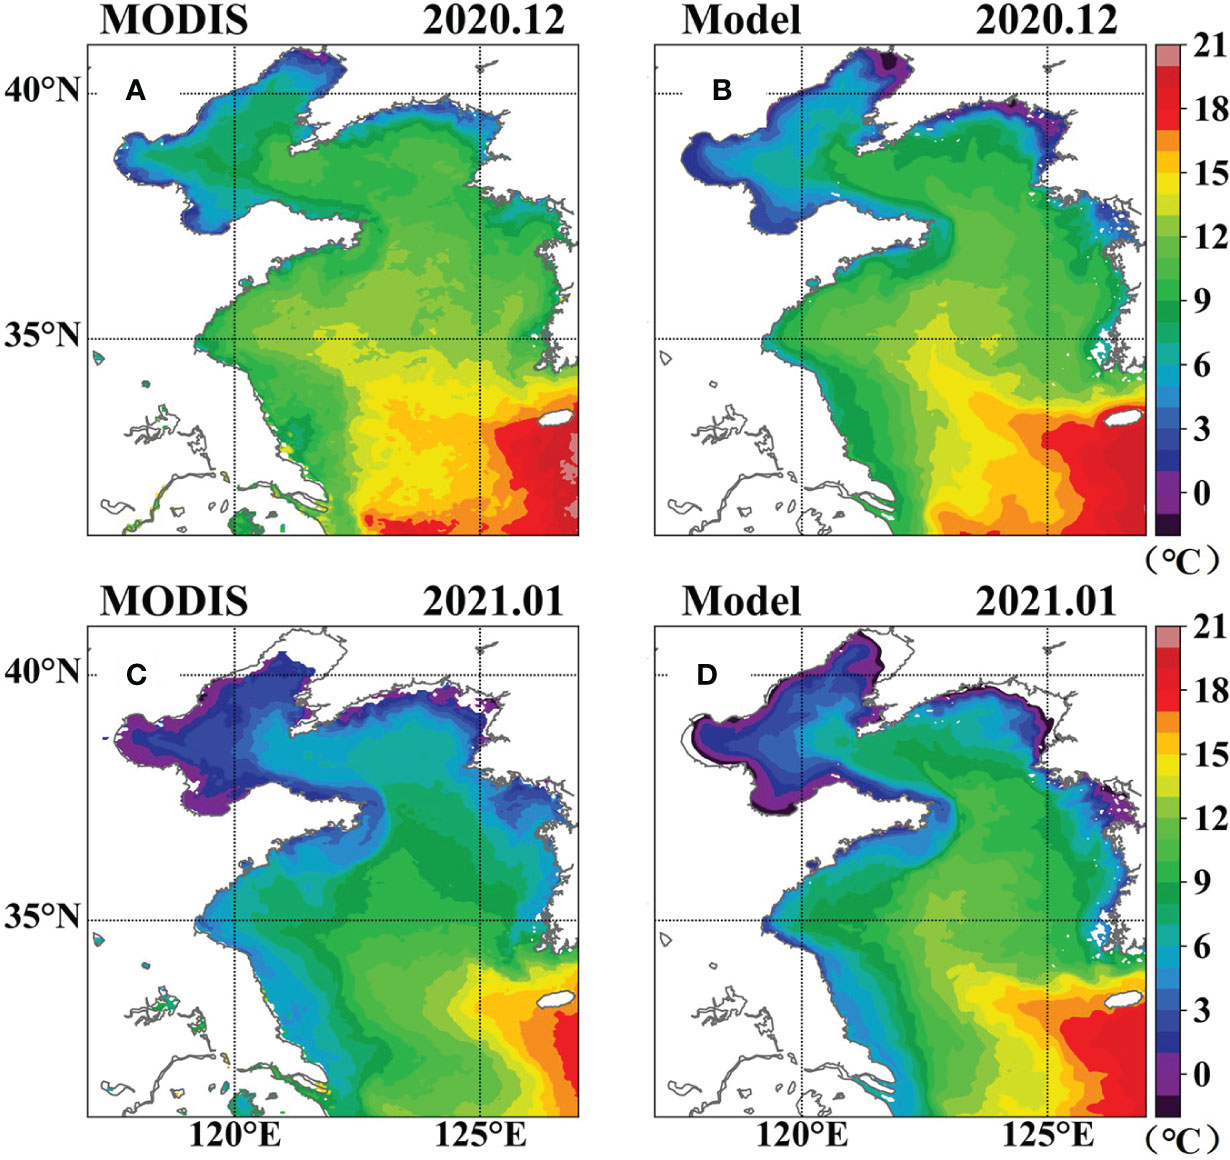
Figure 3 Comparison of satellite-observed (A, B, MODIS data) and model-calculated monthly mean SST (C, D) in December 2020 and January 2021.
3.2 Cross-front transport driven by the winter storm
Figure 4 shows the mean SST and vertically averaged velocity from December 20, 2020 to January 13, 2021, and the front around the Shandong Peninsula is obvious. Comparing the position of the front with the mud deposits, it is found that there are obvious mud deposits outside the front in the north and southeast of the Shandong Peninsula, with a thickness of 5 meters or even more than 10 meters.
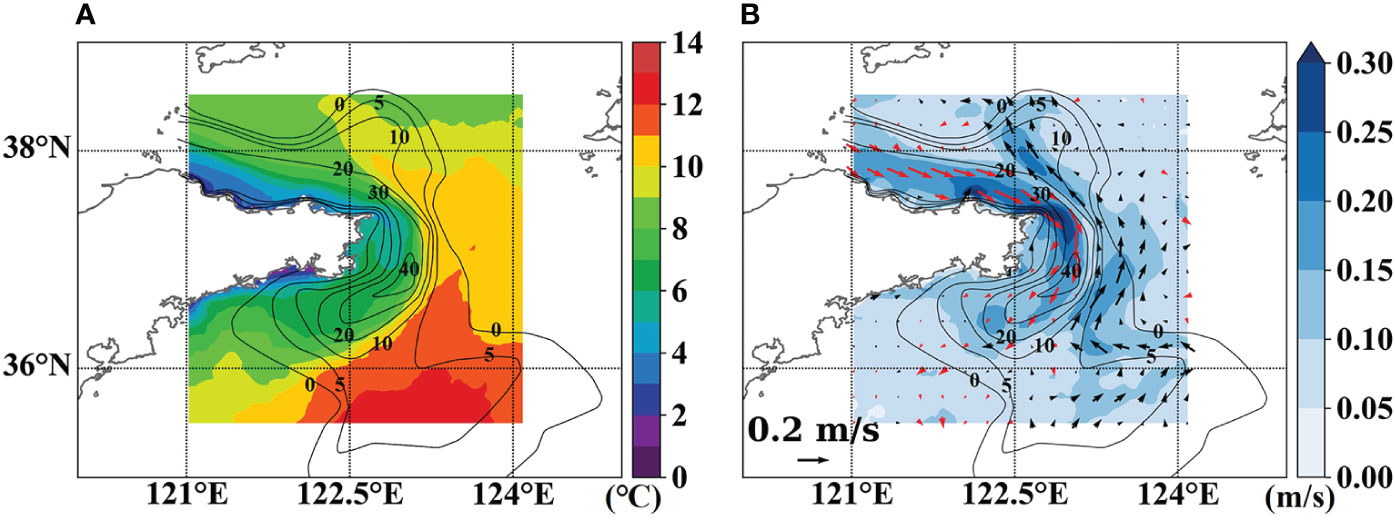
Figure 4 (A) Mean SST and (B) vertically averaged velocity (black arrows indicate northward currents and red arrows indicate southward currents). The black lines indicate the isopach of mud deposits (unit: m, from Yang and Liu, 2007).
3.2.1 A case study of the winter storm event during December 2020
The winter storm event from December 28, 2020 to January 1, 2021 was selected for a case study, which was observed in station B (Figure 1A). During this period, there was a strong wind and a rapid drop in temperature (Figure 5). The winter storm lasted for around 4 days and the maximum wind speed reached 16 m/s. According to the on-site observation, the water level in the study area decreased by about 1 m and the current velocity increased significantly during this period (Figure 2). Model results are used to further reveal the effect of winter storms on cross-front transport.
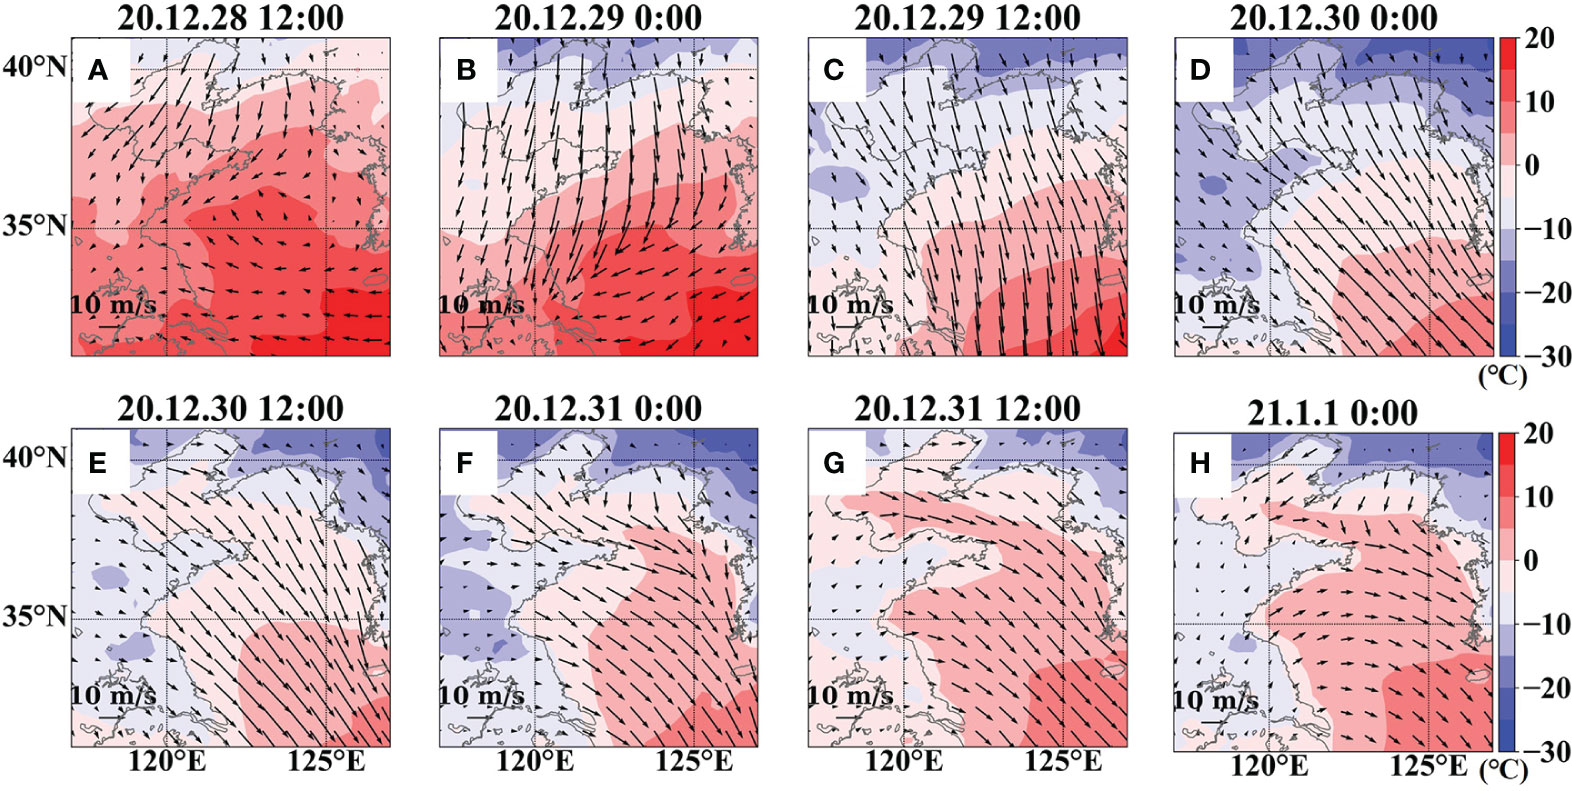
Figure 5 Snapshots of surface wind and 2 m air temperature used in the model in the Bohai Sea and Yellow Sea at 12-hourly intervals during the winter storm event in December 2020.
Figure 5 shows the surface wind and 2 m air temperature from ECMWF data used in the model during this time. The 12-hourly snapshots indicate that the storm over the Yellow Sea first enhanced gradually and then weakened slightly. Strong winds began in the Bohai Sea and North Yellow Sea (Figures 5A, B) and gradually covered the South Yellow Sea (Figures 5B, C). The wind direction gradually changed from northerly to northwesterly (Figures 5B–F), and finally even changed to westerly in the Bohai Sea and North Yellow Sea (Figures 5F, G).
Figure 6 shows the subtidal depth averaged currents in the study area. At the beginning of the winter storm, the currents were relatively weak (Figures 5A, 6A). With the northerly wind becoming stronger from 00:00 on December 29 to 00:00 on December 30, the currents primarily flowed southward and eastward and the nearshore current velocity is much greater than the offshore current velocity (Figures 5B–D, 6B–D). At 12:00 on December 30, the nearshore current still totally flowed southward and eastward and reached its maximum, and the offshore current began to flow northward and westward (Figure 6E). From 12:00 on December 30, the offshore current strengthened significantly, and the nearshore current weakened gradually (Figures 6E–G). At the end of the storm, the currents returned to the averaged situation (Figures 5H, 6H).
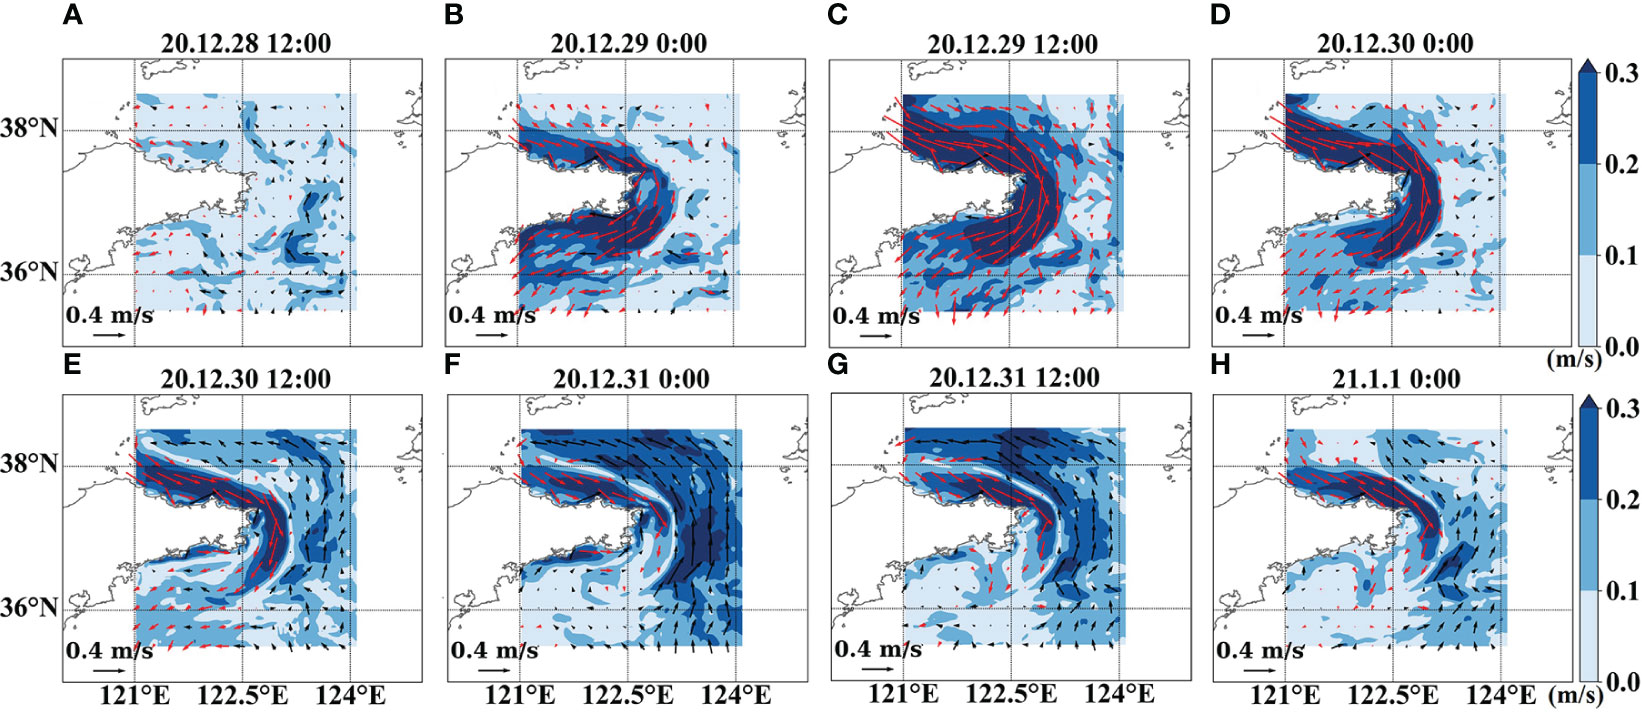
Figure 6 Evolution of subtidal depth averaged currents during a winter storm event in December 2020. Black arrows indicate northward currents and red arrows indicate southward currents.
3.2.2 Cross-front transport during the winter storm
How cross-front transport occurs during winter storms is our concern. Lagrangian floats trajectories are often used to track water mass movements. In order to observe the process of water transport across the front, we released 256 Lagrangian floats at 00:00 on December 20 in the upper layer (1 m from the surface) and the lower layer (20 m from the surface) inside the front of the northern Shandong Peninsula (Figure 7). The floats’ motion state was recorded until January 13, 2021. In order to track the coastal water which was able to cross the front and move offshore, we extracted and highlighted the trajectories of the floats that cross the front. We plotted the motion trajectories of all the floats (Figure 7A) and found that 61 of them (surface layer 32, middle layer 29) moved across the front (Figure 7B). The cross-front positions are mainly located in the northeastern Shandong Peninsula, and a few floats in the upper layer transport across the front in the southeastern Shandong Peninsula (Figure 7B).
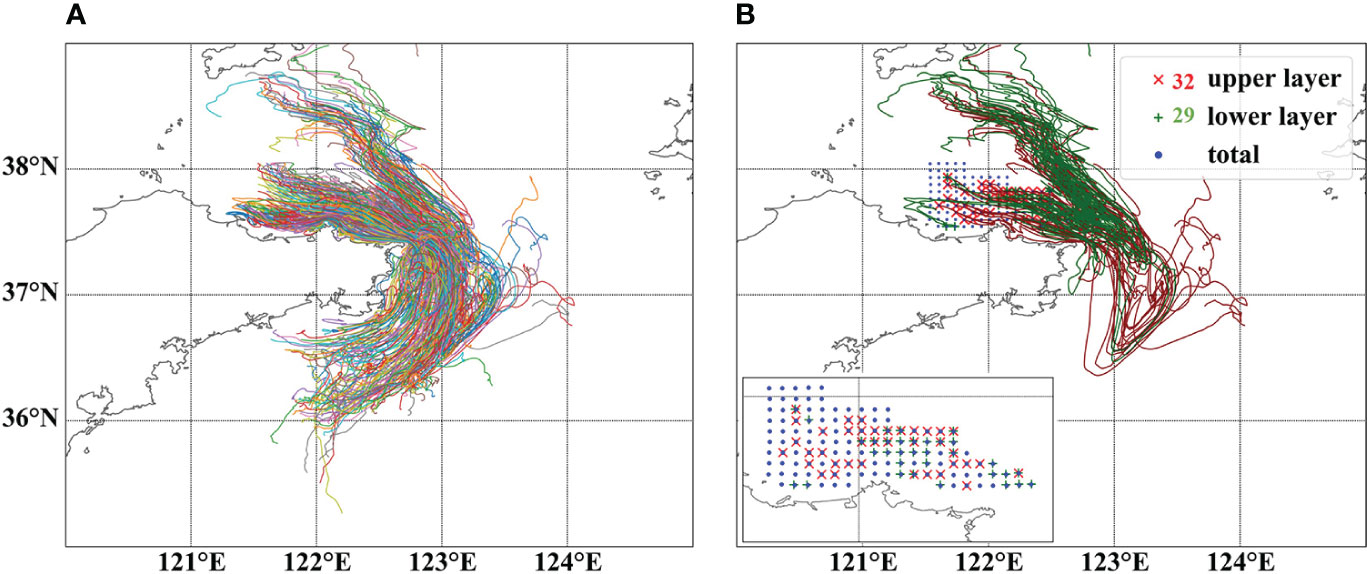
Figure 7 Motion trajectories of (A) all the Lagrangian floats and (B) cross-front floats from December 20, 2020 to January 13, 2021. Blue dots indicate the initial positions of all the Lagrangian floats. Red × and green + separately indicate cross-front floats in the upper layer and lower layer.
In order to study the timing of cross-front, we selected two representative floats separately in the upper and lower layer showing the cross-front transport. It can be seen from the Figure 7 that if a float crosses the front, the movement will show a change of longitude and latitude as: the longitude changes from increasing to decreasing, and the latitude changes from decreasing to increasing, that is to say, the deflection position of the latitude and longitude is the position that the cross-front occurs. According to this feature, we projected the float coordinates onto the time axis, so as to determine the time when the float crosses the front, which was about at 0:00 on December 30, 2020 (Figure 8A). According to the wind speed sequence diagram, we found that the float crossed the front in the middle stage of the storm event (Figure 8B) when the LBCC almost reached its maximum (Figures 8C–E).
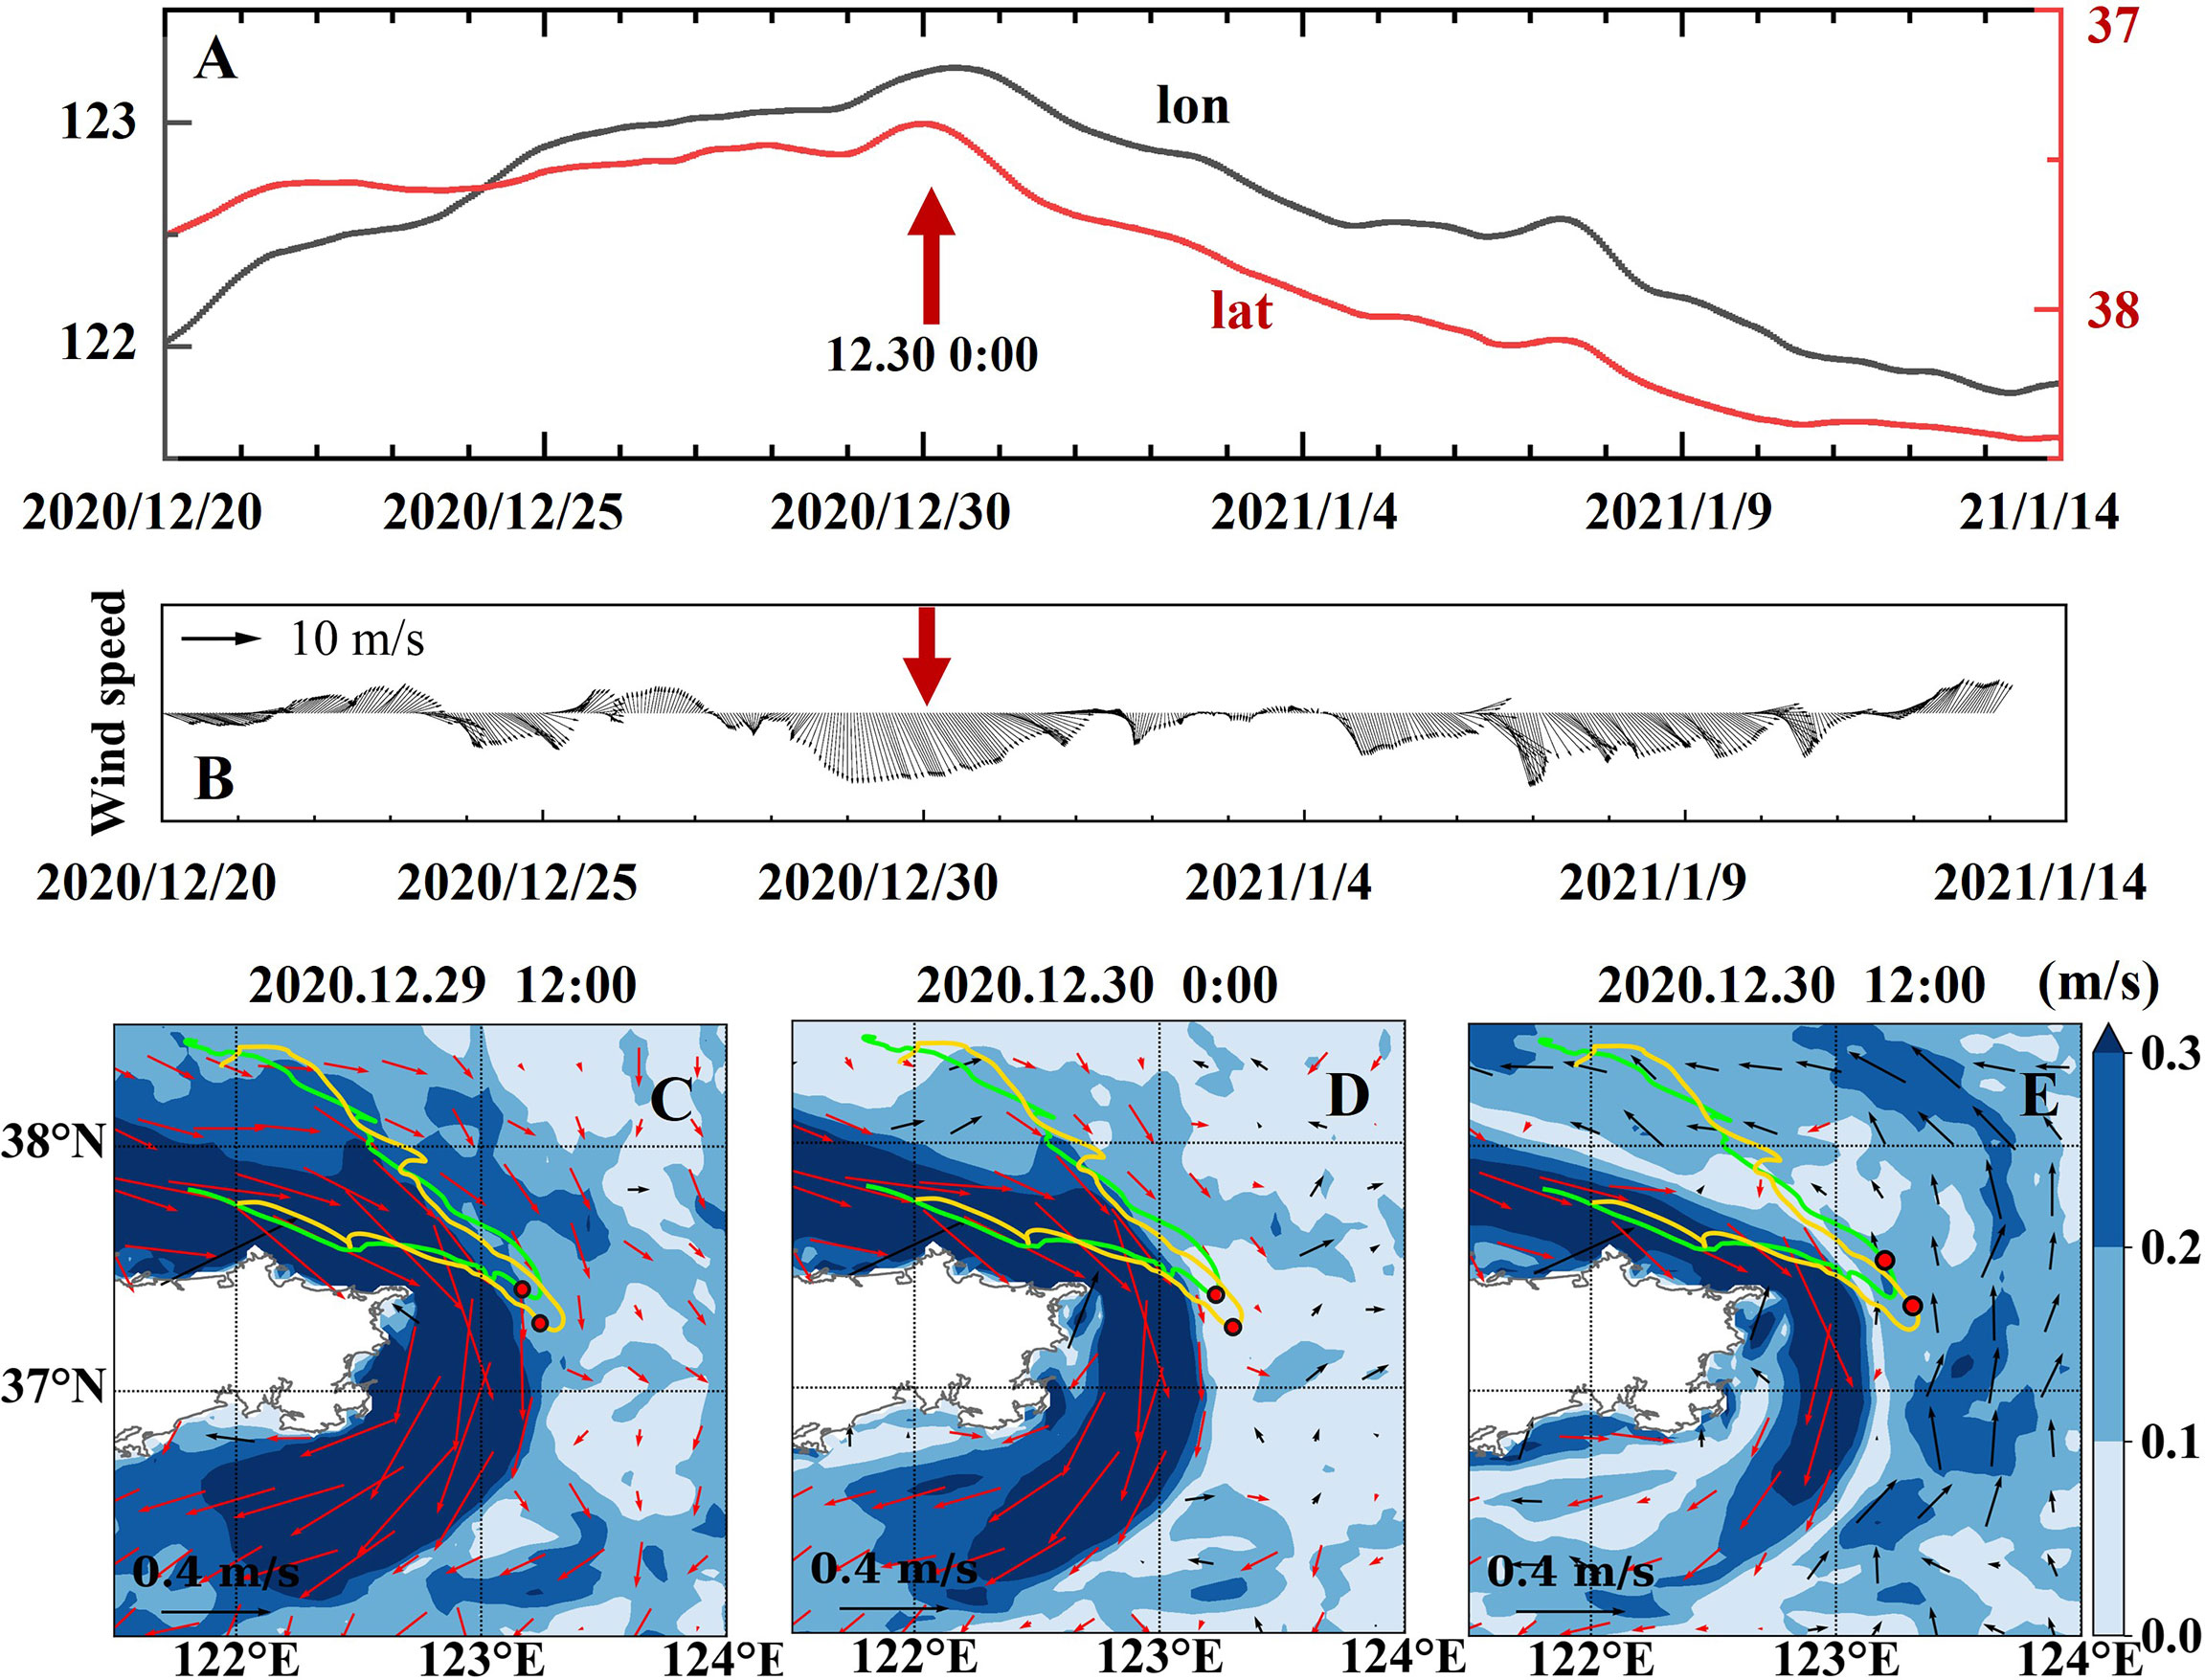
Figure 8 Typical floats across the front in the upper and lower layer with the time and position of cross-front transport. (A) The change of longitude and latitude of one typical float. (B) The wind vectors from December 20, 2020 to January 14, 2021 at Chengshantou Station, located at the northeastern tip of the Shandong Peninsula. The red arrow is the deflection position of the latitude and longitude which indicates the time of cross-front transport. (C–E) Time and position of cross-front transport. The yellow line and green line separately indicate the trajectories of the floats in the upper layer and lower layer, and the red points indicate the position of the floats at every moment.
4 Discussion
4.1 Possible mechanisms of the cross-front transport
4.1.1 Ocean currents evolution
The front around the Shandong Peninsula is associated with the convergence of the LBCC and YSWC. Therefore, the frontal evolution can be affected by the strength changes of these two currents. The LBCC is a kind of wind-driven current in the coastal area, which is directly affected by the wind (Zheng et al., 2021), while the YSWC is mainly determined by the interactions between the East Asian Winter Monsoon and the Kuroshio Current (Song et al., 2009; Xu et al., 2009). Forced by the winter monsoon, the YSWC serves as a compensation current that lasts for several days (Teague and Jacobs, 2000).
Figures 9, 10 show the evolution of model-simulated subtidal sea level elevation and subtidal currents at surface and 50 m depth separately, from which we can see the relative change of the LBCC and the YSWC. The subtidal surface current was selected to represent the LBCC and the subtidal current at 50 m depth was selected to represent the YSWC (Ding et al., 2018). During the entire storm, the LBCC increased rapidly with the increase in wind speed (Figures 9A–C), and reached its maximum velocity in the middle stage of the winter storm (Figure 9C), then weakened gradually (Figures 9C–G). However, the YSWC showed a weakening trend rapidly (Figures 10A–C), then increased significantly (Figures 10D, E), and then weakened gradually (Figures 10F–H). This change in the YSWC has a great relationship with the wind and the sea-level related pressure gradient. In detail, in the early stage of the winter storm, the water was transported from the Northern Yellow Sea to the Southern Yellow Sea driven by the northwesterly wind, which decreased the northward YSWC significantly (Figures 10A–C). Then the northward barotropic pressure gradient increased with the water accumulating in the Southern Yellow Sea, which forced the seawater to move northward. The high sea level elevation signal propagated northward along the Korean coast, which built up a westward sea-level related pressure gradient and then strengthened the YSWC due to geostrophic adjustment in the late stage of the winter storm (Figures 10D–F, Ding et al., 2018; Wu et al., 2019). At last, as the westward and northward barotropic pressure gradient diminished, the YSWC tended to weaken gradually (Figure 10G, H).
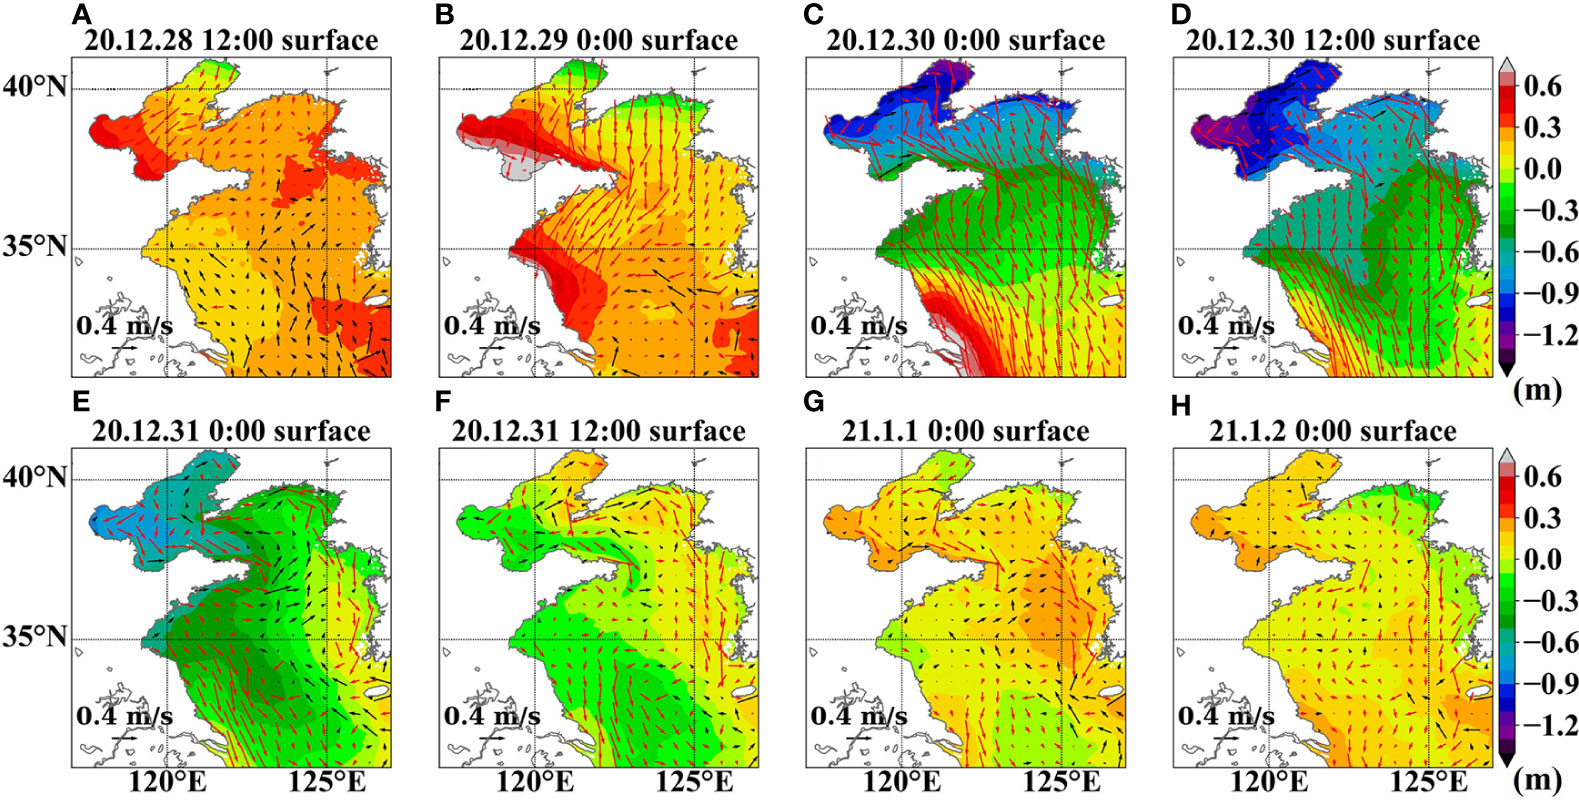
Figure 9 Evolution of model-simulated subtidal sea level elevation and subtidal surface currents during the winter storm event in December 2020. Black arrows indicate northward currents and red arrows indicate southward currents.
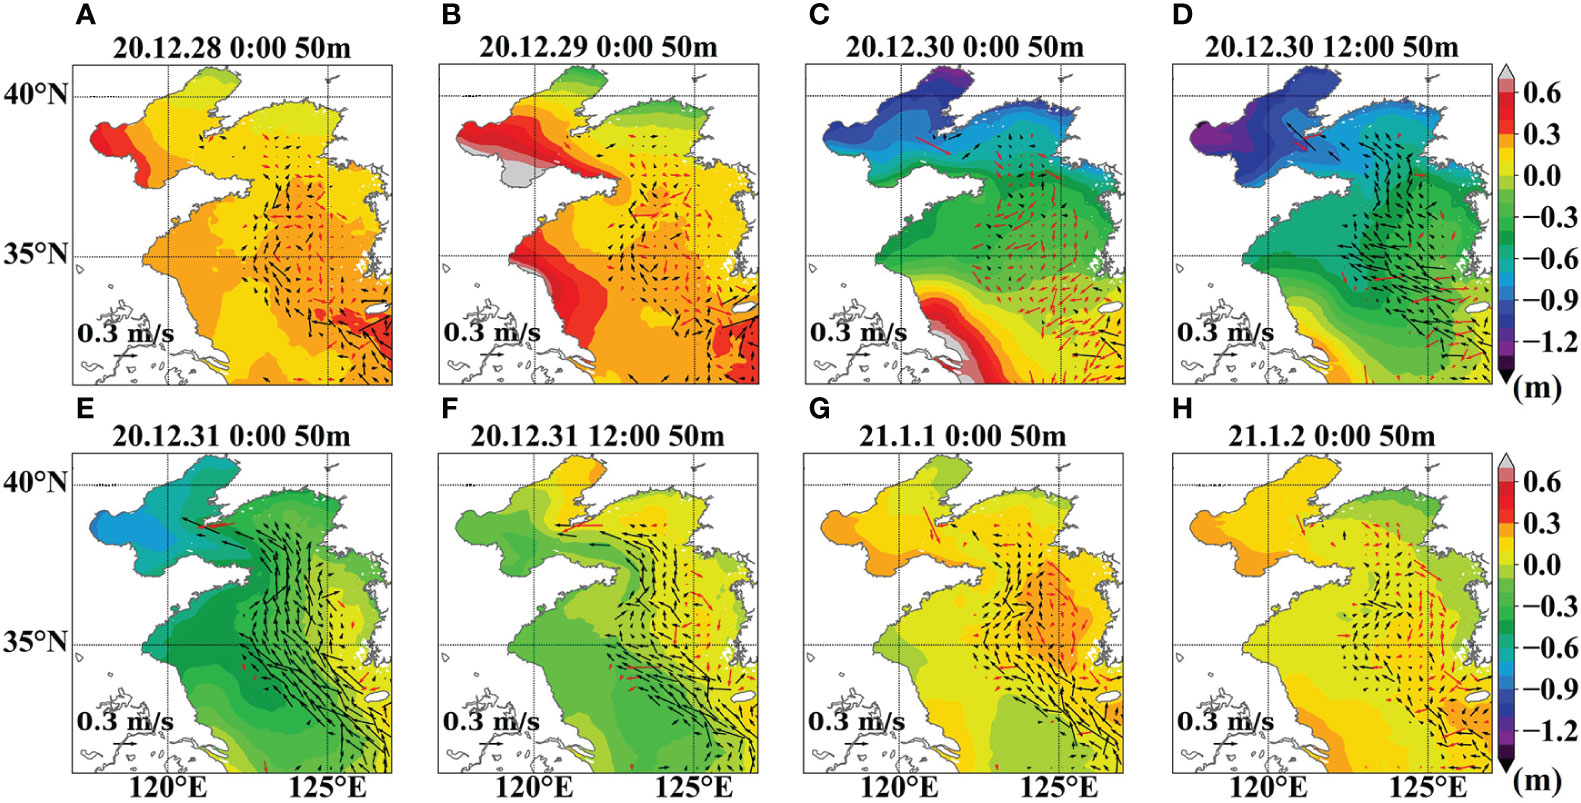
Figure 10 Evolution of model-simulated subtidal sea level elevation and subtidal currents at 50 m depth during the winter storm event in December 2020. Black arrows indicate northward currents and red ones indicate southward currents.
From the above analysis, we can see that it is because of the inconsistency in the changes of the LBCC and the YCWC during the winter storm that the front changes, and then the phenomenon of cross-front transport occurs. The LBCC strengthened first and then weakened, while the YSWC weakened first and then strengthened. Associated with the strengthening LBCC, the southward along-front flow becomes stronger and transported the material inside the front downstream (southward). Then the strengthening front becomes unstable (i.e., frontal instability), allowing cross-front material transport to occur. As the material crosses the front, the strengthening YSWS brought the material northward.
4.1.2 The front instability due to the winter storm
Figures 7, 8 show that floats move across the front in the middle stage of the storm event in the northeastern and southeastern Shandong Peninsula, which means at that moment the front instability occurred. From the above analysis, the strengthening of the LBCC is the key step of ‘cross’. Will the significantly increased LBCC result in the front instability during the winter storm?
Buckingham (2021) has examined the role of curvature in modifying frontal instabilities, pointed out the potentially unstable regions for curved fronts in cyclogeostrophic or gradient wind balance (Figure 11C), and also given a criterion for instability. The nondimensional form of the criterion is given by Eq. (1). L′ is a non-dimensional form of absolute angular momentum (Eq. (2)) and q′ is a nondimensional form of Ertel PV (Eq. (3)). The product of L′ and q′ must be positive for stability within an inviscid front but if either of these quantities is negative, instability will result (Buckingham et al., 2021).
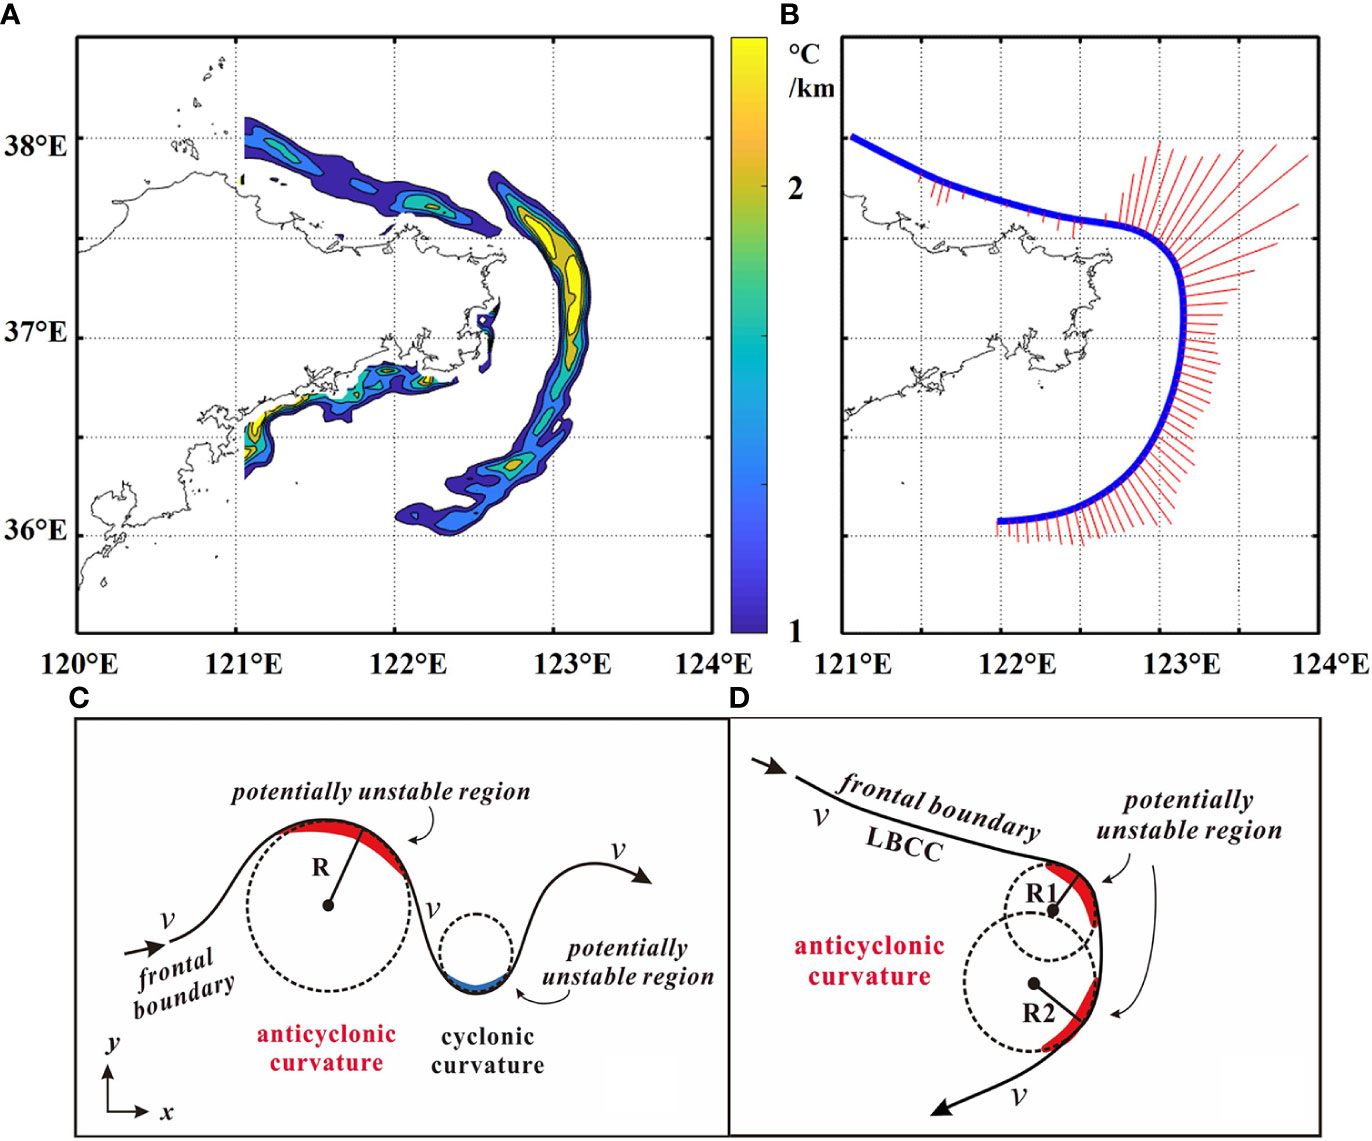
Figure 11 (A) The position of the curved front. (B) Curvature (Red lines) along a typical front (Blue line). (C) Illustration of mean flowand the radius of curvature R of a meandering front in the Northern Hemisphere (f >0), as well as potentially unstable regions of this front, where x and y correspond to along-front and cross-front displacements (Modified from Buckingham et al., 2021). (D) Illustration of mean flow, the radius of curvature R and the potentially unstable regions with the front around the Shandong Peninsula.
Cu is defined as the curvature number which is a signed quantity and can be described as cyclonic (Cu>0) or anticyclonic (Cu<0) (Eq. (4)). R is the radius and the curvature is actually 1/R, andis the mean along-front components of the flow. R0 is the gradient Rossby number (Eq. (5)), and Ri is the gradient Richardson number (Eq. (6)).
Here we applied the above theory to examine the instability of the curved front around the Shandong Peninsula. In this area, LBCC is a kind of wind-driven current, restricted by the shoreline and topography of the Shandong Peninsula. Under the influence of the strong northerly wind, seawater accumulates along the north coast of the Shandong Peninsula, forming a northward barotropic pressure gradient (Zheng et al., 2021). The LBCC flows eastwards parallel to the north coast of the Shandong Peninsula. When it flows to the northeastern tip of the Shandong Peninsula, it turns to the south, and then it turns to the southwest because of the southeastern tip of the Shandong peninsula, which facilitates the generation of a remarkable curved front system (Figure 11A). LBCC flows along the front in the inner part, and we take its velocity as the mean flow , which is anticyclonic. According to the position of the curved front, we extracted a typical front and calculated the curvature along the front, from which we found the positions with the largest curvature in the northeastern tip of the Shandong Peninsula and a relatively large curvature in the southeastern tip of the Shandong Peninsula (Figure 11B). Buckingham (2021) has pointed out the potentially unstable region for curved fronts where the curvature is large (Figure 11C), and we did a circular fit and made a similar illustration of the potentially unstable regions around the Shandong Peninsula (Figure 11D).
In order to verify if the front instability occurs in these potentially unstable regions, we calculated relevant parameters using the current velocity at 00:00 on December 30, when the LBCC almost reached its maximum (Eq. (1-6), Figure 12). We found that at that moment L′ was mostly positive except in the northeastern Shandong Peninsula (Figure 12A) and q′ was always positive (Figure 12B), which meant the inertial instability occurred in the northeastern Shandong Peninsula (Figure 12C). This result was consistent with the analysis above (Figure 11D) and simulation results (Figure 7), but there was another potentially unstable region in the southeastern Shandong Peninsula. We calculated the critical current velocity that caused frontal instability around the Shandong Peninsula. In this case, for the curvature in the northeastern Shandong Peninsula, a velocity larger than 0.91 m/s could result in frontal inertial instability. But because of the smaller curvature (larger radius) (Figure 11B), only a velocity larger than 2.34 m/s could result in front instability in the southeastern Shandong Peninsula. Since current velocity here is an important factor of the front instability, winter storm intensity which influences the LBCC may affect the front instability around the Shandong Peninsula.
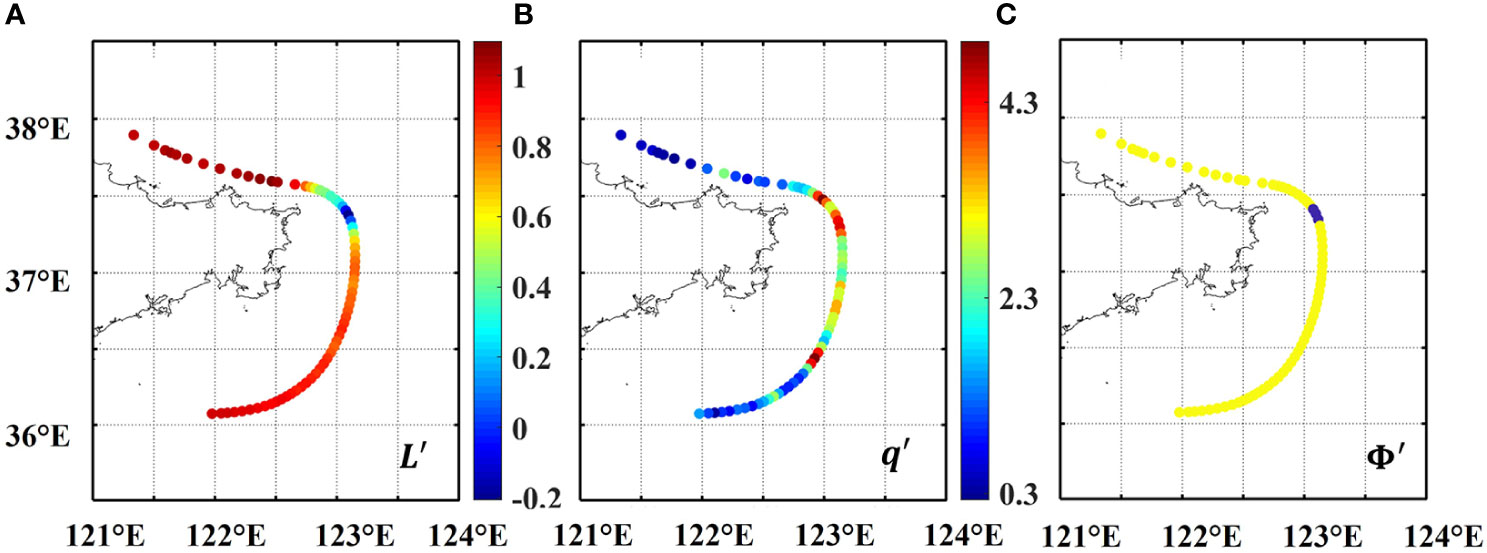
Figure 12 Calculation of (A)L′ (B)q′ (C)Φ′ (dark blue indicates negative Φ′ and yellow indicates positive Φ′).
4.2 Influence of winter storm intensity and direction on cross-front transport
4.2.1 Numerical experiments of winter storm intensity and direction
There is currently no clear and uniform standard for winter storms. In this paper, a storm event refers to the minimum wind speed of 8 m/s for more than 80% of the duration. The characteristics of winter storms (wind speed, duration, and direction) from 1978 to 2022 in this area are summarized in Supplementary Figure S2. According to statistics, during 45 years in the area, there were 1159 winter storms, and northwesterly/northerly winds accounted for 80%. The duration of single winter storm varied from 1 to 13 days, and the average wind speed varied from 6 to 19 m/s (Supplementary Figure S2A). The sum of days in which winter storms occur in the 120-day period is about 40 days, accounting for 1/3 of the total duration.
Based on the statistical results, we chose the typical storm intensities (wind speed and duration) and wind directions to conduct numerical experiments (Table 1). Through 10 sets of experiments, the wind speed, duration, and direction of winter storms were changed to discuss the influence of each element on cross-front transport. In these experiments, 256 Lagrangian floats (128 in the upper layer and 128 in the lower layer) were released at the same time when each experimental winter storm started and we took 10-day motion trajectories for analysis. The floats across the front can qualitatively represent the strength of the cross-front transport and indicate the transport distance and path.
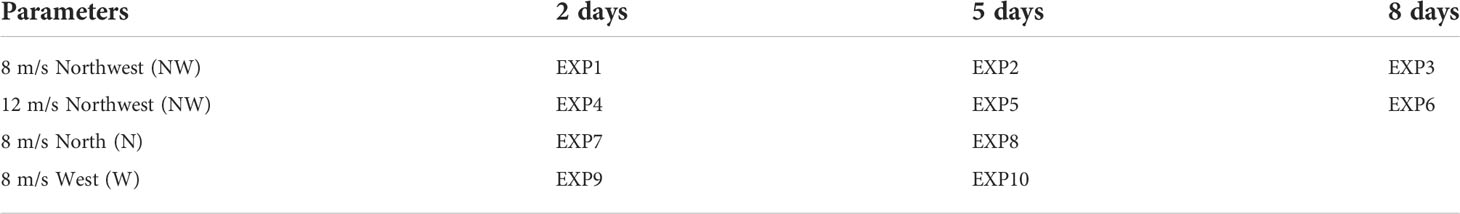
Table 1 Experimental Settings of the winter storms.
4.2.2 The effects of winter storms on cross-front transport
We plotted the motion trajectories of the cross-front floats (Figures 13, 14), and the basic characteristics of cross-front transport could be summarized as follows. Cross-front transport occurs in both the upper and lower layers of the water body near the front. The intensity of a winter storm has a significant effect on the amount and distance of materials transported across the front. The winter storm, with longer duration (Figures 13A–C, 13D–F), greater wind speed (Figures 13A, D, 3B, E, 13C, F), and westward wind direction (Figures 14A–C, 14D–F), tends to trigger stronger cross-front transport and longer transport distance. At the same time, the intensity of the storm also affects the transport path. The cross-front transport path influenced by a weaker winter storm with a small winter speed and a short duration, prefers northward along the meridional line 122.5°E (Figures 13A, B, D, 14). As the storm intensity increases, the transport path gradually becomes northwestward (Figures 13C, E, F). Furthermore, the cross-front positions are mainly located in the northeastern Shandong Peninsula, but when the storm intensity is strong enough, some water could move across the front in the southeastern Shandong Peninsula in the upper layer (Figures 14E, F).
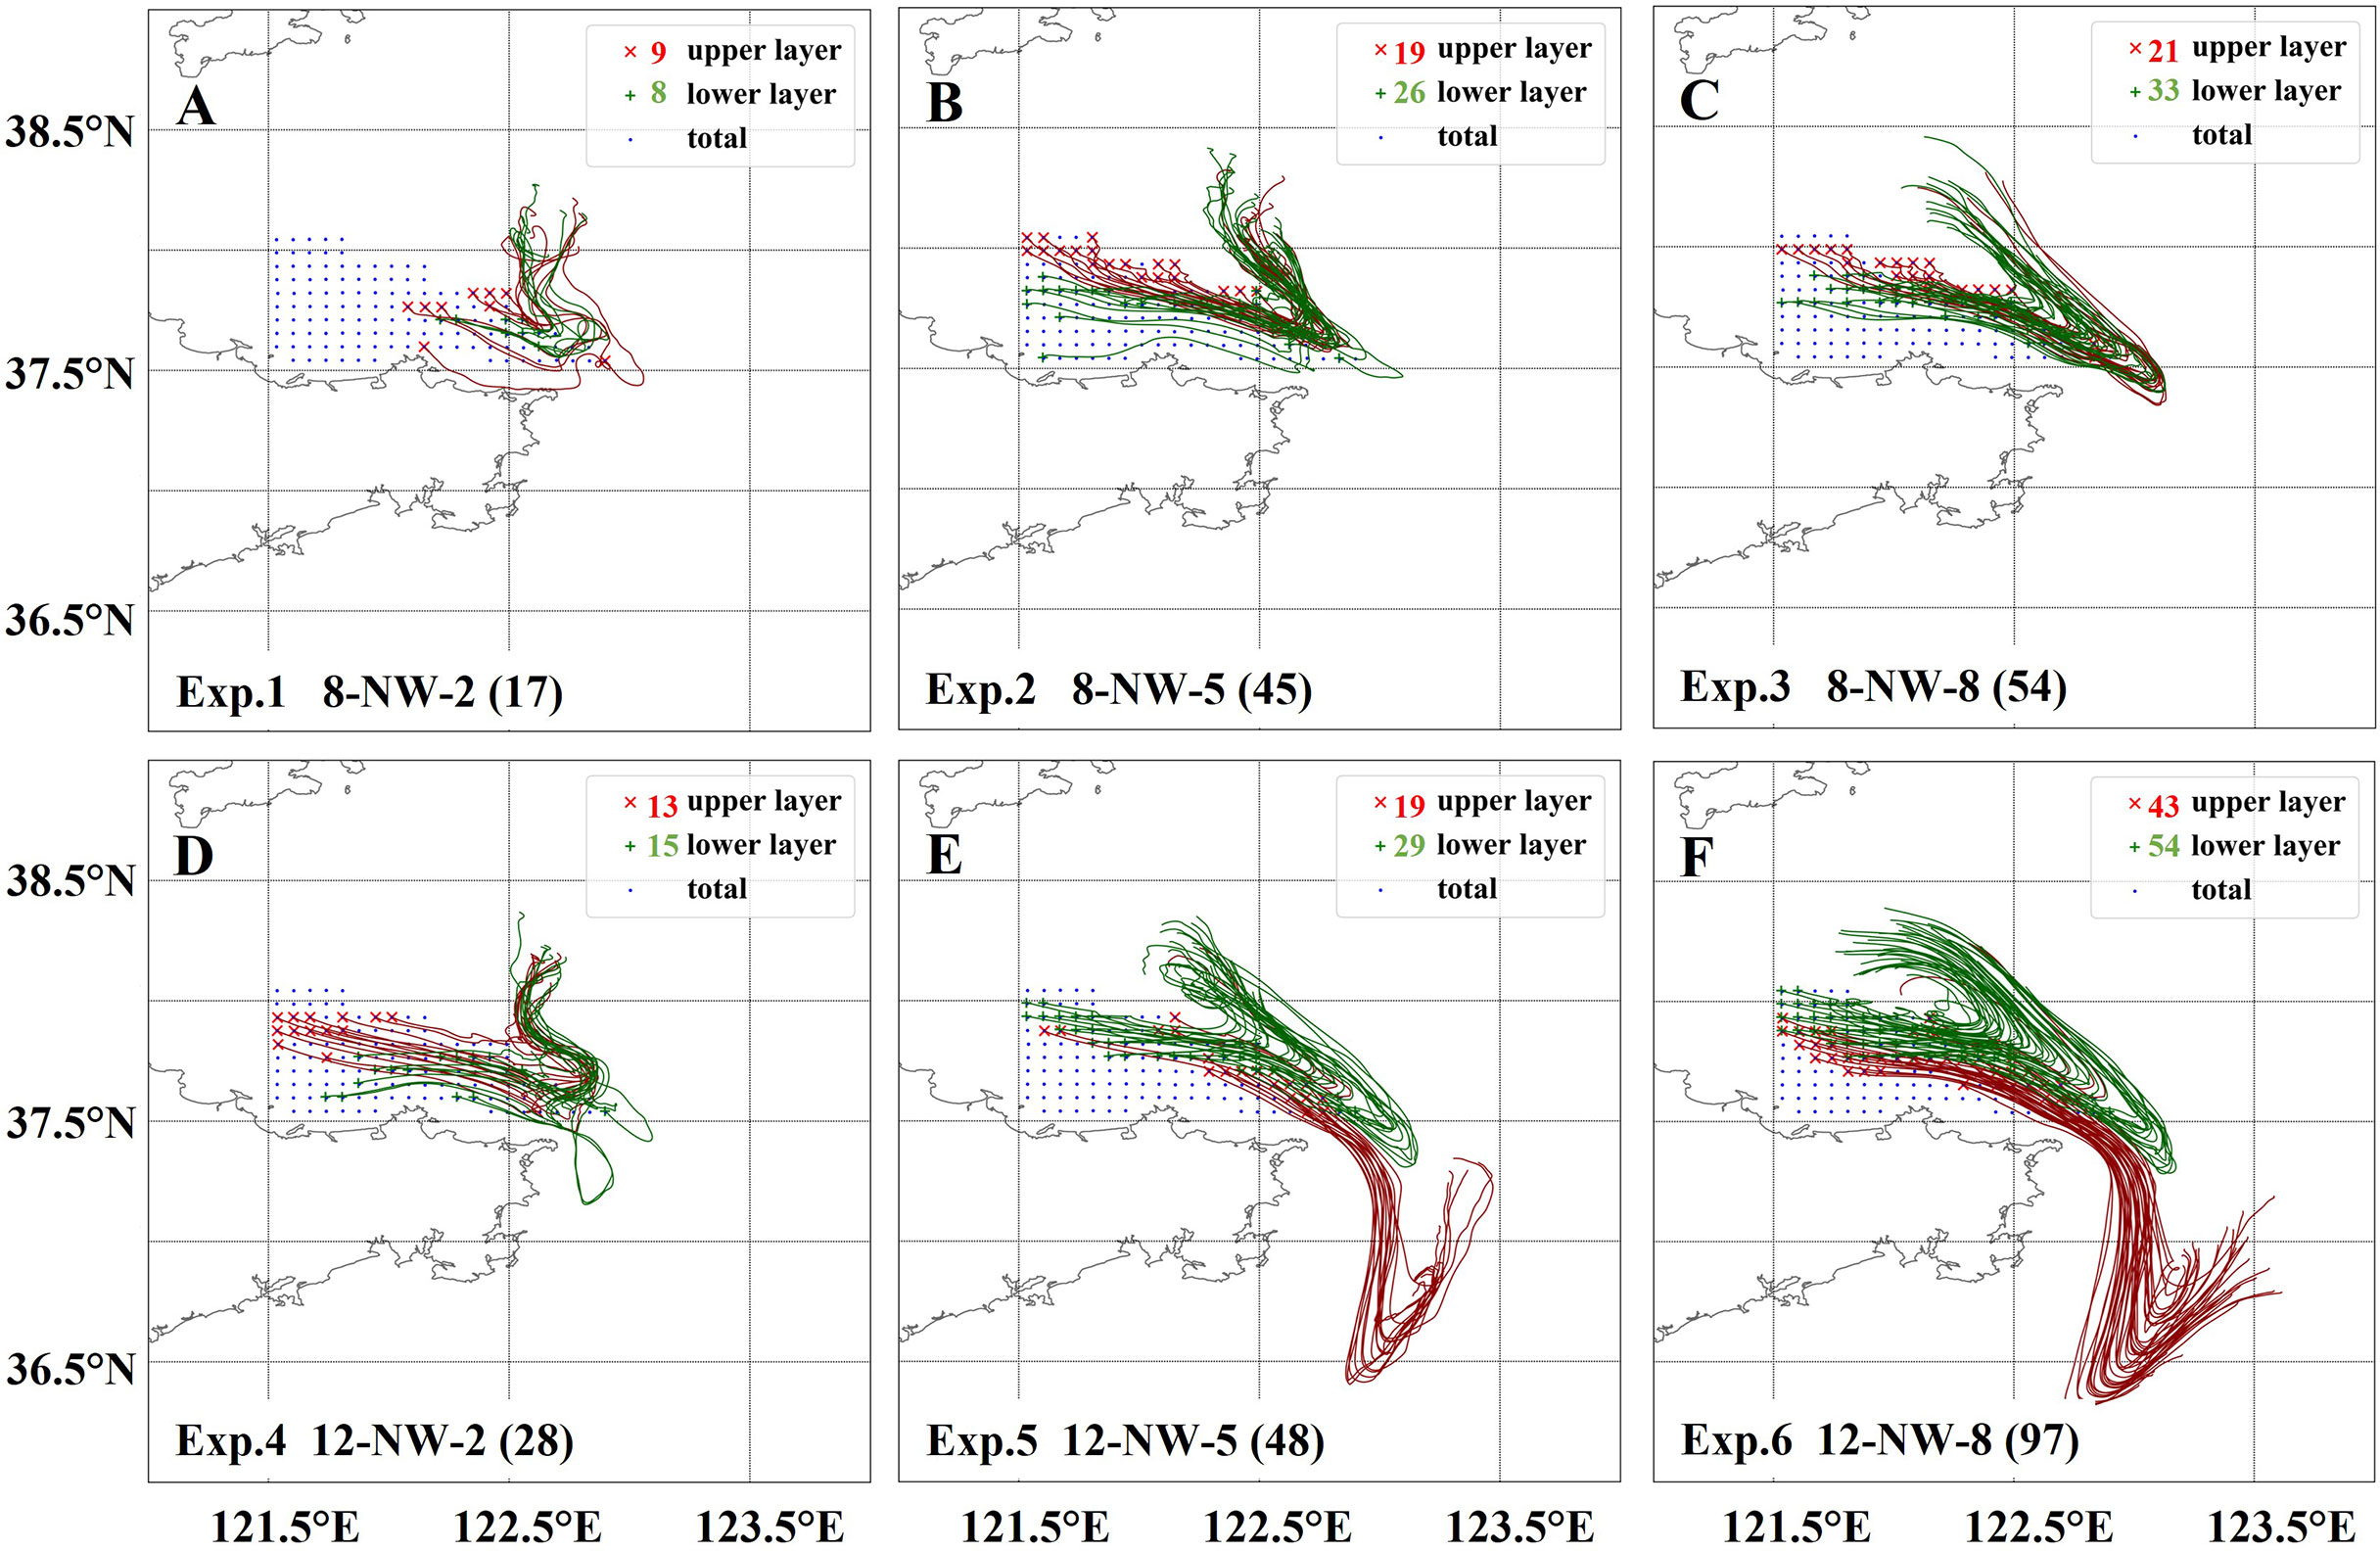
Figure 13 Effects of wind speed and duration on cross-front transport.
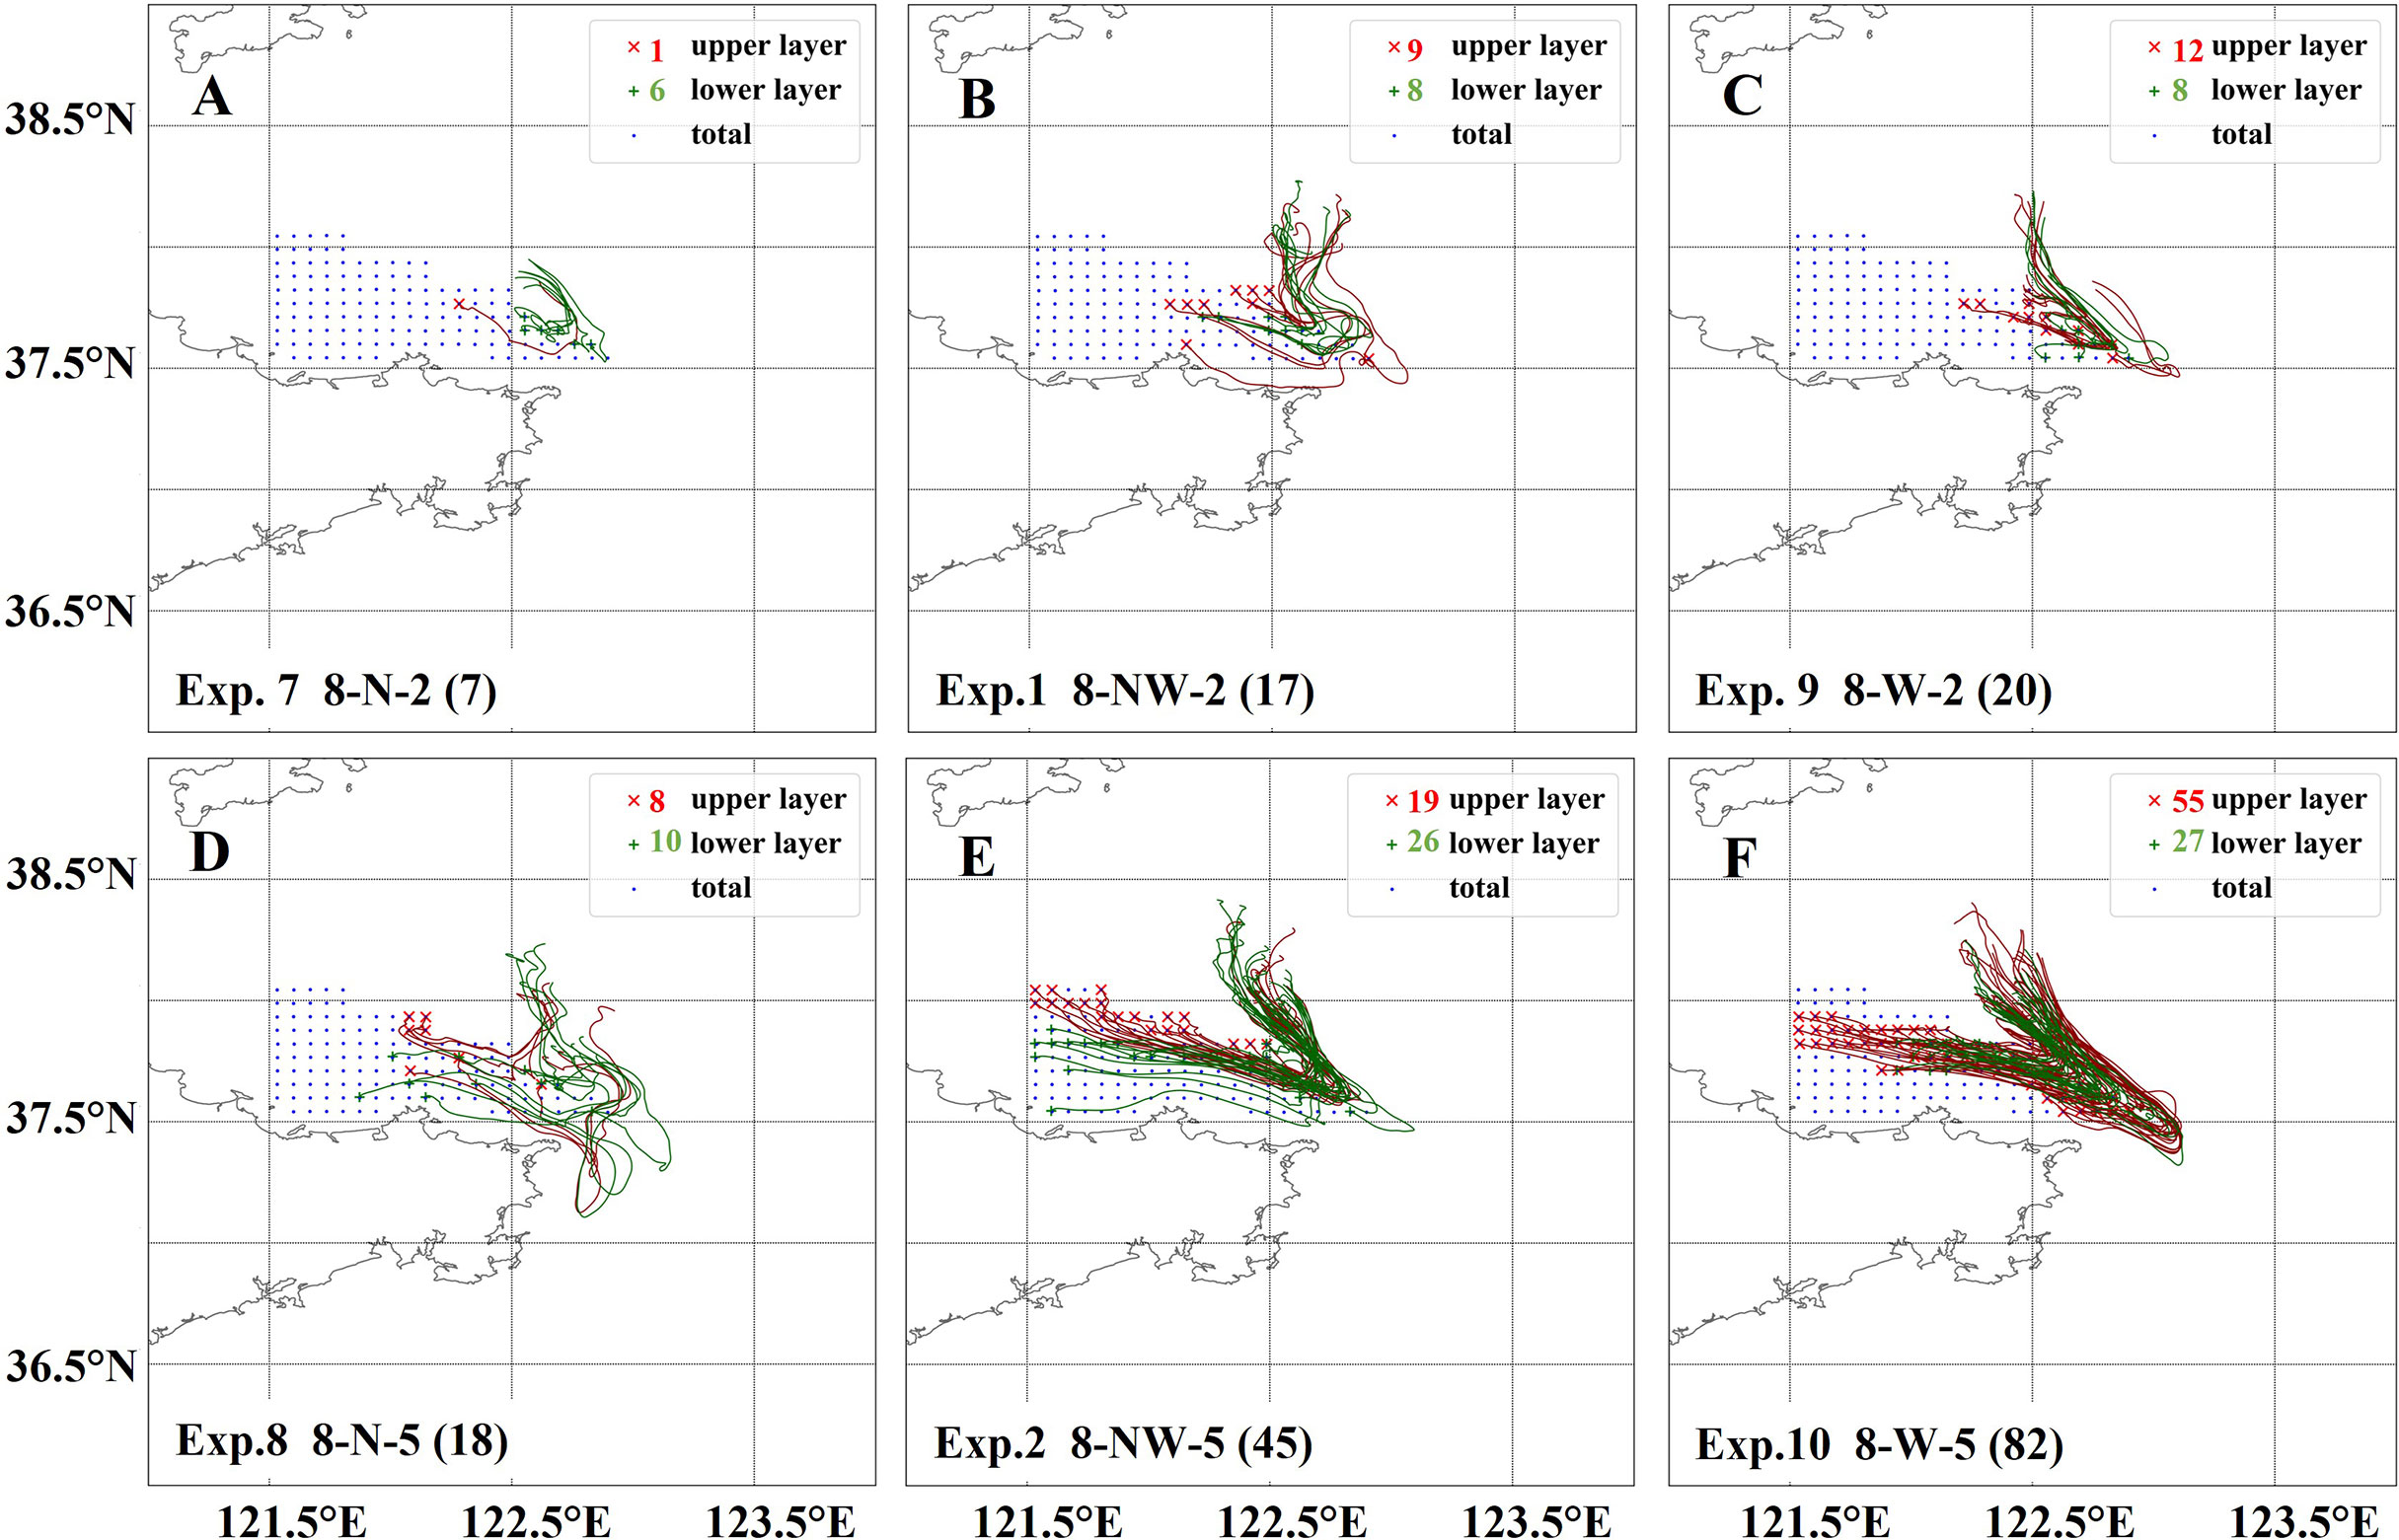
Figure 14 Effects of wind direction on cross-front transport.
According to the change in intensity and frequency of winter storms in the past 45 years, it can be seen that since 2010 the intensity and frequency of winter storms have decreased significantly (Supplementary Figure S2B). On the premise that the basic strength of the YSWC remains unchanged, the weakening of winter storms will inevitably lead to the weakening of cross-front transport, which will lead to the accumulation of nutrients and pollutants in the nearshore areas and affect material transport in the coastal areas.
5 Conclusions
The cross-front transport around the Shandong Peninsula is triggered by winter storms. The dynamic process is divided into two stages. (1) In the early stage of the storm, the coastal current around the Shandong Peninsula significantly intensifies and causes frontal inertial instability, favoring cross-front exchange between both sides of the front. (2) In the late stage of the storm, the Yellow Sea Warm Current flows northward as a compensation current, leading to the northward transport of the materials out of the front. Two locations in the northeastern tip and southeastern tip of the Shandong Peninsula with the highest probability of frontal instability have been identified, where the curvature of the front is larger than others. In addition, both storm intensity (wind speed and duration) and wind direction have an impact on cross-front transport. The winter storm, with longer duration, greater wind speed, and westward wind direction, tends to trigger stronger cross-front transport and longer transport distance, and transport paths also differ under different winter storms.
Winter storms occupy about 1/3 of the entire wintertime in this area. The instrumental data reveal that the intensity and frequency of winter storms have been weakening in the past 10 years, which will have an impact on the cross-front material transport and the coastal ecological environment.
Data availability statement
The original contributions presented in the study are included in the article/Supplementary Material. Further inquiries can be directed to the corresponding author.
Author contributions
XX, JG and YS developed the idea. XX designed the research, analyzed the data, and wrote the manuscript. JG guided the whole study and revised the manuscript. YS and XW helped to revise the manuscript. JL, SZ, SL, GY and TL took part in the field observation and gave comments to the manuscript. All authors contributed to the article and approved the submitted version.
Funding
This work was financially supported by the National Natural Science Foundation of China (Grant numbers: 42106158, 41576043, 41776048) and the Fundamental Research Funds for the Central Universities (Grant numbers: 14380100).
Acknowledgments
We are grateful to the National Science & Technology Infrastructure- National Marine Data Center of China (http://mds.nmdis.org.cn/) for providing data support. We are grateful to the High Performance Computing Center of Nanjing University for doing the numerical calculations in this paper on its blade cluster system. We thank Jieping Tang, Dezhi Chen, Yubin Qu, Zhuo Shu and Bian Zha for their support to our field work.
Conflict of interest
The authors declare that the research was conducted in the absence of any commercial or financial relationships that could be construed as a potential conflict of interest.
Publisher’s note
All claims expressed in this article are solely those of the authors and do not necessarily represent those of their affiliated organizations, or those of the publisher, the editors and the reviewers. Any product that may be evaluated in this article, or claim that may be made by its manufacturer, is not guaranteed or endorsed by the publisher.
Supplementary material
The Supplementary Material for this article can be found online at: https://www.frontiersin.org/articles/10.3389/fmars.2022.975504/full#supplementary-material
References
Alexander C. R., DeMaster D. J., Nittrouer C. A. (1991). Sediment accumulation in a modern epicontinental-shelf setting: The Yellow Sea. Mar. Geol. 98 (1), 51–72. doi: 10.1016/0025-3227(91)90035-3
Astudillo O., Dewitte B., Mallet M., Rutllant J. A., Goubanova K., Frappart F., et al. (2019). Sensitivity of the near-shore oceanic circulation off central Chile to coastal wind profiles characteristics. J. Geophys. Res.: Ocean. 124 (7), 4644–4676. doi: 10.1029/2018JC014051
Baltar F., Currie K., Stuck E., Roosa S., Morales S. E. (2016). Oceanic fronts: transition zones for bacterioplankton community composition. Environ. Microbiol. Rep. 8 (1), 132–138. doi: 10.1111/1758-2229.12362
Belkin I. M. (2002). “Front,” in Interdisciplinary encyclopedia of marine sciences. Eds. Nybakken J. W., Broenkow W. W., Vallier T. L. (Danbury, CT: Grolier), 433–436.
Belkin I. M., Cornillon P. C., Sherman K. (2009). Fronts in large marine ecosystems. Prog. Oceanogr. 81 (1-4), 223–236. doi: 10.1016/j.pocean.2009.04.015
Buckingham C. E., Gula J., Carton X. (2021). The role of curvature in modifying frontal instabilities. part I: Review of theory and presentation of a nondimensional instability criterion. J. Phys. Oceanogr. 51 (2), 299–315. doi: 10.1175/JPO-D-19-0265.1
Castelao R., Schofield O., Glenn S., Chant R., Kohut J. (2008). Cross-shelf transport of fresh water on the New Jersey shelf. J. Geophys. Res. 113, C07017. doi: 10.1029/2007JC004241
Danchenkov M., Lobanov V., Riser S., Kim K., Takematsu M., Yoon J. H. (2006). A history of physical oceanographic research in the Japan/east sea. Oceanography 19 (3), 18–31. doi: 10.5670/oceanog.2006.41
Ding Y., Bao X., Yao Z., Song D., Song J., Gao J., et al. (2018). Effect of coastal-trapped waves on the synoptic variations of the Yellow Sea warm current during winter. Continent. Shelf. Res. 167, 14–31. doi: 10.1016/j.csr.2018.08.003
Dong L. X., Guan W. B., Chen Q., Li X. H., Liu X. H., Zeng X. M. (2011). Sediment transport in the Yellow Sea and East China Sea. Estuar. Coast. Shelf. Sci. 93 (3), 248–258. doi: 10.1016/j.ecss.2011.04.003
Egbert G. D., Bennett A. F., Foreman M. G. (1994). TOPEX/POSEIDON tides estimated using a global inverse model. J. Geophys. Res.: Ocean. 99 (C12), 24821–24852. doi: 10.1029/94JC01894
Egbert G. D., Erofeeva S. Y. (2002). Efficient inverse modeling of barotropic ocean tides. J. Atmos. Ocean. Technol. 19 (2), 183–204. doi: 10.1175/1520-0426(2002)019<0183:EIMOBO>2.0.CO;2
Fairall C. W., Bradley E. F., Hare J. E., Grachev A. A., Edson J. B. (2003). Bulk parameterization of air–sea fluxes: Updates and verification for the COARE algorithm. J. Climate 16 (4), 571–591. doi: 10.1175/1520-0442(2003)016<0571:BPOASF>2.0.CO;2
Gao F., Qiao L., Li G. (2016). Winter meso-scale shear front in the Yellow Sea and its sedimentary effects. J. Ocean. Univ. China 15 (1), 50–56. doi: 10.1007/s11802-016-2668-7
Huang D., Zhang T., Zhou F. (2010). Sea-Surface temperature fronts in the Yellow and East China seas from TRMM microwave imager data. Deep. Sea. Res. Part II.: Top. Stud. Oceanogr. 57 (11-12), 1017–1024. doi: 10.1016/j.dsr2.2010.02.003
Johnston T. S., Rudnick D. L., Pallàs-Sanz E. (2011). Elevated mixing at a front. J. Geophys. Res.: Ocean. 116 (C11), C11033. doi: 10.1029/2011JC007192
Li J., Hu B., Wei H., Zhao J., Zou L., Bai F., et al. (2014). Provenance variations in the Holocene deposits from the Southern Yellow Sea: Clay mineralogy evidence. Continent. Shelf. Res. 90, 41–51. doi: 10.1016/j.csr.2014.05.001
Li C., Nelson J. R., Koziana J. V. (2003). Cross-shelf passage of coastal water transport at the South Atlantic bight observed with MODIS ocean Color/SST. Geophys. Res. Lett. 30 (5), 1257. doi: 10.1029/2002GL016496
Liu X., Chiang K. P., Liu S. M., Wei H., Zhao Y., Huang B. Q. (2015). Influence of the Yellow Sea warm current on phytoplankton community in the central Yellow Sea. Deep. Sea. Res. Part I.: Oceanogr. Res. Pap. 106, 17–29. doi: 10.1016/j.dsr.2015.09.008
Liu J. P., Milliman J. D., Gao S. (2001). The Shandong mud wedge and post-glacial sediment accumulation in the Yellow Sea. Geo-Mar. Lett. 21 (4), 212–218. doi: 10.1007/s00367-001-0083-5
Liu S. D., Qiao L. L., Li G. X., Shi J. H., Huang L. L., Yao Z. G., et al. (2018). Variation in the current shear front and its potential effect on sediment transport over the inner shelf of the East China Sea in winter. J. Geophys. Res.: Ocean. 123 (11), 8264–8283. doi: 10.1029/2018JC014241
Liu J., Saito Y., Wang H., Yang Z., Nakashima R. (2007). Sedimentary evolution of the Holocene subaqueous clinoform off the Shandong peninsula in the Yellow Sea. Mar. Geol. 236 (3-4), 165–187. doi: 10.1016/j.margeo.2006.10.031
Liu D., Wang Y., Wang Y., Keesing J. K. (2018). Ocean fronts construct spatial zonation in microfossil assemblages. Global Ecol. Biogeogr. 27 (10), 1225–1237. doi: 10.1111/geb.12779
Lohmann R., Belkin I. M. (2014). Organic pollutants and ocean fronts across the Atlantic ocean: A review. Prog. Oceanogr. 128, 172–184. doi: 10.1016/j.pocean.2014.08.013
Luo Z., Zhu J., Wu H., Li X. (2017). Dynamics of the sediment plume over the Yangtze bank in the Yellow and East China seas. J. Geophys. Res.: Ocean. 122 (12), 10073–10090. doi: 10.1002/2017JC013215
Nencioli F., Petrenko A. A., Doglioli A. M. (2016). Diagnosing cross-shelf transport along an ocean front: An observational case study in the gulf of lion. J. Geophys. Res.: Ocean. 121 (10), 7218–7243. doi: 10.1002/2016JC011908
Olson D. B., Hitchcock G. L., Mariano A. J., Ashjian C. J., Peng G., Nero R. W., et al. (1994). Life on the edge: Marine life and fronts. Oceanography 7 (2), 52–60. doi: 10.5670/oceanog.1994.03
Omand M. M., D’Asaro E. A., Lee C. M., Perry M. J., Briggs N., Cetinić I., et al. (2015). Eddy-driven subduction exports particulate organic carbon from the spring bloom. Science 348 (6231), 222–225. doi: 10.1126/science.1260062
Oost W. A., Komen G. J., Jacobs C. M. J., Van Oort C. (2002). New evidence for a relation between wind stress and wave age from measurements during ASGAMAGE. Boundary-Lay. Meteorol. 103 (3), 409–438. doi: 10.1023/A:1014913624535
Peterson J. O., Peterson W. T. (2009). Influence of the Columbia river plume on cross-shelf transport of zooplankton. J. Geophys. Res.: Ocean. 114 (C2), C00B10. doi: 10.1029/2008JC004965
Riedlinger S. K., Jacobs G. A. (2000). Study of the dynamics of wind-driven transports into the Yellow Sea during winter. J. Geophys. Res.: Ocean. 105 (C12), 28695–28708. doi: 10.1029/2000JC900127
Shchepetkin A. F., McWilliams J. C. (2005). The regional oceanic modeling system (ROMS): A split-explicit, free-surface, topography-following-coordinate oceanic model. Ocean. Model. 9 (4), 347–404. doi: 10.1016/j.ocemod.2004.08.002
Shi Y., Gao J. H., Sheng H., Du J., Jia J. J., Wang Y. P., et al. (2019). Cross-front sediment transport induced by quick oscillation of the Yellow Sea warm current: Evidence from the sedimentary record. Geophys. Res. Lett. 46 (1), 226–234. doi: 10.1029/2018GL080751
Shi Y., Xu X., Sheng H., Lv J., Zhang S., Gao J. (2022). Neglected role of continental circulation in cross-shelf sediment transport: Implications for paleoclimate reconstructions. Mar. Geol. 443, 106703. doi: 10.1016/j.margeo.2021.106703
Song D., Bao X., Wang X., Xu L., Lin X., Wu D. (2009). The inter-annual variability of the Yellow Sea warm current surface axis and its influencing factors. Chin. J. Oceanol. Limnol. 27 (3), 607–613. doi: 10.1007/s00343-009-9159-2
Taylor P. K., Yelland M. J. (2001). The dependence of sea surface roughness on the height and steepness of the waves. J. Phys. Oceanogr. 31 (2), 572–590. doi: 10.1175/1520-0485(2001)031<0572:TDOSSR>2.0.CO;2
Teague W. J., Jacobs G. A. (2000). Current observations on the development of the Yellow Sea warm current. J. Geophys. Res.: Ocean. 105 (C2), 3401–3411. doi: 10.1029/1999JC900301
Wandres M., Wijeratne E. M. S., Cosoli S., Pattiaratchi C. (2017). The effect of the leeuwin current on offshore surface gravity waves in Southwest Western Australia. J. Geophys. Res.: Ocean. 122 (11), 9047–9067. doi: 10.1002/2017JC013006
Wang F., Liu C. (2009). An n-shape thermal front in the western south Yellow Sea in winter. Chin. J. Oceanol. Limnol. 27 (4), 898–906. doi: 10.1007/s00343-009-9045-y
Wang C., Liu Z., Harris C. K., Wu X., Wang H., Bian C., et al. (2020). The impact of winter storms on sediment transport through a narrow strait, Bohai, China. J. Geophys. Res.: Ocean. 125 (6), e2020JC016069. doi: 10.1029/2020JC016069
Wang Y., Li G., Zhang W., Dong P. (2014). Sedimentary environment and formation mechanism of the mud deposit in the central South Yellow Sea during the past 40ákyr. Mar. Geol. 347, 123–135. doi: 10.1016/j.margeo.2013.11.008
Wang A., Ralston D. K., Bi N., Cheng Z., Wu X., Wang H. (2019). Seasonal variation in sediment transport and deposition on a muddy clinoform in the Yellow Sea. Continent. Shelf. Res. 179, 37–51. doi: 10.1016/j.csr.2019.04.009
Wu X., Wu H., Wang H., Bi N., Duan H., Wang C., et al. (2019). Novel, repeated surveys reveal new insights on sediment flux through a narrow strait, Bohai, China. J. Geophys. Res.: Ocean. 124 (10), 6927–6941. doi: 10.1029/2019JC015293
Wu X., Xu J., Wu H., Bi N., Bian C., Li P., et al. (2019). Synoptic variations of residual currents in the huanghe (Yellow river)-derived distal mud patch off the Shandong peninsula: Implications for long-term sediment transport. Mar. Geol. 417, 106014. doi: 10.1016/j.margeo.2019.106014
Xu L. L., Wu D. X., Lin X. P., Ma C. (2009). The study of the Yellow Sea warm current and its seasonal variability. J. Hydrodyn. 21 (2), 159–165. doi: 10.1016/S1001-6058(08)60133-X
Yang S. Y., Jung H. S., Lim D. I., Li C. X. (2003). A review on the provenance discrimination of sediments in the Yellow Sea. Earth-Sci. Rev. 63 (1-2), 93–120. doi: 10.1016/S0012-8252(03)00033-3
Yang Z. S., Liu J. P. (2007). A unique yellow river-derived distal subaqueous delta in the Yellow Sea. Mar. Geol. 240 (1-4), 169–176. doi: 10.1016/j.margeo.2007.02.008
Zang Z., Xue Z. G., Bi N., Yao Z., Wu X., Ge Q., et al. (2017). Seasonal and intra-seasonal variations of suspended-sediment distribution in the Yellow Sea. Continent. Shelf. Res. 148, 116–129. doi: 10.1016/j.csr.2017.08.016
Zhang W., Cui Y., Santos A. I., Hanebuth T. J. (2016). Storm-driven bottom sediment transport on a high-energy narrow shelf (NW Iberia) and development of mud depocenters. J. Geophys. Res.: Ocean. 121 (8), 5751–5772. doi: 10.1002/2015JC011526
Keywords: winter storm, curved front, frontal instability, cross-front transport, numerical modeling
Citation: Xu X, Gao J, Shi Y, Wu X, Lv J, Zhang S, Liu S, Liu T and Yang G (2022) Cross-Front Transport Triggered by Winter Storms Around the Shandong Peninsula, China. Front. Mar. Sci. 9:975504. doi: 10.3389/fmars.2022.975504
Received: 22 June 2022; Accepted: 13 July 2022;
Published: 02 August 2022.
Edited by:
Zeng Zhou, Hohai University, ChinaReviewed by:
Paul Liu, North Carolina State University, United StatesXiao Wu, Ocean University of China, China
Copyright © 2022 Xu, Gao, Shi, Wu, Lv, Zhang, Liu, Liu and Yang. This is an open-access article distributed under the terms of the Creative Commons Attribution License (CC BY). The use, distribution or reproduction in other forums is permitted, provided the original author(s) and the copyright owner(s) are credited and that the original publication in this journal is cited, in accordance with accepted academic practice. No use, distribution or reproduction is permitted which does not comply with these terms.
*Correspondence: Jianhua Gao, amhnYW9Abmp1LmVkdS5jbg==