 A.-M. Wefing
 N. Casacuberta
 M. Christl2
- 1Physical Oceanography, Institute of Biogeochemistry and Pollutant Dynamics, Department of Environmental Systems Science, ETH Zurich, Zurich, Switzerland
- 2Laboratory of Ion Beam Physics, Department of Physics, ETH Zurich, Zurich, Switzerland
- 3Norwegian Polar Institute, Fram Centre, Tromsø, Norway
Changes in the provenance and composition of waters exported from the Arctic Ocean have the potential to impact large-scale ocean circulation processes in the sub-polar North Atlantic. The main conveyor of waters from the Arctic Ocean to lower latitudes is the East Greenland Current (EGC), flowing southward through Fram Strait. It is therefore crucial to determine and monitor the composition of the EGC, a mixture of polar waters of different origins. Here we present a pilot study on the potential of the long-lived anthropogenic radionuclides 129I and 236U as tracers of the EGC water mass composition, based on a time series of 236U and 129I concentrations measured across Fram Strait in the years 2016, 2018, and 2019. The overall spatial distribution of 236U and 129I was similar among the three sampling years, but a decrease in concentration was observed in the upper water column of the EGC. The observed changes could only partly be attributed to the transient nature of the radionuclide signals, but instead pointed to changes in the EGC water mass composition. To investigate these changes, 236U and 129I were first combined in a mixing model featuring the endmembers expected in the upper EGC. We distinguished between Pacific Water (PAC), Atlantic Water advected from the Arctic Ocean (ATL), and Atlantic Water recirculating in Fram Strait (RAC). In 236U-129I tracer space, PAC and RAC showed similar tracer signatures, but were well distinguished from ATL. From 2016 to 2018/19, a decrease in the ATL fraction was evident for the upper EGC. Secondly, the respective combination of 236U and 129I with salinity showed differences in absolute water mass fractions, but similar temporal trends. Both suggested an increase in PAC of about 20% for the uppermost layer of the EGC (samples with potential densities below 26.5) and an increase in RAC of about 10−20 % for denser samples. 129I and 236U, in combination with salinity, were shown to be suitable tracers to investigate water mass composition in Fram Strait, with the advantage that they can distinguish Atlantic Water advected from the Arctic Ocean from that recirculating in Fram Strait.
1 Introduction
Anthropogenic climate change leads to rapid transformations in the Arctic Ocean, including Atlantic Water transport of heat and anthropogenic carbon, increased sea-ice melt, as well as changes in the meteoric water budget (Muilwijk et al., 2018; Arthun et al., 2019; Forryan et al., 2019; Terhaar et al., 2020; Timmermans and Marshall, 2020; Wang et al., 2020). Via the Canadian Arctic Archipelago, the Barents Sea, and Fram Strait, the Arctic Ocean is connected to the North Atlantic Ocean. Changes in the properties of waters transported from the Arctic Ocean to lower latitudes will eventually affect the global ocean circulation via its influence on deep-water formation in the sub-polar North Atlantic, an important driver of the Atlantic Meridional Overturning Circulation (Rahmstorf et al., 2015; Holliday et al., 2020).
The up to 2600 m deep Fram Strait, located between Greenland and Svalbard (Figure 1), is the only gateway allowing for a two-way exchange of waters between the Arctic and the North Atlantic Ocean. In eastern Fram Strait, the West Spitsbergen Current (WSC) carries warm and saline Atlantic Water into the Arctic Ocean. In western Fram Strait, the East Greenland Current (EGC) transports cold and fresh Arctic-derived waters as well as sea-ice southwards to the Nordic Seas (e.g., Beszczynska-Moller et al., 2011; Havik et al., 2017). In total, about half of the Arctic Ocean freshwater (sea ice and liquid freshwater relative to a reference salinity of 34.8) is exported through Fram Strait (Serreze et al., 2006; Haine et al., 2015). Pacific Water contributes to the Arctic Ocean freshwater pool due to its lower salinity compared to Atlantic Water. Over time, significant changes in the Arctic Ocean freshwater export through Fram Strait have been observed (Dodd et al., 2012; de Steur et al., 2015; de Steur et al., 2017; de Steur et al., 2018). The most recent study on freshwater transport in the EGC based on mooring observations pointed to an “Atlantification” of the western Fram Strait (Karpouzoglou et al., 2022).
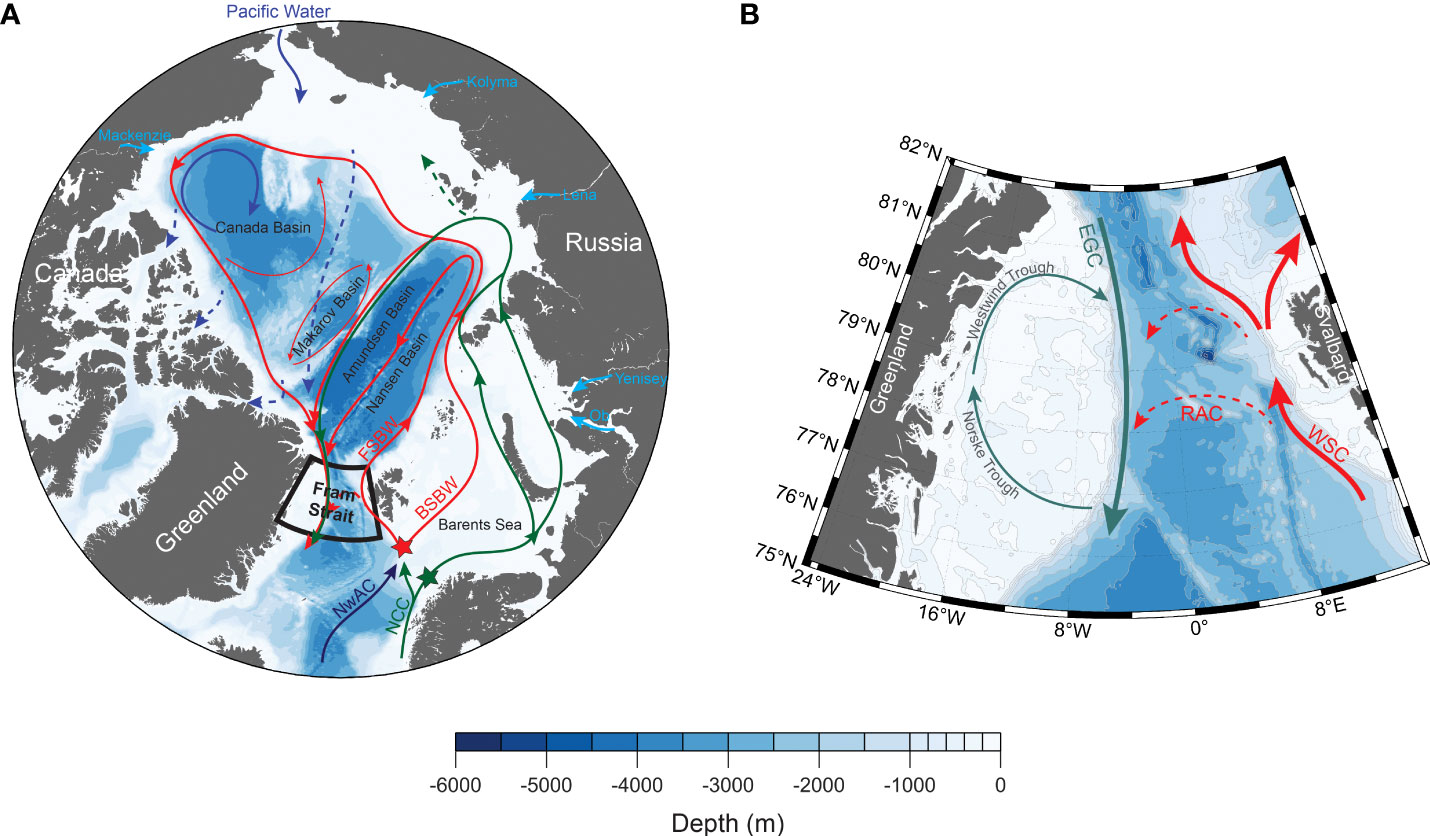
Figure 1 (A) Circulation of Atlantic (red and green) and Pacific (blue) waters in the Arctic Ocean. Green arrows depict the circulation of Atlantic Water originating from the Norwegian Coastal Current (NCC) in the surface layer. Red arrows depict the circulation of Fram Strait Branch Water (FSBW) and Barents Sea Branch Water (BSBW) in the mid-depth Atlantic layer. Star symbols show the locations where the surface (green star) and mid-depth Atlantic layer (red star) input functions of 129I and 236U to the Arctic Ocean, depicted in Figure 2, were defined. Light blue arrows depict inflow of major rivers draining into the Arctic Ocean. The black outline highlights the Fram Strait study area shown in (B). The map was modified after Figure 1 in Wefing et al. (2021). NwAC: Norwegian Atlantic Current. (B) Map of Fram Strait with main circulation features in the upper water column including the West Spitsbergen Current (WSC), East Greenland Current (EGC), and Return Atlantic Current (RAC), as well as main topographic features on the Greenland shelf.
To understand causes of the observed changes, the water mass composition of the EGC needs to be resolved. To this aim, the combination of different chemical tracers has been used in the past. Salinity and stable oxygen isotopes (δ 18O) allow to determine fractions of sea-ice melt and meteoric water (comprising precipitation, river runoff, and glacial meltwater) (Dodd et al., 2009). Atlantic- and Pacific-derived waters have classically been distinguished by nutrient-based methods using nitrate-phosphate (N:P method) or phosphate-oxygen relationships (PO*; e.g., Ekwurzel et al., 2001; Yamamoto-Kawai et al., 2008; Jones et al., 2008a; Jones et al., 2008b; Bauch et al., 2011; Dodd et al., 2012; Newton et al., 2013; Alkire et al., 2015; Alkire et al., 2019; Forryan et al., 2019). However, there is an ongoing debate regarding the reliability of nutrient-based approaches for Arctic Ocean water masses, due to shelf-interaction processes taking place on the broad Arctic shelves such as denitrification in the Chukchi Sea, or seasonal variability (Ekwurzel et al. (2001); Bauch et al. (2011); Alkire et al. (2015); Alkire et al. (2019); Forryan et al. (2019)). New tracers have been investigated to differentiate between Pacific and Atlantic contributions, such as dissolved gallium (Whitmore et al., 2020) or neodymium isotopes (Laukert et al., 2017). Recently, also the use of anthropogenic radionuclides as tracers to distinguish between Atlantic- and Pacific-derived waters in the Arctic Ocean has been suggested (Alkire et al., 2019; Forryan et al., 2019). The long-lived radionuclides 129I and 236U behave conservatively in seawater and are transported by Atlantic-origin waters in the Arctic Ocean (Casacuberta et al., 2018). Recent studies used the 129I and 236U signal to track pathways of Atlantic-origin waters through the Arctic Ocean (Casacuberta et al., 2016), and the transient signal of both radionuclides has been successfully applied to estimate water mass ages and mixing regimes of Atlantic Water in the Arctic Ocean and Fram Strait (Christl et al., 2015b; Wefing et al., 2019; Wefing et al., 2021). So far, however, 129I and 236U have not been explored as tracers to differentiate between Pacific and Atlantic Water and to determine water mass fractions.
This study addresses the transient nature as well as the potential of 129I and 236U as tracers to distinguish between Atlantic- and Pacific-derived waters in Fram Strait. Firstly, temporal changes in the 236U distribution across Fram Strait in the years 2016, 2018, and 2019 are presented and investigated in light of the time-dependent input of both radionuclides to the Arctic Ocean. Secondly, both radionuclides are combined with salinity in a steady-state mixing model to derive water mass fractions and their temporal variation in the EGC. Finally, strengths and weaknesses of both radionuclides as tracers of Atlantic and Pacific Water in Fram Strait are discussed and their future potential as new water mass composition tracers is assessed.
2 Material and methods
2.1 Study area
Main circulation features in the upper water column of Fram Strait comprise the northward-flowing WSC and the southward-flowing EGC (Figure 1B). The WSC carries warm and saline Atlantic Water into the Arctic Ocean, which evolves into the so-called Fram Strait Branch Water (FSBW). Together with Barents Sea Branch Water (BSBW), FSBW constitutes the mid-depth Atlantic Layer of the Arctic Ocean. About half of the WSC, however, is known to recirculate already within Fram Strait and is then referred to as Return Atlantic Current (RAC; Marnela et al., 2013; de Steur et al., 2014). The extent, spatial and temporal variability, as well as mechanisms of this recirculation are subject to ongoing research (e.g., Hattermann et al., 2016; Kawasaki and Hasumi, 2016; Wekerle et al., 2017; Richter et al., 2018). The RAC joins the EGC, which carries Polar Waters of Atlantic- and Pacific-origin southward. Rudels et al. (2005) and Rudels et al. (2012) classified waters with a potential density (σΘ ) below or equal 27.7 and a potential temperature below or equal 0°C and above 0°C as Polar Surface Water (PSW) and Warm Surface Water (PSWw), respectively. In this study, we do not distinguish between PSW and PSWw but refer to both water masses as PSW.
The western Fram Strait is dominated by the broad north-east Greenland continental shelf with depths between about 50 and 300 m. Its main topographic feature is a C-shaped trough system comprising Norske Trough and Westwind Trough (Figure 1B), with depths ranging mostly between about 300 and 500 m (Arndt et al., 2015). The troughs have been found to play an important role in the transport of warm Atlantic origin waters to glaciers terminating in Fram Strait, especially the so-called 79° N glacier (Nioghalvfjerdsbrae; Schaffer et al. (2017); Münchow et al. (2020)), suggesting an anti-cyclonic flow through Norske Trough and potentially further north through Westwind Trough. Schaffer et al. (2017) estimated a transit time of less than 1.5 years for waters transported by the WSC to reach the 79° N glacier.
In mid-depth layers (∼400−1000 m) of Fram Strait, waters of Atlantic origin (i.e., FSBW or BSBW), which have circulated through the Arctic Ocean, are transported southwards, referred to as Arctic Atlantic Water (AAW) and Arctic Intermediate Water (AIW) (Rudels et al., 2005; Rudels et al., 2012). Below, a mixture of deep waters from the Eurasian and Canada Basin of the Arctic Ocean and the Nordic Seas is found.
2.2 Sources of 129I and 236U in the Arctic Ocean and Fram Strait
The main signal of the two long-lived anthropogenic radionuclides 129I and 236U in the Arctic Ocean can be attributed to liquid releases of two European nuclear fuel reprocessing plants located in La Hague (France) and Sellafield (United Kingdom), (Christl et al., 2015b; Casacuberta et al., 2016, Casacuberta et al., 2018). The amounts of released 129I and 236U have been changing over time. Overall, more 129I has been released compared to 236U (Casacuberta et al., 2016). The reprocessing plant signal is transported northward from the North Sea in the Norwegian Coastal Current (NCC; Edmonds et al. (2001); Gascard et al. (2004); Smith et al. (2011); Casacuberta et al. (2018)).
Another source of 236U (and a minor amount of 129I) is the global fallout from atmospheric nuclear weapon tests conducted in the 1950s and 60s. This signal can be found in all recently (i.e., less than about 70 years ago) ventilated water masses (e.g., Christl et al., 2015b). The global fallout signal in the North Atlantic Ocean is primarily carried northwards in the Norwegian Atlantic Current (NwAC). The admixture of NCC waters carrying the reprocessing plant radionuclides signal to the NwAC results in a time-dependent 129I and 236U signature labeling all Atlantic Water that enters the Arctic Ocean.
As a consequence of the (not spatially uniform) mixing of NCC and NwAC, different Atlantic branches entering the Arctic Ocean carry different 129I and 236U concentrations (Figure 2). The strongest reprocessing plant signal is found in the NCC (green datapoints in Figure 2) and the high 129I concentrations observed in the surface layer of the Amundsen Basin in 2015 could clearly be attributed to waters originating from this branch (Casacuberta et al., 2018). Further downstream, the upper layer of the EGC in Fram Strait also showed high 129I concentrations in 2016, suggesting the presence of a significant fraction of NCC-derived waters (Wefing et al., 2019). Waters entering the Arctic Ocean through Fram Strait and the Barents Sea Opening, offshore from the Norwegian coast, carry a smaller fraction of the NCC and therefore lower 129I and 236U concentrations. Casacuberta et al. (2018) defined different input functions for these two branches, suggesting that BSBW carries slightly higher 129I and 236U concentrations than FSBW (Figure 2).
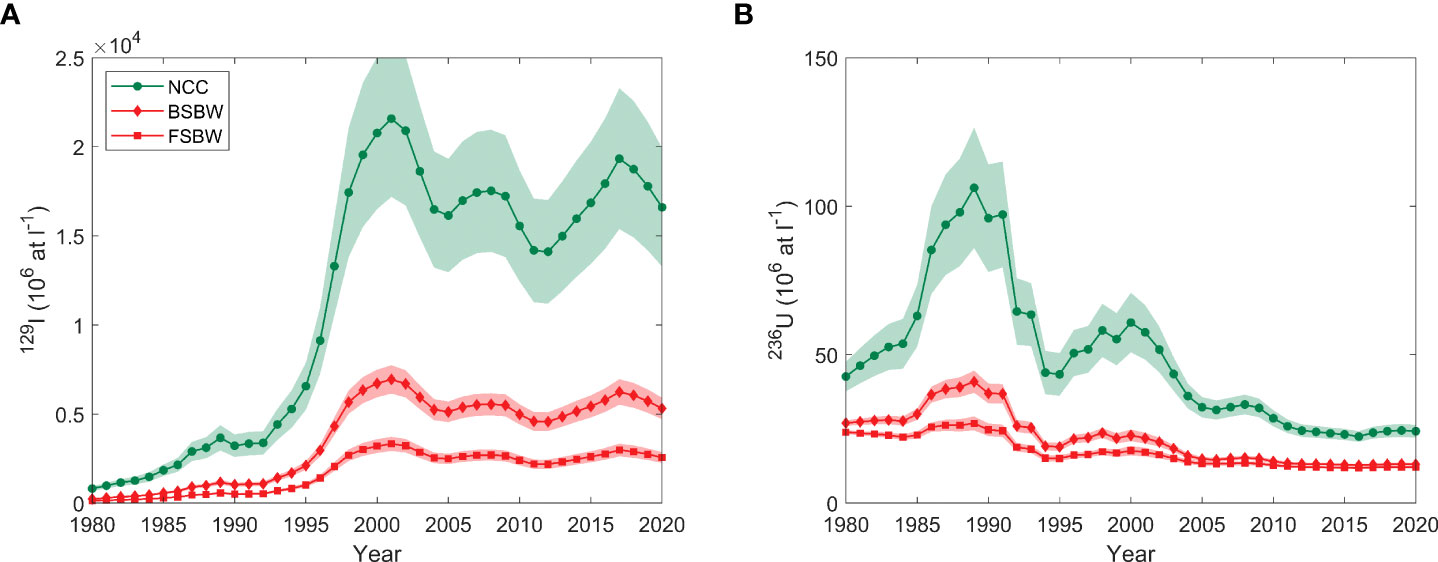
Figure 2 Input functions of 129I (A) and 236U (B) in the Norwegian Coastal Current (NCC), Barents Sea Branch Water (BSBW), and Fram Strait Branch Water (FSBW) after Casacuberta et al. (2018) and Wefing et al. (2021).
Pacific Water entering the Arctic Ocean through Bering Strait has not been labeled by reprocessing plant releases but carries only the global fallout signal of 129I and 236U. Both radionuclides were introduced to the surface ocean via wet and dry deposition and not via air-sea gas exchange. One can therefore assume that most 129I and 236U from the nuclear weapon tests, conducted more than 50 years ago, has been distributed within the upper ocean and the global fallout signal in Pacific Water is considered constant in time [at 107 at·L−1 for 129I and 236U, Wefing et al. (2021)].
2.3 Sampling, chemical analysis, and measurement
Seawater samples for 129I and 236U analyses presented in this study were collected during three oceanographic expeditions to Fram Strait in 2016, 2018 and 2019. All samples were taken from 12‐L Niskin bottles mounted on a conductivity‐temperature‐depth (CTD) rosette. For the analysis of 129I, 200−500 ml of seawater were filled into plastic bottles without further treatment. For the analysis of 236U, 3−5 L of seawater were collected in plastic cubitainers without further treatment. Whenever possible, seawater samples for 129I and 236U analysis were taken from the same Niskin bottle. All samples were shipped to the Laboratory of Ion Beam Physics at ETH Zurich for 129I and 236U analysis.
129I and 236U data from the 2016 expedition aboard R/V Polarstern (PS100, July-September 2016; Kanzow (2017)) have already been published in Wefing et al. (2019). Hydrographic data for this expedition were obtained from the PANGAEA database (Kanzow et al., 2017). Full-depth profiles for 129I and 236U analysis were collected along the 79° N transect and in several stations on the north-east Greenland shelf.
The 2018 and 2019 expeditions (FS2018, FS2019) were carried out by the Norwegian Polar Institute (NPI, Tromsø) aboard R/V Kronprins Haakon in August/September 2018 and September 2019, respectively. Hydrographic data from FS2018 and FS2019 were kindly provided by NPI (pers. communication P.A. Dodd, 2020). In both years, full-depth profiles of 236U samples were collected along the 79° N transect with the main focus on the upper 400 m of the outflowing waters in the EGC. One 236U profile was also taken in Norske Trough. In 2018 and 2019, only two and one full-depth profile, respectively, were collected for 129I analysis.
For all samples, the chemical preparation and determination of 129I and 236U concentrations with Accelerator Mass Spectrometry (AMS) was performed at the Laboratory of Ion Beam Physics at ETH Zurich following the method described in Wefing et al. (2019). Note that samples for 236U analysis collected during FS2018 and FS2019 were spiked with a new 233U spike (PTB2014-1126, about 1 pg 233U per sample). Technical details on the AMS measurement can be found in Vockenhuber et al. (2015) and Christl et al. (2015a).
Generally, 238U concentrations are determined from measured 233U/238U atom ratios using the known amount of 233U added as a spike, as also described in Wefing et al. (2019). Together with the measured 236U/238U atom ratios, this allows to infer 236U concentrations. However, comparing the three sampling years, we noticed inconsistencies in the 238U-salinity relationship from the measured 238U compared to the theoretical relationship by Owens et al. (2011). Measured 238U were all above the 238U concentrations expected from salinity, especially for FS2019. A possible explanation could be the handling and storage of the 233U spike, which was pre-weighed in small (1.5 ml) vials and stored for several months (longest for FS2019). A potential adsorption of 233U onto the vial or an incomplete transfer from the vial into the seawater sample would lead to an overestimation of 233U transferred into the sample and hence also 238U in the sample. To ensure comparability among the different sampling years, we therefore decided to use the 238U-salinity relationship and corresponding uncertainty from Owens et al. (2011) to calculate 238U from salinity for all three expeditions. 236U concentrations were then calculated from the measured 236U/238U atom ratio, propagating corresponding uncertainties. Atom ratios and concentrations are reported in Table S1 in the supplement.
3 Results
3.1 Hydrographic parameters and 236U distribution across Fram Strait
In all sampling years, radionuclide samples were collected along a transect across Fram Strait, at about 79° N. Potential temperature, salinity, and 236U concentrations are therefore depicted as sections through Fram Strait, showing the upper 1000 m of the water column between 12° W and 8° E (Figure 3). All available hydrographic and 236U data along this transect was depicted here (Figures 3A–C).
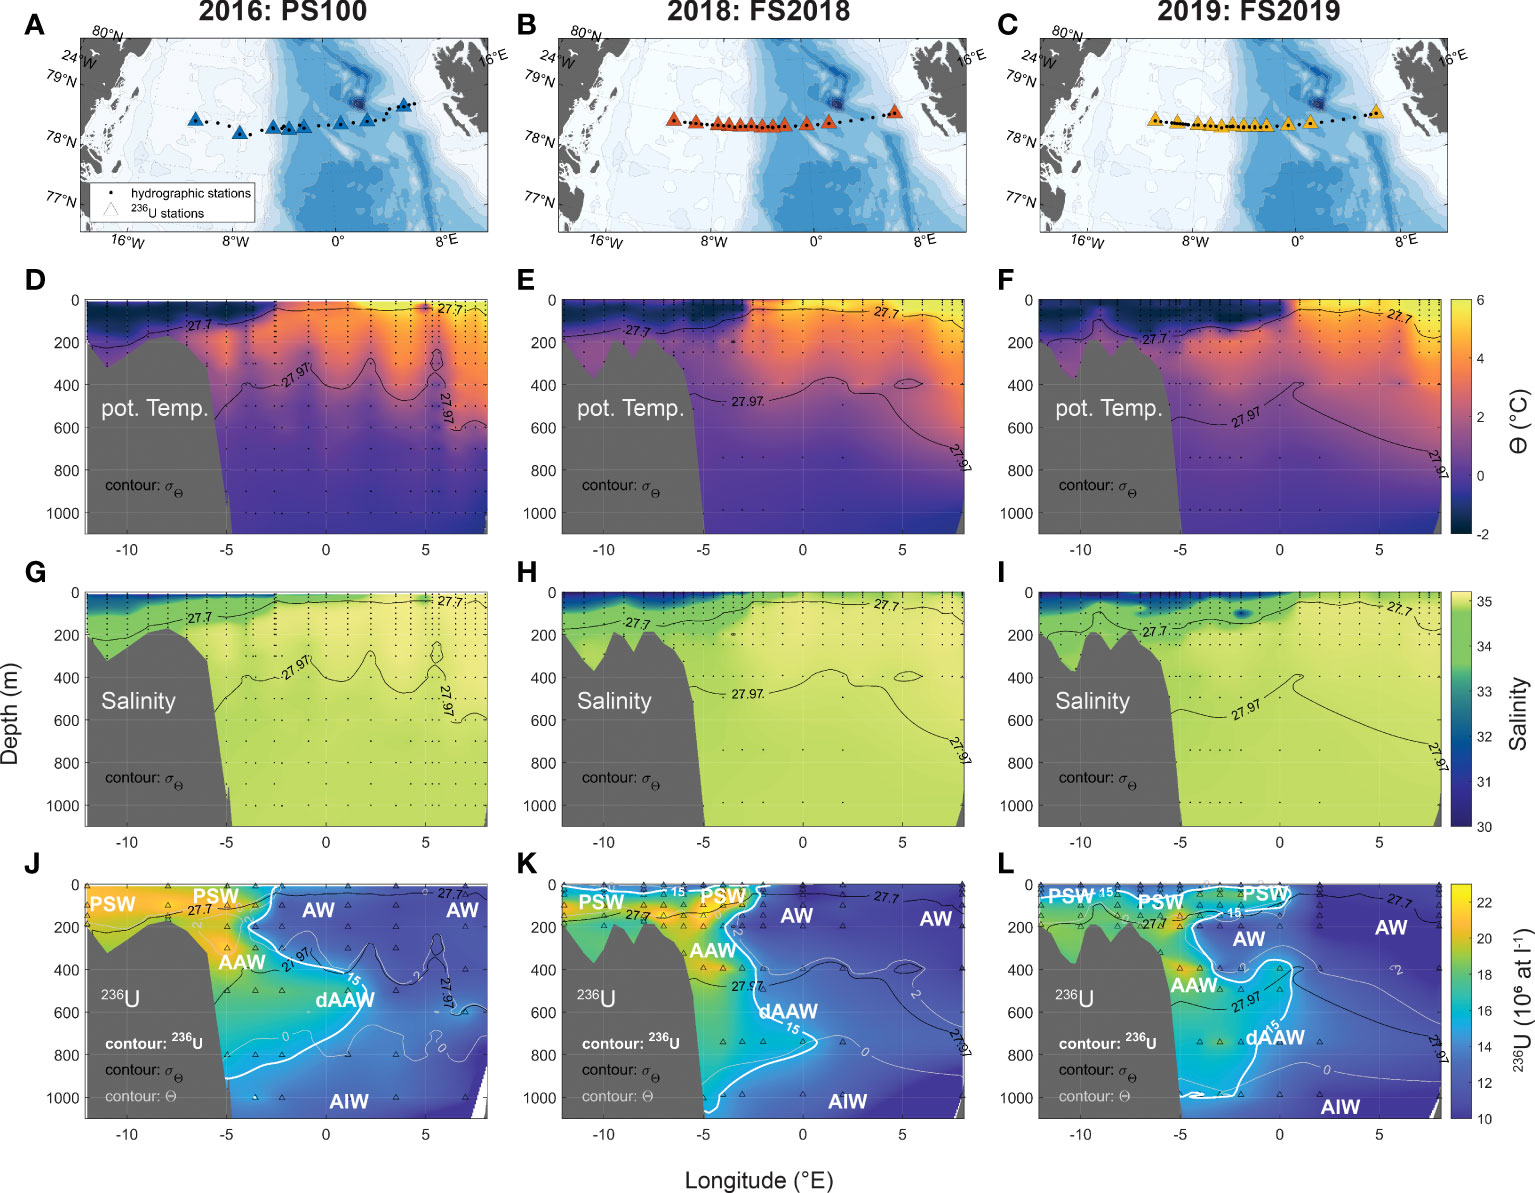
Figure 3 (A–C) CTD stations for hydrographic sampling (black dots) and 236U sampling (colored triangles) during expedition PS100 in 2016 (A), FS2018 (B), and FS2019 (C). (D–F) Transects of potential temperature (Θ) for 2016 (D), 2018 (E), and 2019 (F). (G–I) Transects of salinity for 2016 (G), 2018 (H), and 2019 (I). (J–L) Transects of 236U/238U for 2016 (J), 2018 (K), and 2019 (L). In all transects, only the upper 1000 m are shown and bathymetry corresponds to bottom depths of all CTD stations along the transect. Isopycnals of 27.7 and 27.97 are shown in black. In 236U transects, additionally 236U isolines of 15 × 106 at · L −1 are shown in white (bold), Θ isolines of 0 °C and 2 °C are shown in light gray, and water masses are indicated. PSW: Polar Surface Water, AW: Atlantic Water, (d)AAW: (dense) Arctic Atlantic Water, AIW: Arctic Intermediate Water.
The sections of potential temperature (Figures 3D–F) and salinity (Figures 3G–I) clearly showed cold and fresh PSW of Arctic origin residing in the upper water column of the western Fram Strait, including the north-east Greenland shelf. In the eastern Fram Strait, warm and saline Atlantic Water (AW) occupied the water column down to about 400-600 m. In the surface layer, the interface between PSW and AW was delineated by a sharp front in both potential temperature and salinity, located at about 2° W in 2016 and 2018. In 2019, PSW extended further to the east and the front was located east of the prime meridian (Figures 3F–I). Below PSW, increased potential temperature and salinity pointed to the presence of transformed Atlantic Water, i.e, water of Atlantic origin which has already circulated through the Arctic Ocean (AAW), in the western Fram Strait in all years.
In the 236U sections across Fram Strait, the above-mentioned water masses are indicated based on the water mass classification in Rudels et al. (2005); Rudels et al. (2012) (Figures 3J–L). Note the difference in sampling resolution compared to hydrographic data, but also between 2016 and 2018/19, especially in PSW. The 236U distribution across Fram Strait in 2016 has already been presented in Wefing et al. (2019), however, main features are summarized here again. 236U concentrations were generally higher in outflowing Arctic water (PSW and AAW) compared to the inflowing AW. The front between PSW and AW in the surface, delineated in the 2°C isotherm (light gray), was well aligned with the strong eastward decrease in 236U concentrations. For better visualization, the isoline for a 236U concentration of 15×106 at·L−1 was also depicted in the sections (thick white line). In the upper 200−300 m, it closely followed the 2°C isotherm (Figures 3J–L). In all three years, the highest 236U signal was found in PSW (upper 200 m of the EGC) and in (dense) AAW at around 400 to 750 m depth. The underlying waters with Θ < 0°C (AIW) carried a lower tracer signal which decreased further with depth. Below 1000 m depth, 236U concentrations were at the level of global fallout (around 106 at·L−1 ) or below (not shown).
From 2016 to 2018, 236U concentrations in the upper 50 to 100 m of the EGC decreased (Figures 3J, K). Highest 236U signals in 2018 (around 23×106 at·L−1 ) were found between 100 and 200 m depth approximately at the shelfbreak (around 4−5 °W, Figure 3K), associated with the core of the EGC (velocity maximum from moorings at around 4° W; de Steur et al. (2018)). 236U concentrations at similar depths decreased slightly from 2018 to 2019 (to around 20−21×106 at·L−1 ; Figure 3L). At the same time, the interface between in- and outflowing waters in the upper 100 m shifted significantly to the east in 2019 compared to 2018 and 2016. This shift was observed in Θ and salinity, but also in the 236U distribution. The isoline of 15×106 at·L−1 236U shifted from about 2.5°E in 2016 and 2018 to about 0.4°W in 2019 (average of eastward extent over 0−100 m depth). In contrast, no significant temporal changes were observed in mid-depth waters (AAW and dAAW). Note that below about 200 m depth, however, the sampling resolution for 236U was lower and differed between 2016 and 2018/2019 (Figures 3J–L).
3.2 236U and 129I profiles of matching stations
To account for differences in the sampling locations over time, a direct comparison of data from all three years was performed for eight stations which were identified as “matching stations” among the expeditions (Figure 4A). Station 1 is located in Norske Trough, stations 2 and 3 cover the north-east Greenland shelf, stations 4−7 cover the central Fram Strait, and station 8 is located in the WSC close to Svalbard. Profiles of 236U and 129I data for the different sampling years show the temporal evolution of both radionuclides at these eight stations (Figures 4B–I).
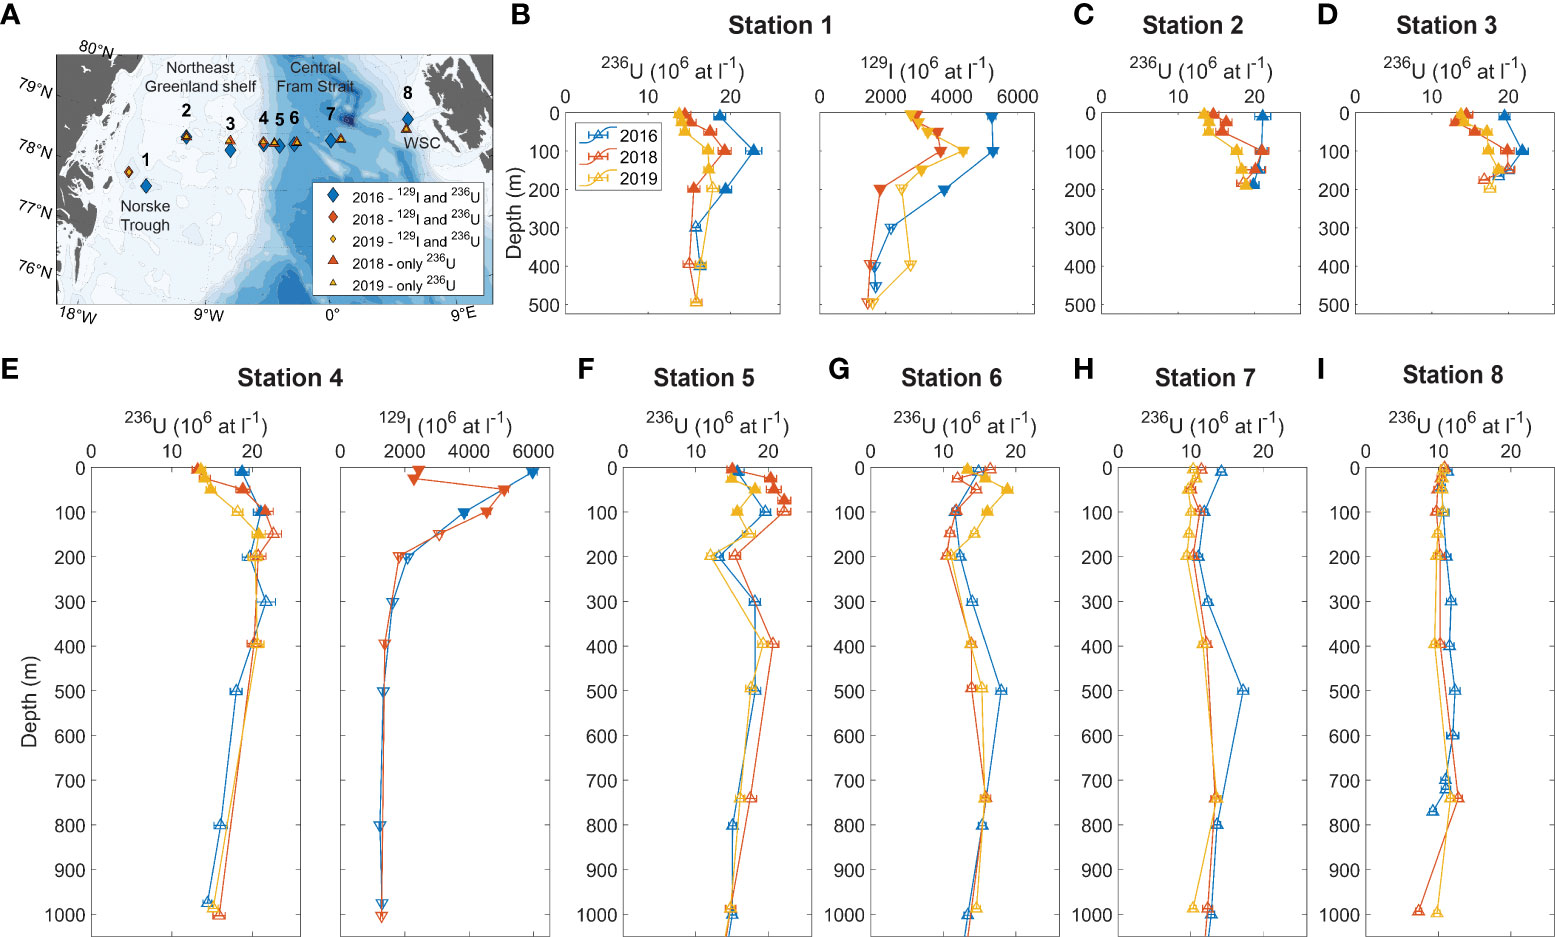
Figure 4 (A) Map showing locations of eight matching stations among the different expeditions. Colored diamonds show stations of available 129I and 236U data for 2016 (blue), 2018 (red) and 2019 (yellow). Colored triangles show stations where only 236U data are available. (B–I) Profiles of 236U (and 129I for station 1 and 4) at matching stations 1-8 for 2016 (blue), 2018 (red), 2019 (yellow). Filled symbols indicate samples classified as PSW or PSWw.
At the shelf stations (stations 1-3), 236U concentrations decreased from 2016 to 2018/19 from about 20−22×106 at·L−1 to 14−20×106 at·L−1 in the upper 100 m (Figures 4B–D). For greater depths, the decrease was less pronounced or not observed. For stations 2 and 3, 236U in the deepest samples (150−200 m depth) agreed within uncertainties for all years. Similar trends were observed for 129I at station 1, with a decrease from about 5000−6000×106 at·L−1 measured in the surface samples in 2016 to about 2000−4000×106 at·L−1 in 2018/2019. At about 400 m depth, however, 129I was similar in 2016 and 2018, and increased in 2019. This trend was not observed in 236U at the same station. Slight temporal changes were also observed for potential temperature and salinity at the shelf stations (Figures S1, S2). In the upper 100 m, salinity generally decreased from 2016 to 2018/19 (Figures S1A-C), whereas potential temperature decreased at station 1 but increased slightly at stations 2 and 3 (Figures S2A-C). At station 1, a significant increase in potential temperature was observed at around 150−200 m depth, accompanied by a slight increase of salinity.
Among the deep stations in central Fram Strait (stations 4-7), no differences in 129I and 236U were observed below 1000 m depth, hence only the upper 1000 m are shown. At station 4, located at the shelf break, similar trends were observed as for the shelf stations, with a decrease of both 129I and 236U in the surface from 2016 to 2018/19 (Figure 4E). In the upper 100 m depth at station 5, slightly higher 236U concentrations were observed for 2018 compared to 2016 and 2019 (Figure 4F).
In contrast to all other stations, station 6 showed significant differences between 2016/18 and 2019, related to the previously mentioned shift of the interface between in- and outflowing waters in the surface layer (observed in Θ , salinity, and 236U, see Figure 3). In 2019, the upper 200 m were characterized by significantly higher 236U concentrations compared to 2016 and 2018 (Figure 4). No 129I concentrations are available for 2018 and 2019, but both potential temperature and salinity decreased significantly from 2018 to 2019 at the same depths (Figures S1F and S2F). Overall, the profiles of 236U, Θ , and salinity at station 6 in 2019 rather resembled those of station 5 (Figures S1E and S2E), whereas in 2016 and 2018, station 6 appeared similar to station 7 (Figures S1G, S2G). The zig-zag structure observed in 236U and also in Θ in the upper 50 m of station 6 in 2018 might also hint at a mixture of in- and outflowing waters in the upper water column. At around 500 m depth, a slightly higher 236U concentration was found in 2016.
Further to the east, at station 7, only a slight decrease of 236U concentrations from 2016 to 2018/19 was observed in the upper water column, accompanied by a significant increase in potential temperature and salinity (Figures S1G, S2G). At station 8, comprising inflowing Atlantic Water, no significant changes were observed in 236U throughout the water column, whereas potential temperature and salinity decreased at the surface (Figures S1H, S2H).
Overall, the comparison of profiles from matching stations between 2016, 2018 and 2019 confirmed that the greatest temporal changes in 236U concentrations were observed in the upper water column in samples classified as PSW, especially in stations on the north-east Greenland shelf. Changes in 236U were accompanied by changes in available 129I and partly also by changes in potential temperature and salinity.
4 Discussion
Generally, the observed temporal changes in 236U and 129I across Fram Strait could have been caused by two processes that shall be discussed in the following:
(i) The transient nature of 129I and 236U, i.e., temporally changing inputs of both radionuclides into the Arctic Ocean (Figure 2). This naturally leads to changes in their distribution across the Arctic Ocean and Fram Strait over time as shown in earlier time-series studies on 129I (e.g., Smith et al., 2011).
(ii) Changes in the water mass composition of the EGC as a consequence of upstream circulation changes. This leads to changes in 129I and 236U across Fram Strait due to mixing of water masses carrying different tracer signals, such as changing fractions of Pacific- and Atlantic-origin waters.
4.1 Temporal changes of 236U and 129I as a consequence of their time-dependent input functions
To account for the transient nature of 129I and 236U (process (i)), the temporal variability in their input to the Arctic Ocean (Figure 2) needs be projected to the sampling location and time, i.e., Fram Strait in 2018 and 2019. This projection requires knowledge of the travel time of water from the initialization point of the input function (Barents Sea opening; Casacuberta et al. (2018); Wefing et al. (2021)) to the sampling location.
One approach to estimate travel times are “tracer ages” derived from the combination of 129I and 236U in a simple binary mixing model as described in recent studies (Christl et al., 2015b; Wefing et al., 2019; Wefing et al., 2021). Briefly, this binary mixing model is based on the assumption that the flow of Atlantic-derived water in the surface Arctic Ocean is purely advective in the sense that tracer signals from different years of the input function do not mix. Mixing only occurs between Atlantic Water carrying the input function signal from a certain year, and water carrying a constant global fallout signal (in the surface Arctic Ocean, this corresponds to Pacific Water). Both endmembers are plotted in 236U-129I tracer space. Mixing lines constructed between each year of the input function (i.e., the annual input function tracer concentrations, Figure 2) and the global fallout signal permit to define both a tracer age and a dilution factor of the input function tracer signal (further details are given in Wefing et al., 2021).
Since a complete dataset of both tracers was only available for 2016, we applied the binary mixing model to all PSW and PSWw samples from the matching stations from expedition PS100 (a plot of the binary mixing model is shown in Figure S3A). Note that we used the NCC input function for these calculations, hence tracer ages and dilution factors (reported in Table S1) are given relative to tracer concentrations at the Barents Sea Opening. The NCC input function was used to ensure comparability to tracer ages and dilution factors based on PS100 that were already reported in Wefing et al. (2021). Differences between results from this study and from Wefing et al. (2021) are due to the slightly adjusted 236U concentrations (based on the 238U-Salinity relationship, see 4.3).
The calculation of projected 129I and 236U concentrations for 2018 and 2019 is illustrated with the example of a PSW sample in 2016 that has a tracer age of 15 years and a dilution factor of 4. This sample hence carried a mixture of about 25% of the input function signal from 2001 with about 75% of the GF signal. Assuming that the circulation pattern did not change over time, one would hence always expect to find the input function signal of 15 years previous to the sampling year at the sampling location and depth of this sample, diluted with the same fraction of GF water. For the sampling years of 2018 and 2019, one would therefore expect the tracer signal from the input function years of 2003 and 2004, respectively.
The obtained projected 129I and 236U concentrations are depicted in Figure 5, together with the measured profiles from 2018 and 2019. Uncertainties for projected concentrations correspond to the propagated uncertainty of the NCC input function (Figure 2). For depths shallower than 50 m, the projected concentrations largely exceeded the measured ones, both for 129I and 236U. Below, the measured concentrations fell in the projected range, except for station 1 (Figure 5A). At this station, measured 129I and 236U concentrations in 2018 and 2019 reached a maximum at 100 m depth, where they agreed with projected concentrations, and decreased towards greater depths, where 129I fell below the projected 129I concentration.
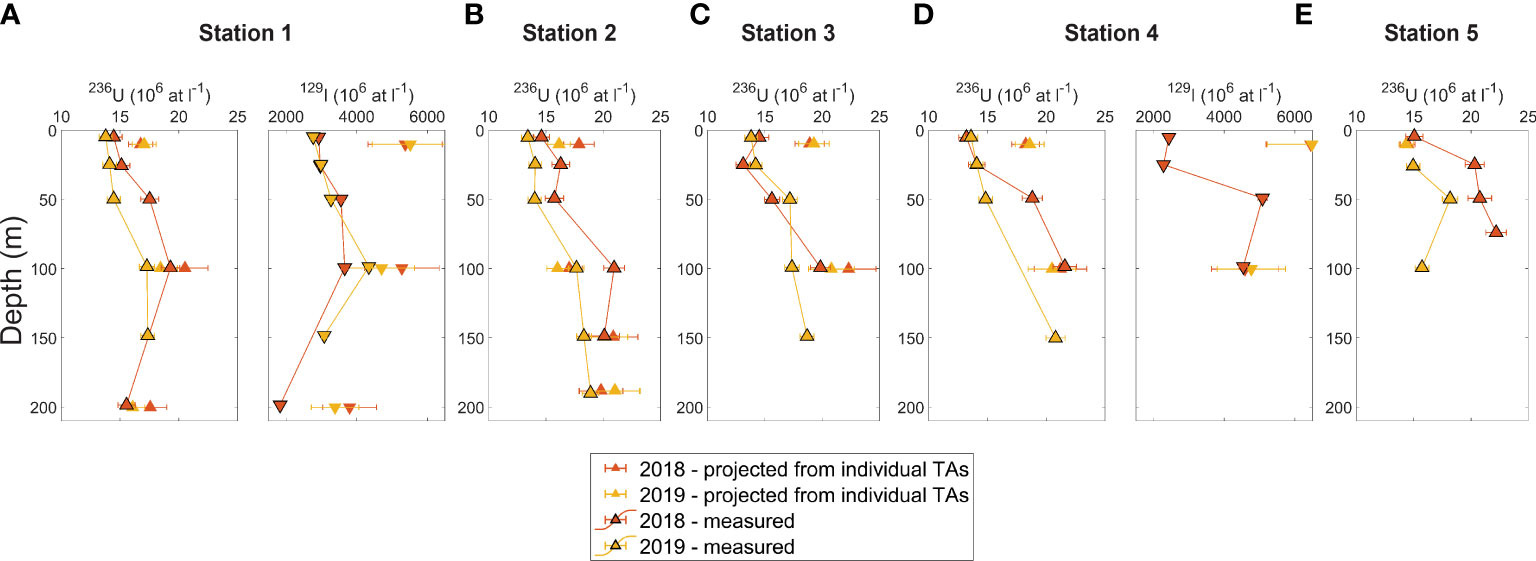
Figure 5 (A–E) Profiles of measured (data points with black outline) and projected (data points with no outline) 236U (and 129I for station 1 and 4) at matching stations for 2018 (red) and 2019 (yellow).
Overall, the transient nature of 129I and 236U (process (i) above) can hence explain the concentrations measured in 2018 and 2019 for most samples below 50 m depth. In shallower depths and for the deepest PSW samples of station 1, however, the 129I and 236U concentrations were lower than what was expected from the propagation of the input function signal, based on the tracer ages determined for 2016. We therefore conclude that this was due to a change in water mass composition, i.e., process (ii) introduced above.
4.2 Combination of 129I and 236U to investigate changes in the upper EGC water mass composition
For the use of 129I and 236U to investigate changes in the water mass composition, we expanded the previously introduced binary mixing model to include all water masses (i.e., endmembers) expected in the upper EGC. Classically, these were Pacific- and Atlantic-derived water, meteoric water and sea-ice melt (e.g., Dodd et al., 2012; Rabe et al., 2013). For the 129I-236U mixing model, two new aspects need to be addressed:
(i) There are two different “Atlantic Water” endmembers in the 236U-129I tracer space. Water of Atlantic origin found in the upper EGC has either been advected from the Eurasian Basin surface layer or corresponds to the RAC carrying the recirculated WSC tracer signal. This is of special importance on the north-east Greenland shelf (Figure 4A, station 1), where the presence of RAC has been identified based on potential temperature and salinity characteristics in earlier studies (e.g., Schaffer et al., 2017). 129I and 236U concentrations in Eurasian Basin surface water are related to the NCC input function, whereas the RAC is expected to carry the tracer signal defined for the FSBW input function (Casacuberta et al., 2018). Consequently, the upper water column of the EGC has to be considered as a mixture of five endmembers here: Atlantic-derived water that has circulated through the Eurasian Basin in the Arctic Ocean surface layer (ATL), Pacific-derived water (PAC), meteoric water (MW), sea-ice meltwater (SIM) and recirculating Atlantic Water (RAC) (Table 1). While this generally complicates the quantification of endmember fractions, it also provides a unique advantage of 129I and 236U, namely the possibility to distinguish between the two “Atlantic Water” endmembers. Note that in the following, the term “Atlantic-derived water” (ATL) will be used when referring to the Atlantic-origin waters advected from the Eurasian Basin only. Atlantic Water recirculating in Fram Strait will be referred to as RAC.
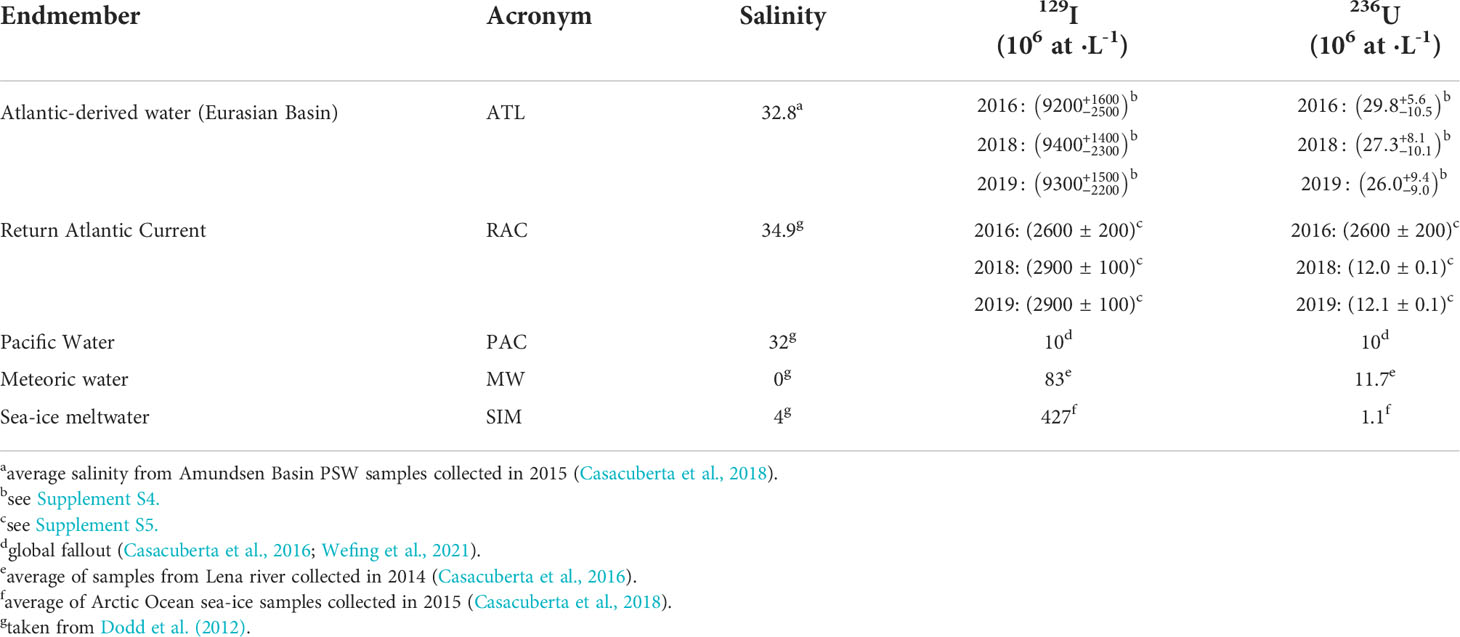
Table 1 Endmembers and corresponding salinity, 129I, and 236U concentration used in steady-state mixing models for PSW samples.
To obtain the transient tracer signal for ATL, the NCC input function was diluted 50:50 with the global fallout background signal (Figure S4). This was necessary since Wefing et al. (2021) found that a dilution of about 50% of the NCC input function with global fallout background occurs between the initialization point of the NCC input function (Barents Sea opening) and the surface of the Amundsen Basin. A fraction of about 50% Pacific Water is not very likely to be found in that part of the Arctic Ocean, hence a dilution with Pacific Waters cannot explain the lower concentrations found in the Amundsen Basin compared to the NCC input function. Instead, we suggest that a mixture of the NCC input function with the BSBW or FSBW input function (which carry a higher proportion of global fallout compared to the NCC, Casacuberta et al. (2018)) takes place in the Barents Sea, effectively reducing the 129I and 236U signal transported to the Eurasian Basin surface layer.
(ii) The ATL and RAC endmembers are not constant in time. The transient nature of 129I and 236U in Atlantic Water was used above to determine tracer ages. To asses temporal changes in the contribution of different endmembers in Fram Strait, however, we defined steady-state ATL and RAC endmembers for each sampling year (details are outlined in Supplement S4). A steady-state ATL water endmember was estimated using the mean tracer age of the subset of PSW samples from 2016 (15±4 years). Tracer ages determined from the few available combined 129I and 236U samples from 2018 and 2019 were in a similar range as those for 2016 (Figures S3B, C), hence we decided to use the same mean tracer age for all three years. A mean ATL concentration was then calculated taking the range of mean tracer age ± standard deviation and averaging over the corresponding years of the time-dependent ATL endmember defined above. Note that the result is different for each sampling year, since the mean tracer age is subtracted from the respective sampling year. Details are outlined in Supplement S4. To estimate an uncertainty range of the steady-state ATL endmember, we used the minimum and maximum tracer age from 2016 to obtain minimum and maximum estimates of the ATL concentration (see Table 1 and Supplement S4). For the RAC endmember, 129I and 236U concentrations from the FSBW input function defined in Casacuberta et al. (2018) of the corresponding sampling year were used (see Table 1 and Supplement S5).
For each sampling year, the endmembers outlined above were plotted in 236U vs. 129I tracer space with PSW data on top, color-coded by potential density (Figure 6). The ATL endmember was characterized by highest concentrations of both radionuclides. The RAC endmember carried significantly higher 129I concentrations compared to the PAC endmember but similar 236U concentrations as PAC. For the SIM endmember, we used an average of all sea-ice data presented in Casacuberta et al. (2018), which was characterized by low 129I and 236U concentrations. The MW endmember in principle includes both river water and glacial melt, but 129I and 236U data was only available for the Lena river draining into the Kara Sea (Casacuberta et al., 2016). Note that the temporal variability of this data is not known. As a best guess, we therefore used an average of all river data from Casacuberta et al., 2016, which plotted close to the PAC endmember.
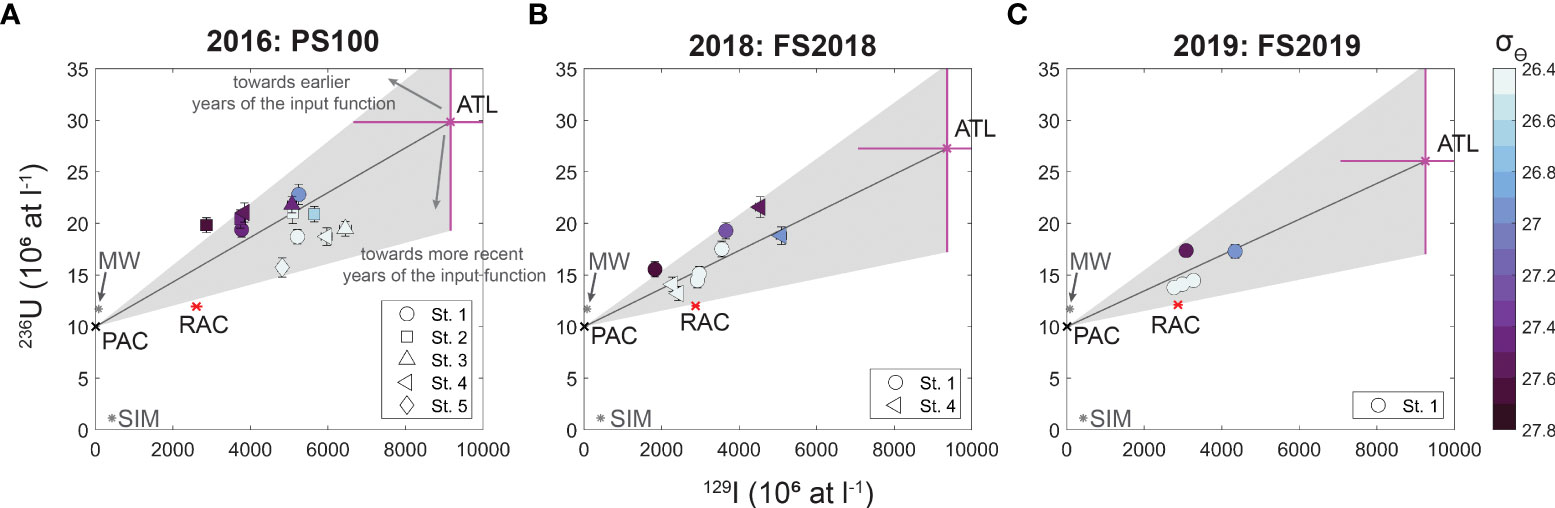
Figure 6 236U-129I steady state mixing models for 2016 (A), 2018 (B), 2019 (C). For the ATL endmember, the magenta symbol shows the mean, error bars correspond to a minimum and maximum estimate to account for the transient nature of the ATL input function (see Table 1 and Supplement S4). The gray area illustrates the range of PAC-ATL mixing lines including this uncertainty. PSW samples from matching stations between the three sampling years (Figure 4A) are plotted on top, color coded by potential density (σΘ). Different symbols refer to different stations. Acronyms are explained in Table 1.
Samples with low potential densities (σΘ<26.5 ) largely fell on or close to the PAC-ATL mixing line for 2018 and 2019 and partly below in 2016 (Figure 6). The sample with lowest 236U concentration in 2016 (Figure 6A, st. 5), plotting significantly below the PAC-ATL mixing line, had a lower tracer age compared to the other samples and was hence in line with more recent years of the input function (indicated by the gray arrow in Figure 6A; more recent years were characterized by lower 236U concentrations). Samples with higher densities generally plotted above the ATL-PAC mixing line, implying higher 236U concentrations (and relatively lower 129I) than expected. They rather fell on mixing lines of PAC with earlier years of the ATL input function (earlier years were characterized by higher 236U concentrations). This was in agreement with an increase of tracer ages with depth, i.e., the presence of older components of the ATL input function (see Supplement Table S1). Overall, almost all samples fell in the range spanned by the uncertainties of the ATL endmember defined above. From 2016 to 2019, an overall decrease of 129I and 236U concentrations was observed in the mixing plots. This translates to a shift of all samples towards the PAC and RAC endmember, implying a decrease in the ATL fraction over time (Figure 6).
The combination of 129I and 236U is a powerful tracer pair to distinguish PAC and ATL, i.e., Pacific-and Atlantic origin waters advected from the Arctic Ocean, as already shown in earlier studies (Casacuberta et al., 2016; Wefing et al., 2021). With the presence of RAC in Fram Strait, however, this tracer pair alone cannot distinguish if the decrease in the ATL fraction was counterbalanced by an increased proportion of the PAC, or the RAC endmember. The latter plots close to the PAC-ATL mixing line in 236U-129I tracer space. The fact that 236U and 129I showed similar trends for the three endmembers (PAC, ATL, RAC) implies that the combination of both does not significantly improve the endmember differentiation compared to using either 129I or 236U alone. Instead, the combined use of one radionuclide with another tracer having different endmember values for PAC and RAC, such as salinity, could provide more insights. In earlier studies on the Arctic Ocean, salinity was mainly used together with δ 18O to distinguish saline (i.e., PAC or ATL) waters from MW and SIM (e.g., Yamamoto-Kawai et al., 2008). Here we use it together with 236U and 129I, respectively, to differentiate PAC from RAC.
4.3 Combination of salinity with 236U and 129I to quantify water mass fractions
The endmembers discussed above were hence plotted in 236U vs. salinity (Figures 7A-C) and 129I vs. salinity (Figures 7D-F) tracer space, overlaid by the PSW data. Note the higher number of 236U data points compared to 129I. Mixing lines connect PAC, ATL, and RAC. For ATL, the mean salinity determined from the Amundsen Basin surface samples collected in 2015 was used as the endmember value, salinities of the other endmembers were taken from Dodd et al. (2012) (see Table 1). In the mixing plot, PAC and RAC were well distinguished by salinity, whereas 236U or 129I served to distinguish ATL from both. Dilution with the MW and SIM endmembers, both characterized by very low salinities, was indicated with mixing lines from PAC and ATL.
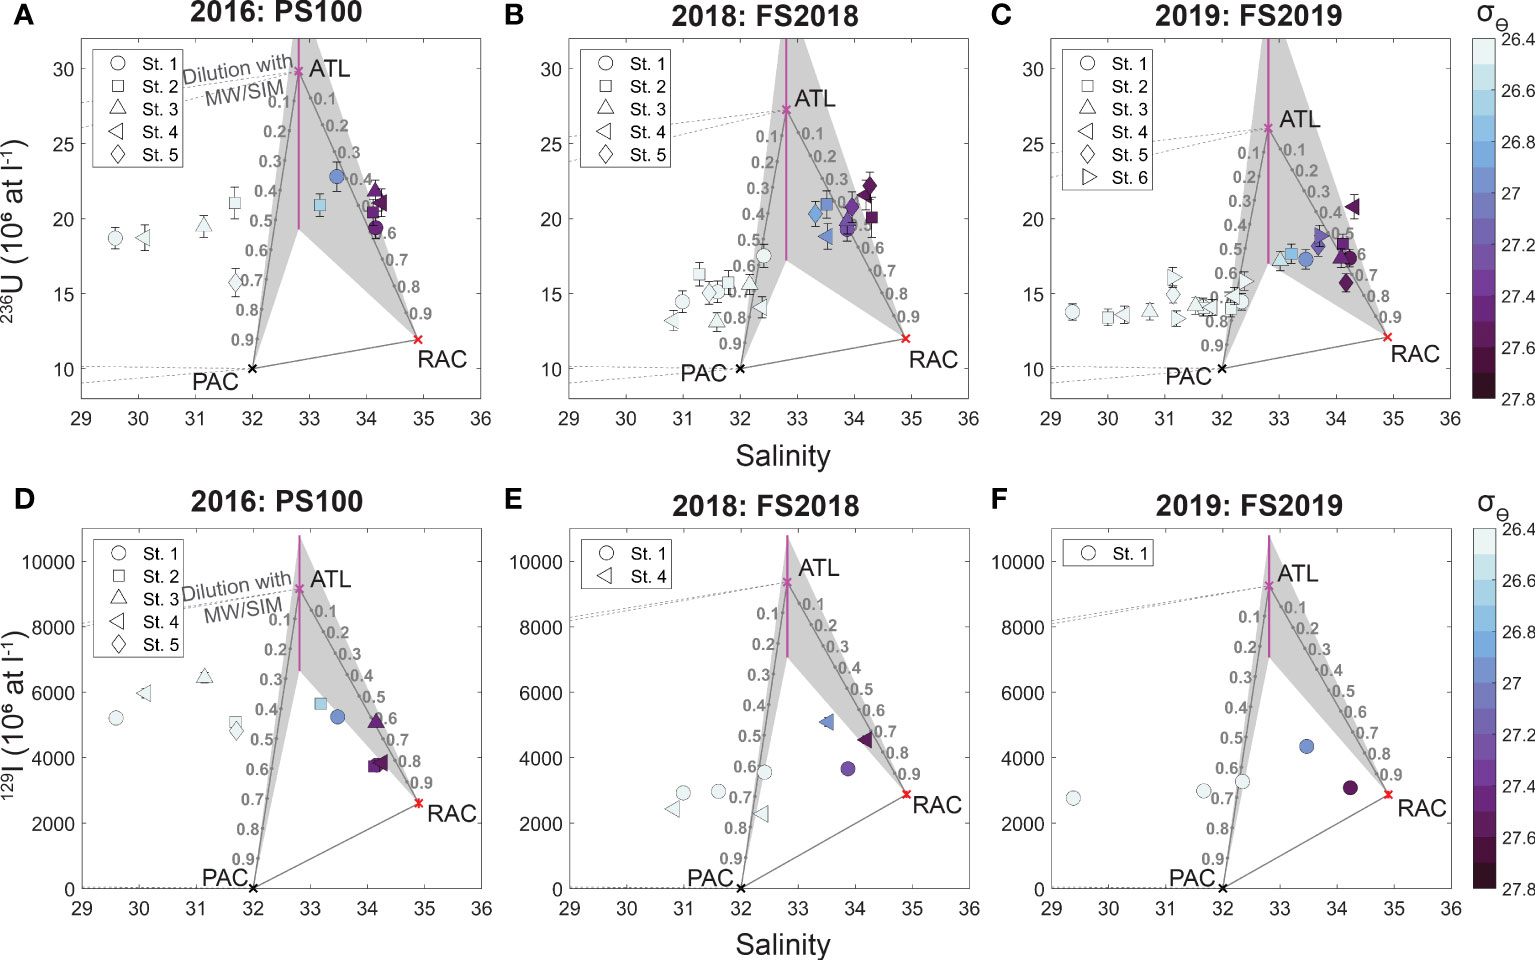
Figure 7 236U-Salinity (A–C) and 129I-Salinity (D–F) steady state mixing models for 2016, 2018, 2019. PSW samples from matching stations between the three sampling years (Figure 4A) are plotted on top, color coded by potential density (σΘ). Numbers along the PAC-ATL and RAC-ATL mixing lines denote fractions of PAC and RAC waters, respectively. Note the better data coverage for 236U compared to 129I. Different symbols refer to different stations. Acronyms are explained in Table 1.
Samples with lowest potential densities (σΘ<26.5 ) had low salinities and largely plotted left of the ATL-PAC mixing line for all sampling years and for both tracer combinations (Figure 7). This was probably caused by a dilution with SIM and/or MW. SIM and MW fractions calculated from available salinity and δ 18O data for 2016 ranged up to −10% and 15%, respectively (the negative fractions imply upstream formation of sea-ice; see Supplement S6). Although the low-density samples did not plot directly on the PAC-ATL mixing line, rough estimates for their PAC (or ATL) fractions could still be obtained. 236U-salinity and 129I-salinity mixing plots for each year largely showed a similar range for these samples. In 2016, Pacific Water fractions ranged between 30-70% (Figures 7A–D) and increased to about 60-90% in 2018 and 2019 (Figures 7B–F). The combination of 236U or 129I with salinity hence pointed to an increase in the PAC fraction in the uppermost layer of the EGC from 2016 to 2018/19 of about 20%.
For samples with higher densities (σΘ>26.5), the 236U-salinity and 129I-salinity mixing plots showed different fractions. In the former, samples plotted closer to the ATL endmember for all sampling years (Figures 7A–C). In the 129I-salinity mixing plot, the same samples plotted close to the RAC endmember instead, implying only very low fractions of ATL (Figures 7D–F). In 236U-salinity space, highest-density PSW samples (σΘ>27) plotted right of the ATL-RAC mixing line and partly also outside the uncertainty band. This points to an inaccurate definition of the ATL or RAC endmember, suggesting that both or one of the two are in fact characterized by higher 236U concentrations. In contrast, in the 129I-salinity mixing plot, almost all samples with σΘ>26.5 plotted inside the domain (Figures 7D–F), pointing to a reasonable definition of the endmembers. RAC fractions estimated from the 129I-salinity combination reached up to 90% for some samples, suggesting almost no ATL. If these fractions are valid is difficult to assess, since we are not aware of any other tracer to estimate RAC fractions in the western Fram Strait.
The significant differences observed between the tracer combinations for dense samples in PSW suggest that the definition of the RAC and/or ATL endmembers have to be improved. Especially the ATL endmember is difficult to assess due to the transient tracer signal and the long travel times of waters from the Barents Sea Opening, where the NCC tracer input function was defined, through the Arctic Ocean to Fram Strait. Generally, the fact that samples largely plot inside the domain for the 129I-salinity combination indicates that the 129I endmember values are more reliable compared to 236U. This might be due to the GF background signal for 236U, which is not of concern for 129I. In addition, the dynamic range between RAC and ATL is larger for 129I compared to 236U.
Despite the inaccuracy in the RAC and ATL endmembers and the inconsistency between absolute fractions derived from 236U or 129I, the observed temporal trends in ATL vs. RAC fractions of dense PSW samples were similar for both. From 2016 to 2018/19, a slight increase in the RAC fraction of about 10-20% was evident. For denser PSW (σΘ>26.5 ), the combination of 236U or 129I with salinity hence pointed to an increase in the RAC fraction from 2016 to 2018/19, counterbalancing a decrease in ATL.
4.4 Comparison to earlier studies
The combination of 129I, 236U, and hydrographic data revealed changes in the water mass composition of the EGC between 2016 and 2019, which could likely be attributed to an increase in the Pacific Water fraction in shallow (low-density) samples as well as an increase in recirculating Atlantic Water below. Significant year-to-year variations in Pacific Water fractions exported through Fram Strait were also observed in earlier studies based on the combination of salinity, δ 18O, and nutrient measurements (Falck et al., 2005; Dodd et al., 2012). Although the reliability of quantifying absolute Atlantic and Pacific Water fractions based on nitrate-to-phosphate ratios is under debate (e.g., Alkire et al., 2019), time series of tracer measurements still provide insights into the temporal variability of different water mass fractions. For the years of available 129I and 236U data, δ 18O, nitrate, and phosphate measurements are only available for 2016, hence we cannot compare the temporal trends observed in 129I and 236U to nutrient-based estimates.
Changes in freshwater transport through Fram Strait were also derived from a mooring array in the EGC at about 79° N, which allows for a continuous monitoring of salinity and velocity. Between 1977 and 2015, significant variations in freshwater transport were observed (de Steur et al., 2018). Since 2015, freshwater transport in the EGC has been decreasing, which was related to a salinification of lower halocline waters counterbalancing a freshening of the top layer (Karpouzoglou et al., 2022). Based on the mooring data alone, it could not be determined if this “Atlantification” of the western Fram Strait was caused by an increase in Atlantic Water recirculation or in advection of Atlantic-origin waters from the Eurasian Basin. The temporal changes observed in 129I and 236U concentration presented here, combined salinity, clearly point to an increase in recirculation (i.e., the RAC endmember), instead of more Eurasian Basin waters (i.e., ATL), especially for station 1 in Norske Trough. Since increased recirculation was not directly observed in the mooring data (Karpouzoglou et al., 2022), it most likely occurred north of the section considered here.
The water mass composition in the EGC is closely linked to the upstream ocean dynamics (e.g., Dodd et al., 2012; Rabe et al., 2013), hence changes observed in outflowing waters in Fram Strait relate to changes in the Arctic Ocean circulation pattern. This includes the variability of Pacific Water advection pathways, freshwater build-up within, and release from, the Beaufort Gyre, as well as variability in the advection of river water. Karpouzoglou et al. (2022) reported on a direct correlation between Beaufort Gyre freshwater content and southward freshwater transport through Fram Strait between 2003 and 2019. It has also been suggested that these changes are at least partly related to the state of atmospheric circulation, classically characterized by the Arctic Oscillation (AO) index (e.g., Morison et al., 2012). This finding was supported by the eastward shift of the PSW-AW interface (i.e., in- and outflowing waters) between 2018 and 2019, that was observed in the data presented here. Taking the eastward extension of the 15×106 at·L−1 236U isoline as a measure of the PSW extent, the interface shifted by about 3° in longitude in the surface layer (about 0−100 m depth), whereas deeper layers did not change significantly (Figures 3J–L). A possible explanation is the faster response of the surface layer to changes in atmospheric circulation patterns while deeper layers were less affected. The shift in the surface layer was also observed in hydrographic data, however, for deeper layers the 236U concentration provided a more reliable measure of the eastward extent of Arctic-derived waters.
4.5 Strengths and limitations of the 129I-236U tracer pair to determine water mass composition in Fram Strait
The 129I-236U tracer pair is a novel approach for the quantification of water mass fractions exiting Fram Strait in the EGC, which provided promising results in the pilot study presented here. However, some limitations of this approach should be taken into account. A weakness of both radionuclides regarding their use as water mass composition tracers lies in their time-dependent Atlantic Water input function. For the steady-state mixing models presented here, the ATL endmember was estimated taking the upstream circulation processes into account. This can be achieved by using both tracers for an estimation of circulation times and dilution processes that alter the tracer signal of the input function. In this regard, a better understanding of the evolution of Atlantic Waters during their passage through the Arctic Ocean would be beneficial, which could be achieved through an intensified sampling program including 129I and 236U, as well as the incorporation of both tracers into circulation models as in Karcher et al. (2012) and Smith et al. (2021).
Since the 129I and 236U endmembers of MW and SIM are not well constrained, the effect of dilution with those waters was not investigated in detail here. Especially for samples close to Greenland, dilution with glacial meltwater probably plays a more important role. When considering the temporal changes in the water mass composition between 2016 and 2019, however, the influence of MW and SIM is negligible since it affects samples from all years and is not expected to have changed significantly during this timeframe.
In contrast to other tracers used to distinguish Atlantic- and Pacific-origin components in Arctic Ocean surface waters (e.g., N:P ratios, NO*, Gallium), 129I and 236U tracer signals are different for recirculating Atlantic Waters in Fram Strait and those advected from the Eurasian Basin. On one hand, this complicates the quantification of water mass fractions in the EGC, since it introduces another endmember compared to classical approaches. However, it also provides the opportunity to differentiate both Atlantic-derived waters. Differentiating the origin of waters in the EGC is important to understand the dynamics behind the “Atlantification” of the western Fram Strait (Karpouzoglou et al., 2022). An increase in recirculating waters can lead to increased heat transport towards the Greenland shelf, where it impacts glacial melt processes (Schaffer et al., 2017), or increased southward heat transport towards the sub-polar North Atlantic. Changes in the origin of Atlantic Waters will likely also impact nutrient dynamics and primary production in the EGC (Tuerena et al., 2021).
5 Conclusions
We presented a time-series of 129I and 236U measurements from Fram Strait, covering the years 2016, 2018, and 2019. The combination of both radionuclides was used together with hydrographic data to identify and investigate changes in the water mass composition of the upper EGC. The overall distribution of both radionuclides was similar among all three years, clearly highlighting differences in 129I and 236U concentrations between inflowing Atlantic Water and outflowing Arctic Water, as well as differences between the surface layer and the mid-depth Atlantic layer. In the upper water column of the EGC, composed of PSW, temporal variations were observed. Especially between 2016 and 2018, 129I and 236U concentrations in the upper 100 m depth decreased substantially.
129I-236U-based tracer ages from the entrance to the Arctic Ocean to Fram Strait were estimated to account for the transient nature of the input functions of both tracers. We concluded that the observed changes in the upper 50 m of PSW between 2016 and 2019 could not be attributed to changes in the input function alone, but were caused by a change in the water mass composition of the EGC. 129I and 236U were therefore combined in a steady-state mixing model in order to investigate the proportions of Pacific and Atlantic-derived waters in both sampling years. It was found that both radionuclides alone do not serve to estimate Pacific Water fractions in Fram Strait due to the presence of recirculating Atlantic Water, which carries a similar tracer signal. Using the combination of 129I and 236U with salinity instead, we found an increase in Pacific Water in shallow PSW samples between 2016 and 2019. At the same time, an increase in recirculating Atlantic Water was observed for samples below. The fraction of Atlantic Waters advected from the Eurasian Basin decreased over time in all PSW samples.
The Arctic region is already undergoing major changes as a consequence of anthropogenic climate change, which are only expected to become even more severe in the future. Changes in the freshwater budget and freshwater export to the North Atlantic via the EGC might have a substantial impact on the Atlantic Meridional Overturning Circulation. 129I and 236U proved to be useful tracers for the origin of waters exported through Fram Strait. In the future, combining anthropogenic radionuclides with other water mass tracers that are emerging as an alternative to nutrient relationships, such as dissolved Gallium or Nd isotopes (Whitmore et al., 2020; Paffrath et al., 2021), could help to further disentangle water masses. This requires a coordinated sampling effort during upcoming expeditions, as well as specifically targeting the endmembers of 129I and 236U. Generally, the use of 129I and 236U to quantify water masses is expected to become less complicated further upstream, in the central Arctic Ocean, closer to the source region of both tracers.
Data availability statement
The original datasets presented in this study can be found in the Supplementary Material (Table S1).
Author contributions
A-MW and NC contributed to conception and design of the study. A-MW performed investigation, formal analysis, and wrote the original draft of the manuscript. MC and NC performed AMS measurements and supported investigation and formal analysis. NC supervised the study and acquired funding. PD supported sample collection during expeditions FS2018 and FS2019 and provided hydrographic data. All authors contributed to manuscript revision and approved the submitted version.
Funding
Anne-Marie Wefing received funding from the ETH Doctoral Grant ETH-06 16-1 “Combining U-236 with other multi-sourced anthropogenic tracers as a new tool to study ocean circulation”. Núria Casacuberta’s research was supported by the Swiss National Science Foundation (AMBIZIONE PZ00P2_154805 and PRIMA PR00P2_193091), the European Research Council (ERC) under the European Union’s Horizon 2020 research and innovation programme (Grant agreement No. GAP-101001451), and the Laboratory of Ion Beam Physics at ETH Zurich, which is partially funded by its consortium partners EAWAG, EMPA and PSI. Statement: Open access funding provided by ETH Zurich
Acknowledgments
The authors acknowledge captain and crew of the RV Kronprins Haakon as well as all people involved in the sampling activities across Fram Strait. Special thanks go to Christof Vockenhuber for support with 129I measurements. This publication was adapted from Chapter 5 of the doctoral thesis by A-MW (Wefing, 2021).
Conflict of interest
The authors declare that the research was conducted in the absence of any commercial or financial relationships that could be construed as a potential conflict of interest.
Publisher’s note
All claims expressed in this article are solely those of the authors and do not necessarily represent those of their affiliated organizations, or those of the publisher, the editors and the reviewers. Any product that may be evaluated in this article, or claim that may be made by its manufacturer, is not guaranteed or endorsed by the publisher.
Supplementary material
The Supplementary Material for this article can be found online at: https://www.frontiersin.org/articles/10.3389/fmars.2022.973507/full#supplementary-material
References
Alkire M. B., Morison J., Andersen R. (2015). Variability in the meteoric water, sea-ice melt, and pacific water contributions to the central Arctic ocean 2000-2014. J. Geophysical Research: Oceans 120, 1573–1598. doi: 10.1002/2014JC010023
Alkire M. B., Rember R., Polyakov I. (2019). Discrepancy in the identification of the Atlantic/Pacific front in the central Arctic ocean: NO versus nutrient relationships. Geophys. Res. Lett. 46, 3843–3852. doi: 10.1029/2018GL081837
Arndt J. E., Jokat W., Dorschel B., Myklebust R., Dowdeswell J. A., Evans J. (2015). A new bathymetry of the northeast Greenland continental shelf: Constraints on glacial and other processes. Geochem. Geophys. Geosyst. 16, 3733–3753. doi: 10.1002/2015GC005931
Årthun M., Eldevik T., Smedsrud L. H. (2019). The role of Atlantic heat transport in future Arctic winter Sea ice loss. J. Climate 32, 3327–3341. doi: 10.1175/JCLI-D-18-0750.1
Bauch D., van der Loeff M. R., Andersen N., Torres-Valdes S., Bakker K., Abrahamsen E. P. (2011). Origin of freshwater and polynya water in the Arctic ocean halocline in summer 2007. Prog. Oceanography 91, 482–495. doi: 10.1016/j.pocean.2011.07.017
Beszczynska-Möller A., Woodgate R., Lee C., Melling H., Karcher M. (2011). A synthesis of exchanges through the main oceanic gateways to the Arctic ocean. Oceanography 24, 82–99. doi: 10.5670/oceanog.2011.59
Casacuberta N., Christl M., Vockenhuber C., Wefing A.-M., Wacker L., Masqué P., et al. (2018). Tracing the three Atlantic branches entering the Arctic ocean with 129I and 236U. J. Geophysical Research: Oceans 123, 6909–6921. doi: 10.1016/j.epsl.2016.02.020
Casacuberta N., Masqué P. G., Henderson M., Rutgers van-der-Loeff D., Bauch C., Vockenhuber A., et al (2016). First 236U Data from the Arctic Ocean and Use of 236U/238U and 129I/236U as a New Dual Tracer. Earth and Planetary Science Letters 440, 127–34. doi: 10.1016/j.epsl.2016.02.020
Christl M., Casacuberta N., Lachner J., Maxeiner S., Vockenhuber C., Synal H.-A., et al. (2015a). Status of 236U analyses at ETH Zurich and the distribution of 236U and 129I in the north Sea in 2009. Nucl. Instruments Methods Phys. Res. Section B: Beam Interact. Materials Atoms 361, 510–516. doi: 10.1016/j.nimb.2015.01.005
Christl M., Casacuberta N., Vockenhuber C., Elsässer C., Bailly du Bois P., Herrmann J., et al. (2015b). Reconstruction of the 236U input function for the northeast Atlantic ocean: Implications for 129I/236U and 236U/238U-based tracer ages. J. Geophysical Research: Oceans 120, 7282–7299. doi: 10.1002/2015JC011116
de Steur L., Hansen E., Mauritzen C., Beszczynska-Möller A., Fahrbach E. (2014). Impact of recirculation on the East Greenland current in fram strait: Results from moored current meter measurements between 1997 and 2009. Deep Sea Res. Part I: Oceanographic Res. Papers 92, 26–40. doi: 10.1016/j.dsr.2014.05.018
de Steur L., Peralta-Ferriz C., Pavlova O. (2018). Freshwater export in the East Greenland current freshens the north Atlantic. Geophys. Res. Lett. 45, 13,359–13,366. doi: 10.1029/2018GL080207
de Steur L., Pickart R. S., Macrander A., Våge K., Harden B., Jónsson S., et al. (2017). Liquid freshwater transport estimates from the East Greenland current based on continuous measurements north of Denmark strait. J. Geophys. Res. Oceans 122, 93–109. doi: 10.1002/2016JC012106
de Steur L., Pickart R. S., Torres D. J., Valdimarsson H. (2015). Recent changes in the freshwater composition east of Greenland. Geophys. Res. Lett. 42, 2326–2332. doi: 10.1002/2014GL062759
Dodd P. A., Heywood K. J., Meredith M. P., Naveira-Garabato A. C., Marca A. D., Falkner K. K. (2009). Sources and fate of freshwater exported in the East Greenland current. Geophysical Res. Lett. 36, L19608. doi: 10.1029/2009GL039663
Dodd P. A., Rabe B., Hansen E., Falck E., Mackensen A., Rohling E., et al. (2012). The freshwater composition of the fram strait outflow derived from a decade of tracer measurements. J. Geophysical Research: Oceans 117, C11005. doi: 10.1029/2012JC008011
Edmonds H. N., Zhou Z. Q., Raisbeck G. M., Yiou F., Kilius L., Edmond J. M. (2001). Distribution and behavior of anthropogenic 129I in water masses ventilating the north Atlantic ocean. J. Geophysical Research: Oceans 106, 6881–6894. doi: 10.1029/1999JC000282
Ekwurzel B., Schlosser P., Mortlock R. A., Fairbanks R. G., Swift J. H. (2001). River runoff, sea ice meltwater, and pacific water distribution and mean residence times in the Arctic ocean. J. Geophysical Research: Oceans 106, 9075–9092. doi: 10.1029/1999JC000024
Falck E., Kattner G., Budéus G. (2005). Disappearance of pacific water in the northwestern fram strait. Geophysical Res. Lett. 32, L14619. doi: 10.1029/2005GL023400
Forryan A., Bacon S., Tsubouchi T., Torres-Valdés S., Naveira Garabato A. C. (2019). Arctic Freshwater fluxes: Sources, tracer budgets and inconsistencies. Cryosphere 13, 2111–2131. doi: 10.5194/tc-13-2111-2019
Gascard J.-C., Raisbeck G., Sequeira S., Yiou F., Mork K. A. (2004). The Norwegian Atlantic current in the lofoten basin inferred from hydrological and tracer data (129I) and its interaction with the Norwegian coastal current. Geophysical Res. Lett. 31, L01308. doi: 10.1029/2003GL018303
Haine T. W., Curry B., Gerdes R., Hansen E., Karcher M., Lee C., et al. (2015). Arctic Freshwater export: Status, mechanisms, and prospects. Global Planetary Change 125, 13–35. doi: 10.1016/j.gloplacha.2014.11.013
Hattermann T., Isachsen P. E., von Appen W.-J., Albretsen J., Sundfjord A. (2016). Eddy-driven recirculation of Atlantic water in fram strait. Geophysical Res. Lett. 43, 3406–3414. doi: 10.1002/2016GL068323
Håvik L., Pickart R. S., Våge K., Torres D., Thurnherr A. M., Beszczynska-Möller A., et al. (2017). Evolution of the East Greenland current from fram strait to Denmark strait: Synoptic measurements from summer 2012. J. Geophysical Research: Oceans 122, 1974–1994. doi: 10.1002/2016JC012228
Holliday N. P., Bersch M., Berx B., Chafik L., Cunningham S., Florindo-López C., et al. (2020). Ocean circulation causes the largest freshening event for 120 years in eastern subpolar north Atlantic. Nat. Commun. 11, 585. doi: 10.1038/s41467-020-14474-y
Jones E. P., Anderson L. G., Jutterström S., Mintrop L., Swift J. H. (2008b). Pacific freshwater, river water and sea ice meltwater across Arctic ocean basins: Results from the 2005 beringia expedition. J. Geophys. Res. 113, C08012. doi: 10.1029/2007JC004124
Jones E., Anderson L., Jutterström S., Swift J. (2008a). Sources and distribution of fresh water in the East Greenland current. Prog. Oceanography 78, 37–44. doi: 10.1016/j.pocean.2007.06.003
Kanzow T. (2017). “The expedition PS100 of the research vessel POLARSTERN to the fram strait in 2016,” in Reports on polar and marine research (Bremerhaven: Alfred-Wegener-Institut).
Kanzow T., von Appen W.-J., Schaffer J., Köhn E., Tsubouchi T., Wilson N., et al. (2017). Physical oceanography measured on water bottle samples from CTD/Large volume Watersampler-system during POLARSTERN cruise PS100 (ARK-XXX/2). Bremerhaven, PANGAEA: Alfred Wegener Institute, Helmholtz Centre for Polar and Marine Research. doi: 10.1594/PANGAEA.871028
Karcher M., Smith J. N., Kauker F., Gerdes R., Smethie W. M. (2012). Recent changes in Arctic ocean circulation revealed by iodine-129 observations and modeling. J. Geophysical Research: Oceans 117, C08007. doi: 10.1029/2011JC007513
Karpouzoglou T., de Steur L., Smedsrud L. H., Sumata H. (2022). Observed changes in the Arctic freshwater outflow in fram strait. J. Geophysical Research: Oceans 127, e2021JC018122. doi: 10.1029/2021JC018122
Kawasaki T., Hasumi H. (2016). The inflow of Atlantic water at the fram strait and its interannual variability. J. Geophysical Research: Oceans 121, 502–519. doi: 10.1002/2015JC011375
Laukert G., Frank M., Bauch D., Hathorne E. C., Rabe B., von Appen W.-J., et al. (2017). Ocean circulation and freshwater pathways in the Arctic Mediterranean based on a combined Nd isotope, REE and oxygen isotope section across fram strait. Geochimica Cosmochimica Acta 202, 285–309. doi: 10.1016/j.gca.2016.12.028
Marnela M., Rudels B., Houssais M.-N., Beszczynska-Möller A., Eriksson P. B. (2013). Recirculation in the fram strait and transports of water in and north of the fram strait derived from CTD data. Ocean Sci. 9, 499–519. doi: 10.5194/os-9-499-2013
Morison J., Kwok R., Peralta-Ferriz C., Alkire M., Rigor I., Andersen R., et al. (2012). Changing Arctic ocean freshwater pathways. Nature 481, 66–70. doi: 10.1038/nature10705
Muilwijk M., Smedsrud L. H., Ilicak M., Drange H. (2018). Atlantic Water heat transport variability in the 20th century Arctic ocean from a global ocean model and observations. J. Geophys. Res. Oceans 123, 8159–8179. doi: 10.1029/2018JC014327
Münchow A., Schaffer J., Kanzow T. (2020). Ocean circulation connecting fram strait to glaciers off northeast Greenland: Mean flows, topographic rossby waves, and their forcing. J. Phys. Oceanogr. 50, 509–530. doi: 10.1175/JPO-D-19-0085.1
Newton R., Schlosser P., Mortlock R., Swift J., MacDonald R. (2013). Canadian Basin freshwater sources and changes: Results from the 2005 Arctic ocean section. J. Geophys. Res. Oceans 118, 2133–2154. doi: 10.1002/jgrc.20101
Owens S., Buesseler K., Sims K. (2011). Re-evaluating the 238U-salinity relationship in seawater: Implications for the 238U-234Th disequilibrium method. Mar. Chem. 127, 31–39. doi: 10.1016/j.marchem.2011.07.005
Paffrath R., Laukert G., Bauch D., Rutgers van der Loeff M., Pahnke K. (2021). Separating individual contributions of major Siberian rivers in the transpolar drift of the Arctic ocean. Sci. Rep. 11, 8216. doi: 10.1038/s41598-021-86948-y
Rabe B., Dodd P. A., Hansen E., Falck E., Schauer U., Mackensen A., et al. (2013). Liquid export of Arctic freshwater components through the fram strait 1998–2011. Ocean Sci. 9, 91–109. doi: 10.5194/os-9-91-2013
Rahmstorf S., Box J. E., Feulner G., Mann M. E., Robinson A., Rutherford S., et al. (2015). Exceptional twentieth-century slowdown in Atlantic ocean overturning circulation. Nat. Clim Change 5, 475–480. doi: 10.1038/nclimate2554
Richter M. E., von Appen W.-J., Wekerle C. (2018). Does the East Greenland current exist in the northern fram strait? Ocean Sci. 14, 1147–1165. doi: 10.5194/os-14-1147-2018
Rudels B., Anderson L., Eriksson P., Fahrbach E., Jakobsson M., Jones E. P., et al. (2012). “Observations in the ocean,” in Arctic Climate change, vol. vol. 43 . Eds. Lemke P., Jacobi H.-W. (Dordrecht: Springer Netherlands), 117–198.
Rudels B., Björk G., Nilsson J., Winsor P., Lake I., Nohr C. (2005). The interaction between waters from the Arctic ocean and the Nordic seas north of fram strait and along the East Greenland current: Results from the Arctic ocean-02 oden expedition. J. Mar. Syst. 55, 1–30. doi: 10.1016/j.jmarsys.2004.06.008
Schaffer J., von Appen W.-J., Dodd P. A., Hofstede C., Mayer C., de Steur L., et al. (2017). Warm water pathways toward nioghalvfjerdsfjorden glacier, northeast Greenland. J. Geophys. Res. Oceans 122, 4004–4020. doi: 10.1002/2016JC012462
Serreze M. C., Barrett A. P., Slater A. G., Woodgate R. A., Aagaard K., Lammers R. B., et al. (2006). The large-scale freshwater cycle of the Arctic. J. Geophysical Research: Oceans 111, C11010. doi: 10.1029/2005JC003424
Smith J. N., Karcher M., Casacuberta N., Williams W. J., Kenna T., Smethie W. M. (2021). A changing Arctic ocean: How measured and modeled 129I distributions indicate fundamental shifts in circulation between 1994 and 2015. J. Geophysical Research: Oceans 126, e2020JC016740. doi: 10.1029/2020JC016740
Smith J. N., McLaughlin F. A., Smethie W. M., Moran S. B., Lepore K. (2011). Iodine-129, 137Cs, and CFC-11 tracer transit time distributions in the Arctic ocean. J. Geophysical Res. 116, C04024. doi: 10.1029/2010JC006471
Terhaar J., Kwiatkowski L., Bopp L. (2020). Emergent constraint on Arctic ocean acidification in the twenty-first century. Nature 582, 379–383. doi: 10.1038/s41586-020-2360-3
Timmermans M.-L., Marshall J. (2020). Understanding Arctic ocean circulation: A review of ocean dynamics in a changing climate. J. Geophys. Res. Oceans 125, e2018JC014378. doi: 10.1029/2018JC014378
Tuerena R. E., Hopkins J., Buchanan P. J., Ganeshram R. S., Norman L., Appen W.-J., et al. (2021). An Arctic strait of two halves: The changing dynamics of nutrient uptake and limitation across the fram strait. Global Biogeochemical Cycles 35, e2021GB006961. doi: 10.1029/2021GB006961
Vockenhuber C., Casacuberta N., Christl M., Synal H.-A. (2015). Accelerator mass spectrometry of 129I towards its lower limits. Nucl. Instruments Methods Phys. Res. Section B: Beam Interact. Materials Atoms 361, 445–449. doi: 10.1016/j.nimb.2015.01.061
Wang Q., Wekerle C., Wang X., Danilov S., Koldunov N., Sein D., et al. (2020). Intensification of the Atlantic water supply to the Arctic ocean through fram strait induced by Arctic Sea ice decline. Geophys. Res. Lett. 47, e2019GL086682. doi: 10.1029/2019GL086682
Wefing A.-M. (2021). 129I and 236U as a new tracer pair to study water mass circulation in the arctic ocean and fram strait. Ph.D. thesis, ETH Zurich, Zurich. doi: 10.3929/ethz-b-000491713
Wefing A.-M., Casacuberta N., Christl M., Gruber N., Smith J. N. (2021). Circulation timescales of Atlantic water in the Arctic ocean determined from anthropogenic radionuclides. Ocean Sci. 17, 111–129. doi: 10.5194/os-17-111-2021
Wefing A.-M., Christl M., Vockenhuber C., Rutgers van der Loeff M., Casacuberta N. (2019). Tracing Atlantic waters using 129I and 236U in the fram strait in 2016. J. Geophysical Research: Oceans 124, 882–896. doi: 10.1029/2018JC014399
Wekerle C., Wang Q., Danilov S., Schourup-Kristensen V., von Appen W.-J., Jung T. (2017). Atlantic Water in the Nordic Sea: Locally eddy-permitting ocean simulation in a global setup. J. Geophysical Research: Oceans 122, 914–940. doi: 10.1002/2016JC012121
Whitmore L. M., Pasqualini A., Newton R., Shiller A. M. (2020). Gallium: A new tracer of pacific water in the Arctic ocean. J. Geophys. Res. Oceans 125, e2019JC015842. doi: 10.1029/2019JC015842
Keywords: radionuclides, tracers, Fram Strait, water mass, East Greenland current
Citation: Wefing A-M, Casacuberta N, Christl M and Dodd PA (2022) Water mass composition in Fram Strait determined from the combination of 129I and 236U: Changes between 2016, 2018, and 2019. Front. Mar. Sci. 9:973507. doi: 10.3389/fmars.2022.973507
Received: 20 June 2022; Accepted: 03 August 2022;
Published: 07 September 2022.
Edited by:
Gilles Reverdin, Centre National de la Recherche Scientifique (CNRS), FranceReviewed by:
Tsuneo Ono, Japan Fisheries Research and Education Agency (FRA), JapanPaul Myers, University of Alberta, Canada
Copyright © 2022 Wefing, Casacuberta, Christl and Dodd. This is an open-access article distributed under the terms of the Creative Commons Attribution License (CC BY). The use, distribution or reproduction in other forums is permitted, provided the original author(s) and the copyright owner(s) are credited and that the original publication in this journal is cited, in accordance with accepted academic practice. No use, distribution or reproduction is permitted which does not comply with these terms.
*Correspondence: A.-M. Wefing, YW5uZW1hcmllLndlZmluZ0B1c3lzLmV0aHouY2g=