
95% of researchers rate our articles as excellent or good
Learn more about the work of our research integrity team to safeguard the quality of each article we publish.
Find out more
ORIGINAL RESEARCH article
Front. Mar. Sci. , 24 August 2022
Sec. Marine Evolutionary Biology, Biogeography and Species Diversity
Volume 9 - 2022 | https://doi.org/10.3389/fmars.2022.968666
 Li Qihang1
 Chai Yuanming1
 Shao Qianwen1,2Wang Zaiming1
 Xie Wei3
 Zhou Yadong1,4Sun Dong1,4
 Xie Xiaohui1,4,5
 Zhang Dongsheng1,4,5*
Planktonic larvae (meroplankton) plays an important role in both benthic and pelagic ecosystems. The meroplankton study of South China Sea (SCS) and Philippine Sea (PS) may be particularly important, where they could serve as vectors for the influx of Pacific species into the East Indies Triangle (global marine biodiversity center). Here, we employed a metabarcoding method to investigate the geographical distribution pattern of meroplankton among SCS and PS. Different primers and reference databases were tested, for a better and more reliable interpretation of the current results and improvement of the method. In this study, metabarcoding was efficient for meroplankton study with high taxonomic resolution and good accuracy. COI against NCBI NT database showed the best taxonomy annotation efficiency, followed by 18S V1-V2, then 18S V4. The SILVA database showed similar performance to the NCBI NT database for the two 18S primers. The meroplankton diversity of SCS is higher than that of PS, and both communities are dominated by Polychaeta, Mollusca, Arthropoda and Echinodermata. Meroplankton geographical patterns are significantly different between the two basins, possibly due to the different distribution of their benthic adult, as well as the influence of five key environmental factors (IC, SCM, SST, SSS and DO). Our results suggest that the unidirectional Kuroshio Current intrusion may play an important role in shaping the biogeographical pattern in the west Pacific, by facilitating planktonic-larvae flowing into the northern SCS from the Pacific, on the contrary, limiting planktonic-larvae spreading out.
Most benthic invertebrates have a planktonic larval stage, during which they spend hours to months in the water column before settling to the seabed. These planktonic larvae, known as meroplankton, usually constitute a large portion of zooplankton communities in pelagic ecosystems (Shanks et al., 2002; Hidalgo et al., 2014; Gluchowska et al., 2016), potentially competing for resources with holoplanktonic species and serving as food source for predators (Allen, 2008; Short et al., 2013). More importantly, meroplankton plays a key role in the dispersal of the benthic adults, determining their potentials to colonize adjacent habitats and contributing to the connectivity among spatially isolated populations (Cowen and Sponaugle, 2009; Hilário et al., 2015; Ershova et al., 2019). The planktonic phase also provides the benthic invertebrates with access to food in the productive upper water column, reduces intra- and interspecific competition, avoids predation by abundant benthic omnivores, and reduces inbreeding (Pechenik, 1999; Palumbi, 2003).
The South China Sea (SCS) and the Philippine Sea (PS) are two adjacent deep-sea basins located in the Indo-Pacific region (Figure 1). The Kuroshio Current (KC) intrudes from the PS through Luzon Strait to the northern SCS all year round, with stronger magnitude in winter than in summer (Nan et al., 2015). About 4Sv of Pacific water flows into the SCS through the Luzon Strait every year (Qu et al., 2000), which significantly alters the circulation structure (Yuan et al., 2007; Yuan et al., 2009) and nutrient distribution (Du et al., 2013) of northern SCS, and also carries a large amount of meroplankton. In this area, meroplankton can serve as vectors for the inflow of Pacific species into the East Indies Triangle (global marine biodiversity center). For sessile or less-mobile benthic invertebrates, meroplankton transport is the only apparent mechanism by which this expansion can occur (Renaud et al., 2015), which also makes meroplankton community studies of SCS and PS critical.
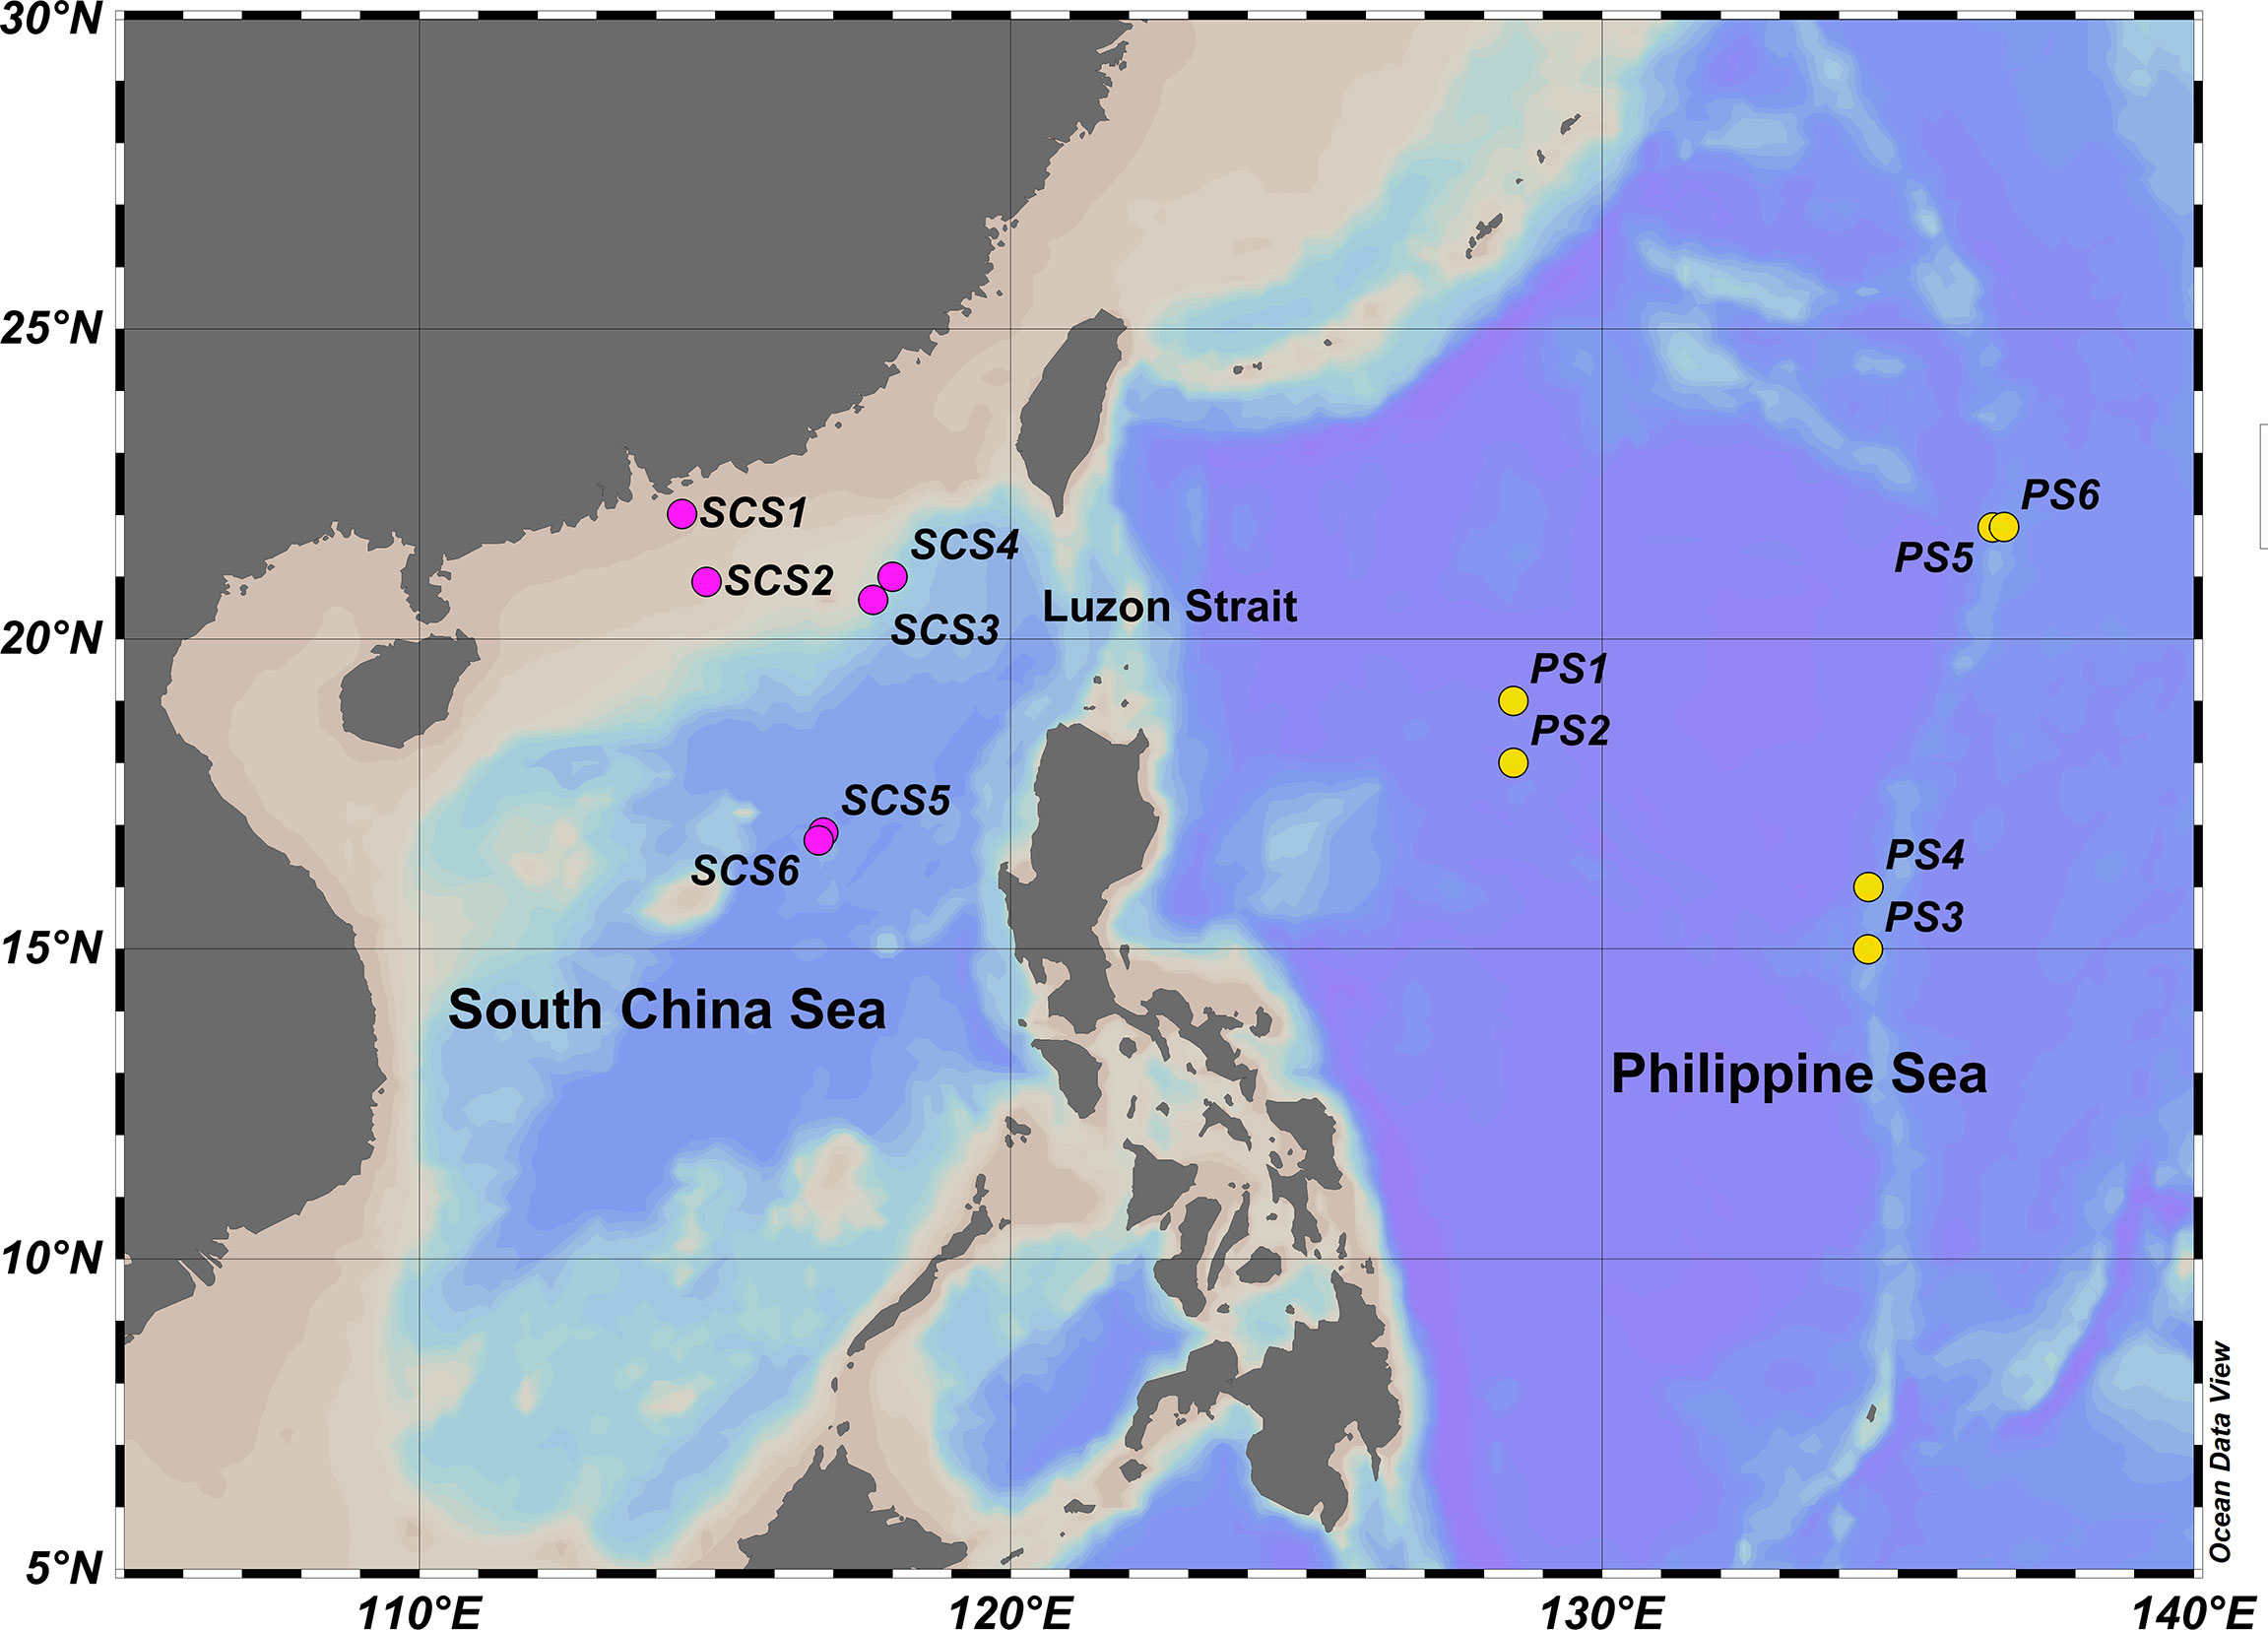
Figure 1 Locations of sampling sites used for analysis.
Despite playing important roles in both benthic and pelagic ecosystems, meroplankton has been historically overlooked in both planktonic or benthic studies. Due to lack of sufficient morphological features for identification (especially in their early stage), meroplankton specimens were mainly classified into broad categories, such as phylum or class levels (Koettker and Lopes, 2013; Gallego et al., 2015; Silberberger et al., 2016; Brandão et al., 2020). Moreover, the morphological identification of meroplankton is very time-consuming and labor-intensive even for experienced taxonomists (Ershova et al., 2021; Pappalardo et al., 2021). In recent years, with a rapid growth in the number of reference barcodes in public databases as well as the advances in methods specifically designed to barcode meroplankton (Ershova et al., 2019), describing meroplankton into lower taxonomic level has become feasible (Hebert et al., 2003; Descôteaux et al., 2021). Though such species-level identification provides detailed information of community composition of meroplankton, individual specimen processing is still required (Ershova et al., 2019), which limits the broad application of barcoding in meroplankton survey and underestimates its diversity. DNA metabarcoding combined with high-throughput sequencing can rapidly detect biodiversity information of the whole samples, and has achieved great success in studying metazoans (Laroche et al., 2020a; Laroche et al., 2020b; Di Capua et al., 2021; Liu and Zhang, 2021) and zooplankton community (Ershova et al., 2021; Pappalardo et al., 2021). However, very few studies of meroplankton using metabarcoding have been reported to date. Ershova et al. (2021) suggested that metabarcoding recovered more than 10 times in the number of meroplankton species comparing with the morphological identification, and 75% of the groups identified by morphology can be found in the results of metabarcoding.
Presumably, the meroplankton in the SCS and PS consist of larvae produced by local benthic invertebrates, as well as advected with currents from adjacent regions. In this study, we employed metabarcoding to survey meroplankton community in the SCS and the PS. Three widely used metabarcoding markers (COI, 18S V1-V2 and 18S V4) were used here in order to reduce the marker-bias and to recover a more comprehensive taxa information. Our aims were: (1) to test the efficiency of metabarcoding methods for surveying meroplankton in the SCS and PS; (2) to compare the effects of primers and databases on metabarcoding results; (3) to examine the geographical distribution pattern of benthic-planktonic larvae in the SCS and the PS.
The zooplankton samples were collected using the WP2 net (mesh size 200 μm) at 12 sampling sites (Figure 1, Table S1) in the SCS (six sites) and PS (six sites) during two cruises in July-August 2020 and September 2021. All sites were vertically towed from depths greater than 200 meters to the surface, except SCS1 and SCS2, which were located in the shelf area with the water depths less than 200 meters, and were vertically towed to surface from a height of five meters above the bottom (Table S1). Samples of SCS1-SCS6 were fully preserved in 95% ethanol, while samples of PS1-6 were split evenly into two fractions, one of which were preserved in 95% ethanol. The WP2 net was carefully cleaned after each field sampling to avoid cross-contamination.
A Sea-Bird conductivity-temperature-depth (CTD) sampler (SBE 911 plus, Seabird Co., Ltd., Sunnyvale, CA, United States) was used to collect seawater from different depths (5m, 25m, 50m, DCM, 100m, 150m and 200m) at each site. Basic environmental factors of the water column, including depth, temperature, salinity, and dissolved oxygen (DO), were obtained in situ using the CTD profiler and a DO sensor during sampling. Chlorophyll was measured according to standard methods as previously described (Guo et al., 2019). The chlorophyll on each filter was measured using a Trilogy Laboratory Fluorometer (Model 7200, Turner Designs Co., Ltd., Sunnyvale, CA, United States) after overnight extraction with 90% aqueous acetone at -20°C in the dark (Parsons et al., 1984). Integrated chlorophyll (IC) took into account each depth. The mixed layer depth (MLD) was defined as the depth 0.5°Clower than surface temperature (Sprintall and Tomczak, 1992).
Prior to extraction, each plankton sample was sieved through a pre-sterilized 200 μm mesh and rinsed three times with dd water. Biomass (wet weight) was measured with an electronic balance. Due to the high biomass in samples from the six sites, DNA extraction from these sites were made on subsamples of the total amount of collected biomass. In order to test whether different proportions of subsamples may cause community variation, three subsamples with different proportions (1/4, 1/8 and 1/16 of the whole net) from each SCS site was prepared. For the PS sites, the entire half-net subsamples preserved in ethanol were used for DNA extraction. All subsamples from SCS and PS sites were fully ground into powder under liquid nitrogen. Extraction was performed using EasyPure Marine Animal Genomic DNA Kit according to the manufacturer’s protocol. All instruments were cleaned with 10% bleach solution and rinsed in dd water between samples in laboratory. The sterilized gloves and tweezers were replaced after each grinding.
For each DNA sample, three pairs of primers from two different genes (COI and 18S) were used. For COI, the universal metazoan primers mlCOIintF (5’-GGWACWGGWTGAAWACWGGWTGAACCYCC-3’; Leray et al., 2013) and jgHCO2198 (5’-TAIACYTCIGGRTGICCRAARAAYCA-3’; Geller et al., 2013) were used to amplify a 313-bp sequence. For 18S, the primer set F04 (5’-GCTTGTCTCAAAGATTAAGCC-3’; Fonseca et al., 2010) and R22mod (5’-CCTGCTGCCTTCCTTRGA-3’; Sinniger et al., 2016) targeting the 365-bp V1-V2 region (hereafter called 18S1) as well as the primer set Uni18SF (5’-AGGGCAAKYCTGGTGCCAGC-3’; Zhan et al., 2013) and Uni18SR (5’-GRCGGTATCTRATCGYCTT-3’; Zhan et al., 2013) targeting the approximately 450-bp V4 region (hereafter called 18S4) of the 18S rRNA gene. A unique eight-base sample barcode was prepended to the forward primer for each sample. The PCR reactions were performed using 20 μL mixture which contained 4 μL of 5× FastPfu Buffer, 2 μL of 2.5 mM dNTPs, 0.8 μL of forward primer (5 μM), 0.8 μL of reverse primer (5 μM), 0.4 μL of FastPfu Polymerase, 0.2 μL of BSA and 10 ng of template DNA, then add ddH2O to 20 μL. All PCR protocols consisted of a denaturing step of 5 min at 95°C, followed by 35 cycles of 95°C for 30S, 55°C for 30S, 72°C for 45S, and a final extension of 10 min at 72°C. Three PCR replicates were done for each sample to reduce stochastic effects in amplification and were then pooled following amplification and purification. Amplicons were purified using the AxyPrep DNA Gel Extraction Kit (Axygen Biosciences, Union City, CA, U.S.) according to the manufacturer’s instructions and quantified using QuantiFluor™-ST (Promega, U.S.).
Purified amplicons with different barcodes were pooled into two libraries and paired-end sequenced (2×250) on Illumina Novaseq platform (Mingke Biotechnology (Hangzhou) Co., Ltd) according to the standard protocols.
Since 18S is highly conserved (Clarke et al., 2017) and COI has relatively larger intraspecific dissimilarity (up to 3-9%; Leray et al., 2013), we adopted different strategies for taxonomic assignment. More detailed information was described in Appendix S1.
For COI, raw reads were firstly demultiplexed and filtered by Trimmomatic v0.33 (Bolger et al., 2014). Primer sequences were identified and removed by cutadapt 1.9.1. Paired-end reads were assembled by FLASH v1.2.7 (Magoč and Salzberg, 2011), and chimeric sequences were identified and removed by UCHIME v4.2 (Edgar et al., 2011). Sequences with ≥97% similarity were assigned to the same OTUs using USEARCH (Edgar, 2013). Singletons were discarded and taxonomic assignment of OTUs were performed using UCLUST v1.2.22q (Prasad et al., 2015) by searching the GenBank nucleotide (NT; Benson et al., 2010) and BOLD (https://www.boldsystems.org/) databases. Following Laroche et al. (2020a) method, assignments with similarity less than 70% were discarded.
For 18S, raw reads were dereplicated and subjected to the DADA2 algorithm (QIIME 2 recommended) to identify indel-mutations and substitutions (Callahan et al., 2016). The trimming and filtering were performed on paired reads with a maximum of two expected errors per read (maxEE = 2). After merging paired reads and chimera filtering, 18S rRNA gene sequence (herein called amplicon sequence variants, ASVs) was analyzed by UCLUST v1.2.22q against the NT (Benson et al., 2010) and SILVA 18S rRNA v132 (https://www.arb-silva.de/) databases based on the same principle (Appendix S1) as COI but increasing the similarity threshold to 80% (Sommer et al., 2017).
Sequencing depth and recovered diversity per sample was investigated using rarefaction curves with the “vegan” R package.
Taxonomic information of OTUs and ASVs were corrected manually according to the WORMS (World Register of Marine Species, http://www.marinespecies.org/) after the non-metazoan (bacteria, fungi, archaea, protists, uncultured sequences and environmental sample sequences) OTUs and ASVs eliminated, and all non-marine taxa (arachnid, fresh water fish, mammals and terrestrial mollusca) were removed. Afterwards, the OTUs/ASVs were classified into different types of zooplankton (holoplankton, meroplankton and ichthyoplankton) according to reviewed literatures (Table S2), and all OTUs/ASVs classified as meroplankton were merged into a dataset for further statistical analysis.
According to plankton types (zooplankton including holoplankton, meroplankton and ichthyoplankton), primers (COI, 18S1 and 18S4) and taxonomic annotation databases (NT database for the three primers, SILVA database for the two 18S primers), ten datasets (COI-Z-NT, COI-M-NT, 18S1-Z-NT, 18S1-M-NT, 18S1-Z-SILVA, 18S1-M-SILVA, 18S4-Z-NT, 18S4-M-NT, 18S4-Z-SILVA and 18S4-M-SILVA) from the six SCS sites were generated to test the influence of different subsample proportions (1/4, 1/8 and 1/16 of the whole net). The BOLD database was excluded from this analysis because of its low recovery of the annotated OTUs from the COI sequences dataset. To analyze meroplankton community, two new meroplankton datasets of COI and 18S1 against NT database were generated, including six SCS sampling sites (SCS1-6) and six PS sampling sites (PS1-6). The 1/4 net subsamples (see 3.2.1) were selected to represent the six SCS sampling sites except SCS2 in the 18S1 dataset, which was represented by 1/8 net subsamples (see 3.1).
In order to evaluate the differences in alpha-diversity (Shannon diversity and Pielou evenness) of samples with different proportions (1/4, 1/8 and 1/16 of the whole net), we performed permutational multivariate analysis of variance (PERMANOVA) and cluster analysis. Boxplots based on the Kruskal-Wallis nonparametric test and Venn diagrams were used to compare different primers and databases. In the subsequent analysis of the meroplankton community, the reads were fourth-root transformed to account for the very large spread of the biomass values and the exponential nature of PCR in the sequencing data (Ershova et al., 2021). Community structure was investigated using non-metric multidimensional scaling (nMDS) on Bray-Curtis dissimilarities of fourth-root transformed relative sequence counts. An analysis of similarity (ANOSIM) and PERMANOVA were used to test for significant difference of meroplankton communities between the SCS sites and the PS sites. The global R in ANOSIM ranges from 0 to 1 and represents the degree of separation between groups; R=0 indicates no separation, whereas R=1 suggests complete separation (Clarke and Gorley, 2015). A similarity of percentage (SIMPER) analysis was performed to identify the taxa contributing most to the dissimilarities. Comparison of meroplankton communities at order level was visualized in a heatmap. Redundancy analysis (RDA) was used to explore the effect of environmental variables on meroplankton communities based on the longest gradient lengths of detrended correspondence analysis (Oksanen et al., 2007). The longest gradient lengths were <3 for both COI and 18S1, indicating RDA is suitable. Before the RDA analysis, the environmental factors with high variance inflation (VIF) >30 were eliminated to avoid collinearity among factors. Toassess the biogeography pattern between SCS and PS, OTUs/ASVs identified to species level (97% similarity COI, 99% similarity 18S1) were extracted. Geographical distribution information of these species was downloaded from OBIS (https://obis.org/), and four datasets (SCS-OBIS-COI, SCS-OBIS-18S, PS-OBIS-COI and PS-OBIS-18S) were generated and used for mapping separately.
The PERMANOVA, clustering, nMDS, ANOSIM and RDA were conducted with the R package “vegan” (Oksanen et al., 2007). The boxplot, Venn diagram and heatmap was drawn by the genescloud tools, a free online platform for data analysis (https://www.genescloud.cn).
A total of 1,215,852, 1,210,562 and 1,375,265 reads were generated for COI, 18S1 and 18S4, respectively (Table S3). Quality filtration, denoising, merging and chimera removal discarded 55,596, 24,214 and 121,454 reads for COI, 18S1 and 18S4, respectively.
After taxonomic assignment, removing non-metazoan and non-marine sequences, COI-NT, 18S1-NT, 18S1-SILVA, 18S4-NT and 18S4-SILVA left 894,069, 963,997, 934,724, 618,038 and 572,162 reads as well as 2,605, 1,517, 1,359, 883 and 854 OTUs/ASVs, respectively (Table S3). Among them, meroplankton reads accounted 3.01-7.29% (average 4.76%; Table S3), and its OTUs/ASVs number accounted for 16.66-29.36% (average 24.35%; Table S3). However, two subsamples of SCS2 (1/4 and 1/16 of the whole net) had less than 15,000 reads in 18S1, which is obviously lower than the average 40,000 reads, and were excluded as Laroche et al. (2020a) suggested. Rarefaction curves of the three primers showed that the sequencing depths were sufficient to recover the diversity for 18S1 and 18S4, but insufficient for COI (Figure S1).
For six datasets generated from COI and 18S1, the values of OTUs/ASVs number, Shannon diversity and Pielou evenness were slightly higher in the subsamples with higher proportion, but similar tendency was not observed for the four datasets generated from 18S4 (Figure S2). However, the results of PERMANOVA didn’t revealed significant difference among the three proportions for all ten datasets (Table S4), which was also supported by cluster analysis (Figure S3), suggesting similar effects of different subsample proportions on diversity assessment for both zooplankton and meroplankton. Each proportion was capable of representing the community structure of its own site and distinguishing from other sites. The 1/4 net subsamples with higher OTUs/ASVs recovered from either zooplankton or meroplankton than other subsamples were selected to represent the six SCS sites and used for further community analysis.
We compared the taxonomy annotation effects of zooplankton and meroplankton between different primers (COI, 18S1 and 18S4) against different databases. For all zooplankton, COI revealed significantly higher OTUs/ASVs number and Shannon diversity than those of 18S1, while 18S4 revealed the lowest OTUs/ASVs number and Shannon diversity (Dunn’s test, p <0.05; Figure 2A). However, the Pielou evenness of 18S1 was significantly higher than that of COI and 18S4 (Dunn’s test, p <0.05; Figure 2A). For meroplankton, there was no significant difference among the three primers in most cases (Figure 2B). The OTUs number of COI was slightly higher than ASVs number of 18S1 and 18S4, the Shannon diversity of 18S1 was slightly higher than that of COI and 18S4, and the Pielou evenness of 18S1 and 18S4 was slightly higher than that of COI (Figure 2B).
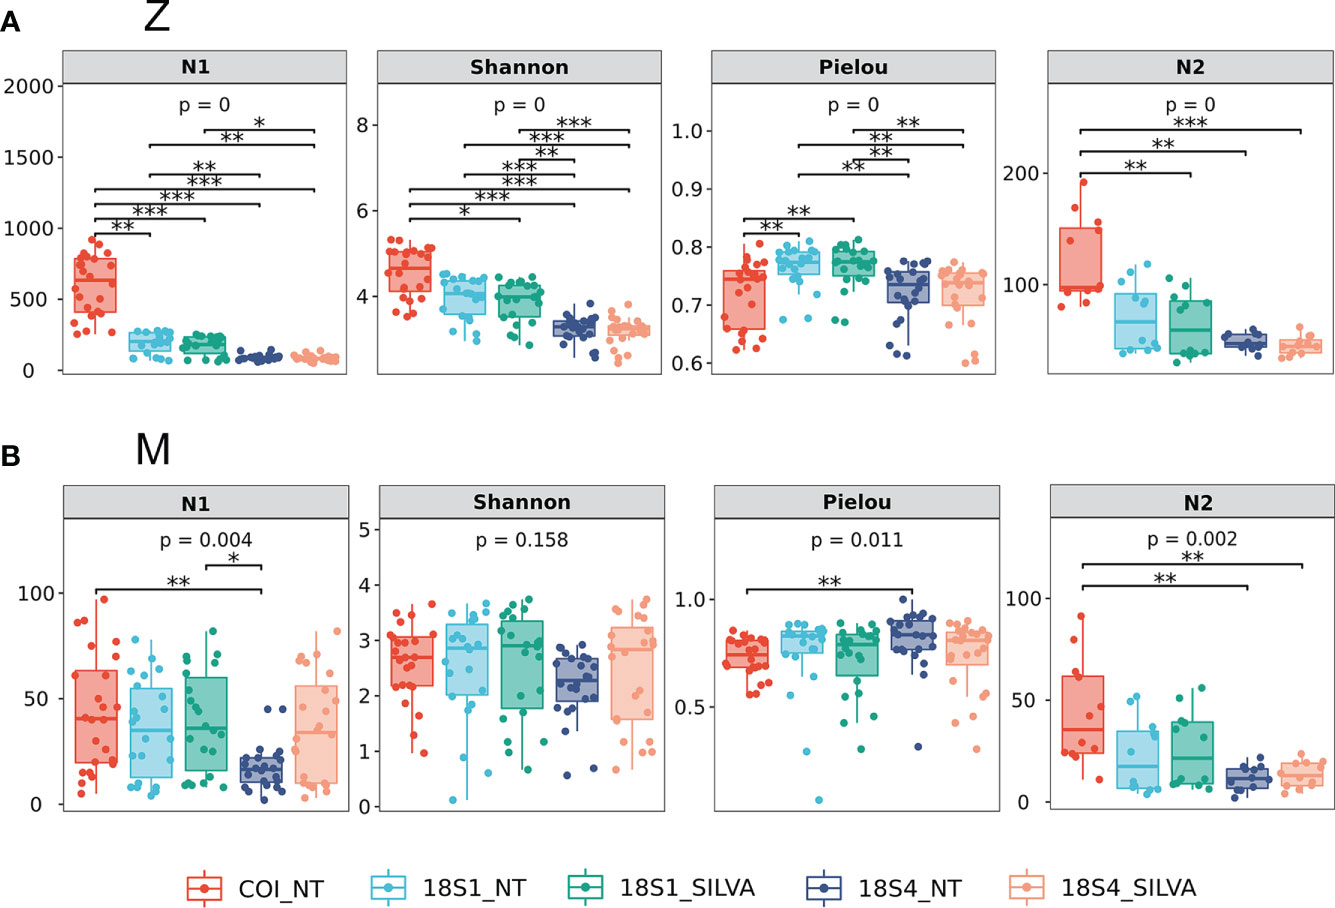
Figure 2 Summary of OTUs/ASVs numbers (N1), Shannon diversity, Pielou evenness and families numbers (N2) of different primers (COI, 18S1 and 18S4) and different databases (NT and SILVA). P-values for the overall test between groups were obtained by Kruskal-Wallis nonparametric test. Mark of the significance level of differences were obtained by Dunn’s test post-hoc comparison between each group (*, p<0.05; **, p<0.01; ***, p<0.001). (A) Z, zooplankton; (B) M, meroplankton.
Additionally, taxonomic information of the three primers annotated against two databases (NT and SILVA) were compared at family level. The number of families recovered by COI was higher than that of 18S1, and significantly higher than that of 18S4 in both zooplankton and meroplankton. A total of 551 families of zooplankton, including 264 families of meroplankton, were recovered, in which 92 families of zooplankton (33 families of meroplankton) were recovered by all three primers (Figures 3A, B). About 50% families, for either zooplankton or meroplankton, recovered by COI based on NT database were unique, however, the percentage of unique families recovered by 18S1 and 18S4 were lower (Figures 3A, B). 18S1 recovered distinctly more families and higher percentage of unique families than 18S4 from both of the two databases (Figure 3). The results suggested that COI had the best taxonomic annotation efficiency, followed by 18S1, then 18S4. When considering the effect of the database, for 18S1 and 18S4, NT and SILVA databases showed similar efficiency and resolution for taxonomic assignments (Figure 2; Figure S4).
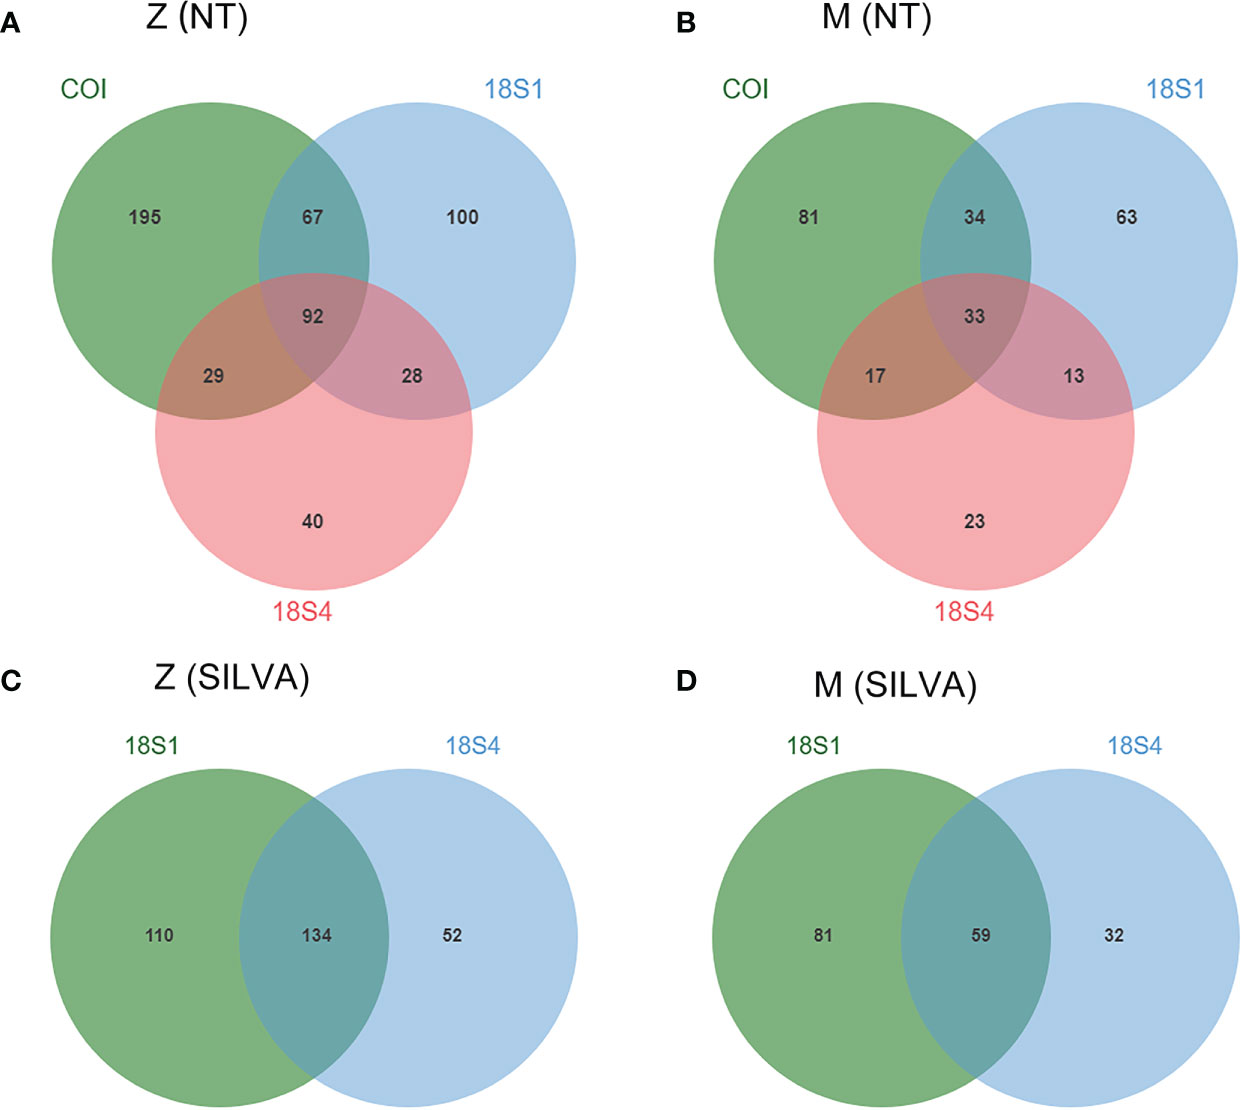
Figure 3 Venn diagrams showing number of families for COI, 18S1 and 18S4 against NT (A, B) and SILVA databases (C, D). Z, zooplankton; M, meroplankton.
Totally, 285 OTUs (COI, 9,749 reads) were obtained, composed of eight phyla, 16 classes, 52 orders and 129 families, while 245 ASVs (18S1, 23,730 reads) were obtained, composed of nine phyla, 15 classes, 48 orders and 119 families (Tables S5, 6). The five dominant phyla (Annelida, Arthropoda, Cnidaria, Echinodermata and Mollusca) accounted for more than 85% OTUs/ASVs. Besides, a high abundance of Bryozoa were found in the 18S1 results, although its diversity was low (Table S6).
Averagely, 58 OTUs and 47 ASVs were recovered from each SCS sampling sites, higher than the average OTU (13) and ASV (7) number from each PS sampling sites (Table 1).
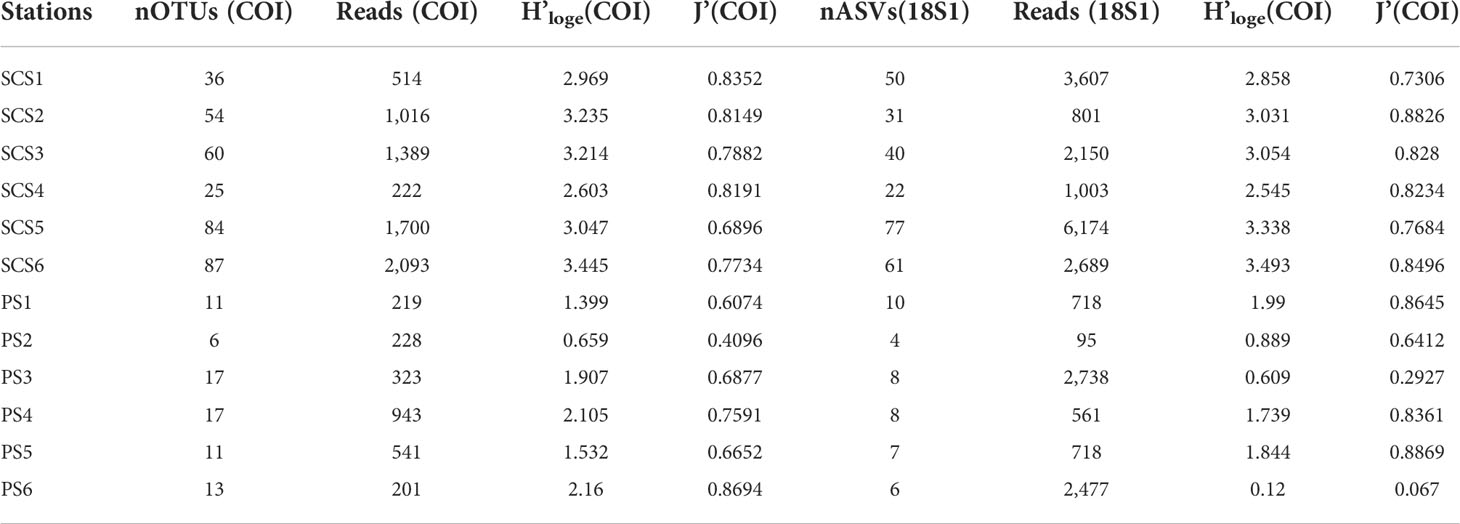
Table 1 Summary of meroplankton OTUs/ASVs number, reads, Shannon diversity (H’loge) and Pielou evenness (J’) per station for two primers (COI and 18S1).
The nMDS ordination analysis for COI showed that SCS samples were separated from the PS samples by nMDS axis 1 (Figure 4A), while 18S1 results didn’t separate the two groups of samples (Figure 4B). However, the results of ANOSIM analyses demonstrated that the meroplankton communities of both COI (Global R= 0.441, p =0.009) and 18S1 (Global R= 0.284, p =0.022) were significantly different between SCS and PS (Figure 4), which was supported by PERMANOVA analysis (COI, p =0.0048; 18S1, p =0.047), suggesting that meroplankton communities between the SCS and the PS were different.
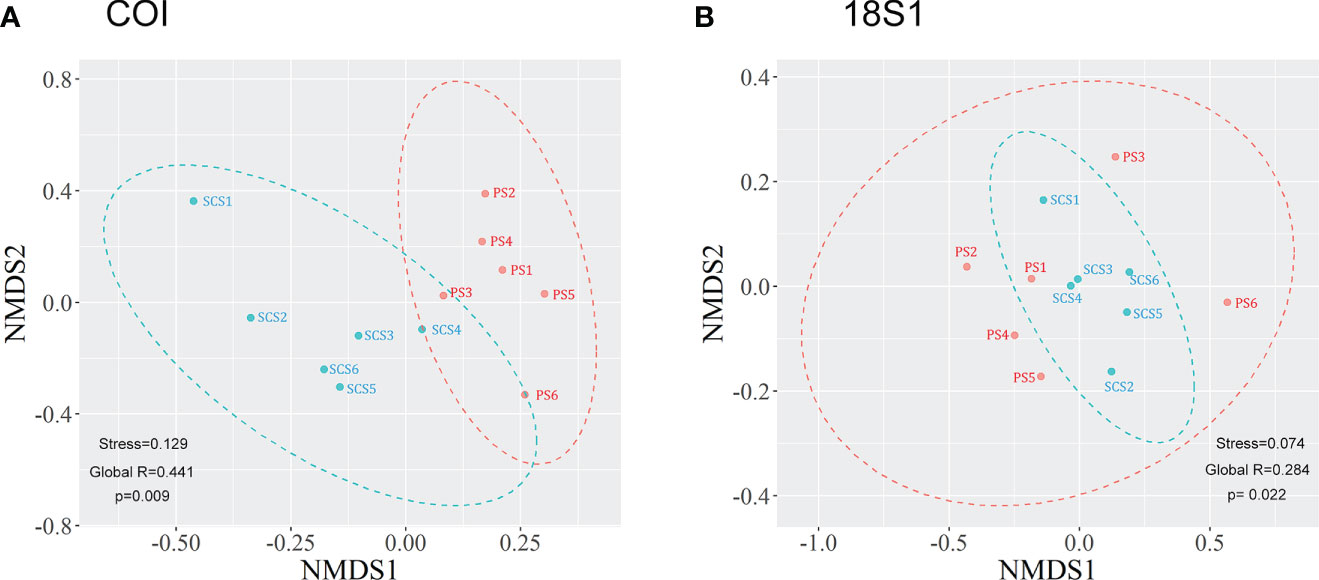
Figure 4 nMDS ordination of COI (A) and 18S1 (B) based on Bray-Curtis similarity. SCS sites are marked in cyan, while PS sites are marked in orange.
Community composition between the SCS and PS were compared at order/family level (Figure 5). The SCS had distinctly more orders/families than the PS, which was consistent with the distribution of OTUs/ASVs. COI data showed that Phyllodocida, Amphilepidida, Caenogastropoda, Decapoda, Actiniaria, and Neogastropoda were dominant groups in the SCS, Sipuncula, Phyllodocida, Amphilepidida, and Caenogastropoda were the dominant groups in the PS (Figure 5A). 18S1 data suggested similar results with COI data that Decapoda, Phyllodocida, Littorinimorpha, Cephalaspidea, Amphinomida, and Actiniaria dominated the meroplankton community in the SCS, while only two orders (Phyllodocida and Littorinimorpha) were dominant groups in the PS (Figure 5B). SIMPER indicated average dissimilarity in meroplankton communities between SCS and PS were 70.14% (COI) and 73.21% (18S1), respectively. Decapoda, Actiniaria, Littorinimorpha, Phyllodocida, and Neogastropoda were main contributors of the dissimilarity, and all contributed more than 3% of the dissimilarity in both COI and 18S1 (Table S7). The five groups play important role in distinguishing the two communities.
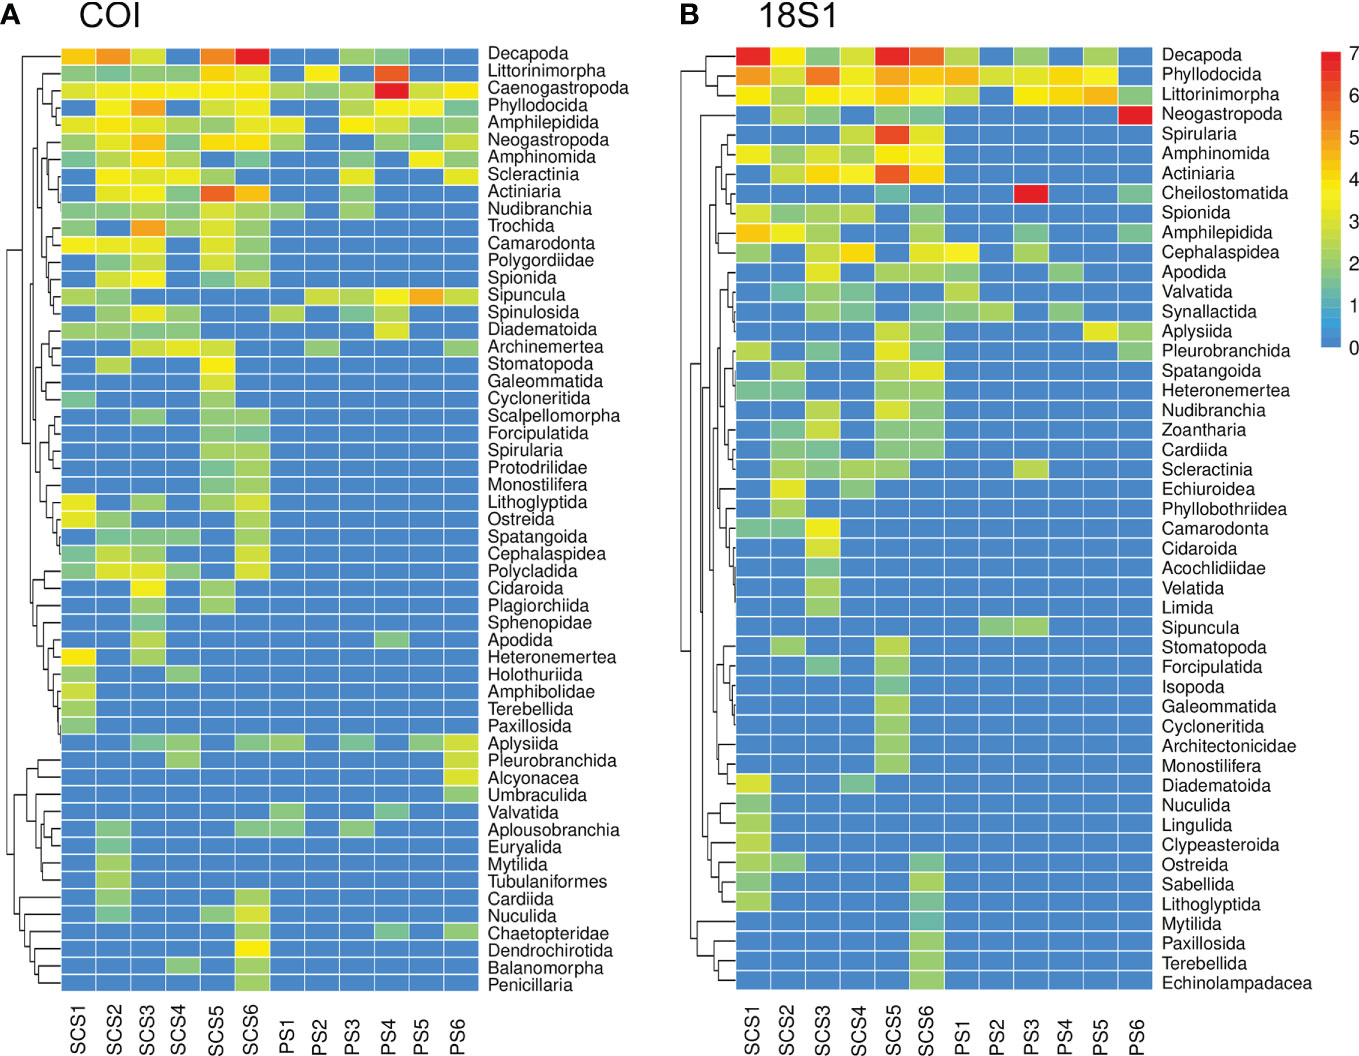
Figure 5 Heatmap showing meroplankton community composition for COI (A) and 18S1 (B). Most of the classification levels are at the order level, family names were used when they were not assigned to any order temporally. Reads were fourth-root transformed and displayed in the legend.
Various environmental factors are shown in Table 2. Deep chlorophyll maximum (DCM) was removed for its VIF greater than 30, while surface seawater temperature and salinity (SST and SSS), dissolved oxygen (DO), mixed layer depth (MLD), subsurface chlorophyll maximum (SCM) and Integrated chlorophyll (IC) were used for RDA analysis. Two RDA ordinations showed separations of SCS and PS samples (Figure 6). For both COI and 18S1, meroplankton of PS (PS1-6) was positively correlated with SST, while SCS5-6 was positively correlated with IC, and SCS2-4 was positively correlated with SCM (Figure 6). However, the meroplankton of SCS1 was positively correlated with MLD in 18S1 and negatively correlated in COI (Figure 6).

Table 2 Summary of environmental factors at different sites.
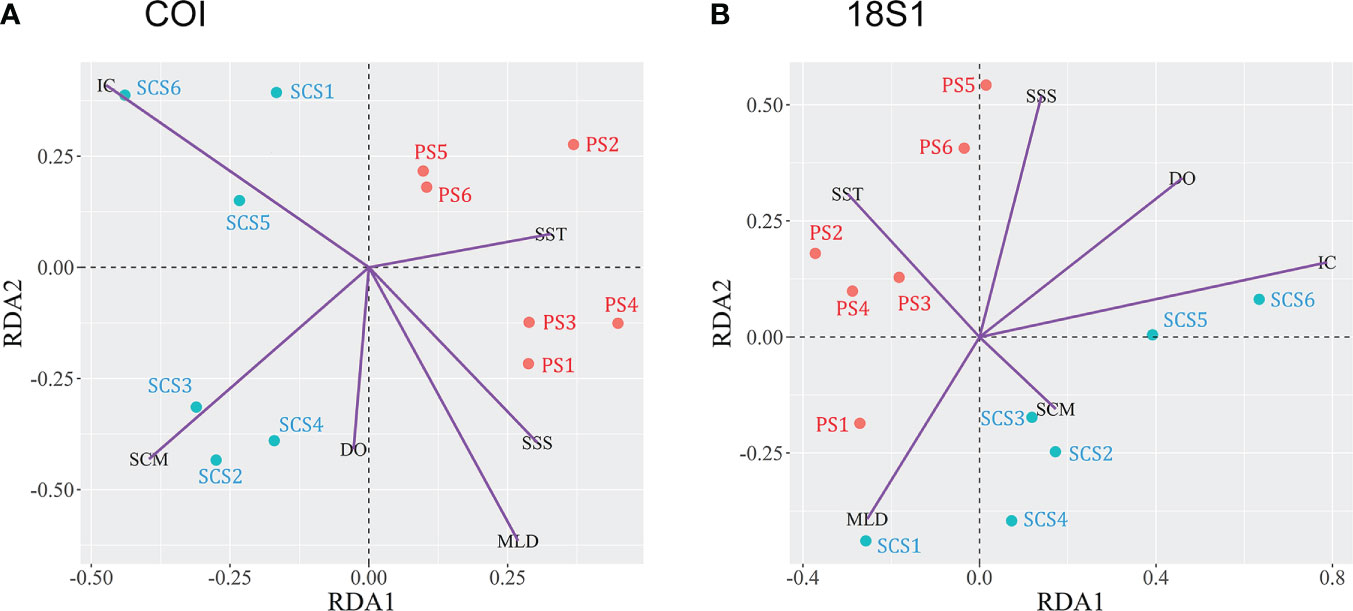
Figure 6 RDA ordinations showing the meroplankton composition in relation to environmental variable. (A) COI; (B) 18S1. SST, surface seawater temperature; SSS, surface seawater salinity; DO, dissolved oxygen; MLD, mixed layer depth; DCM, deep chlorophyll maximum; SCM, Subsurface chlorophyll maximum; IC, integrated chlorophyll of the upper 200m water column.
COI and 18S are the two predominantly used genetic markers for metazoan biodiversity study (Alberdi et al., 2018; Zhang et al., 2018; Ficetola et al., 2021), their efficiency in taxa detection was likely dependent on the completeness of the database. Laroche et al. (2020a) studied metazoan communities of abyssal plains in the eastern Pacific and suggested a much larger portion of COI sequences were unassigned compared to 18S, which may be attributed to the poor understanding of deep-sea taxonomic information in the eastern Pacific (Glover et al, 2016; Christodoulou et al., 2019). In this study, COI recovered slightly higher OTUs/ASVs numbers than 18S V4 (Figures 2, 3). This is probably because the Indo-Pacific is one of the most well-studied areas all over the world, with a much larger number of COI sequences deposited in GenBank, therefore, resulting in a higher COI taxonomic detecting efficiency. Additionally, the COI is less conservative and lacks the conserved stem regions compared with 18S V4 (Leray et al., 2013; Clarke et al., 2017), so the higher-level assignment of COI is more dependent on the integrity of the reference database (Atienza et al., 2020).
Very few studies reported meroplankton in the SCS and PS. Rao et al. (2020) reported that in the Daya bay, meroplanktonic larvae were dominated by Crustacea, and Echinodermata, which had also been suggested as dominant group of meroplanktonic larvae in the coastal area of the Hainan island (Zhang et al., 2014) and in the Dongsha atoll (Hsieh et al., 2017), respectively. However, the meroplanktonic larvae were mostly identified into very high taxonomic level (e.g. phylum or class). In this study, Polychaeta, Mollusca, Arthropoda, and Echinodermata were the dominant groups (Tables S5-6), which is consistent with previous results. Within the four phyla, about 100 families including more than 200 OTUs/ASVs were identified, which greatly improve the taxonomic resolution of the meroplankton community. Our results also revealed relatively high OTUs/ASVs of Cnidaria, dominated by Actiniaria and Scleractinia in the slope and basin sites. Li and Xu (2020) summarized that at least 20 families of Actiniarians were reported in the SCS, among which 10 families were detected in this study and two families (Metridiidae and Phelliidae) were reported in the SCS for the first time. Huang et al. (2015) suggested that the SCS hosts a richness of reef corals comparable to the Coral Triangle area. Four families of Scleractinia detected in this study were also reported previously (Rodriguez-Lanetty and Hoegh-Guldberg, 2002; Chen et al., 2019; Xu et al., 2019; Li et al., 2022; Zeng et al., 2022). Furthermore, rare species from Brachiopoda, Bryozoa, Nemertea, and Platyhelminthes were easily neglected through traditional methods, but were more easily detected by metabarcoding, suggesting high efficiency of this novel method.
Generally, primers and databases may have distinct taxonomy identification efficiency for different ribosomal regions. Multiple primers and databases may enhance taxon detection efficiency and increase reliability in the results (van der Loos and Nijland, 2021) and could be the best solution for metabarcoding survey of a poorly studied area. Our results highlighted the importance of using multiple markers and that metabarcoding may be an efficient method for meroplankton study, providing high resolution information for the meroplankton community. However, we did not identify physical larvae specimens from the plankton samples. Further studied are needed to compare metabarcoding methods with morphological identification.
Meroplanktonic benthic-larvae may provide useful information on geographical distribution of benthic invertebrates. Most species from the OBIS datasets were cosmopolitan, widely distributed around the Indo-Pacific from the west Indian Ocean to the Hawaiian islands, from northwest Pacific to the Tasmanian Sea (Figure 7), which is consistent with previous studies that Indo-Pacific characterized by a vast degree of biogeographic connectivity (Craig et al., 2007; Gaither et al., 2011; Minegishi et al., 2012; Pinzón et al., 2013; Erpenbeck et al., 2017). However, a large number of records in the northern SCS and the East China Sea (ECS) recovered from the SCS-OBIS datasets were absent in the PS-OBIS datasets (Figure 7). Additionally, the two SCS-OBIS datasets were further divided into three pairs of sub-datasets according to their sampling sites, shelf (SCS1, SCS2), slope (SCS3, SCS4) and basin (SCS5, SCS6). Most coastal records recovered from the shelf sites were absent in slope and basin sites (Figures S5C-F), suggesting that the coastal benthic invertebrates in the SCS and ECS were limited within the shelf. This may be due to fact that the SCS and ECS shelves were affected by the Guangdong coastal current (GDCC), Min Zhe coastal current (MZCC), South China Sea warm current (SCSWC) and Taiwan warm current(TWC) (Wang et al., 2016; Shu et al., 2018), which play important role in material transportation along the coastal line and enhance connectivity of benthic invertebrates within the SCS and ECS shelves (Han et al., 2015; Ye et al., 2015; Feng et al., 2020). In addition, water depth may be another important potential cause, which had been proved to have effects on the distribution of benthic invertebrates and discrimination of their populations (Etter et al., 2005; Zardus et al., 2006; Cowart et al., 2014). The broad shallow-water shelf in the northern SCS and ECS provides suitable habitats for settlement of those coastal species, but in slope and basin sites, deep seafloor may be a very harsh environment for coastal species, preventing them from settlement and propagate.
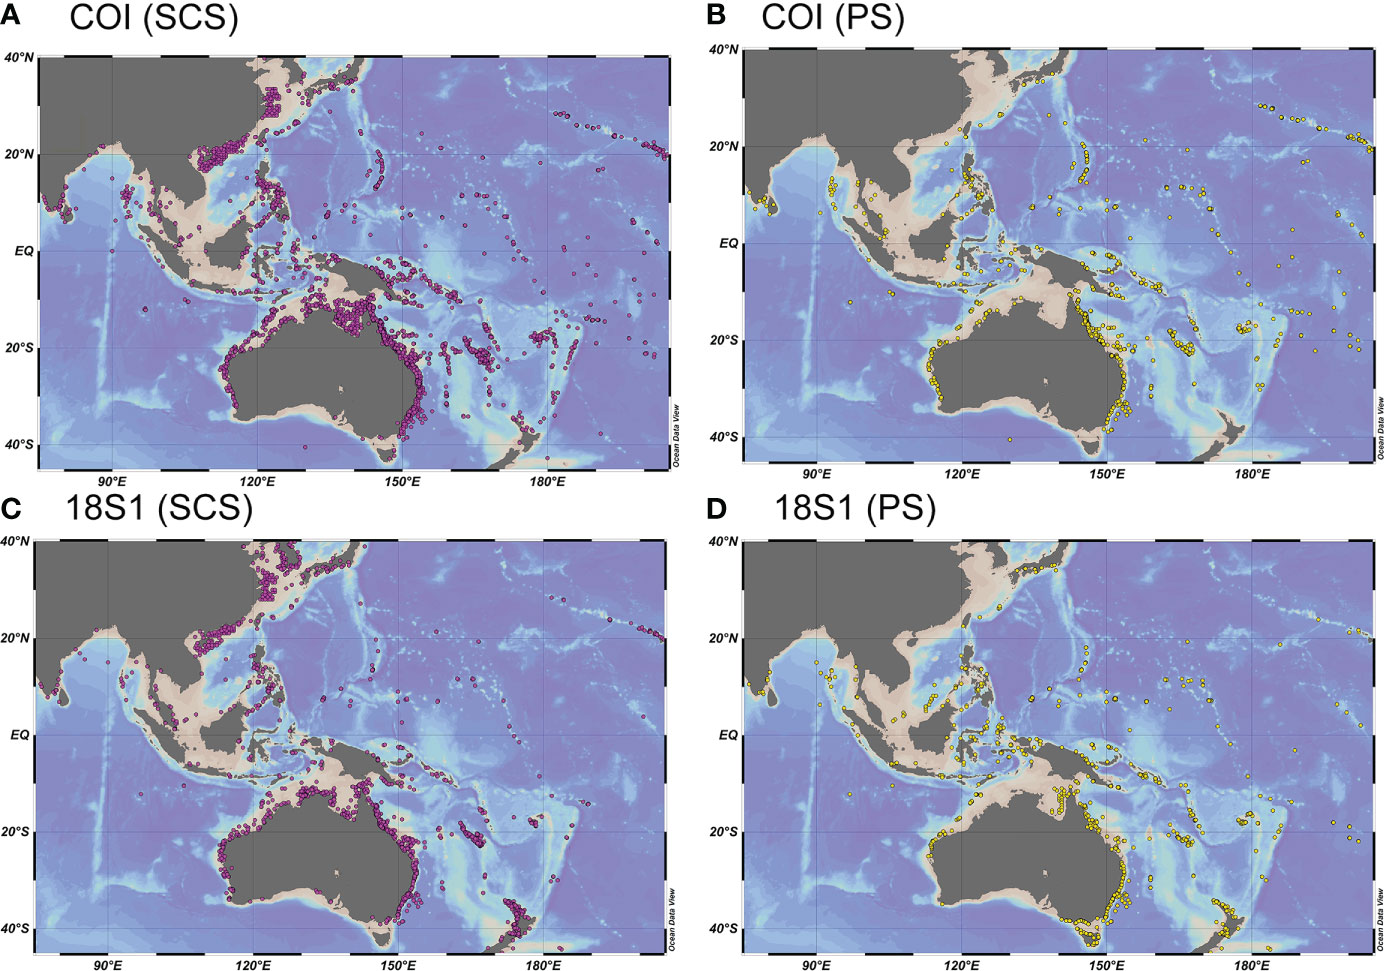
Figure 7 Geographical distribution of meroplankton species (>97% similarity COI, >99% similarity 18S1) in the SCS (A, C) and PS (B, D).
With shelf sites excluded, lots of OBIS records from slope area in the northern SCS and around the Hainan island were recovered from both slope sites and basin sites, but absent in the PS sites. This may suggest a weak connectivity between the SCS and PS. Data from physical oceanography indicate that the KC intrudes into the northern SCS via the Luzon Strait (Jan et al., 1994; Jan et al., 2002). This unidirectional KC intrusion (KCI) may facilitate pacific species flowing into the northern SCS from the Pacific Ocean, on the contrary, prevent planktonic-larvae of benthic invertebrates from spreading out. Benthic invertebrates recorded from northwest part of the SCS may be limited within the SCS. It was indicated that the KC played important roles in shaping plankton assemblages in the northern SCS (Hwang et al., 2007; Huang et al., 2017). However, the influence of the KCI may be limited to the northeast part of the SCS and southwest of Taiwan. Chen et al. (2020) suggested that mesozooplankton community in the northwest of Philippine island was strongly influenced by the immobile Luzon Cold Eddy, while the shelf was mainly impacted by the Pearl River. Our results found only a few points in the northeast SCS and southwest of Taiwan from the PS-OBIS datasets (Figure 7), supporting the idea of limited influence of the KCI.
Besides, meroplankton geographic patterns are also impacted by environmental heterogeneity. RDA results showed that IC, SCM, SST, SSS, and DO were key environmental factors impacting meroplankton community structure (Figure 6). It was consistent with previous studies (Silberberger et al., 2016; Brandão et al., 2020; Brandão et al., 2021). Many studies have shown that meroplankton mostly feeds on algae (Conover, 1968; Paulay et al., 1985; Fenaux et al., 1994). The high IC in SCS sites (Table 2) may explain their higher OTUs/ASVs number (Tables S5-6) due to sufficient food source available compare to the PS sites. Temperature had been documented to have negative effects on larval development time (O'Connor et al., 2007). Higher SST in the PS may shorten the planktonic duration time of the benthic larvae and resulted in a weaker dispersal capability which may be one of the causes of lower OTUs/ASVs in the PS than the SCS.
In this study, metabarcoding was successfully used for studying meroplankton community in the SCS and the PS. Three primers exhibited different annotation effects and limited taxonomic overlap with each other at the family level. Two databases showed similar performance for the two 18S primers. Multiple primers and databases are recommended to enhance taxon detection efficiency and increase the reliability of the results. Polychaeta, Mollusca, Arthropoda, and Echinodermata dominated meroplankton community in both SCS and PS. Meroplankton community at phylum level based on metabarcoding in the SCS is consistent with previous studies based on metabarcoding in the SCS is consistent with previous studies based on morphological identification under a dissecting microscope, highlighting the validity of the state of the art method. However, meroplankton community were significantly different between the two basins, and Decapoda, Actiniaria, Littorinimorpha, Phyllodocida, and Neogastropoda were major orders contributing to the inter-basin dissimilarity. IC, SCM, SST, SSS and DO were key environmental drivers impacted meroplankton community structure. KC intrusion played an important role in shaping the distribution pattern of meroplankton. This study provides a useful method for future study of meroplankton community, shedding lights on the biogeography pattern of meroplankton at two deep-sea basins in the West Pacific.
The datasets presented in this study can be found in online repositories. The raw sequence reads were deposited in NCBI's Sequence Read Archive (SRA, http://www.ncbi.nlm.nih.gov/sra) under Bioprojects PRJNA846978 (COI), PRJNA847031 (18S1) and PRJNA847038 (18S4).
LQ and ZD conceived the original idea, analyzed the data, and led the writing. CY, WZ and XW were responsible for sample collection. SQ, SD, ZY and XX assisted in analyzing the data and contributed critically to the drafts. All authors approved the final manuscript.
This research has been jointly funded by the National Natural Science Foundation of China (42076135), the Scientific Research Fund of the Second Institute of Oceanography, MNR (HYGG2003) and NSFC (41876016).
We thank taxonomic experts Ma Lin, Song Xikun, Sun Jin, Wang Yueyun and Xu Peng for their professional opinions on the classification of zooplankton types (holoplankton, meroplankton and ichthyoplankton), and also to Feng Yunzhi and Zhang Ruiyan for guidance on data processing.
The authors declare that the research was conducted in the absence of any commercial or financial relationships that could be construed as a potential conflict of interest.
All claims expressed in this article are solely those of the authors and do not necessarily represent those of their affiliated organizations, or those of the publisher, the editors and the reviewers. Any product that may be evaluated in this article, or claim that may be made by its manufacturer, is not guaranteed or endorsed by the publisher.
The Supplementary Material for this article can be found online at: https://www.frontiersin.org/articles/10.3389/fmars.2022.968666/full#supplementary-material
Alberdi A., Aizpurua O., Gilbert M. T. P., Bohmann K. (2018). Scrutinizing key steps for reliable metabarcoding of environmental samples. Methods Ecol. Evol. 9 (1), 134–147. doi: 10.1111/2041-210X.12849
Allen J. D. (2008). Size-specific predation on marine invertebrate larvae. Biol. Bull. 214 (1), 42–49. doi: 10.2307/25066658
Atienza S., Guardiola M., Præbel K., Antich A., Turon X., Wangensteen O. S. (2020). DNA Metabarcoding of deep-sea sediment communities using COI: community assessment, spatio-temporal patterns and comparison with 18S rDNA. Diversity 12 (4), 123. doi: 10.3390/d12040123
Benson D. A., Karsch-Mizrachi I., Lipman D. J., Ostell J., Sayers E. W. (2010). GenBank. Nucleic Acids Res. 39 (suppl_1), D32–D37. doi: 10.1093/nar/gkq1079
Bolger A. M., Lohse M., Usadel B. (2014). Trimmomatic: a flexible trimmer for illumina sequence data. Bioinformatics 30 (15), 2114–2120. doi: 10.1093/bioinformatics/btu170
Brandão M. C., Comtet T., Pouline P., Cailliau C., Blanchet-Aurigny A., Sourisseau M., et al. (2021). Oceanographic structure and seasonal variation contribute to high heterogeneity in mesozooplankton over small spatial scales. ICES J. Mar. Sci. 78 (9), 3288–3302. doi: 10.1093/icesjms/fsab127
Brandão M. C., Garcia C. A., Freire A. (2020). Meroplankton community structure across oceanographic fronts along the South Brazil shelf. J. Mar. Syst. 208, 103361. doi: 10.1016/j.jmarsys.2020.103361
Callahan B. J., McMurdie P. J., Rosen M. J., Han A. W., Johnson A. J. A., Holmes S. P. (2016). DADA2: High-resolution sample inference from illumina amplicon data. Nat. Methods 13 (7), 581–583. doi: 10.1038/nmeth.3869
Chen Y., Lin S., Wang C., Yang J., Sun D. (2020). Response of size and trophic structure of zooplankton community to marine environmental conditions in the northern south China Sea in winter. J. Plankton Res. 42 (3), 378–393. doi: 10.1093/plankt/fbaa022
Chen B., Yu K., Liang J., Huang W., Wang G., Su H., et al. (2019). Latitudinal variation in the molecular diversity and community composition of symbiodiniaceae in coral from the South China Sea. Front. Microbiol. 1278. doi: 10.3389/fmicb.2019.01278
Christodoulou M., O’Hara T. D., Hugall A. F., Arbizu P. M. (2019). Dark ophiuroid biodiversity in a prospective abyssal mine field. Curr. Biol. 29 (22), 3909–3912. doi: 10.1016/j.cub.2019.09.012
Clarke L. J., Beard J. M., Swadling K. M., Deagle B. E. (2017). Effect of marker choice and thermal cycling protocol on zooplankton DNA metabarcoding studies. Ecol. Evol. 7 (3), 873–883. doi: 10.1002/ece3.2667
Conover R. J. (1968). Zooplankton–life in a nutritionally dilute environment. Am. Zoologist 8 (1), 107–118. doi: 10.1093/icb/8.1.107
Cowart D. A., Halanych K. M., Schaeffer S. W., Fisher C. R. (2014). Depth-dependent gene flow in gulf of Mexico cold seep lamellibrachia tubeworms (Annelida, siboglinidae). Hydrobiologia 736 (1), 139–154. doi: 10.1007/s10750-014-1900-y
Cowen R. K., Sponaugle S. (2009). Larval dispersal and marine population connectivity. Annu. Rev. Mar. Sci. 1, 443–466. doi: 10.1146/annurev.marine.010908.163757
Craig M. T., Eble J. A., Bowen B. W., Robertson D. R. (2007). High genetic connectivity across the Indian and Pacific oceans in the reef fish myripristis berndti (Holocentridae). Mar. Ecol. Prog. Ser. 334, 245–254. doi: 10.3354/meps334245
Descôteaux R., Ershova E., Wangensteen O. S., Præbel K., Renaud P. E., Cottier F., et al. (2021). Meroplankton diversity, seasonality and life-history traits across the barents Sea polar front revealed by high-throughput DNA barcoding. Front. Mar. Sci. 8. doi: 10.3389/fmars.2021.677732
Di Capua I., Piredda R., Mazzocchi M. G., Zingone A. (2021). Metazoan diversity and seasonality through eDNA metabarcoding at a Mediterranean long-term ecological research site. ICES J. Mar. Sci. 78 (9), 3303–3316. doi: 10.1093/icesjms/fsab059
Du C., Liu Z., Dai M., Kao S. J., Cao Z., Zhang Y., et al. (2013). Impact of the kuroshio intrusion on the nutrient inventory in the upper northern South China Sea: Insights from an isopycnal mixing model. Biogeosciences 10 (10), 6419–6432. doi: 10.5194/bg-10-6419-2013
Edgar R. (2013). UPARSE: Highly accurate OTU sequences from microbial amplicon reads. Nat. Methods 10 (10), 996–998. doi: 10.1038/NMETH.2604
Edgar R. C., Haas B. J., Clemente J. C., Quince C., Knight R. (2011). UCHIME improves sensitivity and speed of chimera detection. Bioinformatics 27 (16), 2194–2200. doi: 10.1093/bioinformatics/btr381
Erpenbeck D., Aryasari R., Benning S., Debitus C., Kaltenbacher E., Al-Aidaroos A. M., et al. (2017). Diversity of two widespread indo-pacific demosponge species revisited. Mar. Biodiversity 47 (4), 1035–1043. doi: 10.1007/s12526-017-0783-3
Ershova E. A., Descoteaux R., Wangensteen O. S., Iken K., Hopcroft R. R., Smoot C., et al. (2019). Diversity and distribution of meroplanktonic larvae in the pacific Arctic and connectivity with adult benthic invertebrate communities. Front. Mar. Sci. 490. doi: 10.3389/fmars.2019.00490
Ershova E. A., Wangensteen O. S., Descoteaux R., Barth-Jensen C., Præbel K. (2021). Metabarcoding as a quantitative tool for estimating biodiversity and relative biomass of marine zooplankton. ICES J. Mar. Sci. 78 (9), 3342–3355. doi: 10.1093/icesjms/fsab171
Etter R., Rex M. A., Chase M. R., Quattro J. M. (2005). Population differentiation decreases with depth in deep-sea bivalves. Evolutionary Appl. 59 (7), 1479–1491. doi: 10.1111/j.0014-3820.2005.tb01797.x
Fenaux L., Strathmann M. F., Strathmann R. A. (1994). Five tests of food-limited growth of larvae in coastal waters by comparisons of rates of development and form of echinoplutei. Limnol. Oceanography 39 (1), 84–98. doi: 10.4319/lo.1994.39.1.0084
Feng J., Fu Z., Guo Y., Li J., Guo B., Lü Z., et al. (2020). Strong genetic differentiation of the clam meretrix lamarckii in the China Sea revealed by mitochondrial DNA marker. Mol. Biol. Rep. 47 (1), 693–702. doi: 10.1007/s11033-019-05177-9
Ficetola G. F., Boyer F., Valentini A., Bonin A., Meyer A., Dejean T., et al. (2021). Comparison of markers for the monitoring of freshwater benthic biodiversity through DNA metabarcoding. Mol. Ecol. 30 (13), 3189–3202. doi: 10.1111/mec.15632
Fonseca V. G., Carvalho G. R., Sung W., Johnson H. F., Power D. M., Neill S. P., et al. (2010). Second-generation environmental sequencing unmasks marine metazoan biodiversity. Nat. Commun. 1 (1), 1–8. doi: 10.1038/ncomms1095
Gaither M. R., Jones S. A., Kelley C., Newman S. J., Sorenson L., Bowen B. W. (2011). High connectivity in the deepwater snapper pristipomoides filamentosus (Lutjanidae) across the indo-pacific with isolation of the Hawaiian archipelago. PloS One 6 (12), e28913. doi: 10.1371/journal.pone.0028913
Gallego R., Heimeier D., Lavery S., Sewell M. A. (2015). The meroplankton communities from the coastal Ross Sea: A latitudinal study. Hydrobiologia 761 (1), 195–209. doi: 10.1007/s10750-015-2487-7
Geller J., Meyer C., Parker M., Hawk H. (2013). Redesign of PCR primers for mitochondrial cytochrome c oxidase subunit I for marine invertebrates and application in all-taxa biotic surveys. Mol. Ecol. Resour. 13 (5), 851–861. doi: 10.1111/1755-0998.12138
Glover A. G., Wiklund H., Rabone M., Amon D. J., Smith C. R., O'Hara T., et al. (2016). Abyssal fauna of the UK-1 polymetallic nodule exploration claim, clarion-clipperton zone, central pacific ocean: Echinodermata. Biodiversity Data J. 4, e7251. doi: 10.3897/BDJ.4.e7251
Gluchowska M., Kwasniewski S., Prominska A., Olszewska A., Goszczko I., Falk-Petersen S., et al. (2016). Zooplankton in Svalbard fjords on the Atlantic–Arctic boundary. Polar Biol. 39 (10), 1785–1802. doi: 10.1007/s00300-016-1991-1
Guo J., Yu K., Wang Y., Zhang R., Huang X., and Qin Z, et al (2019). Potential impacts of anthropogenic nutrient enrichment on coral reefs in the South China Sea: Evidence from nutrient and chlorophyll a levels in seawater. Environmental Science: Processes & Impacts 21(10):1745–1753. doi: 10.1039/C9EM00331B
Han Z., Zheng W., Chen G., Shui B., Liu S., Zhuang Z. (2015). Population genetic structure and larval dispersal strategy of portunid crab charybdis bimaculata in yellow sea and East China sea. Mitochondrial DNA Part B 26 (3), 402–408. doi: 10.3109/19401736.2013.840592
Hebert P. D. N., Cywinska A., Ball S. L., DeWaard J. R. (2003). Biological identifications through DNA barcodes. Proc. R. Soc. London 270 (1512), 313–321. doi: 10.1098/rspb.2002.2218
Hidalgo M., Reglero P., Álvarez-Berastegui D., Torres A. P., Álvarez I., Rodriguez J. M., et al. (2014). Hydrographic and biological components of the seascape structure the meroplankton community in a frontal system. Mar. Ecol. Prog. Ser. 505, 65–80. doi: 10.3354/meps10763
Hilário A., Metaxas A., Gaudron S. M., Howell K. L., Mercier A., Mestre N. C., et al. (2015). Estimating dispersal distance in the deep sea: challenges and applications to marine reserves. Front. Mar. Sci. 2. doi: 10.3389/fmars.2015.00006
Hsieh H. Y., Hung J. J., Wang Y. H., Lo W. T. (2017). Hydrographic characteristics and community structure of epipelagic mesozooplankton in the dongsha (Pratas) atoll, south China Sea. Mar. Freshw. Res. 68 (12), 2228–2241. doi: 10.1071/MF16247
Huang D., Licuanan W. Y., Hoeksema B. W., Chen C. A., Ang P. O., Huang H., et al. (2015). Extraordinary diversity of reef corals in the south China Sea. Mar. Biodiversity 45 (2), 157–168. doi: 10.1007/s12526-014-0236-1
Huang D., Zhang X., Jiang Z., Zhang J., Arbi I., Jiang X., et al. (2017). Seasonal fluctuations of ichthyoplankton assemblage in the northeastern s outh c hina s ea influenced by the K uroshio intrusion. J. Geophysical Res.: Oceans 122 (9), 7253–7266. doi: 10.1002/2017JC012906
Hwang J. S., Dahms H. U., Tseng L. C., Chen Q. C. (2007). Intrusions of the kuroshio current in the northern south China Sea affect copepod assemblages of the Luzon strait. J. Exp. Mar. Biol. Ecol. 352 (1), 12–27. doi: 10.1016/j.jembe.2007.06.034
Jan S., Chern C. S., Wang J. (1994). A numerical study on currents in Taiwan strait during summertime. La Mer 32 (4), 225–234. doi: 10.1007/BF02878749
Jan S., Wang J., Chern C. S., Chao S. Y. (2002). Seasonal variation of the circulation in the Taiwan strait. J. Mar. Syst. 35 (3-4), 249–268. doi: 10.1016/S0924-7963(02)00130-6
Koettker A. G., Lopes R. M. (2013). Meroplankton spatial structure and variability on abrolhos bank and adjacent areas, with emphasis on brachyuran larvae. Continental Shelf Res. 70, 97–108. doi: 10.1016/j.csr.2013.10.004
Laroche O., Kersten O., Smith C. R., Goetze E. (2020a). Environmental DNA surveys detect distinct metazoan communities across abyssal plains and seamounts in the western clarion clipperton zone. Mol. Ecol. 29 (23), 4588–4604. doi: 10.1111/mec.15484
Laroche O., Kersten O., Smith C. R., Goetze E. (2020b). From sea surface to seafloor: A benthic allochthonous eDNA survey for the abyssal ocean. Front. Mar. Sci. 682. doi: 10.3389/fmars.2020.00682
Leray M., Yang J. Y., Meyer C. P., Mills S. C., Agudelo N., Ranwez V., et al. (2013). A new versatile primer set targeting a short fragment of the mitochondrial COI region for metabarcoding metazoan diversity: Application for characterizing coral reef fish gut contents. Front. Zool. 10 (1), 1–14. doi: 10.1186/1742-9994-10-34
Li M., Huang W., Wu Q., Feng Y., Chen Y., Yu K., et al. (2022). High genetic differentiation and moderate genetic diversity of the degenerative branching coral pocillopora verrucosa in the tropical south China Sea. Sci. Total Environ. 819, 153076. doi: 10.1016/j.scitotenv.2022.153076
Liu J., Zhang H. (2021). Combining multiple markers in environmental DNA metabarcoding to assess deep-Sea benthic biodiversity. Front. Mar. Sci. 8. doi: 10.3389/fmars.2021.684955
Li Y., Xu K. D. (2020). Species diversity and faunal characteristics of the order actiniaria (Cnidaria: Anthozoa) in the seas of China. Oceanologia Limnologia Sin. 51 (3), 434–443. doi: 10.11693/hyhz20191100237
Magoč T., Salzberg S. L. (2011). FLASH: fast length adjustment of short reads to improve genome assemblies. Bioinformatics 27 (21), 2957–2963. doi: 10.1093/bioinformatics/btr507
Minegishi Y., Gagnaire P. A., Aoyama J., Bosc P., Feunteun E., Tsukamoto K., et al. (2012). Present and past genetic connectivity of the indo-pacific tropical eel Anguilla bicolor. J. Biogeography 39 (2), 408–420. doi: 10.1111/j.1365-2699.2011.02603.x
Nan F., Xue H., Yu F. (2015). Kuroshio intrusion into the south China Sea: A review. Prog. Oceanography 137, 314–333. doi: 10.1016/j.pocean.2014.05.012
O'Connor M. I., Bruno J. F., Gaines S. D., Halpern B. S., Lester S. E., Kinlan B. P., et al. (2007). Temperature control of larval dispersal and the implications for marine ecology, evolution, and conservation. Proc. Natl. Acad. Sci. 104 (4), 1266–1271. doi: 10.1073/pnas.0603422104
Oksanen J., Kindt R., Legendre P., O’Hara B., Stevens M. H. H., Oksanen M. J., et al. (2007). The vegan package. Community Ecol. Package 10 (631-637), 719.
Palumbi S. R. (2003). Population genetics, demographic connectivity, and the design of marine reserves. Ecol. Appl. 13 (sp1), 146–158. doi: 10.1890/1051-0761(2003)013[0146:PGDCAT]2.0.CO;2
Pappalardo P., Collins A. G., Lohan P. K. M., Hanson K. M., Truskey S. B., Jaeckle W., et al. (2021). The role of taxonomic expertise in interpretation of metabarcoding studies. ICES J. Mar. Sci. 78 (9), 3397–3410. doi: 10.1093/icesjms/fsab082
Parsons T. R., Lalli C. M., Maita Y. (1984). A manual of chemical and biological methods for seawater analysis (New York: NY: Pergamon Press).
Paulay G., Boring L., Strathmann R. R. (1985). Food limited growth and development of larvae: experiments with natural sea water. J. Exp. Mar. Biol. Ecol. 93 (1-2), 1–10. doi: 10.1016/0022-0981(85)90145-5
Pechenik J. A. (1999). On the advantages and disadvantages of larval stages in benthic marine invertebrate life cycles. Mar. Ecol. Prog. Ser. 177, 269–297. doi: 10.3354/meps177269
Pinzón J. H., Sampayo E., Cox E., Chauka L. J., Chen C. A., Voolstra C. R., et al. (2013). Blind to morphology: Genetics identifies several widespread ecologically common species and few endemics among indo-pacific cauliflower corals (Pocillopora, scleractinia). J. Biogeography 40 (8), 1595–1608. doi: 10.1111/jbi.12110
Prasad D. V., Madhusudanan S., Jaganathan S. (2015). uCLUST-a new algorithm for clustering unstructured data. ARPN J. Eng. Appl. Sci. 10 (5), 2108–2117.
Qu T., Mitsudera H., Yamagata T. (2000). Intrusion of the north pacific waters into the south China Sea. J. Geophysical Res.: Oceans 105 (C3), 6415–6424. doi: 10.1029/1999JC900323
Rao Y., Cai L., Chen B., Chen X., Zheng L., Lin S. (2020). How do spatial and environmental factors shape the structure of a coastal macrobenthic community and meroplanktonic larvae cohort? evidence from daya bay. Mar. Pollut. Bull. 157, 111242. doi: 10.1016/j.marpolbul.2020.111242
Renaud P. E., Sejr M. K., Bluhm B. A., Sirenko B., Ellingsen I. H. (2015). The future of Arctic benthos: Expansion, invasion, and biodiversity. Prog. Oceanography 139, 244–257. doi: 10.1016/j.pocean.2015.07.007
Rodriguez-Lanetty M., Hoegh-Guldberg O. (2002). The phylogeography and connectivity of the latitudinally widespread scleractinian coral plesiastrea versipora in the Western pacific. Mol. Ecol. 11 (7), 1177–1189. doi: 10.1046/j.1365-294X.2002.01511.x
Shanks A. L., Largier J., Brink L., Brubaker J., Hooff R. (2002). Observations on the distribution of meroplankton during a downwelling event and associated intrusion of the Chesapeake bay estuarine plume. J. Plankton Res. 24 (4), 391–416. doi: 10.1093/plankt/24.4.391
Short J., Metaxas A., Daigle R. M. (2013). Predation of larval benthic invertebrates in St george’s bay, Nova Scotia. J. Mar. Biol. Assoc. United Kingdom 93 (3), 591–599. doi: 10.1017/S0025315412000768
Shu Y., Wang Q., Zu T. (2018). Progress on shelf and slope circulation in the northern South China Sea. Sci. China Earth Sci. 61 (5), 560–571. doi: 10.1007/s11430-017-9152-y
Silberberger M. J., Renaud P. E., Espinasse B., Reiss H. (2016). Spatial and temporal structure of the meroplankton community in a sub-Arctic shelf system. Mar. Ecol. Prog. Ser. 555, 79–93. doi: 10.3354/meps11818
Sinniger F., Pawlowski J., Harii S., Gooday A. J., Yamamoto H., Chevaldonné P., et al. (2016). Worldwide analysis of sedimentary DNA reveals major gaps in taxonomic knowledge of deep-sea benthos. Front. Mar. Sci. 3. doi: 10.3389/fmars.2016.00092
Sommer S. A., Van Woudenberg L., Lenz P. H., Cepeda G., Goetze E. (2017). Vertical gradients in species richness and community composition across the twilight zone in the north pacific subtropical gyre. Mol. Ecol. 26 (21), 6136–6156. doi: 10.1111/mec.14286
Sprintall J., Tomczak M. (1992). Evidence of the barrier layer in the surface layer of the tropics. J. Geophysical Res.: Oceans 97 (C5), 7305–7316. doi: 10.1029/92JC00407
van der Loos L. M., Nijland R. (2021). Biases in bulk: DNA metabarcoding of marine communities and the methodology involved. Mol. Ecol. 30 (13), 3270–3288. doi: 10.1111/mec.15592
Wang Z., Zhang Y., Zhao L., Song N., Han Z., Gao T. (2016). Shallow mitochondrial phylogeographical pattern and high levels of genetic connectivity of thamnaconus hypargyreus in the South China Sea and the East China Sea. Biochem. Systematics Ecol. 67, 110–118. doi: 10.1016/j.bse.2016.05.013
Xu A., Chen Z., Qu Y., Tian Y., Shu C., Zheng X., et al. (2019). Cold-water corals in a cold seep area on the northern continental slopes of the South China sea and their isotopic characteristics. Deep Sea Res. Part I: Oceanographic Res. Papers 152, 103043. doi: 10.1016/j.dsr.2019.05.003
Ye Y., Li J., Wu C. (2015). Genetic diversity and population connectivity of the Asian green mussel perna viridis in south China Sea, inferred from mitochondria DNA markers. Biochem. Systematics Ecol. 61, 470–476. doi: 10.1016/j.bse.2015.07.009
Yuan Y., Liao G., Xu X. (2007). Three dimensional diagnostic modeling study of the South China Sea circulation before onset of summer monsoon in 1998. J. Oceanography 63 (1), 77–100. doi: 10.1007/s10872-007-0007-8
Yuan Y., Liao G., Yang C. (2009). A diagnostic calculation of the circulation in the upper and middle layers of the Luzon strait and the northern south China Sea during march 1992. Dynamics Atmospheres Oceans 47 (1-3), 86–113. doi: 10.1016/j.dynatmoce.2008.10.005
Zardus J. D., Etter R. J., Chase M. R., Rex M. A., Boyle E. E. (2006). Bathymetric and geographic population structure in the pan-Atlantic deep-sea bivalve deminucula atacellana (Schenc). Mol. Ecol. 15 (3), 639–651. doi: 10.1111/j.1365-294X.2005.02832.x
Zeng K., Xu Z., Yang Y., Liu Y., Zhao H., Zhang Y., et al. (2022). In situ hyperspectral characteristics and the discriminative ability of remote sensing to coral species in the south China Sea. GIScience Remote Sens. 59, 1–23. doi: 10.1080/15481603.2022.2026641
Zhang G. K., Chain F. J., Abbott C. L., Cristescu M. E. (2018). Metabarcoding using multiplexed markers increases species detection in complex zooplankton communities. Evolutionary Appl. 11 (10), 1901–1914. doi: 10.1111/eva.12694
Zhang G., Chen S., Chen D. (2014). The relationship between zooplankton and the environmental factors in the coastal waters of hainan island in the early summer. Acta Oceanologica Sin. 36 (12), 125–132. doi: 10.1007/s13131-014-0508-4
Keywords: biogeography, diversity, environmental factor, meroplankton, metabarcoding, Philippine Sea, South China Sea
Citation: Qihang L, Yuanming C, Qianwen S, Zaiming W, Wei X, Yadong Z, Dong S, Xiaohui X and Dongsheng Z (2022) Metabarcoding survey of meroplankton communities in the South China Sea and Philippine Sea: Shedding light on inter-basin biogeography in the West Pacific. Front. Mar. Sci. 9:968666. doi: 10.3389/fmars.2022.968666
Received: 14 June 2022; Accepted: 01 August 2022;
Published: 24 August 2022.
Edited by:
Tommaso Russo, University of Rome Tor Vergata, ItalyReviewed by:
Giulia Maiello, University of Rome Tor Vergata, ItalyCopyright © 2022 Qihang, Yuanming, Qianwen, Zaiming, Wei, Yadong, Dong, Xiaohui and Dongsheng. This is an open-access article distributed under the terms of the Creative Commons Attribution License (CC BY). The use, distribution or reproduction in other forums is permitted, provided the original author(s) and the copyright owner(s) are credited and that the original publication in this journal is cited, in accordance with accepted academic practice. No use, distribution or reproduction is permitted which does not comply with these terms.
*Correspondence: Zhang Dongsheng, ZHN6aGFuZ0BzaW8ub3JnLmNu
Disclaimer: All claims expressed in this article are solely those of the authors and do not necessarily represent those of their affiliated organizations, or those of the publisher, the editors and the reviewers. Any product that may be evaluated in this article or claim that may be made by its manufacturer is not guaranteed or endorsed by the publisher.
Research integrity at Frontiers
Learn more about the work of our research integrity team to safeguard the quality of each article we publish.