 Jesse N. Beckman
 Joseph W. Long
- Department of Physics and Physical Oceanography, University of North Carolina Wilmington, Wilmington, NC, United States
A yearlong wind and wave dataset derived from a cost-effective GPS wave buoy (Spotter) is compared to waves obtained from an accelerometer wave buoy (Datawell) and winds obtained from a collocated meteorological buoy. Overall, there was a strong correlation in bulk wave parameters obtained from the Spotter buoy and the Datawell buoy (RMSE of 0.06 m, 0.27 s, and 21.89° for significant wave height, mean wave period, and peak wave direction, respectively). Similarly, the bulk characteristics compared well when separating the directional wave spectra into sea and swell components with more scatter in mean wave periods for lower frequencies. Measurements of mean directional spread from the Spotter buoy were 7.51° larger than the Datawell, spreading more wave energy across different directions outside the peak direction. Additional analysis indicates that the increased directional spreading arises from a bias in the a1 and b1 spectral moments. Using the equilibrium frequency range of the wave energy spectrum, the Spotter buoy can derive wind speed and direction. This study found the Spotter buoy can report wind speed and direction with reasonable accuracy but underestimates wind speeds less than 4 m/s and greater than 8 m/s and was less accurate reporting wind directions oriented offshore. A comparison with a Spotter buoy in deeper water revealed the Spotter buoy further offshore was most accurate in reporting wind directions indicating this proxy-based measurement of wind speed and wind direction may be significantly influenced by fetch and local geography (e.g., large-scale cuspate coastlines).
Introduction
Offshore wave and wind data are crucial for characterizing regional wave climates, ocean navigation, understanding controls on wave transformation, and forcing hydrodynamic models used to inform coastal management decisions. Yet, collocated wind and wave datasets are spatially coarse as oceanographic instrumentation is often costly and challenging to deploy and maintain. These obstacles have resulted in efforts to make ocean measurements more accessible through low-cost devices, including smaller commercial off-the-shelf (COTS) wave buoys (Raghukumar et al., 2019; Houghton et al., 2021) and proxies to derive wind speeds and directions from wave energy spectra rather than direct wind measurements (Philips, 1985; Thomson et al., 2013; Voermans et al., 2020).
Surface-following wave buoys provide the primary source of wave measurements beyond shallow nearshore areas. Accelerometer-based wave buoys have been extensively validated in the field (O’Reilly et al., 1996; Colbert, 2010) and are considered among the most reliable options for acquiring spectral wave data. However, the high cost and size/weight of these buoys limits deployments and therefore the spatial resolution of available wave observations. GPS-based wave buoys are less expensive and have been found to give similar accuracy in wave measurements compared to accelerometer wave buoys (Jeans et al., 2003; Colbert, 2010). A past disadvantage of using GPS-based wave buoys was the requirement of a fixed reference point, limiting the offshore extent they could be deployed (Joodaki et al., 2013). However, the utilization of a high-pass filtering algorithm developed by Iwanaka et al. (2005) and improved on by Joodaki et al. (2013) now allows for GPS-based wave buoys to have cm-level accuracy in measuring wave heights and 1% error in wave direction measurements without the need for a nearby base station.
COTS wave buoys developed by Datawell are considered by many to be the industry standard (Andrews and Peach, 2019) with their accelerometer and GPS-based wave buoys proven to have 1 cm-level accuracy (de Vries et al., 2003; Jeans et al., 2003; Colbert, 2010). Although GPS-based wave buoys are less expensive than accelerometer-based wave buoys, Datawell GPS wave buoys remain costly and there has been a push for low-cost, easily deployable, solar powered wave buoys (Colbert, 2010; Raghukumar et al., 2019). Cost-efficient COTS buoys offer the potential to fill in spatial gaps in ocean observations of wave, wind, and surface current data (Voermans et al., 2020; Houghton et al., 2021). This study tests the performance one such buoy, the Spotter, developed by Sofar Ocean. Proliferation in the use of these technologies to fill gaps in ocean observations has led to a need for robust analyses of their performance over longer time periods and a need to identify regional characteristics that may impact the measurement of both wave and wind processes.
Raghukumar et al. (2019) conducted a lab experiment between a Spotter buoy and a motion-controlled validation test stand in addition to a series of moored field tests ranging from 10 m to 40 m in water depth. Field tests also included comparisons to a Datawell DWR-G4 buoy and ADCP-derived wave characteristics with a maximum test duration of 10-days. They found that for both field and laboratory tests bulk wave statistics from the Spotter were comparable to those recorded by other methods and a preliminary investigation of wave speed estimates by the Spotter was comparable to those predicted by linear wave theory. A similar study was completed by Janssen (2020) between a Spotter and a Datawell DWR-G4 over a 12-day period in 40 m water depth with similar findings. Andrews and Peach (2019) performed a comprehensive study between the bulk wave statistics and raw displacement data recorded by the Spotter and a variety of other devices for a two-month period from mid-March to the end of June in 16 m water depth. There was a consistent correlation between the Spotter and a Datawell DWR-G4 (considered the “truth” in the study). A two-month-long analysis of wave measurements from a Spotter, ADCP, and two RBR pressure loggers by Lancaster et al. (2021) in 7 m water depth also demonstrated a strong agreement in measured integrated wave statistics (significant wave height, peak wave period, and mean wave direction) between the Spotter and ADCP, although the Spotter recorded lower energy near the peak frequency. The RBR pressure loggers were found to be the least accurate compared to wave statistics (significant wave height and mean wave period) recorded by the Spotter and ADCP.
Similar to wave measurements, offshore wind data is limited by a lack of meteorological buoys (Voermans et al., 2020). Offshore wind measurements are important for understanding and modeling air-sea interactions and ocean phenomena to inform coastal management decisions as well as identify potential locations for renewable energy (e.g., wind farms). While Spotter buoys do not make direct measurements of meteorological variables, the wind speed and direction are estimated using portions of the directional wave spectra as a proxy (Voermans et al., 2020). This is done based on the assumed relationship between the wind friction velocity and energy within the equilibrium range of the wave spectrum (Philips, 1985; Thomson et al., 2013; Voermans et al., 2020). Using collocated wind and wave measurements from NDBC buoys, Voermans et al. (2020) found proxy-based wind speeds and directions were reasonably accurate compared to direct measurements, although the accuracy was impacted by a number of factors (e.g., fetch, wave steepness, wave age, misalignment between wind and peak wave directions, etc.). Using wind and wave data obtained from a drifting Spotter network in the Pacific Ocean, Houghton et al. (2021) performed a triple collocation analysis to compare Spotter measurements against satellite observations and model outputs over a 12-month period. The analysis highlighted an error in Spotter wind estimates at high wind speeds. This was attributed to either young energetic seas or an inaccurate identification of the equilibrium region of recorded wave spectra by the Spotter. Specific studies that test the accuracy of proxy-derived wind parameters from these low-cost buoys against meteorological buoys in different settings are very limited.
This study builds off comparisons performed by past studies that utilized moored Spotter buoys, with a focus on providing comparisons over a yearlong dataset that covers a range of wave conditions on the inner continental shelf of a large-scale (~155 km between headlands) embayment between two capes. Similar to previous work we investigate bulk wave statistics, but in addition to the increased observational time series we build upon previous comparisons by focusing on separate swell and sea frequencies, detailing characteristics of the frequency-directional wave spectra and expanding on the limited comparisons between measured and proxy-based wind speeds and directions using Spotter buoys. To do so, statistical analyses were completed between a Spotter deployed near a Datawell Directional Waverider MkIII (Datawell) and a metrological buoy using half-hourly to hourly observations over a 12-month time period.
Methods
The Spotter was deployed ~190 m apart from a collocated Datawell and meteorological buoy located ~9.8 km offshore of Masonboro Inlet, North Carolina in 15.2 m (NAVD88) water depth (Figure 1). The Datawell and meteorological buoys are operated by the Coastal Ocean Research Monitoring Program (CORMP) and are used as the controls in this study. The mooring configuration for the Spotter utilized two surface floats with a mooring line length (polypropylene rope) of ~36 m (Figure 2). The Datawell mooring configuration utilized two neutrally buoyant floats with a mooring line (rubber cord) length of ~30 m.
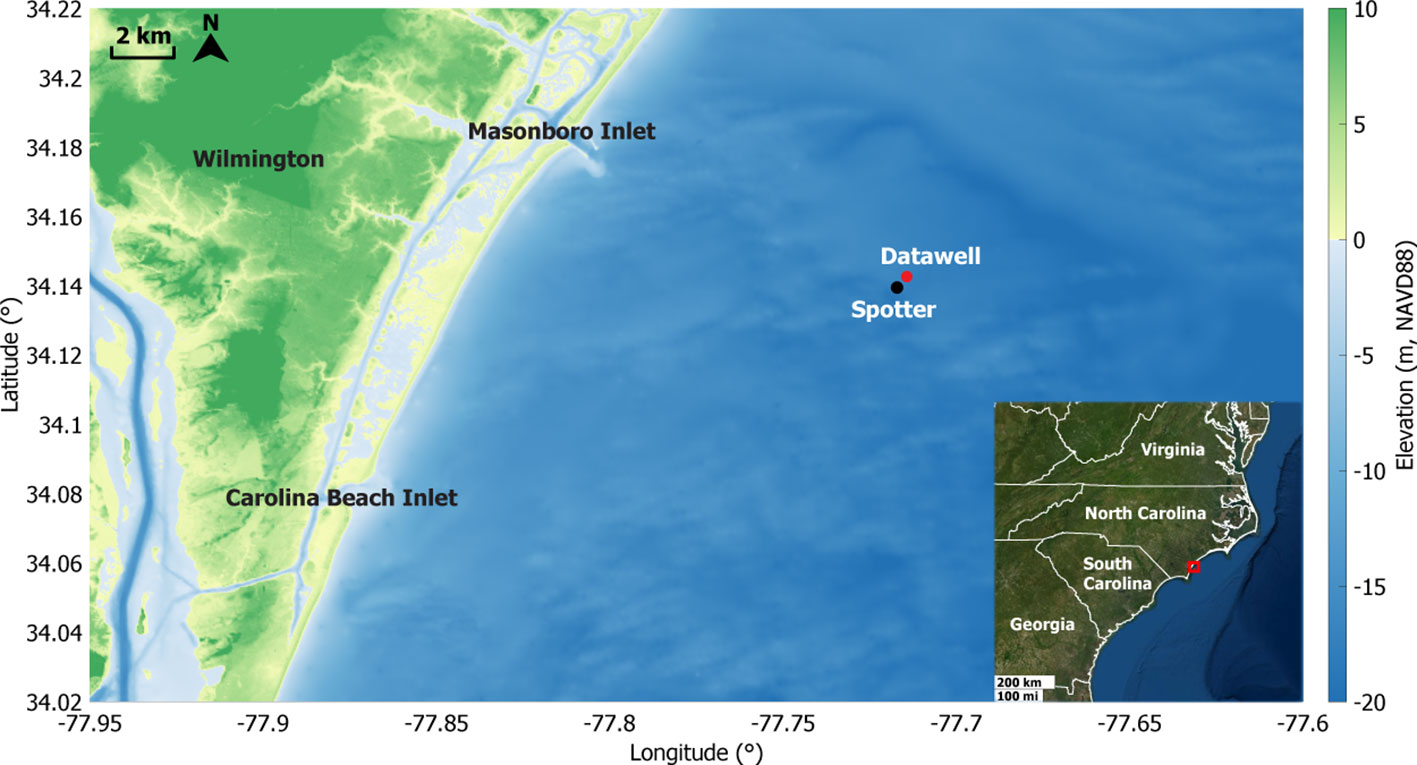
Figure 1 Location of the Datawell and Spotter wave buoys offshore of Masonboro Inlet, North Carolina.
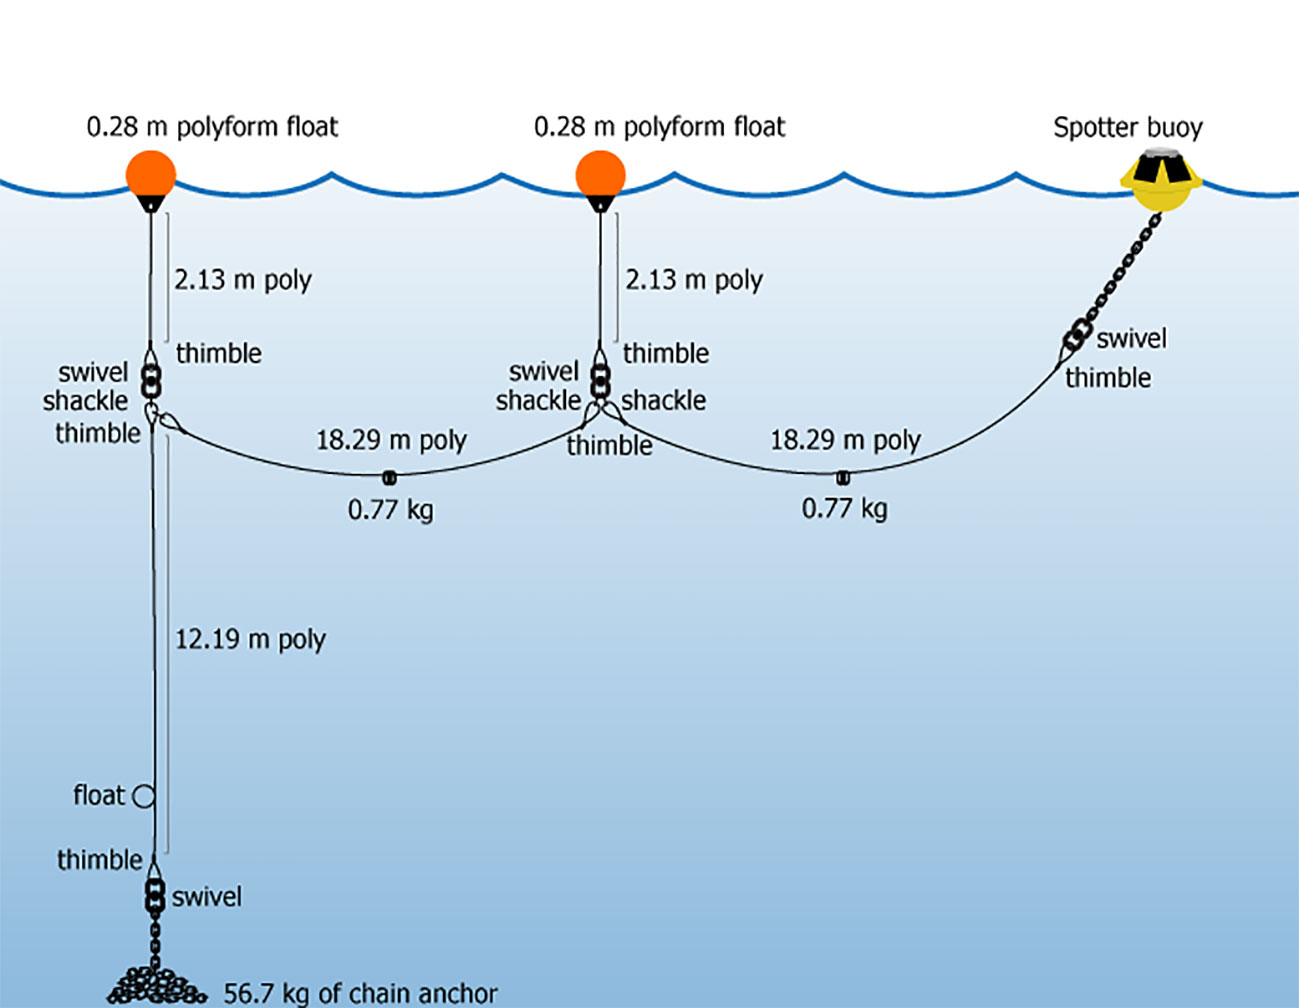
Figure 2 Diagram depicting the Spotter buoy mooring.
The Spotter was swapped out once as part of a routine maintenance schedule between its initial deployment on December 3rd, 2020, and final recovery of the buoy on December 15th, 2021, providing a year’s worth of almost continuous data for comparisons of wind and wave data. Over the duration of the study period, the Spotter recorded 237 instances of peak periods greater than 20 s. The Spotter buoy uses a linear frequency grid that translates to coarser resolutions for higher wave periods which can result in large spikes. As the Datawell buoy did not record peak periods greater than 20 s these points were considered erroneous and removed. Wave and wind data were reported at 30 and 60-minute intervals, respectively. To ensure a consistent comparison between control and Spotter datasets, each dataset was interpolated to a consistent time series; missing data points were set to NaN.
Lightweight and compact (~5.5 kg and 38-cm diameter), the Spotter combines GPS, satellite communication, and solar technologies to measure 3-D surface displacements at 2.5 Hz for 30 minutes to compute a cross-spectral matrix; bulk wave statistics are computed onboard from the spectra. Raw displacement data is stored on an SD card which can be retrieved and used for analyses of wave parameters with the use of a parsing script provided by Sofar Ocean. For a more detailed description of the Spotter, information on recorded spectra and calculated wave statistics, the reader is directed to Raghukumar et al. (2019) and Smit (2018). The Datawell buoy utilizes three accelerometers (one for wave height, two for wave direction) to make measurements of spectral wave energy. While the Datawell buoy is larger (~109 kg and 70-cm diameter), it is an established and accurate device for measuring ocean wave spectra.
Quantitative comparisons were made between bulk wave statistics (significant wave height, mean wave direction, peak wave period, mean directional spread) recorded by the Spotter and Datawell buoy, and between wind parameters (wind speed and wind direction) recorded by the meteorological buoy and estimated by the Spotter. To estimate wind parameters from wave spectra, the Spotter identifies the equilibrium range by computing the minimum variance between an f -4 slope and the observed wave energy density in 20 consecutive frequency bins (Houghton et al., 2021). Wind friction velocity is then derived from the equilibrium range and converted to a U10 wind speed (Houghton et al., 2021). Wind direction is calculated using the average first order Fourier coefficients across the identified equilibrium range (Houghton et al., 2021). The Spotter buoy reports U10 wind speeds while the meteorological buoy measures and reports wind speeds at an anemometer height of 2.95 m. For consistent comparisons, meteorological buoy wind speeds were converted to U10 using the power law U10/Ua = (10/Za)0.11 (Hsu et al., 1994) where Ua is the recorded wind speed and Za is the anemometer height. Sea and swell waves were separated for the two buoys using a 0.127 Hz (8 s period) frequency threshold and bulk wave statistics were then computed for each partition and compared between the two buoys. To evaluate the Spotter’s ability to record multimodal directional wave spectra, multimodal wave spectra were identified for each buoy if at least two wave energy peaks existed at least 30° apart where the smaller energy peak at least 50% the size of the larger energy peak.
Using the raw displacement data from both buoys, investigations were also made into the spectral accuracy of the Spotter in recording energy density across frequency and direction, and the variance density spectrum which was estimated using the maximum entropy method (Lygre and Krogstad, 1986). For wave variance density spectrum comparisons, Spotter wave energies were interpolated to the Datawell frequency grid. Mean directional spread was calculated for both wave buoys using the average frequency weighted first-order moments (a1 and b1):
As the Datawell buoy does not report mean direction, mean direction was calculated for both wave buoys also using the average frequency weighted first-order moments (a1 and b1):
The bias, RMSE, and R2 were calculated between the Spotter and the two control buoys. The bias (equation 3) and RMSE (equation 4) were calculated as follows where the Datawell and meteorological buoy are interchangeable:
Results
Average (standard deviation) peak wave direction, significant wave height, and peak period during the deployment were 128.02 (37.98) degrees (nautical convention), 0.88 (0.36) m, and 7.76 (2.67) seconds, respectively. The maximum significant wave height during this timeframe was 2.95 m. Comparatively, average (standard deviation) peak wave direction, significant wave height, and peak period since 2008 were 129.80 (40.04) degrees (nautical convention), 0.93 (0.39) m, and 7.69 (2.67) seconds, respectively, with a maximum significant wave height of 5.10 m. Average (standard deviation) wind speeds and wind directions during the covered timeframe were 5.77 (2.72) m/s and 169.78 (107.77) degrees. The maximum wind speed during this timeframe was 16.37 m/s. Since 2008, average (standard deviation) wind speeds and wind directions were 5.71 (2.72) m/s and 172.01 (101.71) degrees. Hence, the wind and wave characteristics observed during the time period of the analysis below are representative of the general climatology for the region.
Comparisons of bulk wave statistics between the Spotter and Datawell are shown in Figures 3, 4 with error statistics reported in Table 1. There was a strong correlation (0.98 R2) in Spotter and Datawell reported significant wave heights with low error and bias (RMSE and bias of 0.06 m and -0.01 m, respectively). A lower correlation existed in comparisons of peak period (0.64 R2) with slightly smaller values reported by the Spotter (bias of -0.18 s); a stronger correlation (0.93 R2) and lower error (RMSE of 0.27 s) was found in mean period values. The second lowest correlation (0.67 R2) existed between peak wave direction between the two wave buoys. Due to the large scatter in Datawell recorded wave directions, the majority of Spotter recorded peak wave directions (93%) still fell within 1 standard deviation of those reported by the Datawell buoy. A higher correlation (0.84 R2) was found between mean wave directions recorded by the two buoys compared to peak wave direction (0.67 R2). A distinct bias (7.51°) was observed between the mean directional spread recorded by the two buoys with the Spotter overestimating mean directional spread.
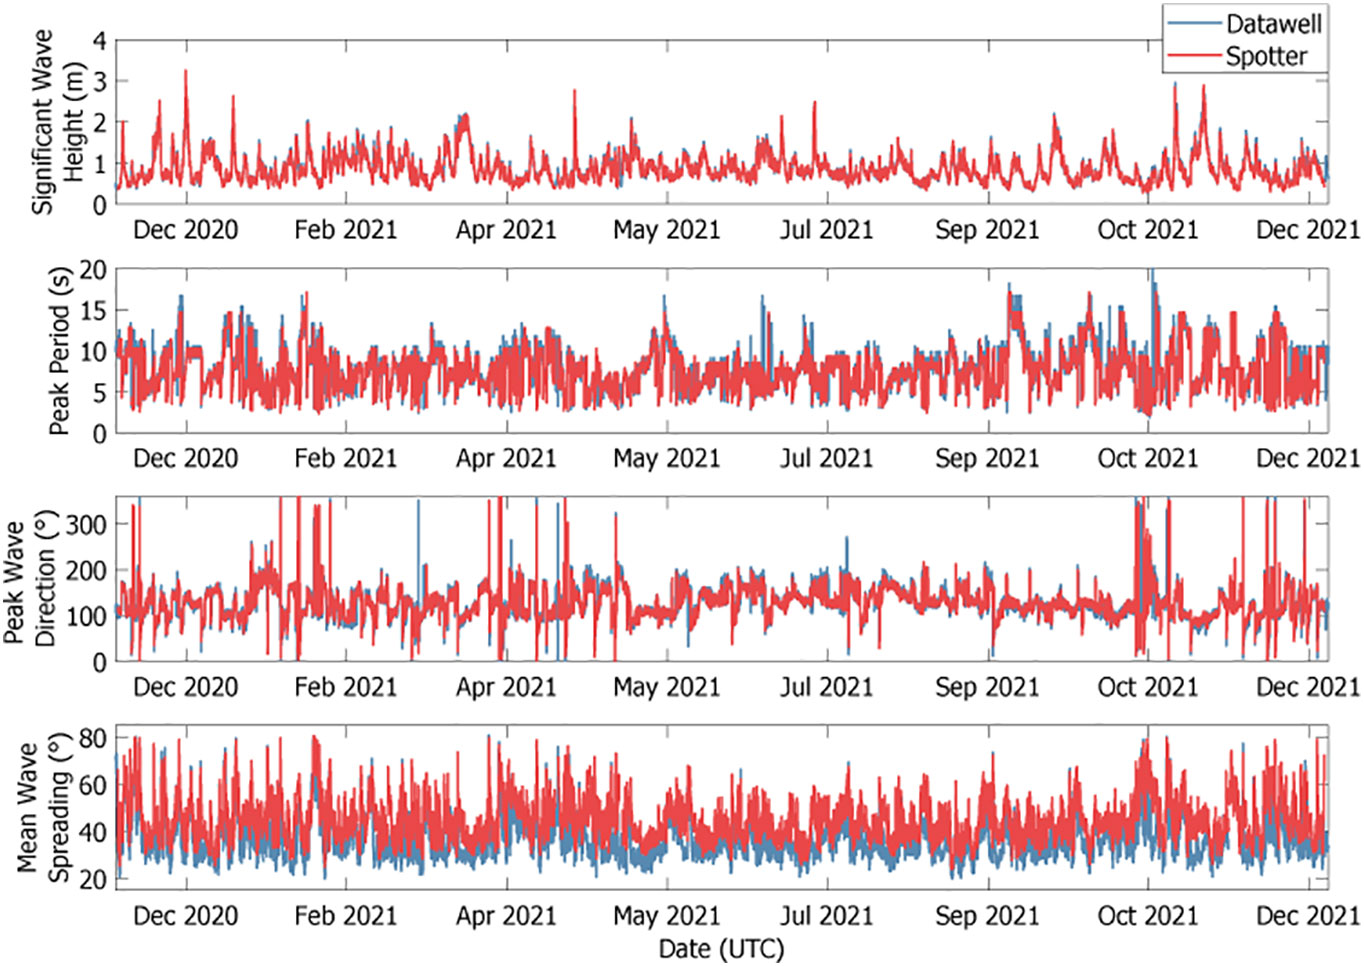
Figure 3 Time series plots comparing bulk wave statistics reported by the Datawell and Spotter wave buoys.
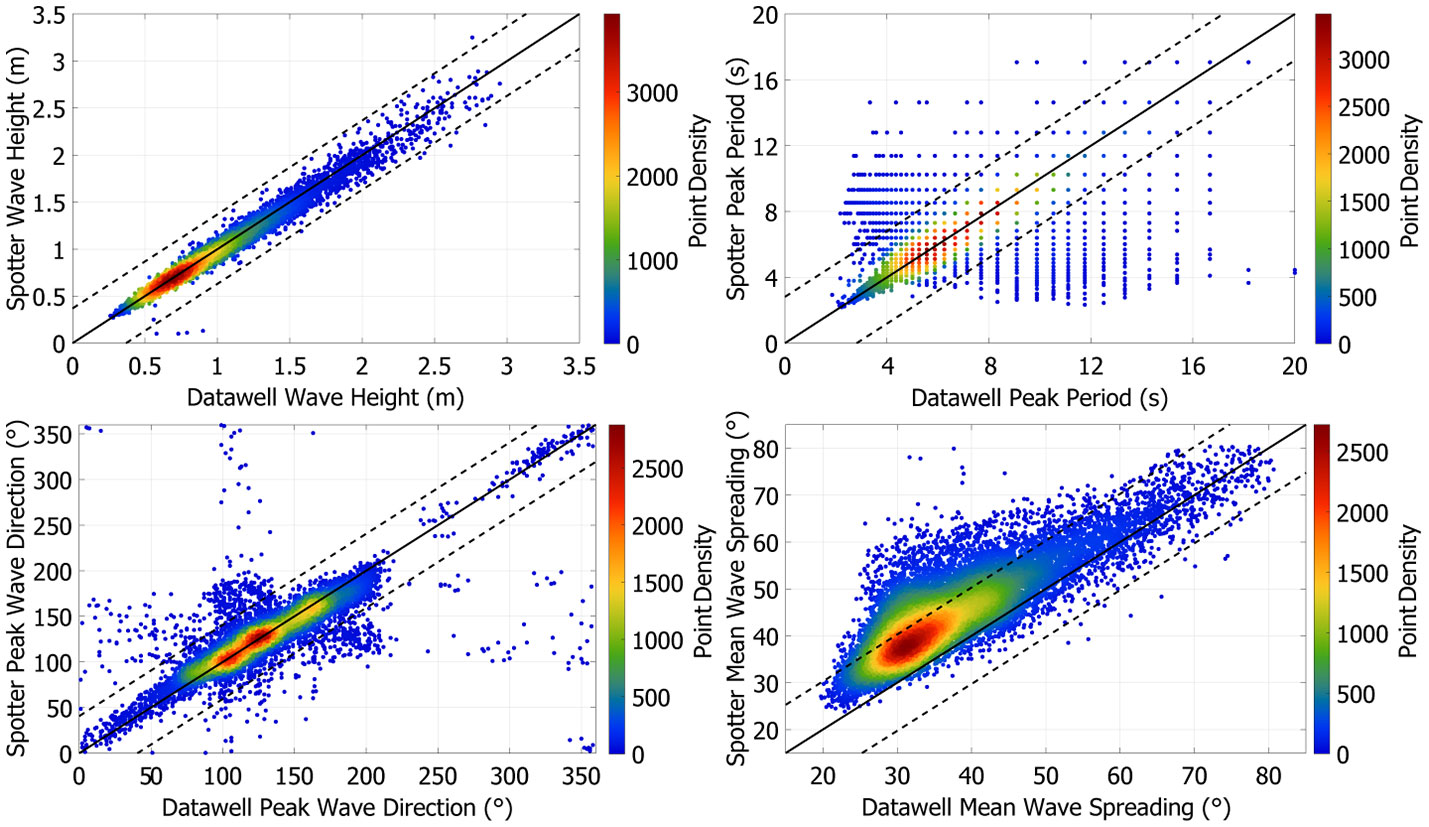
Figure 4 Density scatter plots of significant wave heights (top left), peak periods (top right), peak wave directions (bottom left), and mean wave spreading (bottom right) values reported by the Datawell and Spotter wave buoys. The solid black line through the origins shows a 1:1 relationship between the two buoys; the dashed black lines show one standard deviation for the Datawell from the 1:1 line.
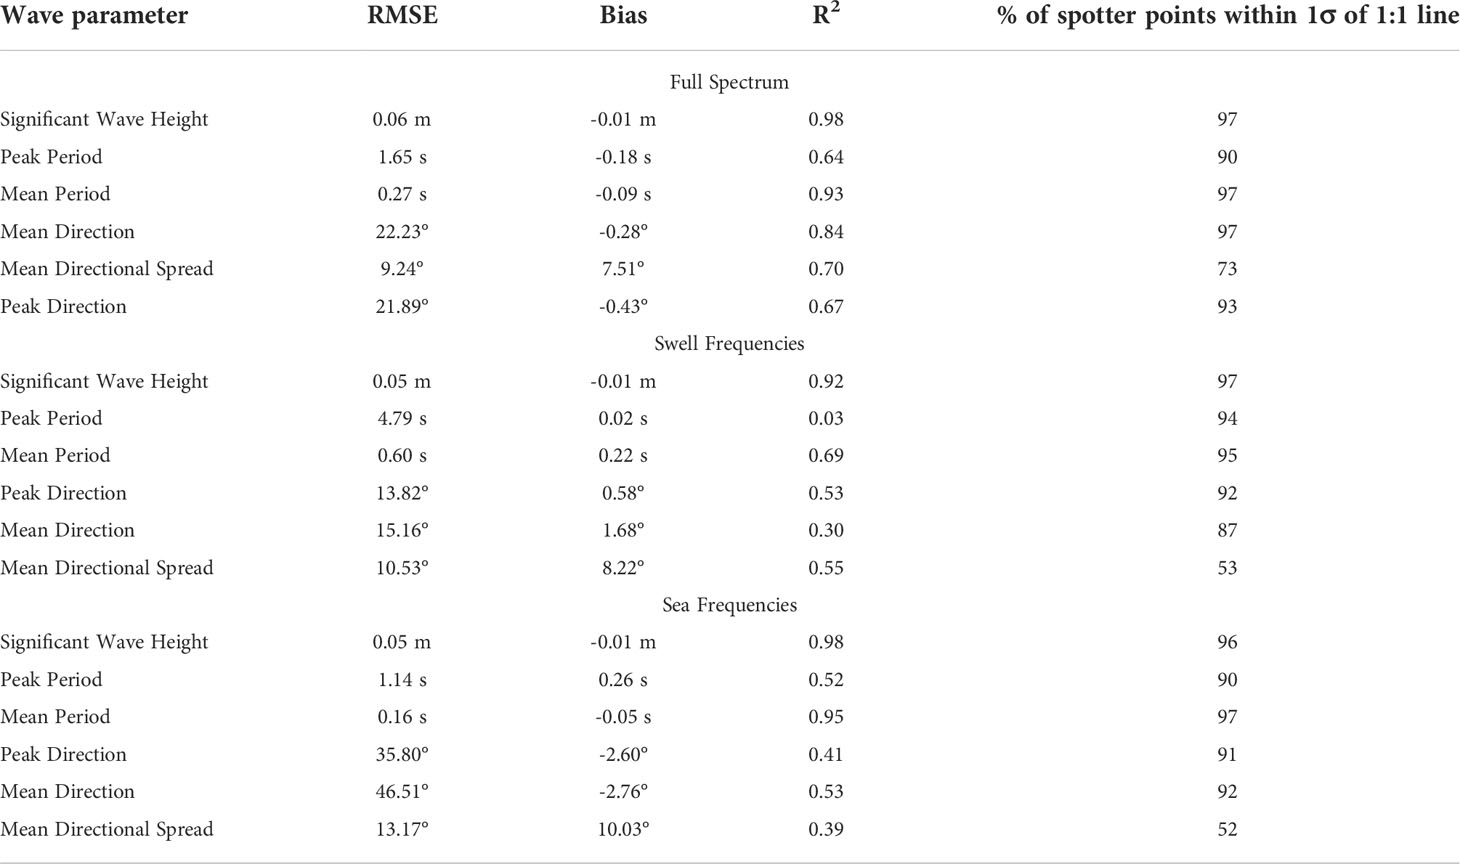
Table 1 Statistics comparing bulk wave statistics reported by the Datawell and Spotter wave buoys for the full wave spectrum and swell and sea frequencies.
Error statistics calculated for the swell and sea bulk wave statistics are shown in Table 1 and a comparison is shown in Figure 5. There was excellent agreement between Spotter and Datawell buoy derived significant wave heights for both swell (0.05 m RMSE, -0.01 m bias, 0.92 R2) and sea frequencies (0.05 m RMSE, -0.01 m bias, 0.98 R2). For peak period, greater error was found for swell frequencies (4.79 s RMSE) with a low correlation (0.03 R2) compared to sea frequencies (1.14 s RMSE, 0.52 R2). Similarly, there was a lower correlation and greater error for mean swell periods (0.60 s RMSE, 0.69 R2) compared to mean sea periods (0.16 s RMSE, 0.95 R2). Error for swell peak (13.82° RMSE) and mean directions (15.16° RMSE) were lower than those calculated for sea peak (35.80° RMSE) and mean directions (46.51° RMSE). A positive bias was found for both swell (8.22°) and sea mean directional spreads (10.03°).
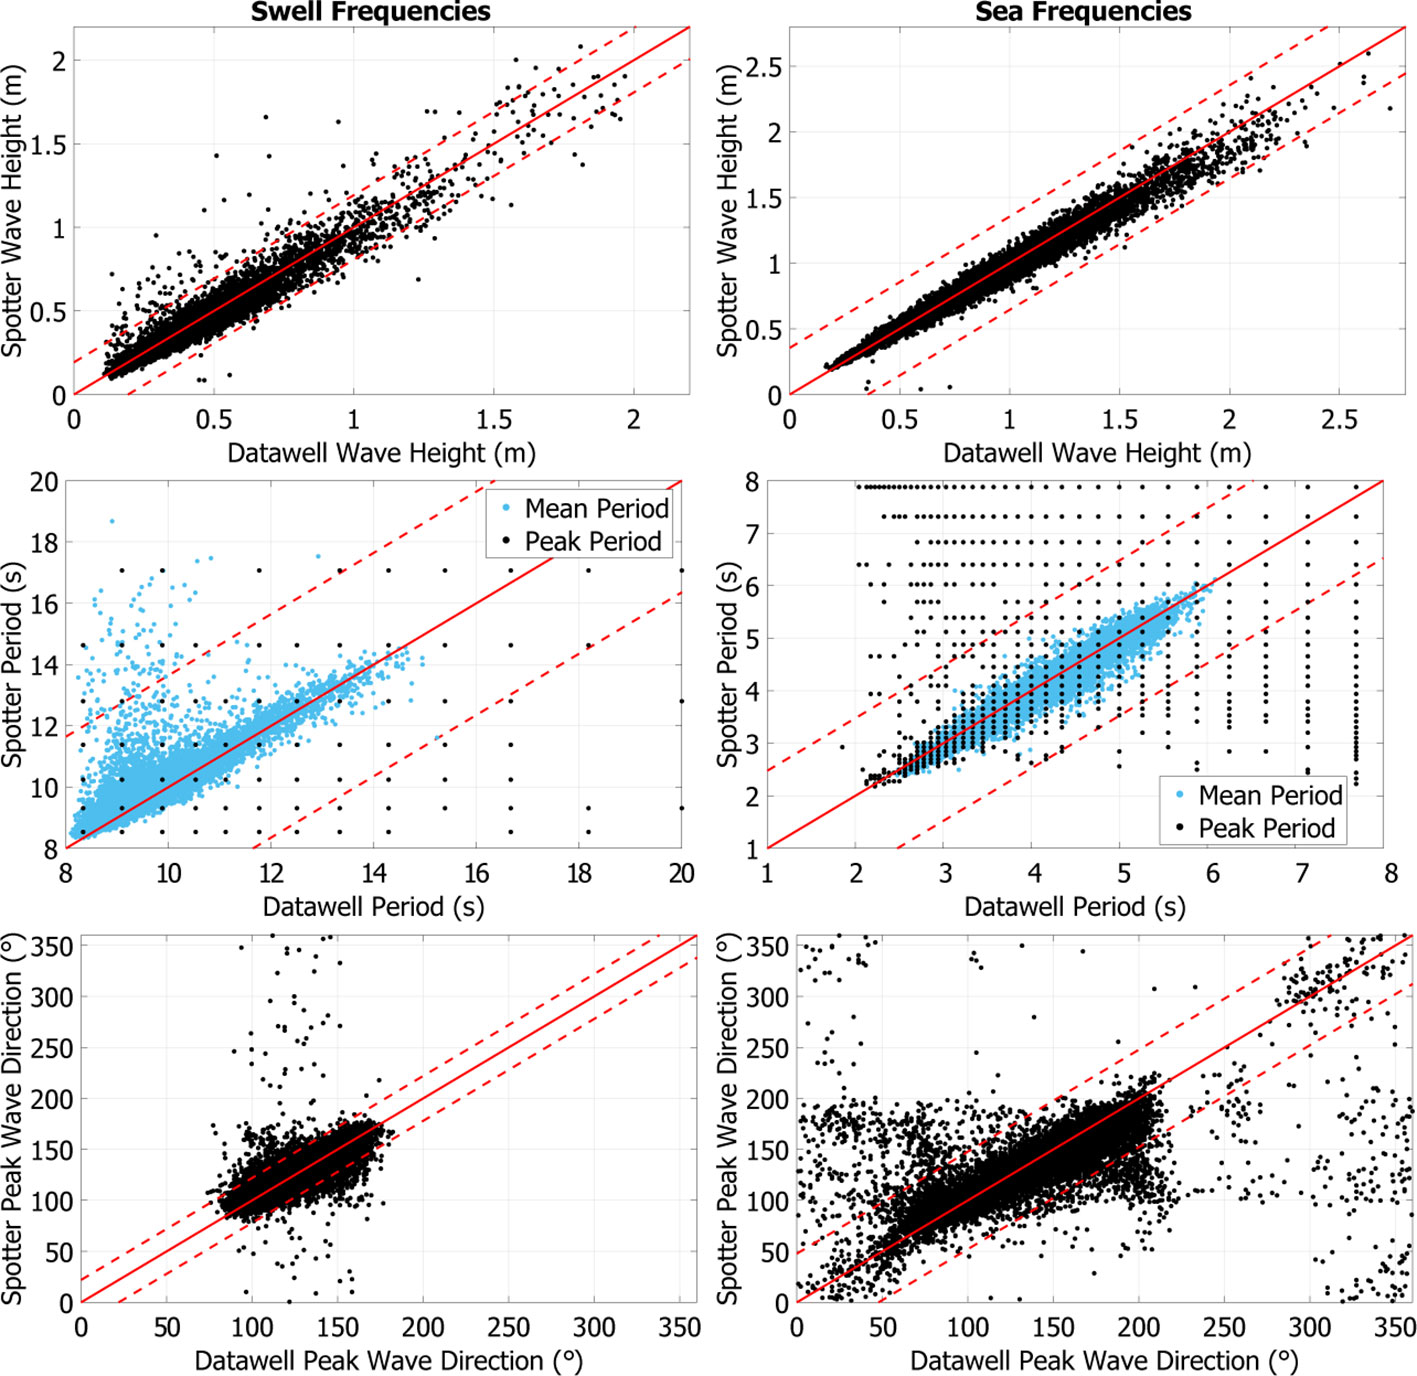
Figure 5 Scatter plots of significant wave height (top row), peak period and mean period (middle row), and peak wave directions (bottom row) calculated for swell frequencies (left column) and sea frequencies (right column) of the Datawell and Spotter wave buoys. The solid red line through the origins shows a 1:1 relationship between the two buoys; the dashed red lines show one standard deviation for the Datawell from the 1:1 line. For the middle row, the dashed red lines show one standard deviation for Datawell reported peak periods from the 1:1 line.
A visual analysis of energy density reported by the two buoys over time indicated the Spotter was less accurate in capturing lower frequencies (less than ~0.1 Hz) but was proficient recording energy densities at higher frequencies (Figure 6). The Spotter captured general trends in the directional distribution of wave energy but tended to measure more wave energy traveling outside of the peak direction compared to the Datawell (Figure 7). To better understand differences in wave spectra recorded by the two buoys, the variance density spectra as a function of frequency and direction were compared for three time periods where there was disagreement in reported bulk statistics (Table 2 and Figure 8). The plots in Figure 8 highlight the errors reported in Table 1 where the Spotter buoy was less accurate in recording wave energy at lower frequencies and across different directions. Over the duration of the dataset, the Datawell buoy identified 7421 instances of multimodal directional wave spectra while the Spotter buoy identified 3984 instances of multimodal directional wave spectra (~46% less than the Datawell buoy). The bottom right panel in Figure 8 is one example where the Spotter buoy did not resolve all directional peaks in the wave spectrum.
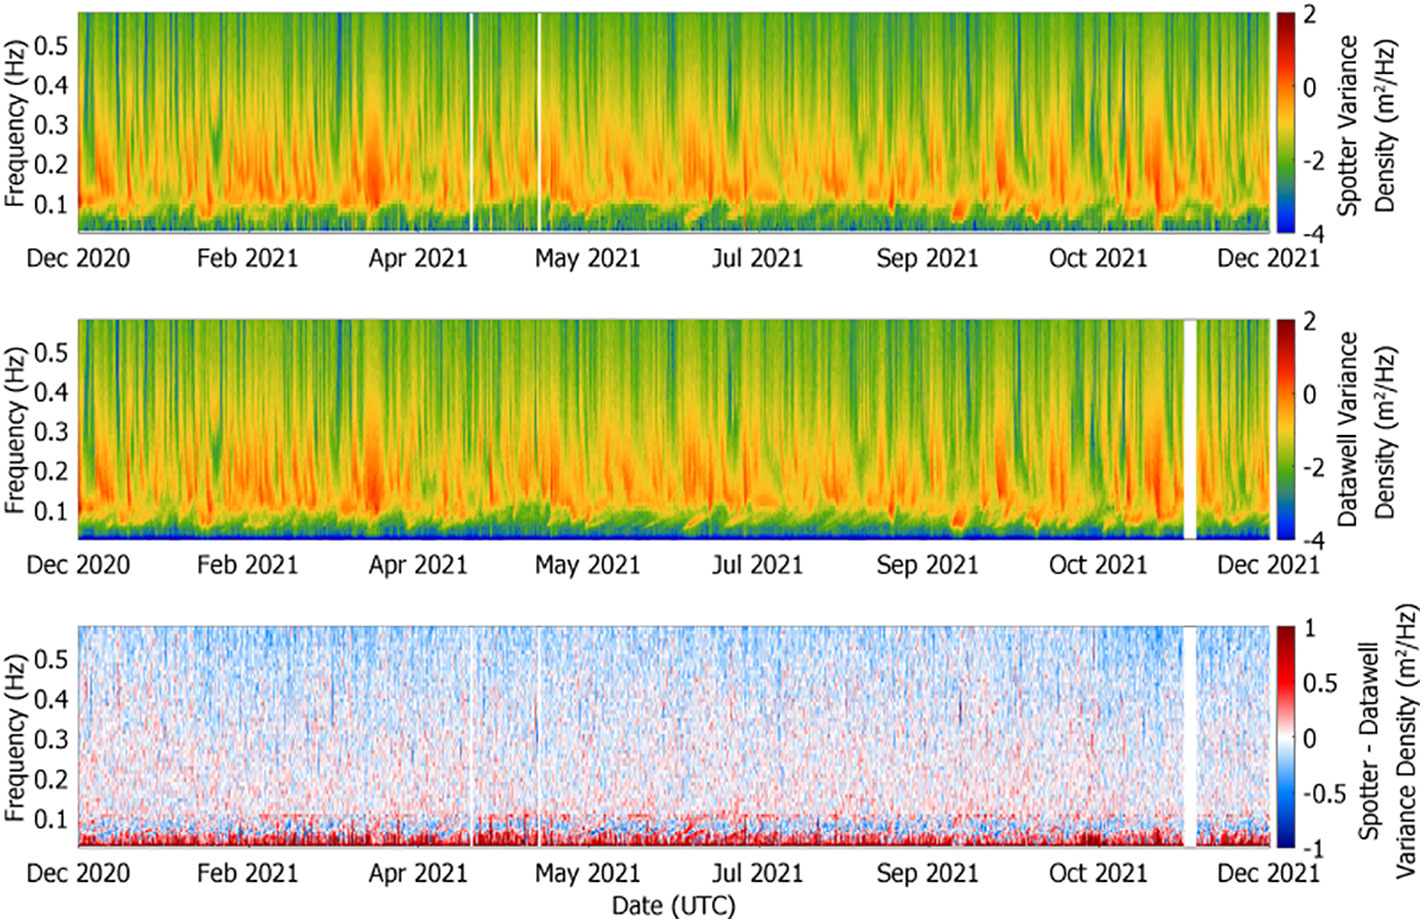
Figure 6 Time series displaying wave energy against frequency recorded by the Spotter (top) and Datawell (center) wave buoys on a log scale.
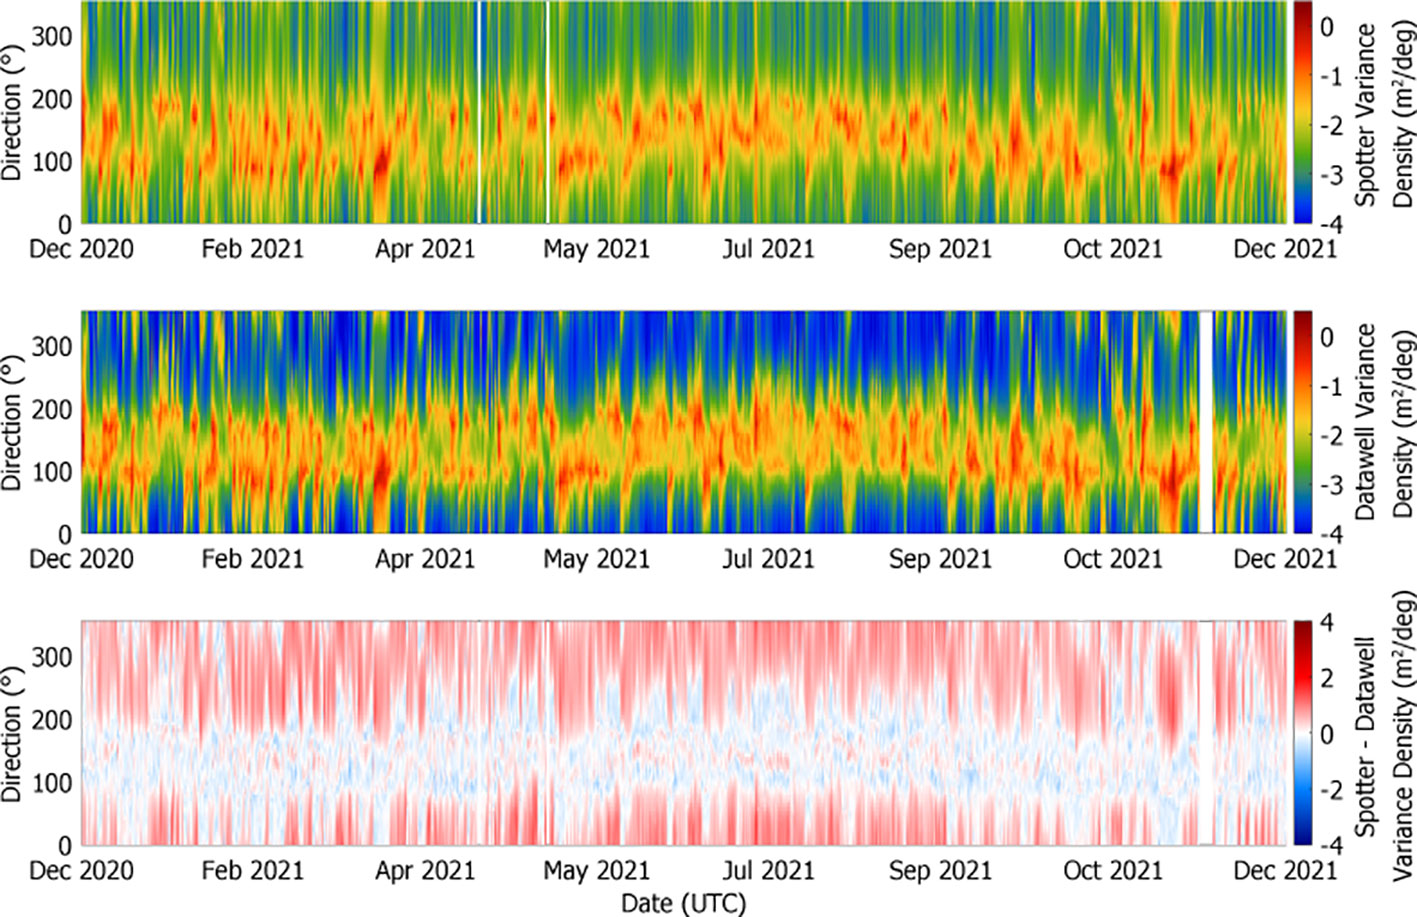
Figure 7 Time series displaying wave energy against direction recorded by the Spotter (top) and Datawell (center) wave buoys on a log scale.
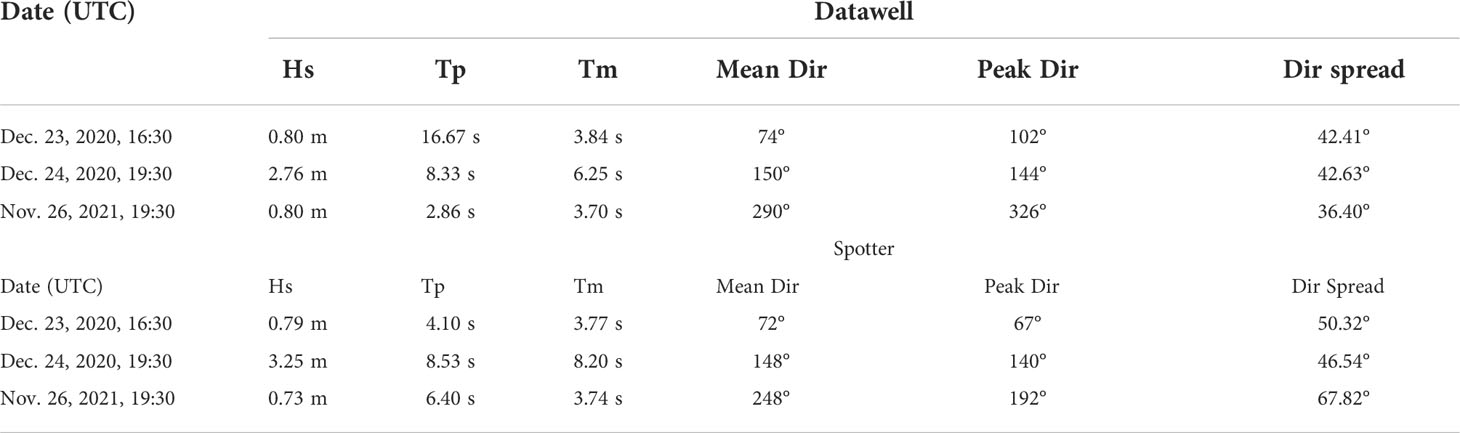
Table 2 Bulk wave statistics for the three time periods shown in Figure 8.
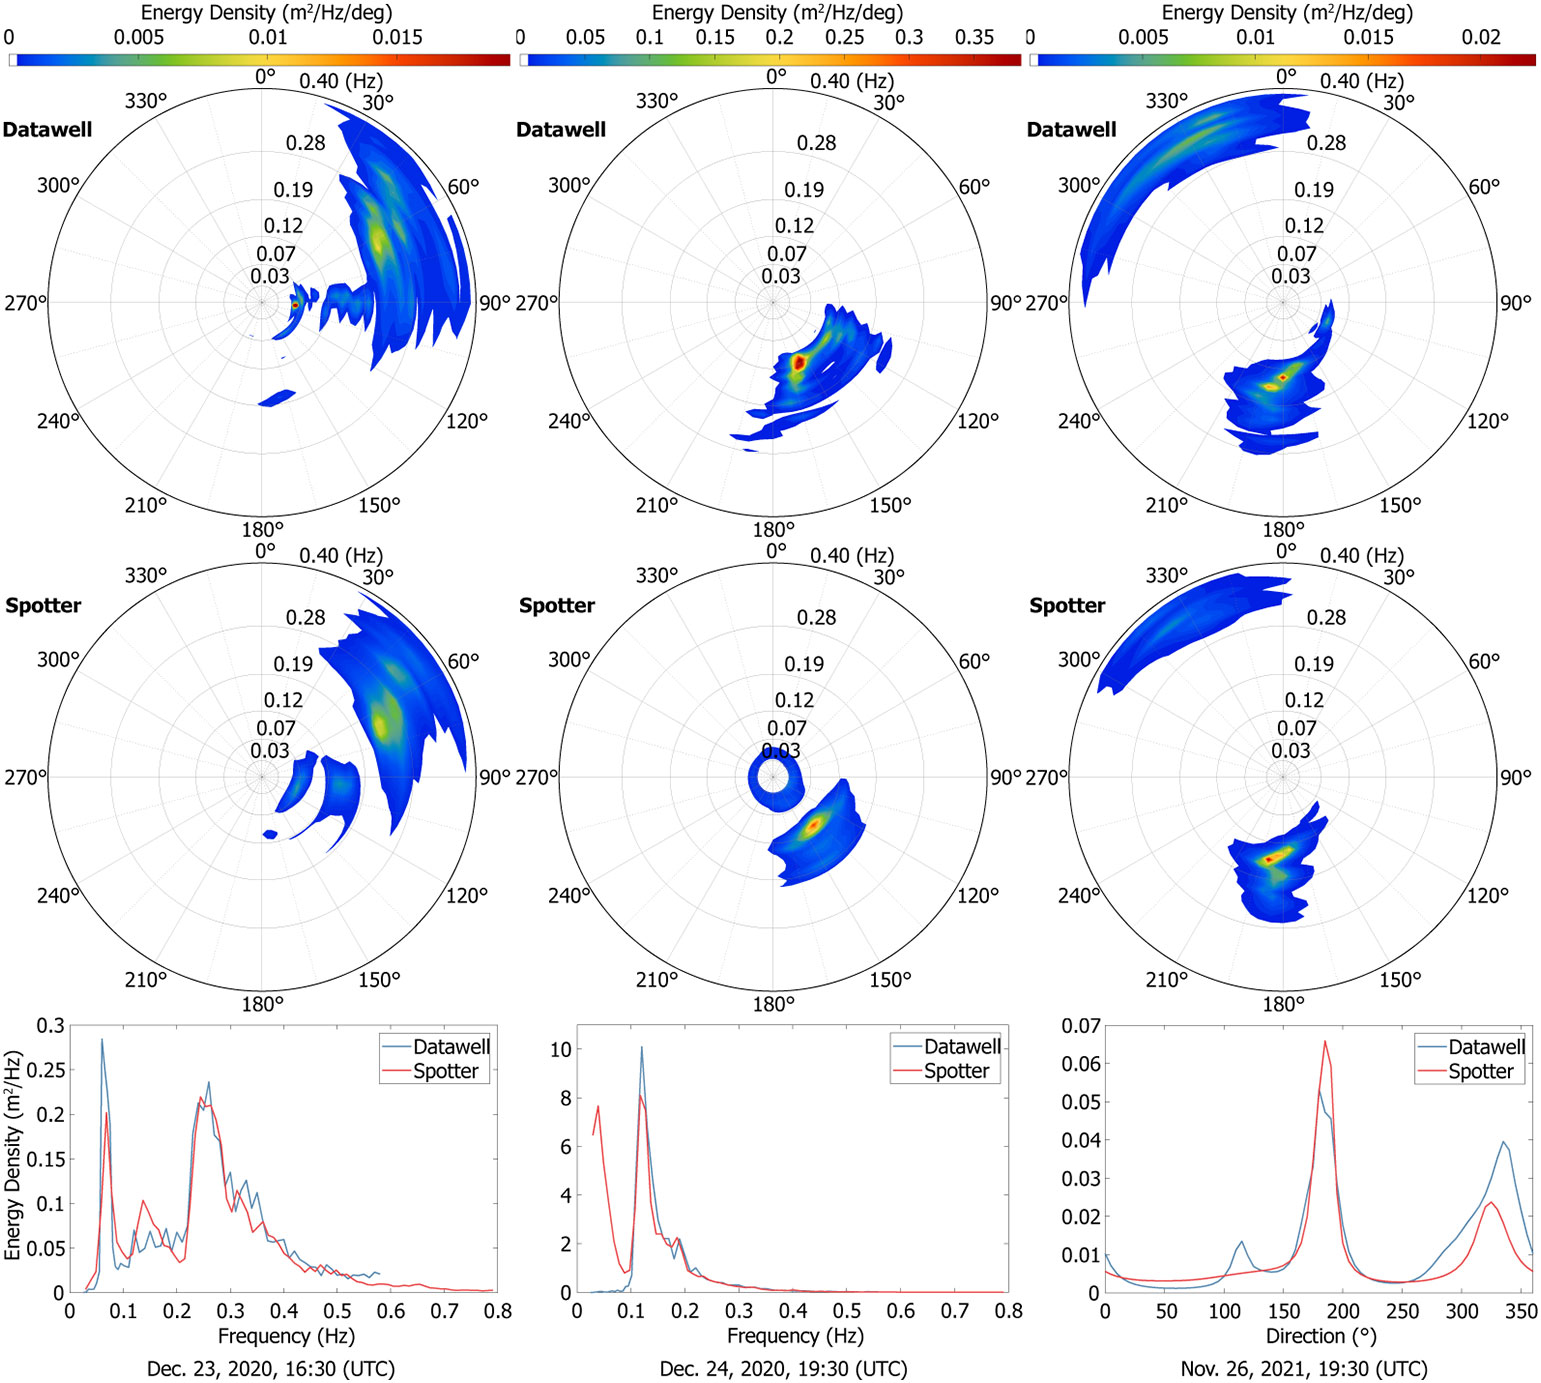
Figure 8 Comparison of the directional distribution of wave energy for the Datawell (top row) and Spotter (middle row) wave buoys for the three time periods shown in Table 2. The bottom left and bottom center panel show energy density versus frequency for the two buoys, the bottom right panel shows energy density versus direction for the two buoys.
Error statistics between reported wind speed and directions by the Spotter and meteorological buoy are shown in Table 3. There was good correlation (0.72 R2) between wind speeds recorded by the Spotter and meteorological buoy with the Spotter underestimating wind speeds (bias of -1.41 m/s) but there is a clear nonlinear dependence between error and wind speed. Errors in Spotter recorded wind speeds was greater at lower (below ~4 m/s) and higher (above ~8 m/s) wind speeds. The Spotter was less reliable in reporting wind direction with a low correlation (0.32 R2) and high error (95.70° RMSE), generally underestimating wind direction compared to the meteorological buoy (-19.06° Bias). The differences in wind direction recorded by the two buoys are further highlighted in Figures 9 and Figure 10 where the Spotter buoy was accurate in recording winds coming from 10°–90° but became less accurate recording winds coming from 200°–270°.
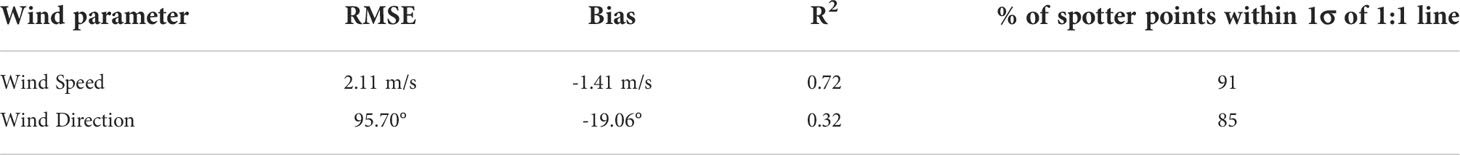
Table 3 Statistics comparing wind parameters recorded by the Meteorological buoy and Spotter wave buoy.
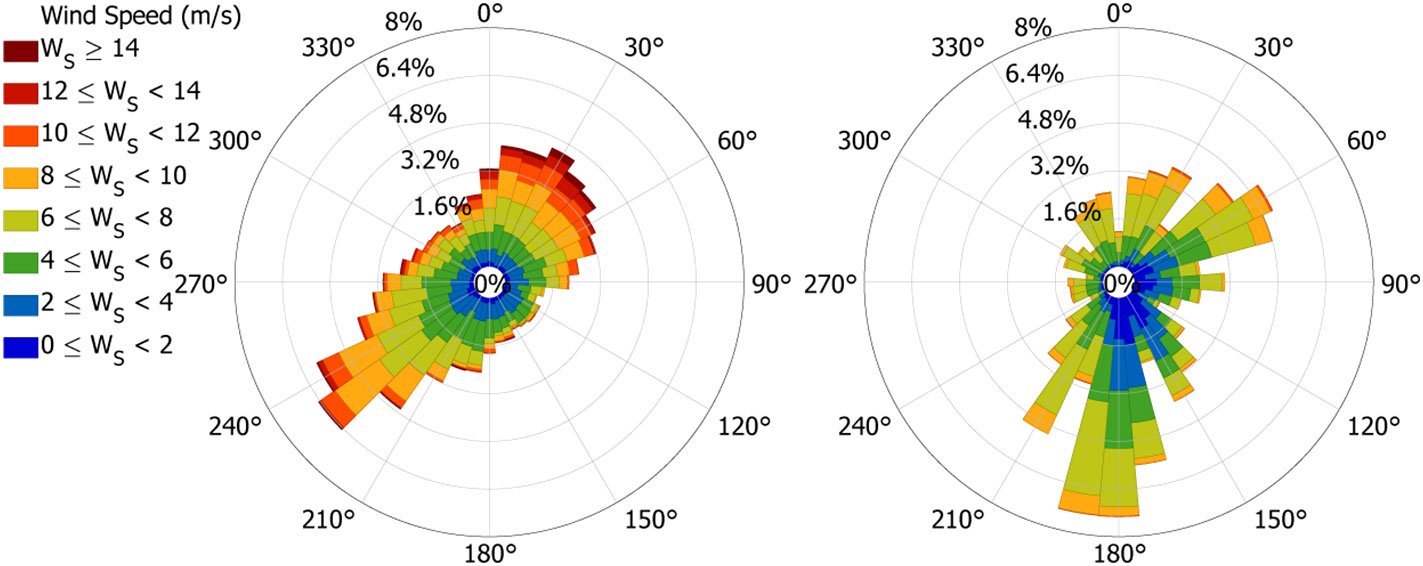
Figure 9 Comparison of wind roses for the meteorological buoy (left) and Spotter buoy (right).
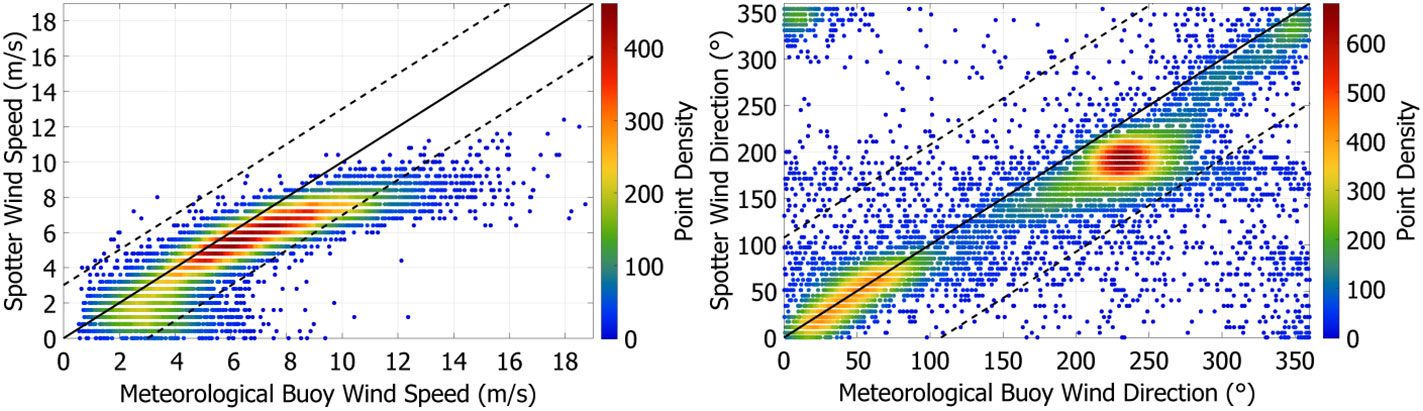
Figure 10 Density scatter plots of wind speed (left) and wind direction (right) recorded by the meteorological buoy and Spotter wave buoy. The solid black line through the origins shows a 1:1 relationship between the two buoys; the dashed black lines show one standard deviation for the meteorological buoy from the 1:1 line.
Discussion
The performance of a GPS Spotter wave buoy in recording winds and waves was evaluated against an accelerometer based Datawell wave buoy and meteorological buoy across a range of oceanographic conditions over the course of a year. Of note, is that both the Datawell buoy and cost-effective Spotter buoy had few issues and instances of missing or erroneous data over the full deployment. Similar to other comparative Spotter buoy studies (e.g., Andrews and Peach, 2019; Raghukumar et al., 2019; Lancaster et al., 2021), bulk wave parameters reported by the Spotter buoy correlated well with measurements made by the Datawell buoy. The Spotter buoy recorded a range (~0.5 m to ~3 m) of significant wave heights with minimal error compared to those reported by the Datawell buoy. Peak periods reported by the Spotter buoy were accurate overall, although as peak periods increased, there was an increasing amount of scatter (Figure 4). This is likely related to 1) the traditional lack of robustness of peak period measurements and 2) a decrease in resolution for higher periods caused by the use of a linearly increasing frequency grid. Errors in Spotter buoy reported mean and peak wave directions were also low compared to those reported by the Datawell buoy, showing the Spotter buoy can accurately record a variety of bulk wave directions given a specific wave climate. There was a positive bias in Spotter reported mean directional spreading, with the Spotter buoy overestimating the mean directional spread by 7.51° (Figure 7). This is contrary to previous studies that reported a slight underestimate by the Spotter (Raghukumar et al., 2019; Lancaster et al., 2021). Due to mean directional spread being calculated using the first-order spectral moments (a1 and b1), the observed bias in mean directional spread between the two buoys could result from errors in spectral moments from either buoy.
Separating the wave spectra into swell and sea partitions further indicated proficiency of the Spotter Buoy in recording significant wave height with low error in both swell and sea frequencies. While there is large scatter in comparisons of peak period, mean wave periods, an integrated metric, provides a more robust comparison and shows agreement between the buoys with little bias. There is some scatter in the swell components where the Spotter buoy overestimates the mean period, but this is limited with 95% of Spotter calculated mean periods falling within 1 standard deviation of Datawell calculated mean periods in the swell frequency range (center left panel of Figure 5). Error in the mean directional spread was similar for both swell and sea frequencies with the Spotter Buoy overestimating the directional spread.
An analysis of recorded variance spectra demonstrated good overall agreement between the Spotter and Datawell buoys but a decrease in accuracy for the Spotter buoy at lower frequencies with it tending to overestimate wave energy. As indicated by the comparison of directional spreading, the Spotter buoy had energy spread across more directions (Figure 7) and in some cases was inaccurate in recording small peaks in wave energy traveling in different directions (bottom right panel of Figure 8). This could be a limit of the Spotter and GPS wave buoys’ abilities to record the directional distribution of wave energy during multimodal conditions. It is important to note that reconstructing the directional wave spectrum is performed using the a1/b1/a2/b2 spectral moments and differences in the directional distribution of wave energy between the two wave buoys could stem from errors in spectral moments recorded from either wave buoy (Figure 11). In addition, it is possible that site specific factors including a relatively mild wave climate (mean significant wave height and mean peak period of 0.93 m and 7.79 seconds, respectively) and a short, slanted fetch in the dominant wind directions influenced results reported. Specifically, the generally low swell amplitudes could explain scatter observed between recorded peak periods and wave directions. We note that while the Datawell buoy was used as the baseline for all comparisons, these accelerometer-based buoys also require levels of post-processing (e.g., high pass filtering) that impact the reporting of wave energy across different frequency bands. Comparisons between recorded and derived wind speeds showed that the Spotter buoy underestimated wind speeds with increasing error at lower and higher wind speeds. For lower wind speeds (U10 < 4 m/s), Voermans et al. (2020) attributed this to a shift in physical exchange process between wind and waves where the momentum exchange between the atmosphere and ocean is driven by viscous drag rather than form drag (Kudryavtsev and Makin, 2001). For higher wind speeds, the underestimation could be caused by an inaccurate identification of the equilibrium frequency range or overall lack of equilibrium range caused by energetic seas (Houghton et al., 2021), or from extrapolating anemometer wind speeds to U10 leading to an overestimation in meteorological buoy wind speeds (Voermans et al., 2020). Performance of Spotter buoy derived wind directions were mixed with the Spotter buoy accurately reporting wind directions from 10°–90° but underestimating wind directions from 200°–270°. Voermans et al. (2020) used spectra observed from Datawell buoys to estimate wind direction and reported a slight dependence of wind direction error on the directional alignment of wind and wave directions and a sensitivity to absolute fetch. However, errors did not exceed ~4° while the comparison here indicates errors of ~40°.
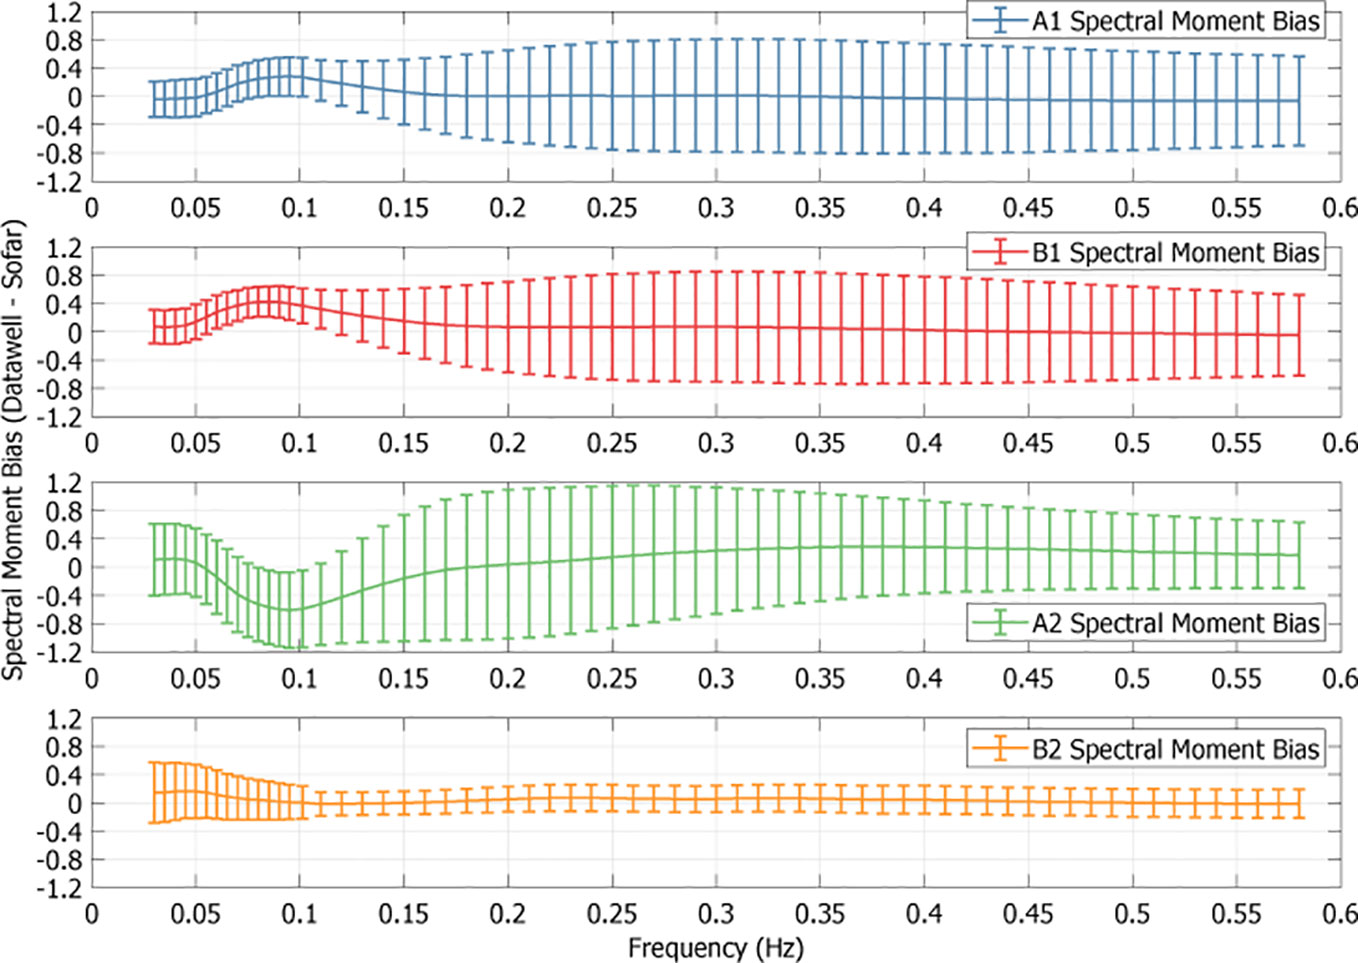
Figure 11 Biases of each spectral moment between the two wave buoys for each frequency band during the duration of the study. The error bars show the bias standard deviation for the spectral moments in each frequency band.
To investigate the influence of fetch on wind direction error, a comparison was made between two spotter buoys and two meteorological buoys that were deployed over a two-month timeframe (May 20, 2021, to July 14, 2021) shown in Figure 12. The ILM3 Spotter buoy was deployed near and compared to the ILM3 meteorological buoy in 30.5 m water depth and ~46.3 km offshore, the ILM2 Spotter buoy (the focus of this study) was deployed near and compared to the ILM2 meteorological buoy in 15.2 m water depth and ~9.8 km offshore. For wind directions coming from between ~200° to ~270° the ILM3 Spotter buoy was the most accurate. Focusing on the ILM2 Spotter buoy, wind directions coming from ~50° (NNE) are more accurate than those coming from ~210° (SSW) but the absolute fetch (distance from coastline to the buoy) within the embayment are similar. This suggests that distance from the shoreline may not be the primary or sole factor. It is also possible that large, shallow, submerged shoal features extending from the capes (apparent in the bottom left corner of the map in Figure 12) could affect wind estimates derived from wave spectra. These inaccuracies could also be related to errors in the a1 and b1 spectral moments themselves which are used in the wind direction estimates. While not shown here, comparisons were also made for U10 wind speeds across the same timeframe at both locations. Despite the impact of distance from the shoreline in estimating wave direction, there was no significant difference in wind speed estimates at any of the two buoys.
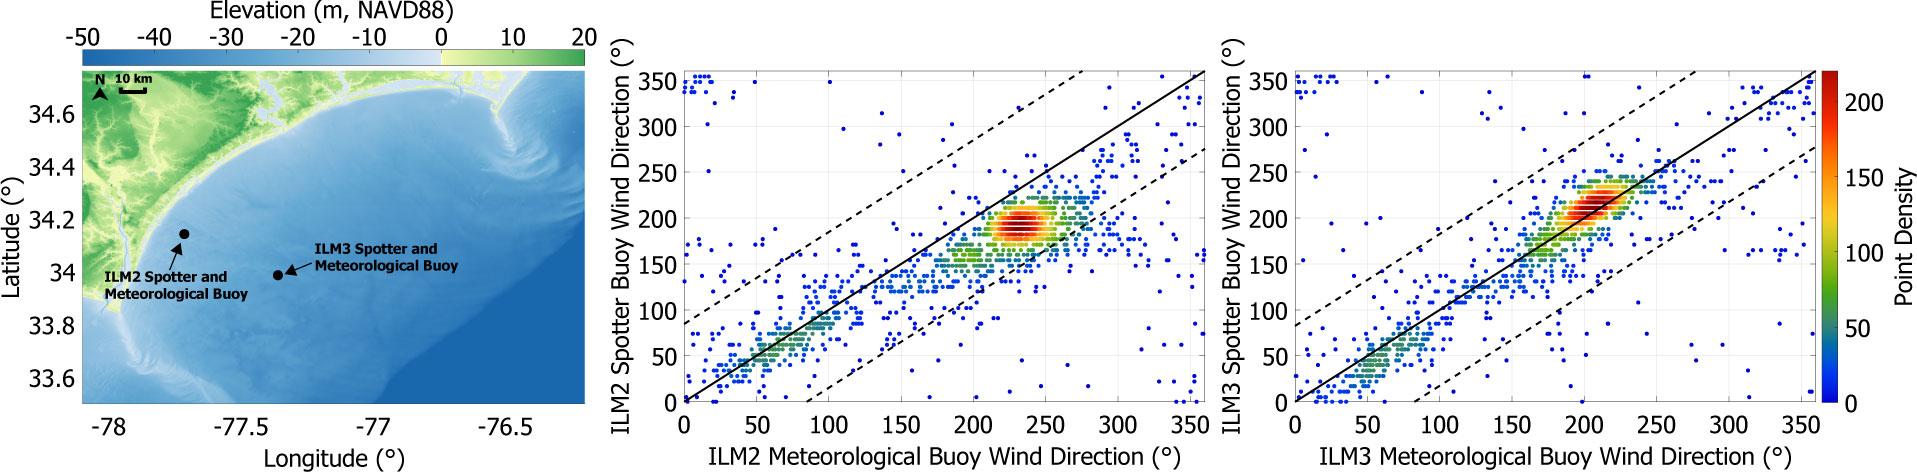
Figure 12 Locations of the two Spotter buoys and associated meteorological buoys (left), and density scatter plots comparing Spotter buoy derived wind directions to wind directions recorded by the nearest meteorological buoy. The solid black line through the origins shows a 1:1 relationship between each compared buoy; the dashed black lines show one standard deviation for the meteorological buoys from the 1:1 line.
Conclusion
A yearlong dataset with waves and winds derived from a cost-effective COTS wave buoy (Spotter) was evaluated against a Datawell accelerometer wave buoy and meteorological buoy in a large embayment off the southeast coast of North Carolina. The Spotter buoy proved proficient in measuring wave statistics both for the full wave spectrum, and the partitioned swell and sea frequencies, with only 6 cm error in significant wave height. A persistent bias did exist for mean directional spread with the Spotter buoy overestimating the directional spread for the full spectrum, and the swell and sea frequencies. The Spotter buoy tended to be less accurate reporting wave period at lower frequencies. For wave direction, the Spotter buoy was less accurate at higher frequencies. The Spotter and Datawell buoys provided similar measurements of wave energy across different frequencies, however, the Spotter buoy was less accurate at lower frequencies. The Spotter buoy was able the replicate general patterns of the directional distribution of wave energy but tended to overestimate the amount of wave energy outside of the peak direction and was not always effective in identifying multimodal wave spectra.
Using an algorithm that derives wind speed and direction from the equilibrium region of a given wave spectrum, the Spotter buoy also provides estimates of wind variables. For this longer duration time series, we found that wind speeds reported by the Spotter buoy are underestimated compared to those measured by a meteorological buoy, with an overall bias larger than previously reported. Patterns of increasing error found at lower and higher wind speeds was consistent with previous studies. For wind direction, the Spotter was accurate in reporting directions coming from 10° to 90° (NNE nautical directions) but underestimated wind directions coming from 200° to 270° by ~40°. A comparison of wind directions between a Spotter and meteorological buoy further offshore, indicated that an increase in distance from the shoreline improved comparisons between Spotter buoy derived wind directions and measured wind directions. It should be noted that fetch did not explain all wind direction errors and local geographic influences (e.g., shoals) and conditions with winds directed offshore may influence wind direction accuracy as well. Overall, the Spotter buoy provides a cost-effective method to improve the spatial coverage of global wave and wind datasets but wind estimates from nearshore deployments could be biased based on local conditions.
Data availability statement
Data from the Datawell buoy and meteorological buoys are available on ndbc.gov and cormp.org. Bulk wave and wind statistics for the Sofar buoy are on cormp.org. Spectral data from the Sofar buoy will be provided without delay by the authors upon request.
Author contributions
JB was the primary writer and JL contributed ideas and edited the manuscript. JB performed the statistical analyses and data management. JL conceived the study and led data acquisition through the deployment of wave buoys. All authors contributed to the article and approved the submitted version.
Funding
Costs to deploy and maintain buoys were funded, in part, by the US Coastal Research Program (USCRP) as administered by the US Army Corps of Engineers® (USACE), Department of Defense (grant number: W912HZ-21-2-0001). The content of the information provided in this publication does not necessarily reflect the position or the policy of the government, and no official endorsement should be inferred. The authors acknowledge the USACE and USCRP’s support of their effort to strengthen coastal academic programs and address coastal community needs in the United States.
Acknowledgments
We would like to thank CORMP for providing open access wave data and deploying and maintaining the wave and meteorological buoys used in this study. Chris LaClair was instrumental in the mooring design, deployment, and maintenance of these buoys used in this study. We are thankful to the multiple reviewers that spent time commenting on the manuscript and providing their perspectives and expertise which resulted in an improved analysis.
Conflict of interest
The authors declare that the research was conducted in the absence of any commercial or financial relationships that could be construed as a potential conflict of interest.
Publisher’s note
All claims expressed in this article are solely those of the authors and do not necessarily represent those of their affiliated organizations, or those of the publisher, the editors and the reviewers. Any product that may be evaluated in this article, or claim that may be made by its manufacturer, is not guaranteed or endorsed by the publisher.
References
Andrews E., Peach L. (2019). Wave monitoring equipment comparison: An evaluation of current and emerging in-situ ocean wave monitoring technology, (Brisbane, Australia: Queensland Dept. ofEnvironment and Science Coastal Impacts Unit Publ.) 66 pp.
Colbert D. B. (2010). Field evaluations of ocean wave measurements with GPS buoys. (Master thesis) (California, United States: Department of Physical Oceanography, Naval Postgraduate School, Monterey).
de Vries J. J., Waldron J., Cunningham V. (2003). Field tests of the new datawell DWR-G GPS wave buoy. Sea Technol. 44, 50–55.
Houghton I. A., Smit P. B., Clark D., Dunning C., Fisher A., Nidzieko N., et al. (2021). Performance statistics of a real-time pacific ocean weather sensor network. J. Atmos. Ocean. Technol. 38, 1047–1058. doi: 10.1175/JTECH-D-20-0187.1
Hsu S. A., Meindl E. A., Gilhousen D. B.. (1994). Determining the Power-Law Wind-Profile Exponent under Near-Neutral Stability Conditions at Sea. J. Appl. Meteorol. 33, 757–765. doi: 10.1175/1520-0450(1994)033<0757:DTPLWP>2.0.CO;2
Iwanaka Y., Kasai T., Murayama T., Harigae M., Yamaguchi I., Nakanishi H., et al. (2005). Abreast of the waves: Moored-sea sensor to measure height and direction. GPS World 16 (5), 16–27.
Janssen T. (2020) Data validation: Statistics at maverick. Available at: https://www.sofarocean.com/posts/data-validation-statistics-at-mavericks (Accessed May 5, 2022).
Jeans G., Bellamy I., de Vries J. J., van Weert P. (2003). “Sea Trial of the new datawell GPS directional waverider,” in Proceedings of the Ieee/Oes seventh working conference on current measurement technology, (San Diego, CA: IEEE) 145–147. doi: 10.1109/CCM.2003.1194303
Joodaki G., Nahavandchi H., Cheng K. (2013). Ocean wave measurement using GPS buoys. J. Geod. Sci. 3, 163–172. doi: 10.2478/jogs-2013-0023
Kudryavtsev V. N., Makin V. K. (2001). The impact of air-flow separation on the drag of the sea surface. Bound.-Layer Meteorol. 98, 155–171. doi: 10.1023/A:1018719917275
Lancaster O., Cossu R., Boulay S., Hunter S., Baldock T. E. (2021). Comparative wave measurements at a wave energy site with a recently developed low-cost wave buoy (Spotter), ADCP, and pressure loggers. J. Atmos. Ocean. Technol. 38, 1019–1033. doi: 10.1175/JTECH-D-20-0168.1
Lygre A., Krogstad H. E. (1986). Maximum-entropy estimation of the directional distribution of ocean wave spectra. J. Phys. Oceanogr. 16, 2052–2060. doi: 10.1175/1520-0485(1986)016<2052:MEEOTD>2.0.CO;2
Oreilly W. C., Herbers T. H. C., Seymour R. J., Guza R. T. (1996). A comparison of directional buoy and fixed platform measurements of pacific swell. J. Atmos. Ocean. Technol. 13, 231–238. doi: 10.1175/1520-0426(1996)013<0231:ACODBA>2.0.CO;2
Phillips O. M. (1985). Spectral and statistical properties of the equilibrium range in wind-generated gravity-waves. J. Fluid Mech. 156, 505–531. doi: 10.1017/S0022112085002221
Raghukumar K., Chang G., Spada F., Jones C., Janssen T., Gans A. (2019). Performance characteristics of “Spotter,” a newly developed real-time wave measurement buoy. J. Atmos. Ocean. Technol. 36, 1127–1141. doi: 10.1175/JTECH-D-18-0151.1
Smit P. B. (2018) Wave parameter definitions. Available at: https://content.sofarocean.com/hubfs/Spotter%20product%20documentation%20page/wave-parameter-definitions.pdf (Accessed April 3, 2022).
Thomson J., D’Asaro E. A., Cronin M. F., Rogers W. E., Harcourt R. R., Shcherbina A. (2013). Waves and the equilibrium range at ocean weather station p. J. Geophys. Res. Oceans 118, 5951–5962. doi: 10.1002/2013JC008837
Keywords: low-cost instrumentation, wind measurements, wave measurements, ocean observations, buoy observations
Citation: Beckman JN and Long JW (2022) Quantifying errors in wind and wave measurements from a compact, low-cost wave buoy. Front. Mar. Sci. 9:966855. doi: 10.3389/fmars.2022.966855
Received: 11 June 2022; Accepted: 20 September 2022;
Published: 10 October 2022.
Edited by:
Gilles Reverdin, Centre National de la Recherche Scientifique (CNRS), FranceReviewed by:
Louis Marie, Institut Français de Recherche pour l’Exploitation de la Mer (IFREMER), France;Xiangzhou Song, Hohai University, ChinaCopyright © 2022 Beckman and Long. This is an open-access article distributed under the terms of the Creative Commons Attribution License (CC BY). The use, distribution or reproduction in other forums is permitted, provided the original author(s) and the copyright owner(s) are credited and that the original publication in this journal is cited, in accordance with accepted academic practice. No use, distribution or reproduction is permitted which does not comply with these terms.
*Correspondence: Jesse N. Beckman, YmVja21hbi5qZUBub3J0aGVhc3Rlcm4uZWR1