 Anja Singer1,2*
 Allert I. Bijleveld3†
 Florian Hahner1
 Sander J. Holthuijsen3Krischan Hubert4†
 Onur Kerimoglu1
 Loran Kleine Schaars3
 Ingrid Kröncke1,2
 Karsten A. Lettmann1Timo Rittweg1,2Gregor Scheiffarth5
 Henk W. van der Veer3Andreas Wurpts4†
- 1Institute for Chemistry and Biology of the Marine Environment (ICBM), Carl von Ossietzky University, Oldenburg, Germany
- 2Senckenberg am Meer, Department for Marine Research, Wilhelmshaven, Germany
- 3NIOZ Royal Netherlands Institute for Sea Research, Department of Coastal Systems, Den Burg, Texel, Netherlands
- 4Coastal Research Station - Lower Saxony Water Management, Coastal Defense and Nature Conservation Agency, Lower Saxony Water Management, Coastal Defence and Nature Conservation Agency (NLWKN), Norden, Germany
- 5Communication and Research, Lower Saxony Wadden Sea National Park Authority, Wilhelmshaven, Germany
Since the last decades, previous long-term Wadden Sea studies revealed significant changes in the abundance, biomass and spatial distribution of characteristic macrofauna communities in response to environmental changes and anthropogenic stressors. In this study, we performed statistical community analysis for the East-Frisian Wadden Sea (EFWS, southern North Sea) on two reference datasets across a period with severe climatic and environmental changes (1980s-2018). Therefore, historical macrofauna data from the Quantitative Sensitivity Mapping (1980s, SENSI 1) were reanalyzed and compared with data from the Synoptic Intertidal Benthic Survey (SIBES/SENSI 3) collected in 2018. Our results revealed significant quantitative and spatial changes in the characteristic macrofauna communities between the 1980s and 2018, most likely in response to de-eutrophication and sea level rise mediated habitat changes. Since the 1980s, the total number of taxa remained relatively stable (1980s: 90, 2018: 81), but the total abundance decreased by ca. -31% and the total biomass decreased by ca. -45%, particularly in the eastern regions of the study site probably due to de-eutrophication processes. Thereby, the mean abundances/m2 of ≥ -80% (1980s-2018) in the EFWS of several dominant species decreased: e.g. the gastropod Peringia ulvae, the polychaete Lanice conchilega and the bivalve Mya arenaria. In contrast, the mean abundance/m2 of one dominant species increased by ≥ +80% (1980s-2018): the invasive bivalve Ensis leei. The mean biomass [g/m2] of three dominant species decreased by ≥ -80% (1980s-2018): P. ulvae, L. conchilega and the amphipod Corophium volutator. In contrast, the mean biomass [g/m2] of one dominant species increased by ≥ +75% (1980s-2018): the polychaete Arenicola marina. In the western part of the EFWS, not only higher abundances of A. marina, but also of L. conchilega and P. ulvae were found in 2018, caused i.a. by sea level rise mediated decreasing mud contents and sand accretion on tidal flats. At the community level, the Oligochaeta/Heteromastus community increased in spatial distribution in the western EFWS in 2018 in the vicinity of increasing mussel/oyster beds.
1 Introduction
Since recent decades, severe changes in the abundance, biomass and spatial distribution of characteristic marine communities have been recorded for all trophic levels across the globe, i.e. mammals, fish, benthos, zoo- and phytoplankton (e.g. Ehrich et al., 2007; Rockström et al., 2009; Beukof et al., 2019). These changes have resulted in profound alterations in the functional composition and biodiversity of benthic and pelagic communities, which had a major impact on marine food webs and inherent bottom-up and top-down processes (e.g. Dornelas et al., 2014; Bowler et al., 2015; Pilotto et al., 2020). Since the 1980s, long-term changes in characteristic North Sea communities and their bentho-pelagic coupling, both coastal and offshore, were primarily linked to climate change induced temperature increase by 1.5°C (Beare et al., 2004), the exploitation of marine resources, fisheries impact, Neobiota introduction such as the Pacific Oyster and eutrophication processes caused by agricultural and industrial wastewater discharges (e.g. Beukema, 1992; Beukema and Dekker, 2020; De Jong, 2007; Markert et al., 2010; Kröncke et al., 2011, Kröncke et al., 2019; Emeis et al., 2015).
OSPAR endorsed an agreement in 1988 with the target of a 50% nutrient reduction in North Sea countries between 1985 and 1995 (OSPAR, 2010). OSPAR countries agreed to implement a coordinated programme for nutrient reduction from point sources and agriculture where eutrophication problems were identified. A wide range of European and international instruments aim at combating harmful nutrient releases to surface waters and air through controlling discharges and emissions as well as through the designation of clear environmental targets. Due to OSPAR regulations, nutrient loads of the rivers Elbe, Weser, Ems, IJssel, Rhine, Scheldt and Meuse decreased significantly since the 1980s (Emeis et al., 2015; Van Beusekom et al., 2019).
Reduced riverine nutrient input led to de-eutrophication processes such as decreases in primary production and phytoplankton biomass or quality as well as decreasing copepod abundance in the south-eastern North Sea (Van der Wal, 2010; Boersma et al., 2015; Capuzzo et al., 2017; Van Beusekom et al., 2017; Van Beusekom et al., 2019; Desmit et al., 2020; Xu et al., 2020). Although a parallel increasing water temperature might cause a higher phytoplankton primary production, it also causes faster turnover rates of nutrients by the microbial loop in the water column (Glibert and Mitra, 2022). This process leads to a faster nutrient depletion in the water column. As a consequence, and in addition to the nutrient decrease, less particulate organic matter (POM) reaches the seafloor. This will result in decreasing benthic food availability, because non-predatory benthic macrofauna depend on freshly settled POM from the water column (Kröncke et al., 2004). For higher trophic levels, decreased benthic prey biomass caused severe food deficits, e.g. for benthivore predators such as fish and birds in the Dutch Wadden Sea (Philippart et al., 2007). In addition, Meyer et al. (2018) found up to 80% decrease in abundance and biomass of macrofauna communities since the 1980s in the south-eastern coastal North Sea due to decreasing food availability for benthic invertebrates from the water column.
Nutrient reduction and temperature increase in the last decades also affected the East-Frisian Wadden Sea (EFWS), which is an intertidal coastal sea in the German part of the UNESCO Wadden Sea World Heritage Site (UNESCO, 2009). Previous Wadden Sea studies revealed significant changes in macrofauna abundance, biomass and community structure in response to altered environmental and anthropogenic habitat conditions (Lotze, 2005) such as Neobiota introduction, sea level rise induced changes in hydrodynamics and increased water temperatures. Recent long-term studies in the Dutch and East-Frisian Wadden Sea give evidence that the reduction of nutrient loads led to seagrass recovery due to an improved water quality and light penetration through the water column (Adolph, 2010; Boyce et al., 2010; Van Beusekom et al., 2019). For the westernmost part of the Dutch Wadden Sea, reduced nutrient loads from the river Rhine since 1985 could be related to a biomass decrease of phytoplankton, macrofauna and estuarine birds (Philippart et al., 2007). At the Balgzand intertidal, macrofauna biomass is still increasing in winter since the 1970s. In summer it remained rather stable until 2010, but decreased in the following years (Beukema and Dekker, 2020). In the western part of the Dutch Wadden Sea macrofauna biomass remained rather stable (Drent et al., 2017). Similar to Balgzand, abundance and biomass of macrofauna communities off Norderney are still increasing in the 2nd quarter of the year, but are decreasing significantly during summer (Kröncke et al., 2013; Dippner and Kröncke, 2015).
For the years 1986 and 1990, a full-coverage intertidal macrofauna mapping with a sampling raster of 1 station per km² was performed for the EFWS within the research project “Quantitative Sensitivity Mapping 1984-1992” (SENSI 1) (Van Bernem, 1992; Van Bernem et al., 1994). For 2018, similar intertidal macrofauna data are available from the German extension of the Dutch long-term project “Synoptic Intertidal Benthic Survey” (SIBES) (Bijleveld et al., 2012; Compton et al., 2013). These two reference datasets (biological and environmental) with a large spatial scale and sampling resolution from different timespans enable us to study spatial changes in benthic communities. Benthic communities are an important food source for higher trophic levels (e.g. Van den Kam et al., 2004; Reiss et al., 2011; Sell and Kröncke, 2013), and for nutrient cycling in the entire North Sea food web and ecosystem functioning (e.g. Albouy et al., 2011; Kristensen et al., 2014). Because of their relatively sessile habit, benthic species are ideal indicators for environmental changes and disturbances (Herman et al., 1999). Therefore, long-term studies on the spatial distribution, abundance and biomass of vulnerable benthic communities are crucial for understanding the ecological status of the Wadden Sea, particularly with regards to potential ongoing threads on food webs and associated trophic processes (e.g. Compton et al., 2013; Birchenough et al., 2015; Bijleveld et al., 2018; De la Vega et al., 2018).
The purpose of this study was to compare community analysis on two reference datasets across a period with severe climatic and environmental changes (1980s-2018) to describe changes in the species abundance, biomass and composition, as well as habitat structure of characteristic benthic communities in the EFWS. The availability of comparable high-quality reference datasets for both studied time intervals offered a unique opportunity to investigate the ecological status and changes in the abundance, biomass and spatial distribution of characteristic benthic communities for the UNESCO-protected EFWS since the last 4 decades (1980s versus 2018). We first investigated whether macrofauna abundances and biomass have changed between the 1980s and 2018. Second, we investigated the macrofauna community composition for each time period separately. Third, we compared changes in the community composition between the 1980s and 2018, which we discuss in relation to de-eutrophication and sea level rise mediated changes in hydro- and morphodynamics.
2 Materials and methods
2.1 Study area
The East-Frisian Wadden Sea (EFWS) in the southern North Sea, Germany (Figure 1) is part of the Trilateral Wadden Sea and is a shallow intertidal coastal sea, protected from the open North Sea through seven large barrier islands. It stretches ca. 100 km along the German North Sea coast and comprises a total area of ca. 855.9 km². The study site is located in the Wadden Sea National Park Lower Saxony and part of the UNESCO World Heritage Site Wadden Sea (UNESCO, 2009). The EFWS is legally protected by four EU-Directives: Birds, Habitats, Water Framework and Marine Strategy Framework Directive CWSS (2017).
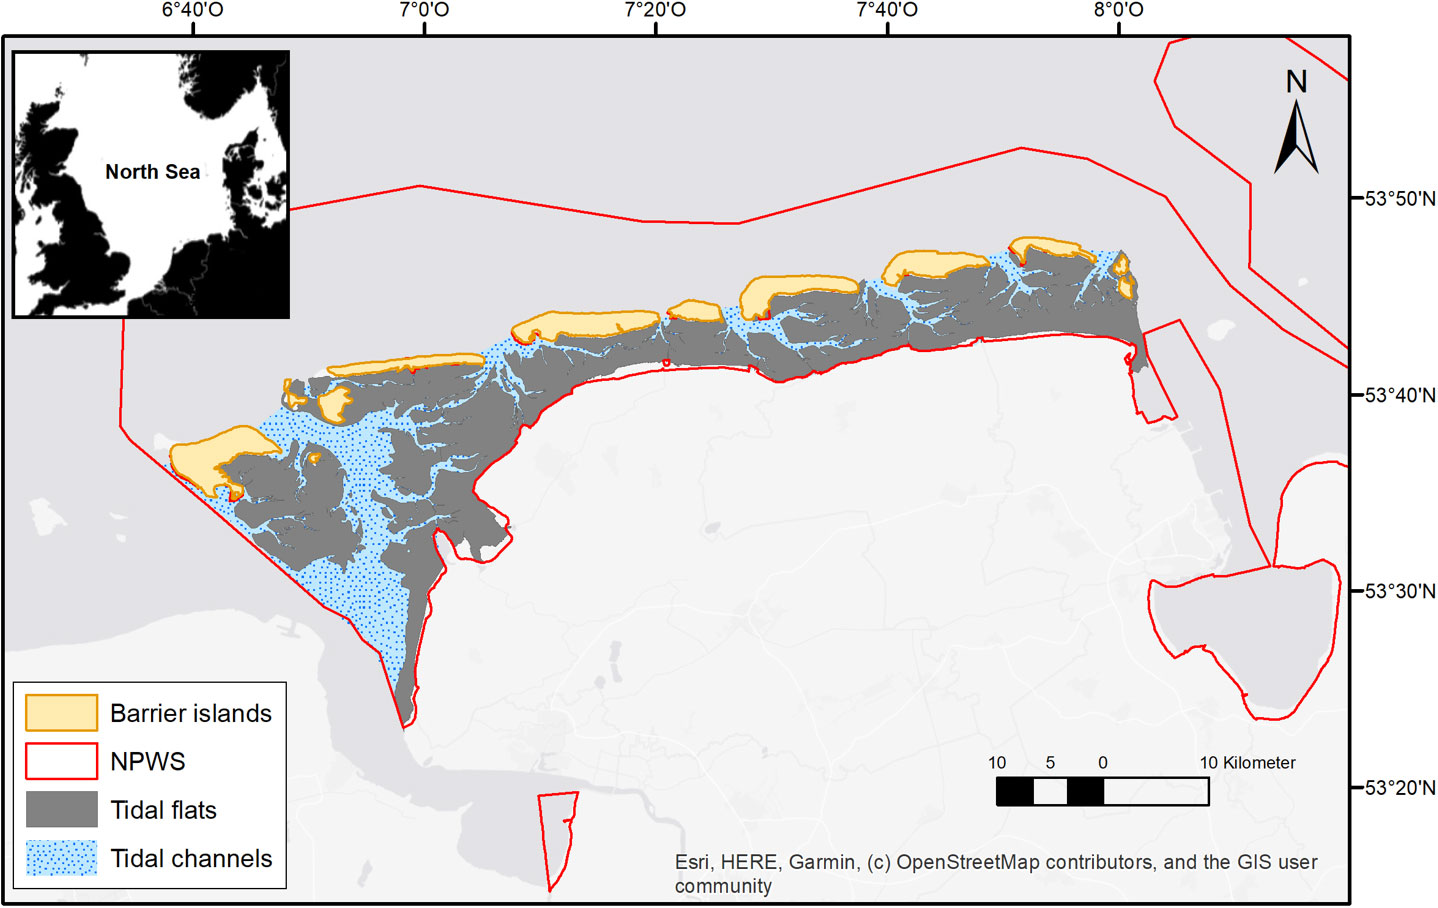
Figure 1 Study area in the East-Frisian Wadden Sea (EFWS), showing the tidal flats, the tidal channels, the 7 large East-Frisian barrier islands and the border of the Wadden Sea National Park (NPWS) in the Lower Saxony region, shapefiles provided by the Lower Saxony Wadden Sea National Park Authority (NLPV).
Due to its island-enclosed position, a clear separation between hydrodynamically exposed subtidal regions (in the permanently submersed tidal channels) and hydrodynamically protected intertidal regions (in the back barrier tidal flats of the islands) can be made. The tidal range at the EFWS varies between 2.3 and 3.0 m and increases from west to east, following the tidal circulation (Flemming and Bartholomä, 1997; Behre, 2011). During low tide ca. 610 km2 of tidal flats (ca. 71.8% of the entire area) are exposed to atmospheric conditions. Residual currents along the Wadden Sea follow the anticlockwise circulation of the North Sea. Therefore, the EFWS is mainly impacted by river discharges from the Ems and Rhine, both flushing fresh water, nutrients and contaminants eastwards into the study area (Van Beusekom et al., 2017).
Because of the before mentioned hydrodynamic gradient, three different sediment types can be distinguished: sandflats, mixed flats and mudflats (Reise et al., 2010; Schückel et al., 2013). Furthermore, mussel/oyster beds (Mytilus edulis/Magallana gigas, 29.2 km² in 2016; MDI 2021) and seagrass beds (Zostera noltii, 9.1 km² in 2019; MDI 2021) form characteristic biogenic structures within the EFWS.
2.2 Macrofauna sampling design
2.2.1 Historical macrofauna data (SENSI 1, 1980s)
The macrofauna data (>0.5 mm) representing the 1980s in our study (i.e. species abundances) were sampled during summer months (1986 and 1990, May to August) within the research project “Quantitative Sensitivity Mapping 1984-1992” (SENSI 1, Figure 2), financed by the Lower Saxony Wadden Sea National Park Authority (NLPV), and they were a first full-coverage intertidal macrofauna mapping for the Lower Saxony Wadden Sea (Van Bernem, 1992; Van Bernem et al., 1994). Within SENSI 1, a sampling raster (1 station per km²) was applied, which provided in total 480 sampling stations for our EFWS study (Figure 2). Abundance and taxa number were available as means per 0.017 m² and 90% of the organisms were identified at species level.
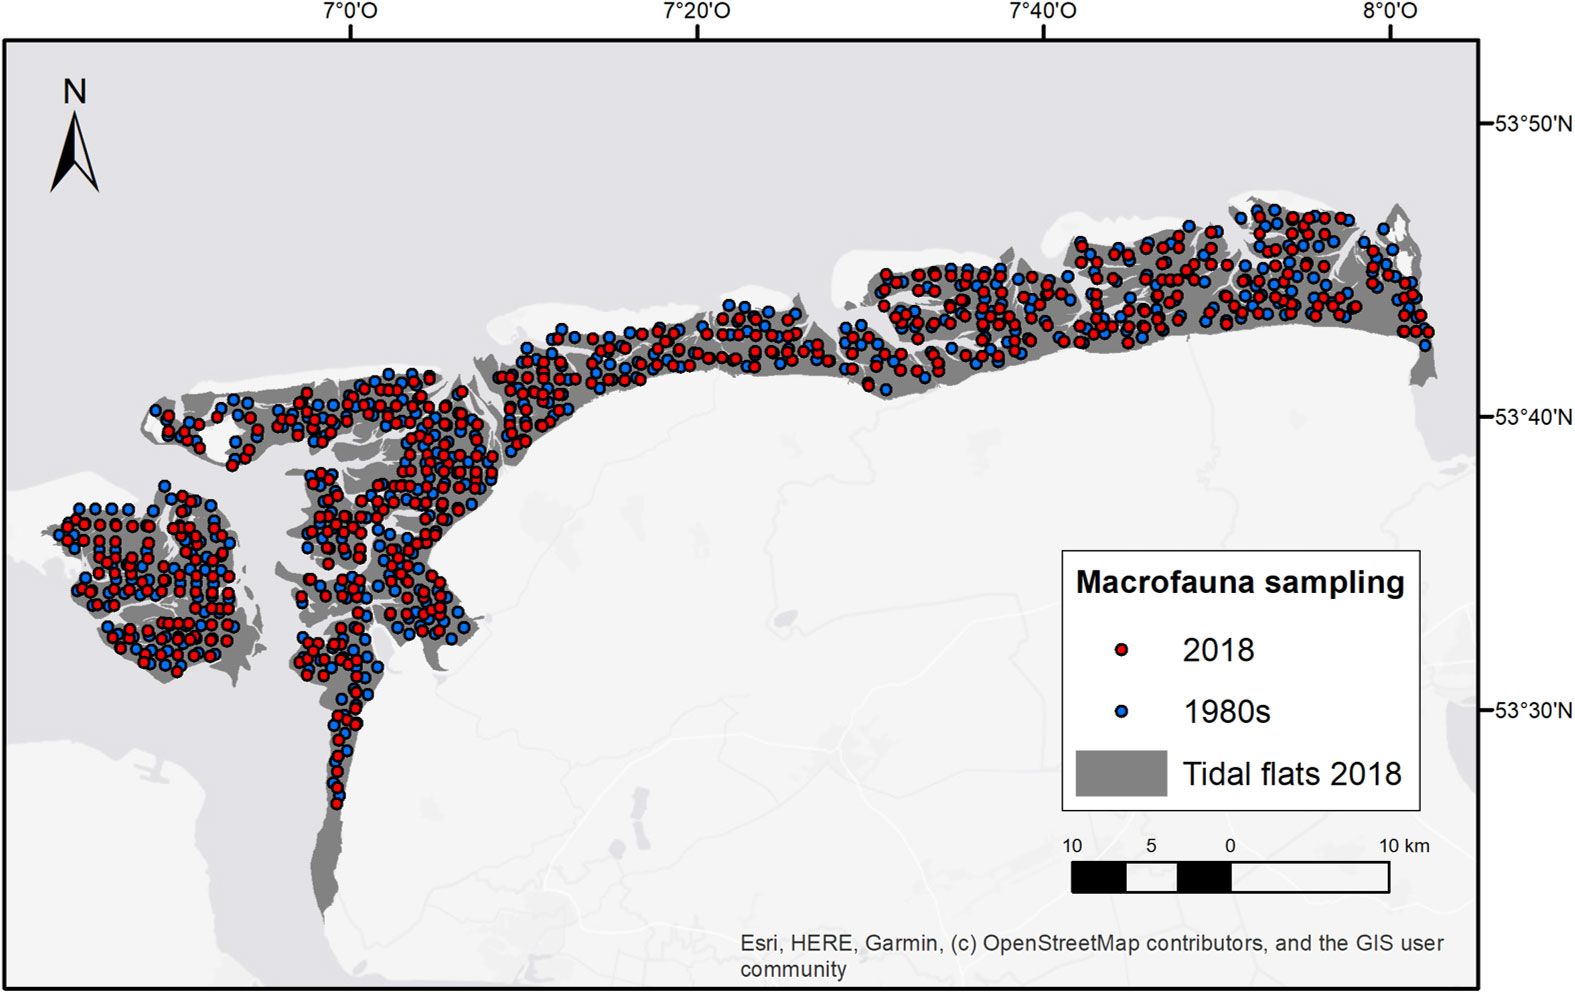
Figure 2 Sampled macrofauna data used for the long-term community analysis, sampling campaigns: SIBES 2018 (n=480) and SENSI1 1980s (n=480), plotted on the tidal flat shapefile for 2018 (Rijkswaterstaat RWS, Royal NIOZ).
During the past sampling campaign 1-6 cylindrical cores (0.05 m²/core) were taken per station to a depth of ~30 cm. All samples were sieved over 1 mm mesh size in the field and identified to the lowest taxonomic level possible in the lab. For further details on the sampling procedure and laboratory analyses, see Van Bernem (1992) and Van Bernem et al. (1994). Since biomass data for SENSI 1 were not available, biomass data of SIBES/SENSI 3 (see below) were used by dividing species biomass data (mean ash free dry weight in mg) by species abundance data. Thereafter, the individual weights were multiplied for each species with the 1980s abundance data.
2.2.2 Present-day macrofauna data (SIBES/SENSI 3, 2018)
The present macrofauna data for our study (i.e. species abundances, biomass) were collected during summer months (2018, April to July) as a German extension of the NIOZ long-term project “Synoptic Intertidal Benthic Survey” (SIBES) (Bijleveld et al., 2012; Compton et al., 2013), initiated in collaboration with the NLPV. The purpose of this project extension was the creation of a present-day reference dataset (SENSI 3), which could be compared with the historical SENSI 1 dataset from the 1980s. For the EFWS, a total of 900 stations was sampled in 2018, covering the entire intertidal area of the study site. They consisted of ~500 grid points, spaced 1000 m apart and ~400 sample points randomly distributed along the grid lines in between the grid points. See Bijleveld et al. (2012) for the rational of adding random stations. To guarantee statistical comparability between the two studied time periods (1980s versus 2018), the 826 sampled SIBES/SENSI 3 stations for 2018 were reduced to 480 stations where those stations were selected that had the best spatial overlap with the 1980s data (Figure 2). Abundance, biomass and taxa number were available as means per 0.017 m².
SIBES/SENSI 3 samples were collected around low water by food whereby a single core (0.0175 m²) was taken to a depth of ~25 cm. For intertidal stations in too deep or too muddy areas, two cores (0.0018 m²) to a depth of ~25 cm were taken by boat. All samples were sieved over 1 mm mesh size in the field. Macrofauna was identified to the lowest taxonomic level possible in the lab, 90% were identified at species level. Biomass was measured as ash free dry weight (mg/0.017 m²) per species. For further details on the sampling procedure in the field and laboratory analyses we refer to Compton et al. (2013).
2.3 Environmental data
Table 1 provides an overview of all available environmental variables for the two periods (1980s versus 2018). In total, 16 predictor variables (1980s: 6, 2018: 10) could be integrated in the community analysis (see 2.4); 2 were omitted prior to the multivariate statistics because of a high predictor collinearity with the other environmental parameters (r > 0.7; i.e. total organic nitrogen and total organic carbon). All environmental point data were interpolated with the Geostatistical Analyst in ArcGIS 10.7.1, using the ordinary kriging interpolation method. All processed environmental grids were converted with ArcGIS to the same extent (855.9 km²), coordinate system (WGS 1982, EPSG 4326) and resolution (100 m). All interpolated grids, used in this study, can be found in section 3.1 (Figure 3).
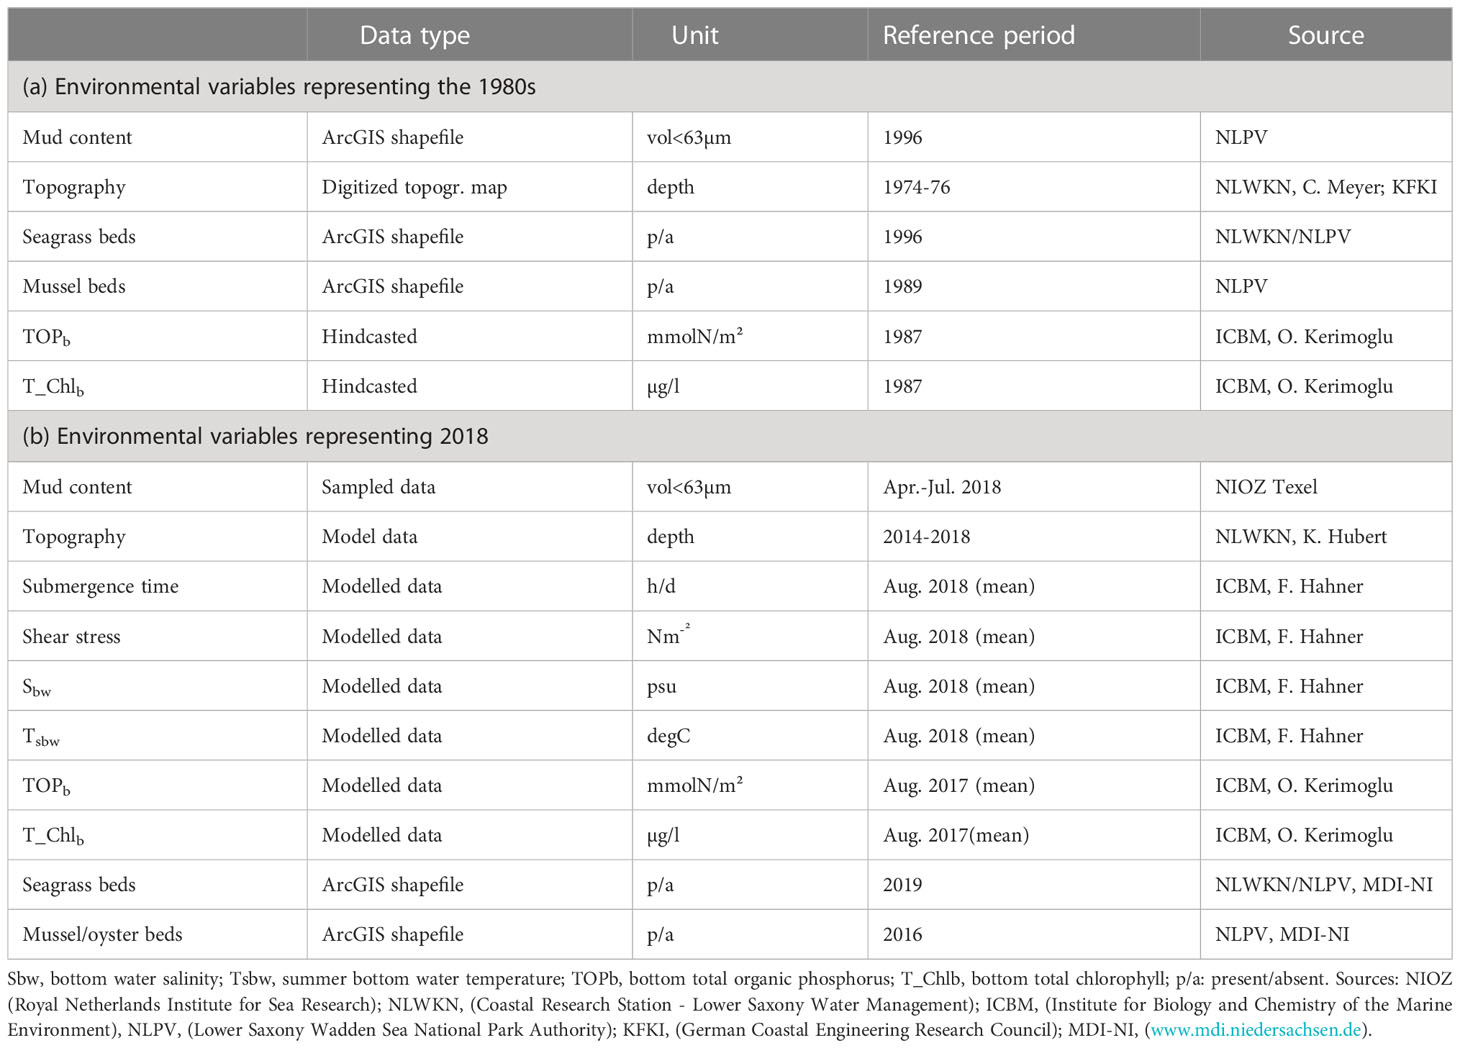
Table 1 Environmental variables and associated information for (A) the 6 environmental variables employed for our 1980s community analysis and (B) the 10 environmental variables employed for our 2018 community analysis.
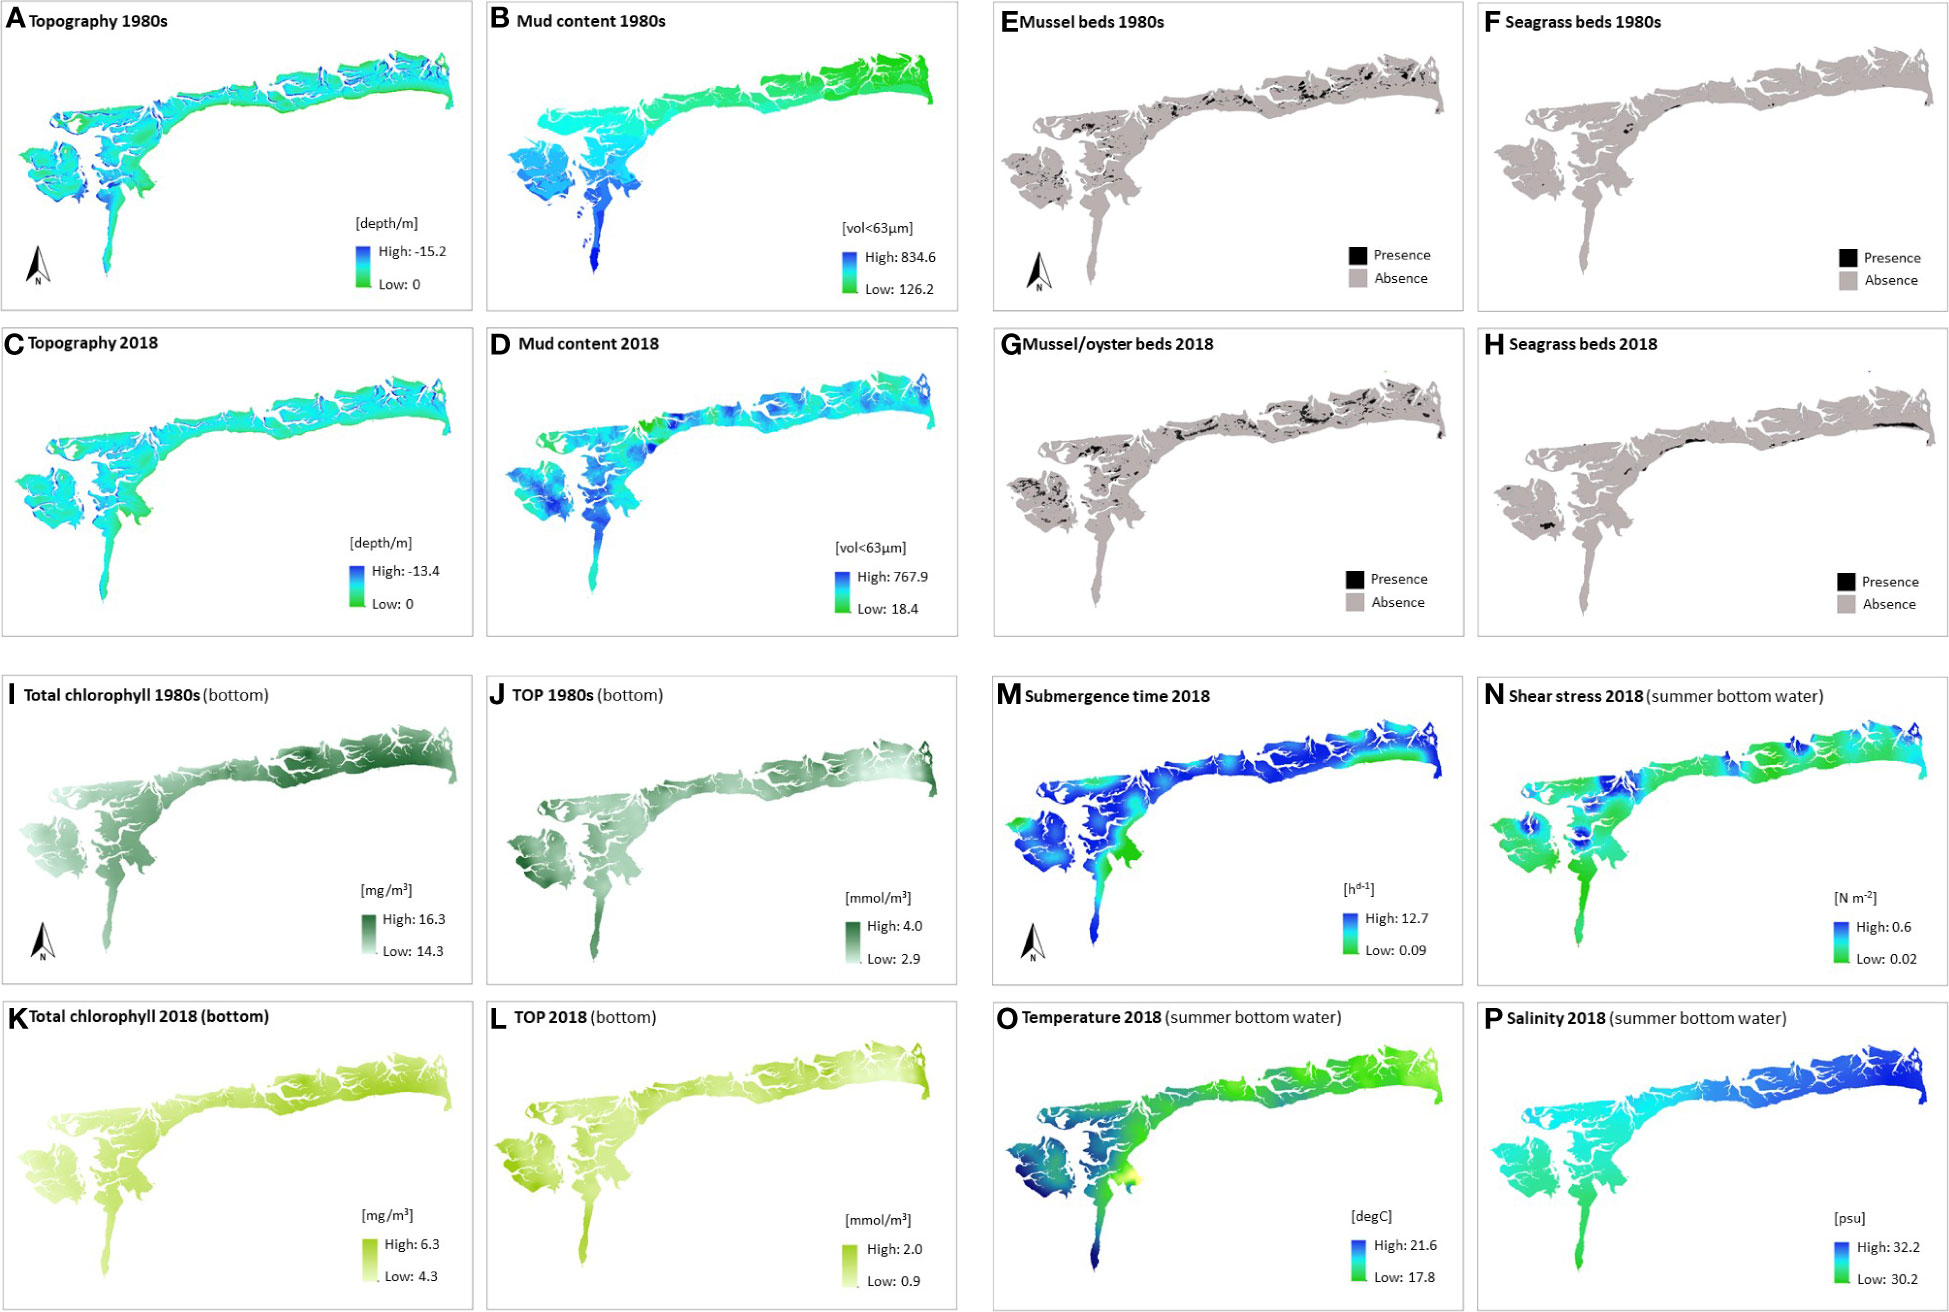
Figure 3 Environmental conditions in the EFWS (1980s versus 2018): (A) topography 1980s, (B) mud content 1980s, (C) topography 2018, (D) mud content 2018, (E) mussel beds 1980s, (F) seagrass beds 1980s, (G) mussel beds 2018, (H) seagrass beds 2018, (I) T_Chlb 1980s (hindcasted), (J) TOPb 1980s (hindcasted), (K) T_Chlb 2018, (L) TOPb 2018, (M) submergence time, (N) shear stress (summer bottom water), (O) temperature (summer bottom water) and (P) salinity (summer bottom water); converted in ArcGIS 10.7.1 to have the same extent (855.9 km2), coordinate system (WGS 84, EPSG 4326) and resolution (100 m); data comparability (1980s versus 2018): see paragraph above this figure; the coastline in Fig. 3c can differ slightly at the Leybucht. Data source given in Table 1.
2.3.1 Historical environmental data (representing the 1980s)
Mud content for the 1980s was available as ArcGIS (ESRI) shapefile and was digitized from a sediment map (Meyer and Ragutzki, 1999). Sediment types were identified via aerial photographs and following ground truthing. Sediment classes were decoded in sandflats, mixed sediments and mudflats, the decoding procedure was based on the report by Meyer and Ragutzki, 1999 and Meyer, 2004.
The topography was digitized from depth records from a large-scale measuring campaign of the entire German Bight coastal areas coordinated by the German Coastal Engineering Research Council (KFKI) during the mid-1970s. The digitized grid has a horizontal resolution of 5 m.
The ArcGIS (ESRI) shapefiles for seagrass beds (Zostera noltii, Z. marina) and mussel beds (Mytilus edulis) were obtained by aerial monitoring and ground truthing.
Based on previous environmental surveys, potential past nutrient loads in the EFWS were hindcast for the 1980s. Over the last 4 decades total organic phosphorus (TOP) and total chlorophyll (T_Chl) contents decreased significantly throughout the Wadden Sea (Van Beusekom et al., 2017; Van Beusekom et al., 2019).
2.3.2 Present-day environmental data (representing 2018)
For mud content, samples were taken from the surface layer (depth of ~4 cm) in the EFWS, during the 2018 SIBES/SENSI 3 sampling campaign, and thus, on the same spatial and temporal scale as carried out for the macrofauna samples. The mud content (particles <63 μm) was analyzed using a LS 13 320 Aqueous Liquid Module. Besides the particle size class, the volume of the particle size class within the sediment sample was calculated (Compton et al., 2013).
The topography was extracted and interpolated from a model topography. The model grid is unstructured with an average horizontal resolution of 175 m in the study area. Sources of model topography in the EFWS are digital terrain models from airborne laser scanning and sounding ranging from 2014-2018 (Hubert et al., 2021).
Tide-induced submergence time, bottom shear stress, bottom water salinity (Sbw) and summer bottom water temperature (Tsbw) were computed by the Regional Ocean Modeling System (ROMS; Shchepethik and McWilliams, 2005) as part of the Coupled Ocean-Atmosphere Wave-Sediment Transport Model (COAWST; Warner et al., 2010). The hydrodynamic model was operated using 20 vertical layers in a nested-grid application, resulting in a spatial resolution of 1000 m for the German Bight and 333 m for areas near the German Coast and the East-Frisian Islands.
For bottom total chlorophyll (T_Chlb) and bottom total organic phosphorus (TOPb) the coupled physical-biogeochemical Generalized Plankton Model (GPM) described by Kerimoglu et al. (2020) was used. The nutrient data in the sediment were derived from the geochemistry component of the model that describes the recycling of the organic material within the water and the sediments. As hydrodynamical host the General Estuarine Transport Model (GETM; Burchard and Bolding, 2002) was defined on a curvilinear grid with a horizontal resolution of 1.5-4 km and 20 vertical layers (Kerimoglu et al., 2020).
The ArcGIS (ESRI) shapefiles for Z. noltii beds and mixed mussel/oyster beds were obtained by aerial monitoring and ground truthing.
2.4 Macrofauna community analysis (1980s versus 2018)
For the community analysis, the species abundance data for each survey (i.e. 1980s and 2018) were calculated as individuals per m². The multivariate statistical community analysis was performed with the 1980s and the 2018 data respectively, to create comparable output data with the same statistical quality. Hereby, all sampled and identified taxa of both time intervals were included in the statistical analysis for the EFWS (1980s: 90 taxa, 2018: 81 taxa).
Group average cluster analysis followed by a similarity profile test (SIMPROF) were performed using the R package ‘clustsig’ (for Significant Cluster Analysis, R version 4.1.0; Whitaker and Christman, 2015) to separate different clusters within the abundance matrix, and to determine the number of significant clusters, based on fourth root transformed species abundance data and a Bray-Curtis dissimilarity matrix.
In the R package ‘vegan’ (for Community Ecology, R version 4.1.0; Oksanen et al., 2020) the ANOSIM (Analysis of Similarity) randomization test (Clarke and Green, 1988) was used to test the significant spatial and temporal differences in the community structure within and between the 1980s and 2018. In addition, discriminating species, which significantly (p < 0.05) separated the different communities were identified using the similarity percentage routine (SIMPER; Clarke, 1993). Finally, Canonical Correspondence Analysis (CCA), an ordination technique, was applied to analyze community-environment relationships at the study site. CCA output data revealed those parameters (major component axes) that best explained the variation in the abundance data, i.e. those environmental parameters having the highest correlation with the two major component axes (CCA1, CCA2).
3 Results
3.1 Habitat conditions (1980s versus 2018)
During the 1980s and 2018, the maximum depths occurred in the permanently submersed tidal channels, which connect the EFWS with the open North Sea (Figures 3A, C). Minimum depths were found along the coastlines of the mainland and the seven barrier islands. Mud contents in the 1980s (126 to 834 volume < 63 μm; Figure 3B) and 2018 (18.4-767.9 volume < 63μm; Figure 3D) followed the above-mentioned hydrodynamic gradient, with highest values in the western parts of the study site (Ems-Dollart estuary) and in the back barrier tidal flats of the islands (visible only in 2018 due to a better spatial resolution of the sampling campaign). The sediment grids (mud content 1980s, mud content 2018) and the topography grids (topography 1980s, topography 2018) are not statistically comparable. Nevertheless, major environmental gradients and trends at the study site are clearly visible and comparable between both time intervals.
Mussel beds covered 17.4 km² in the 1980s and mussel/oyster beds 29.2 km² in 2018 (Figures 3E, G). Seagrass beds covered 1.5 km² in the 1980s and 9.1 km² in 2019 (Figures 3F, H), with a generally narrow local distribution in the EFWS, concentrated on the sheltered coastal zones.
The highest total chlorophyll a content in the bottom waters in the 1980s and 2018 (1980s: 14.6 to 16.3 mg/m³, Figure 3I; 2018: 4.3 to 6.3 mg/m³, Figure 3K) occurred in the sheltered easternmost intertidal regions, highest bottom TOP prevailed at the topographically exposed outermost boundaries of the EFWS (1980s: 2.9 to 4.0 mmol/m³, Figure 3J; 2018: 0.9 to 2.0 mmol/m³, Figure 3L).
In addition, four high-quality and benthos-relevant environmental parameters could be collected for the present-day habitat conditions: submergence time, shear stress, salinity and temperature (Figures 3M–P). The submergence time ranged from 0.09 to 12.7 hours per day (Figure 3M), with the longest submergence time in the tidal channels and with the shortest submergence time on the uppermost tidal flats along the coastline of the mainland. Shear stress (0.02 to 0.6 N m-2, Figure 3N) followed this pattern, with highest values in the EFWS tidal channels, which connect the study site with the open North Sea. Summer bottom water temperatures (17.8 to 21.6 deg C, Figure 3O) generally showed a west-east decrease at the study site, whereas bottom water salinity (30.2 to 32.2 psu, Figure 3P) showed a west-east increase at the study site.
3.2 Macrofauna abundance and taxa (1980s versus 2018)
The total taxa number between the 1980s (90 species) and 2018 (81 species) revealed a 10% decrease (Table 2), but mainly due to a present unaccepted taxonomic identification of the 1980s species, which cannot be corrected because a taxa reference collection is lacking.
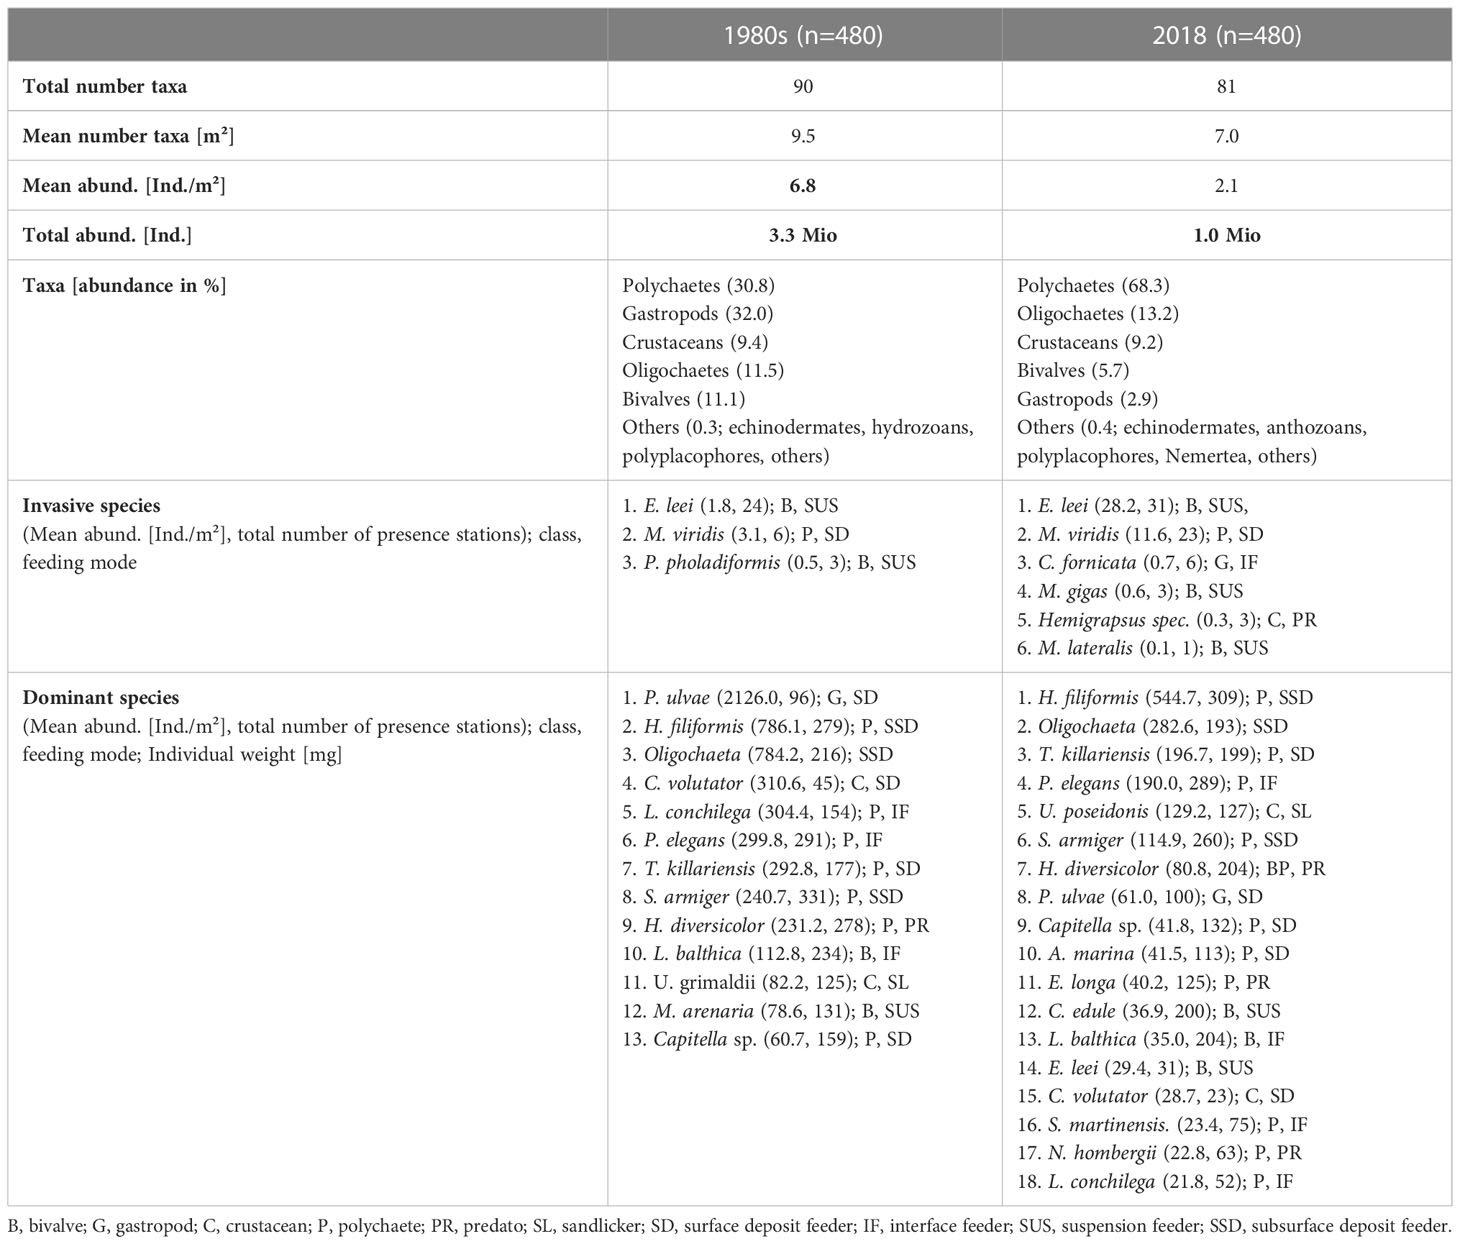
Table 2 Comparison of the most important macrofauna abundance and taxa changes in the East-Frisian Wadden Sea (1980s versus 2018).
The mean abundance/m² was significantly lower in 2018 by 31.0% (1980s: 6.8 Individuals per m², 2018: 2.1 Ind./m²; -31.0%), as did the total abundance (1980s: 3,3 Mio. Ind., 2018: 1,0 Mio. Ind.; -31.0%). In the 1980s, the percentage of the different taxonomic classes (i.e. polychaetes, gastropods, oligochaetes, crustaceans, bivalves and others) was more equally distributed than in 2018: i.e. polychaetes (35.8%), gastropods (32.0%), oligochaetes (11.4%), crustaceans (9.4%), bivalves (11.1%) and others (0.3%; see Table 2). In 2018, polychaetes dominated significantly in abundance (68.3%), followed by oligochaetes (13.2%), crustaceans (9.2%), bivalves (5.7%), gastropods (2.9%) and others (0.4%; see Table 2).
For details on the mean abundances and the number of presence stations for all identified invasive species (1980s, 2018), we refer to Table 2. In this study we considered species as invasive, when their introduction and/or spread threaten the biological diversity of the North Sea ecosystem (Büttger et al., 2017). Three taxa in the 1980s and six taxa in 2018 were considered as invasive. In the 1980s these were two bivalves: the razor clam Ensis leei and the American piddock Petricolaria pholadiformis; and one polychaete: Marenzelleria viridis. E. leei increased slightly in its occurrence (+7 stations) and significantly in its mean abundance (+93.6%). In addition, the mean abundance of M. viridis increased significantly (+73%) and the polychaete occurred more widespread in 2018 (+17 st.). Newly recorded invasive species in 2018 were: The Pacific oyster Magallana gigas, the dwarf surf clam Mulinia lateralis, the common American slippersnail Crepidula fornicata and the varunid crab Hemigrapsus spec. The bivalve P. pholadiformis was not found in the 2018 samples.
Dominant species were defined as those species covering together >90% of the total abundance in the studied region and during the studied timespan. In both periods, multiple species were identified as dominant (1980s: 13, 2018: 18; Table 2). The dominant species belonged to the following classes: polychaetes (1980s: 7 taxa, 2018: 11 taxa), oligochaetes (1980s and 2018, treated as one species), crustaceans (1980s: 3 taxa, 2018: 2 taxa), bivalves (1980s: 2 taxa, 2018: 3 taxa) and gastropods (1980s: 2 taxa, 2018: 1 taxa).
In the 1980s, the mudsnail Peringia ulvae had by far the highest abundance (2126.0 Ind./m²), but a strong patchy distribution, occurring at 96 sampling stations. Followed by the polychaete Heteromastus filiformis (799.3 Ind./m², 279 st.) and oligochaetes (797.3 Ind./m², 216 st.), both with a widespread distribution area-wide, occurring at 279 and 216 sampling stations. In 2018, the polychaete H. filiformis had the highest abundance (544.75 Ind./m²) and occurred widely (309 st.), followed by oligochaetes (282.6 Ind./m², 193 st.) and the polychaetes Tharyx killariensis (196.7 Ind./m², 199 st.) and Pygospio elegans (190.0 Ind./m², 289 st.), all three taxa with high mean abundances and a high occurrence rate area-wide.
The abundance of 14 out of the 19 dominant taxa decreased significantly between the 1980s and 2018 (Figures 4A, 5). The seven species with the most striking abundance decrease since the 1980s (>-80%) were: the surface deposit feeding gastropod P. ulvae (-97.1%, relatively stable number of stations; Figure 5A), the interface feeding sand mason worm Lanice conchilega (-92.8%, -102 st.; Figure 5B), the surface deposit feeding crustacean Corophium volutator (-90.8%, -22 st.; Figure 5C), the suspension feeding bivalve M. arenaria (-88.7%, -80 st.; Figure 5D) and the interface feeding bivalve Limecola balthica (-83.6%, -99 st.).
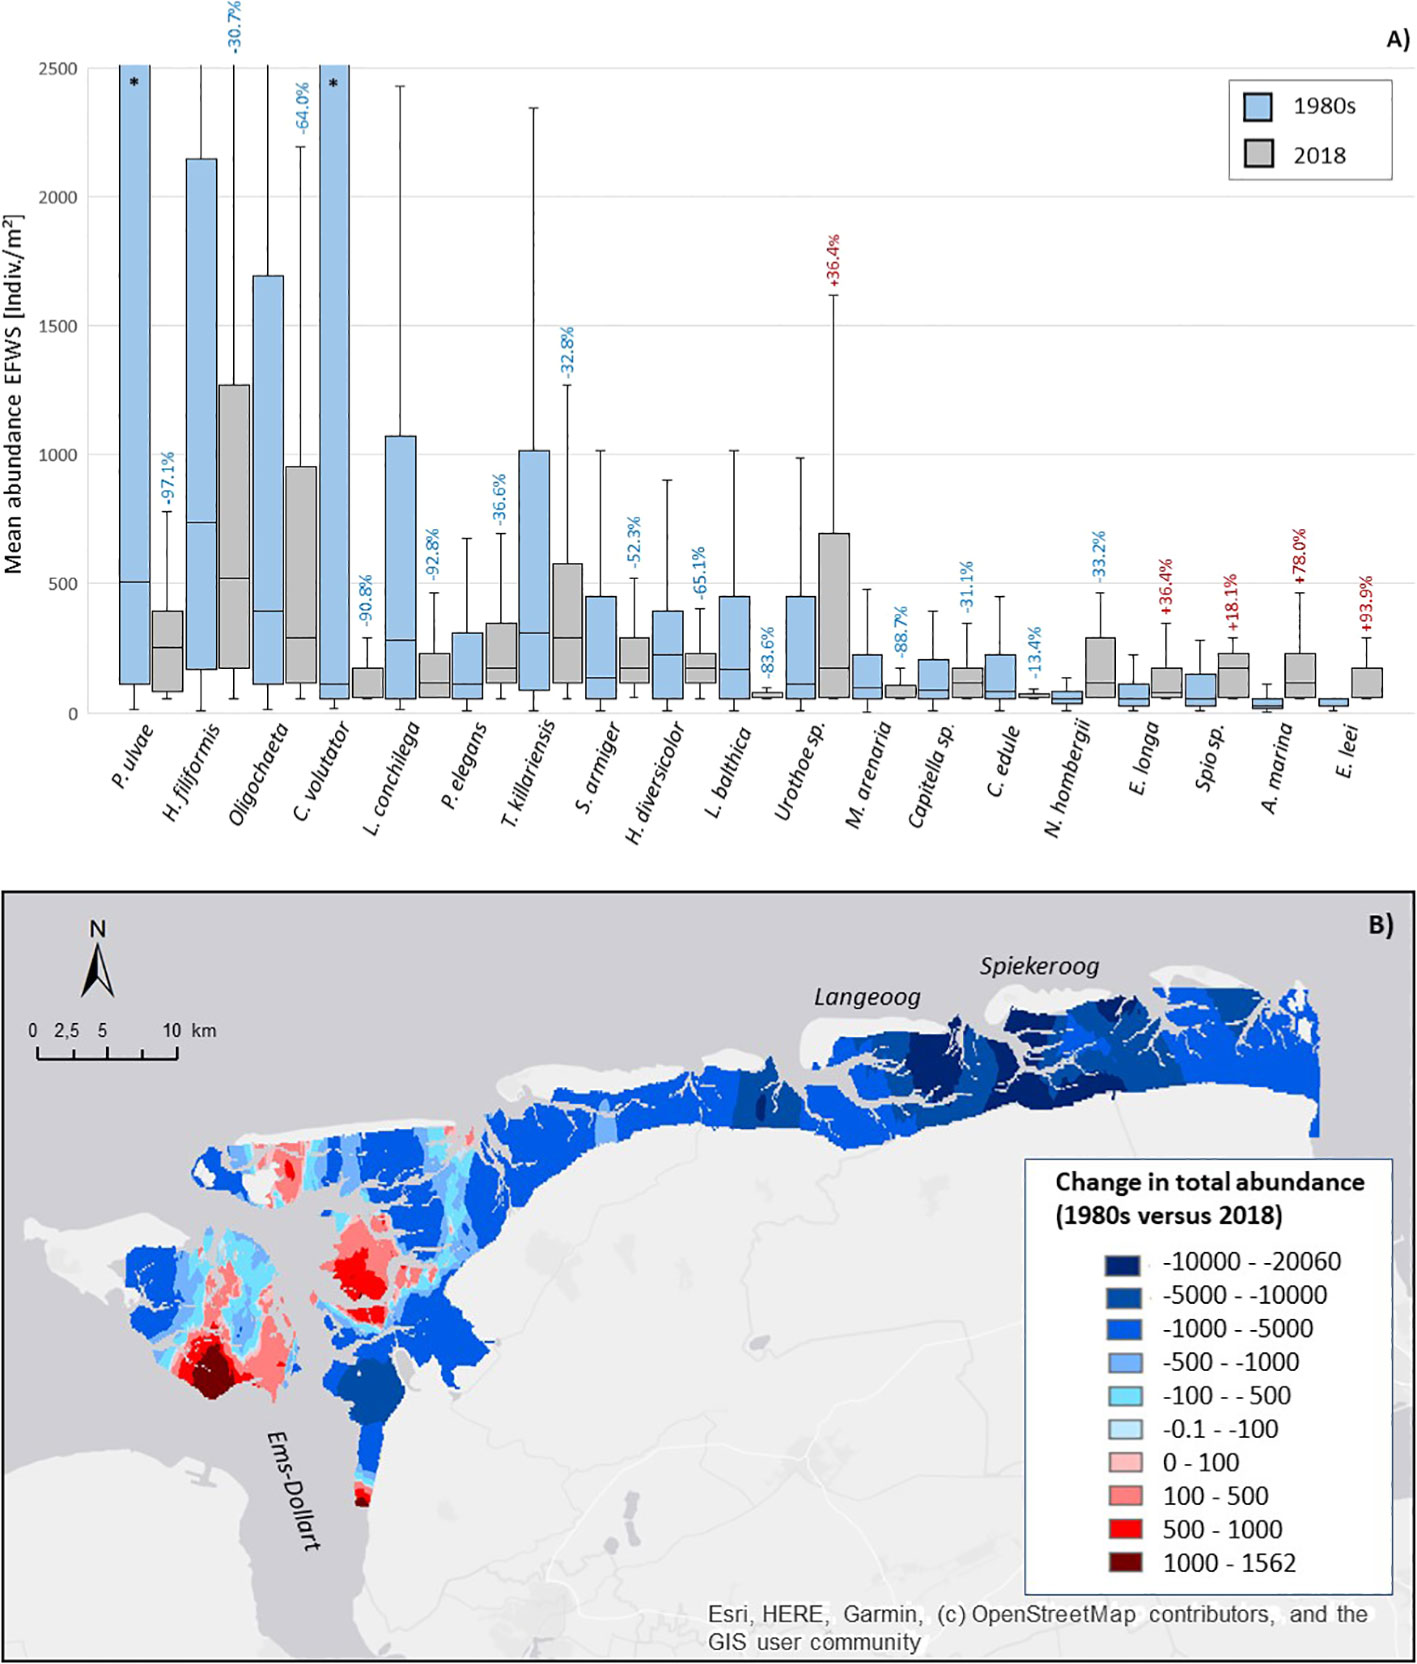
Figure 4 Spatio-temporal changes in the abundance of the dominant species in the East-Frisian Wadden Sea (EFWS); (A) boxplot showing the changes in the mean abundance [Ind./m²] between the 1980s and 2018, with % total abundance decrease (1980 versus 2018, blue color) and % total abundance increase (1980 versus 2018, red color), *: the abundance of P. ulvae and C. volutator was limited in the graph to enhance data visibility of the other species, for the absolute values for P. ulvae and C. volutator see Table 2; (B) map of the total abundance change since the 1980s in the EFWS. Blue colors indicate a decrease in the total abundance between the 1980s and 2018, red colors indicate an increase in the total abundance between the 1980s and 2018.
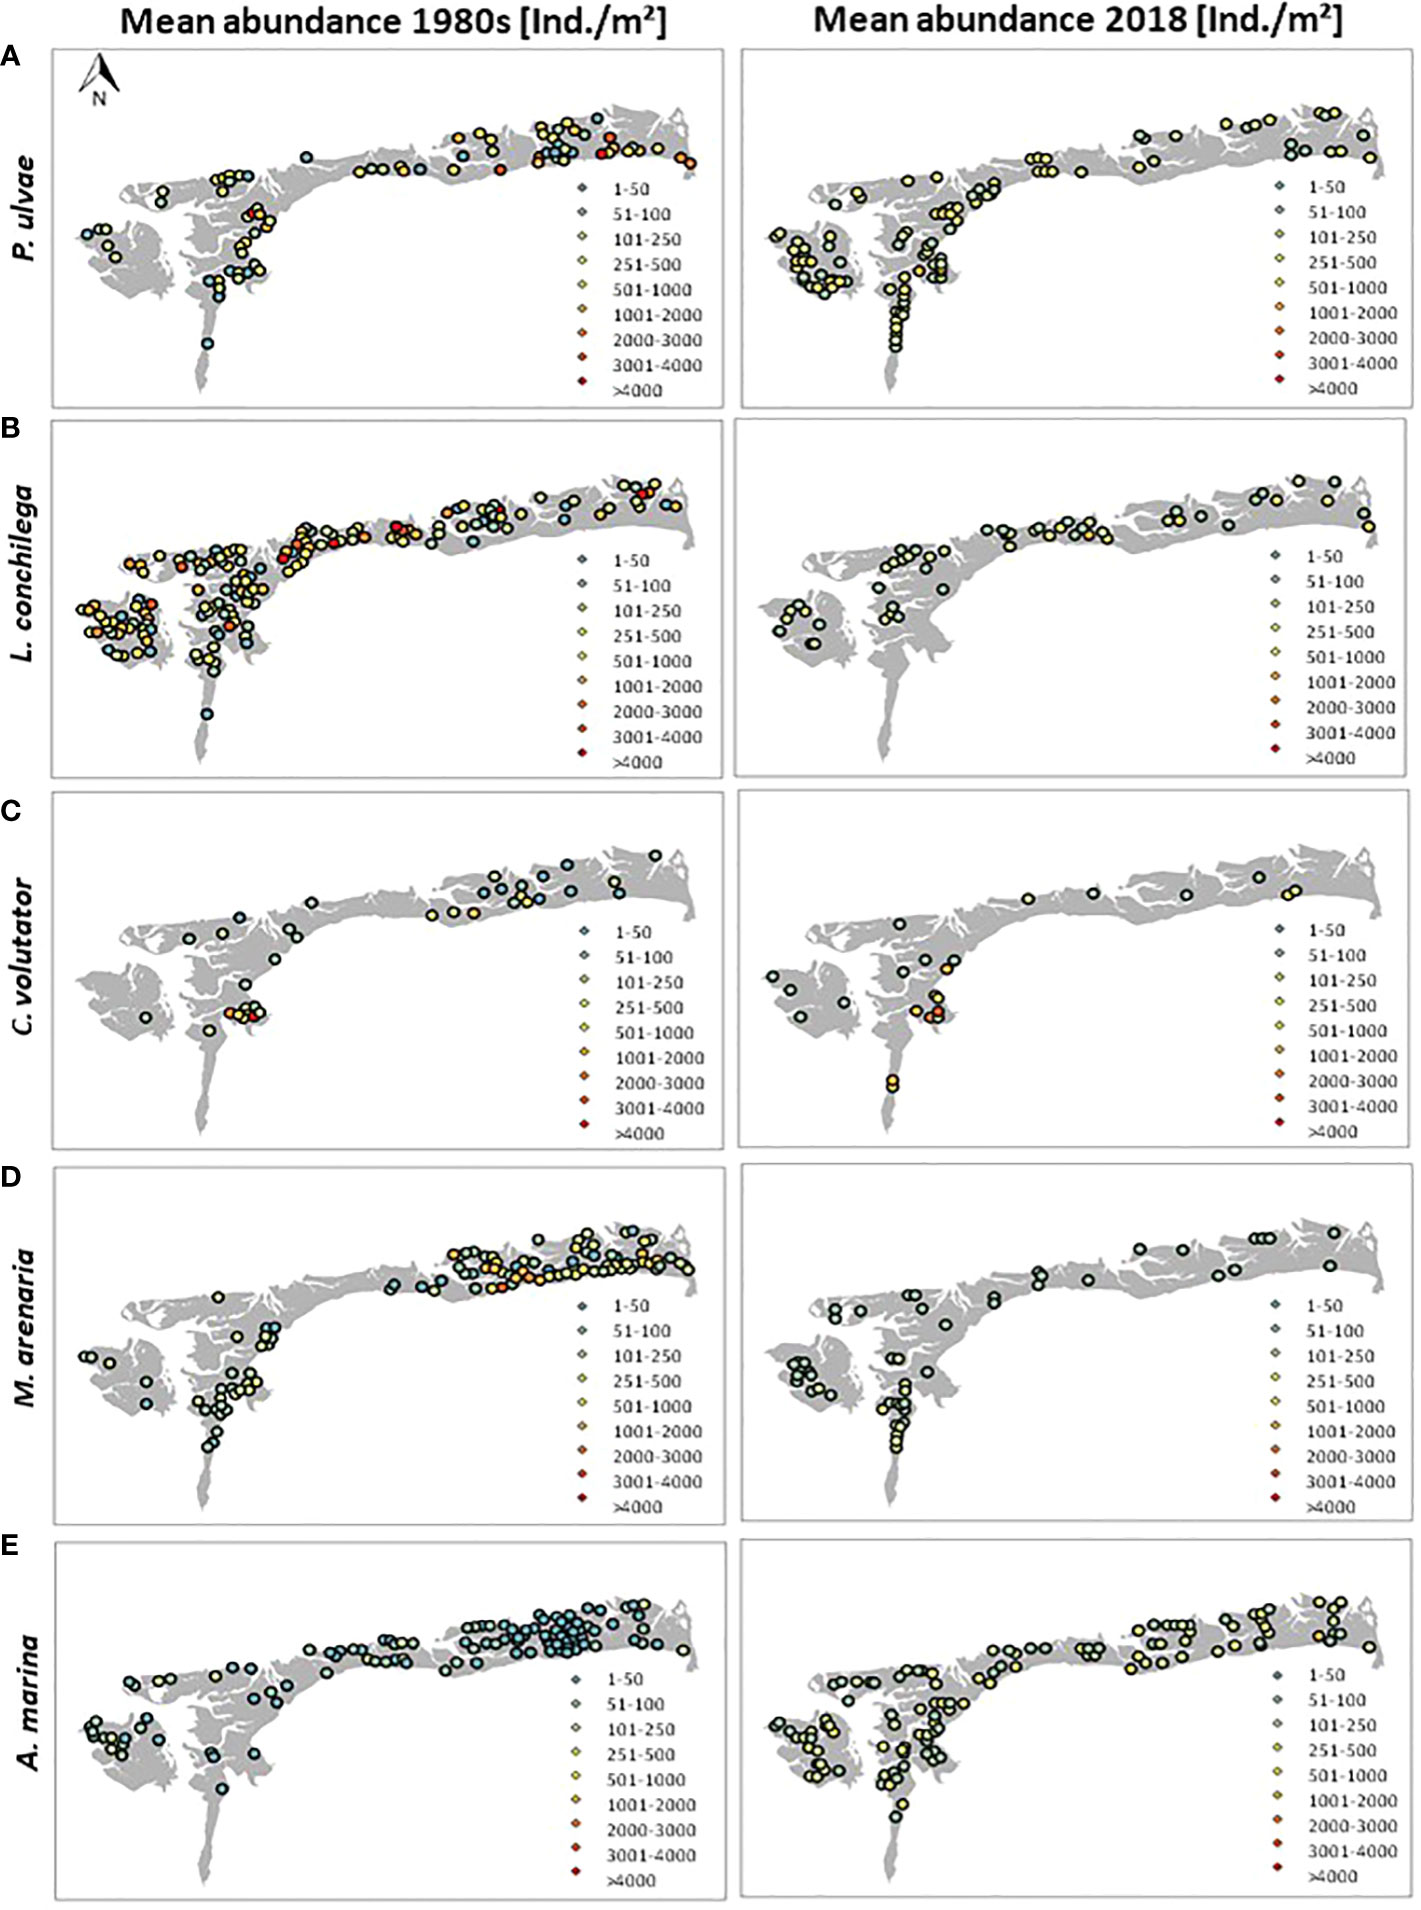
Figure 5 Overview of the spatial distribution of 5 dominant species showing most significant abundance decreases (A-D) and abundance increases (E) in the East-Frisian Wadden Sea (EFWS, 1980s versus 2018).
In contrast, five of the 21 dominant species showed a significant abundance increase since the 1980s. This abundance increase was not represented in the number of presence stations. These five species were: the suspension feeding and invasive bivalve E. leei (+93.9%, +8 st.), the surface deposit feeding lugworm Arenicola marina (+78.0%, +3 st.; Figure 5E), the predating worm Eteone longa (+36.4%, -15 st.), the suspension feeding crustacean Urothoe spec. (+36.4%, +2 st.) and the interface feeding polychaete Spio spec. (+18.1%, -9 st.).
The change in total abundance between the 1980s and 2018 (Figure 4B) shows a clear separation in regions with a significant abundance decrease in the eastern part, with the most significant abundance decrease, up to ~-20000 Ind./m², in the mudflats behind the eastern islands Langeoog and Spiekeroog, and regions with a moderate abundance increase (some patches in the western regions, close to the Ems-Dollart estuary) with a maximum of ~+1500 Ind./m².
3.3 Macrofauna biomass (1980s versus 2018)
In the EFWS, the mean biomass/m2 decreased significantly between the 1980s and 2018 by 47% (1980s: 3.5 g AFDM/m², 2018: 1.7 g AFDM/m²). For details on the mean biomass and the individual weights in mg of the biomass-dominant species (1980s versus 2018) see Table 3.
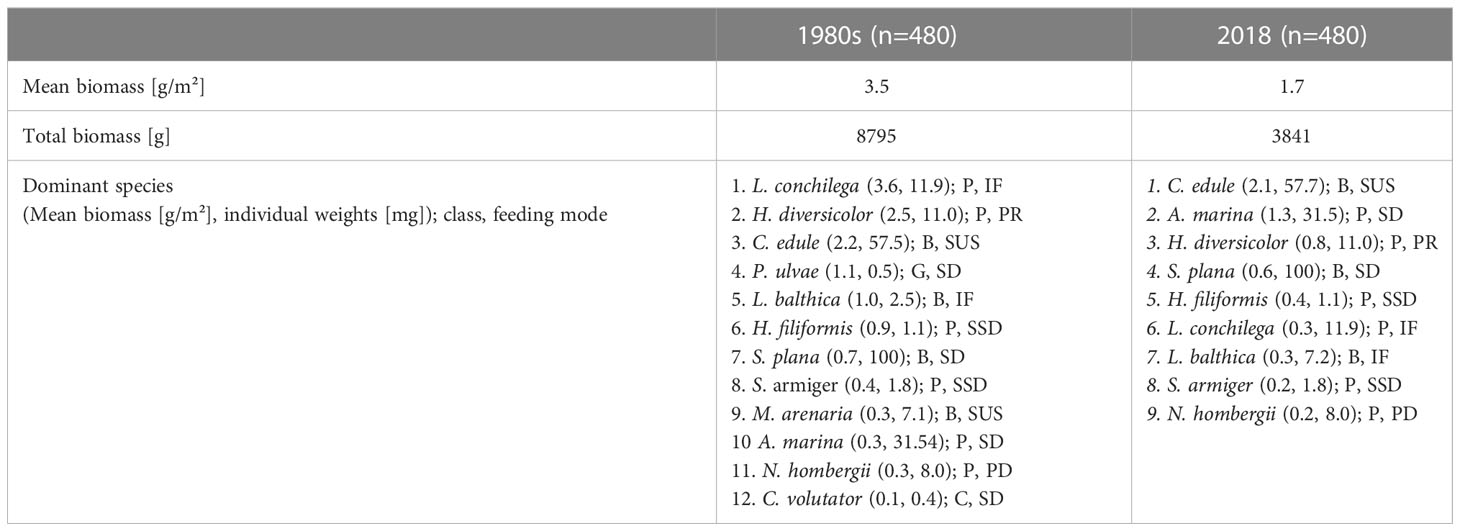
Table 3 Comparison of macrofauna biomass changes in the East-Frisian Wadden Sea (1980s versus 2018). B: bivalve, G: gastropod, C: crustacean, P: polychaete; PR: predator, SL: sandlicker, SD: surface deposit feeder, IF: interface feeder, SUS: suspension feeder, SSD: subsurface deposit feeder.
The interface feeding polychaete L. conchilega had the highest biomass in the macrofauna community during the 1980s (3.6 g/m²), with a relatively high individual weight (11.9 mg). Followed by the predating polychaete H. diversicolor (2.5 g/m², ind. weight: 11.0 mg) and the bivalve C. edule (2.2 g/m², ind. weight: 57.7 mg). In addition, the surface deposit feeding gastropod P. ulvae, with a low individual weight (0.5 mg) was identified as dominant in the 1980s in terms of biomass (1.1 g/m²), followed by the bivalve L. balthica (1.0 g/m², ind. weight: 2.5 mg) (Table 3). In 2018, most dominant macrofauna species in the EFWS in terms of biomass were the suspension feeding bivalve C. edule (2.1 g/m²) and two polychaetes: the deposit feeding lugworm A. marina (1.3 g/m², ind. weight: 31.4 mg) and the predating polychaete H. diversicolor (0.8 g/m²). Followed by the surface deposit feeding bivalve Scrobicularia plana (0.6 g/m², ind. weight: 100.2 mg). For details see Table 3.
The mean biomass/m2 of the surface deposit feeding gastropod P. ulvae decreased most significantly (-97.3%) between the 1980s and 2018 (Figures 6A, 7). Followed by the suspension and interface feeding species L. conchilega (-92.8%), M. arenaria (-79.0%) and L. balthica (-75.8%); and the surface deposit feeding amphipod C. volutator (-91.0%). In contrast, the mean biomass of the surface deposit feeding lugworm A. marina (+78.5%) increased significantly; and the biomass of the peppery furrow shell S. plana increased slightly by 12.5%. The mean biomass of the suspension feeding bivalve C. edule kept relative stable with only a slight decrease in the mean biomass between the 1980s and 2018 (-6.1%).
Figure 6 Spatio-temporal changes in the biomass of the dominant species in the East-Frisian Wadden Sea (EFWS); (A) boxplot showing the changes in the mean biomass [g/m²] between the 1980s and 2018, with % total biomass decrease (1980 versus 2018, blue color) and % total biomass increase (1980 versus 2018, red color), the two biomass-dominant species M. edulis and S. plana were not displayed in this figure to enhance data visibility of the other species; (B) map of the total biomass changes [g] in the East-Frisian Wadden Sea (1980s versus 2018).
Figure 7 Overview of the spatial distribution of 5 dominant species showing most significant biomass decreases (A–C), relatively stable biomass (D) and biomass increases (E) in the East-Frisian Wadden Sea (EFWS).
The total biomass [g/m²] decreased area-wide between the 1980s and 2018 (Figure 6B), with most significant decreases in the eastern part of the study site, on the back barrier tidal flats of the east-frisian islands Langeoog, Spiekeroog and Wangeroog (up to ~-154 g/m²), 2) and on the mudflats closest to the Ems-Dollart estuary (up to ~-70 g/m²).
3.4 Macrofauna community structure (1980s versus 2018)
SIMPROF-analysis (p<0.05) and group averaged cluster analysis, based on fourth root transformed abundance data and Bray-Curtis dissimilarity index, separated seven significant cluster (communities) for the 1980s (Figure 8A) and eight significant cluster (communities) for 2018 (Figure 8B).
Figure 8 Spatial distribution of the macrofauna communities in the East-Frisian Wadden Sea, based on community analysis of the SENSI1 (1980s) and SENSI3 (2018) abundance data; (A) seven separated macrofauna communities for the 1980s and (B) eight separated macrofauna communities for 2018 (based on SIMPROF and cluster analysis, R package “clustsig”, version 4.1.9).
Four macrofauna communities were equally separated for both time intervals: the Urothoe community, the Heteromastus/Oligochaeta community, the Scoloplos community and the Limecola community (Figure 8). The most dominant species of these four clusters, their mean abundances (Ind./m², % contribution), for the 1980s and 2018 respectively, are summarized in Table 4.
Table 4 Characteristic species of the four communities, separated equally for the 1980s and 2080 (results from SIMPROF and cluster analysis, R package “clustsig”, version 4.1.9).
In the 1980s and 2018, the widespread Heteromastus/Oligochaeta community was predominantly located on sediments with higher mud content and lower shear stress, along the coastal zones of the mainland and the barrier islands. This community was characterized by surface and subsurface deposit feeding polychaetes with a lower mobility, living buried in the sediments and with a higher tolerance towards anoxic conditions. Between the 1980s and 2018, this community increased significantly in its spatial distribution (1980s: 131 st., 2018: 217 st.).
The Scoloplos community occurred adjacent to the Heteromastus/Oligochaeta community during both studied periods, i.e. on the hydrodynamically more exposed mixed sediments closer to the tidal channels. This community kept relative stable in terms of spatial distribution (1980s: 67 st., 2018: 78 st.) and was represented by more mobile crustaceans (B. sarsii), together with predating (H. diversicolor) and tube-building polychaetes (P. elegans).
The Urothoe community decreased significantly between the 1980s and 2018 (1980s: 133 st., 2018: 51 st.). In the 1980s, it occurred widespread in the westernmost parts, close to the Ems-Dollart region. In 2018, the Urothoe community was reduced to some distinct patches. It was characterized by mobile and tube-building species (comparable to the Scoloplos community), but with a very high abundance of mobile and surface feeding crustaceans.
During both time periods, the Limecola community was present on very few suitable habitats (1980s: 7 st., 2018: 10 st.). It was mainly dominated by suspension (C. edule) and interface feeding bivalves.
Besides the above mentioned 4 communities, three further macrofauna communities were significantly separated for the 1980s: the Lanice community (38 st.; hot spots in the western regions, associated with the Urothoe community), the Peringia community (23 st., hot spots on the mudflats of the eastern regions) and the Corophium community (11 st.; hot spots on the uppermost tidal flats, directly adjacent to the coastlines). For 2018, four further macrofauna communities were significantly separated by SIMPROF-analysis: the Pygospio community (68 st.; hot spots under moderate environmental conditions in the central parts of the study site), the Nepthys community (18 st., hot spots in small patches adjacent to the tidal channels), the Arenicola community (10 st., some distinct patches in muddier sediments) and the Eteone community (8st., small patches in the hydrodynamically more exposed regions).
The results of the SIMPER-analysis confirm that all species dominating the respective clusters (Table 4) can be considered as discriminating species, and therefore, were responsible for the dissimilarities between the clusters. Furthermore, the SIMPER-analysis revealed further discriminating species for the respective clusters, which occurred less frequently in the different communities, but had a high influence on the cluster separation. For the 1980s, these were the two polychaetes Capitella sp. and Spio martinensis. For 2018, these were the crustacean Gammarus locusta and the two polychaetes Spio filicornis and Phyllodoce mucosa.
The CCA biplots for the 1980s, showed that total chlorophyll (summer bottom water) and mud content (CCA1, Eigenvalue: 0.7) as well as TOP and seagrass beds (CCA2, Eigenvalue: 0.4) were the most significantly correlated environmental parameters (Figure 9A). In 2018, these environmental parameters were chlorophyll and shear stress (CCA1, Eigenvalue: 0.5) as well as salinity and biogenic structures (CCA2, Eigenvalue: 0.3) (Figure 9B). For chlorophyll in the 1980s, as an example, the Peringia community tolerates higher chlorophyll contents, compared to most other communities, which prefer lower chlorophyll contents. For salinity in the 2018, as second example, the Limecola community tolerates habitats with a higher salinity than e.g. the Pygospio community or the Hetereomastus/Oligochaeta community.
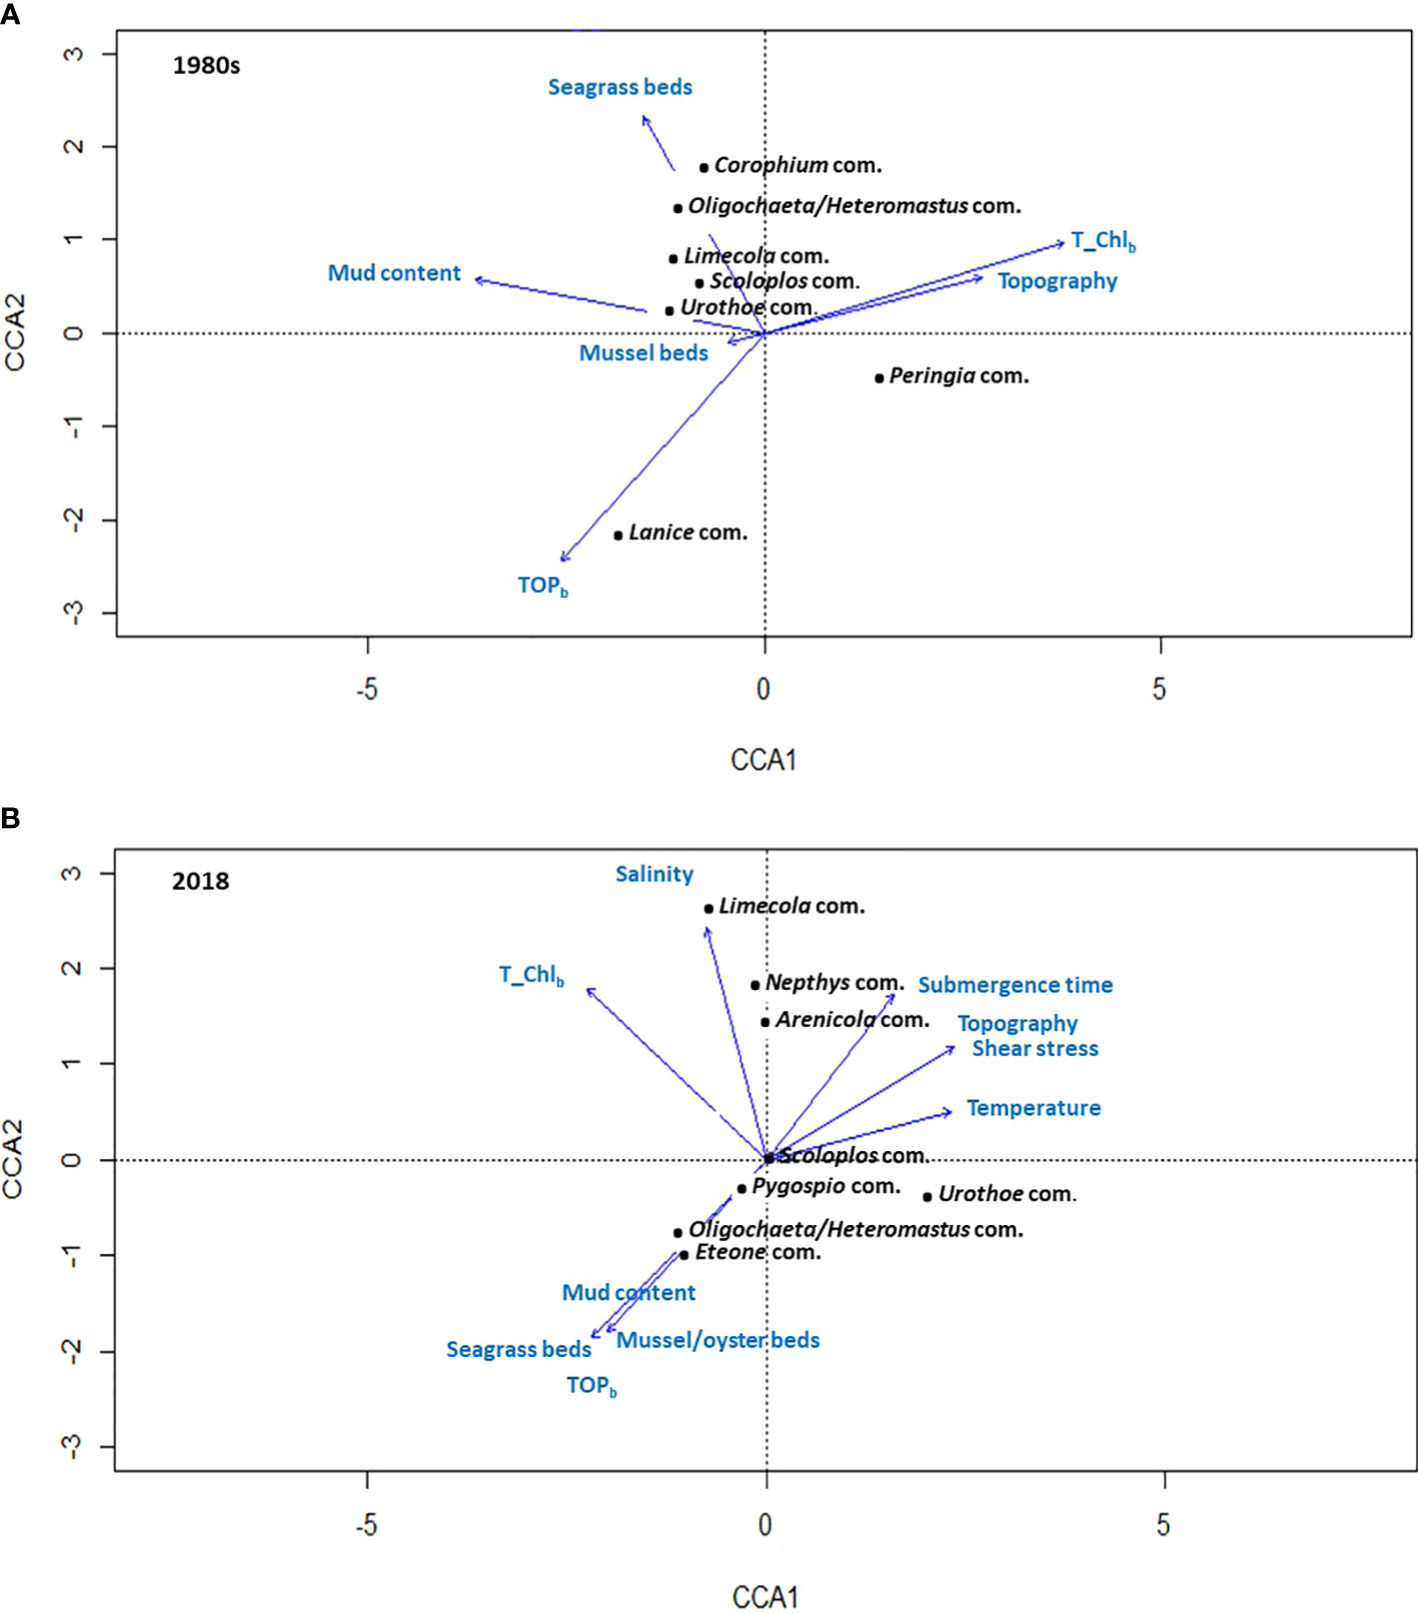
Figure 9 Canonical Correspondence Analysis (CCA) biplots; (A) for the 1980s, showing the environmental parameters having the highest correlation with the variation in the seven separated macrofauna communities; (B) for 2018, showing the environmental parameters having the highest correlation with the variation in the eight separated macrofauna communities.
4 Discussion
The most striking quantitative outcome of our comparison was, that a significant decrease in the total abundance (-31%) and in the mean abundance per m2 (-31%) of the macrofauna could be recorded for the EFWS (1980s versus 2018). In contrast, the mean number of taxa per m² and the total number of taxa remained relatively stable between the two studied time periods. In addition, the total biomass decreased significantly between the 1980s and 2018 by 45.0%, as did the mean biomass per m² by 47.0%. Abundance and biomass of different species decreased or increased on a large or small spatial scale. All investigated macrofauna changes and related processes will be discussed below.
4.1 Decrease in macrofauna abundance and biomass related to de-eutrophication
The significant decrease in total abundance and biomass was mainly caused by the decrease in abundance and biomass of the gastropod Peringia ulvae (-97%), which feeds on microphytobenthos. In addition, the decrease of P. ulvae as well as the decrease in abundance and biomass of particulate organic matter (POM) feeding polychaetes, amphipods and bivalves coincided with decreasing food supply, as documented in this study by several model results for decreasing chlorophyll a (-10 µg/L) and TOP concentrations (-2.0 mmol N/m²) for the EFWS. In coastal waters of the south-eastern North Sea, the decrease in food supply from the water column correlates with decreasing nutrient loads from the rivers (Philippart et al., 2007; Capuzzo et al., 2017; Van Beusekom et al., 2019; Desmit et al., 2020). The OSPAR regulations of 50% nutrient reduction since the 1980s (OSPAR, 2010) aimed at the substantial nutrient reduction in the rivers Elbe, Weser, Ems, IJssel, Rhine, Scheldt and Meuse since the 1980s (Emeis et al., 2015; Van Beusekom et al., 2019), because under EU legislations, stricter requirements apply to agriculture and urban waste water treatment plants, discharging into areas designated as sensitive or vulnerable to nutrient inputs.
Furthermore, suspension and surface deposit feeding macrofauna species such as L. conchilega and M. arenaria depend on fresh and high-quality food in the water column and on the sediment surface, as confirmed by the CCA results for 2018, and thus, suffer from decreasing food supply. As a consequence, the reduction of benthic abundance and biomass in the EFWS will trigger further abundance and biomass changes in higher trophic levels (e.g. benthivore crustaceans, fish, birds and mammals) in the near future, and thus, in the entire marine food web (Schückel et al., 2015; Gravel et al., 2016; De la Vega et al., 2018). Macrofauna abundance and biomass decreases, in combination with a stable taxa number, were also found for macrofauna communities in the adjacent south-eastern North Sea and were also related to de-eutrophication processes since the 1980s (Meyer et al., 2018). The decrease in total macrofauna abundance and biomass in the EFWS between 1980s and 2018 are confirmed by similar decreasing trends in macrofauna abundance and biomass of continuous long-term studies in the western Dutch Wadden Sea, at Balgzand and Norderney in summer (Philippart et al., 2007; Kröncke et al., 2013; Dippner and Kröncke, 2015; Beukema and Dekker, 2020). In contrast, biomass remained rather stable at several stations in the eastern Dutch Wadden Sea (Drent et al., 2017), similar to the results for the Ems-Dollart estuary in this study.
Decreased nutrient loads led to a significant reduction in algae blooms, and as a consequence, to a better water quality and oxygen conditions in the EFWS (Van Beusekom et al., 2019), which also has a positive effect on seagrass and mixed mussel/oyster beds (e.g. Folmer et al., 2017). The results of our study confirm the German Wadden Sea wide recorded seagrass recovery until 2018 as well as the extension of mixed mussel/oyster beds (Wehrmann et al., 2000; Markert et al., 2010; Schumacher et al., 2014). The seagrass recovered by 7.6 km² in the EFWS (1980s: 1.5 km², 2019: 9.1 km²) and the mixed mussel/oyster beds extended by 12.2 km² (1980s: 17.4 km², 2018: 29.2 km²). These changes in biogenic structures reveal a similar process as described for the Sylt Wadden Sea (Dolch et al., 2013). In general, seagrass beds and mussel/oyster beds locally enhance the “buffling” of sedimentation processes of finer sediments, reduce turbidity and increase light penetration, which in turn clearly alters benthic habitats (Bos et al., 2007; Van Katwijk et al., 2010; Schückel et al., 2013; Andriana et al., 2021) concerning species richness, abundance, biomass or diversity of sessile species such as anthozoans or barnacles.
4.2 Macrofauna abundance and biomass related to sea level rise mediated morphodynamics and sediment changes
Besides de-eutrophication mediated changes in the macrofauna communities, detected changes could also be attributed to sea level rise and associated environmental effects. Although the abundance and biomass of the polychaete H. filiformis (subsurface deposit feeder, SSD) and oligochaetes (SSD) decreased significantly in the EFWS since the 1980s, the Oligochaeta/Heteromastus community increased in spatial extension in 2018, as also found in the Jade Bay and the Sylt Wadden Sea (Schückel and Kröncke, 2013; Schumacher et al., 2014). In the CCA analyses, the spatial patterns of the Heteromastus/Oligochaeta community were related to the seagrass beds and mussel/oyster beds, which increased in particular in the Ems-Dollart estuary. The “buffling” effects of these biogenic structures on higher sedimentation rates led to locally increased mud contents in 2018.
In contrast, the more widespread spatial distribution and increased abundance and biomass of A. marina in the entire EFWS, but in particular in the Ems-Dollart estuary, are an indication for higher sand accretion rates in the EFWS in 2018, since A. marina is a characteristic species for sand flats (Volkenborn, 2005). About 30 cm of sea level rise in the Wadden Sea since the last century (Schückel and Kröncke, 2013; Schumacher et al., 2014) caused increased current velocities and increased erosion rates in subtidal areas and of the EFWS islands, which led to reduced mud contents and increased sand accretion on tidal flats (Flemming and Bartholomä, 1997; Schückel and Kröncke, 2013; Schumacher et al., 2014; Benninghoff and Winter, 2019).
Benninghoff and Winter (2019) calculated an accretion rate of 5-7.5 mm/y in the Ems-Dollart region since 1998, which was related to an import of sediments in the Ems-Dollart estuary of 17.8 106 m3 in the eulittoral and 42.5 106 m3 in the sublittoral. From the western to the eastern EFWS the accretion rate reached 0.1-15 mm/y. This was related to an import of sediments of 56.7 106 m3 in the eulittoral and 29.0 106 m3 in the sublittoral. Sediment and topography maps from the 1980s and 2018 both reflect these trends, i.e. decreasing depth and changes in the sediment composition, and therefore, confirm the above discussed changes in morphodynamics due to erosion and accretion of sediments. The map from the 1980s showed highest mud contents in the Ems-Dollart estuary, while the map of 2018 revealed significantly lower mud contents in this region than in the 1980s. Sand accretion and lower mud contents seemed to support the spatial extension of A. marina in the Ems-Dollart estuary, as confirmed by the CCA results in 2018. Furthermore, other species such as P. ulvae, E. leei, L. conchilega and M. arenaria seem to benefit from lower mud contents in the Ems-Dollart estuary since the 1980s.
Higher mud contents in the 1980s were probably also related to started dredging activities in the inner and outer Ems-Dollart estuary (De Jonge, 1983; De Jonge and Schückel, 2019). These dredging activities caused high amounts of suspended matter in the water column and changes in hydrodynamics, which affected benthic habitats and fishery grounds in the Ems-Dollart (Schultze and Nehle, 2017). Increasing current velocities due to synergistic effects of sea level rise and channel deepening might have resulted in decreased mud contents in 2018 in the Ems-Dollart estuary.
4.3 Non-native species in the EFWS in response to temperature increase
The climate driven increase in sea surface temperatures (SST) in the EFWS by 2°C since the 1980s (Kröncke et al., 2013; Beukema and Dekker, 2020; Meyer et al., 2021) enabled the establishment of new invasive species in the EFWS, which has been reviewed by Buschbaum et al. (2012) and Lackschewitsch et al. (2014). In this study, the total number of invasive species increased by four to a total of six species in 2018. The abundance of two species increased significantly, i.e. the suspension feeding bivalve E. leei (+90%) and the surface deposit feeding polychaete M. viridis (+20%). The newly recorded four invasive species in 2018 (the more generalistic and interface feeding gastropod C. fornicata, the two suspension feeding bivalves M. gigas and M. lateralis, and the predating crustacean Hemigrapsus spec.) were also recorded in other Wadden Sea regions since the 1980s (e.g. Schückel et al., 2013; Büttger et al., 2017) and were found in numerous relevant studies and high-quality marine databases as tolerant towards higher temperatures and selective towards higher-quality and fresh food at the sediment surface (e.g. Drent et al., 2017; MarLIN, 2021; SeaLifeBase, 2021). The four species C. fornicata, M. gigas, M. lateralis and Hemigrapsus spec. are associated to mussel/oyster beds (Markert et al., 2010). Their low abundance in this study is due to the unrepresentative sampling design of the mussel/oyster beds. At Balgzand in the Dutch Wadden Sea, Dekker and Beukema (2021) described the reduction of L. balthica due to increasing SST. In contrast, the warm-temperate bivalve Abra tenuis expanded in the Dutch Wadden Sea and was also found in single specimens at Norderney and Spiekeroog in this study in 2018.
Our results reflect the importance of de-eutrophication and sea level rise mediated changes in the macrofauna communities in the EFWS, which will have significant effects on the entire food web, in particular due to the high ecological value of the EFWS as nursery ground for juvenile flat fish and as feeding area for breeding and resting bird stocks. De-eutrophication processes are an essential measure, which reflect the positive effect of legal restrictions on harmful nutrient loads, which has already been started in the 1980s. Because ongoing sea level rise and temperature increase are predicted for the next decades, the EFWS ecosystem will face comparably serious environmental and biological changes in the future. Thus, the detailed knowledge of significant changes in the UNESCO Wadden Sea World Heritage Site is essential for guiding future environmental law decisions and the development of realistic management concepts and stakeholder-scenarios, with the overarching aim to establish a persistent strategy for a sustainable use of natural marine resources.
Data availability statement
The datasets presented in this study can be found in online repositories. The names of the repository/repositories and accession number(s) can be found below: http://www.mdi.niedersachsen.de/, http://www.mdi.niedersachsen.de/.
Author contributions
AS, and IK made the conception and design of the study AS wrote most parts of the manuscript IK wrote most of the discussion section of the manuscript AB, SH, LK, HV, and GS provided macrofauna data AS, IK, and TR organized the macrofauna database TR made the taxonomic identification of the macrofauna data AS performed the statistical analysis FH, KH, OK, KL and AW provided environmental data. All authors contributed to the article and approved the submitted version.
Funding
Sampling 1980s and taxonomic identification was financed by NLPV. Sampling 2018 was funded by the SIBES programme at NIOZ. Taxonomic identifcation 2018 and data analysis were funded by Lower Saxony Wadden Sea Foundation (1-18_SENSI3) and Bingo Environmental Foundation (Ems 003/18G). Funds for personel costs were managed at ICBM, University of Oldenburg. Working place for taxonomic identification 2018 was provided by NIOZ. Working place for data analysis was provided by Senckenberg am Meer. The taxonomy of the 2018 samples and the data analyses were funded by the Lower Saxony Wadden Sea Foundation and the Bingo Environment Foundation, which is kindly acknowledged. SIBES is currently financed by the Nederlandsche Aardolie Maatschappij NAM, Rijkswaterstaat RWS and the Royal NIOZ. OK was supported by the Deutsche Forschungsgemeinschaft (grant no. KE 1970/2-1). The numerical simulations of FH were financed by the Ministry for Science and Culture (MWK) of Lower Saxony, Germany, and the German Research Foundation (DFG). AB was partly funded by the Dutch Research Council grand VI.Veni.192.051.
Acknowledgments
This paper is dedicated to the late Dr. Gerald Millat, NLPV, who always supported benthic research in the Lower Saxony Wadden Sea. We also thank the current SIBES core team for collecting and processing the many samples. In alphabetical order they are Anne Dekinga, Job ten Horn, Jeroen Kooijman, Anita Koolhaas, Simone Miguel, Luc de Monte and Dennis Mosk, Bianka Rasch, Charlotte Saull, Marten Tacoma and Eveline van Weerlee. The RV Navicula was essential for collecting the samples and particularly we thank the current crew Wim Jan Boon, Klaas Jan Daalder, Bram Fey, Hendrik Jan Lokhorst and Hein de Vries.
Conflict of interest
The authors declare that the research was conducted in the absence of any commercial or financial relationships that could be construed as a potential conflict of interest.
Publisher’s note
All claims expressed in this article are solely those of the authors and do not necessarily represent those of their affiliated organizations, or those of the publisher, the editors and the reviewers. Any product that may be evaluated in this article, or claim that may be made by its manufacturer, is not guaranteed or endorsed by the publisher.
References
Adolph W. (2010). Praxistest monitoring küst(2008) seegraskartierung gesamtbestandserfassung der eulitoralen seegrasbestände im niedersächsischen wattenmeer und bewertung nach EG-wasserrahmenrichtlinie. NLWKN Küstengewässer und Ästuare 2/2010. 52, S.
Albouy C., Guilhaumon F., Villéger S., Mouchet M., Mercier L., Culioli J. M., et al. (2011). Predicting trophic guild and diet overlap from functional traits: statistics, opportunities and limitations for marine ecology. Mar. Ecol. Prog. Ser. 436, 17–28. doi: 10.3354/meps09240
Andriana R., Engel F. G., Gusmao J. B., Eriksson B. K. (2021). Intertidal mussel reefs change the composition and size distribution of diatoms in the biofilm. Mar. Biol. 168, 24. doi: 10.1007/s00227-020-03819-2
Beare D. J., Burns F., Greig A., Jones E. G., Peach K., Kienzle M., et al. (2004). Long-term increases in prevalence of north Sea fishes having southern biogeographic affinities. Mar. Ecol. Prog. Ser. 284, 269–278. doi: 10.3354/meps284269
Behre K. E. (2011). Sea-Level changes in the southern north Sea region: a response to bungenstock and weert(2010). Int. J. Earth Sci. 101, 1077–1082. doi: 10.1007/s00531-011-0697-4
Benninghoff M., Winter C. (2019). Recent morphological evolution of the German wadden Sea. Sci. Rep. 8, 9293. doi: 10.1038/s41598-019-45683-1
Beukema J. J. (1992). Expected changes in the wadden Sea benthos in a warmer world: lessons from periods with mild winters. Neth J. Sea Res. 30, 73–79. doi: 10.1016/0077-7579(92)90047-I
Beukema J. J., Dekker R. (2020). Half a century of monitoring macrobenthic animals on tidal flats in the Dutch wadden Sea. Mar. Ecol. Prog. Ser. 656, 1–18. doi: 10.3354/meps13555
Beukof E., Dencker T. S., Pecuchet L., Lindegren M. (2019). Spatio-temporal variation in marine fish traits reveals community-wide responses to environmental change. Mar. Ecol. Prog. Ser. 610, 205–222. doi: 10.3354/meps12826
Bijleveld A. I., Compton T. J., Klunder L., Holthuijsen S., Ten Horn J., Koolhaas A., et al. (2018). Presence-absence of marine macrozoobenthos does not generally predict abundance and biomass. Sci. Rep. 8, 3039. doi: 10.1038/s41598-018-21285-1
Bijleveld A., Van Gils J. A., van der Meer J., Dekinga A., Kraan C., van der Veer H., et al. (2012). Designing a benthic monitoring program with multiple conflicting objectives. Meth Ecol. Evol. 3, 526–536. doi: 10.1111/j.2041-210X.2012.00192.x
Birchenough S. N. R., Reiss H., Degraer S., Mieszkowska N., Borja A., Buhl-Mortensen L., et al. (2015). Climate change and marine benthos: a review of existing research and future directions in the north Atlantic. Wiley Interdiscip Rev. Clim Change 6, 203–223. doi: 10.1002/wcc.330
Boersma M., Wiltshire K. H., Kong S.-M., Greve W., Renz J. (2015). Long-term change in the copepod community in the southern German bight. J. Sea Res. 101, 41–50. doi: 10.1016/j.seares.2014.12.004
Bos A. R., Bouma T. J., de Kort G. L. J., van Katwijk M. M. (2007). Ecosystem engineering by annual intertidal seagrass beds: sediment accretion and modification. Estuar. Coast. Shelf Sci. 74, 344–348. doi: 10.1016/j.ecss.2007.04.006
Bowler D. E., Haase P., Kröncke I., Tackenberg O., Bauer H. G., Brendel C., et al. (2015). A cross-taxon analysis of the impact of climate change on abundance trends in central Europe. Biol. Conserv. 187, 41–50. doi: 10.1016/j.biocon.2015.03.034
Boyce D. G., Lewis M. R., Worm B. (2010). Global phytoplankton decline over the past century. Nature 466, 591–596. doi: 10.1038/nature09268
Burchard H., Bolding K. (2002). GETM - a general estuarine transport model. Sci. Doc. (Italy: EGS General Assembly Conference), 157.
Buschbaum C., Lakschewitz D., Reise K. (2012) Nonnative macrobenthos in the Wadden Sea ecosystem. Ocean and Coastal Management, 68, 89–101.
Büttger H., Buschbaum C., Dolmer P., Gittenberger A., Jensen K., Kabuta S., et al. (2017). Alien species. in: Wadden Sea quality status report 2017 (Wilhelmshaven, Germany: Common Wadden Sea Secretariat).
Capuzzo E., Lynam C. P., Barry J., Stephens D., Forster R. M., Greenwood N., et al. (2017). A decline in primary production in the north Sea over 25 years, associated with reductions in zooplankton abundance and fish stock recruitment. Global Change Biol. 24, 352–364. doi: 10.1111/gcb.13916
Clarke K. R. (1993). Non-parametric multivariate analyses of changes in community structure. Austr. J. Ecol. 18, 117–143. doi: 10.1111/j.1442-9993.1993.tb00438.x
Clarke K. R., Green R. H. (1988). Statistical design and analysis for a ‘biological effects’ study. Mar. Ecol. Prog. Ser. 46, 213–226. doi: 10.3354/meps046213
Compton T. J., Holthuijsen S., Koolhaas A., Dekinga A., Ten Horn J., Smith J., et al. (2013). Distinctly variable mudscapes: distribution gradients of intertidal macrofauna across the Dutch wadden Sea. J. Sea Res. 82, 103–116. doi: 10.1016/j.seares.2013.02.002
CWSS, Kloepper S., et al. (2017). “Wadden Sea quality status report 2017,” in Introduction (Wilhelmshaven, Germany: Common Wadden Sea Secretariat). Available at: https://www.qsr.waddensea-worldheritage.org/reports/introduction.
De Jong F. (2007). Marine eutrophication in perspective: on the relevance of ecology for environmental policy. Aquat. Ecol. (Verlag, Berlin: Springer). 40, 581–582.
De Jonge V. N. (1983). Relations between annual dredging activities, suspended matter concentrations, and the development of the tidal regime in the ems estuary. Can. J. Fish Aquat. Sci. 40 (Suppl 1), 289–300. doi: 10.1139/f83-290
De Jonge V. N., Schückel U. (2019). Exploring effects of dredging and organic waste on the functioning and the quantitative biomass structure of the ems estuary food web by applying input method balancing in ecological network analysis. Ocean Coast. Managem. 174, 38–55. doi: 10.1016/j.ocecoaman.2019.03.013
Dekker R., Beukema J. J. (2021). Climate warming leads to replacement of limecola balthica by abra tenuis on 2 high tidal flats of the wadden Sea. J. Sea Res. 178, 102137. doi: 10.1016/j.seares.2021.102137
De la Vega C., Schückel U., Horn S., Kröncke I., Asmus R., Asmus H. (2018). How to include ecological network analysis results in management? A Case study three tidal basins Wadden Sea south-eastern North Sea. Ocean Coast. Managem. 163, 401–416. doi: 10.1016/j.ocecoaman.2018.07.019
Desmit X., Nohe A., Borges Vieira A., Prins T., De Cauwer K., Lagring R., et al. (2020). Changes in chlorophyll concentration and phenology in the north Sea in relation to de-eutrophication and sea surface warming. Limnol. Oceanogr. 65, 828–847. doi: 10.1002/lno.11351
Dippner J. W., Kröncke I. (2015). Ecological forecasting in the presence of abrupt regime shifts. J. Mar. Sys. 150, 34–40. doi: 10.1016/j.jmarsys.2015.05.009
Dolch T., Buschbaum C., Reise K. (2013). Persisting intertidal seagrass beds in the northern wadden Sea since the 1930s. J. Sea Res. 82, 134–141. doi: 10.1016/j.seares.2012.04.007
Dornelas M., Gotelli N. J., McGill B., Shimadzu H., Moyes F., Sievers C., et al. (2014). Assemblage time series reveal biodiversity change but not systematic loss. Science 344, 296–299. doi: 10.1126/science.1248484
Drent J., Bijkerk R., Herlyn M., Grotjahn M., Voß J., Carauso M.-C., et al. (2017). “Wadden Sea quality status report 2017,” in Maobecrozonthos (Wilhelmshaven, Germany: Common Wadden Sea Secretariat).
Ehrich S., Adlerstein S., Brockmann U., Floeter J., Garthe S., Hinz H., et al. (2007). 20 years of the German small-scale bottom trawl survey (GSBTS): A review. Senckenbmarit 37, 13–82. doi: 10.1007/BF03043206
Emeis K.-C., van Beusekom J., Callies U., Ebinghaus R., Kannen A., Kraus G., et al. (2015). The north Sea - a shelf sea in the anthropocene. J. Mar. Sys. 141, 18–33. doi: 10.1016/j.jmarsys.2014.03.012
Flemming B. W., Bartholomä A. (1997). Response of the wadden Sea to a rising sea level: a predictive empirical model. Ger. J. Hydrogr. 49, 343–353. doi: 10.1007/BF02764043
Folmer E., Büttger H., Herlyn M., Markert A., Millat G., Troost K., et al. (2017). “Wadden Sea quality status report 2017,” in Beds of blue mussels and pacific oysters (Wilhelmshaven, Germany: Common Wadden Sea Secretariat).
Glibert P. M., Mitra A. (2022). From webs, loops, shunts, and pumps to microbial multitasking: Evolving concepts of marine microbial ecology, the mixoplankton paradigm, and implications for a future ocean. Limnol. Oceanogr. 67, 585–597. doi: 10.1002/lno.12018
Gravel D., Albouy C., Thuiller W. (2016). The meaning of functional trait composition of food webs for ecosystem functioning. Phil. Trans. R. Soc B 371, 20150268. doi: 10.1098/rstb.2015.0268
Herman P. M. J., Middelburg J. J., Van de Koppel J., Heip C. H. R. (1999). Ecology of estuarine macrobenthos. Adv. Ecol. Res. 29, 195–240. doi: 10.1016/S0065-2504(08)60194-4
Hubert K., Wurpts A., Berkenbrink C. (2021). Interaction of Estuarine Morphology and adjacent Coastal Water Tidal Dynamics (ALADYN-C). In: Die Küste 89, Kuratorium für Forschung im Küsteningenieurwesen, Hamburg. doi: 10.18171/1.089108
Kerimoglu O., Voynova Y. G., Chegini F., Brix H., Callies U., Hofmeister R., et al. (2020). Interactive impacts of meteorological and hydrological conditions on the physical and biogeochemical structure of a coastal system. Biogeosciences 17, 5097–5127. doi: 10.5194/bg-17-5097-2020
Kristensen E., Delefosse M., Quintana C. O., Flindt M. R., Valdemarsen T. (2014). Influence of benthic macrofauna community shifts on ecosystem functioning in shallow estuaries. Front. Mar. Sci. 1, 41. doi: 10.3389/fmars.2014.00041
Kröncke I., Neumann H., Dippner W. P., Holbrook S., Lamy T., Miller R., et al. (2019). Comparison of biological and ecological long-term trends related to northern hemisphere climate in different marine ecosystems. Nat. Conserv. 34, 311–341. doi: 10.3897/natureconservation.34.30209
Kröncke I., Reiss H., Dippner J. W. (2013). Effects of cold winters and regime shifts on macrofauna communities in shallow coastal regions. Estuar. Coast. Shelf Sci. 119, 79–90. doi: 10.1016/j.ecss.2012.12.024
Kröncke I., Reiss H., Eggleton J. D., Aldridge J., Bergman M. J. N., Cochrane S., et al. (2011). Changes in north Sea macrofauna communities and species distribution between 1986 and 2000. Estuar. Coast. Shelf Sci. 94, 1–15. doi: 10.1016/j.ecss.2011.04.008
Kröncke I., Stoeck T., Wieking G., Palojaervi A. (2004). Relationship between structure and function of microbial and macrofaunal communities in different areas of the north Sea. Mar. Ecol. Prog. Ser. 282, 13–31. doi: 10.3354/meps282013
Lackschewitsch D., Reise K., Buschbaum C., Karez R. (2014). Neobiota in deutschen küstengewässern -eingeschleppte und kryptogene tier- und pflanzenarten an der deutschen nord- und ostseeküste. bundesamt für landwirtschaft. Umwelt und ländliche Räume Des. Landes Schleswig-Holstein (LLUR), LLUR SH – Gewässer; D 25, 216.
Lotze H. K. (2005). Radical changes in wadden Sea fauna and flora over the last 2.000 years. Helgol Mar. Res. 59, 71–83. doi: 10.1007/s10152-004-0208-0
Marine Daten Infrastruktur Niedersachsen (2021) MDI-NI. Available at: http://www.mdi.niedersachsen.de (Accessed 2021-02-03).
Markert A., Wehrmann A., Kröncke I. (2010). Recently established: Crassostrea-reefs versus native mytilus-beds: differences in ecosystem engineering affects the macrofaunal communities (Wadden Sea of lower Saxony, southern German bight). Biol. Invasions 12, 15–32. doi: 10.1007/s10530-009-9425-4
MarLIN - (2021) The marine life information networ. Available at: www.marlin.ac.uk/species (Accessed 2021-04-12).
Meyer C. (2004). Sedimentverteilung für morphodynamische prozesse - berichte der forschungsstelle küste norderney. Forschungsstelle Küste Norderney 42, 53–78.
Meyer J., Kröncke I., Bartholomä A., Heckroth M., Scheiffarth G. (2021). Small-scale and long-term variability in population dynamics of the cockle cerastoderma edule in a southern north Sea tidal flat system. Front. Mar. Scie. 8, 698467. doi: 10.3389/fmars.2021.698467
Meyer J., Nehmer P., Moll A., Kröncke I. (2018). Shifting south-eastern north Sea macrofauna community structure since 1986: A response to de-eutrophication and regionally decreasing food supply? Est. Coas. Shel. Sc. 213, 115–127. doi: 10.1016/j.ecss.2018.08.010
Meyer C., Ragutzki G. (1999). Sedimentverteilung als Indikator für morphodynamische Prozesse. Niedersächsisches Landesamt für Ökologie, Forschungsstelle Küste (Hg.). 81 pp.
Oksanen J., Blanchet F. G., Friendly M., Kindt R., Legendre R., Minchin P. R., et al. (2020). Package Vegan: Community Ecology. Available at: https://cran.r-project.org/web/packages/vegan/index.html
Philippart C. J. M., Beukema J. J., Cadée G. C., Dekker R., Goedhart P. W., Van Iperen J., et al. (2007). Impacts of nutrient reduction on coastal communities. Ecosystems 10, 95–118.
Pilotto F., Kühn I., Adrian R., Alber R., Alignier A., Andrews C., et al. (2020). Meta-analysis of multidecadal biodiversity trends in Europe. Nat. Comm 11, 3486. doi: 10.1038/s41467-020-17171-y
Reise K., Baptist M., Burbridge P., Dankers N., Fischer L., Flemming B., et al. (2010). The wadden Sea - a universally outstanding tidal wetland. Wadden Sea Ecosystem No. 29 Common Wadden Sea Secreatariat Wilhelmshaven pp. 7–24.
Reiss H., Cunze S., Kröncke I., König K., Neumann H. (2011). Species distribution modelling of marine benthos: A north Sea case study. Mar. Ecol. Prog. Ser. 442, 71–86. doi: 10.3354/meps09391
Rockström J., Steffen W., Noone K., Persson A., Stuart Chapin I. I. I. F., Lambin E. F., et al. (2009). A safe operating space for humanity. Nature 461, 472–475. doi: 10.1038/461472a
Schückel U., Beck M., Kröncke I. (2013). Spatial variability in structural and functional aspects of macrofauna communities and their environmental parameters in the jade bay (Wadden Sea lower Saxony, southern north Sea). Helgol Mar. Res. 67, 121–136. doi: 10.1007/s10152-012-0309-0
Schückel U., Beck M., Kröncke I. (2015). Macrofauna communities of tidal channels in jade bay (German wadden sea): Spatial patterns, relationships with environmental characteristics, and comparative aspects. Mar. Biodivers 45, 841–855. doi: 10.1007/s12526-014-0308-2
Schückel U., Kröncke I. (2013). Temporal changes in intertidal macrofauna communities over eight decades: a result of eutrophication and climate change. Estuar. Coast. Shelf Sci. 117, 210–218. doi: 10.1016/j.ecss.2012.11.008
Schultze M., Nehls G. (2017). “Wadden Sea quality status report 2017,” in “Extraction and dredging,”. Ed. Kloepper S. (Wilhelmshaven, Germany: Wilhelmshaven: CWSS) Common Wadden Sea Secretariat).
Schumacher J., Dolch T., Reise K. (2014). Transitions in sandflats biota since the 1930s: effects of sea-level rise, eutrophication and biological globalization in the tidal bay königshafen, northern wadden Sea. Helgol Mar. Res. 68, 289–298. doi: 10.1007/s10152-014-0389-0
SeaLifeBase (2021). Available at: http://sealifebase.ca (Accessed 2021-04-12).
Sell A., Kröncke I. (2013). Correlations between benthic habitats and demersal fish assemblages - a case study on the dogger bank (North Sea). J. Sea Res. 80, 12–24. doi: 10.1016/j.seares.2013.01.007
Shchepethik A. F., McWilliams J. C. (2005). The regional oceanic modeling system (ROMS): a split-explicit, free-surface, topography-following-coordinate oceanic model. Ocean Modell 9, 347–404. doi: 10.1016/j.ocemod.2004.08.002
UNESCO (2009). UNESCO REPORT OF DECISIONS: Extract of the Report Agenda Item 8BNominations to the World Heritage List Decision 33 COM 8B.4. Dt. hydrogr. Z. 44, 293–309.
Van Bernem K.-H. (2009). Thematische kartierung und sensitivitätsraster im deutschen wattenmeer. Dt. hydrogr. Z. 44, 293–309.
Van Bernem K.-H. (1992). Thematische kartierung und sensitivitätsraster im deutschen wattenmeer. (Seville, Spain: UNESCO).
Van Bernem K.-H., Grotjahn M., Knüpling J., Krasemann H. L. (1994). Thematische kartierung und sensitivitätsraster im deutschen wattenmeer juni 1987-juni 1993. UBA-Forschungsbericht, 94–077.
Van Beusekom J. E. E., Bot P., Carstensen J., Grage A., Kolbe K., Lenhart H.-J., et al. (2017). “Wadden Sea quality status report 2017,” in Eutrophication (Wilhelmshaven, Germany: Common Wadden Sea Secretariat).
Van Beusekom J. E. E., Carstensen J., Dolch T., Grage A., Hofmeister R., Lenhart H., et al. (2019). Wadden Sea eutrophication: Long-term trends and regional differences. Front. Mar. Sci. 6, 370. doi: 10.3389/fmars.2019.00370
Van den Kam J., Ens B., Piersma T., Zwarts L. (2004). Shorebirds. illustrated Behav. ecology. Condor 107, 188–189.
Van der Wal D., Wielemaker-van den Dool A., Herman P. M. J. (2010). Spatial synchrony in intertidal benthic algae biomass in temperate coastal and estuarine ecosystems. Ecosystems 13, 338–351. doi: 10.1007/s10021-010-9322-9
Van Katwijk M. M., Bos A. R., Hermus D. C. R., Suykerbuyk W. (2010). Sediment modification by seagrass beds: muddification and sandification induced by plant cover and environmental conditions. Estuar. Coast. Shelf Sci. 89, 175–181. doi: 10.1016/j.ecss.2010.06.008
Volkenborn N. (2005). Ecosystem engineering in intertidal sand by the lugworm arenicola marina. Dissertation Univ. Bremen pp, 137.
Warner J. C., Armstrong B., He R., Zambon J. B. (2010). Development of a coupled ocean–atmosphere–wave–sediment transport (COAWST) modeling system. Ocean Modelling 35, 230–244
Wehrmann A., Herlyn M., Bungenstock F., Hertweck G., Millat G.. (2000). The distribution gap is closed - first record of naturally settled pacific oysters crassostrea gigas in the East Frisian wadden Sea, north Sea. Senckenb Marit 30, 153–160. doi: 10.1007/BF03042964
Keywords: abundance decrease, biomass decrease, infauna, tidal accretion, tidal erosion, Wadden Sea World Heritage Site
Citation: Singer A, Bijleveld AI, Hahner F, Holthuijsen SJ, Hubert K, Kerimoglu O, Kleine Schaars L, Kröncke I, Lettmann KA, Rittweg T, Scheiffarth G, van der Veer HW and Wurpts A (2023) Long-term response of coastal macrofauna communities to de-eutrophication and sea level rise mediated habitat changes (1980s versus 2018). Front. Mar. Sci. 9:963325. doi: 10.3389/fmars.2022.963325
Received: 07 June 2022; Accepted: 21 December 2022;
Published: 07 February 2023.
Edited by:
Leonardo Cruz Da Rosa, Federal University of Sergipe, BrazilReviewed by:
Chhaya Chaudhary, Alfred Wegener Institute Helmholtz Centre for Polar and Marine Research (AWI), GermanyMary Anne Mandario, Southeast Asian Fisheries Development Center, Philippines
Copyright © 2023 Singer, Bijleveld, Hahner, Holthuijsen, Hubert, Kerimoglu, Kleine Schaars, Kröncke, Lettmann, Rittweg, Scheiffarth, van der Veer and Wurpts. This is an open-access article distributed under the terms of the Creative Commons Attribution License (CC BY). The use, distribution or reproduction in other forums is permitted, provided the original author(s) and the copyright owner(s) are credited and that the original publication in this journal is cited, in accordance with accepted academic practice. No use, distribution or reproduction is permitted which does not comply with these terms.
*Correspondence: Anja Singer, YW5qYS5zaW5nZXJAc2VuY2tlbmJlcmcuZGU=
†ORCID: Allert I. Bijleveld, orcid.org/0000-0002-3159-8944
Andreas Wurpts, orcid.org/0000-0001-8404-9837
Krischan Hubert, orcid.org/0000-0002-9493-2620