- 1The Key Laboratory of Mariculture, Ocean University of China, Ministry of Education, Qingdao, Shandong, China
- 2Fishery College, Zhejiang Ocean University, Zhoushan, China
Trichiuridae fish are economically important species and are widely distributed across the nearshore to the open ocean. In the present study, the genomic survey sequencing method was used to analyze the genomic characteristics of five Trichiuridae fish. The calculated genome size was 913 Mb, 868 Mb, 871 Mb, 747 Mb, and 670 Mb for Trichiurus japonicus, Trichiurus nanhaiensis, Trichiurus brevis, Lepturacanthus savala, and Eupleurogrammus muticus, respectively. The average GC content of the five Trichiuridae fish ranged from 39.59% to 42.05%, and the repeat sequence content ranged from 33.21% to 45.87%. The heterozygous ratio of E. muticus was the highest, and that of L. savala was the smallest. The proportion of microsatellite motifs showed a decreasing trend with the increase in repeat numbers: the dinucleotide repeats were dominant, followed by the trinucleotide repeats, tetranucleotide repeats, pentanucleotide repeats, and hexanucleotide repeats. The mitochondrial genomes of five Trichiuridae species were excavated from the genome data, and the ML tree revealed that T. japonicus, T. nanhaiensis, T. brevis, L. savala, and E. muticus formed into one clade. E. muticus showed earlier expansion than the other four species and had a significant population decline at the Last Glacial period by pairwise sequentially Markovian coalescent (PSMC) analysis. This is the first report to sequence and characterize the whole genomes of five Trichiuridae species.
Introduction
Trichiuridae belongs to Perciformes, Scombroide, which is a group composed of more than 40 species (Hsu et al., 2009; Nelson et al., 2016). Trichiuridae fish are economically important species and are widely distributed across the nearshore to the open ocean (Fischer et al., 1995). It was reported that there are six species distributed in the coastal waters of China, namely, Trichiurus japonicus, Trichiurus nanhaiensis, Trichiurus brevis, Lepturacanthus savala, Eupleurogrammus muticus, and Tentoriceps cristatus (Yi et al, 2022). T. nanhaiensis and T. brevis are mainly distributed in the South China Sea and the other four species have a wider distribution range in China. There are also six other species distributed in the open sea of China with a depth of more than 100 m (Yi et al, 2022). Trichiuridae fish could be divided into two groups, scabbardfishes and hairtails, which have significant differences in tail shape (Yi et al, 2022). Most scabbardfishes inhabit offshore waters with more than 250 m of water depth (Fischer et al., 1995).
With the development of high-throughput technology, some whole genomes of fishes have been published (Xu et al., 2014; Chen et al., 2019; Kon et al., 2021), which provided abundant information for their further genetic study. The genome survey analysis, a priori knowledge of the whole genome, could predict the genome size, the heterozygous ratio, and repeat ratio, which can help us better know the basic information of the whole genome (Huang et al., 2022). In addition, it can also help us identify the genome-wide short sequence repeat (SSR) motifs, separate the mitochondrial genomes, or conduct the demographic history analysis (Xu et al., 2020; Huang et al., 2022). Due to its convenience and low cost, a large number of genome survey was conducted recently (Chen et al., 2019; Schroeter et al., 2020). SSRs are widely distributed in eukaryotic genomes and show polymorphism at both individual and population levels, which can be widely used in constructing linkage maps, and performing population genetic studies and pedigree identification (Xiong et al., 2021). The genomic SSRs have higher polymorphism and better coverage than transcriptome data, and then could be widely used for SSR development (Baeza et al., 2021). Compared with traditional development methods, high-throughput sequencing is more cost-effective, time-saving, and powerful, and then genome data obtained by high-throughput sequencing have become an important resource for SSR development (Jo et al., 2021).
The rich single-nucleotide polymorphisms (SNPs) obtained by next-generation sequencing can be widely used in the phylogenetic reconstruction of objective species (Xu et al., 2019). Moreover, the separated mitochondrial DNA sequence from the genome survey data may be more commonly used in the phylogenetic analysis due to rich sequences, which could be downloaded from databases. The genome survey can also be beneficial for evolutionary biology by analyzing the historical changes in the effective population size (Jia et al., 2020).
The external morphological characters of Trichiuridae fish are similar and some existing taxonomic keys disputes, so it is difficult to identify some species (Tzeng and Chiu, 2012). Until the 1990s, taxonomists believed that there was only one hairtail species in China. Trichiuridae fish are an important resource, but the overall catch was often reported without species distinction. For example, L. savala and E. muticus were often misidentified as T. japanicus in the statistical data. Recently, different molecular markers have been used to study the systematic classification and genetic relationship of Trichiuridae fish, which greatly correct the traditional classification and provide us with a clearer genetic relationship map (Karaiskou et al., 2003; Chakraborty et al., 2006; Hsu et al., 2007; Tzeng et al., 2007; Zheng et al., 2015). However, until now, no genomic information of Trichiuridae fish was available, and the phylogenetic relationship of Trichiuridae fish needs to be reevaluated by more powerful methods. Then, it is necessary to supplement genetic information for their further study. In the present study, the genome survey analysis of five Trichiuridae fishes was firstly conducted, and we aim to evaluate their genome size and characteristics, preparing for further whole genome sequencing. Based on the genome data, microsatellite motifs and mitochondrial genome were also identified, which can profit further population genetic studies.
Materials and methods
Sample collection and DNA extraction
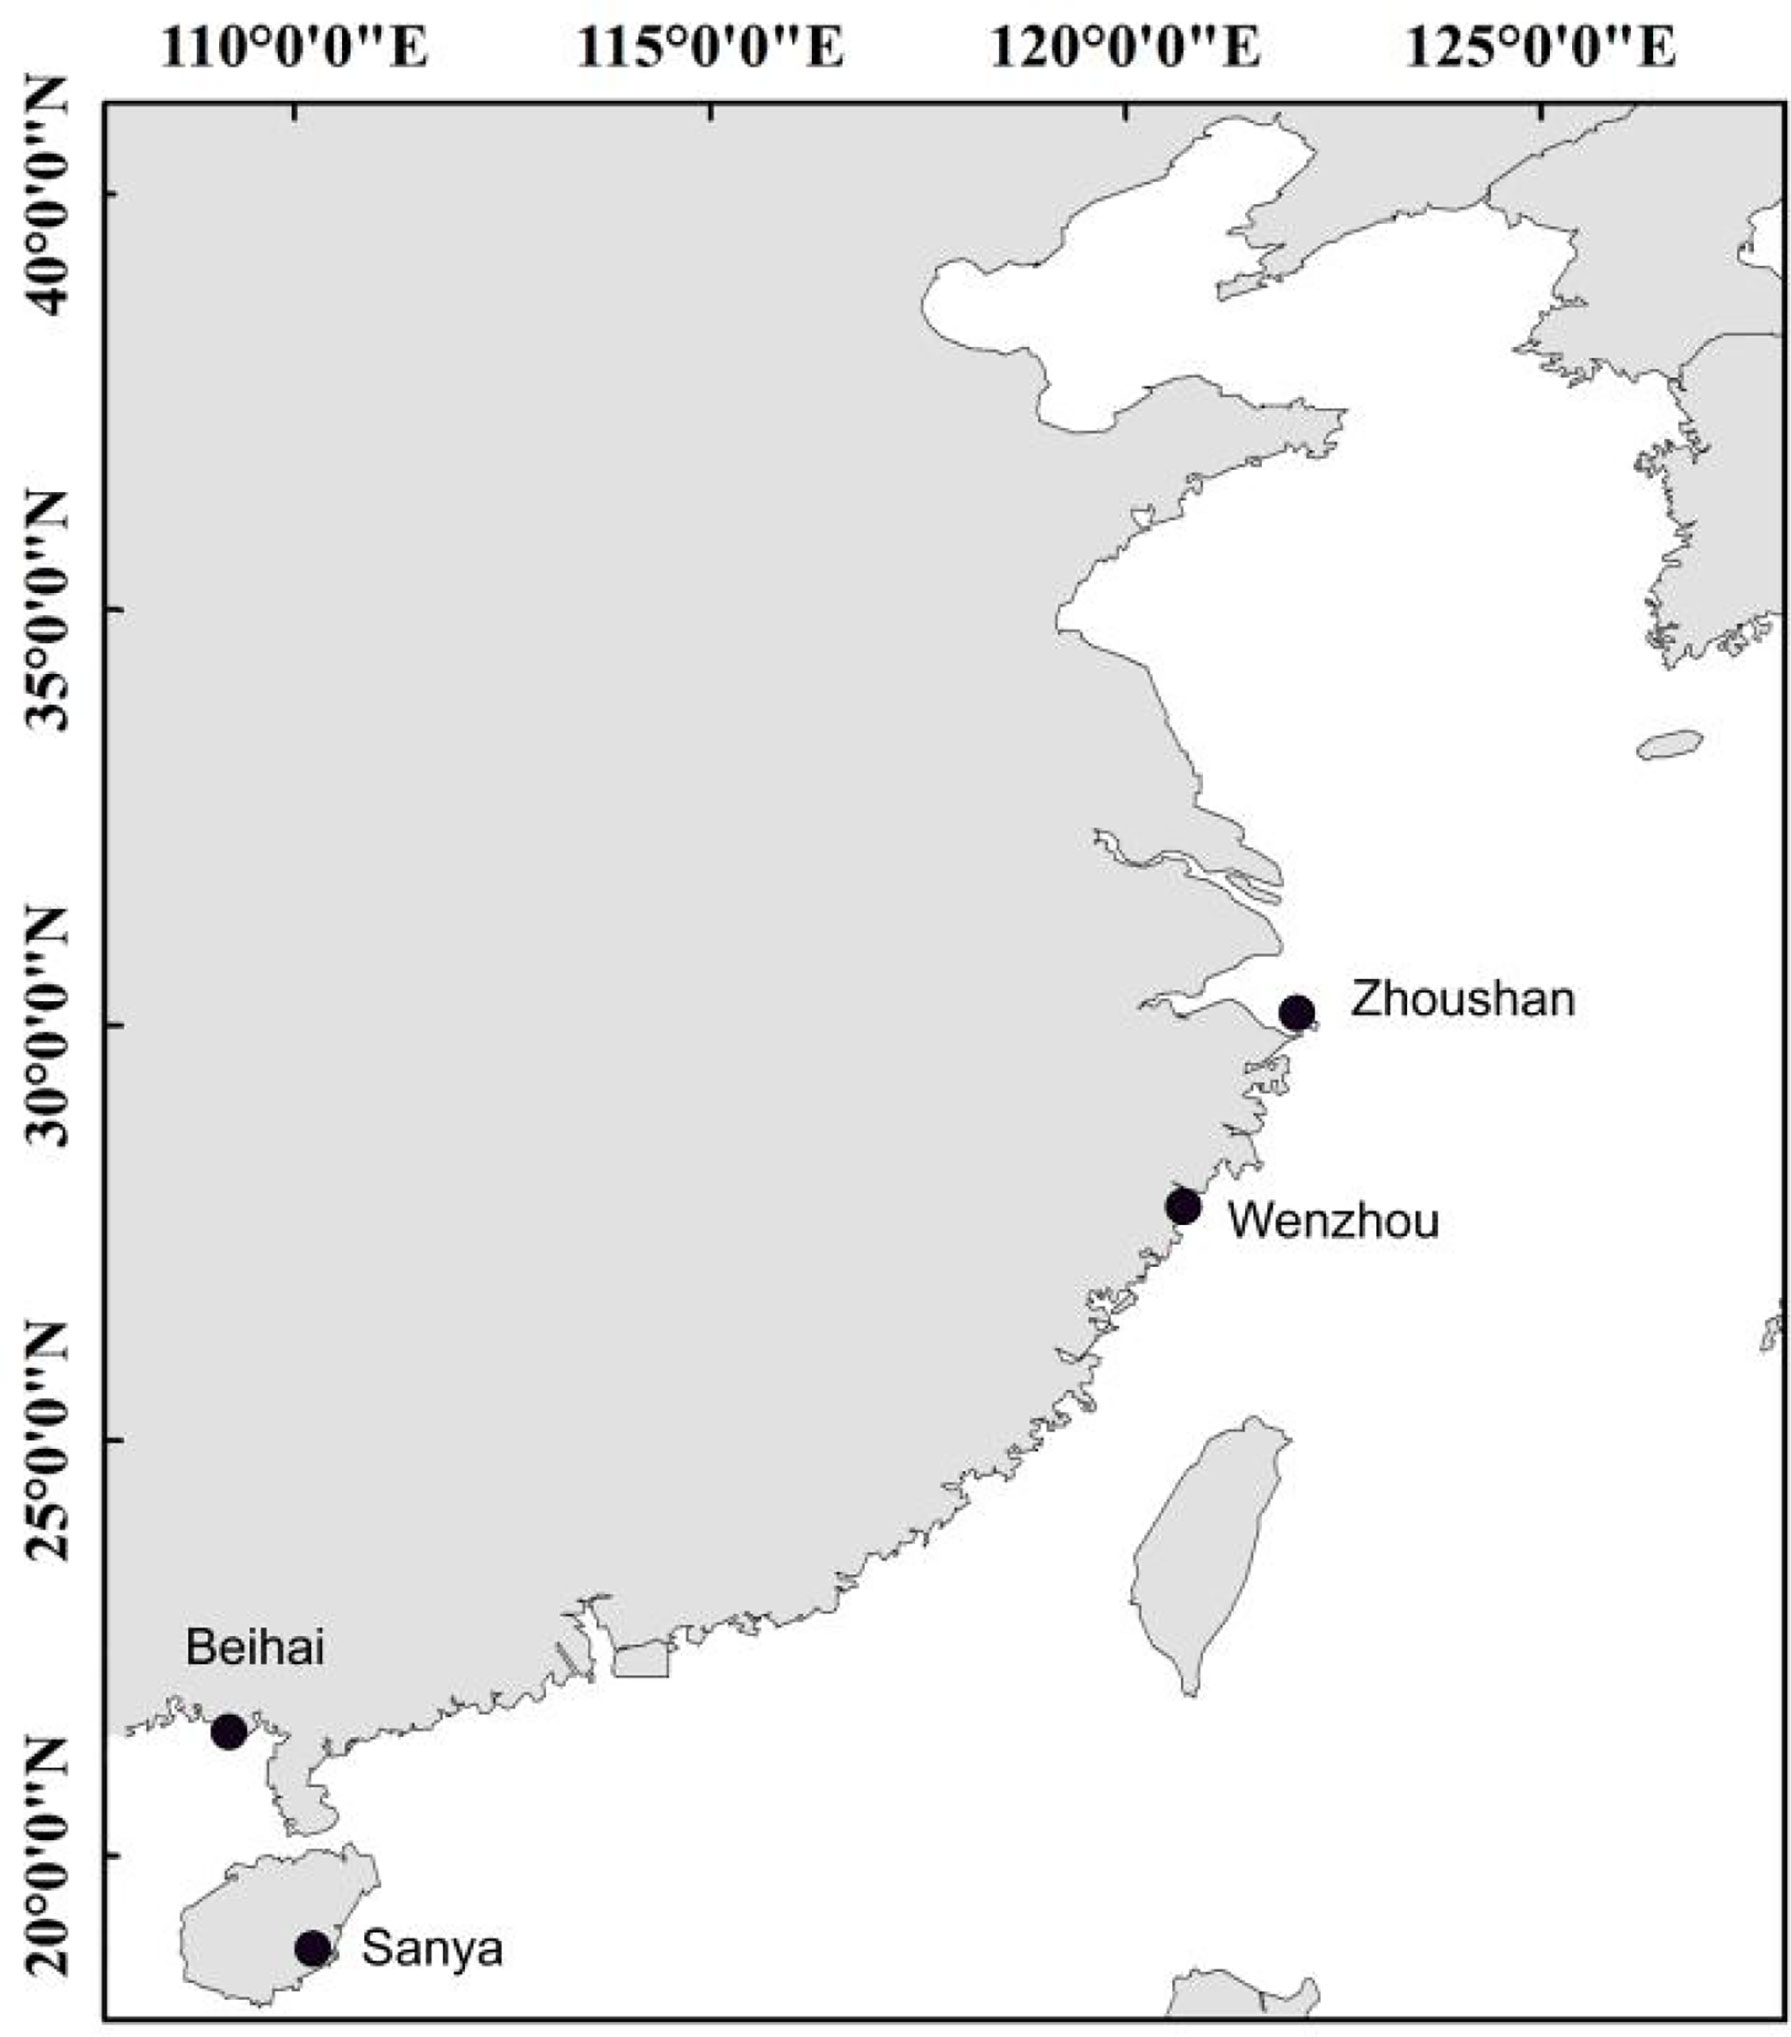
The specimens used in this study were collected from the coastal waters across the East China Sea and South China Sea (Table 1; Figure 1). The individuals were identified based on their morphological characteristics and the muscle tissue was stored in 95% alcohol for DNA extraction. The standard phenol/chloroform method was used for DNA extraction and RNase A was used to purify the DNA template. Fish muscle tissue was first ground in liquid nitrogen, followed by addition of SDS buffer and proteinase K to lyse cells and remove impurities. DNA extraction solution (phenol:chloroform:isoamyl alcohol = 25:24:1) was used for DNA extraction, isopropanol was used to recover the DNA pellet, and finally the DNA was washed with cold 70% ethanol. After the residual ethanol evaporates, add sterile water to dissolve the DNA.
Library construction and sequencing
The library construction and sequencing were performed in the Gooalgene Technology Company in Wuhan, and the sequence reads reported in this study have been deposited in GenBank with No. PRJNA825079.
Sequencing data quality control and K-mer analysis
The software FASTP was used to conduct the quality control of raw sequencing data, and clean data were obtained (Chen et al., 2018). The quality values Q20 (ratio of bases with sequencing quality value above 20), Q30 (proportion of bases with sequencing quality values above 30), and GC distribution statistics were calculated to evaluate the sequencing quality. A total of 10,000 pairs of clean reads were randomly selected and blasted with the NCBI nucleotide database (NT Library) to confirm that the sequencing reads were not polluted. The software JELLYFISH was used to perform the K-mer analysis, and the genome size was calculated based on the K-mer frequency distributions (Marçais and Kingsford, 2011). The heterozygous ratio and repeat sequence content were obtained by GCE software (Liu et al., 2013).
Identification of SSR motifs
We used SOAPdenovo2 to assemble the clean reads separately into unique contigs and scaffolds (Luo et al., 2012). The potential microsatellite motifs were searched using the Perl script “misa.pl” of MISA software (Beier et al., 2017). The search parameters were set for the detection of di-, tri-, tetra-, penta-, and hexanucleotide microsatellite motifs with a minimum of six, five, five, five, and five repeats, respectively.
Mitochondrial genome assembly and single copy gene extraction
The filtered clean reads were also used to assemble the complete mitochondrial genomes by MitoFinder software (Allio et al., 2020). To construct the phylogenetic relationship among Trichiuridae species, the mitochondrial genomes of Aphanopus carbo (16406, AP012944), Assurger anzac (16510 AP012508), Benthodesmus tenuis (16864, AP012522), and Evoxymetopon poeyi (16475 AP012509) were downloaded from NCBI. Since the ND6 gene was very ineffective in restoring the expected phylogenetic performance (Miya and Nishida, 2000), we removed it and used IQ-TREE software (Minh et al., 2020) to construct ML phylogenetic trees based on the other 12 protein-coding genes. The OrthoFinder and Busco5 software were used to search for single-copy homologous genes and reconstruct phylogenetic trees (Simão et al., 2015; Emms and Kelly, 2019).
Population size dynamics
The pairwise sequentially Markovian coalescent method (PSMC) was used to infer the population size history of five Trichiuridae species (Li and Durbin, 2011). The “fq2psmcfa” and “splitfa” tools in the PSMC software were used to create the input file for the PSMC modeling. The PSMC analysis command included the options “-N25” for the number of cycles of the algorithm, “-t15” as the upper limit for the most recent common ancestor (TMRCA), “-r5” for the initial θ/ρ, and “-p 4 + 25*2 + 4 + 6” for atomic intervals. The reconstructed population history was plotted using the “psmc_plot.pl” script with the substitution rate “-u 2.5e-8” and a generation time of 2 years.
Results
Sequence quality estimation of five Trichiuridae genomes
A 300- to 350-bp insert library was constructed for Illumina nova sequencing of the five species, and a total of 53.44 Gb, 45.75 Gb, 52.34 Gb, 49.94 Gb, and 48.60 Gb of clean reads were obtained for T. japonicus, T. nanhaiensis, T. brevis, L. savala, and E. uticus after the quality control, respectively. All the Q20 values were over 97% and all the Q30 values were over 92%, which ensured the accuracy of sequencing in this study (Table 2). From the results of NT library comparison of sequencing data, the top species blasting against the NT Database were related fish species, which proved no obvious exogenous contamination during the library construction (data not shown).
Genome size and sequence characteristic
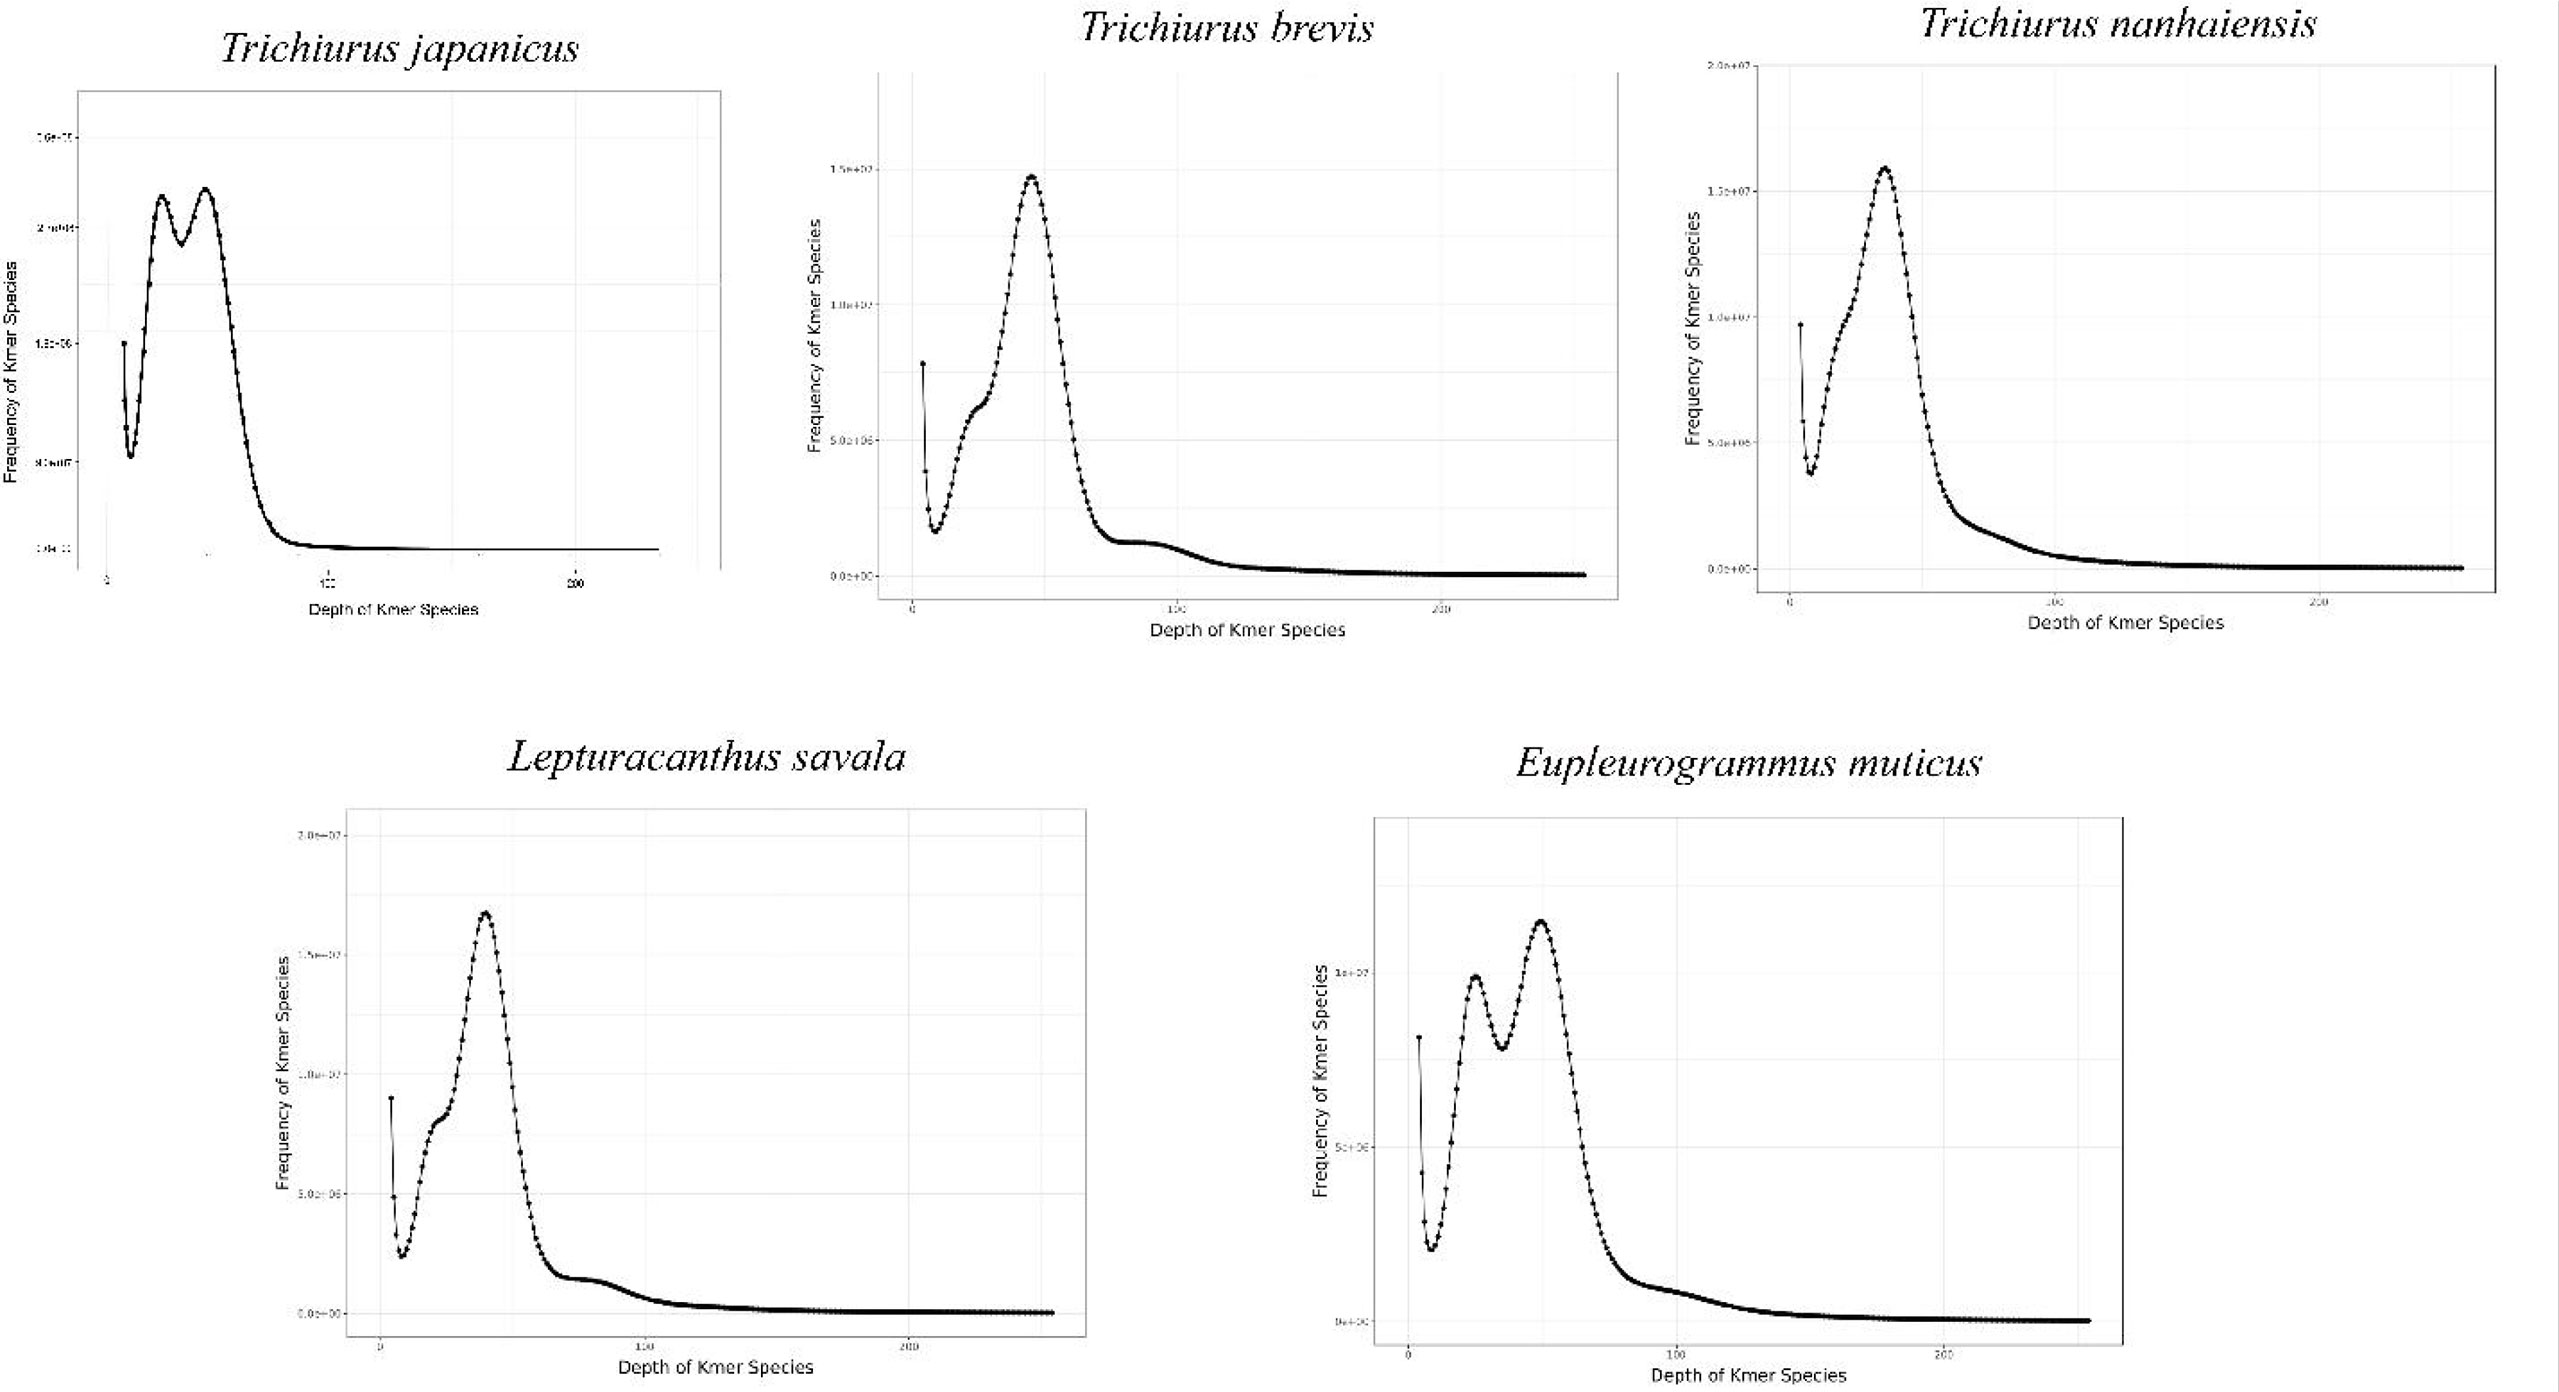
The expected K-mer depth was estimated to be 49, 36, 40, 45, and 49 for the five species, and we can speculate the genome size of these five Trichiuridae species according to the K-mer depth and number (Figure 2, Table 3). The calculated genome size of E. muticus was the smallest (680 Mb), and the size of T. japonicus was the largest (928 Mb) (Table 3). The repeat sequence content of T.japonicus was the smallest (33.21%) and T. brevis was the highest (45.87%). The high heterozygous ratio of E. muticus was the highest (1.26), and L.savala was the smallest (0.72) (Table 3).
The draft genome assembly was performed using the filtered clean data. The assembled information of five Trichiuridae species are shown in Table 4. By comparison, T. japonicus had the largest total length and total number, while both the N50 length and N90 length at the contig and scaffold level were the smallest for T. japonicus. The average GC content of the five Trichiuridae fish ranged from 39.59% to 42.05% (Table 2).
Profile of candidate microsatellite markers
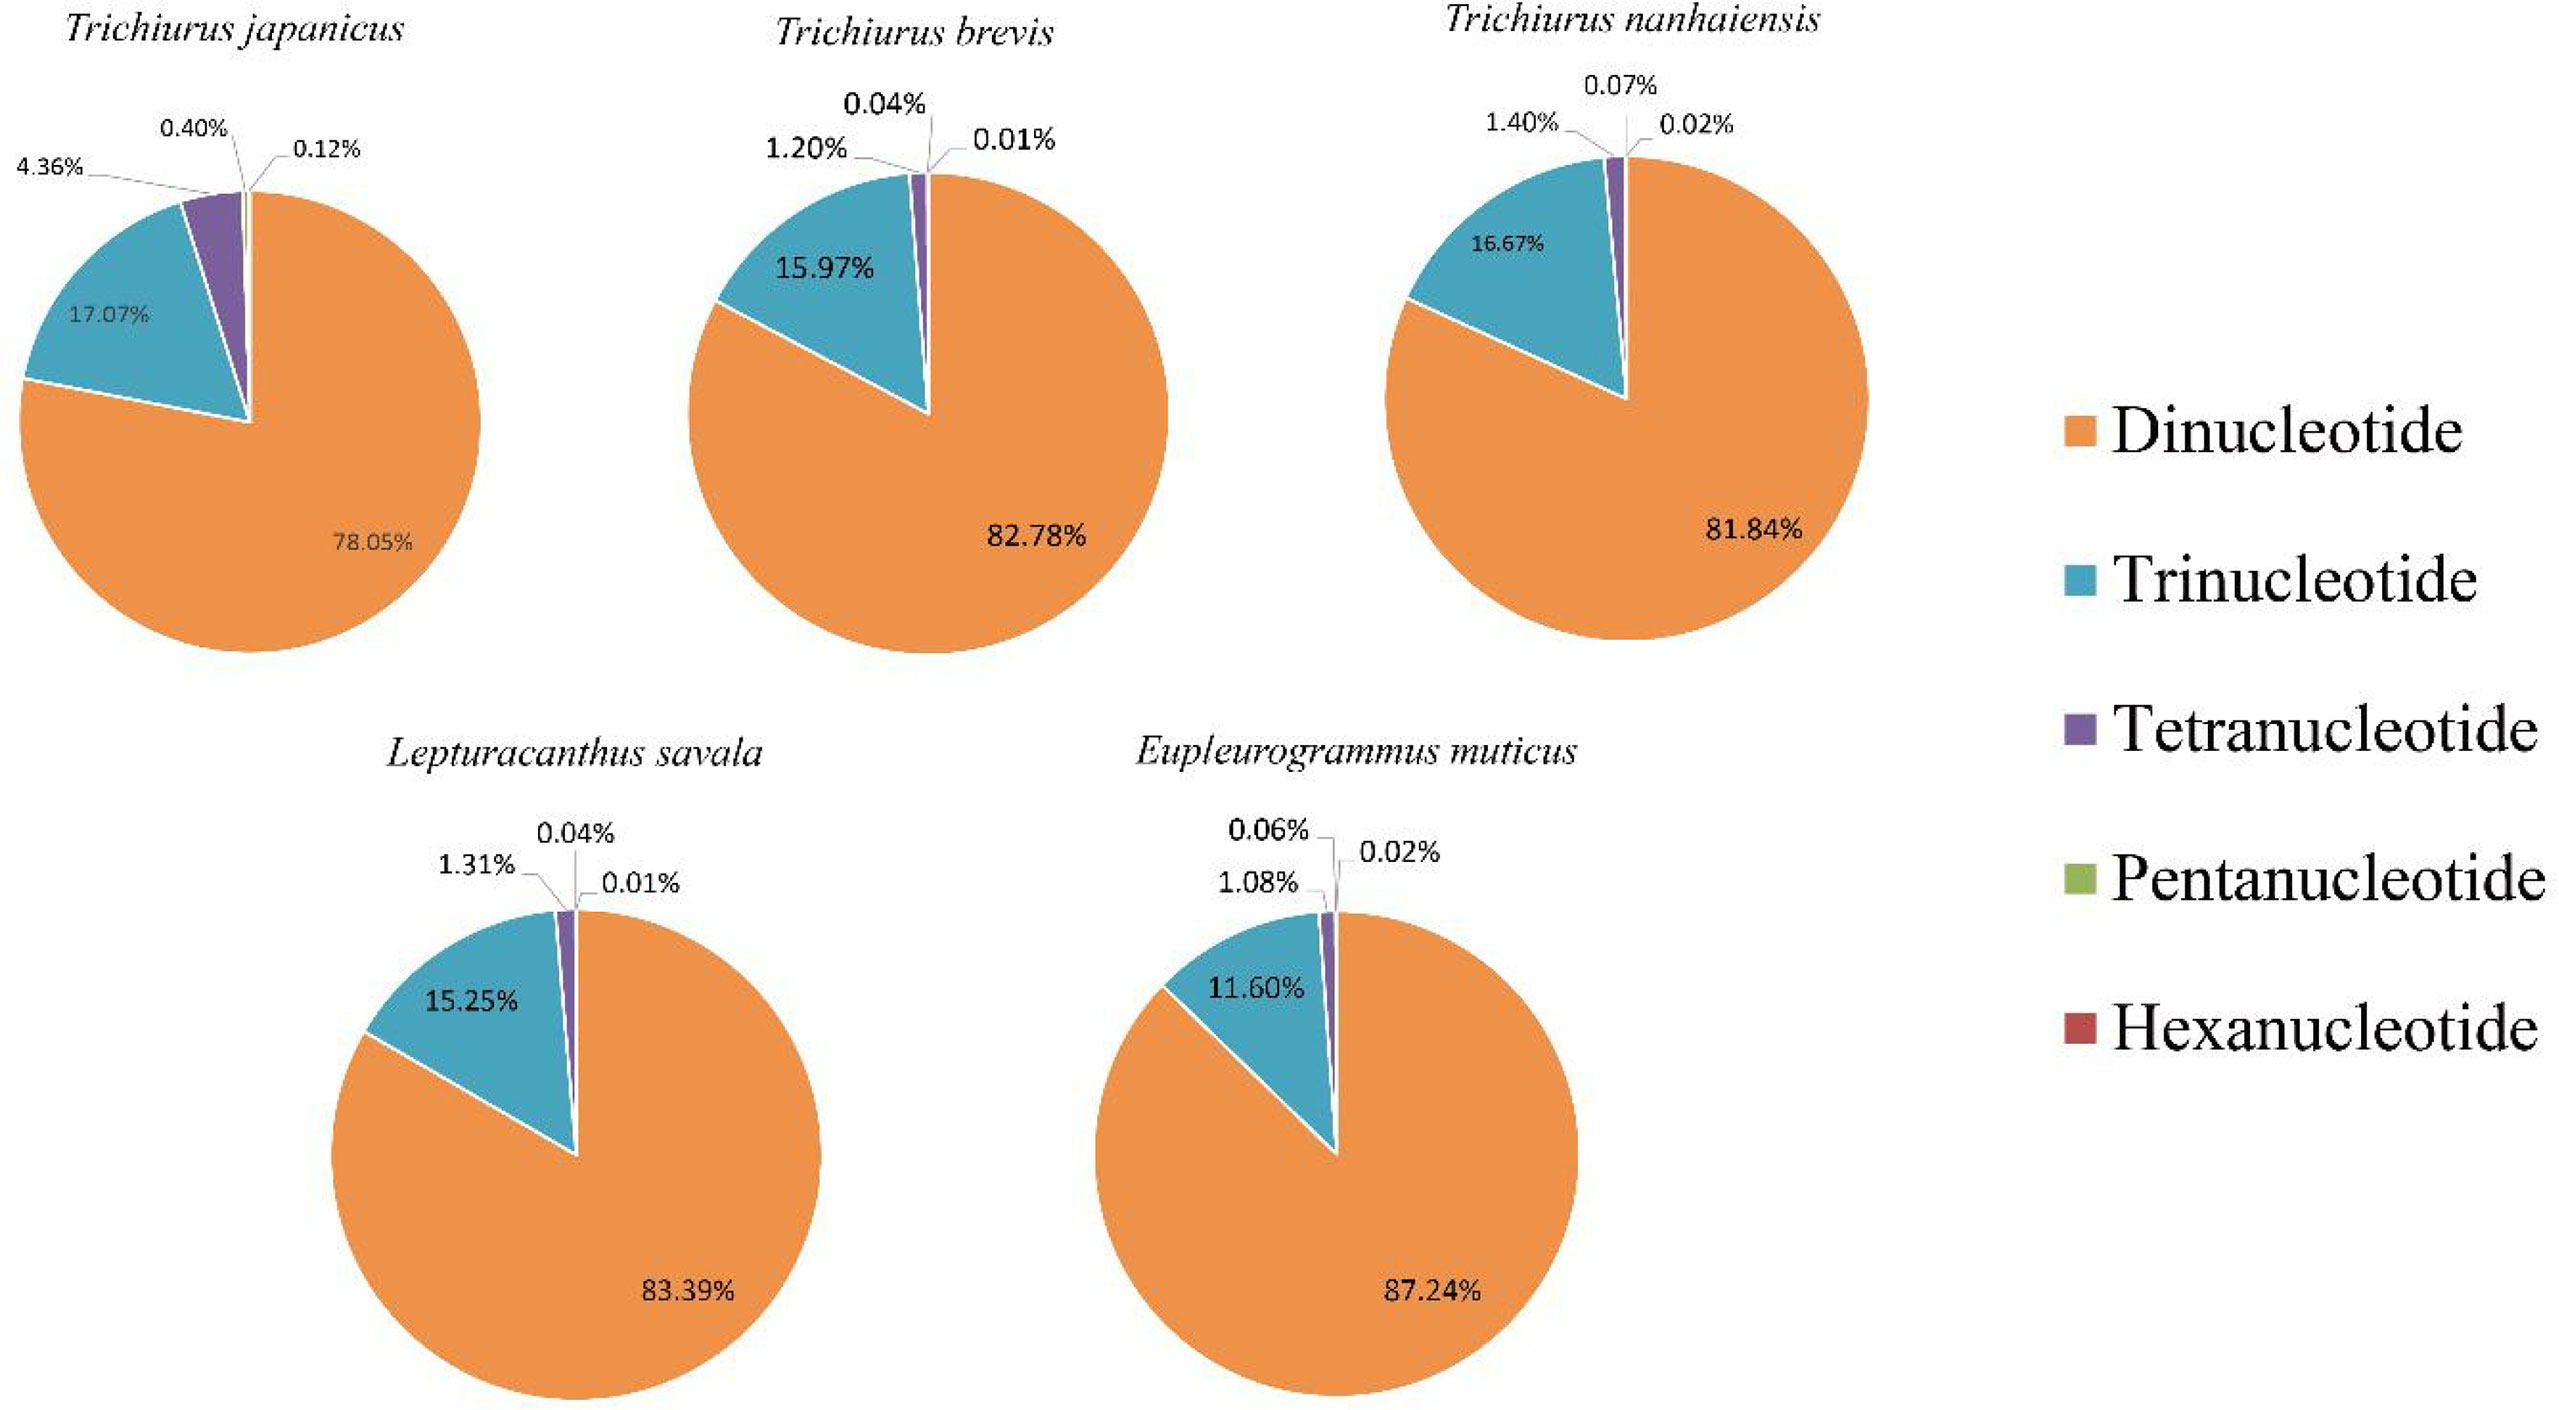
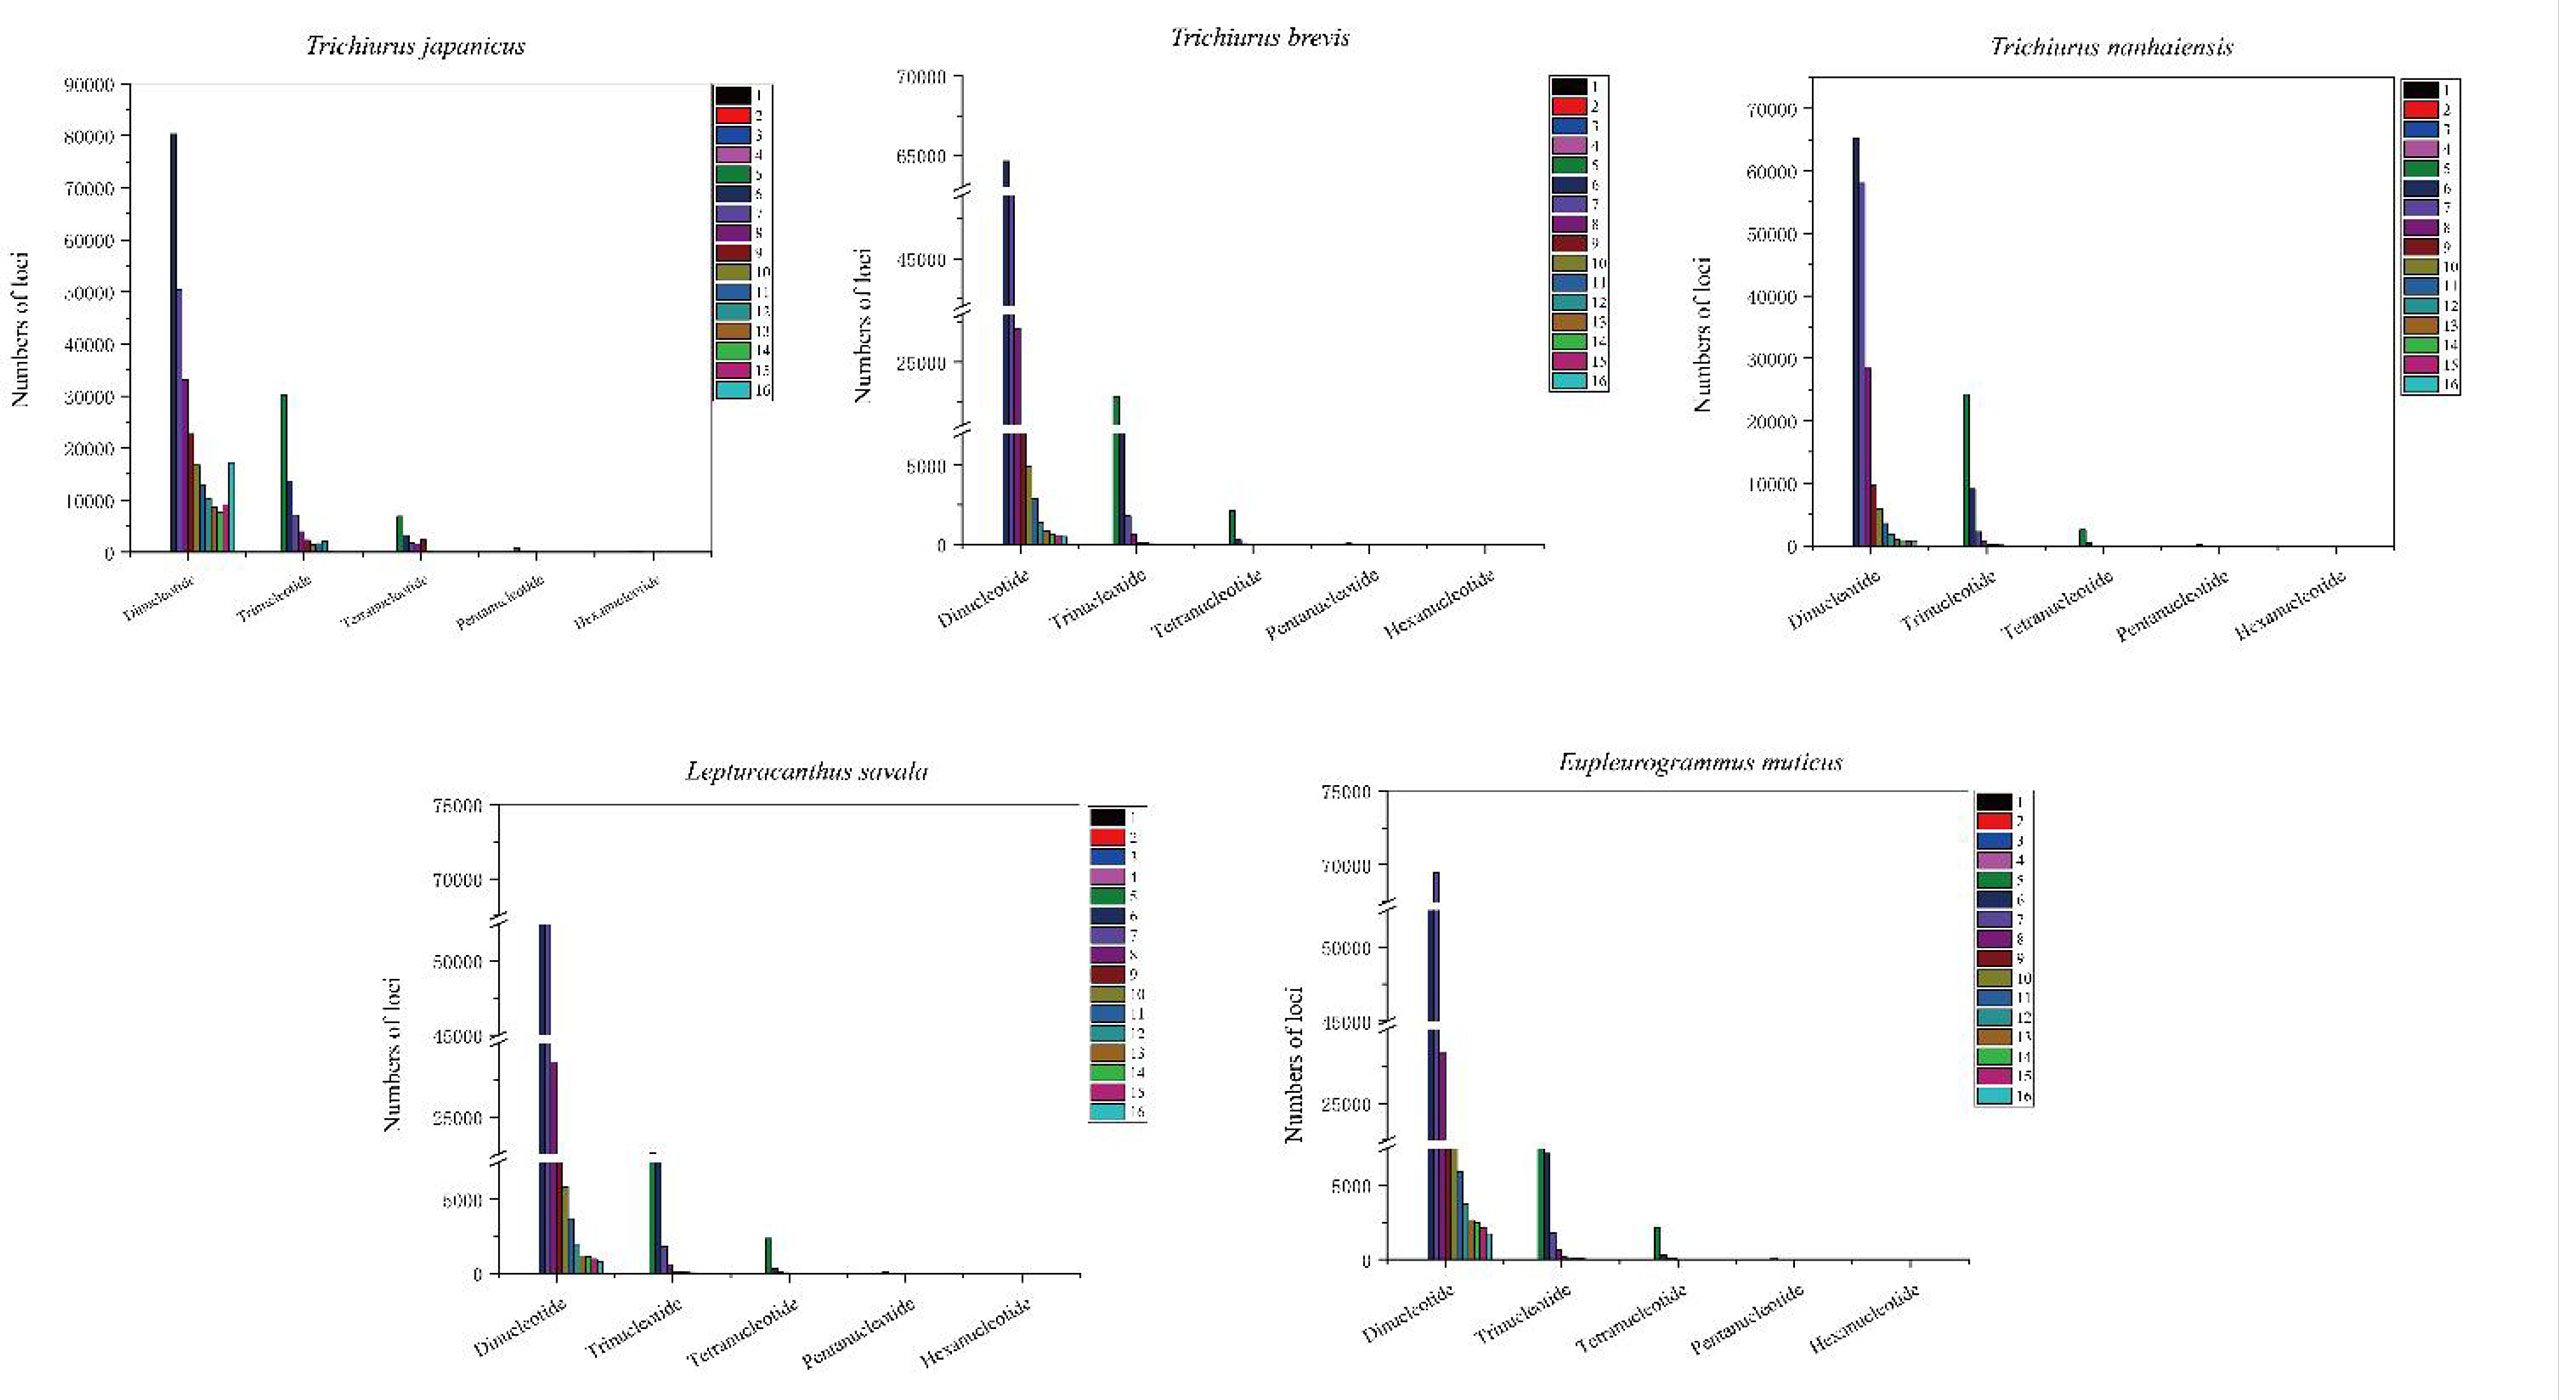
Based on the genome survey data, the total number of identified SSRs of the five Trichiuridae species was 563,132, 383,808, 342,191, 432,258, and 470,603, respectively. The detailed information is shown in Table 5. Among the motif types of microsatellites of the five Trichiuridae species, the dinucleotide repeats were dominant (78.05%–87.24%), followed by the trinucleotide repeats (11.60%–17.07%), tetranucleotide repeats (1.08%–4.36%), pentanucleotide repeats (0.04%–0.4%), and hexanucleotide repeats (0.01%–0.12%) (Figure 3). The proportion of microsatellite motifs showed a decreasing trend with the increase in repeat numbers. The motif AC was the most abundant among the dinucleotide repeat motifs and the motif AAAT was the most among the tetranucleotide repeat motifs for all five Trichiuridae species (Figure 3). The motif CCT of trinucleotide repeats was the most abundant for T. nanhaiensis and T. brevis, motif GAG was the most abundant for E. muticus and T. japonicus, and motif AAT was the most abundant for L. savala. The numbers of pentanucleotide and hexanucleotide repeat types were relatively small and the difference is not obvious (less than five for pentanucleotide repeats and less than two for hexanucleotide repeats) (Figure 4).
Characterization of mitochondrial DNA genomes
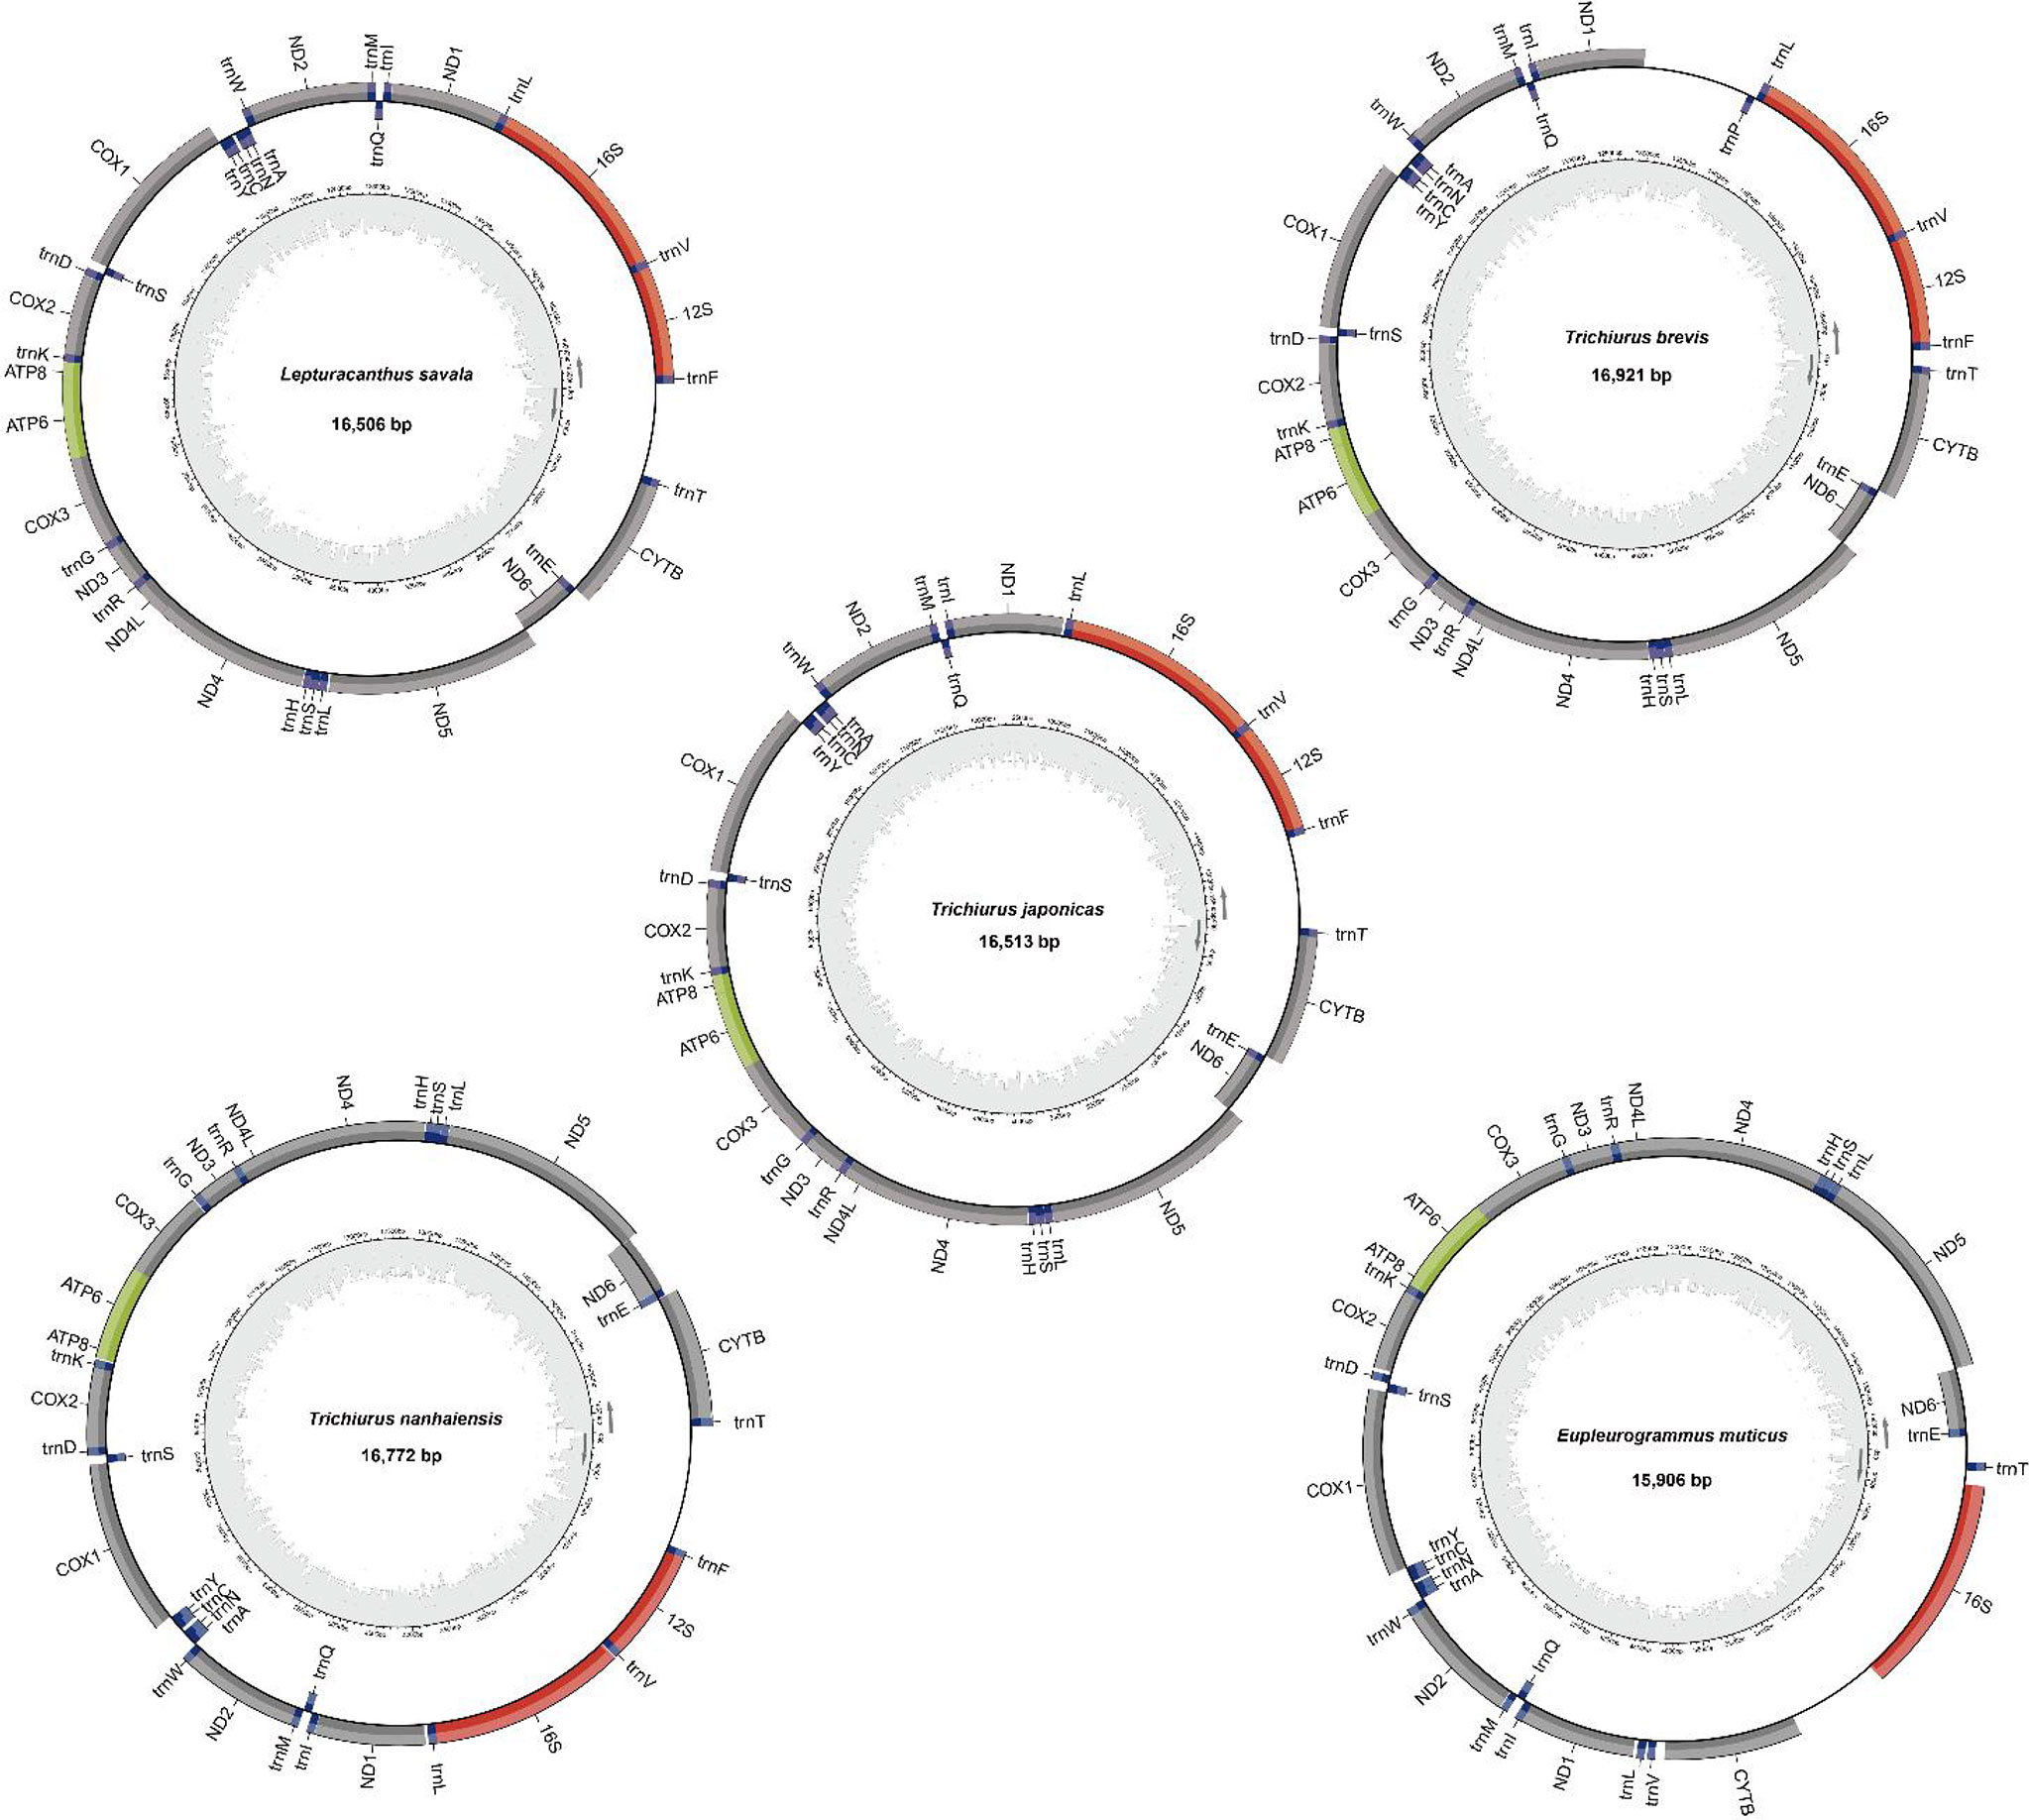
The mitochondrial genomes of five Trichiuridae species were excavated from the genome survey data. The total length of mitogenome for T. japonicus, T. nanhaiensis, T. brevis, L. savala, and E. muticus was 16,513 bp, 16,722 bp, 16,921 bp, 16,506 bp, and 15,906 bp, respectively. The closed circular molecule of the five species was incomplete because of the lack of the second half of the control region and tRNA-pro. The structure diagram of five mitochondrial genomes is shown in Figure 5. To infer the phylogenetic relationship among five Trichiuridae species, the mitochondrial genomes of four scabbardfishes were downloaded and the 12 protein-coding genes (except ND6) were used to construct the ML tree. We chose “TIM2+F+I+G4” as the best-fit model according to Bayesian Information Criterion (BIC), and then used IQ-TREE software to construct ML tree based on 1,000 bootstraps. The results revealed that five Trichiurus species in the present study formed into one clade, and the other four species formed into another clade (Figure 6). Additionally, the phylogenetic tree inferred from the single-copy homologous genes showed that three Trichiurus species clustered firstly, and the other two species formed into another clade (Figure 7).
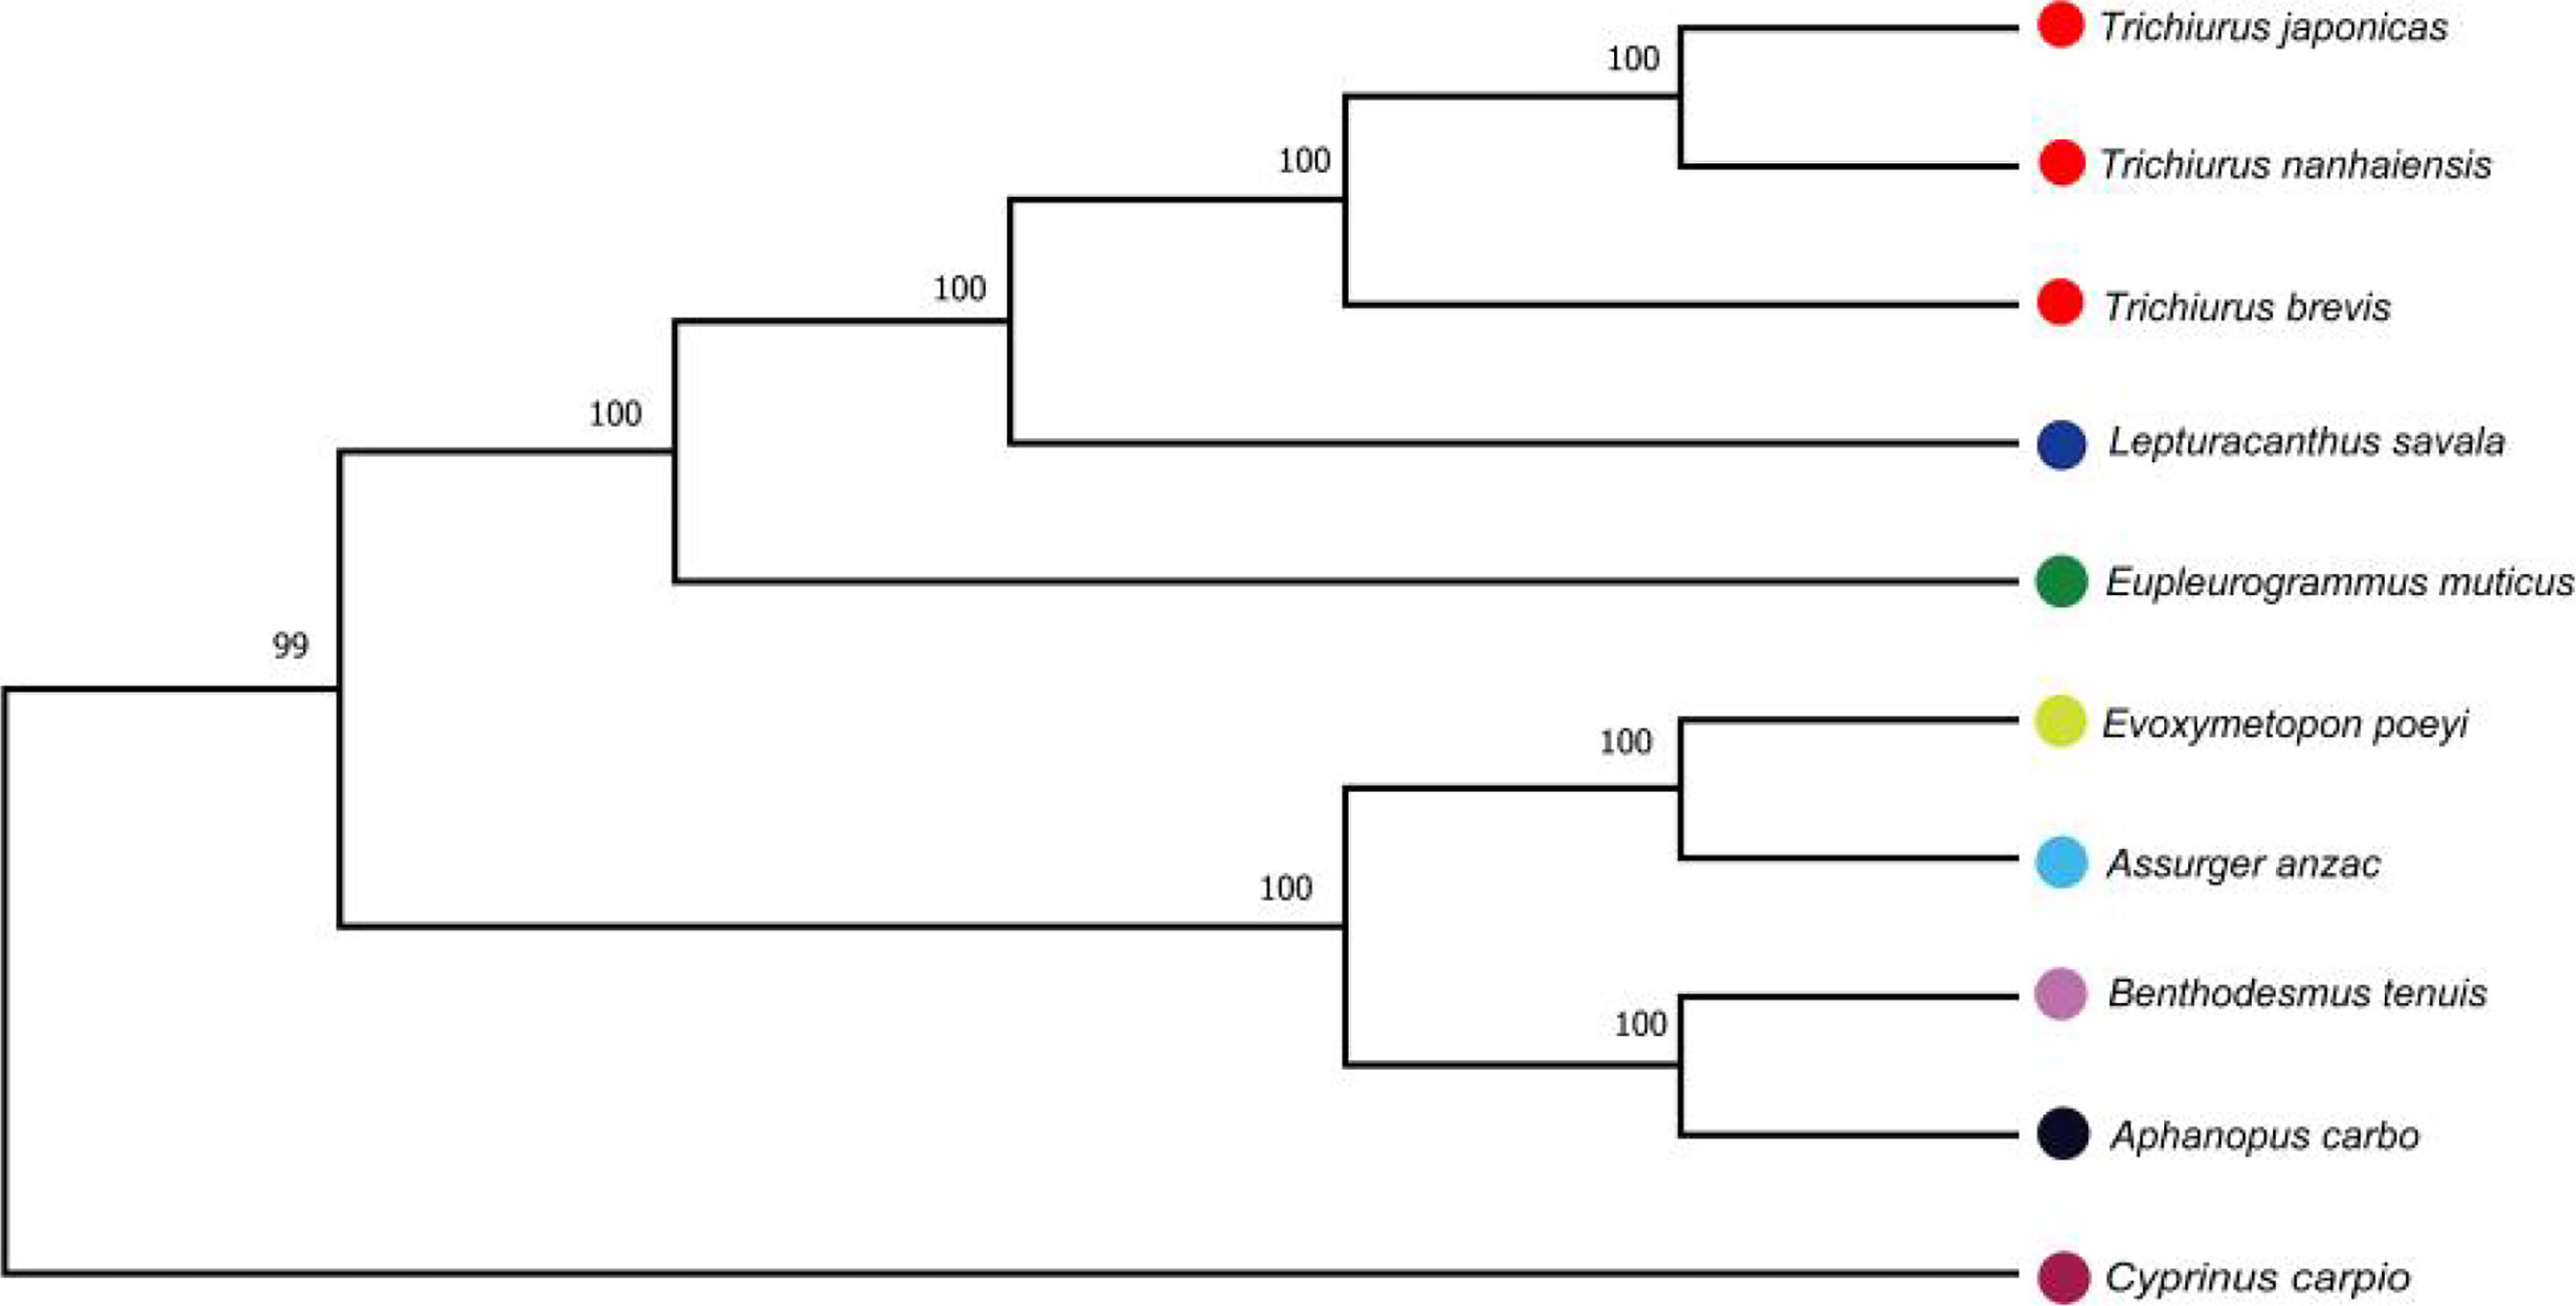
Figure 6 The phylogenetic tree inferred from the 12 protein-coding genes of nine Trichiuridae species.
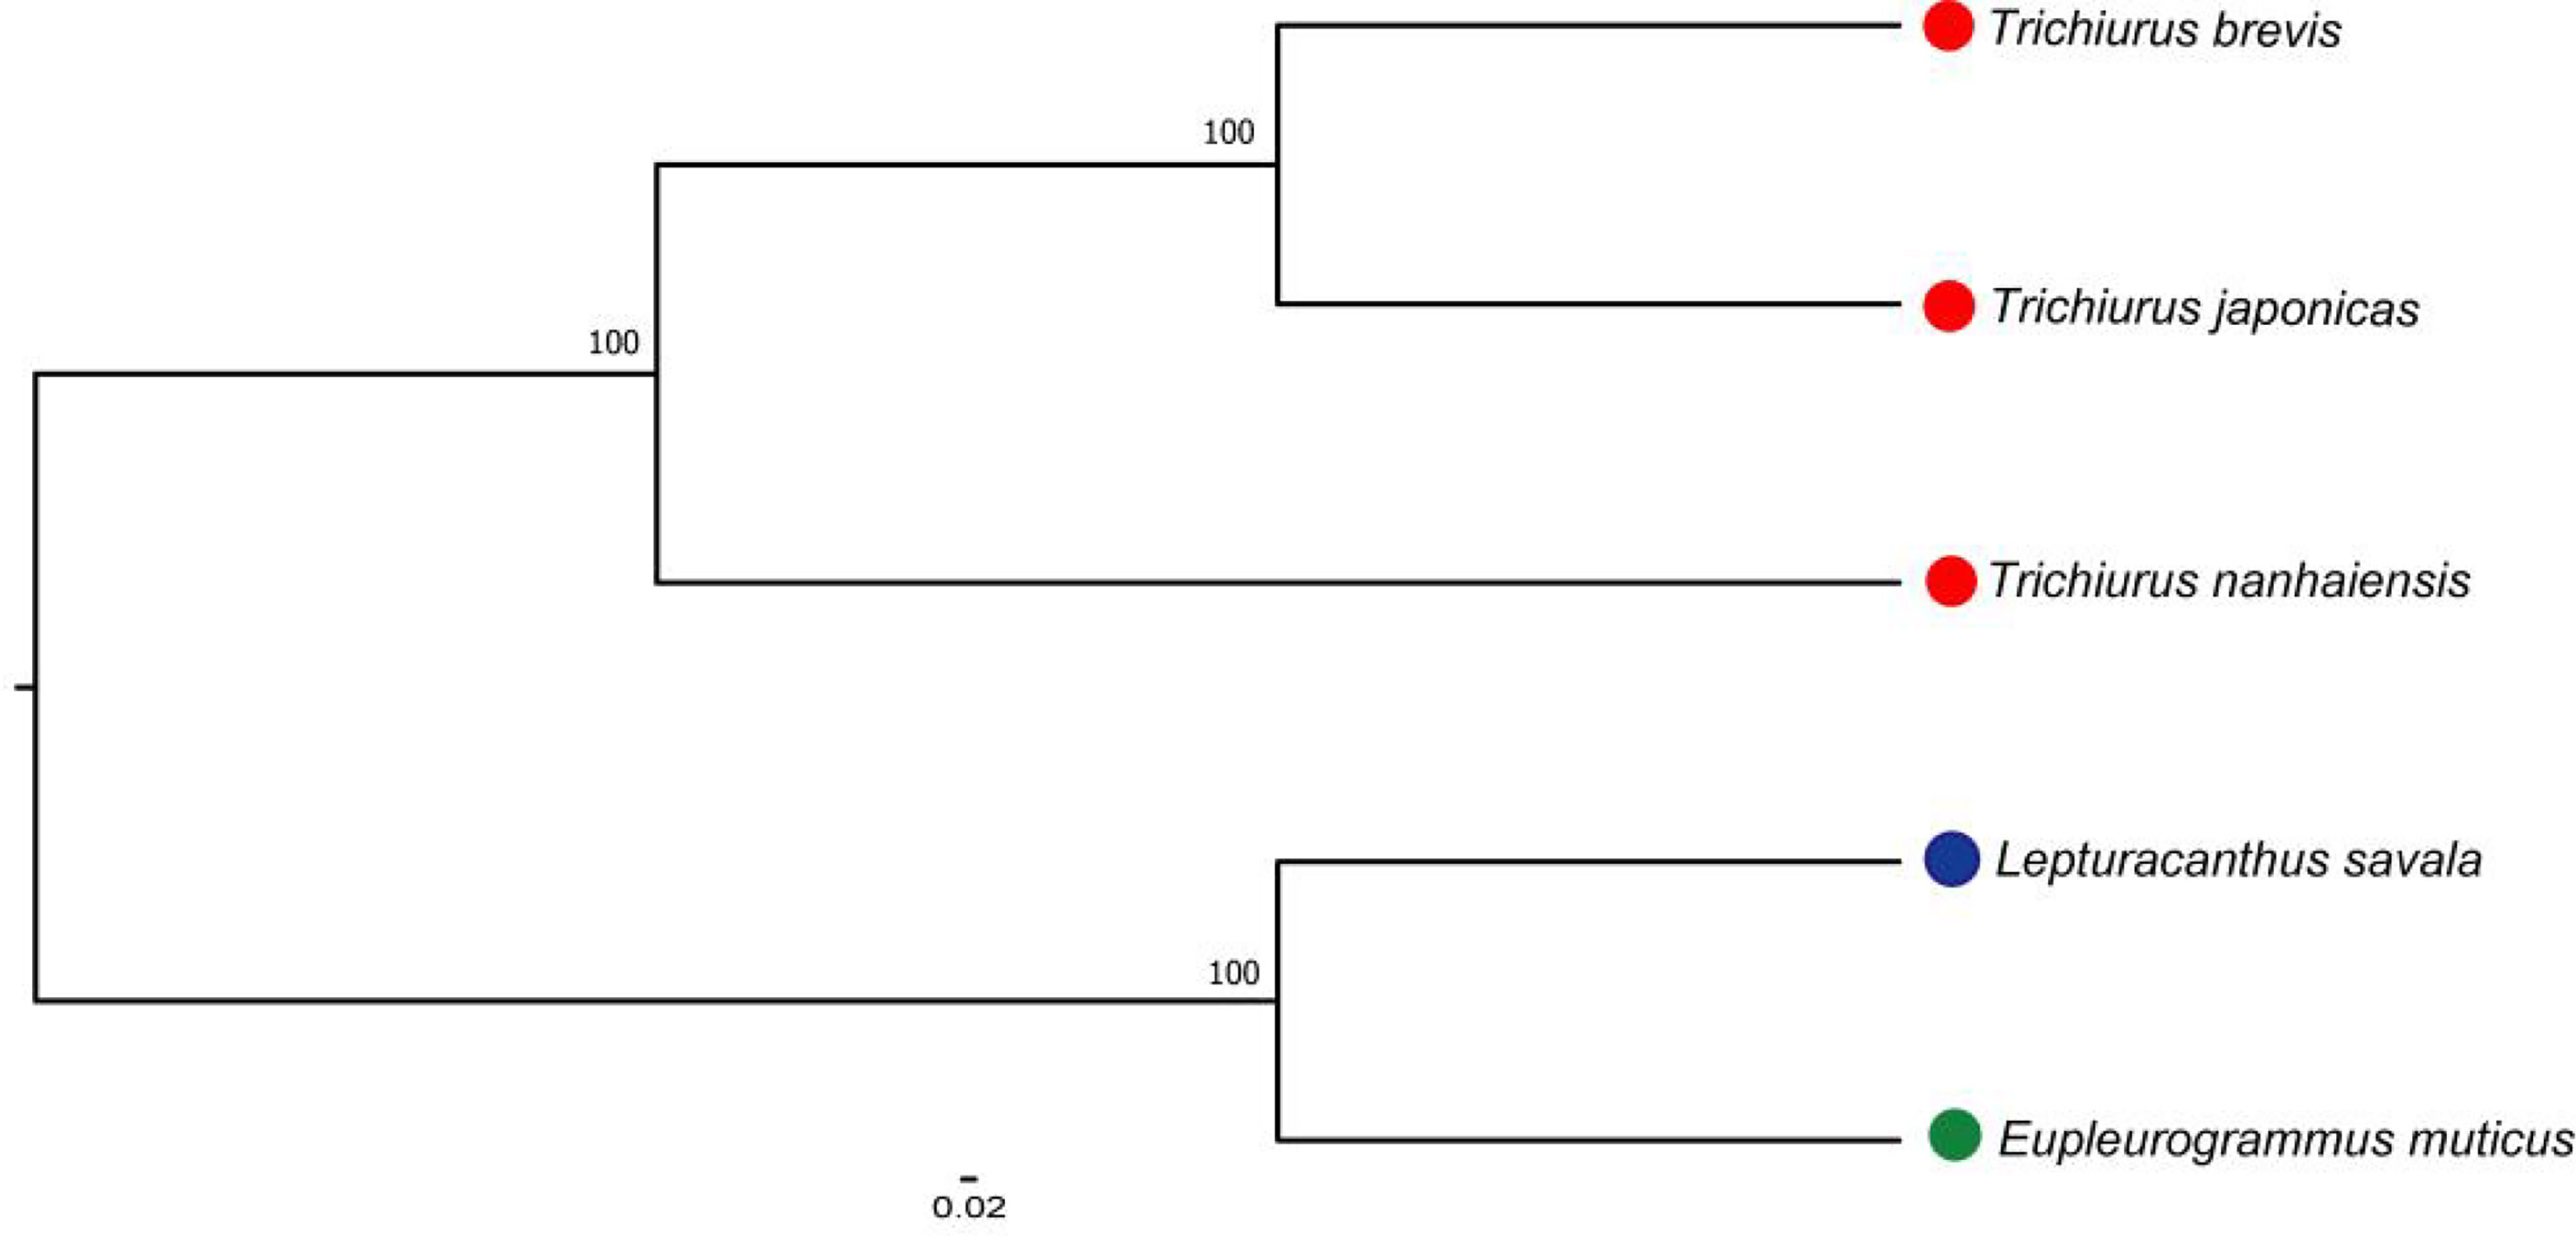
Figure 7 The phylogenetic tree inferred from the single-copy homologous genes of five Trichiuridae species.
Demographic history of five Trichiuridae fish
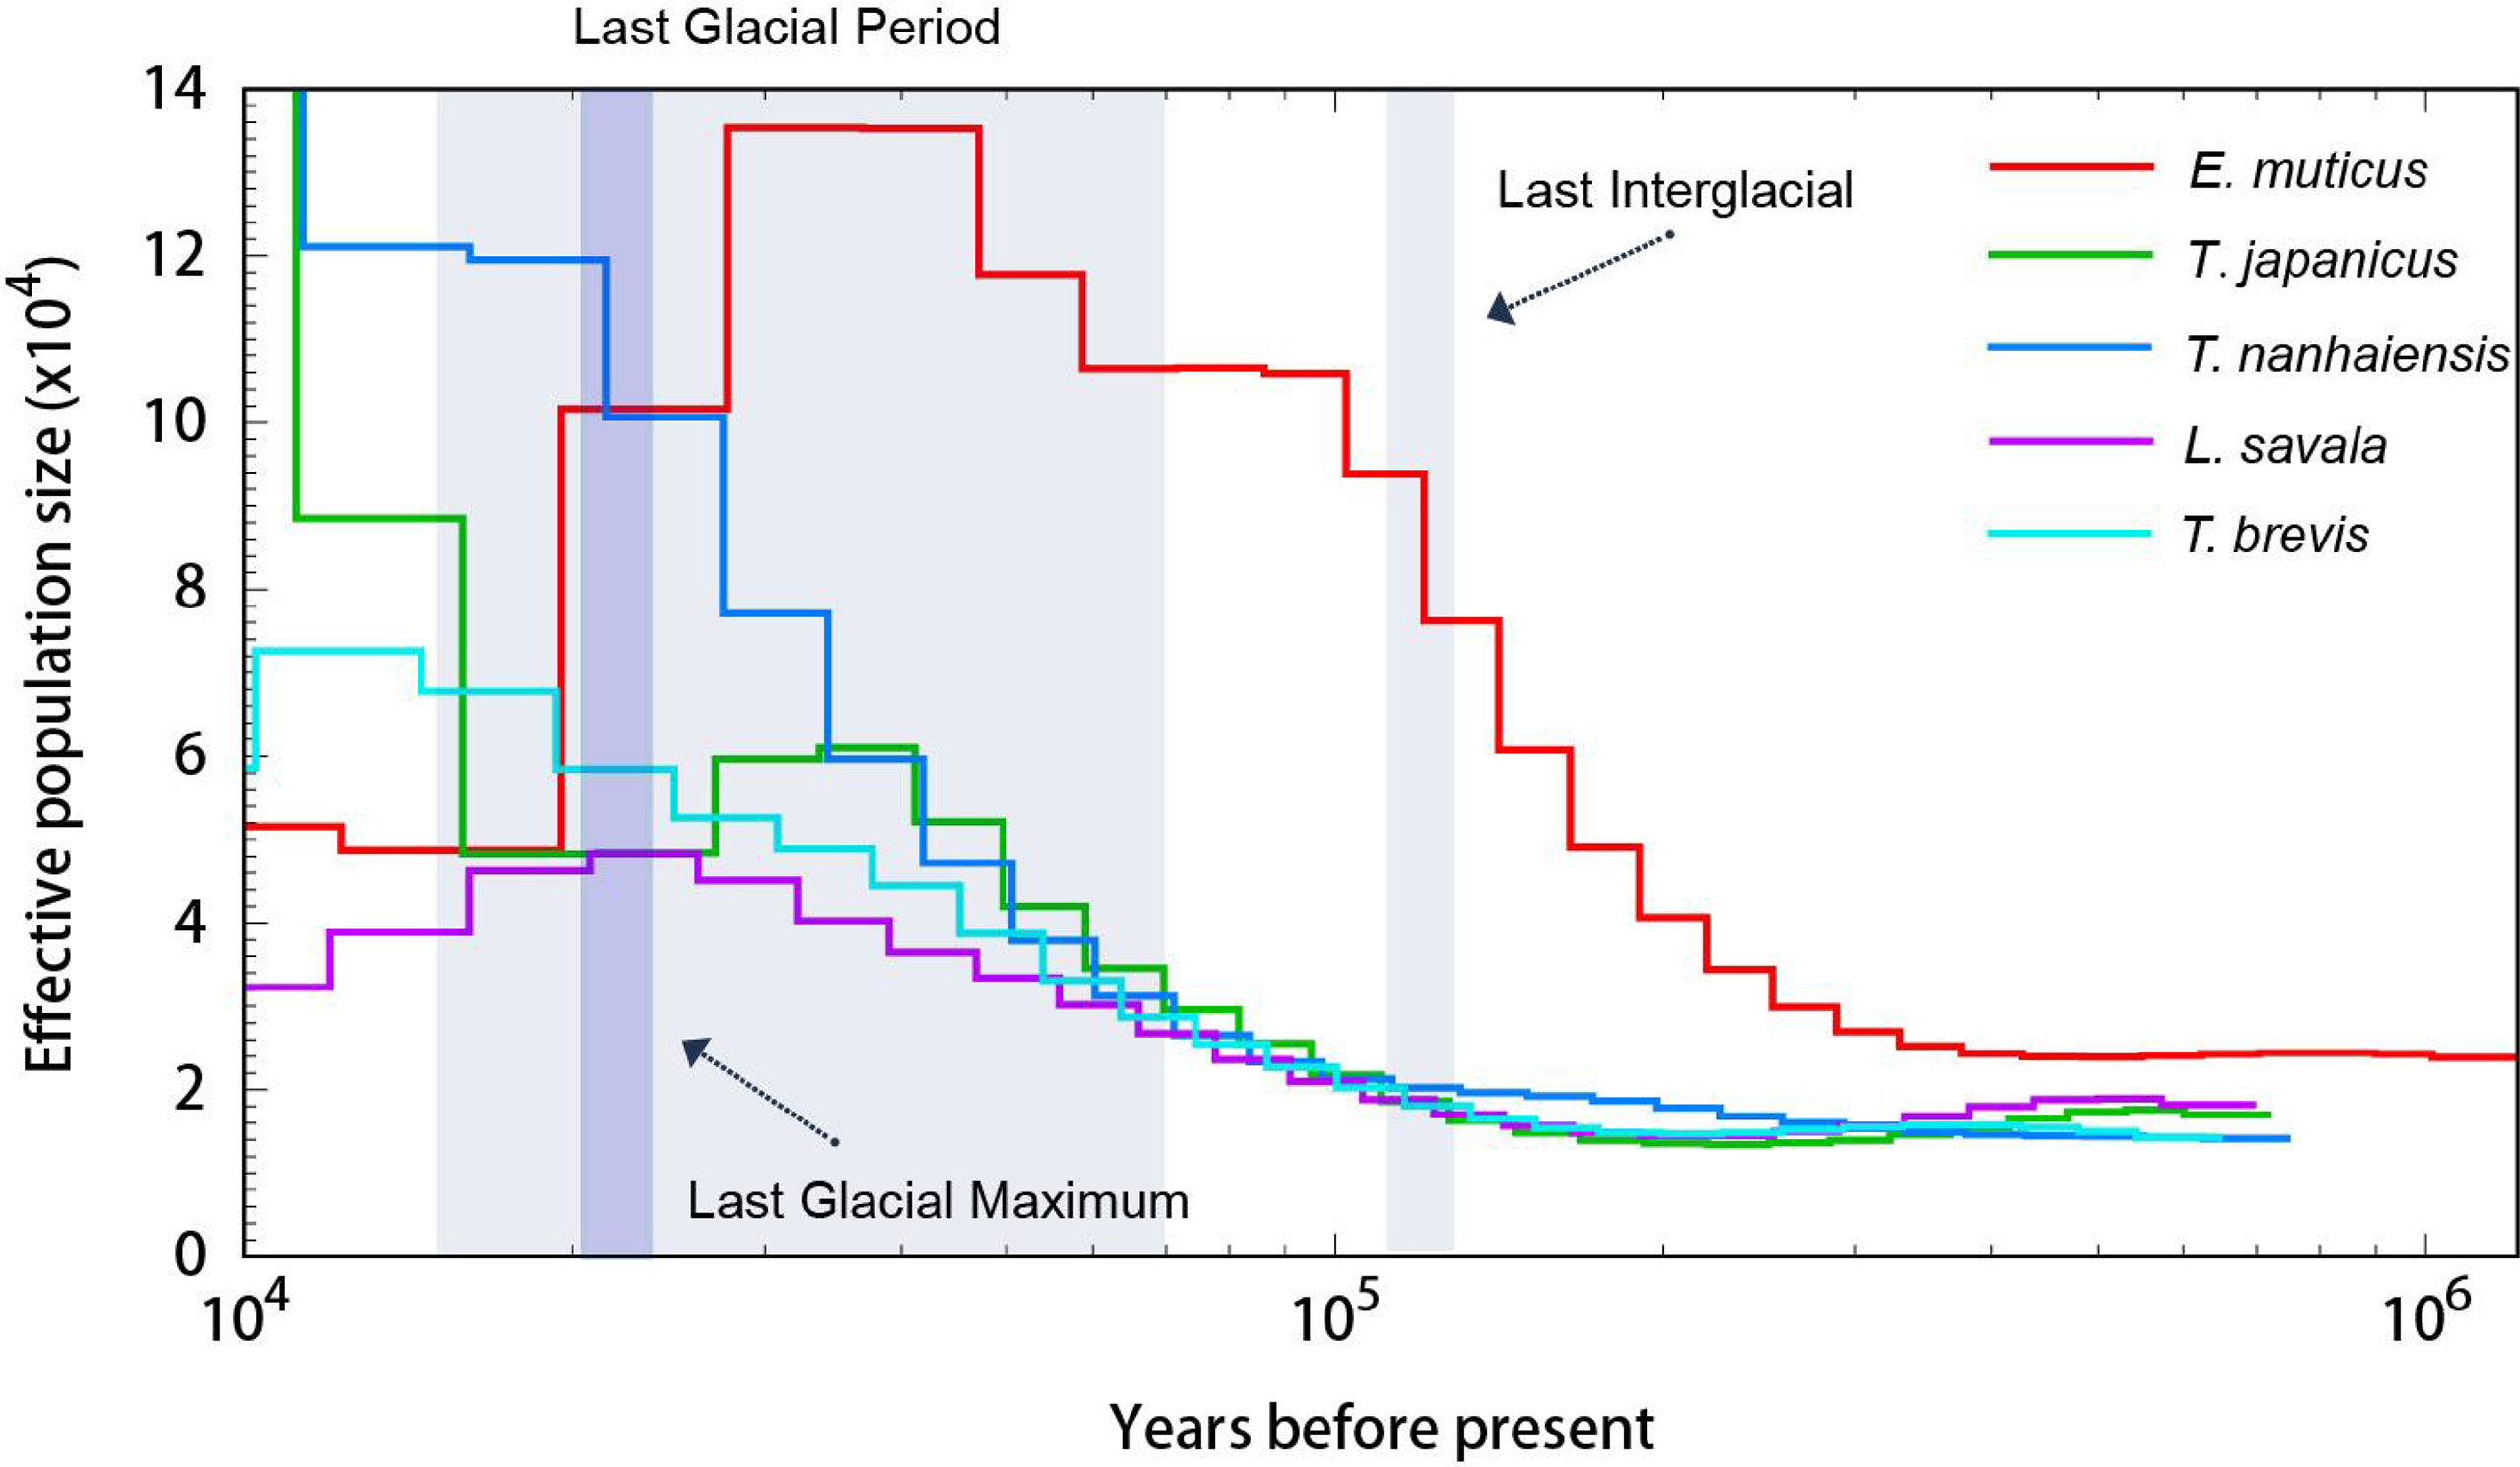
The PSMC analysis was conducted to estimate the demographic history of five Trichiuridae species, and the changes in effective population size between 10 ka and 1 ma are shown in Figure 8. The population expansion event for T. japonicus, T. nanhaiensis, T. brevis, and L. savala exhibited a similar trend, which was about 100 ka YBP, while E. muticus showed earlier expansion and has a significant population decline during the Last Glacial period. Among five Trichiuridae fish, T. japonicus and T. nanhaiensis showed obvious larger effective population sizes than the other three species.
Discussion
The improvement of high-throughput sequencing technology and the development of sequence assembling algorithms have made it possible to obtain plenty of whole genome sequences at low cost and high efficiency (Gaither et al., 2018; Kon et al., 2021). The exponentially increasing number of genome sequences has greatly promoted the rapid development of life science (Xu et al., 2017). However, the genome size and complexity of different species vary significantly, and then the genome survey analysis played a key role in whole genome sequencing (Xu et al., 2019; Jo et al., 2021). In the present study, all the Q20 values were over 97% and all the Q30 values were over 92%, which ensure the sequencing quality. As the important sequence index, the GC content could affect the randomness of genome sequencing (Xu et al., 2014). The average GC content for Trichiuridae species ranged from 39.59% to 42.05% in this study, which was mid-GC content and in the normal range (Zhou et al., 2013; Chen et al., 2020). According to the K-mer analysis index, the calculated genome size of the five Trichiuridae species was 913 Mb (T. japonicus), 868 Mb (T. nanhaiensis), 871 Mb (T. brevis), 747 Mb (L. savala), and 670 Mb (E. muticus), respectively. Most reported fish genomes were less than 1 Gb (Chen et al., 2019), and five Trichiuridae fish in this study fit this pattern. However, it is worth noting that the heterozygous ratio for T. japonicus and E. muticus was high, and they had two K-mer peaks, which may affect actual genome assembly. In conclusion, the genomes of five Trichiuridae fish species are relatively simple and suitable for further whole genome sequencing.
In the present study, the dinucleotide repeat was the most abundant SSR motif for the five species, which is similar to other reported data (Zeng et al., 2013; Chen et al., 2020). E. muticus has the largest total number of identified SSRs among five Trichiuridae species. The proportion of the motif types for T. japonicus, T. nanhaiensis, T. brevis, and L. savala was similar, while E. muticus showed a significant difference with them. Moreover, the proportion of trinucleotide repeats for E. muticus was the highest and that of tetranucleotide repeats was the lowest, which indicated its distinctiveness. We speculated that this may be related to its higher genomic heterozygosity (Yang et al., 2019). The phylogenetic tree inferred from two methods also validated the above presumption. According to our results, the number of identified SSRs was not related to the genome size. The proportion in the motif types showed a decreasing trend with the increase in repeat numbers, and the differences of the motif types may be related to the selection and evolution mechanisms of different species (Doris et al., 2000). SSRs in different genomic regions may have various characteristics to perform different functions (Sonah et al., 2011). Although longer motifs are much less and more difficult for isolation, they are also important for having more accuracy in allele assignment than shorter repeats (Qiu et al., 2020). Until now there are few reported microsatellite markers for Trichiuridae fish (but see Bi et al., 2009; Guo et al., 2012; Zhang et al., 2019), and therefore, the results of this study could provide strong support for their subsequent study on the population genetics and breeding.
The mitogenomes of T. japonicus (No. NC_011719.1, 16796), T. nanhaiensis (No. NC_018791.1, 17060), T. brevis (No. MW694877, 15688), E. muticus (No. MN067886.1, 18251), and L. savala (MT269921, 17146) have been reported in the previous study (Liu and Cui, 2009; Liu et al., 2013; Fan et al., 2019; Cai et al., 2020). The genome length of four Trichiuridae species in this study was shorter than the reported sequences except for T. brevis. The tRNA-Pro was absent in the Trichiurus mitochondrial genome, which was consistent with the results of Yi et al. (2022). The obtained length of T. brevis in the present study was 188 bp longer than the reported sequences, which was caused by the absence of tRNA for sequence MW694877. Although the absence of some fragments often occurs in the next high-throughput sequencing, it still was thought to be an effective method for developing the mitogenome sequences (Xu et al., 2019).
The ML phylogenetic tree constructed by 12 protein-coding genes showed a close relationship among T. japonicus, T. nanhaiensis, T. brevis, L. savala, and E. muticus, which was consistent with the previous results (Xiong et al, 2021; Yi, 2019; Cai, 2020). Trichiuridae fishes were often classified into two groups (scabbardfishes and hairtails) based on their tail characters. The five Trichiuridae species in the present study belong to the hairtail type and the other four species, A. carbo, A. anzac, B. tenuis, and E. poeyi, belong to scabbardfishes, which was also in accordance with the results of COI sequences (Cai, 2020). There are few reported mitochondrial genomes of Trichiuridae fish, which had an appreciable effect on the construction of their phylogenetic tree. More molecular and morphological data were required to reveal the phylogenetic relationship of Trichiuridae fish. Moreover, the genomic information of scabbardfishes is strongly demanded in the following studies.
The population history dynamic analysis based on the PSMC model showed that the effective population sizes of five Trichiuridae fish all increased before the last glacial maximum. However, they emerged with different changing trends during the last glacial maximum. The drastic climate change during the Pleistocene period has been reported to play an important role in the population size and habitat dynamic of marine organisms (Liu et al., 2007). In the present study, only T. nanhaiensis showed a continuing increase, while T. japonicus experienced a brief decreasing period and began to increase continuously. The effective population size of T. brevis, L. savala, and E. muticus failed to increase since the last glacial maximum. The re-colonizing ability may be related to their original distribution and adaptability (Liu et al., 2007). Among the genus Trichiurus, T. brevis was the ancestral species. T. japonicus was the latest species, but it had the widest distribution (Yi et al, 2022). The process of species formation and evolution ability may correspond to its distribution area. The genome size of T. japonicus was the largest, and the ratio of the repeat sequence was the smallest in this study. This may be related to its strong adaptability and rapid expansion after the Pleistocene period (Lin et al., 2021).
In conclusion, this is the first report to sequence and characterize the whole genomes of five Trichiuridae fish, which opened up new horizons for this fish group. The genomes of five Trichiuridae fish ranged from 670 Mb to 913 Mb, which were relatively simple and suitable for further whole genome sequencing. The sequencing data will profit the following SSR development of the Trichiuridae fish and can provide useful genetic information for them.
Data availability statement
The datasets presented in this study can be found in online repositories. The names of the repository/repositories and accession number(s) can be found below: https://www.ncbi.nlm.nih.gov/, PRJNA825079.
Ethics statement
The animal study was reviewed and approved by Animal Research and Ethics Committees of the Ocean University of China.
Author contributions
TG conceived and managed the project. XZ and CC collected the sequencing samples. XZ performed the experiment and analysis. NS wrote the manuscript. TG and XZ revised the manuscript. All authors contributed to the article and approved the submitted version.
Funding
This research was funded by the National Key Research and Development Program of China (2019YFD0901303) and the Zhejiang Provincial Key Research and Development Program (2021C02047).
Acknowledgments
We would like to thank Mr. Qi Liu from Wuhan Onemore-tech Co., Ltd. (Wuhan, Hubei 430076, China) for the kind help for the data analysis.
Conflict of interest
The authors declare that the research was conducted in the absence of any commercial or financial relationships that could be construed as a potential conflict of interest.
Publisher’s note
All claims expressed in this article are solely those of the authors and do not necessarily represent those of their affiliated organizations, or those of the publisher, the editors and the reviewers. Any product that may be evaluated in this article, or claim that may be made by its manufacturer, is not guaranteed or endorsed by the publisher.
References
Allio R., Schomaker-Bastos A., Romiguier J. (2020). MitoFinder: Efficient automated large-scale extraction of mitogenomic data in target enrichment phylogenomics. Mol. Ecol. Res. 20 (4), 892–905. doi: 10.1111/1755-0998.13160
Baeza J. A., Molina-Quirós J. L., Hernández-Muñoz S. (2021). Genome survey sequencing of an iconic ‘Trophy’ sportfish, the roosterfish Nematistius ectoralis: Genome size, repetitive elements, nuclear RNA gene operon, and microsatellite discovery. Genes. 12, 1710. doi: 10.3390/genes12111710
Beier S., Thiel T., Münch T., Scholz U., Mascher M. (2017). MISA-web: A web server for microsatellite prediction. Bioinformatics. 33, 2583–2585. doi: 10.1093/bioinformatics/btx198
Bi J. Z., Shao C. W., Miao G. D. (2009). Isolation and characterization of 12 microsatellite loci from cutlassfish (Trichiurus haumela). Conserv. Genet. 10, 1171–1173. doi: 10.1007/s10592-008-9736-5
Cai C. (2020). Study on genetic diversity of Lepturacanthus savala and phylogenetic relationships of Trichiuridae. Ocean Univ. China. 1–3
Cai C., Song N., Zhao L., Gao T. (2020). The complete mitogenome of the Lepturacanthus savala (Perciformes: Trichiuridae) from the yellow sea. Mitochondrial DNA Part B. 5 (3), 2821–2822. doi: 10.1080/23802359.2020.1789512
Chakraborty A., Aranishi F., Iwatsuki Y. (2006). Genetic differences among three species of the genus Trichiurus (Perciformes: Trichiuridae) based on mitochondrial DNA analysis. Ichthyol Res. 53 (1), 93–96. doi: 10.1007/s10228-005-0313-3
Chen B., Sun Z., Lou F., Song N. (2020). Genomic characteristics and profile of microsatellite primers for Acanthogobius ommaturus by genome survey sequencing. Biosci. Rep. 40 (11), BSR20201295. doi: 10.1042/BSR20201295
Chen S., Xu W., Liu Y. (2019). Fish genomic research: Decade review and prospect. J. Fisheries China. 43, 1–14. doi: 10.11964/jfc.20181211599
Chen S., Zhou Y., Chen Y., Gu J. (2018). Fastp: An ultra-fast all-in-one FASTQ preprocessor. Bioinformatics 34 (17), i884–i890. doi: 10.1093/bioinformatics/bty560
Doris B., Martin A., Marianne I. (2000). Microsatellite variability differs between dinucleotide repeat motifs-evidence from drosophila melanogaster. Mol. Biol. Evol. 9, 1277. doi: 10.1093/oxfordjournals.molbev.a026411
Emms D. M., Kelly S. (2019). OrthoFinder: Phylogenetic orthology inference for comparative genomics. Genome Biol. 20 (1), 238. doi: 10.1186/s13059-019-1832-y
Fan H., Peng K., Cheng Q. (2019). The complete mitochondrial genome and phylogenetic relationship of Trichiurus sp. from jiangsu. Mitochondrial DNA Part B. 4 (1), 1231–1232. doi: 10.1080/23802359.2019.1591226
Fischer W., Krupp F., Schneider W., Sommer C., Carpenter K. E., Niem V. (1995). Pacifico centro-oriental: 3. Vertebrados, parte 2. Fao Species Identification Guide for Fishery Purposes. 3, 1638–1642.
Gaither M. R., Gkafas G. A., de Jong M. (2018). Genomics of habitat choice and adaptive evolution in a deep-sea fish. Nat. Ecol. Evol. 2, 680–687. doi: 10.1038/s41559-018-0482-x
Guo Y. S., Liu X. M., Wang Z. D. (2012). Isolation and characterization of microsatellite dna loci from naihai cutlassfish (Trichiurus nanhaiensis). J. Genet. 91 (3), e109–e112. doi: 10.1007/s12041-012-0196-9
Hsu K., Shih N., Ni I. (2007). Genetic variation in Trichiurus lepturus (Perciformes: Trichiuridae) in waters off Taiwan: Several species or cohort contribution. Raffles Bull. Zoology. 14, 215–220.
Hsu K., Shih N., Ni I., Shao K. (2009). Speciation and population structure of three Trichiurus species based on mitochondrial DNA. Zoological Stud. 48 (6), 851–865.
Huang G., Cao J., Chen C., Wang M., Liu Z., Gao F., et al. (2022). Genome survey of Misgurnus anguillicaudatus to identify genomic information, simple sequence repeat (SSR) markers, and mitochondrial genome. Mol. Biol. Rep. 49 (3), 2185–2196. doi: 10.1007/s11033-021-07037-x
Jia C., Zhang X., Xu S., Yang T., Yanagimoto T., Gao T. (2020). Comparative analysis of the complete mitochondrial genomes of three rockfishes (Scorpaeniformes, sebastiscus) and insights into the phylogenetic relationships of Sebastidae. Biosci. Rep. 40 (12), BSR20203379. doi: 10.1042/BSR20203379
Jo E., Cho Y. H., Lee S. J., Choi E., Park H. (2021). Genome survey and microsatellite motif identification of Pogonophryne albipinna. Biosci. Rep. 41 (7), BSR20210824. doi: 10.1042/BSR20210824
Karaiskou N., Apostolidis A. P., Triantafyllidis A., Kouvatsi A., Triantaphyllidis C. (2003). Genetic identification and phylogeny of three species of the genus Trachurus based on mitochondrial DNA analysis. Mar. Biotechnol. (NY). 5 (5), 493–504. doi: 10.1007/s10126-002-0099-5
Kon T., Pei L., Ichikawa R., Chen C., Wang P., Takemura I., et al. (2021). Whole-genome resequencing of large yellow croaker (Larimichthys crocea) reveals the population structure and signatures of environmental adaptation. Sci. Rep. 11, 11235. doi: 10.1038/s41598-021-90645-1
Li H., Durbin R. (2011). Inference of human population history from individual whole-genome sequences. Nature. 475, 493–496. doi: 10.1038/nature10231
Lin H. C., Tsai C. J., Wang H. Y. (2021). Variation in global distribution, population structures, and demographic history for four Trichiurus cutlassfishes. PeerJ. 9, e12639. doi: 10.7717/peerj.12639
Liu Y., Cui Z. (2009). The complete mitochondrial genome sequence of the cutlassfish Trichiurus japonicus (Perciformes: Trichiuridae): Genome characterization and phylogenetic considerations. Mar. Genomics 2 (2), 133–142. doi: 10.1016/j.margen.2009.07.003
Liu J. X., Gao T. X., Wu S. F., Zhang Y. P. (2007). Pleistocene isolation in the northwestern pacific marginal seas and limite dispersal in a marine fish, Chelon haematocheilus (Temminck & schlege). Mol. Ecol. 16, 275–288. doi: 10.1111/j.1365-294X.2006.03140.x
Liu X., Guo Y., Wang Z., Liu C. (2013). The complete mitochondrial genome sequence of Trichiurus nanhaiensis (Perciformes: Trichiuridae). Mitochondrial DNA 24 (5), 516–517. doi: 10.3109/19401736.2013.772151
Liu B., Shi Y., Yuan J., Hu X., Zhang H., Li N. (2013). Estimation of genomic characteristics by analyzing k-mer frequency in de novo genome projects. Quant Biol. 35 (s1-3), 62–67. doi: 10.48550/arXiv.1308.2012v1
Luo R., Liu B., Xie Y., Li Z., Huang W., Yuan J., et al. (2012). SOAPdenovo2: an empirically improved memory-efficient short-read de novo assembler. GigaScience. 1 (1), 18. doi: 10.1186/2047-217X-1-18
Marçais G., Kingsford C. (2011). A fast, lock-free approach for efficient parallel counting of occurrences of k-mers. Bioinformatics. 27 (6), 764–770. doi: 10.1093/bioinformatics/btr011
Minh B. Q., Schmidt H. A., Chernomor O. (2020). IQ-TREE 2: New models and efficient methods for phylogenetic inference in the genomic era. Mol. Biol. Evol. 37, 1530–1534. doi: 10.1093/molbev/msaa015
Miya M., Nishida M. (2000). Use of mitogenomic information in teleostean molecular phylogenetics: A tree-based exploration under the maximum-parsimony optimality criterion. Mol. Phylogenet. Evol. 17 (3), 437–455. doi: 10.1006/mpev.2000.0839
Nelson J. S., Grande T. C., Wilson M. (2016). Fishes of the world, 5th Edition. John Wiley & Sons, Inc. 3–4
Qiu B., Fang S., Ikhwanuddin M. (2020). Genome survey and development of polymorphic microsatellite loci for Sillago sihama based on illumina sequencing technology. Mol. Biol. Rep. 47, 3011–3017. doi: 10.1007/s11033-020-05348-z
Schroeter J. C., Maloy A. P., Rees C. B., Bartron M. L. (2020). Fish mitochondrial genome sequencing: expanding genetic resources to support species detection and biodiversity monitoring using environmental DNA. Conserv. Genet. Resour. 12 (3), 433–446. doi: 10.1007/s12686-019-01111-0
Simão F. A., Waterhouse R. M., Ioannidis P., Kriventseva E. V., Zdobnov E. M. (2015). BUSCO: Assessing genome assembly and anno-tation completeness with single-copy orthologs. Bioinformatics. 31 (19), 3210–3212. doi: 10.1093/bioinformatics/btv351
Sonah H., Deshmukh R. K., Sharma A. (2011). Genome-wide distribution and organization of microsatellites in plants: An insight into marker development in brachypodium. PloS One 6 (6), e21298. doi: 10.1371/journal.pone.0021298
Tzeng C. H., Chen C. S., Chiu T. S. (2007). Analysis of morphometry and mitochondrial DNA sequences from two Trichiurus species in waters of the western north pacific: taxonomic assessment and population structure. J. Fish Biol. 70, 165–176. doi: 10.1111/j.1095-8649.2007.01368.x
Tzeng C., Chiu T. (2012). DNA Barcode-based identification of commercially caught cutlassfishes (Family: Trichiuridae) with a phylogenetic assessment. Fish Res., 127–128, 176–181. doi: 10.1016/j.fishres.2012.01.022
Xiong Y., Lei X., Bai S., Xiong Y., Ma X. (2021). Genomic survey sequencing, development and characterization of single- and multi-locus genomic ssr markers of Elymus sibiricus l. BMC Plant Biol. 21 (1), 3. doi: 10.1186/s12870-020-02770-0
Xu J., Bian C., Chen K. (2017). Draft genome of the northern snakehead, Channa argus. GigaScience. 6 (4), 1–5. doi: 10.1093/gigascience/gix011
Xu S. Y., Song N., Xiao S. J., Gao T. X. (2020). Whole genome survey analysis and microsatellite motif identification of Sebastiscus marmoratus. Biosci. Rep. 40 (2), BSR20192252. doi: 10.1042/BSR20192252
Xu P., Zhang X. F., Wang X. M. (2014). Genome sequence and genetic diversity of the common carp, Cyprinus carpio. Nat. Genet. 46 (11), 1212–1219. doi: 10.1038/ng.3098
Xu S., Zhao L., Xiao S., Gao T. (2019). Whole genome resequencing data for three rockfish species of Sebastes. Sci. Data. 6 (1), 97. doi: 10.1038/s41597-019-0100-z
Yang J., Zhang J., Han R., Zhang F., Mao A., Luo J., et al. (2019). Target SSR-seq: a novel ssr genotyping technology associate with perfect SSRs in genetic analysis of cucumber varieties. Front. Plant Sci. 10, 531. doi: 10.3389/fpls.2019.00531
Yi M. (2019). Based on skeletal comparison and COI sequence analysis for 6 species of cutlassfishes Trichiuridae systematic classification in Chinese costal water. Guangdong Ocean Univ. 1–4. doi: 10.27788/d.cnki.ggdhy.2019.000065
Yi M. R., Hsu K. C., Gu S., He X. B., Luo Z. S., Lin H. D., et al. (2022). Complete mitogenomes of four Trichiurus species: A taxonomic review of the T. lepturus species complex. ZooKeys. 1084, 1–26. doi: 10.3897/zookeys.1084.71576
Zeng C., Gao Z., Luo W. (2013). Characteristics of microsatellites in blunt snout bream (Megalobrama amblycephala) EST sequences using 454 FLX. Acta Hydrobiol. Sin. 37, 982–988. doi: 10.7541/2013.129
Zhang H., Liang Z., Wu R. (2019). Development of microsatellite loci for hairtail (Trichiurus japonicus) by using slaf-seq technology and cross-species amplification tests. Genomics Appl. Biol. 38 (02), 574–585. doi: 10.13417/j.gab.038.000574
Zheng W., Du Y., Lin J. (2015). Genetic diversity analysis of Trichiurus lepturus in zhoushan based on mitochondrial DNA d-loop partical sequences. Acta Hydrobiologica Sinica. 39 (2), 408–413. doi: 10.7541/2015.53
Keywords: genome survey, Trichiuridae, microsatellite, mitochondrial genome, PSMC
Citation: Song N, Zhao X, Cai C and Gao T (2022) Profile of the genomic characteristics and comparative studies of five Trichiuridae species by genome survey sequencing. Front. Mar. Sci. 9:962307. doi: 10.3389/fmars.2022.962307
Received: 06 June 2022; Accepted: 20 October 2022;
Published: 09 November 2022.
Edited by:
Anna Rita Rossi, Sapienza University of Rome, ItalyReviewed by:
Qiong Shi, BGI Academy of Marine Sciences, ChinaZhiqin Xie, Guangxi Veterinary Research Institute, China
Copyright © 2022 Song, Zhao, Cai and Gao. This is an open-access article distributed under the terms of the Creative Commons Attribution License (CC BY). The use, distribution or reproduction in other forums is permitted, provided the original author(s) and the copyright owner(s) are credited and that the original publication in this journal is cited, in accordance with accepted academic practice. No use, distribution or reproduction is permitted which does not comply with these terms.
*Correspondence: Tianxiang Gao, Z2FvdGlhbnhpYW5nMDYxMUAxNjMuY29t
†These authors have contributed equally to this work and share first authorship
 Na Song
 Xiang Zhao1†
 Tianxiang Gao
