 Edwin S. Uribe1,2*
 Andrés Etter1
 Andrea Luna-Acosta1
 María Claudia Diazgranados3
 David Alonso2
 Luis Chasqui2Adriana Osorno2
 Alberto Acosta4Alexandra Rodríguez-Rodríguez5
 Constanza Ricaurte-Villota6Luisa Escobar7
 Alan Giraldo8
- 1Departamento de Ecología y Territorio, Pontificia Universidad Javeriana, Bogotá, Colombia
- 2Programa Biodiversidad y Ecosistemas Marinos, Instituto de Investigaciones Marinas y Costeras – INVEMAR, Santa Marta, Colombia
- 3Blue Carbon Program, International Conservation, Bogotá, Colombia
- 4UNESIS (Unidad de Ecología y Sistemática), Departamento de Biología, Facultad de ciencias, Pontificia Universidad Javeriana, Bogotá, Colombia
- 5Programa Calidad Ambiental Marina, Instituto de Investigaciones Marinas y Costeras – INVEMAR, Santa Marta, Colombia
- 6Programa Geociencias Marinas y Costeras, Instituto de Investigaciones Marinas y Costeras – INVEMAR, Santa Marta, Colombia
- 7Departamento de Biología, Facultad de Ciencias, Pontificia Universidad Javeriana, Bogotá, Colombia
- 8Grupo de Oceanografía, Facultad de Ciencias, Universidad del Valle, Cali, Colombia
Introduction: Human activities represent a growing threat to biodiversity, increasing species extinction and leading ecosystems to collapse. The knowledge of the spatial distribution of threats to ecosystems is fundamental to understanding their risk of collapse as defined by the Red List of Ecosystems, an International Union for Conservation of Nature (IUCN) global standard to guide conservation and management actions. Colombia is a megadiverse country; almost half of its territory is marine, and its ecosystems are subject to anthropogenic and climatic threats.
Methodology: This study provides a quantitative map assessment for a set of relevant anthropic and climatic threats and impacts on the marine and coastal areas of Colombia, intending to perform the threat description component of the Red List assessment protocol. A cumulative impact assessment was applied to analyze the threat levels (TLs) and impact levels of 12 anthropogenic and climatic pressures.
Results: The observed TL patterns meet spatial expectations, revealing that the assessment units in the Caribbean Sea are more threatened than those in the Pacific Ocean, and continental areas are more threatened than the oceanic ones. Habitat transformation and sea warming were the threats with the most impact on coastal and marine ecosystems, respectively. Climatic threats were widely extended throughout the study area, occurring even in the most pristine zones (e.g., Malpelo Island).
Discussion: Climate threats are challenging to national conservation strategies since these pressures are not completely manageable at local scales as they depend mainly on global efforts. Recommendations drawn from this work can guide actions for the conservation of the ecosystems of Colombia.
1 Introduction
Human activities, particularly since the industrial revolution, and their environmental effects represent a growing threat to biodiversity (Brook et al., 2013; Montoya et al., 2018). The impact of anthropic threats leads to ecosystem collapse and drives species to extinction (Johnson et al., 2017; Sato and Lindenmayer, 2018). Anthropic and climatic threats from land and ocean exert pressure on land–water interface zones, and their vulnerable ecosystems, such as coral reefs and mangroves, are increasingly becoming affected (Lu et al., 2018; Halpern et al., 2019). Even in remote oceanic areas, usually perceived as pristine, ecosystems are under threat, being impacted by climate change (Jones et al., 2018) and anthropic threats, such as maritime transportation and hydrocarbon exploration (Jones et al., 2018; Halpern et al., 2019).
Cumulative impact assessments (also referred to as cumulative effects assessment by Stelzenmüller et al., 2015; Stelzenmüller et al., 2020) show local and global threats to marine, coastal, and terrestrial environments around the world in a standardized way, allowing their monitoring in space and time (Halpern et al., 2015) (Holsman et al., 2017; Halpern et al., 2019; Allan et al., 2019). A cumulative impact assessment reveals the intensity with which several climatic and anthropic pressures act upon ecosystems (Hodgson and Halpern, 2019; Tulloch et al., 2020), involving two measurements: threat level (TL; the intensity of the threat in a specific area) and impact level (the degree to which a threat affects a given ecosystem) (Halpern et al., 2008; Halpern et al., 2019). Calculating the impact level is essential since threats affect ecosystems differentially, given their varying vulnerabilities (Halpern et al., 2007; Crain et al., 2009).
The cumulative impact assessment framework is instrumental to society, governments, and the scientific community (Stelzenmüller et al., 2020; Tulloch et al., 2020). Regarding systematic conservation planning (Álvarez-Romero et al., 2018), cumulative impact assessment prioritizes zones and ecosystems according to their impact level, namely low- and high-impact areas. Low-impact areas (coldspots) can be biodiversity refuges (Jones et al., 2018), whereas high-impact areas (hotspots) define affected ecosystems where restoration and protection can mitigate local pressures (Allan et al., 2019). Similarly, cumulative impact assessment informs government conservation policy by identifying the type of pressures (e.g., climatic and land- or marine-originated threats) affecting ecosystems (Tulloch et al., 2020). For instance, where climate pressure is relevant, local actions and investments are often ineffective because it requires global efforts for mitigation (Halpern et al., 2019; Tulloch et al., 2020), such as The Paris Agreement and COP 26.
Cumulative impact assessments are also central to assessing ecosystem collapse risks, given the protocols established by the IUCN Red List of Ecosystems (Keith et al., 2013), which is on its way to becoming the global standard to guide environmental management. A collapsed ecosystem no longer features its defining biotic and abiotic attributes because these were lost or transformed. These changes lead to biodiversity loss, environmental degradation, and ecosystem service reduction. The Red List assessment protocol requires identifying and describing ecosystem threats to understand their dynamics. These can be analyzed with explicit spatial analysis tools, such as the cumulative impact assessment framework.
Cumulative impact assessment is akin to human footprint assessment since both have similar frameworks (Halpern et al., 2019; Williams et al., 2020). However, the human footprint index focuses exclusively on analyzing the cumulative impacts of anthropic pressures. Current tools to generate threat maps can integrate and display, in full detail, threats of anthropic and climatic origin. Furthermore, joint cumulative impact assessment and human footprint maps have informed on seascape ecosystem connectivity, which has been central to developing conservation projects along the Colombian coastline, currently undertaken by Instituto de Investigaciones Marinas y Costeras José Benito Vives de Andréis (INVEMAR) (Correa Ayram et al., 2020).
Colombia’s coastline is approximately 7,000 km long (INVEMAR, 2020), and its maritime area covers almost 1,000,000 km2, accounting for roughly 50% of the nation’s territory (Díaz and Acero, 2003). Colombia is the only country in South America with coastlines in the Pacific Ocean and the Caribbean Sea, which have different climatic, geomorphological, and oceanographic characteristics (Díaz and Acero, 2003; Blanco-Libreros and Álvarez-León, 2019). Such conditions produce unique areas, some of which were declared world heritage sites (e.g., UNEP and WCMC, 2006; Gómez-López et al., 2012). Colombia’s sea biodiversity occurs and is concentrated in coastal and marine ecosystems, offering services crucial to all territorial actors (Costanza et al., 2014). For instance, these ecosystems mitigate climate change (carbon blue areas), offer protection against natural disasters, increase food security, and favor local and national economies (Castaño-Isaza et al., 2015; Zarate-Barrera and Maldonado, 2015; Rojas et al., 2019).
The Colombian maritime territory is subject to anthropic and climatic threats that impact its marine and coastal ecosystems. Some of these threats have been individually analyzed, for instance, unnatural sedimentation (Restrepo et al., 2006; Restrepo et al., 2016), overfishing (Rueda et al., 2010), and sea warming (INVEMAR, 2017). Only a handful of studies have systematically assessed multiple threats per territory (e.g., Yanes et al., 2017), and even fewer have studied pressures on a national scale (e.g., Alonso et al., 2009). Furthermore, most of Colombia’s oceanic regions are isolated and remain unstudied. For example, little is known about ongoing threats in the UNESCO World Heritage sites of Malpelo (Pacific Ocean) and the Seaflower Biosphere Reserve (Caribbean Sea).
There is, however, evidence of degradation and change in marine and coastal ecosystems. Multiple studies report massive death events in key species (Botero and Mancera-Pineda, 1996; Rodríguez-Ramírez et al., 2010; Jackson et al., 2014), disease occurrence (Navas-Camacho et al., 2010), and habitat transformation or fragmentation (Blanco-Libreros and Álvarez-León, 2019, Diaz, et al 2003), among others. Therefore, some ecosystems have arguably lost more than half of their historical area (e.g., Garzón-Ferreira and Díaz, 2003; Villate Daza et al., 2020) due to severe alterations in their biotic and abiotic components (e.g., Blanco-Libreros and Álvarez-León, 2019; INVEMAR, 2020b), thus increasing their susceptibility to collapse (total transformation of ecosystem identity) (Uribe et al., 2020a).
This study analyzes, for the first time, the extent of current anthropic and climatic threats with their impacts on Colombia’s marine and coastal ecosystems using the cumulative impact assessment framework. Employed impact maps identify ecosystems with high conservation concerns and in need of restorative action. Because threat analysis is essential to understand an ecosystem’s risk of collapse (Keith et al., 2013), this assessment constitutes the threat description component of the Red List of marine and coastal ecosystems (Uribe et al., 2020b), which is currently being developed synergistically with this research.
2 Materials and methods
2.1 Study area
The marine and coastal territories of Colombia cover 990,000 km2 of the country extension, distributed across the Pacific (415.800 km2) and Caribbean (574.200 km2) zones of Colombia (Figure 1). To recognize the relevant ecological and biogeographic differences among these areas, these were further divided into the following categories: ecozones, ecosystems, and environments. These categories were created following the marine and Coastal Red List classification system of Colombia (Uribe et al., 2020b), which facilitates the integration of these results with current threat analysis and risk assessment outcomes.
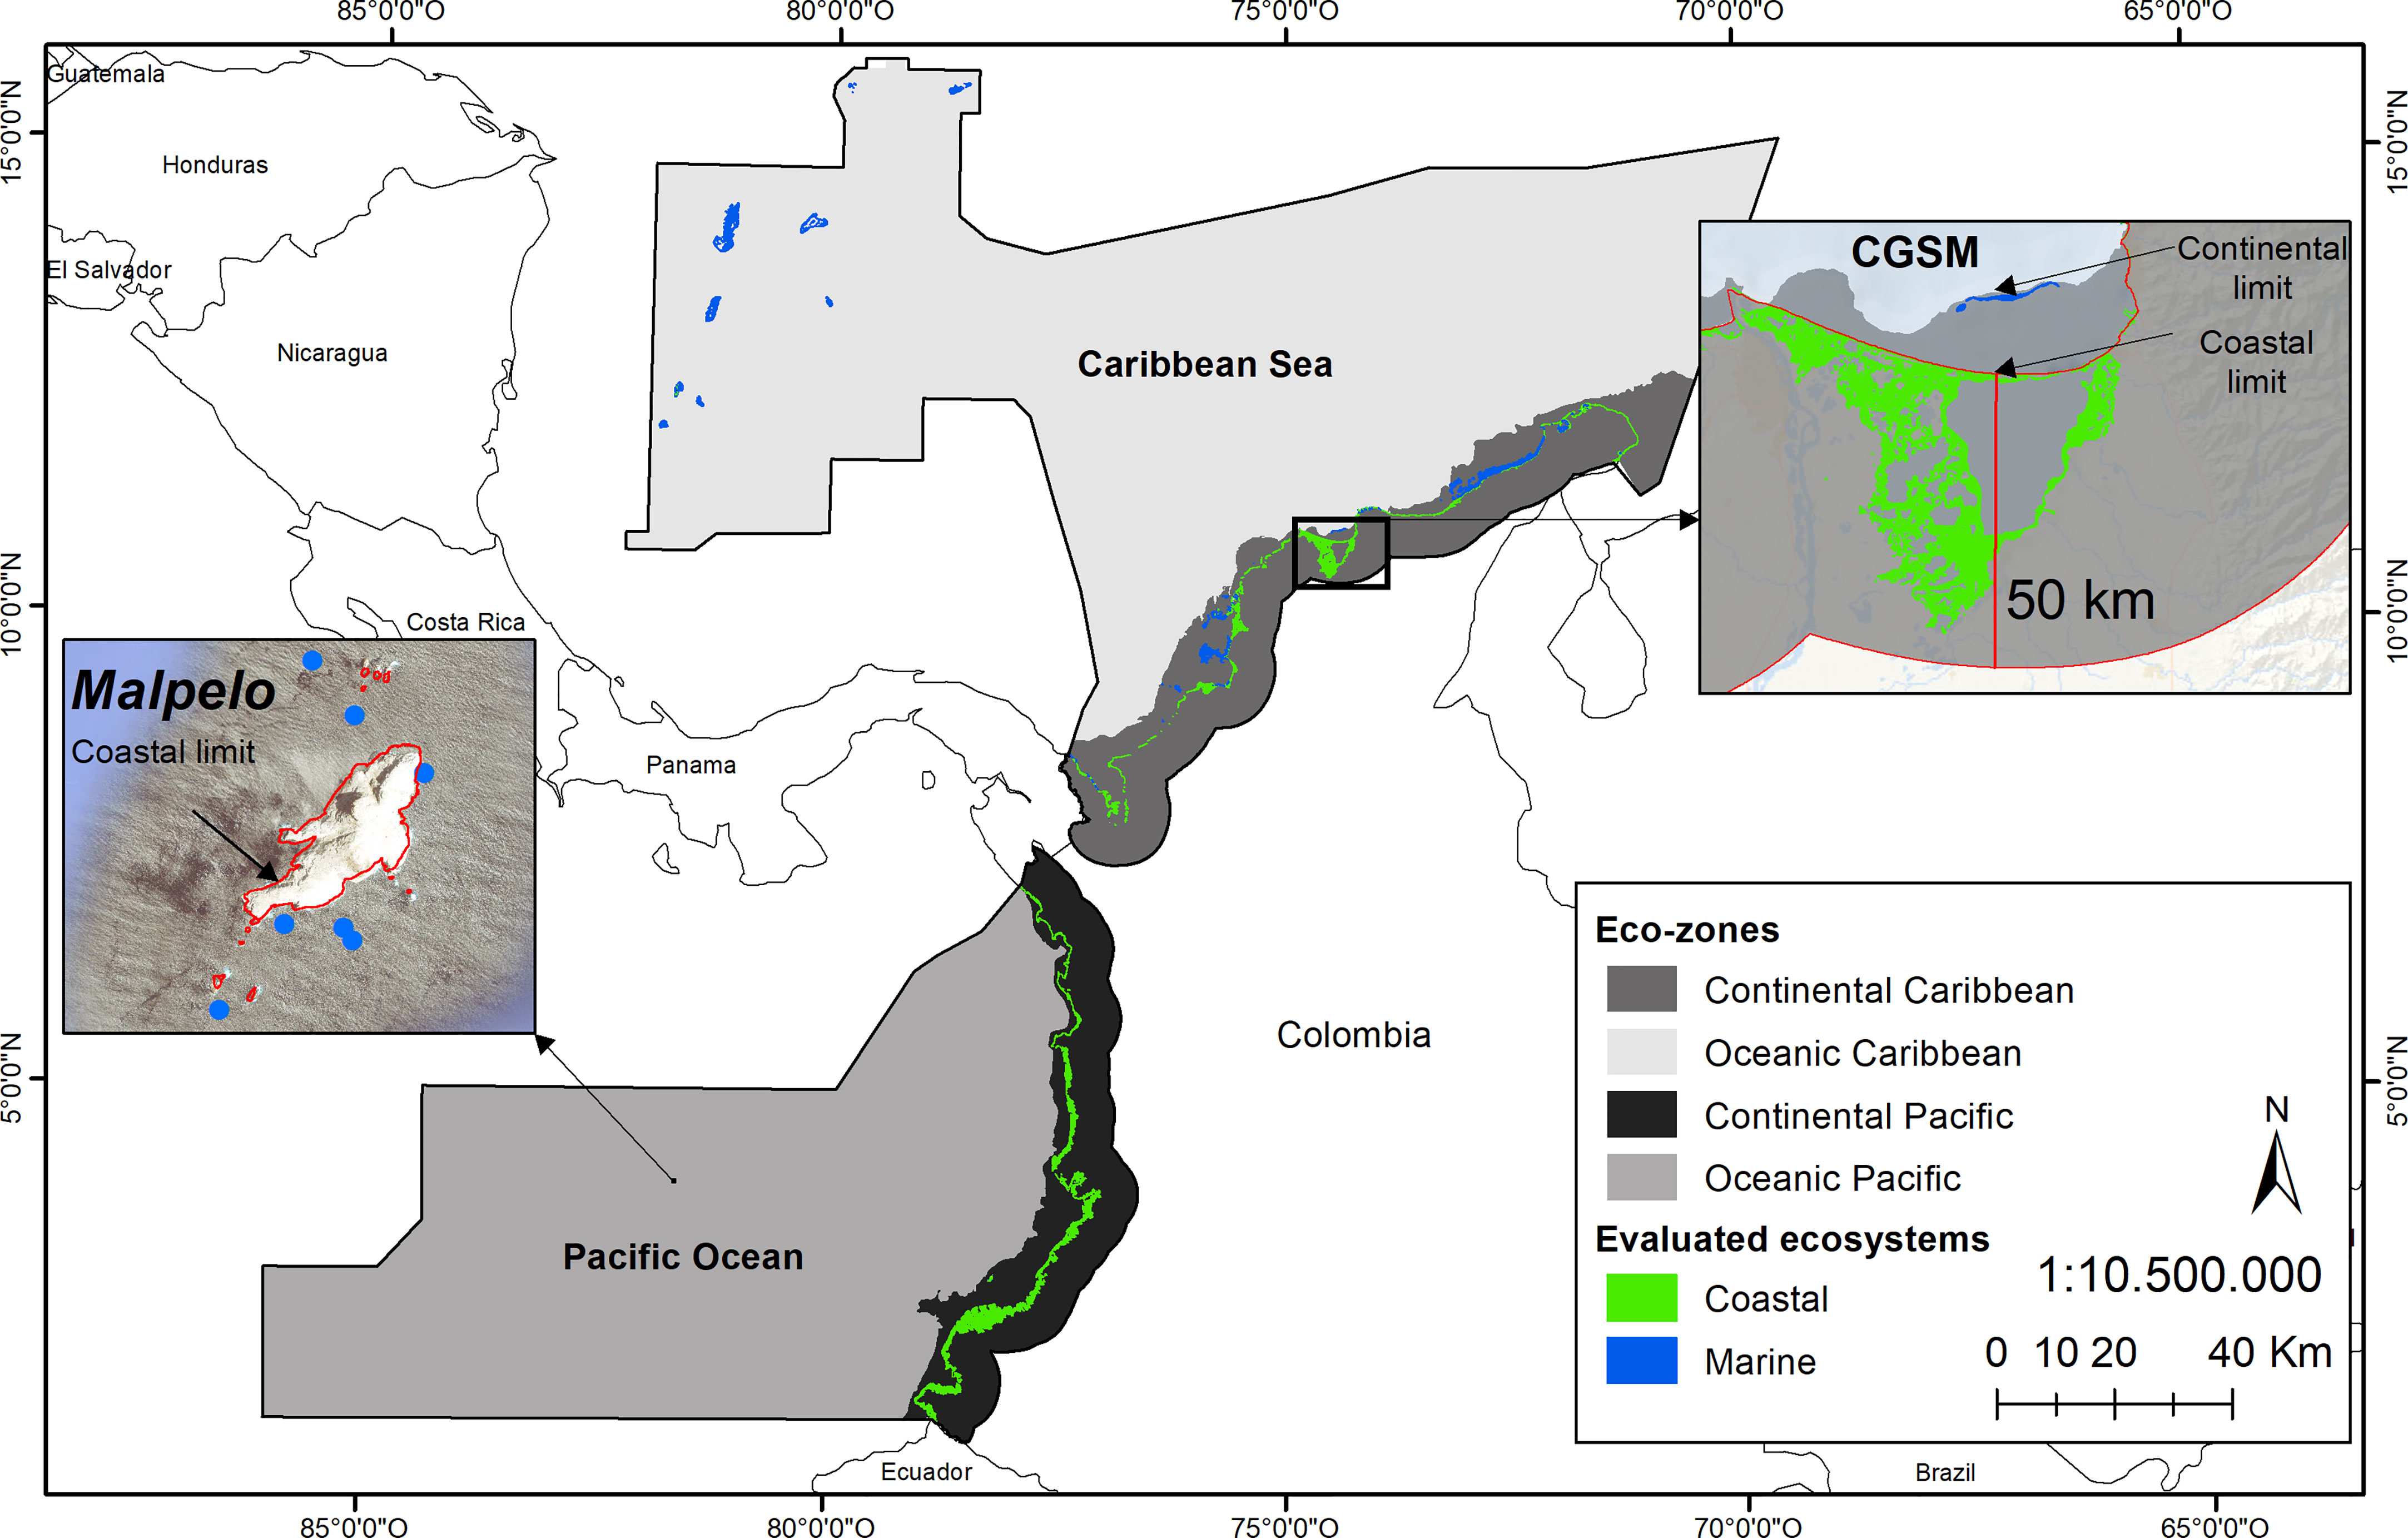
Figure 1 Study area. This map shows the four ecozones and the location of the evaluated coastal and marine ecosystems, including the mangrove coastal area of the Ciénaga Grande of Santa Marta and the marine ecosystem locations of Malpelo Island. The coastal limit (red line) encloses coastal environments, and the continental limit (200 m isobath) encloses continental ecozones.
2.2 Ecozones
Four ecozones were recognized: Oceanic Caribbean, Continental Caribbean, Oceanic Pacific, and Continental Pacific (Figure 1). These divisions were made based on the characteristics of the ecology, geology, geography, and climate heterogeneity of each region (Spalding et al., 2007; Robertson and Cramer, 2009; Robertson and Cramer, 2014). They also agree with the physiographic units and ecozones of Colombia (Díaz and Acero, 2003; IDEAM et al., 2007; Alonso et al., 2009) established by INVEMAR. The two continental ecozones ranged from the 200-m-deep isobath (continental shelf) to the inland limit of the coastal area, and the two oceanic ecozones constitute the region out of the continental shelf to the maritime frontiers of Colombia (Alonso et al., 2009). The description of each ecozone is presented in the Supplementary Material.
2.3 Ecosystems
According to the map of marine and coastal ecosystems of Colombia, at least 20 ecosystem types exist within the study area (IDEAM et al., 2007; IDEAM, IAvH, et al., 2017). Nevertheless, only five were selected since they fulfilled minimum information requirements. These were coral ecosystems, seagrass meadows, cohesive rocky shore, mangrove, and sandy beaches. Additionally, for each ecosystem, a description was made according to the literature and the records of different experts at INVEMAR (see Supplementary Material). For the remaining 15 non-included ecosystems (e.g., estuaries, salt marshes, intertidal muds, deep coral reefs, sand beds, rocky reefs, pelagic waters, and deep waters), available information was insufficient to conduct a cumulative impact assessment; not even unified accepted cartographies for some of them were available.
2.4 Environments
The study area was divided into marine and coastal environments, according to the national policy “National environmental policy for the sustainable development of the oceanic spaces and the coastal and insular areas of Colombia” (MADS, 2000). As stated by this policy, the terrestrial part of the coastal environment comprehends the area between the land–water interface and the 2-km inland interface. Regardless of the inland extensions of mangrove areas, these were fully considered as coastal environments (MADS, 2000). In Colombia, the most inland limit mangrove extension is located at the coastal lagoon system of Ciénaga Grande de Santa Marta (CGSM) where the mangrove cover extends up to 50 km inland. Therefore, for operational processing, all the coastal environment was determined at that distance (Figure 1). On the other hand, the marine environment was delimited between the coastal tide limit and the maritime frontiers of Colombia.
This classification should not be confused with the ecozone classification since they are not redundant. Oceanic ecozones are perceived as only containing marine environments; however, there are islands in oceanic ecozones that generate coastal environments (Figure 1 Malpelo zoom). Therefore, the geographical limits of oceanic–marine ecoregions and continental–coastal environments are not the same (Figure 1 CGSM zoom). As explained in Section 2.6.1, the environment classification system was also maintained to match the technical aspects of threat mapping.
2.5 Valuation units
Valuation units were defined by converging the three previously described study area divisions (ecozone, ecosystem, and environment). Therefore, a total of 15 valuation units were identified, but just 13 met the minimum information requirements for assessment (Table 1). Additionally, an extra division at the northern and southern edges of the Colombian continental Pacific mangrove (from Cabo Corrientes to the Panama border and from Cabo Corrientes to the Equatorian border, respectively) was made for two reasons: (i) there is a clear environmental difference between the north and south edges that generates diverse mangrove features (Blanco-Libreros and Álvarez-León, 2019) and (ii) the existence of high-resolution data to evaluate threats for these valuation units. After modifying the ecosystem map according to the established valuation units, the resulting vector layer was transformed to a raster file of 0.5 km * 0.5 km resolution.

Table 1 Resulting valuation units for threat analysis.
2.6 Threat analysis
All the procedures described below were adapted from the works by Halpern et al. (2007; 2008; 2015). In this study, two variables were estimated (at a pixel level) for assessments: TL and impact level. The steps taken for information review and data geoprocessing are also explained in the following subsections. This assessment does not consider all the threats present in the study area mainly due to lack of information, but it attempts to include a relevant sample of them.
2.6.1 Data selection
National and international virtual data platforms (e.g., Global Biodiversity Information Facility (GBIF), Ocean Biodiversity Information System (OBIS), Coral Reef Watch, and Intergovernmental Panel on Climate Change (IPCC), among others) were reviewed to obtain spatial information about the most important threats to the marine and coastal ecosystems (Table 2). Data were selected following three criteria: (i) optimal temporal and spatial resolution, (ii) updated information, and (iii) full coverage in the study area. Likewise, the ranking of Halpern et al. (2007) was used to prioritize and select the threats according to their importance. The 12 spatial explicit threat layers were assigned to coastal and marine domains according to their applicability (Table 3). Since there are threats that are relevant to both environments (e.g., port activity) and others that are not (as explained below), a total of eight threats were assigned for each one.

Table 2 Descriptions of the 12 chosen threats.
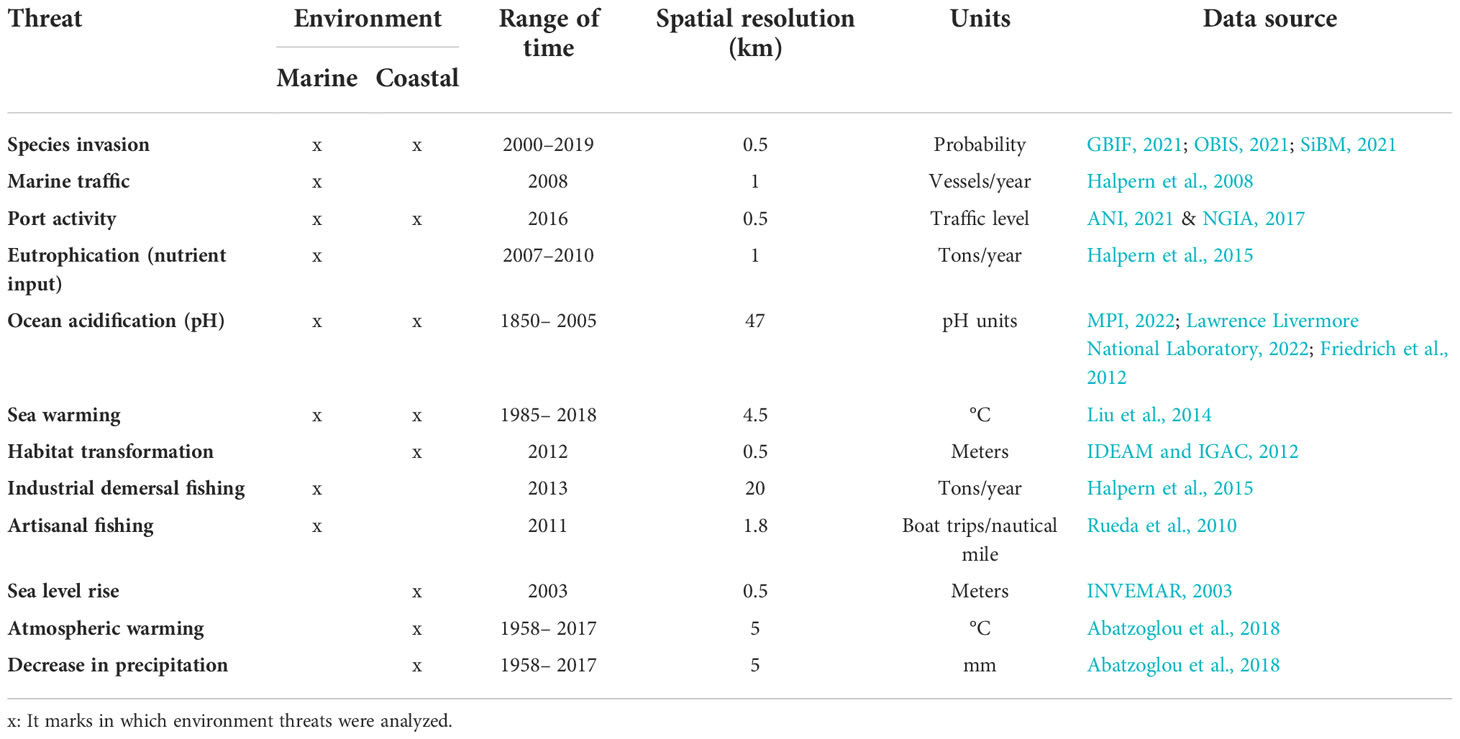
Table 3 Technical features of the 12 analyzed threats.
This division by environments was proposed because there are threats that cannot be mapped in the same way for marine and coastal areas. This is due to, at least, three non-mutually exclusive reasons: (i) spatial dynamics are not evident or explicit for specific environments, (ii) there is no theoretical support to quantified and spatialized threats for coastal or marine territories, and (iii) data may not be available. In that regard, Table 3 shows which threat was mapped for a specific environment. However, for those cases where a threat was not analyzed, it did not mean that it was absent from that specific environment.
2.6.2 Threat level
TL corresponds to the intensity (as a value) with which that threat looms on a given map pixel. For example, a map pixel that has a marine traffic of 30 vessels/year is more threatened than a pixel with 5 vessels/year. However, the methodological framework used by cumulative impact assessment requires combining multiple threats on one map. Therefore, geoprocessing was required to enable the union of the spatial layers generated by each pressure. The original information of the 12 layers was modified using Python 3.8 and ArcGIS 10.6. No major adjustments were necessary for marine traffic, eutrophication, and industrial demersal fishing since this information was already modified and used in a similar model at a global scale by Halpern et al. (2008; 2015). In contrast, the raw data for the nine remaining layers were subjected to specific adjustments (Supplementary Material), mainly consisting of transformations to create quantitative and spatially continuous (~100% study area cover) raster layers.
A logarithmic transformation was applied (Equation 1) to reduce outlier influence on the threat value scale. For instance, eutrophication by fertilizers (nutrient input) had unusually high values in the Magdalena River delta (Supplementary Material). Although these values are coherent with reality since this is the largest river flowing into the Caribbean Sea (Restrepo et al., 2006), this outlier nutrient input values render the other values of lesser magnitude, but equally relevant, such as the eutrophication level of smaller rivers (e.g., Atrato and Sinú river deltas), almost negligible. Through this transformation, low and intermediate values, not perceived at the original scale, acquire a higher magnitude (Supplementary Material). This process also applies to other outliers such as dispersed atypical pixels (outliers created from raw data errors) that are not easily seen in the layers but that modify and skew TLs.
Equation 1. Log transformation of threat i intensity (Di) using raw threat intensity values for that threat (Ti) on a pixel of resolution 0.5 km* 0.5 km. Adapted from Halpern et al. (2015).
Each transformed pressure was rescaled within a range of 0 to 1 to improve value comparison, where 1 is the highest threat intensity and 0 is the absence thereof. All layers were transformed to match in the extension, the resolution (0.5 km * 0.5 km pixel size), the coordinate system (UTM 18N), and the file format (tiff raster). Therefore, the cumulative TL (DC) consists of the sum of m Di threat intensity values looming on each pixel (Equation 2). For our purpose, m = 12 threats were considered. Additionally, to differentiate missing data and zero values, the sum was adjusted so that pixels with missing data (NAs) in at least one of the threat layers were not considered for DC calculation. Thus, when the threat map reports zero, or low values, it is because the intensity of the threats is indeed low and not because data are missing.
Equation 2. Cumulative TL (DC) calculation for a pixel of resolution 0.5 km * 0.5 km. Adapted from Halpern et al. (2015).
In order to compare different map locations, cumulative threat map results were grouped by ecozones, physiographic units (explained in Section 2.2), and environments. Additionally, TL values were arranged into percentiles to identify map spots with extreme TLs. Pixels with threat values below the second percentile (P2) were considered coldspots. In other words, 2% of the pixels on the map experience the lowest TL. Conversely, at the other end, 2% of the pixels on the map experience the highest threat values [those above the 98th percentile (P98)] and were considered hotspots.
2.6.3 Impact level
The cumulative impact level (ILC) involves TL and ecosystem vulnerability (Equation 3). For this purpose, the vulnerability matrix of Halpern et al. (2007) was used and modified (Supplementary Material) to obtain the product of the log-transformed threat intensity value (Di) and the vulnerability weight of ecosystem j under threat i (μi,j). This product is further modified by factor Ej, indicating the presence (1) or absence (0) of ecosystem j at a given pixel location on the map. Therefore, a total of m = 12 threats and n = 5 marine and coastal ecosystems were considered to obtain the cumulative impact level in this study. Expert opinion surveys were reviewed to estimate vulnerability values, which scored metrics such as the functional impact, resistance, and ecosystem recovery from threat impacts (Halpern et al., 2007; Halpern et al., 2015). Although the used weights represent global vulnerability values, they are useful proxies for local values since no national vulnerability weights exist for marine and coastal marine Colombian ecosystems. The construction of a local vulnerability matrix requires future efforts to achieve a national consensus.
Equation 3. Cumulative impact level (ILC) calculated for each pixel of resolution 0.5 km* 0.5 km. Adapted from Halpern et al. (2015).
3 Results
Results are presented according to the calculated variables: TL and impact level. TL explains outcomes for ecozones, environments, and physiographic units. Moreover, identified hotspots and coldspots in the study area highlight relevant threat areas for the Colombian Caribbean and Pacific regions. For the impact level, results are shown by the ecosystem, explaining the intensity and extension of the impacts of each threat assessed.
3.1 Threat level
The obtained cumulative threat map (Figure 2) shows the TL on a 0.5-km-resolution pixel. A total of 970,840 km2 was analyzed on the map, covering 99% of the Colombian marine and coastal extension defined as the study area. The remaining 1% represents pixels with at least one unmapped threat due to processing errors. The scale of threat values ranged between 0.63 and 5.43, with an average of 1.79 and a standard deviation of 0.27. Consequently, the highest TLs do not account for the majority of pixels on the map compared with intermediate values abundant across the territory.
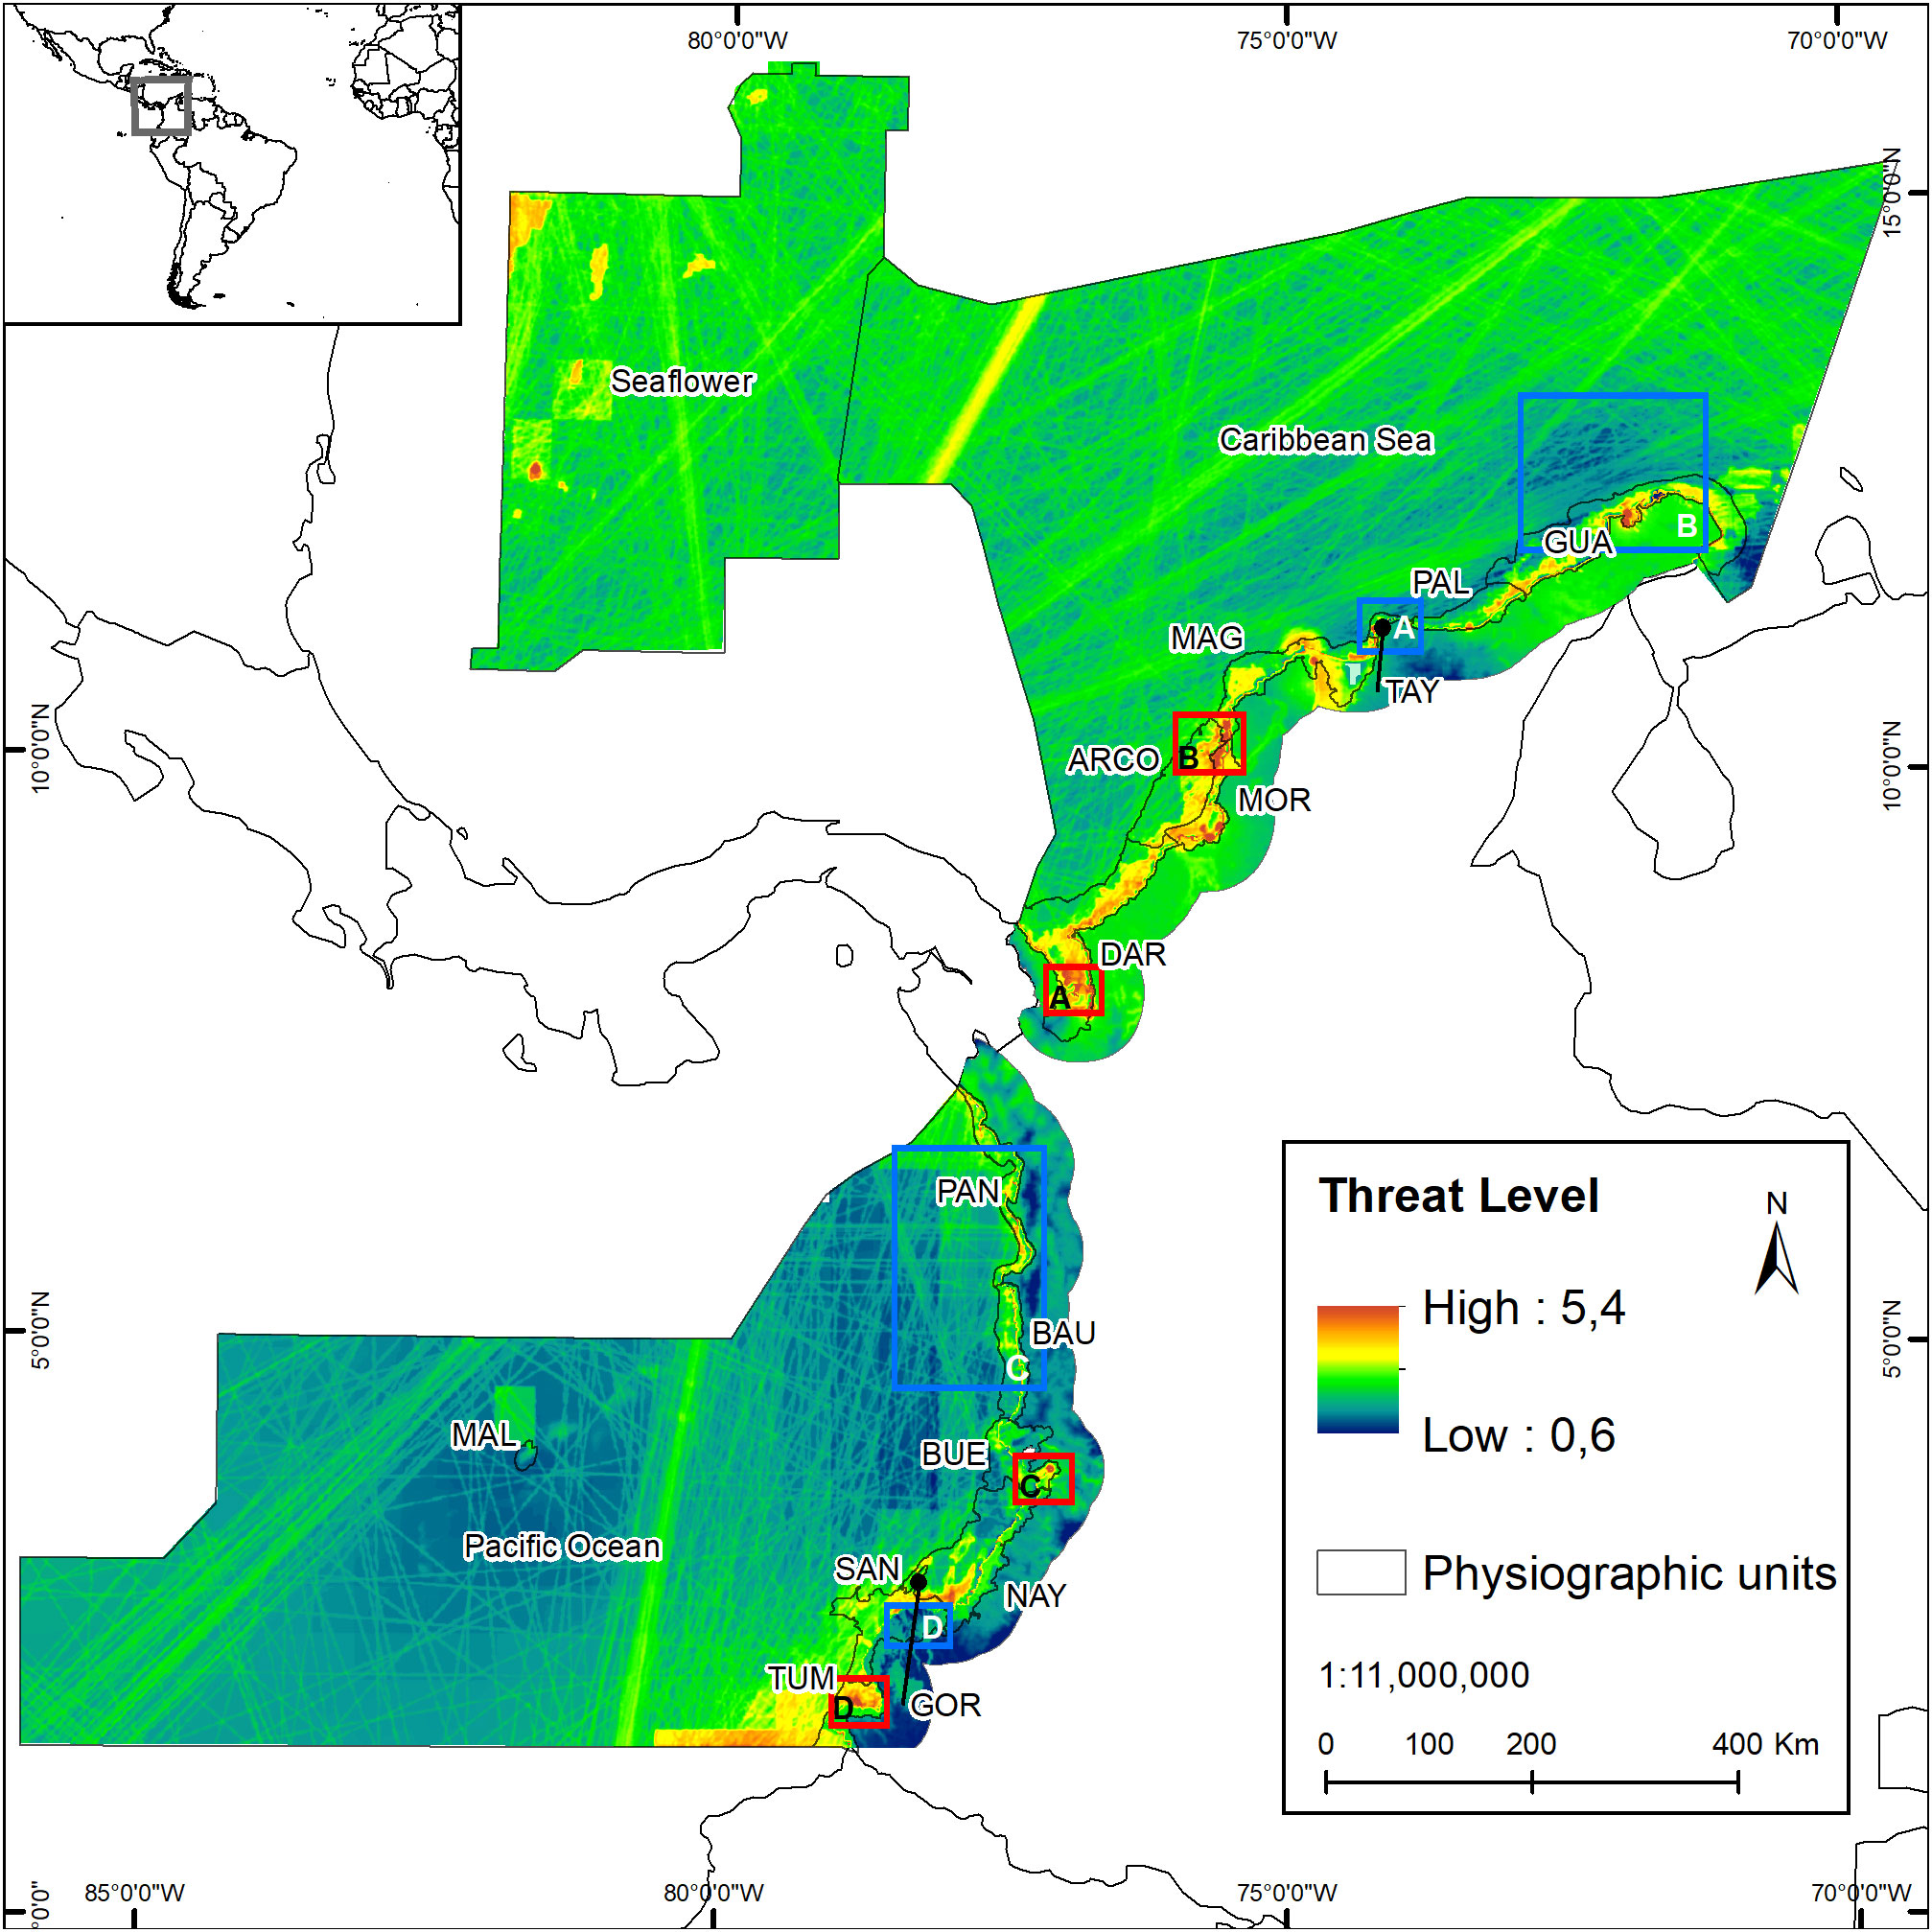
Figure 2 Cumulative threat map. Sum of all individual threat levels (TLs) in marine and coastal environments. Black polygons represent physiographic units according to INVEMAR (full names are provided in Table 4). Threat hotspots (red squares) and coldspots (blue squares) are shown within the study area and identified by letters, as shown in Figures 3 and 4.
3.1.1. Ecozones
The Continental Caribbean ecozone was the most threatened, followed by the Oceanic Caribbean ecozone (Table 4). The average threat values of these Caribbean ecozones were higher than those of the Pacific ones. Likewise, TLs were grouped according to the physiographic units proposed by INVEMAR (Alonso et al., 2009). These facilitated connecting results with other classifications and allowed for more specific identification since physiographic units are the subdivisions of each ecozone. The physiographic units of the Gulf of Morrosquillo (MOR) and Darien (DAR) experienced the highest TLs (Table 4).
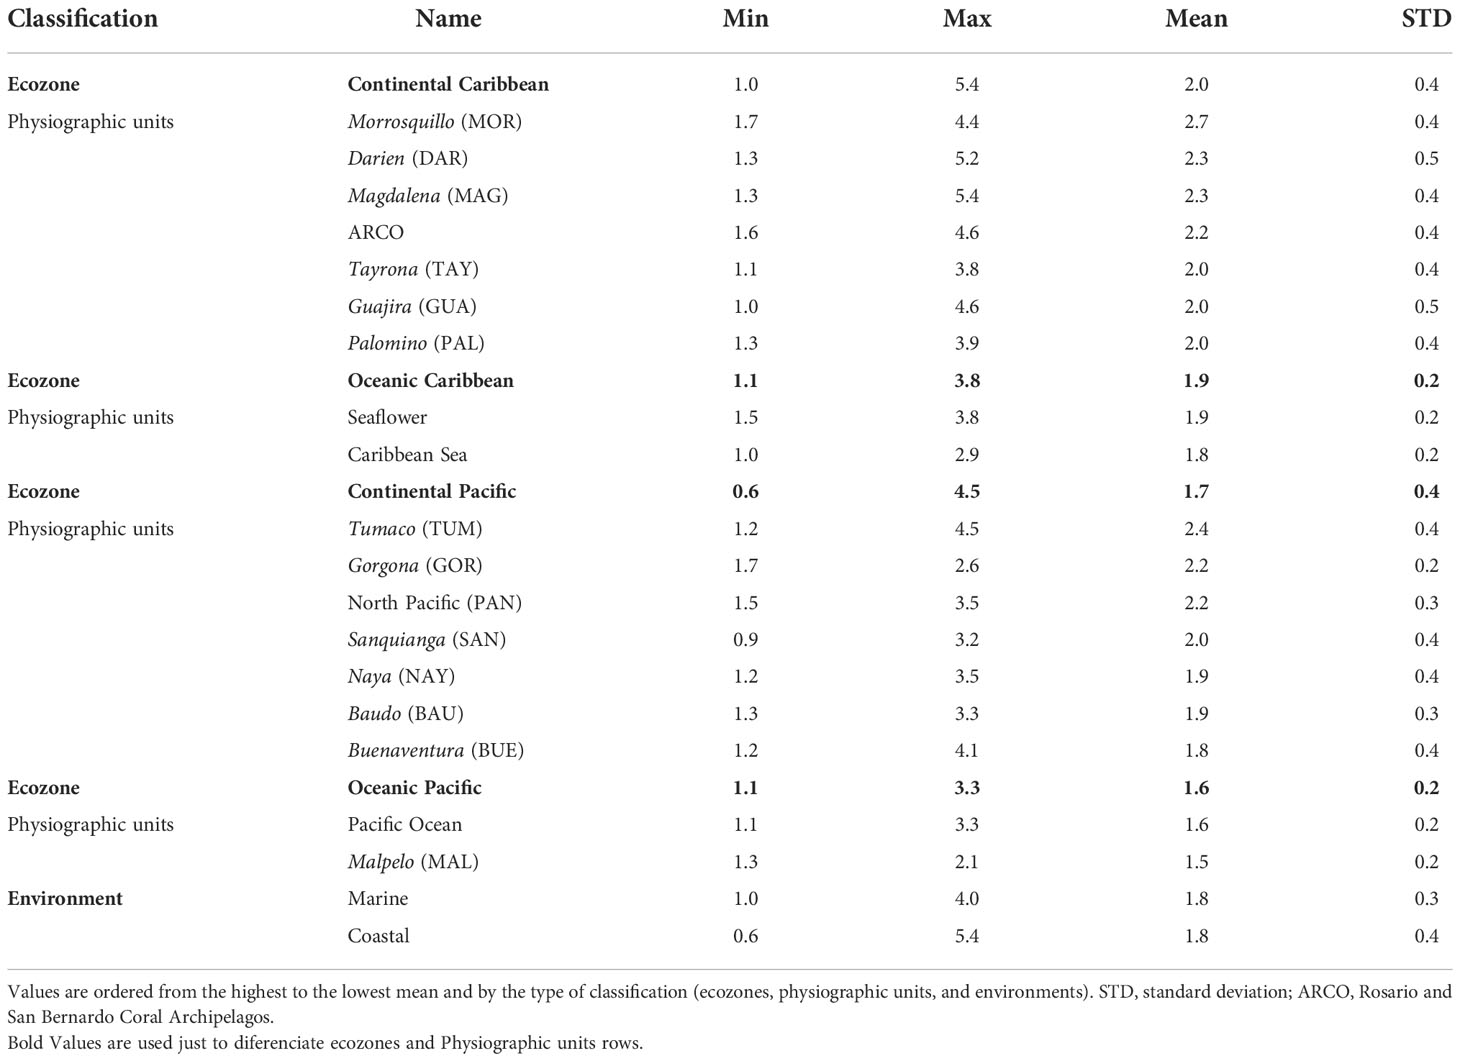
Table 4 Threat level by ecozone and environment.
Notably, the oceanic ecozones (outside the continental shelf) were less threatened than the continental ecozones because their average and minimum values were the lowest in the study area. The Pacific Ocean ecozone and, more in detail, the Malpelo physiographic unit were the least threatened (Table 4). However, even in the most remote and distant areas of the Oceanic Pacific ecozone, no single pixel experienced a TL of 0.
3.1.2. Environments
Cumulative TL values (Dc), reported for each marine and coastal environment, were obtained with eight threats (Table 3), which means that a maximum cumulative TL of 8 is possible if all individual threats have a maximal Di (log-transformation threat intensity) of 1. The highest cumulative TL values (Dc) of 4.0 and 5.4 occurred in marine and coastal environments, respectively (Figure 2). These corresponded to 50% and 67% of the possible maximum accumulated TL values. Thus, the coastal environments experienced the highest TL in the study area. No pristine (i.e., threat-free) pixel was identified on the map since the minimum cumulative threat value was 0.6 for both environments. All marine and coastal environments analyzed in this study were affected by at least one of the mapped variables.
3.1.3. Threat hotspots and coldspots
To increase the level of detail, the cells with the highest threat values (above percentile 98), i.e., hotspots, were identified at the pixel level. The ports of Turbo and Cartagena (Figures 3A, B) were the sites with the highest TL values in the entire Colombian Caribbean. In the continental Pacific, the localities near the ports of Tumaco and Buenaventura were subject to the highest TLs (Figures 3C, D). Similarly, along the marine–coastal limit (land–water interface zone), TLs were high, a situation observed on most of the continental coasts. In this area, climatic and anthropogenic threats to both environments were generally high. For example, sea warming is more intense in the shallowest areas of the sea, and anthropogenic activities, such as port activity, are heavier than in any other part of the coastal area.
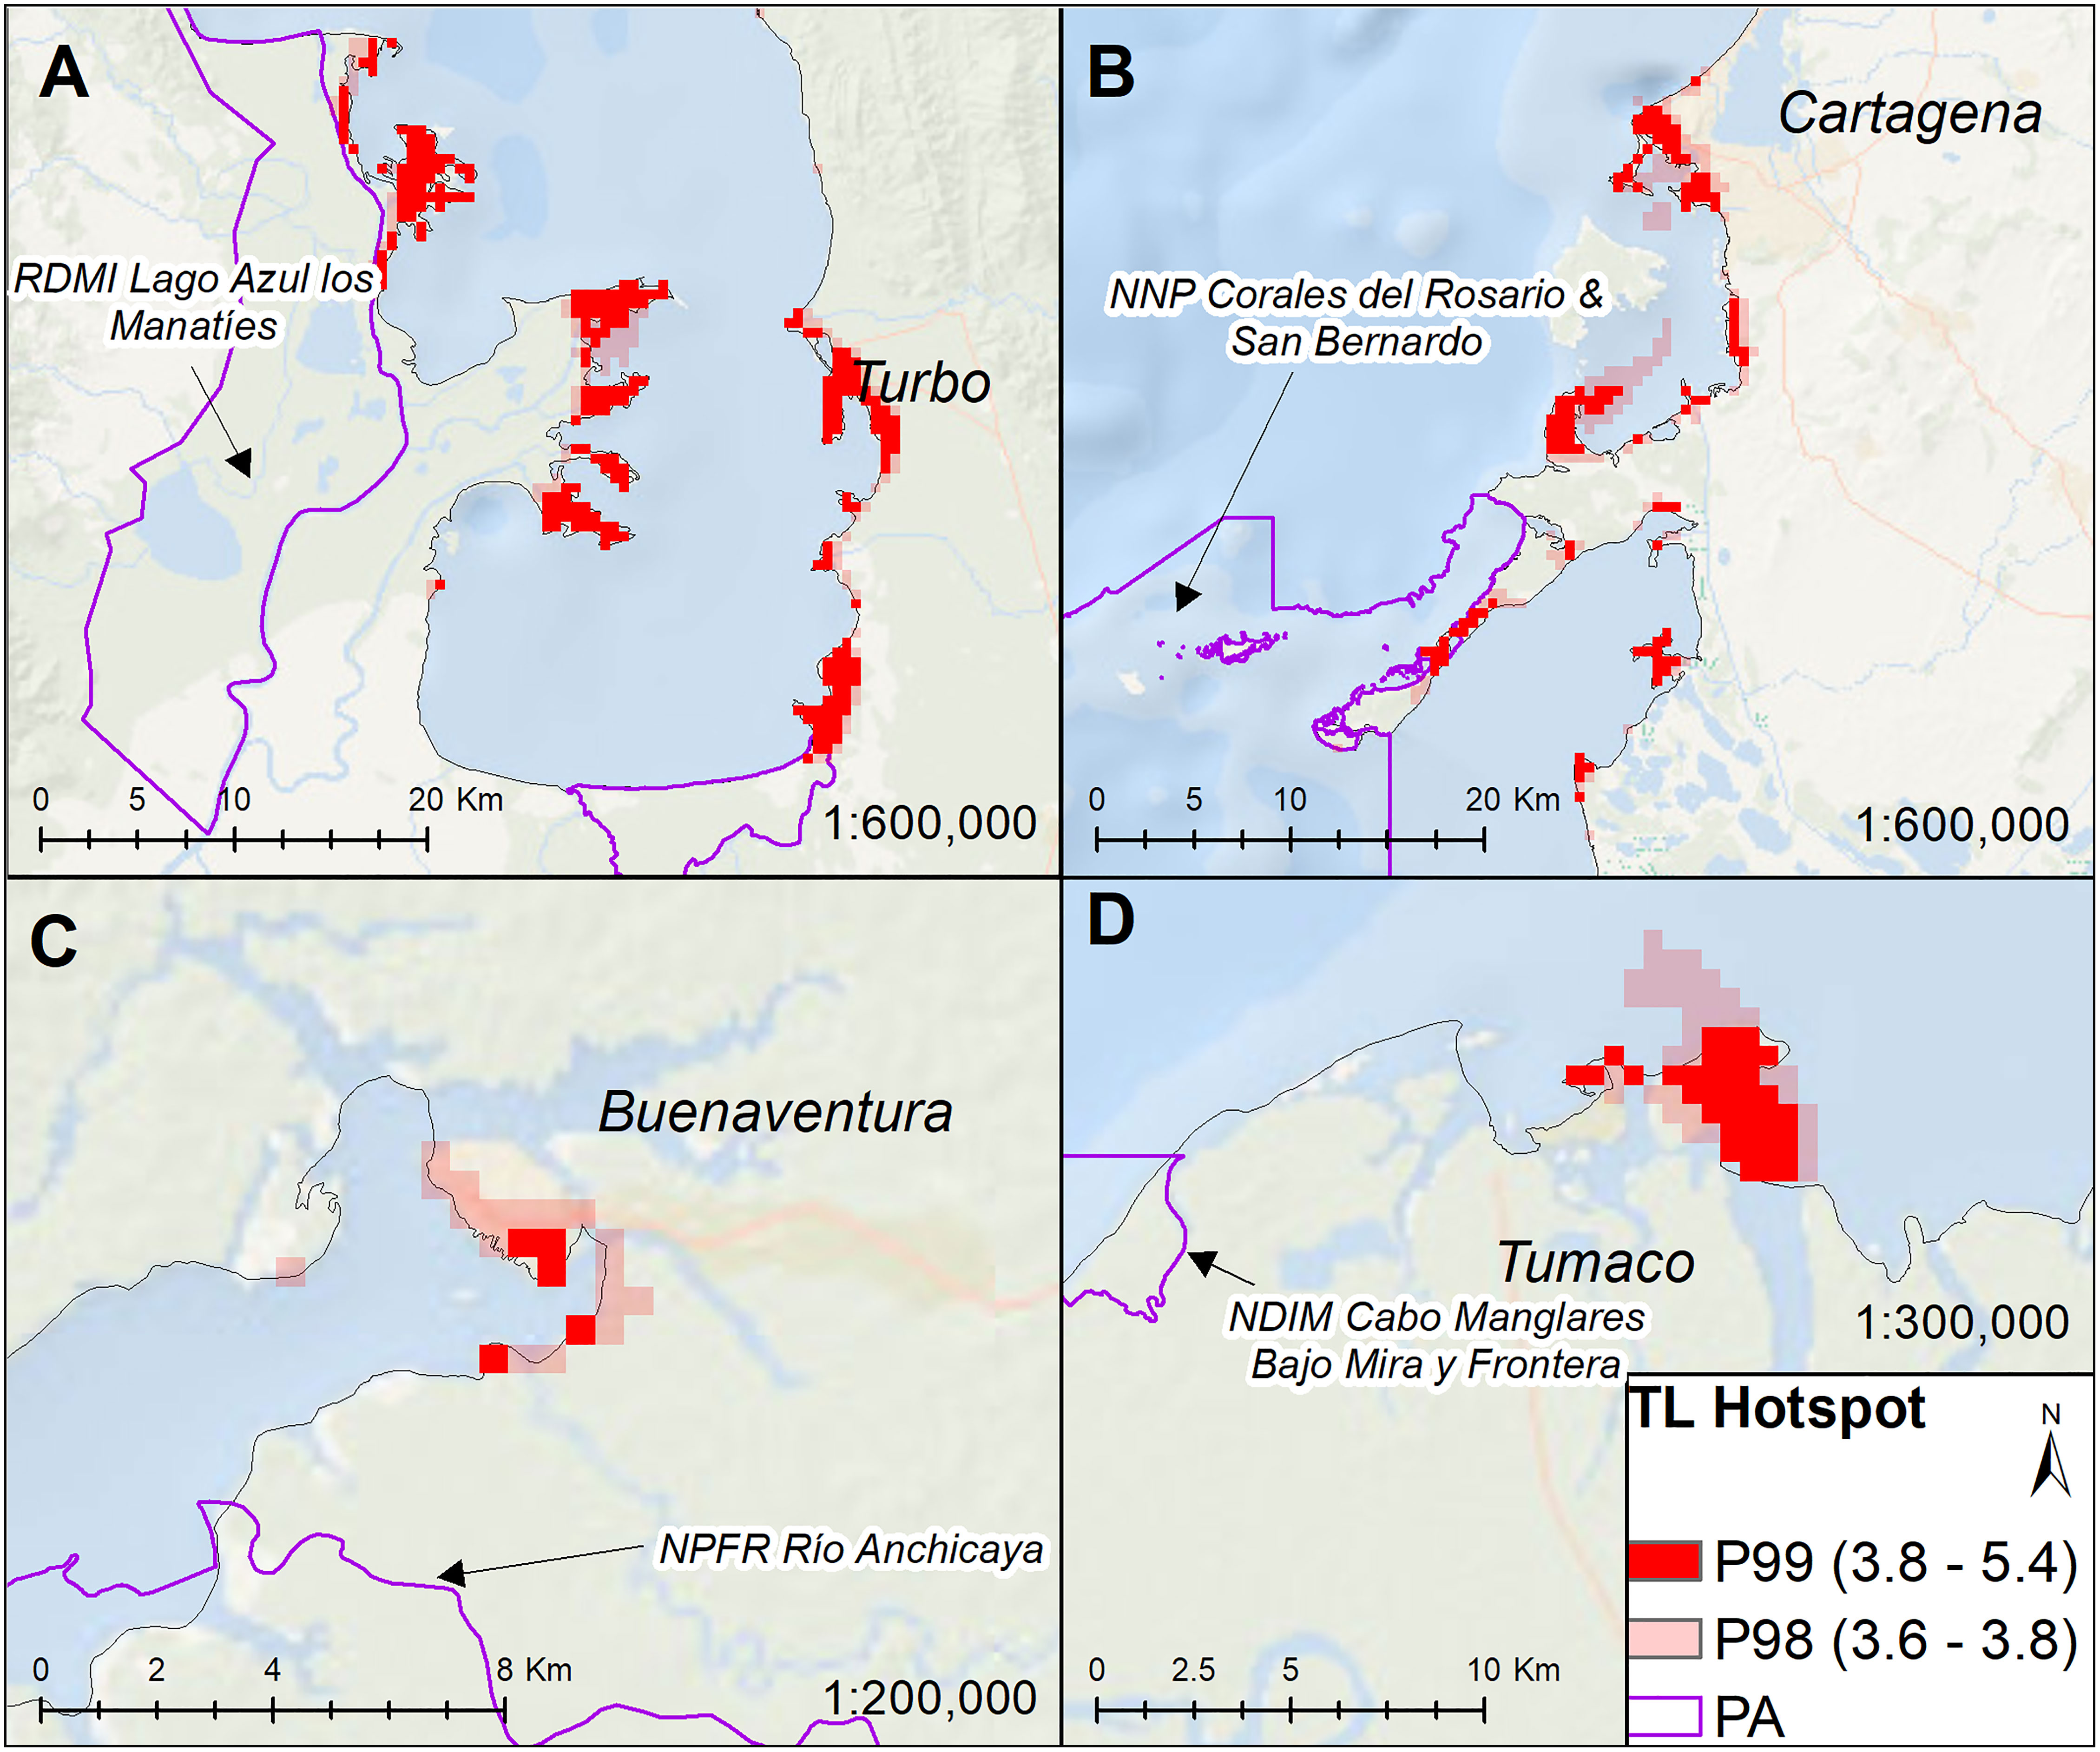
Figure 3 Threat hotspots. (A): Turbo—Antioquia, (B): Bahía de Cartagena—Bolívar, (C): Buenaventura—Valle del Cauca, and (D): Tumaco—Nariño. The location of these hotspots within the national territory of Colombia is shown in Figure 2. TL values (in brackets) were ranked by Percentile 98 (P98) and Percentile 99 (P99) revealing threat hotspots. RDIM, Regional District of Integrated Management; NDIM, National District of Integrated Management; FFS, Fauna and Flora Sanctuary; NPFR, National Protective Forest Reserve; RNP, Regional Natural Park; PA, protected area.
In the Caribbean, the least threatened pixels (i.e., coldspots) were found mainly in the northern Magdalena (MAG) and La Guajira (GUA) physiographic units. Within the former, NNP Tayrona (Figure 4A) entailed the majority of coldspots, and, in the latter, the lowest TL values occurred near the continental shelf and in the Bahía Hondita zone (Figure 4B). Both areas (MAG and GUA) also revealed a low-average ecozone TL (Table 4). Locations in the Pacific showed the localized aggregates of low TL. These correspond chiefly to protected areas and their adjacent zones, for instance, the Gulf of Tribugá (Figure 4C) in the North Pacific and NNP Sanquianga in the South Pacific (Figure 4D).
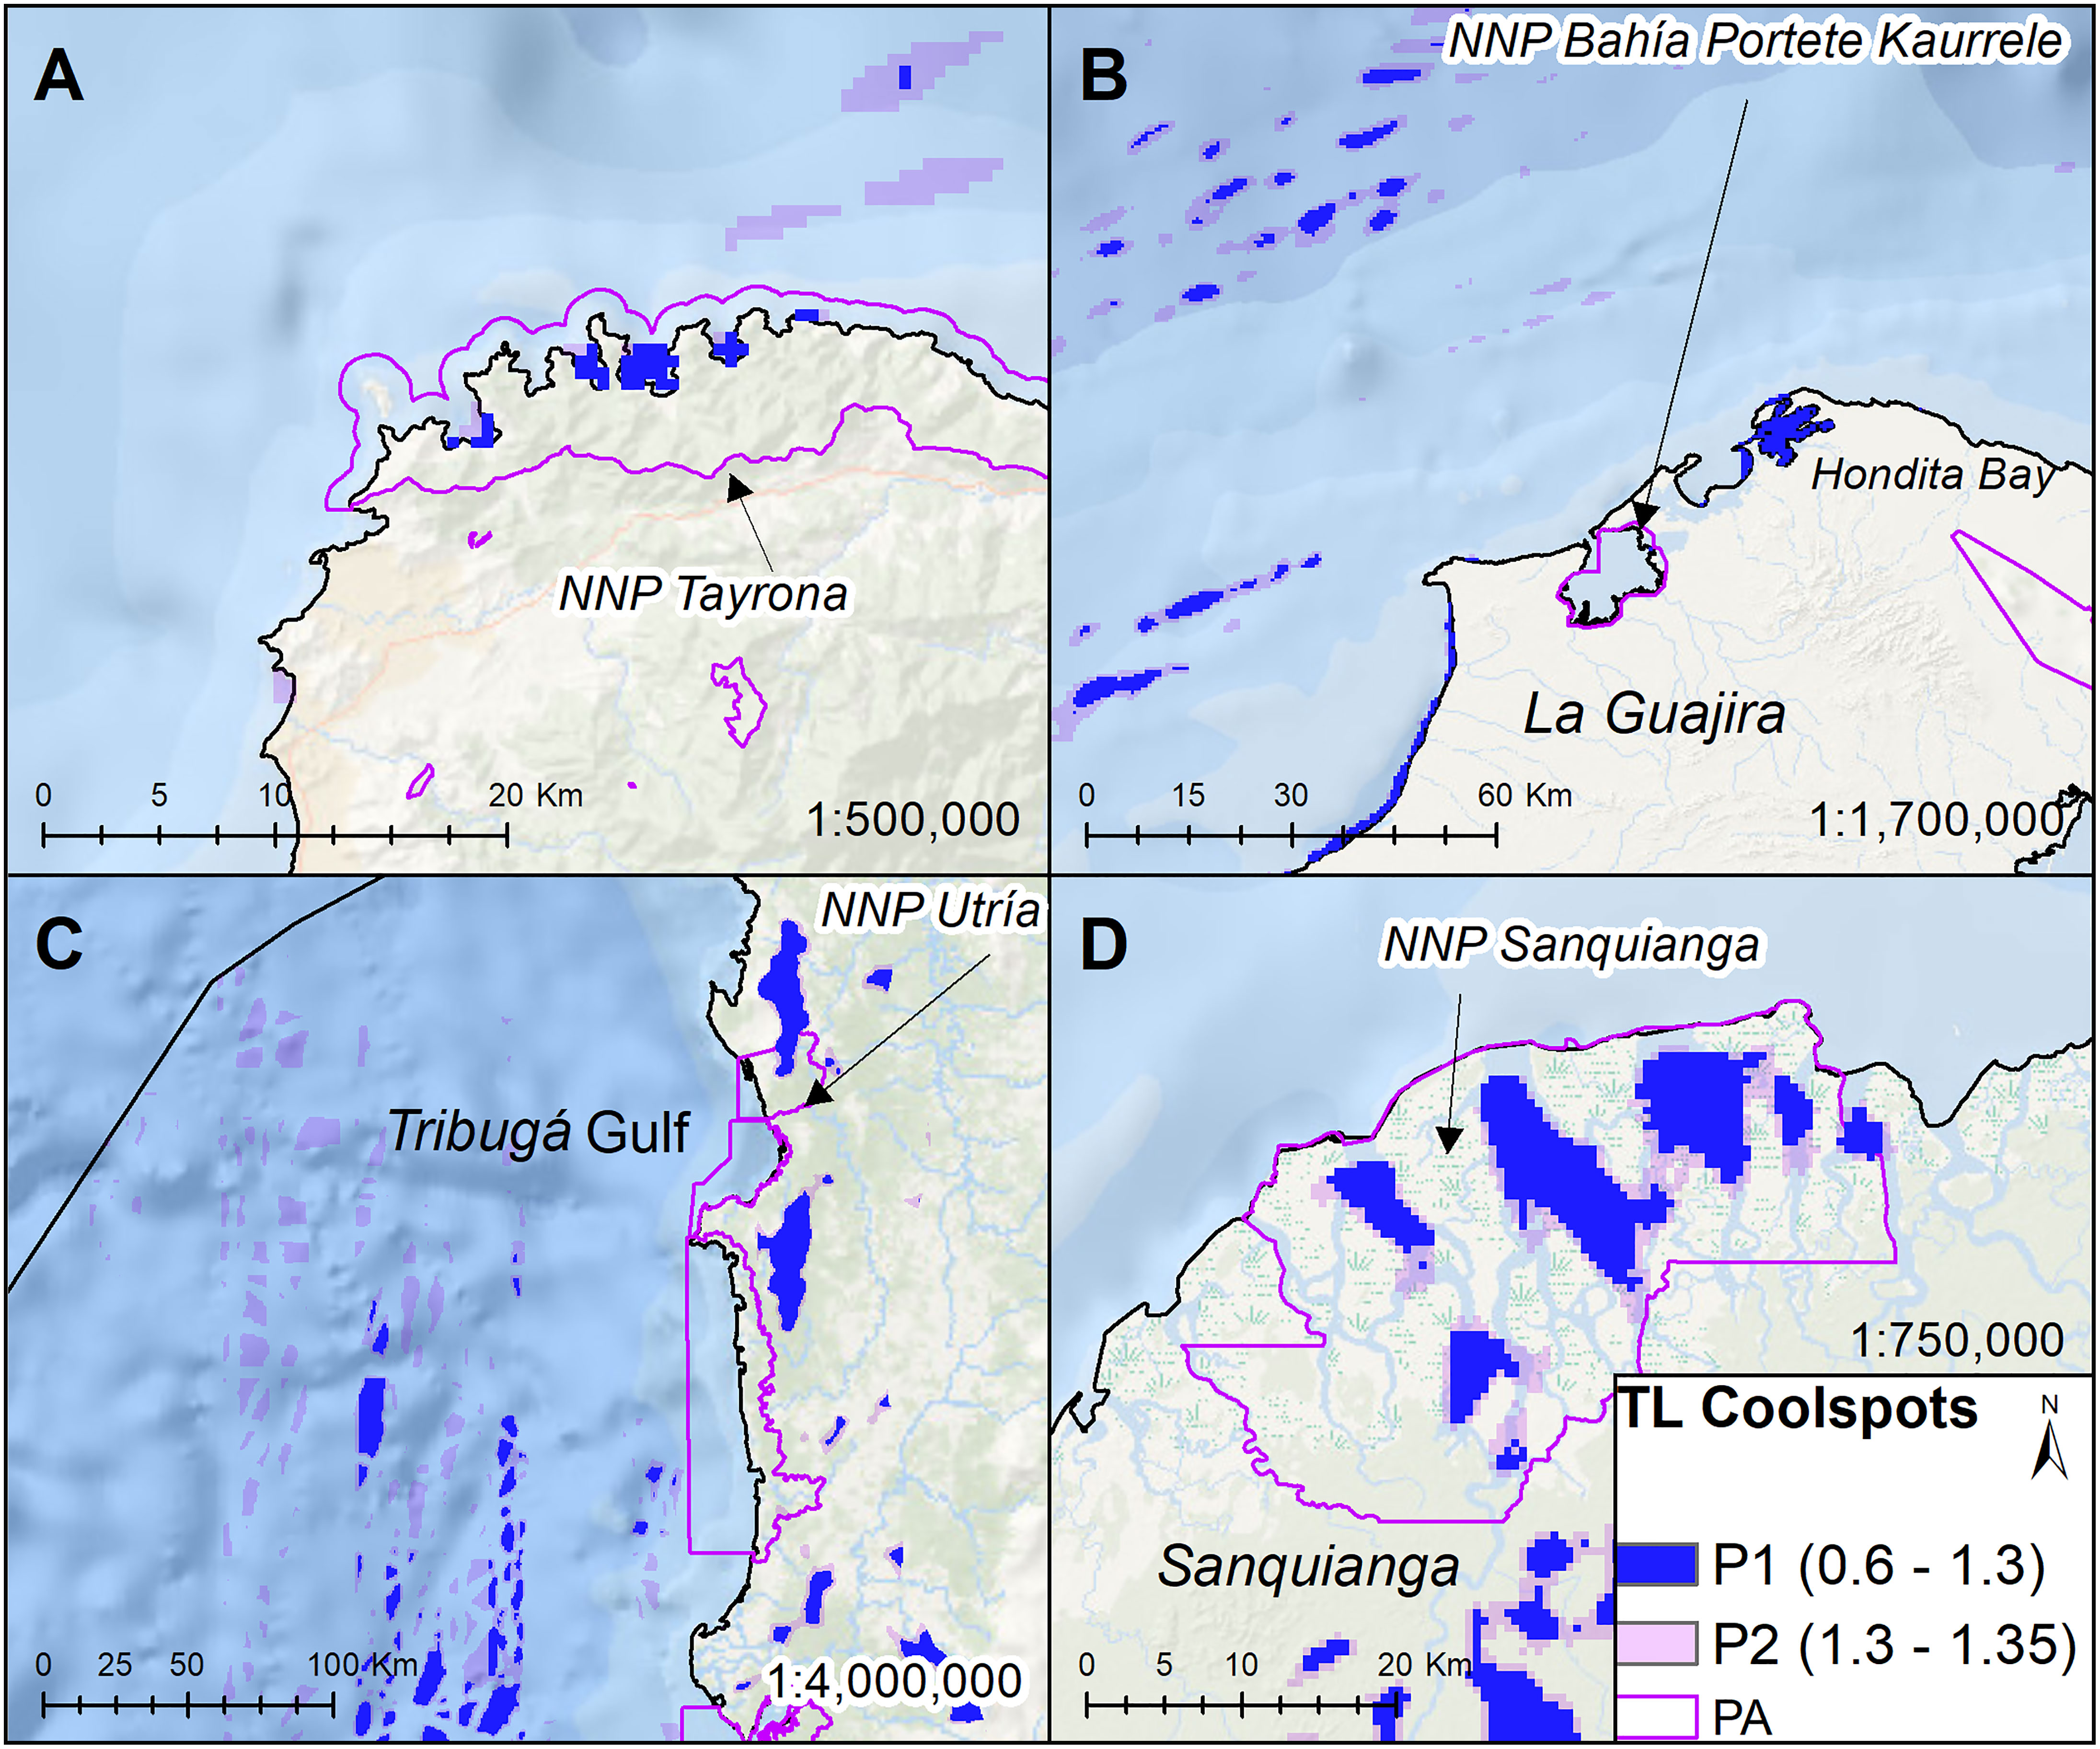
Figure 4 Threat coldspots. (A) NNP Tayrona at MAG ecozone, (B) adjacent areas to continental shelf and Hondita Bay at La Guajira, (C) Tribugá Gulf, and (D) NNP Sanquianga. The location of these coldspots within the national territory of Colombia is shown in Figure 2. TL values (in brackets) were ranked by percentile 1 (P1) and percentile 2 (P2) revealing threat coldspots. NDIM, National District of Integrated Management; NNP, National Natural Park; PA, protected area.
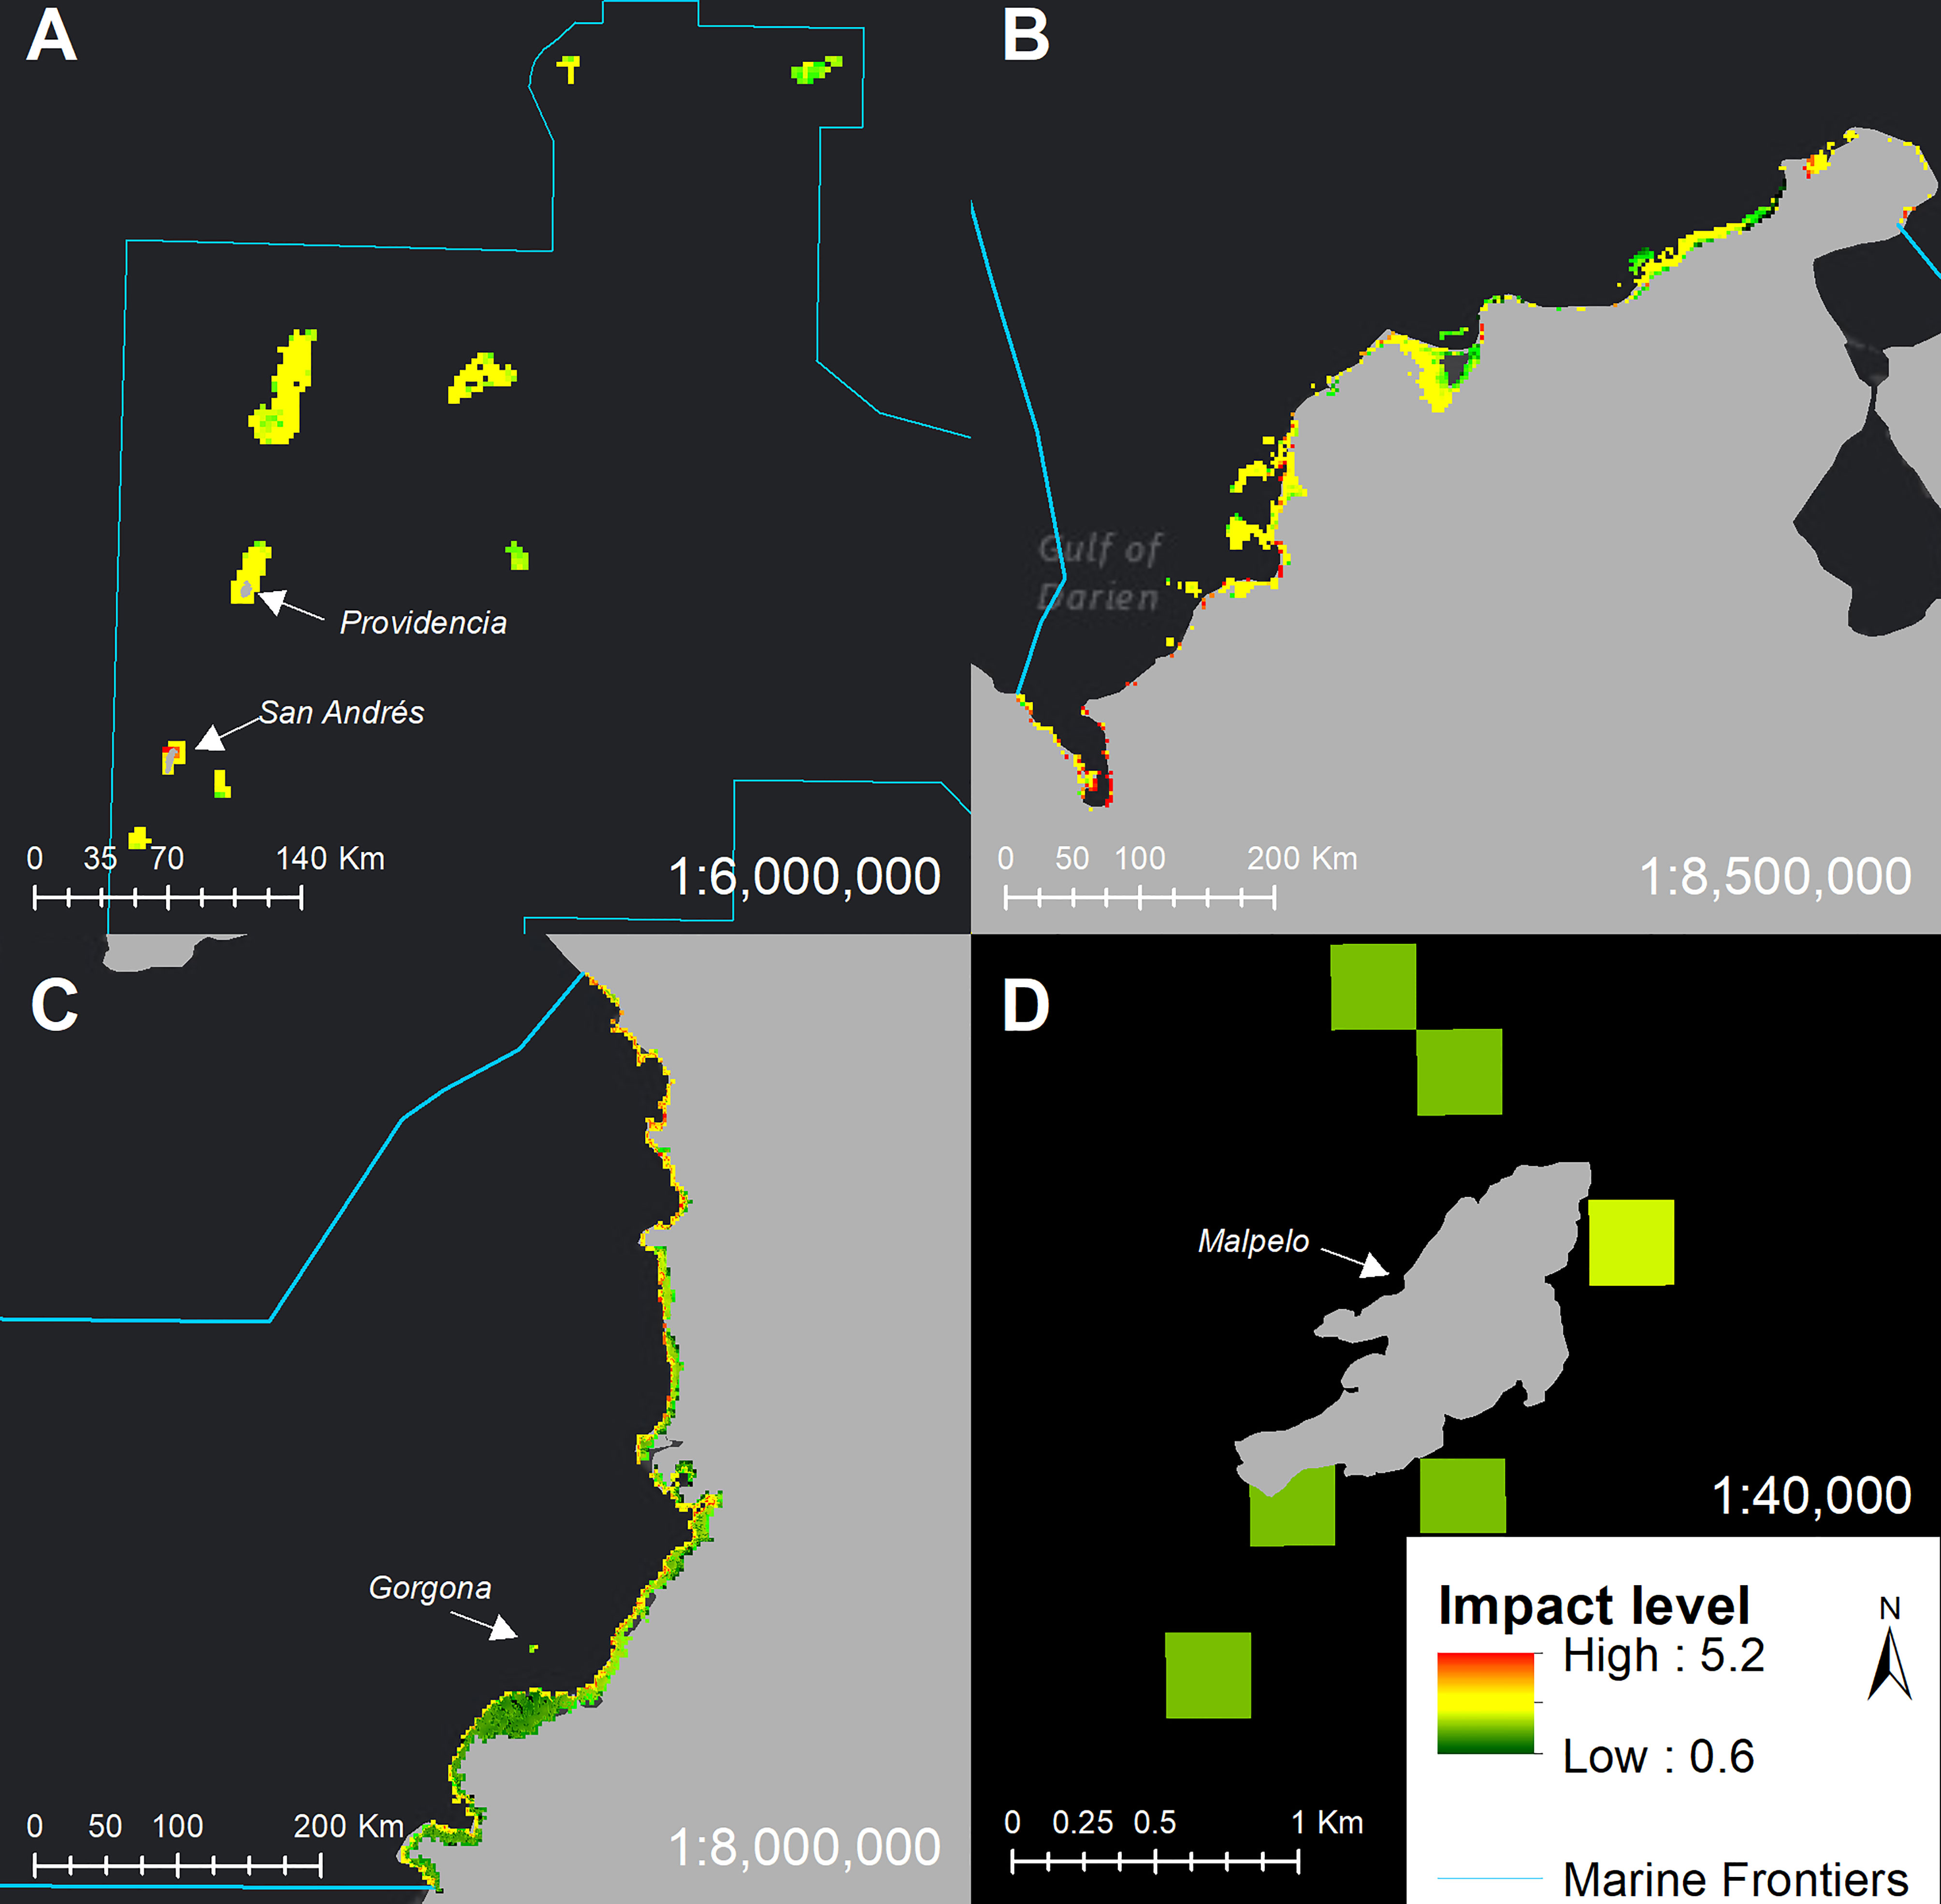
Figure 5 Cumulative impacts map. Sum of all individual impact-levels (IL) on marine and coastal ecosystems marine and coastal ecosystems. Zooms to ecoregions for better visualization, (A): Oceanic Caribbean, (B): Continental Caribbean, (C): Continental Caribbean, and (D): Oceanic Pacific at Malpelo Island, the only location of that region with an ecosystem distribution map. Black-and-white backgrounds are intended for a better contrast between pixel values.
3.2 Impact level
The resulting Cumulative impact map (Figure 5) covers 4,462 Km2 of marine and Coastal ecosystem area. The scale of impact values ranged between 0.6 and 5.2, with a mean of 2.06 and a standard deviation of 0.65, which means that intermediate values are the most frequent over the study area extension. This map was breakdown into two figures to describe impact level per threat and ecosystems (Figure 6) and per thereat impact extension (Figure 7), as explained below.
In the coastal environment, exposure to habitat transformation (a direct anthropic threat) had the highest impact on assessment units (Figure 6). However, except for this anthropic variable, the impacts of climatic threats of marine origin, such as sea warming, sea-level rise, and ocean acidification (OA), surpassed those of all the other threats analyzed in both environments. Other analyzed threats had low impact levels (IL ~ 0) on assessment units. For the coastal environment, the climatic pressures of indirect marine origin (e.g., precipitation decrease and atmospheric warming) revealed the impacts of small magnitude in the study area. In the marine environment, direct anthropic threats like port activity and fishing had a close-to-zero average impact on most assessment units.
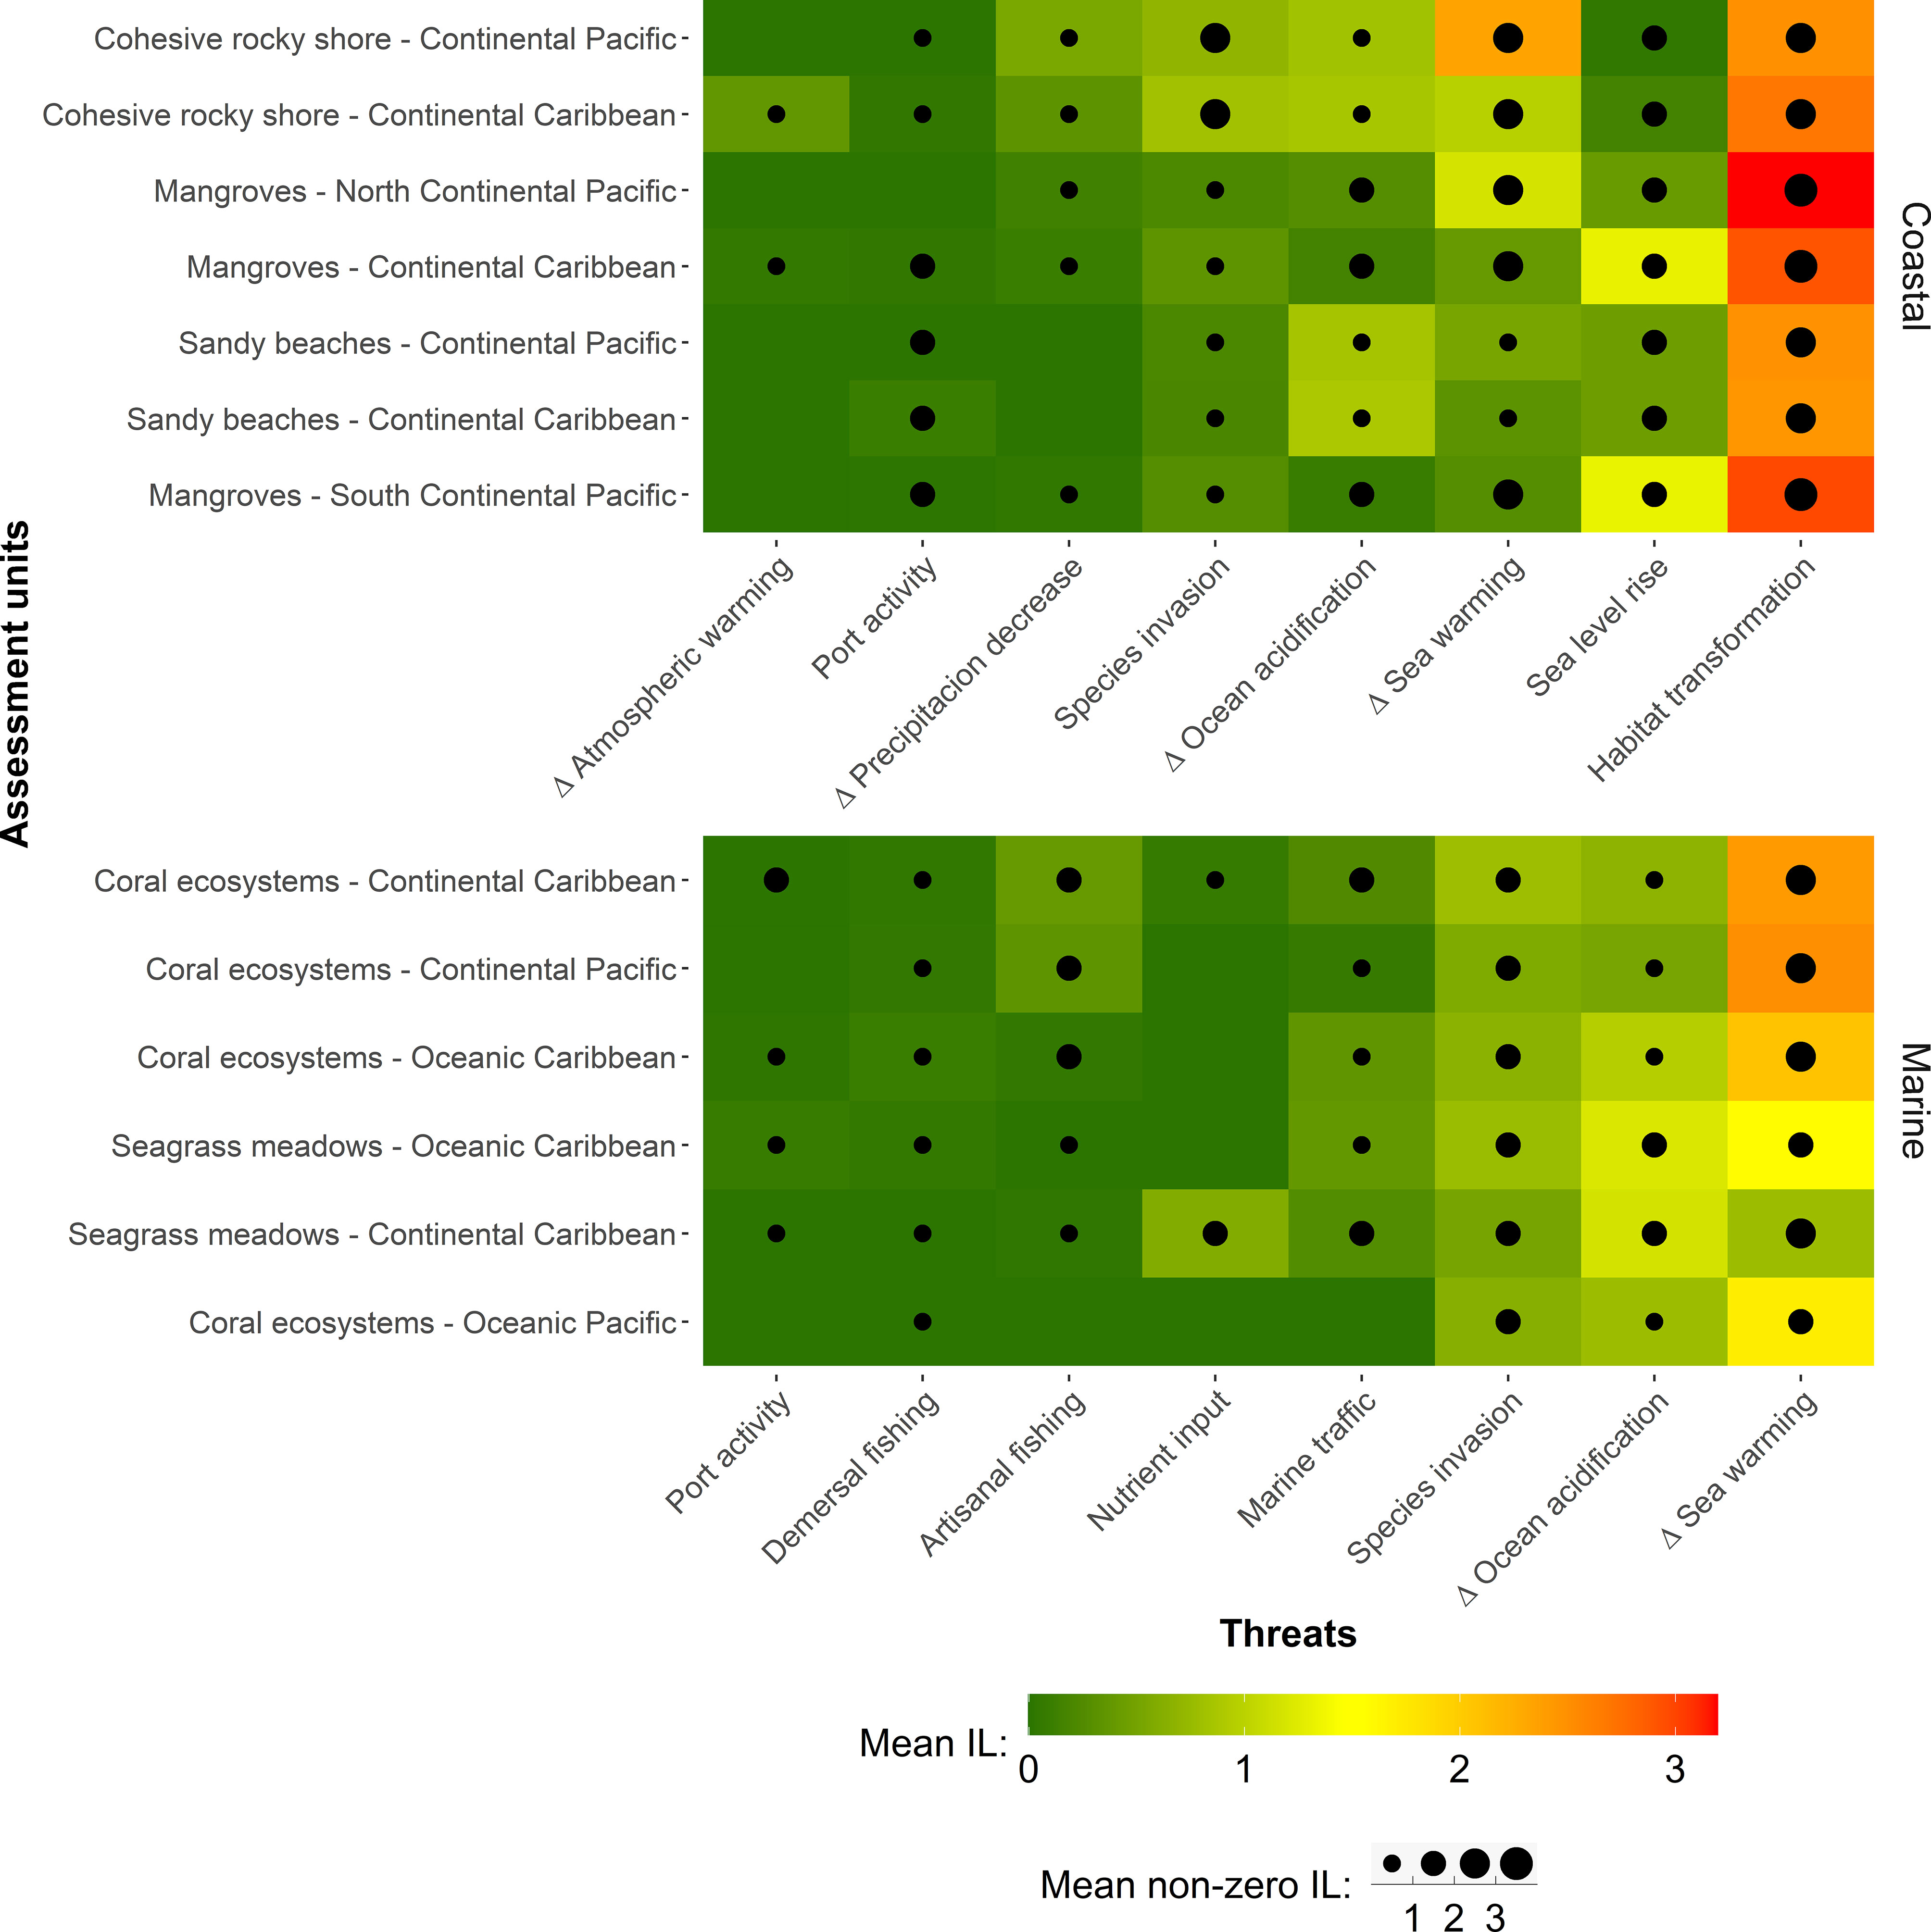
Figure 6 Level of impact by ecosystems and pressures. Threats with Δ labels indicate change over time. The continuous scale of the graph can also be interpreted categorically, where green, yellow, and red denote low, intermediate, and high impacts, respectively.
As shown by the mean non-zero impact level (mean without zero values), dark-green squares do not necessarily mean a zero-impact level on all units’ pixels (Figure 6). However, some assessment units were free of threats (mean IL = 0 and mean non-zero IL = 0), such as those pressures with no black dots and dark-green squares, implying that a unit was not spatially exposed to a threat and was therefore unimpacted (e.g., port activity, artisanal fishing, and marine traffic in coral ecosystems in the Oceanic Pacific). As for sandy beaches, threats without black dots (atmospheric warming and precipitation decrease) meant that this ecosystem was invulnerable to these threats, being unimpacted, according to vulnerability weights taken from Halpern et al. (2007; 2008; 2015).
Considering impacts on environments, coastal assessment units were more impacted than marine units, and, at ecozone levels, continental ecosystems endured higher-impact levels than the oceanic ones. Specifically, rocky shores (coastal) and coral ecosystems (marine) were more impacted by the threats of each environment. In contrast, the least impacted ecosystems were seagrass meadows. However, this does not indicate that its impact is negligible since it involves threats with intermediate values (yellow color). In each unit, at least one threat was calculated with intermediate-to-high impact.
To understand pressure influence across the study area, Figure 7 shows the spatial extents of the impact level of each threat, revealing threats with a broad influence area but a low impact level. Such is the case of terrestrial climatic pressures (atmospheric warming and precipitation decrease) and invasive species, with impact levels that do not reach values above 1 but extend over at least 1,000 km2. Conversely, threats with a high impact level (IL ≥ 1.5) and a narrow influence area were identified, such as port activity, with high impacts clustered in areas no greater than 40 km2. Finally, histograms revealed threats with high impact levels on broad influence areas. For instance, exposure to habitat transformation and sea warming exert a high impact level (IL ≥ 2.5) on at least 1,200 km2.
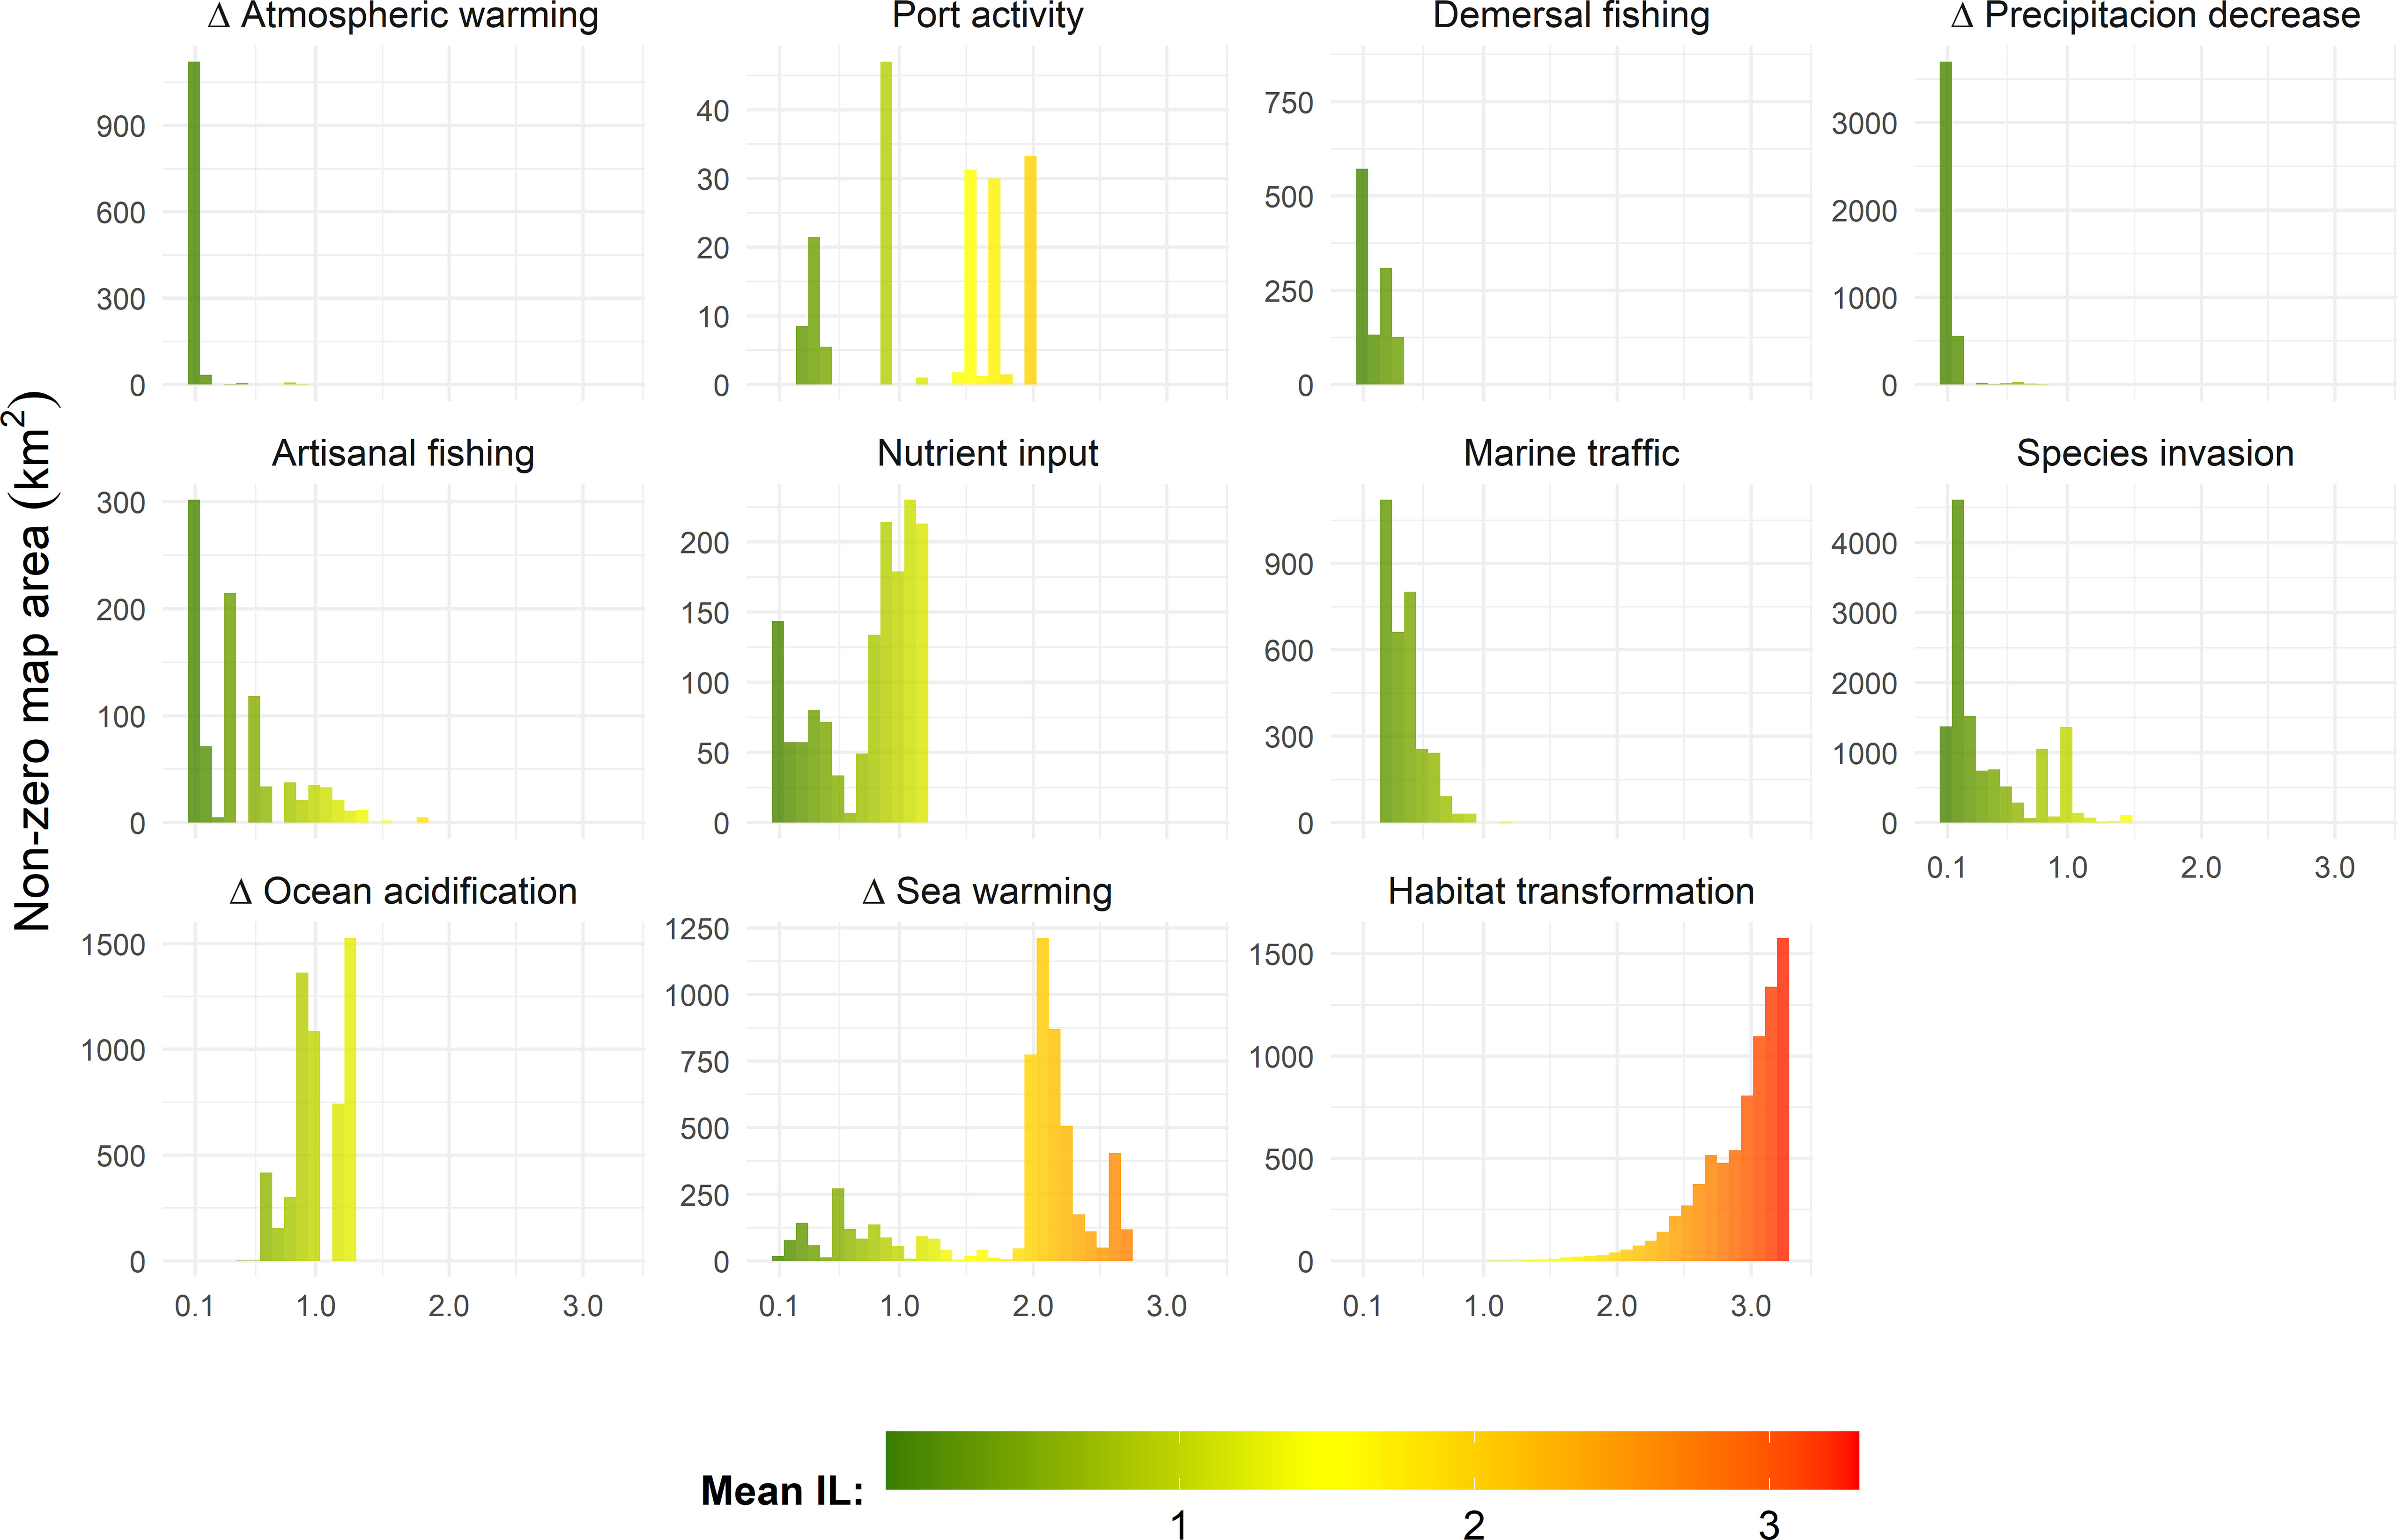
Figure 7 Impacts’ influence area. Impact value extents in non-zero impact-level pixels. Sea-level rise threat was excluded from analysis since it is a presence–absence pressure.
Impact levels identified with the Delta (Δ) symbol varied in time (Table 2). For instance, when the Δ impact level of OA was higher in the Caribbean than in the Pacific, this did not mean that the Caribbean was more acidic than the Pacific. It revealed that the pH levels in the Caribbean changed more over time than in the Pacific.
4 Discussion
This TL analysis reveals three expected spatial patterns: (i) the Caribbean zone is more threatened than the Pacific zone, (ii) the assessed continental areas have a higher TL than oceanic ones, and (iii) coastal environments are more threatened than marine ones. These differences occur mainly due to differential anthropogenic pressures on each ecozone. For instance, Caribbean and continental ecozones boast a higher economic activity (e.g., ports, cities, and roads) (Correa Ayram et al., 2020; Korpinen et al., 2021). Inversely, oceanic and Pacific ecozones are subject to less intense anthropogenic threats since they are far away or isolated from large human settlements (Etter et al., 2011; Korpinen et al., 2021). However, climate threats are present in all ecozones regardless of human activity. As reported by Jones et al. (2018), climate threats loom even in the most pristine areas (e.g., Malpelo Island). For this reason, none of the pixels on the obtained map experiences a TL of zero.
None of the three patterns revealed by our threat analysis was reflected on the obtained impact picture. Firstly, in terms of space, impact is a more specific metric than TL. Impact analysis only considers the level of threat that occurs in an ecosystem, which differs from the one that occurs in an entire ecozone. Secondly, impact levels and TLs entail relevant conceptual differences. A TL increase does not always strengthen impacts on non-vulnerable ecosystems (Halpern et al., 2007; Halpern et al., 2019). In contrast, a slight TL value increase on highly vulnerable ecosystems produces large impacts (Halpern et al., 2015; Tulloch et al., 2020); such is the case of coral ecosystems.
The strong impact of climatic threats on ecosystems has already been reported in the literature (e.g., Halpern et al., 2008; Rodríguez-Rodríguez et al., 2015). According to Jones et al. (2018), pressures like OA and sea warming impact ample extensions, driving high-level impact in most of the extension of coastal–marine space and its ecosystems. In contrast, some threats have a high level of impact but do not affect large areas since they are bound to specific areas of influence (e.g., port activity). Climatic threats represent a challenge in environmental impact management because such pressures are not entirely manageable at local or national scales but depend, to a large extent, on global actions (e.g., reduction of CO2 emissions) (Halpern et al., 2015; Stelzenmüller et al., 2015). However, recent blue carbon initiatives within Colombia’s territories are under development to mitigate climate change (International-Conservation, 2021).
Habitat transformation has a strong impact on coastal ecosystems, particularly on mangroves. Currently, changes in land use, associated with coastal infrastructure development, agriculture, and livestock, are the most salient drivers of deforestation, leading to habitat and ecosystem function loss in mangroves (Blanco et al., 2012; Restrepo et al., 2012; Blanco-Libreros et al., 2013; López-Angarita et al., 2018). In the Caribbean, an increase in cultivated areas (González et al., 2010; Blanco-Libreros et al., 2013), the urbanization of mangrove areas (Blanco-Libreros and Ramírez-Ruiz, 2021), and the development of urban infrastructure and roads have led, in some cases, to the reduction of the total mangrove area in the Atrato (DAR) (Blanco-Libreros and Estrada-Urrea, 2015) and in the Magdalena (MAG) (Rodríguez-Rodríguez et al., 2018) physiographic units. Similarly, Yanes et al. (2017) revealed that land use exerted the highest impact on a risk assessment conducted in the coastal areas of the Antioquia department of Colombia (at DAR physiographic unit). Global assessments also report strong impacts of crops and roads (transformed habitats) on coastal landscapes (Allan et al., 2021).
In the northern continental Pacific unit of Tribugá, natural mangrove covers are currently highly exposed to habitat transformation due to the small area and dispersed distribution of this unit, which increase its exposure to unnatural coverages (e.g., crops) and its susceptibility to edge effects (Didham and Ewers, 2012; Murray et al., 2017). Although historical land change has been more pronounced in the Caribbean (Etter et al., 2008; Uribe et al., 2020b), its less dispersed coverages create clusters in which interior mangrove areas are more distant from transformed habitats, making them less prone to transformation and edge effects (Jusys, 2016). Additionally, the Pacific coast of Colombia is experiencing an increase in transformed habitats (between 2000 and 2015) (Jarvis et al., 2010; Correa Ayram et al., 2020) due to the expansion of gold mining and palm and coca crops (Dávalos et al., 2011; Correa Ayram et al., 2020).
Although some anthropogenic threats had low impact levels, the synergies between these threats can change overall impact levels. For example, port activity was a low-impact threat mainly because the affected area is small compared with the ecosystem’s extension. However, the synergistic effect of port activity and habitat transformation (a high-impact threat) in the Tribugá Gulf (at a PAN physiographic unit), due to the construction of a port, will most likely transform extensive natural mangrove covers into secondary vegetation or grasslands (Rojas et al., 2019). Another case of synergistic threats is oil spills, which are associated with port activity. Following an oil spill event in 2008 at Taganga bay (at a MAG physiographic unit), the diversity of its coral and rocky shore was heavily compromised. Current cumulative impact assessments consider an additive model where the link between threats does not modify the impact level. Such a scenario is due to a lack of information when proposing synergistic or mitigative models (Halpern et al., 2015). This first national assessment focuses on characterizing the intensity and impact of those threats and serves as a basis for future more complex models.
On the other hand, some threats had low impacts because they were not analyzed on the ecosystems that suffer the most damage. Such is the case of industrial demersal fishing in coastline-distant areas (Rueda et al., 2010), which harbor soft-bottom ecosystems (Epstein et al., 2022). The National Aquaculture and Fisheries Authority (AUNAP, for its initials in Spanish) determined that industrial shrimp fishing can occur at a distance of 9 km from the coastline and between depths of 60 and 400 m (Rueda et al., 2010; Marco et al., 2021). Consequently, industrial demersal fishing affects marine ecosystems without sufficient spatial data in the study area (e.g., soft bottoms).
Cumulative impact assessments usually report the impact level as the primary metric and do not mention the TL (see Halpern et al., 2015; Stelzenmüller et al., 2015). We incorporated the TL to understand impacts in areas lacking ecosystem maps. Our results reveal that the TL is not null in oceanic zones (as explained before), and, although there is no mapping of these ecosystems, we can assume that the impacts on these units will neither be null.
Previous efforts have been made to analyze threats in Colombian natural areas. The evaluation and map by Alonso et al. (2009) served as a guide to the present investigation, providing conceptual and technical foundations. Therefore, there is substantial agreement in terms of the patterns, such as hotspots and coldspots, between both maps. However, our map differs from the previous ones due to its novel features, namely (i) updated spatial layers, (ii) added climatic threats (e.g., sea warming and ocean acidification), (iii) the use of quantitative data for all pressures, and (iv) the inclusion of Colombia’s oceanic (offshore) areas, such as the Oceanic Pacific ecozone and the remote Seaflower Biosphere Reserve. Remarkably, these two zones of Colombia remain largely unresearched (see Taylor et al., 2013; Sánchez et al., 2021).
Threats modulate ecosystem risk because their impacts alter biodiversity and the physical environment wherever they occur. This threat analysis was part of a project that sought to estimate for the first time the level of risk in Colombian coastal and marine ecosystems following the IUCN Red List methodology (Uribe et al., 2020b). This framework states that threats on ecosystems must be characterized to gain a broader perspective on current ecosystem collapse risks (analogous to the concept of species extinction) (Keith et al., 2013) since intervening (via restoration) highly threatened ecosystems (those in high risk of collapse) may not be cost-effective if the threats that loom over them cannot be removed (Keith, 2015). This cumulative threat assessment accomplished the threat description component of the Red List of Marine and Coastal Ecosystems of Colombia. Our works use a common ecosystem and threat classification scheme that enables the merging of results.
Our assessment pinned down knowledge gaps that can guide future research. First, we noted the need for more information on the spatial distribution of the marine-coastal ecosystems not assessed in this work; we were able to analyze only five ecosystems from a list of 20 (IDEAM et al., 2017), implying that the spatial distribution of at least 15 ecosystems remains unknown. Furthermore, a lack of information is evident for offshore and deep ecosystems. INVEMAR has directed efforts to spatialize geo-forms of deep underwater landscapes; however, these have not yet reached the ecosystem scale. Similarly, pelagic ecosystems have not been characterized yet, and recent research showed that they are complex systems with particular three-dimensional features (Pittman et al., 2021). Second, there is a need to incorporate more threats into the analysis and deepen our understanding of those already included, namely by increasing national data to identify more specific patterns. An endeavor to satisfy this need is being led by INVEMAR, aiming at mapping ICAM (a national database on seawater quality).
This analysis can inform threat–impact dynamics and provide management guidance in three directions: (i) by drawing attention to physiographic units where the TL is very high, namely the Morrosquillo Gulf (MOR), Darien (DAR), and Tumaco (TUM). (ii) Strategies must be devised to mitigate their threats, for instance, by creating in these three units new marine-protected areas. National and regional efforts should prioritize the reduction of habitat transformation since it threatens coastal environments the most. (iii) Regarding Colombia’s marine environment, national and global efforts must address the current climate crisis (e.g., blue carbon—see Zarate-Barrera and Maldonado, 2015) since marine sea warming is the threat that impacts marine ecosystems the most.
To conclude, this analysis reveals that sea warming and habitat transformation are the most relevant threats on the assessed marine and coastal environments, respectively. Both have a strong impact on a large ecosystem area and are strong modulators of these ecosystems’ risk of collapse. Actions to mitigate these threats will lead to favorable ecosystem changes. Moreover, a sufficient understanding of these threats will help inform and rethink restoration strategies, for instance, to foresee their inefficiency if the pressures that degrade ecosystems are bound to persist. Port activity is the most common threat in all hotspots identified within a study area, which is coupled, synergistically, with habitat transformation. These hotspots exemplify probable new port scenarios in low-threat and -impact areas, such as the proposed Port of Tribugá located in a coldspot TL zone. This manuscript addresses in detail the ecosystem threat component of the first Red List assessment protocol for the marine and coastal ecosystems of Colombia; it also constitutes a systematic threat assessment to guide national conservation efforts.
Data availability statement
The raw data supporting the conclusions of this article will be made available by the authors, without undue reservation.
Author contributions
Conceptualization and literature search were conducted by the authors within the following thematic groups: Red List assessment protocol (EU, AE, AL-A, LC, and MD), national policies (DA and LC), and ecosystem ecology (AR, AO, AA, CR, AL-A and AG). Furthermore, this work’s database was constructed by EU, LC, and LE. Statistical analysis was carried out by EU. Funding was acquired by MD, EU, and LE, and manuscript drafts were written by LE and EU. All authors contributed to the article and approved the submitted version.
Funding
The Ocean program of International Conservation Colombia covered this project’s planning, execution, and outreach expenses. The writing phase of the scientific paper was financed by the Ignacio Gómez Scholarship Fund (Selva Foundation) through its program for Neotropic conservation research. Additionally, the authors created a collective fund to support supplementary expenses.
Acknowledgments
We thank the INVEMAR Research Institute for providing relevant data on the evaluated threats and for its technical support and conceptualization guidance throughout this project’s phases. We also acknowledge the support of the different researchers at Universidad Nacional de Colombia—Bogota, Universidad del Valle, The Seaflower Foundation, and Universidad Jorge Tadeo Lozano who are part of the Colombian marine and coastal Red List initiative.
Conflict of interest
The authors declare that this research was conducted in the absence of any commercial or financial agreements that could be construed as a potential conflict of interest.
Publisher’s note
All claims expressed in this article are solely those of the authors and do not necessarily represent those of their affiliated organizations, or those of the publisher, the editors and the reviewers. Any product that may be evaluated in this article, or claim that may be made by its manufacturer, is not guaranteed or endorsed by the publisher.
Supplementary material
The Supplementary Material for this article can be found online at: https://www.frontiersin.org/articles/10.3389/fmars.2022.962044/full#supplementary-material
References
Abatzoglou J. T., Dobrowski S. Z., Parks S. A., Hegewisch K. C. (2018). TerraClimate, a high-resolution global dataset of monthly climate and climatic water balance from 1958-2015. Sci. Data 5, 170191. doi: 10.1038/sdata.2017.191
Agencia Nacional de Infraestructura (ANI) (2021). “Datos abiertos,” in Puertos geográficos. Available at: https://www.datos.gov.co/dataset/Puertos-Geogr-ficos-ANI/fw9a-ix2x/data.
Allan J. R., Watson J. E. M., Di Marco M., O’Bryan C. J., Possingham H. P., Atkinson S. C., et al. (2019). Hotspots of human impact on threatened terrestrial vertebrates. PloS Biol. (Santa Marta - Colombia: Instituto de Investigaciones Marinas y Costeras José Benito Vives de Andréis (INVEMAR)) 17 (3), 1–18. doi: 10.1371/journal.pbio.3000158
Allan H., Levin N., Kark S. (2021). Quantifying the human footprint and cumulative impacts on earth’s coastal areas. SSRN Electronic J. doi: 10.2139/ssrn.3824996
Alonso D., Ramírez L., Segura C., Castillo-Torres P., Díaz J. M., Walschburger T. (2009). Planificación ecorregional para la conservación in situ de la biodiversidad marina y costera en el caribe y pacífico continental colombiano, No. 41; Serie de Documentos Generales. (Santa Marta - Colombia:Instituto de Investigaciones Marinas y Costeras José Benito Vives de Andréis (INVEMAR)).
Álvarez-Romero J. G., Mills M., Adams V. M., Gurney G. G., Pressey R. L., Weeks R., et al. (2018). Research advances and gaps in marine planning: towards a global database in systematic conservation planning. Biol. Conserv. 227 (July 2017), 369–382. doi: 10.1016/j.biocon.2018.06.027
Blanco J. F., Estrada E. A., Ortiz L. F., Urrego L. E. (2012). Ecosystem-wide impacts of deforestation in mangroves: The urabá gulf (Colombian Caribbean) case study. ISRN Ecol. 2012, 1–14. doi: 10.5402/2012/958709
Blanco-Libreros J. F., Álvarez-León R. (2019). Mangroves of Colombia revisited in an era of open data, global changes, and socio-political transition: Homage to heliodoro sánchez-páez. Rev. la Academia Colombiana Cienc. Exactas Fisicas y Naturales 43 (166), 84–97. doi: 10.18257/raccefyn.780
Blanco-Libreros J. F., Estrada-Urrea E. A. (2015). Mangroves on the edge: Anthrome-dependent fragmentation influences ecological condition (Turbo, Colombia, southern Caribbean). Diversity 7 (3), 206–228. doi: 10.3390/d7030206
Blanco-Libreros J. F., Marín A., Torres V., Rincón A., Estrada E. A., Flórez J. (2013). Deforestación y sedimentación en los manglares del golfo de urabá. Gestión y Ambiente 16 (2), 19–36.
Blanco-Libreros J. F., Ramírez-Ruiz K. (2021). Threatened mangroves in the anthropocene: Habitat fragmentation in urban coastalscapes of pelliciera spp. (Tetrameristaceae) in northern south America. Front. Mar. Sci. 8 (June). doi: 10.3389/fmars.2021.670354
Botero L., Mancera-Pineda J. E. (1996). Síntesis de los cambios de origen antrópico ocurridos en los últimos 40 años en la ciénaga de Santa Marta (Colombia). Rev. Acad. Colomb. Cienc. 20 (78), 465–474.
Brook B. W., Ellis E. C., Perring M. P., Mackay A. W., Blomqvist L. (2013). Does the terrestrial biosphere have planetary tipping points? Trends Ecol. Evol. 28 (7), 396–401. doi: 10.1016/j.tree.2013.01.016
Castaño-Isaza J., Newball R., Roach B., Lau W. W. Y. (2015). Valuing beaches to develop payment for ecosystem services schemes in colombia’s seaflower marine protected area. Ecosystem Serv. 11, 22–31. doi: 10.1016/j.ecoser.2014.10.003
Correa Ayram C. A., Etter A., Díaz-Timoté J., Rodríguez Buriticá S., Ramírez W., Corzo G. (2020). Spatiotemporal evaluation of the human footprint in Colombia: Four decades of anthropic impact in highly biodiverse ecosystems. Ecol. Indic. 117 (April), 106630. doi: 10.1016/j.ecolind.2020.106630
Costanza R., de Groot R., Sutton P., van der Ploeg S., Anderson S. J., Kubiszewski I., et al. (2014). Changes in the global value of ecosystem services. Global Environ. Change 26 (1), 152–158. doi: 10.1016/j.gloenvcha.2014.04.002
Crain C. M., Halpern B. S., Beck M. W., Kappel C. V. (2009). Understanding and managing human threats to the coastal marine environment. Ann. New York Acad. Sci. 1162, 39–62. doi: 10.1111/j.1749-6632.2009.04496.x
Dávalos L. M., Bejarano A. C., Hall M. A., Correa H. L., Corthals A., Espejo O. J. (2011). Forests and drugs: Coca-driven deforestation in tropical biodiversity hotspots. Environ. Sci. Technol. 45 (4), 1219–1277. doi: 10.1021/es102373d
Díaz J. M., Acero A. (2003). Marine biodiversity in Colombia: Achievements, status of knowledge, and challenges. Gayana (Concepción) 67 (2), 261–274. doi: 10.4067/s0717-65382003000200011
Díaz J. M., Barrios L., Gómez-lópez D. (2003). Las praderas de pastos marinos en Colombia Vol. 10 (Santa Marta, Colombia: Instituto de Investigaciones Marinas y Costeras “José Benito Vives De Andréis” (INVEMAR): Serie Publicaciones Especiales).
Didham R. K., Ewers R. M. (2012). Predicting the impacts of edge effects in fragmented habitats: Laurance and yensen’s core area model revisited. Biol. Conserv. 155, 104–110. doi: 10.1016/j.biocon.2012.06.019
Epstein G., Middelburg J. J., Hawkins J. P., Norris C. R., Roberts C. M. (2022). The impact of mobile demersal fishing on carbon storage in seabed sediments. Global Change Biol. 00, 1–20. doi: 10.1111/gcb.16105
Etter A., McAlpine C., Possingham H. (2008). Historical patterns and drivers of landscape change in Colombia since 1500: A regionalized spatial approach. Ann. Assoc. Am. Geographers 98 (1), 2–23. doi: 10.1080/00045600701733911
Etter A., McAlpine C. A., Seabrook L., Wilson K. A. (2011). Incorporating temporality and biophysical vulnerability to quantify the human spatial footprint on ecosystems. Biol. Conserv. 144 (5), 1585–1594. doi: 10.1016/j.biocon.2011.02.004
Friedrich T. A., Timmermann A., Abe-Ouchi N. R., Bates M. O., Chikamoto M. J., Church J. E., et al. (2012). Detecting regional anthropogenic trends in ocean acidification against natural variability. Nat. Climate Change 2 (3), 167–171. doi: 10.1038/nclimate1372
Garzón-Ferreira J., Díaz J. M. (2003). The Caribbean coral reefs of Colombia. Cortés JLatin Am. Coral Reefs,1996, 275–301. doi: 10.1016/B978-044451388-5/50013-8
GBIF (2021) GBIF home page. Available at: https://www.gbif.org.
Gómez-López D. I., Segura-Quintero C., Sierra-Correa P., Garay-Tinoco J. (2012). Atlas de la reserva de biósfera seaflower (Santa Marta, Colombia: Instituto de Investigaciones Marinas y Costeras “José Benito Vives De Andréis”) 28, 180 (Serie de Publicaciones Especiales).
González C., Urrego L. E., Martínez J. I., Polanía J., Yokoyama Y. (2010). Mangrove dynamics in the southwestern Caribbean since the “Little ice age”: A history of human and natural disturbances. Holocene 20 (6), 849–861. doi: 10.1177/0959683610365941
Halpern B. S., Frazier M., Afflerbach J., Lowndes J. S., Micheli F., O’Hara C., et al. (2019). Recent pace of change in human impact on the world’s ocean. Sci. Rep. 9 (1), 1–8. doi: 10.1038/s41598-019-47201-9
Halpern B. S., Frazier M., Potapenko J., Casey K. S., Koenig K., Longo C., et al. (2015). Spatial and temporal changes in cumulative human impacts on the world’s ocean. Nat. Commun. 6 (May), 1–7. doi: 10.1038/ncomms8615
Halpern B. S., Selkoe K. A., Micheli F., Kappel C. V. (2007). Evaluating and ranking the vulnerability of global marine ecosystems to anthropogenic threats. Conserv. Biol. 21 (5), 1301–1315. doi: 10.1111/j.1523-1739.2007.00752.x
Halpern B. S., Walbridge S., Selkoe K. A., Kappel C. V., Micheli F., D’Agrosa C., et al. (2008). A global map of human impact on marine ecosystems. Science 319 (February), 948–953. doi: 10.1126/science.1149345
Hodgson E. E., Halpern B. S. (2019). Investigating cumulative effects across ecological scales. Conserv. Biol. 33 (1), 22–32. doi: 10.1111/cobi.13125
Holsman K., Samhouri J., Cook G., Hazen E., Olsen E., Dillard M., et al. (2017). An ecosystem-based approach to marine risk assessment. Ecosystem Health Sustainability 3 (1). doi: 10.1002/ehs2.1256
IDEAM, IGAC (2012). Mapa de cobertura de la tierra, metodología corine land cover adaptada para Colombia Vol. 1 (Bogotá, Colombia: Instituto de Hidrología, Meteorología y Estudios Ambientales (IDEAM)) 1, 100.000.
IDEAM, IAvH, Invemar, IGAC (2017). Memoria técnica mapa de ecosistemas continentales, costeros y marinos de Colombia (Bogotá, Colombia: Instituto de Hidrología, Meteorología y Estudios Ambientales (IDEAM)).
IDEAM, IAvH, Sinchi I., INVEMAR, I. I. A. P. PNNC, IGAC (2017). Mapa de ecosistemas continentales, costeros y marinos de Colombia a escala 1 (Bogotá, Colombia: Instituto de Hidrología, Meteorología y Estudios Ambientales (IDEAM)) 1, 100.000.
IDEAM, IGAC, IAvH, Invemar, Sinchi I. (2007). Ecosistemas continentales, costeros y marinos de Colombia (Bogotá, Colombia: Instituto Geográfico Agustín Codazzi (IGAC)). 276
International-Conservation (2021) Una nueva alternativa para los manglares del mundo. Available at: http://www.conservation.org.co/Noticias/bio/vidamanglar.
INVEMAR (2003). Programa holandés de asistencia para estudios definición de la vulnerabilidad de los sistemas bio-geofísicos en cambio climático: Colombia. y socioeconómicos debido a un cambio en el nivel del mar en la zona costera colombiana (Santa Marta, Colombia: Instituto de Investigaciones Marinas y Costeras José Benito Vives de Andréis).
INVEMAR (2017). Elaboración del análisis de vulnerabilidad marino costero e insular ante el cambio climático para el país (Santa Marta, Colombia: Instituto de Investigaciones Marinas y Costeras José Benito Vives de Andréis (INVEMAR)), 1–256.
INVEMAR (2020). “Informe del estado de los ambientes y recursos marinos y costeros en Colombia,” in Serie de publicaciones periódicas Santa Marta, Colombia: Instituto de Investigaciones Marinas y Costeras José Benito Vives De Andréis (INVEMAR). 3, 268.
Jackson J. B. C., Donovan M. K., Cramer K. L., Lam V., Lam W. (2014). Status and trends of Caribbean coral Reefs : 1970-2012. Global Coral Reef Monit. Network IUCN Gland Switzerland, 306.
Jarvis A., Touval J. L., Schmitz M. C., Sotomayor L., Hyman G. G. (2010). Assessment of threats to ecosystems in south America. J. Nat. Conserv. 18 (3), 180–188. doi: 10.1016/j.jnc.2009.08.003
Johnson C. N., Balmford A., Brook B. W., Buettel J. C., Galetti M., Guangchun L., et al. (2017). Biodiversity losses and conservation responses in the anthropocene. Science 356 (6335), 270–275. doi: 10.1126/science.aam9317
Jones K. R. R., Klein C. J. J., Halpern B. S. S., Venter O., Grantham H., Kuempel C. D. D., et al. (2018). The location and protection status of earth’s diminishing marine wilderness. Curr. Biol. 28 (15), 2506–2512.e3. doi: 10.1016/j.cub.2018.06.010
Jusys T. (2016). Quantifying avoided deforestation in pará: Protected areas, buffer zones and edge effects. J. Nat. Conserv. 33 (November), 10–17. doi: 10.1016/j.jnc.2016.05.001
Keith D. A. (2015). Assessing and managing risks to ecosystem biodiversity. Austral Ecol. 40 (4), 337–346. doi: 10.1111/aec.12249
Keith D. A., Rodríguez J. P., Rodríguez-Clark K. M., Nicholson E., Aapala K., Alonso A., et al. (2013). Scientific foundations for an IUCN red list of ecosystems. PloS One 8 (5), 25p. doi: 10.1371/journal.pone.0062111
Korpinen S., Laamanen L., Bergström L., Nurmi M., Andersen J. H., Haapaniemi J., et al. (2021). Combined effects of human pressures on europe’s marine ecosystems. Ambio 50 (7), 1325–1336. doi: 10.1007/s13280-020-01482-x
Lawrence Livermore National Laboratory. (2022). Earth System Grid Federation (ESFG). Search & Download Data. Available at: https://esgf-node.llnl.gov/projects/esgf-llnl/.
Liu G., Heron S. F., Mark Eakin C., Muller-Karger F. E., Vega-Rodriguez M., Guild L. S., et al. (2014). Reef-scale thermal stress monitoring of coral ecosystems: New 5-km global products from NOAA coral reef watch. Remote Sens. 6 (11), 11579–11606. doi: 10.3390/rs61111579
López-Angarita J., Tilley A., Hawkins J. P., Pedraza C., Roberts C. M. (2018). Land use patterns and influences of protected areas on mangroves of the eastern tropical pacific. Biol. Conserv. 227 (August), 82–91. doi: 10.1016/j.biocon.2018.08.020
Lu Y., Yuan J., Lu X., Su C., Zhang Y., Wang C., et al. (2018). Major threats of pollution and climate change to global coastal ecosystems and enhanced management for sustainability. Environ. pollut. 239, 670–680. doi: 10.1016/j.envpol.2018.04.016
MADS (2000). Política nacional ambiental para el desarrollo sostenible de los espacios oceánicos y las zonas costeras e insulares de Colombia (Bogotá, Colombia: Ministerio de Medio Ambiente y Desarrollo Sostenible).
Max Planck Institute (MPI) (2022). MPI-earth system model. Modelling. https://mpimet.mpg.de/en/science/models/mpi-esm.
Marco J., Valderrama D., Rueda M. (2021). Evaluating management reforms in a Colombian shrimp fishery using fisheries performance indicators. Mar. Policy 125, 104258. doi: 10.1016/j.marpol.2020.104258
Montoya J. M., Donohue I., Pimm S. L. (2018). Planetary boundaries for biodiversity: Implausible science, pernicious policies. Trends Ecol. Evol. 33 (2), 71–73. doi: 10.1016/j.tree.2017.10.004
Murray N. J., Keith D. A., Bland L. M., Nicholson E., Regan T. J., Rodríguez J. P., et al. (2017). The use of range size to assess risks to biodiversity from stochastic threats. Diversity Distributions 23 (5), 474–483. doi: 10.1111/ddi.12533
National Geospatial-Intelligency Agency (2017). World port index (Springfield, Virginia USA: National Geospatial-Intelligency Agency). 224. Available at: https://msi.nga.mil/Publications/WPI.
Navas-Camacho R., Gil-Agudelo D. L., Rodríguez-Ramírez A., Reyes-Nivia M. C., Garzón-Ferreira J. (2010). Coral diseases and bleaching on Colombian Caribbean coral reefs. Rev. Biol. Trop. 58 (SUPPL. 1), 95–106. Retrieved November 11, 2022, from http://www.scielo.sa.cr/scielo.php?script=sci_arttext&pid=S0034-77442010000500008&lng=en&tlng=en.
OBIS (2021). Ocean biodiversity information system (Intergovernmental Oceanographic Commission of UNESCO). Available at: www.obis.org.
Pittman S., Yates K., Bouchet P., Alvarez-Berastegui D., Andréfouët S., Bell S., et al. (2021). Seascape ecology: identifying research priorities for an emerging ocean sustainability science. Mar. Ecol. Prog. Ser. 663 (March), 1–29. doi: 10.3354/meps13661
Restrepo J. C., Otero L., Casas A. C., Henao A., Gutiérrez J. (2012). Shoreline changes between 1954 and 2007 in the marine protected area of the Rosario island archipelago (Caribbean of Colombia). Ocean Coast. Manage. 69 (July), 133–142. doi: 10.1016/j.ocecoaman.2012.07.027
Restrepo J. D., Park E., Aquino S., Latrubesse E. M. (2016). Coral reefs chronically exposed to river sediment plumes in the southwestern Caribbean: Rosario islands, Colombia. Sci. Total Environ. 553, 316–329. doi: 10.1016/j.scitotenv.2016.02.140
Restrepo J. D., Zapata P., Díaz J. M., Garzón-Ferreira J., García C. B. (2006). Fluvial fluxes into the Caribbean Sea and their impact on coastal ecosystems: The Magdalena river, Colombia. Global Planetary Change 50 (1–2), 33–49. doi: 10.1016/j.gloplacha.2005.09.002
Robertson D. R., Cramer K. L. (2009). Shore fishes and biogeographic subdivisions of the tropical Eastern pacific. Mar. Ecol. Prog. Ser. 380 (Ekman 1953), 1–17. doi: 10.3354/meps07925
Robertson D. R., Cramer K. L. (2014). Defining and dividing the greater Caribbean: Insights from the biogeography of shorefishes. PloS One 9 (7), e102918. doi: 10.1371/journal.pone.0102918
Rodríguez-Ramírez A., Reyes-Nivia M. C., Zea S., Navas-Camacho R., Garzón-Ferreira J., Bejarano S., et al. (2010). Recent dynamics and condition of coral reefs in the Colombian Caribbean. Rev. Biol. Trop. 58 (SUPPL. 1), 107–131. doi: 10.15517/rbt.v58i1.20027
Rodríguez-Rodríguez J. A., Pineda J. E. M., Trujillo L. V. P., Rueda M. E., Ibarra K. P. (2018). “Ciénaga grande de Santa Marta: The largest lagoon-delta ecosystem in the Colombian Caribbean,” in The wetland book, 2nd ed. Eds. Finlayson C. M., Milton G. R., Prentice R. C., Davidson N. C. (Netherlands: Springer) 757–772. doi: 10.1007/978-94-007-4001-3_126
Rodríguez-Rodríguez D., Sánchez-Espinosa A., Schröder C., Abdul Malak D., Rodríguez J. (2015). Cumulative pressures and low protection: A concerning blend for Mediterranean MPAs. Mar. pollut. Bull. 101 (1), 288–295. doi: 10.1016/j.marpolbul.2015.09.039
Rojas A. M., Ruiz–Agudelo C. A., Diazgranados M. C., Polanco H., Anderson R. (2019). Approach to an integral valuation of mangrove’s ecosystem services in a marine protected area. Colombian pacific region. J. Environ. Economics Policy 8 (3), 322–342. doi: 10.1080/21606544.2019.1584127
Rueda M., Marmol D., Viloria E., Doncel O., Rico F., Garcia L., et al. (2010). Identificación, ubicación y extensión de caladeros de pesca artesanal e industrial en el territorio marino-costero de Colombia (INCODER, AGENCIA NACIONAL DE HIDORCARBUROS-ANH: INVEMAR).
Sánchez J. A., Bejarano S., Herrera S. (2021). Editorial: SeaFlower biosphere reserve: New findings and trends in the largest Caribbean marine protected area. Front. Mar. Sci. 8 (October). doi: 10.3389/fmars.2021.772150
Sato C. F., Lindenmayer D. B. (2018). Meeting the global ecosystem collapse challenge. Conserv. Lett. Santa Marta, Colombia: Instituto de Investigaciones Marinas y Costeras José Benito Vives de Andréis 11 (1), 1–7. doi: 10.1111/conl.12348
SiBM (2021). Sistema de información sobre biodiversidad Marina (INVEMAR). Available at: https://siam.invemar.org.co/sibm.
Spalding M. D., Fox H. E., Allen G. R., Davidson N. C., Ferdaña Z. A., Finlayson M., et al. (2007). Marine ecoregions of the world: A bioregionalization of coastal and shelf areas. BioScience 57 (7), 573–583. doi: 10.1641/B570707
Stelzenmüller V., Coll M., Cormier R., Mazaris A. D., Pascual M., Loiseau C., et al. (2020). Operationalizing risk-based cumulative effect assessments in the marine environment. Sci. Total Environ. 724, 138118. doi: 10.1016/j.scitotenv.2020.138118
Stelzenmüller V., Fock H. O., Gimpel A., Rambo H., Diekmann R., Probst W. N., et al. (2015). Quantitative environmental risk assessments in the context of marine spatial management: Current approaches and some perspectives. In ICES J. Mar. Sci. 72 (3), 1022–1042. doi: 10.1093/icesjms/fsu206
Taylor E., Baine M., Killmer A., Howard M. (2013). Seaflower marine protected area: Governance for sustainable development. Mar. Policy 41, 57–64. doi: 10.1016/j.marpol.2012.12.023
Tulloch V. J. D., Turschwell M. P., Giffin A. L., Halpern B. S., Connolly R., Griffiths L., et al. (2020). Linking threat maps with management to guide conservation investment. Biol. Conserv. 245, 108527. doi: 10.1016/j.biocon.2020.108527
UNEP, WCMC (2006). “MALPELO FAUNA AND FLORA SANCTUARY,” in Protected areas and worl heritage sites (United Nations Environmente Programme, World Conservation Monitoring Centre).
Uribe E., Etter A., Luna-Acosta A., Diazgranados M. C., Acosta A., Alonso D. (2020a). Lista roja de los ecosistemas marinos y costeros de Colombia (versión 1) (Pontificia Universidad Javeriana & INVEMAR: Conservación Internacional).
Uribe E., Luna-Acosta A., Etter A. (2020b). Red list of ecosystems: Risk assessment of coral ecosystems in the Colombian Caribbean. Ocean Coast. Manage. 199 (November 2019). doi: 10.1016/j.ocecoaman.2020.105416
Villate Daza D. A., Moreno H. S., Portz L., Manzolli R. P., Bolívar-Anillo H. J., Anfuso G. (2020). Mangrove forests evolution and threats in the Caribbean sea of Colombia. Water (Switzerland) 12 (4), 1113. doi: 10.3390/W12041113
Williams B. A., Venter O., Allan J. R., Atkinson S. C., Rehbein J. A., Ward M., et al. (2020). Change in terrestrial human footprint drives continued loss of intact ecosystems (Supplemental information). One Earth 3 (3), 371–382. doi: 10.1016/j.oneear.2020.08.009
Yanes A., Botero C. M., Arrizabalaga M., Vásquez J. G. (2017). Methodological proposal for ecological risk assessment of the coastal zone of antioquia, Colombia. Ecol. Eng. 130 (January), 242–251. doi: 10.1016/j.ecoleng.2017.12.010
Keywords: red list of ecosystems, climatic threats, anthropogenic threats, cumulative impact maps, national scale analysis
Citation: Uribe ES, Etter A, Luna-Acosta A, Diazgranados MC, Alonso D, Chasqui L, Osorno A, Acosta A, Rodríguez-Rodríguez A, Ricaurte-Villota C, Escobar L and Giraldo A (2022) A comprehensive threat analysis to support the red list of marine and coastal ecosystems of Colombia. Front. Mar. Sci. 9:962044. doi: 10.3389/fmars.2022.962044
Received: 05 June 2022; Accepted: 28 October 2022;
Published: 24 November 2022.
Edited by:
Rowan Trebilco, Centre for Marine Socioecology, AustraliaReviewed by:
Skipton Woolley, Commonwealth Scientific and Industrial Research Organisation (CSIRO), AustraliaKarim Abdelhai, Egyptian Ministry of Environment, Egypt
Calvin Lee, The University of Hong Kong, Hong Kong SAR, China
Copyright © 2022 Uribe, Etter, Luna-Acosta, Diazgranados, Alonso, Chasqui, Osorno, Acosta, Rodríguez-Rodríguez, Ricaurte-Villota, Escobar and Giraldo. This is an open-access article distributed under the terms of the Creative Commons Attribution License (CC BY). The use, distribution or reproduction in other forums is permitted, provided the original author(s) and the copyright owner(s) are credited and that the original publication in this journal is cited, in accordance with accepted academic practice. No use, distribution or reproduction is permitted which does not comply with these terms.
*Correspondence: Edwin S. Uribe, dXJpYmUtZUBqYXZlcmlhbmEuZWR1LmNv