- 1Australian Institute of Marine Science, Indian Ocean Marine Research Centre, Perth, WA, Australia
- 2Oceans Institute, The University of Western Australia, Indian Ocean Marine Research Centre, Perth, WA, Australia
- 3Australian Institute of Marine Science, Cape Cleveland, QLD, Australia
- 4School of Biological Sciences, The University of Western Australia, Perth, WA, Australia
- 5School of Life and Environmental Sciences, Deakin University, Warrnambool, VIC, Australia
- 6School of Life Sciences, University of Technology Sydney, Sydney, NSW, Australia
- 7New South Wales Department of Primary Industries, Sydney Institute of Marine Science, Mosman, NSW, Australia
Subsea pipelines and wells installed to support the oil and gas industry represent some of the most extensive and numerous anthropogenic structures throughout global marine ecosystems. There remains a paucity of information on the habitat value of these structures for fishery target species and, as a result, little understanding of how decommissioning should be conducted to minimise impacts to populations of these economically and socially important species. We assess the diversity and abundance of species that are targets of recreational and commercial fisheries on 33 subsea wells and 17 pipelines across the tropical northwest and temperate southeast marine regions of Australia. We examine relationships between fish identity and abundance and a range of environmental (e.g., depth, location), infrastructure-specific (e.g., pipeline position, diameter, age, length of pipeline, height of well, position on well), and biological (% cover of epibiota) variables using video filmed by remotely operated vehicles during their routine offshore inspection and maintenance campaigns. A total of 100 fishery target species were observed across subsea well and pipeline infrastructure, 56 species uniquely observed on pipelines and nine unique to wells. The families Lutjanidae (snapper), Serranidae (rock cods, groupers, perch), and Carangidae (trevallies) were most common and abundant on both wells and pipelines. In the northwest, lutjanids were most abundant around the base of wells, in shallow depths, on shorter wells, and where pipelines spanned the seafloor. A greater number of fishery target species and abundance of ocean perch (Helicolenus spp.) were also associated with pipelines that spanned the seafloor in temperate southeast Australia. The combined biomass of three species of snapper on wells in the northwest was 1,270 kg, with production levels for these species on each well estimated to be 105.2 g m2 year-1. The present study serves as an important reference point for informing decommissioning decisions for pipeline and well infrastructure and demonstrates the utility of industry-held data for science. We suggest that key predictor variables identified here be incorporated into comprehensive before-after-control-impact scientific studies for specific fields/assets to enable the prediction of potential impacts of decommissioning scenarios on marine communities present and quantification of such impacts after the decommissioning activity has occurred.
1 Introduction
Globally, there is a paucity of knowledge on the influence of subsea wells and pipelines on marine ecosystems. Fundamental to understanding the roles that these structures have in our oceans is insight into the marine communities that interact with them. While, for ~100 years, the oil and gas (O&G) industry has installed structures in the oceans to extract resources (Gourvenec et al., 2022), it is only in recent decades that scientists have been able to access and/or research these structures. Science has traditionally been hampered, to various extents in different regions, by restrictions on access to structures, logistical challenges, and high costs. Yet the science is critically needed to ensure that impacts on marine communities are minimised as these structures are decommissioned.
O&G infrastructure provides additional hard substrata in marine ecosystems that can increase the diversity and abundance of fishes important for recreational and commercial fisheries (Szedlmayer and Shipp, 1994; Gallaway et al., 2009; Bond et al., 2018a; Bond et al., 2018b). Studies documenting high densities of fishery target species on O&G platforms have led to “rigs to reefs” programs where some infrastructure is left in place as habitat for target fishes after decommissioning (e.g., Gulf of Mexico; Love et al., 2003; Kaiser, 2006; Jorgensen, 2009; Cowan and Rose, 2016). A different form of reefing is to repurpose decommissioned O&G structures into artificial reef complexes that incorporate purpose-built reef structures (e.g., King Reef, Exmouth, Western Australia). In addition to platforms, subsea pipelines have been found to possess higher abundances of important fishery species relative to surrounding sand-dominated ecosystems (Love and York, 2005; Bond et al., 2018a; Bond et al., 2018b; McLean et al., 2021a). The concentration of fishery target species on subsea pipelines in northwest (NW) Australia has influenced commercial trap fishing in the region with fishing effort on pipelines ~11.4 times greater per km2 than effort in the rest of the area of the Pilbara Trap Managed Fishery (Bond et al., 2021). Interactions between fisheries and pipelines (positive and negative) have also been examined in the North Sea for different fishing practices (Rouse et al., 2018; Rouse et al., 2020). For these reasons, it is important to understand the mechanisms that promote a high abundance of fishery target species on O&G infrastructure to inform new developments and decommissioning. This knowledge also has implications for structures deployed in the marine renewable energy sector (e.g., wind and tidal power) and purpose-built artificial reefs.
For decades, scientists have sought to understand the extent to which O&G structures create new productivity for fisheries or simply attract/redistribute existing biomass (Lindberg, 1997). Platforms off the coast of California have been found to be among the most productive marine fish habitats globally (Claisse et al., 2014), with most secondary production (80%) associated with fish biomass around the base of these platforms (Claisse et al., 2015). This was linked to shell mounds that housed abundant and diverse communities of fishes and invertebrates that in turn supported predatory fishes (Claisse et al., 2015). It is not known whether platforms in other regions around the world have similar shell mound features that might also generate high productivity. Smith et al. (2016) conducted assessments of a purpose-built artificial reef for fishing off Sydney, Australia, and found evidence for high production of fish communities but considered also “new” production, noting that the productivity measured may not greatly augment net overall productivity due to the contribution of a high number of “visitor” species. Fish production on subsea pipelines is much harder to quantify owing to the nature of these structures (long, narrow corridors), and to our knowledge, no research programs have attempted such analyses. Similarly, there has been no published research that has documented fish production on subsea wells, despite the hundreds of thousands of structures that exist in our oceans and consequently the high proportion of the costs of decommissioning they require (Oil and Gas UK, 2016; CODA, 2021). In Australia, there has been relatively little research on the extent to which O&G structures promote fish production, and this remains a clear knowledge gap.
Important fishery target species can occupy diverse ecological niches that will influence the extent and way in which they associate with O&G structures. For example, pelagic mackerels (Scombridae) and trevallies (Carangidae) are known to be attracted to floating and mid-water fish-attracting devices (FADs) via the provision of structure in open water (a reference point) and associated prey (Dempster and Taquet, 2004). Large schools of these species have been observed around offshore O&G platforms that span the water column and are well lit (Franks, 2000; Simonsen, 2013), suggesting that these structures, particularly when situated in the open ocean, serve a similar function to FADs. Habitat complexity is another important driver of community structure and abundance (Menge and Sutherland, 1976; Martin-Smith, 1993), with complex habitats providing more attachment points for sessile organisms (Hauser et al., 2006) that in turn support more individuals than less complex habitats in their vicinity (Hall and Kingsford, 2021; Kovalenko et al., 2012). Some fishes associate with caves or overhangs, and pipeline spans, well overhangs, and platform beam junctions may be places where these species occur (e.g., Love et al., 2019). Such relationships help explain why higher abundances of demersal fishery species have been observed on subsea pipelines compared to surrounding sand-dominated communities (Bond et al., 2018a; Bond et al., 2018b; McLean et al., 2021a). However, these associations may not necessarily be permanent, as the habitat requirements of fish may change as they grow and mature. Some species may only utilise O&G structures during specific ontogenetic stages (Fujii, 2015; Munnelly et al., 2021). For example, red snapper (Lutjanus campechanus) utilise O&G platforms when young but migrate to less vertically complex structures as they mature (Gallaway et al., 2009). Understanding how species associate with particular structural features of O&G infrastructure is essential for predicting the potential influence that different decommissioning options may have on fish communities and, in turn, commercial fisheries (e.g., plugging and abandonment of wells, removal of pipelines).
The present study analyses videos of subsea wells and pipelines collected using remotely operated vehicle (ROV) deployed by industry in Australia to investigate how a range of environmental and structural variables may influence the diversity and abundance of fishery target species. Furthermore, we provide the first estimates of secondary fish production for important fishery target species on wells globally and for O&G structures in Australia. We predict positive relationships between fishery target species abundance and the complexity of colonising benthic communities and the availability of shelter (i.e., pipeline spans, well height). Furthermore, we expect secondary fish production to be high on subsea wells. With the projected global extent of artificial structures increasing (Bugnot et al., 2021; Gourvenec et al., 2022), the results of this research will not only inform decommissioning of O&G structures but also advise reefing of structures, the creation of new artificial reefs, and the design of new infrastructure for O&G and marine renewable energy industries. With a focus on subsea wells and pipelines, the present study provides insights into fish communities on these globally understudied O&G structures.
2 Methods
Using ROV imagery obtained by industry during routine offshore inspection and maintenance works, we were able to document and describe the diversity and abundance of important fishery target species present on subsea wells and pipelines in the NW and southeast (SE) marine regions of Australia. As we utilised existing imagery, we were limited in our ability to examine the potential influence of certain structural elements of wells and pipelines on fishery species abundance, as replication, stratification, and standardisation in sampling were not possible. As illustrated in Table S1 and Table S2, there was high variability in surveys, e.g., surveys performed in different years, differences in lengths of surveys. Furthermore, there were differences in ROV field of view (FOV), altitude, speed, resolution of imagery, etc. Considering these inconsistencies and limitations, we report on patterns in fishery target species abundance in response to features quantifiable from this imagery such as the extent of burial of pipelines, certain areas of subsea wells (Christmas tree, tree cap assembly, etc.), and the percent cover of particular biota on these structures.
2.1 Study sites and infrastructure descriptions
The present study analysed data from ROV imagery collected by the O&G industry during routine offshore inspection, maintenance, and repair campaigns for subsea pipelines and wells in NW and SE Australian waters (Figure 1). Additional data were included from five independent studies (McLean et al., 2017; Bond et al., 2018c; McLean et al., 2018; McLean et al., 2020; Ierodiaconou et al., 2021) that each varied in the way in which the imagery of structures was analysed for ecological data, detailed in sections that follow (Tables S1, S2).
For subsea wells, we analysed imagery collected from a single point in time (one survey period) from 31 wells in the NW in depths of 74–155 m and two wells in the SE in 128- and 155-m depths (Table S1). For subsea pipelines, we analysed imagery from seven pipelines in the NW and 10 pipelines in the SE, again from ROV surveys conducted at one point in time (Figure 1). As very few target species were observed at depths below 400-m depth, this provided a depth limit for video analysis (Table S2).
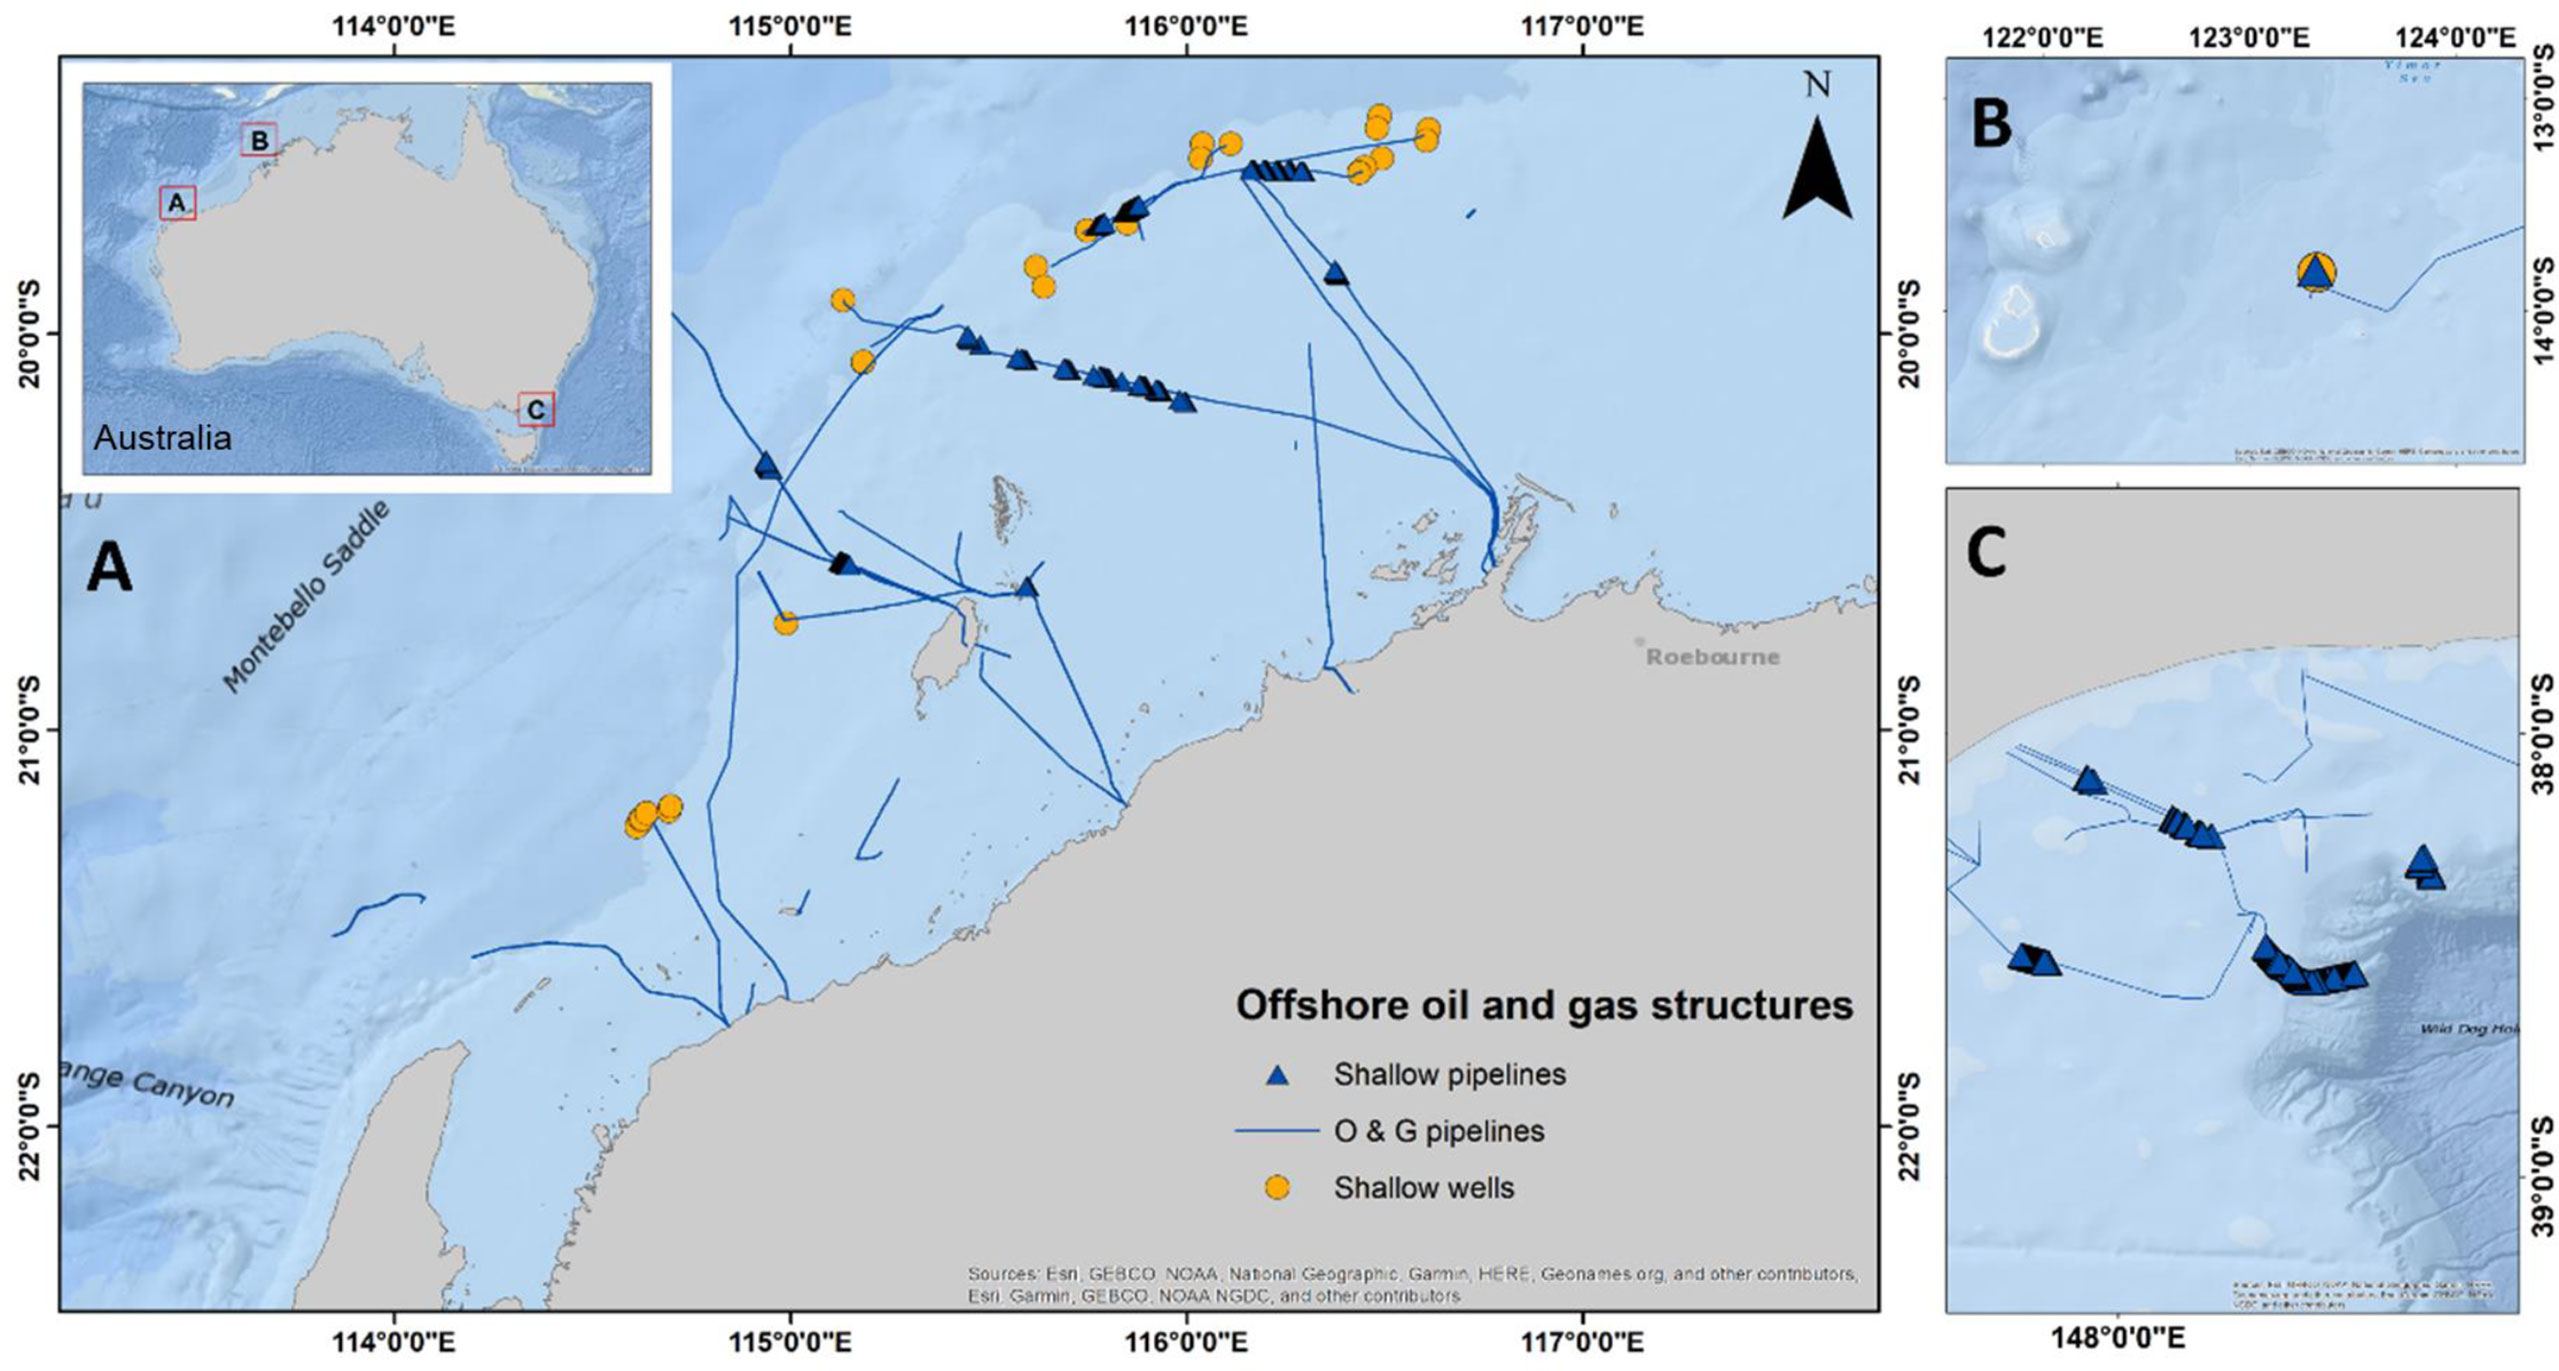
Figure 1 Location of wells (<150 m NW and<160 m SE) and pipelines (<400 m) surveyed for abundance of species targeted by fisheries in (A) NW, (B) NW (Browse), and (C) SE marine regions of Australia. NW = north-west, SE = south-east.
2.2 Remotely operated vehicle (ROV) imagery analysis
All analyses of colonising epibiotic communities used the specialised software program TransectMeasure (SeaGIS, 2020a). “Virtual” quadrats were placed on the ROV imagery (photographs taken from the video), overlapping infrastructure, with 20 points overlaid on each quadrat in a 5 × 4 grid layout. Benthic biota underneath each point was identified using an adaptation of the Collaborative and Annotation Tools for Analysis of Marine Imagery (CATAMI) classification scheme (Althaus et al., 2015). Identification was to the lowest taxonomic resolution possible, and relevant morphological characteristics were noted (e.g., encrusting, complex or taller erect forms). Due to the range in the quality of the images, we pooled categories of epibiota to broad groups (e.g., sponges, soft corals) to facilitate analyses across all structures. Percent cover data were therefore obtained for each broad group observed from these points. In addition to this percent cover data, for each quadrat, we also recorded the complexity of the epibenthic community by estimating the height of the benthic biota for the entire quadrat as 0, negligible; 1, low (0–20 cm); 2, medium (20–40 cm); and 3, high (>40 cm) and density (percent cover of quadrat) as 0, none; 1,<25%; 2, 25%–75%; 3, >75%. Epibiota height was estimated using the known dimensions of structures as a reference.
Analyses of species that were fishery targets used the specialised software program EventMeasure Stereo (SeaGIS, 2020b). Where fish could not be reliably identified to species level, they were recorded to the next lowest taxonomic level possible (typically genus or family). Target species were defined as those that are retained by recreational and commercial fisheries that operate in the NW and SE regions (Butler et al., 2002; Gaughan and Santoro, 2021) and were also identified from online fishing sources (e.g., West resource; East resource) and knowledge of the authors. A full list of these species is provided for wells in Table S3 and pipelines in Table S4. The size (fork length–distance from snout to fork of tail) of all individuals that were abundant target species was estimated in 10-cm-size bins using the known sizes of components of wells and pipelines as a visual reference for size. Methods for analysing the abundance of fishery target species differed for wells and pipelines and are described in sections that follow.
2.2.1 Analysis of ROV imagery of subsea wells
Ten non-overlapping FOV images were obtained in each of the six sections of each well: tree cap assembly, Christmas tree general, flow base, seafloor around structure, seafloor beneath structure, and water column around structure (Figure 2A). It was not possible to standardise the size of these FOV images due to high variability in ROV movements relative to the wells; however, the point classification enabled quantification of percent cover data of the benthic community from these images (Table 1) using the methods described in ROV imagery analysis.
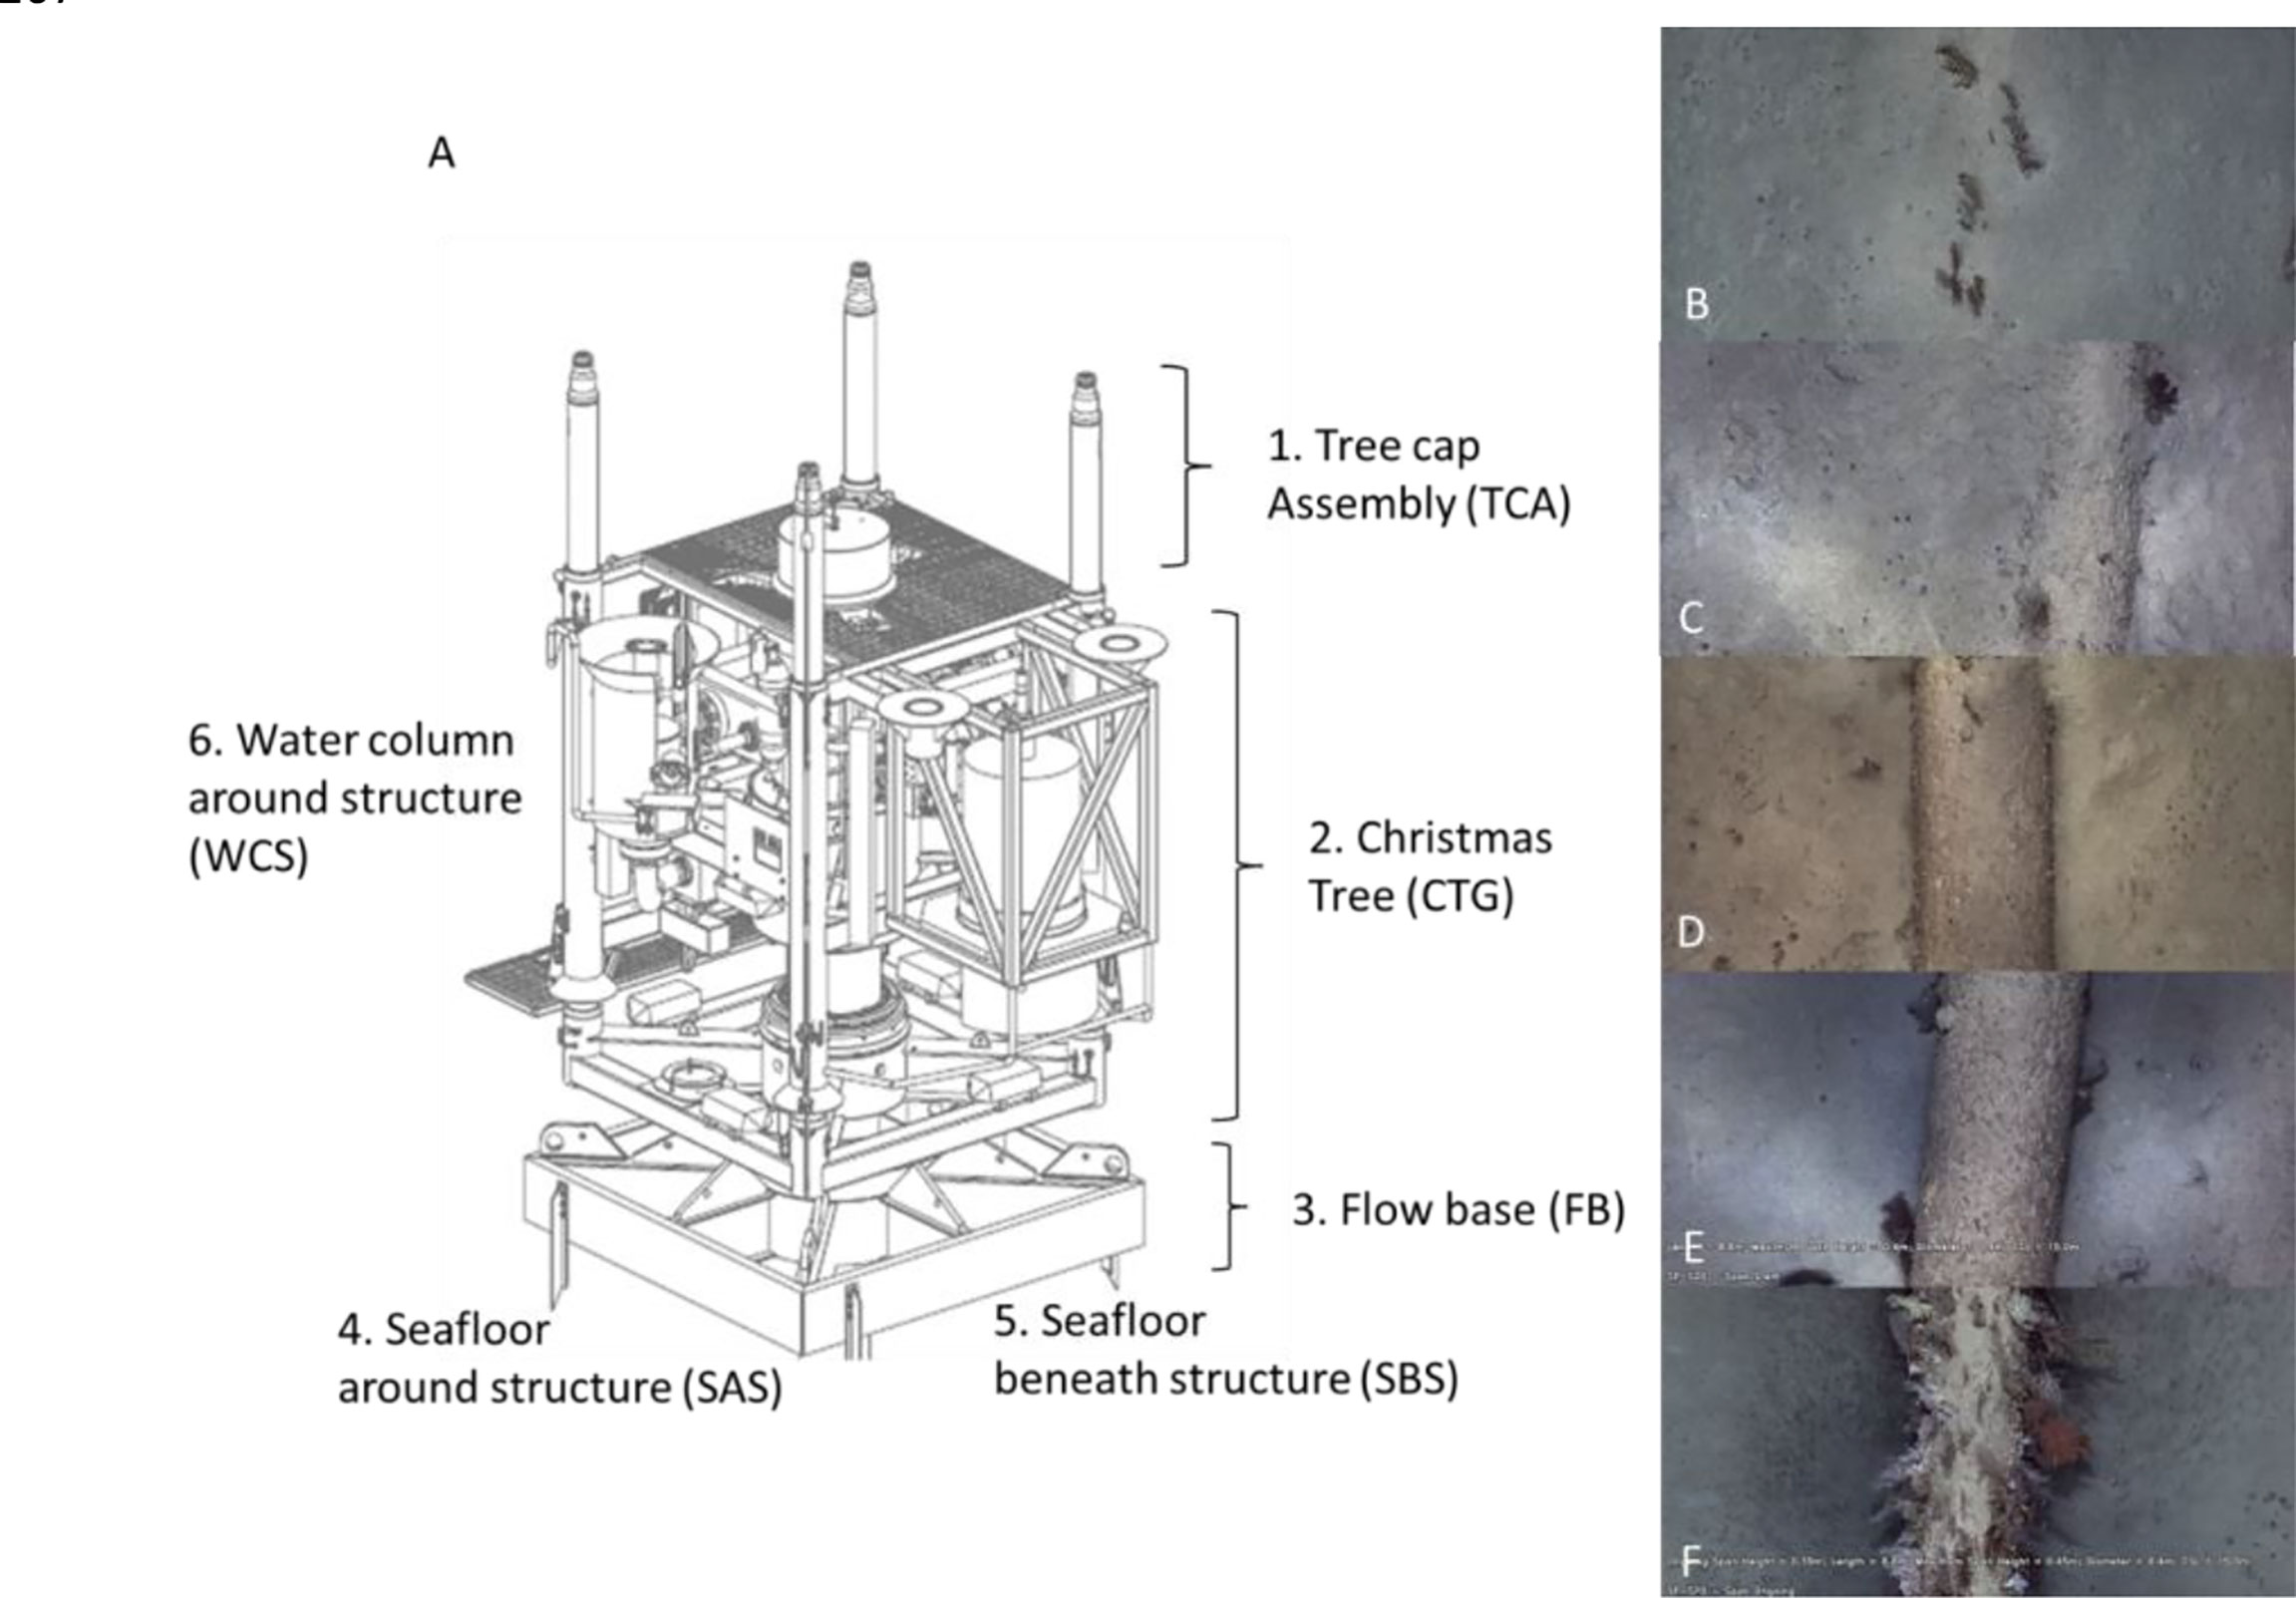
Figure 2 (A) Schematic of a subsea well (adapted from McLean et al., 2018) indicating the different sections for which separate measures of epibiota and abundance of fishery target species were measured. The total abundance of all fish species was also obtained for the entire well (highest MaxN across the sections). (B–F) Features of pipelines assessed from ROV imagery including the extent of burial/spanning (“pipeline position”) ranging from completely buried (0 = A) to more than half buried (1 = B), resting on seafloor (2 = C), underside of pipeline not touching seafloor (3 = D), and pipeline span >0.5 m above seafloor (4 = E).
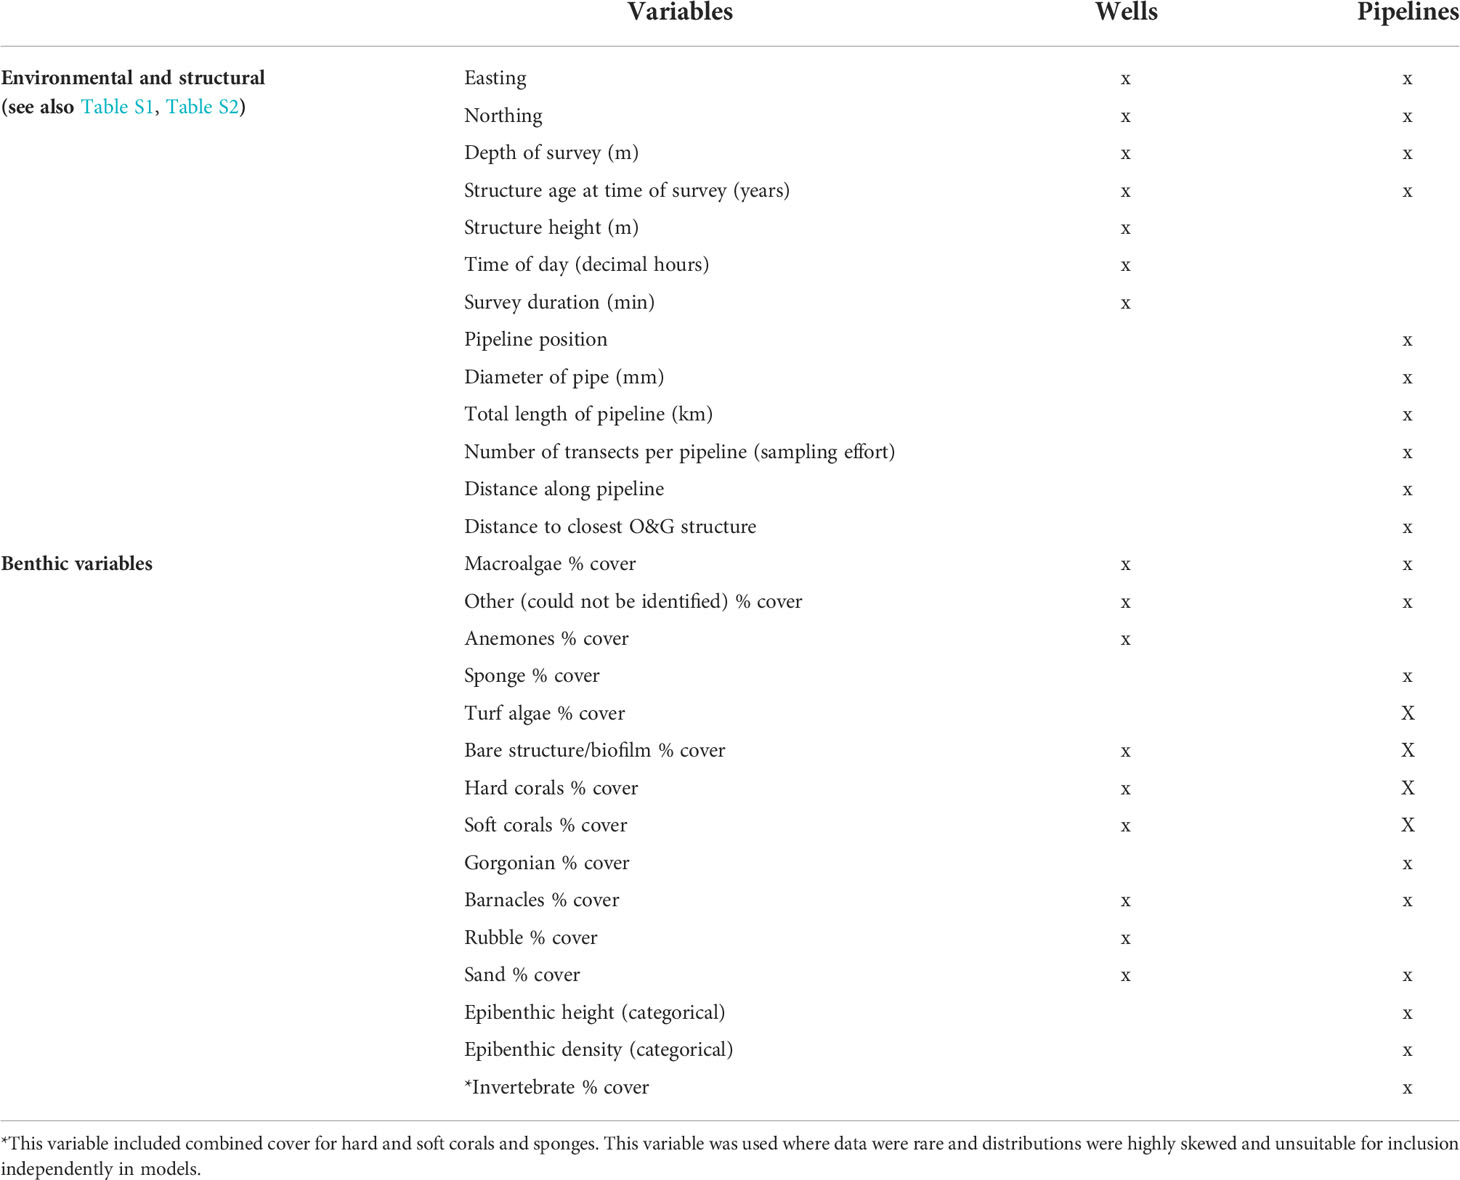
Table 1 List of variables recorded to examine relationships with fish communities observed on different infrastructure.
Abundance counts of fishes and other mobile fauna were obtained by counting the maximum number of each species present within the FOV at a single frame of the ROV video (MaxN). This conservative measure prevents repeated counts of the same individuals leaving and reentering the FOV (Cappo et al., 2007). In addition to an overall MaxN measure, we obtained separate MaxN measures for each target species from the six different sections of the well shown in Figure 2A. We acknowledge that MaxN measures do typically underestimate measures of actual abundance, and this may very well be the case here, but we predict that this difference would be quite conservative given the relatively small size of the structures. It was not possible to use the historical imagery of wells to attempt to count all fish species present given the nature of the surveys that often stopped and started again, focused on particular sections for extended periods, etc.
The length of ROV well surveys varied from rapid general visual inspections (<15 min) to detailed structural assessments (>2 h; Table S1), and as such, “survey time” (among other variables) was included as a variable in statistical analyses (see Data analysis).
The data set analysed here (n = 13 wells) was supplemented with the addition of fish and benthic data obtained from independent studies (n = 20 wells; Ierodiaconou et al., 2021; McLean et al., 2018.). Cooper Energy wells were analysed using the same methods described in Analysis of ROV imagery of subsea wells with the exception that epibenthic community height and density were not recorded for these wells. For wells operated by Woodside, only a total MaxN for each well was recorded (McLean et al., 2018). Percent cover of benthic biota and complexity were estimated for each side of these wells (McLean et al., 2018) rather than by the use of the quadrat method. Given the small size of these structures (Table S1), we assumed that the data obtained for percent cover and complexity of benthos were comparable across all types of wells.
2.2.2 Analysis of ROV imagery of pipelines
The position of pipelines relative to the seafloor (pipeline position) was scored following McLean et al. (2020) with the following: 0, completely buried; 1, pipeline showing above sediment but more than halfway buried; 2, pipeline touching the seafloor but making a closed crevice; 3, underside of pipeline not touching the seafloor (spanning); and 4, pipeline >0.5 m above the seafloor (Figure 2). This pipeline position information was recorded every ca. 10 m along each pipeline. For analysis of the effects of pipeline position, benthic biota, time of day, depth, etc., on abundance and diversity of fishery target species, data was split into 50-m video “transects” each separated by a 10-m gap.
Benthic biota type, complexity, and cover were analysed from quadrats as described in ROV imagery analysis (although refer to Using independent ecological data on subsea pipelines for other data included in the project). For pipelines, each “virtual” quadrat was of approximately 1.5 m2 (~30 cm × ~50 cm, depending on ROV altitude), placed on a freeze-framed image taken every 10 m along each pipeline, spanning the pipeline and seafloor to either side. All fish and other mobile fauna encountered in each 50-m transect were identified to the lowest taxonomic level possible, and their abundances were summed to give a total abundance per transect.
2.2.2.1 Using independent ecological data on subsea pipelines
To supplement the data available for the present study, we included four additional pipeline data sets from independent studies: Cooper flowlines and umbilicals (seven; Ierodiaconou et al., 2021), Echo Yodel (Bond et al., 2018c), 2TL (McLean et al., 2017), and Pluto pipelines (McLean et al., 2020; see Table S2). Cooper pipelines were surveyed in the same manner as is described in Analysis of ROV imagery of pipelines. Echo Yodel and 2TL were surveyed using 5-m transect lengths, whereas Pluto used 10-m transects. To make these transects comparable with the 50-m transects used for all other locations, sets of adjacent shorter transects were pooled to create 50-m transects. All pipeline surveys were conducted during daylight hours; therefore, only the daytime imagery from these additional independent data sets was included. Data from the additional pipelines also recorded epibenthic communities as a single combined score for epibenthic height and density (McLean et al., 2017; McLean et al., 2020), which was different to the approach used for the present study. Consequently, these measures were considered separately for these pipelines. Furthermore, analysis of epibenthic communities on Echo Yodel, 2TL, and Pluto focused only on the pipeline and did not include the adjacent seabed (McLean et al., 2017; Bond et al., 2018c; McLean et al., 2020); thus, the benthic category “sand” was likely to be underrepresented in the data. These independent studies also did not estimate fork lengths of selected target species.
2.3 Data analysis
We recorded environmental, structural, and biological variables to examine their influence on the diversity and abundance of species targeted by fisheries (Table 1). However, we note that ROV imagery was not collected by industry with the goal of hypothesis-testing, so it did not include balanced sampling designs. Thus, our interpretations of outcomes cannot exclude confounding effects. For example, the deepest pipeline (Jansz) was also one of the most recently deployed, so any patterns in fish abundance and diversity could have been due to either depth or age or some combination of the two variables. This is discussed further in Discussion. Additionally, our ability to identify epibenthic communities was constrained by the quality of imagery, which required pooling of biota into broad categories (e.g., sponges, soft corals) for analysis. This meant that we were unable to perform detailed analyses to examine patterns in the distribution and abundance of these colonising communities. With only two wells surveyed in the SE, we were limited to presenting the total fishery target species list for each well and component of each well.
2.3.1 Multivariate analyses of fishery target species abundance
Multivariate tests were used to explore patterns in fishery target species across depths. Prior to analyses, we used a PERMDISP analysis (Anderson, 2004) to test the null hypothesis of no difference in dispersion among depths. The test is a multivariate analogue to a Levene’s test (Levene, 1960). Dispersion of the data did not differ for the different depth categories examined for NW wells [p(perm) = 0.47] but did for NW pipelines [p(perm)< 0.01] and SE pipelines [p(perm)< 0.01]. Multivariate dispersion was examined visually using a principal coordinate (PCO) analysis (Anderson et al., 2008) in the software PRIMER V7 (Clarke and Gorley, 2015). Unconstrained patterns in abundance were analysed using a Bray–Curtis dissimilarity matrix. Individual species or benthic habitat types that were likely responsible for any of the observed differences were identified using Pearson correlations of their abundance with the canonical axes. These relationships are shown as vectors displayed on the PCO plot. Prior to running the PCO analysis, a draftsman plot was produced to examine correlations among Table 1. For wells, only easting and northing were correlated (0.95), with the former removed from the data prior to running the PCO analysis. For NW pipelines, easting and northing were correlated with distance measures and epibenthic density and complexity, whereas epibenthic density and complexity were correlated with a range of epibiota categories. For this reason, easting, northing, distance along pipeline, distance to closest O&G structure, epibenthic density, and epibenthic height were removed prior to PCO analysis.
2.3.2 Univariate analyses of richness and abundance of fishery target species
The influence of variables listed in Table 1. on fish richness and abundance on NW wells and pipelines was investigated using generalised additive models (GAMs; Table 3; Hastie and Tibshirani, 1986; Fisher et al., 2018). Because of a strong collinearity, a full subset approach was used to fit all combinations of predictor variables up to a maximum of two (to prevent overfitting and ensure models remained ecologically interpretable). Some benthic variables were combined due to rarity and highly skewed distributions. Time of day was treated as a circular variable using the function (bs=‘cc’) in mgcv (Wood, 2011). Predictor variables with correlations greater than 0.28 were included in the model set but were not included in the same model. The best model had the fewest variables (most parsimonious) and was the one with lowest Akaike information criterion corrected for small sample sizes (AICc). These best models were also within two AICc units of the lowest AICc value (Burnham and Anderson, 2003; Symonds and Moussalli, 2011). As recommended by O’Hara and Kotze (2010), we used untransformed abundance metrics as our response variables. Models were fitted using a Tweedie error distribution (Tweedie, 1984). A Tweedie model is an extension of a compound Poisson model derived from the stochastic process where a gamma distribution is used for the counted or measured objects (i.e., number of fishes) and has an advantage over delta-type two-step models by handling the zero data in a unified way. All GAM modelling and plots used the R language for statistical computing (R Development Core Team, 2019) with the package mgcv (Wood, 2011) and ggplot2 (Wickham, 2016) and based on the scripts found in Fisher et al. (2018).
2.3.3 Fish production estimates for subsea wells
Estimates were obtained for wells in the NW for three snapper species that had sufficient data on abundance and life history traits and ecology. These included Lutjanus argentimaculatus (mangrove jack), Lutjanus malabaricus (saddletail snapper), and Lutjanus russellii (Moses’ snapper). Wells were chosen for this modelling over pipelines as the ROV imagery covered most, if not all, of the structure and therefore was most likely to provide an accurate estimate of total abundance (and therefore density and biomass) for these species. To facilitate estimates of production, we first had to calculate the volume of “reef” habitat for wells. The average height of wells surveyed here was 6.5 m (data provided from industry; Table S1), and from imagery, we estimated dimensions to be 4 m × 4 m (seabed footprint). However, as we included fish observed within ~2 m of the well structure, we extended the area of well habitat sampled to 8 m × 8 m (seabed footprint m2) × 6.5 m height of well to a volume of 416 m3.
To estimate fish production, we followed the method of Smith et al. (2016), which assumes a steady-state population structure. This allowed us to assume that relative production (i.e., the production to biomass ratio) was equal to the instantaneous total mortality of an organism (Dickie, 1972; Mertz and Myers, 1998; Randall and Minns, 2000), an assumption at the basis of much ecosystem modelling (Christensen and Pauly, 1992). Here, Pi=Bi×Zi, with Pi being production (kg per year), Bi is fish biomass on a structure, and Zi is the instantaneous total mortality rate. Total mortality includes the sum of natural ( M) and fishing ( F ) mortality rates ( Zi=Mi+Fi ). In this instance, fishing mortality is assumed to be zero as commercial fishing activities in these zones are negligible and they are too remote for access by recreational fishers.
We were interested to determine production that was new (Pnew ) by incorporating time into the equation such that new production accounted for the proportion of a year that a particular species spent on a structure Pnew=Pi×tprop . In this way, Pnew equated to the local production that would be lost if the structure was to be removed during decommissioning. The proportion of time likely spent on wells (residency) by L. malabaricus and L. russellii was estimated based on diel observations of the presence of these species on a pipeline in this region (Bond et al., 2018c) and estimated for L. argentimaculatus based on publications on the behaviour of this species (Table 2). One limitation of our estimate of tprop was that it did not account for potential seasonal movements of species away from structure.

Table 2 Estimated mortality (natural M and fishing F), level of residency (tprop), and biomass metrics.
To estimate biomass ( Bi ), we first required an estimate of the average length of each species on wells. This “average” was calculated from the mean length of individuals that were measured from stereo-video imagery obtained from subsea pipelines and platforms in the NW region (Pradella et al., 2014; Bond et al., 2018a; Bond et al., 2018b; McLean et al., 2020; McLean et al., 2021a). Average lengths (499 mm, L. argentimaculatus; 429.4 mm, L. malabaricus; 337 mm, L. russellii) were converted into biomass using the equation Bi=aLb (Table 2). Here, a was a parameter describing body shape and condition, L was length, and b was allometric growth in body proportions. We note that the use of MaxN here is likely to underestimate the total abundance of fishery target species for these structures, and therefore, measures derived from the use of MaxN (e.g., Production) may likewise be underestimates.
3 Results
3.1 Fishery target species on subsea wells
A total of 42 target species were observed on subsea wells, with 35 in the NW and 7 on wells in the SE regions (Table S3). The most speciose families were Serranidae (n = 12; rockcods/groupers/perch), Lutjanidae (n = 10 snapper species), and Carangidae (n = 8 trevally species). Examples of fishery target species associating with subsea wells are shown in Figure S1. The wells with the highest richness of fishery target species were AP2 and PER01 (14 spp. each), then AP3, WA7, and BAL08 (13 spp. each) (Table 3). Those with the least were Scindian2XT (n = 4 spp., 9 individuals) and 4-Well (4 species, 31 individuals).
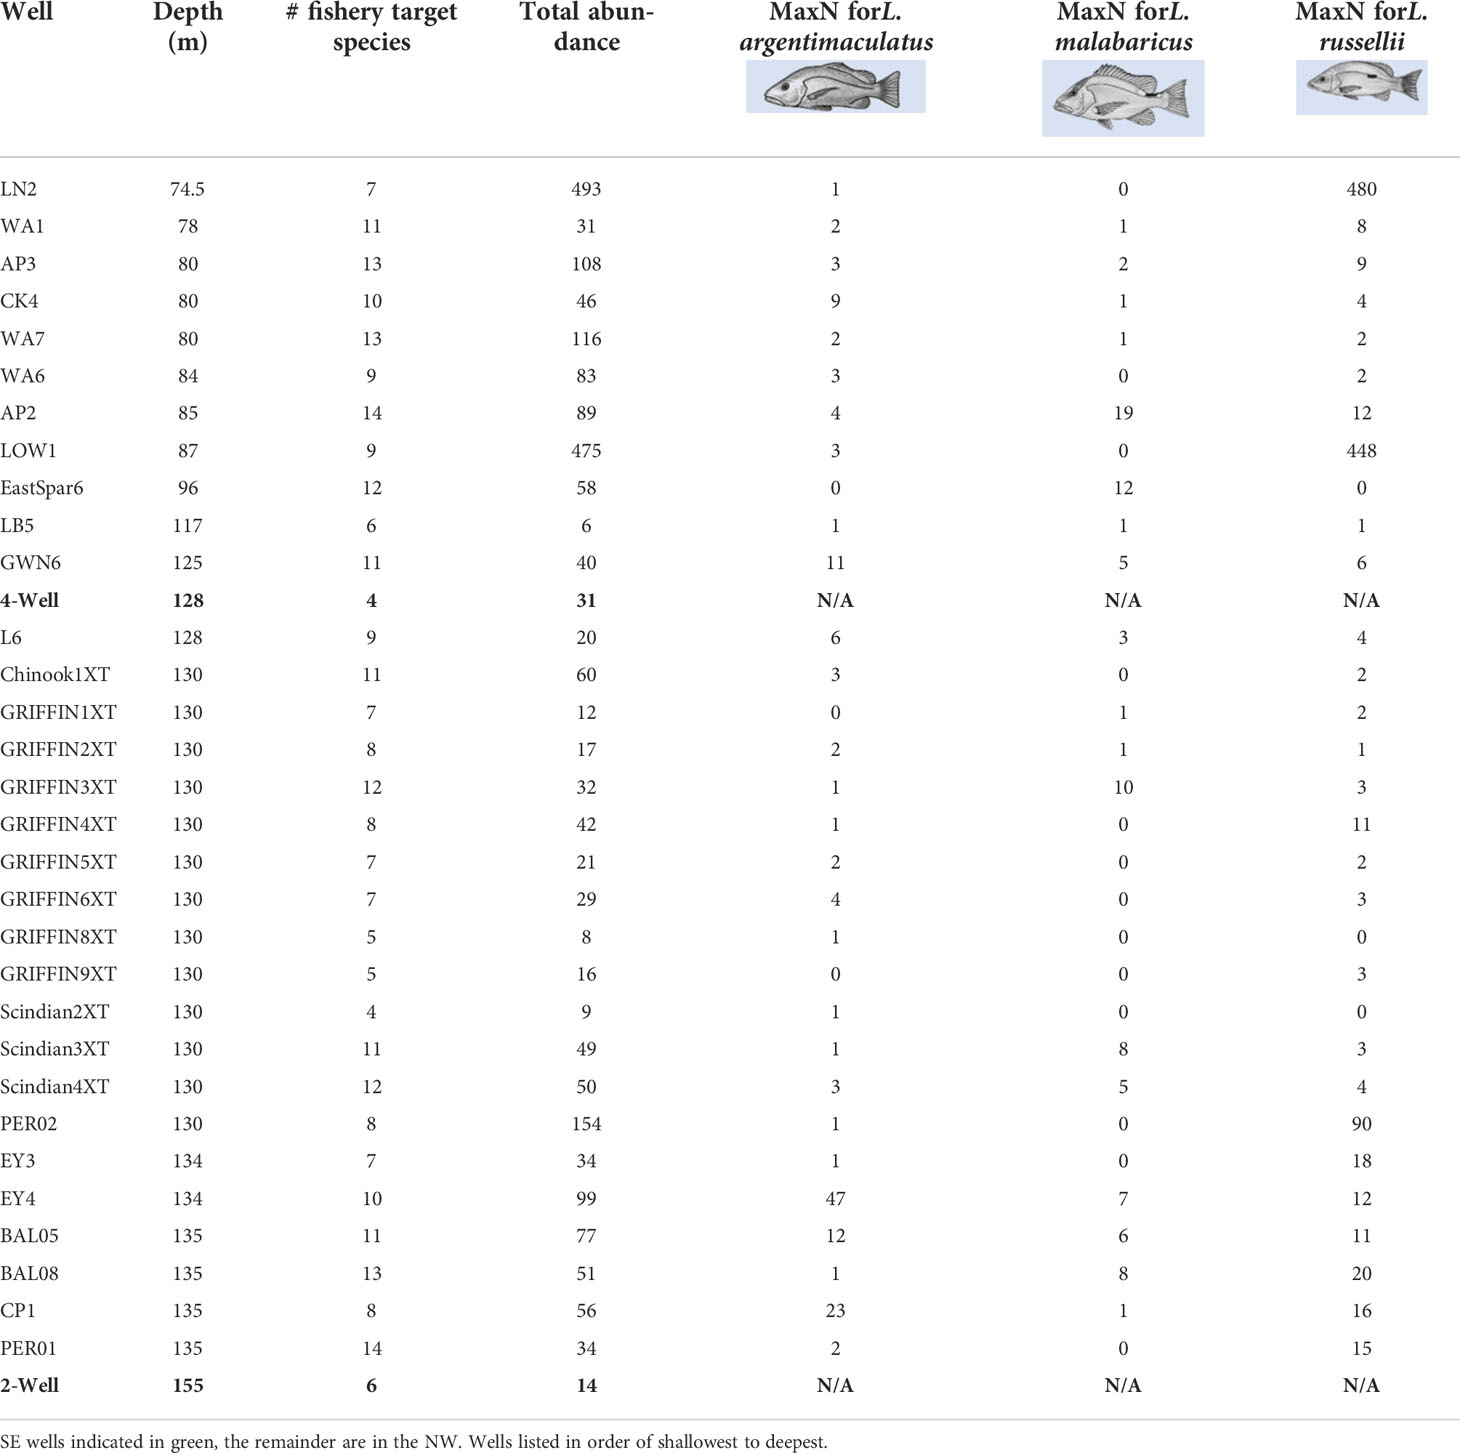
Table 3 Total relative abundance (sum of MaxNs) of all fishery target species and three of the most common and abundant snapper (Lutjanus) species observed on remotely operated vehicle imagery of subsea wells.
The most abundant species observed on wells in the NW were L. russellii (Moses’ snapper; n = 1,192; Table 3), L. vitta (brownstripe snapper; n = 321), Seriola dumerili (amberjack; n = 158), and L. argentimaculatus (mangrove jack; n = 151; Table 3) (Table S3). In the SE, the most abundant target species were Nemadactylus macropterus (jackass morwong; n = 16, 4-well only), Helicolenus spp. (ocean perch; n = 15, 2-Well, 4-Well), and Pseudophycis spp. (cod; n = 9, 2-Well, 4-Well) (Table S3). The highest abundance of target species (493 individuals) occurred on LN2, the shallowest surveyed well, followed by the similarly shallow LOW1. Most of these fishes were L. russellii, with 480 individuals observed on LN2 and 448 on LOW1 (Table 3). PER02 in 130-m depths had the next highest abundance of fishery target species with 154.
The most ubiquitous fishery target species on subsea wells in the NW were L. russellii (90% wells), L. argentimaculatus (90%), Cephalopholis sonnerati (tomato rockcod; 90%), and S. dumerili (84%). L. malabaricus was also included in modelling of fish production, as it was a common species occurring at 58% of wells (Table 3).
The greatest number of fishery target species (richness) occurred on the seafloor both around and under the structure, followed by the main Christmas tree structure (Figure 3). The total abundance of target species was greatest on the seafloor around the structure followed by the seafloor beneath the structure (Figure 3). The lowest abundance occurred in the water column around the structure and in the tree cap assembly. The two most abundant and common families of target species on wells in the NW exhibited slightly different patterns in spatial distribution around wells. Serranidae (groupers) were more abundant on the seafloor beneath the structure and within the Christmas tree of the well, whereas Lutjanidae (snappers) were most abundant on the seafloor around the structure (Figure 3).
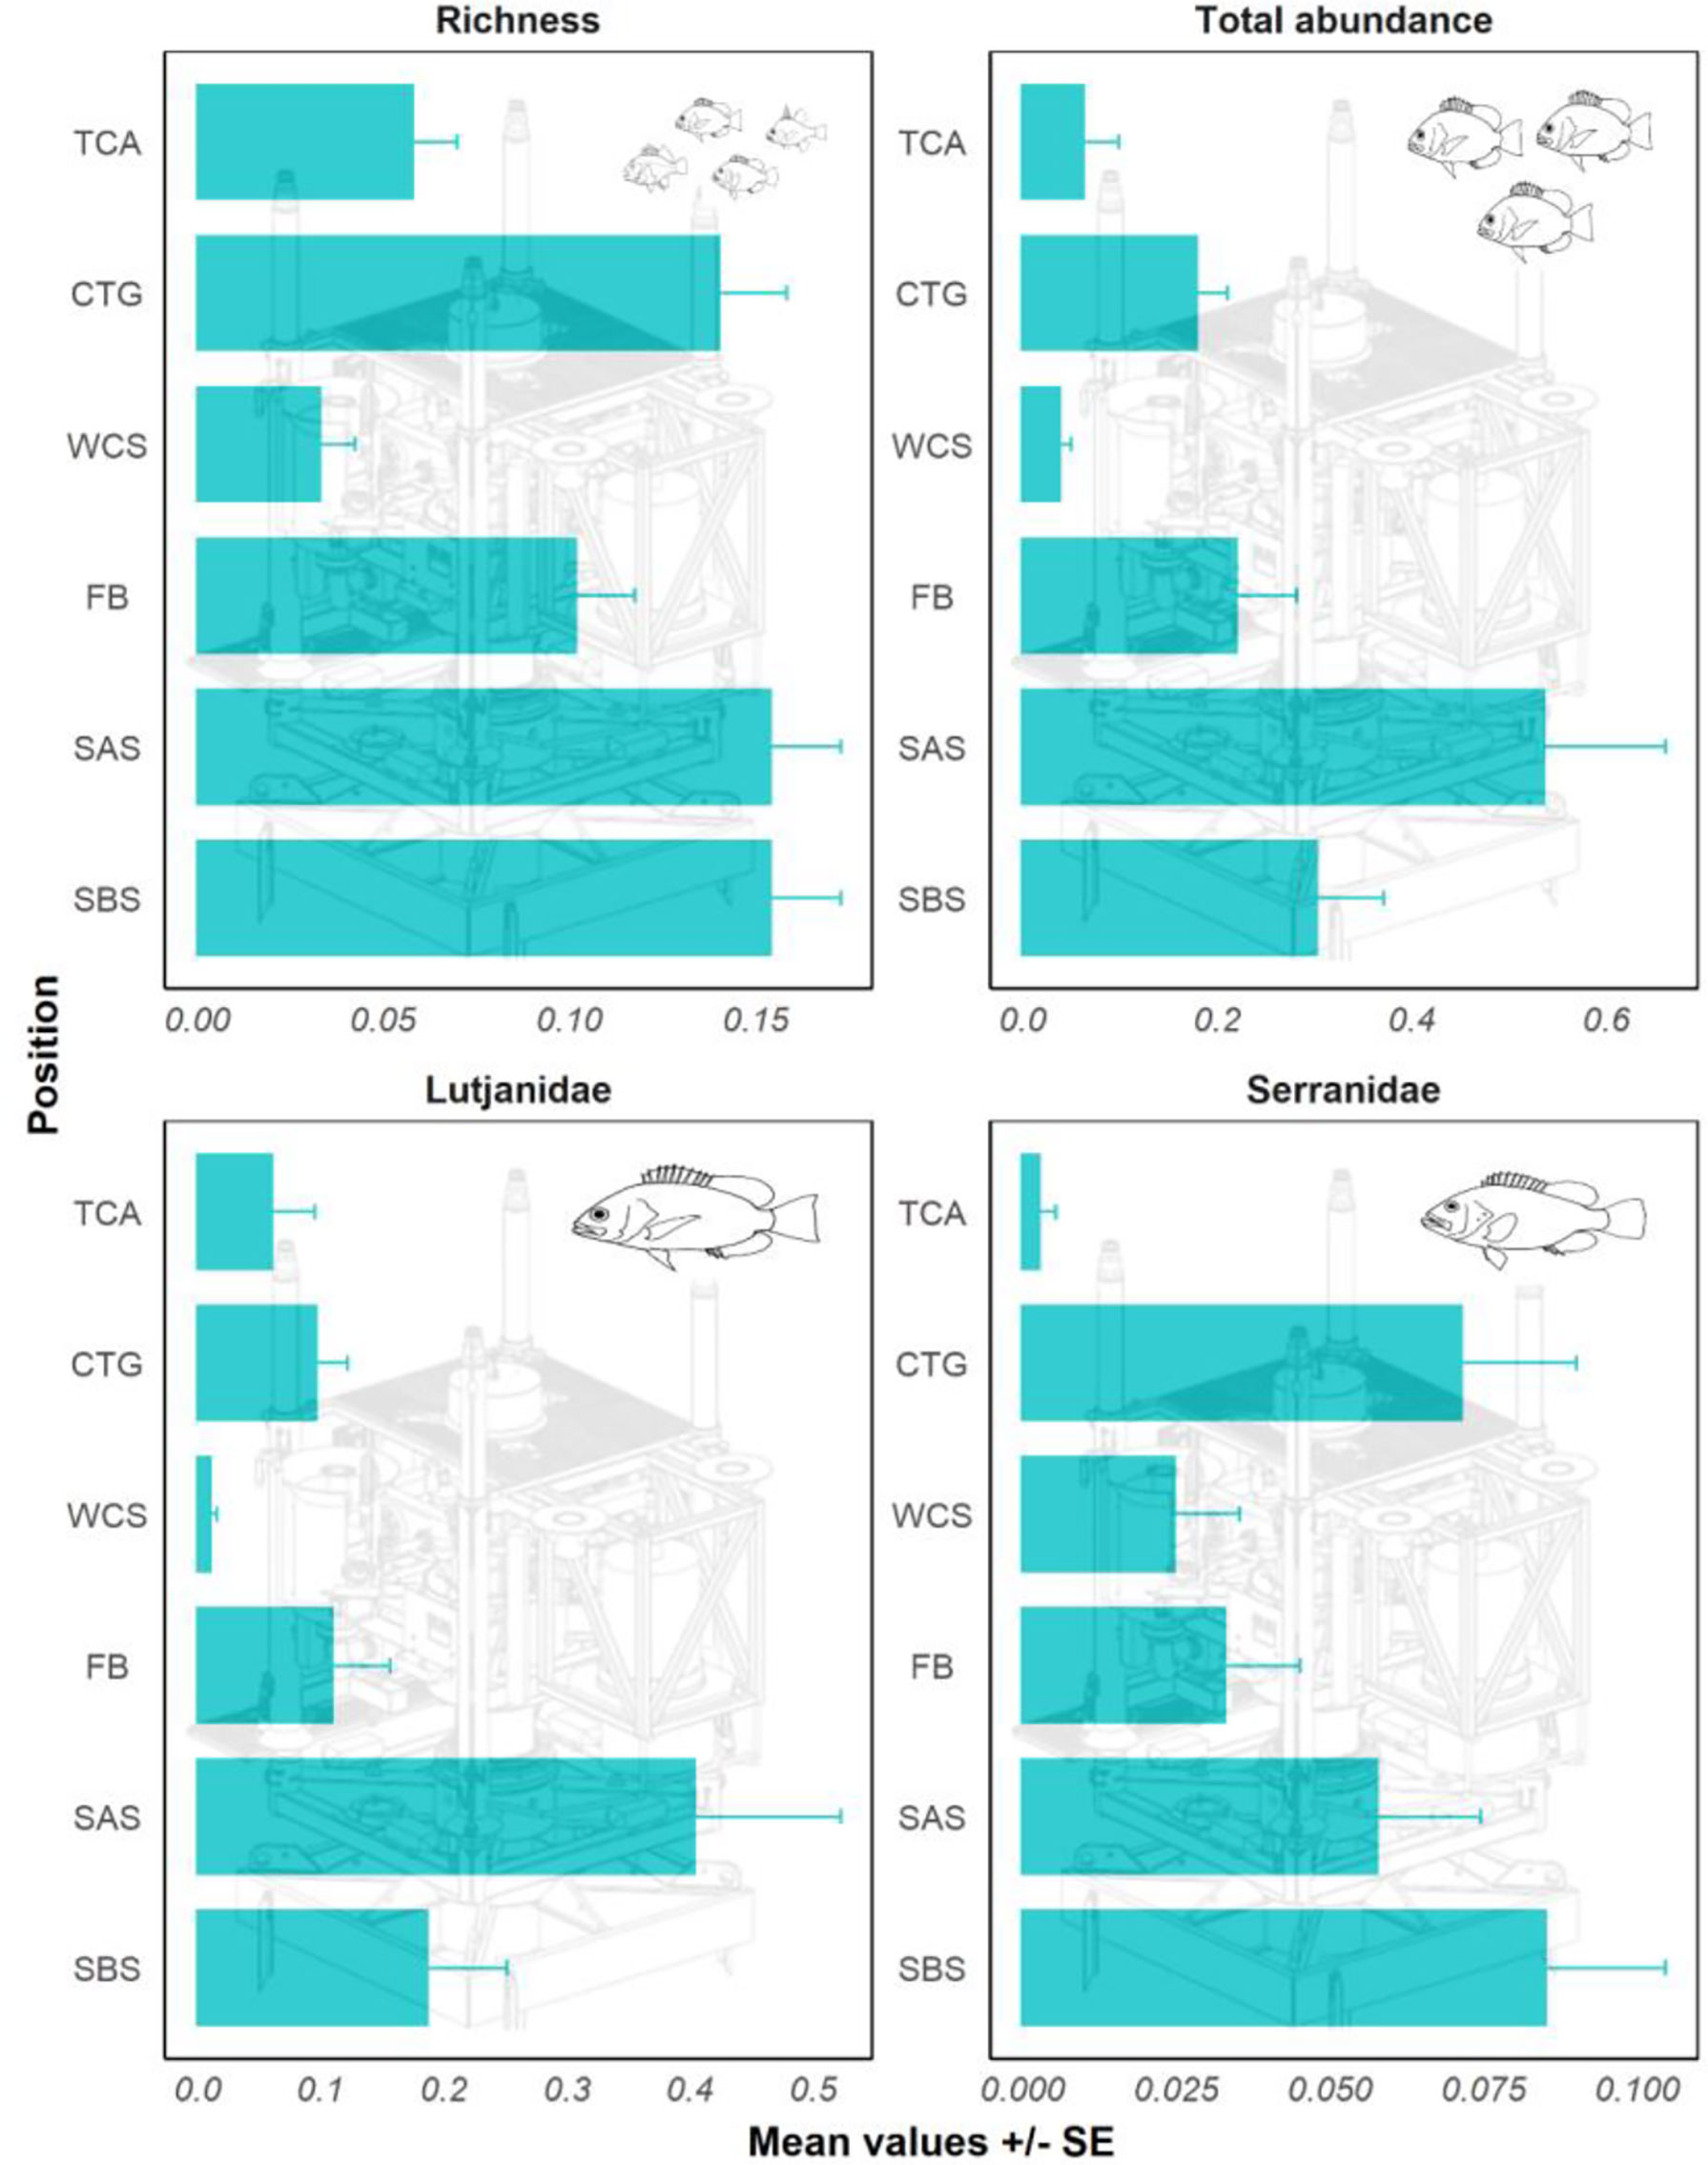
Figure 3 Fishery species richness, total abundance of fishery target species (sum all MaxNs), and the abundance of Lutjanidae (snappers) and Serranidae (groupers) on different sections of NW wells. TCA, tree cap assembly; CTG, Christmas tree; WCS, water column around structure; FB, flow base; SAS, seafloor around structure; SBS, seafloor beneath structure, NW = north-west, SE = south-east.
There was an overlap in the composition and abundance of fish communities on wells in depths of (Figure 4), suggesting that the distinction between these depths is not clear. A few patterns were evident, however, with Glaucosoma buergeri (pearl perch) associated with wells at >100-m depths (Table S3; n = 59 vs. 0 in<100 m) where rubble, sand, and hard cover were also more prevalent. Conversely, some species of Epinephelidae (groupers; E. chlorostigma, E. multinotatus, C. sonnerati, E. coioides) were correlated with wells<100 m in depth (Figure 4; Table S3). L. russellii (Moses’ snapper), Seriola rivoliana (highfin amberjack), and S. dumerili (amberjack) were each correlated with shorter wells and higher percent cover of barnacles (Figure 4).
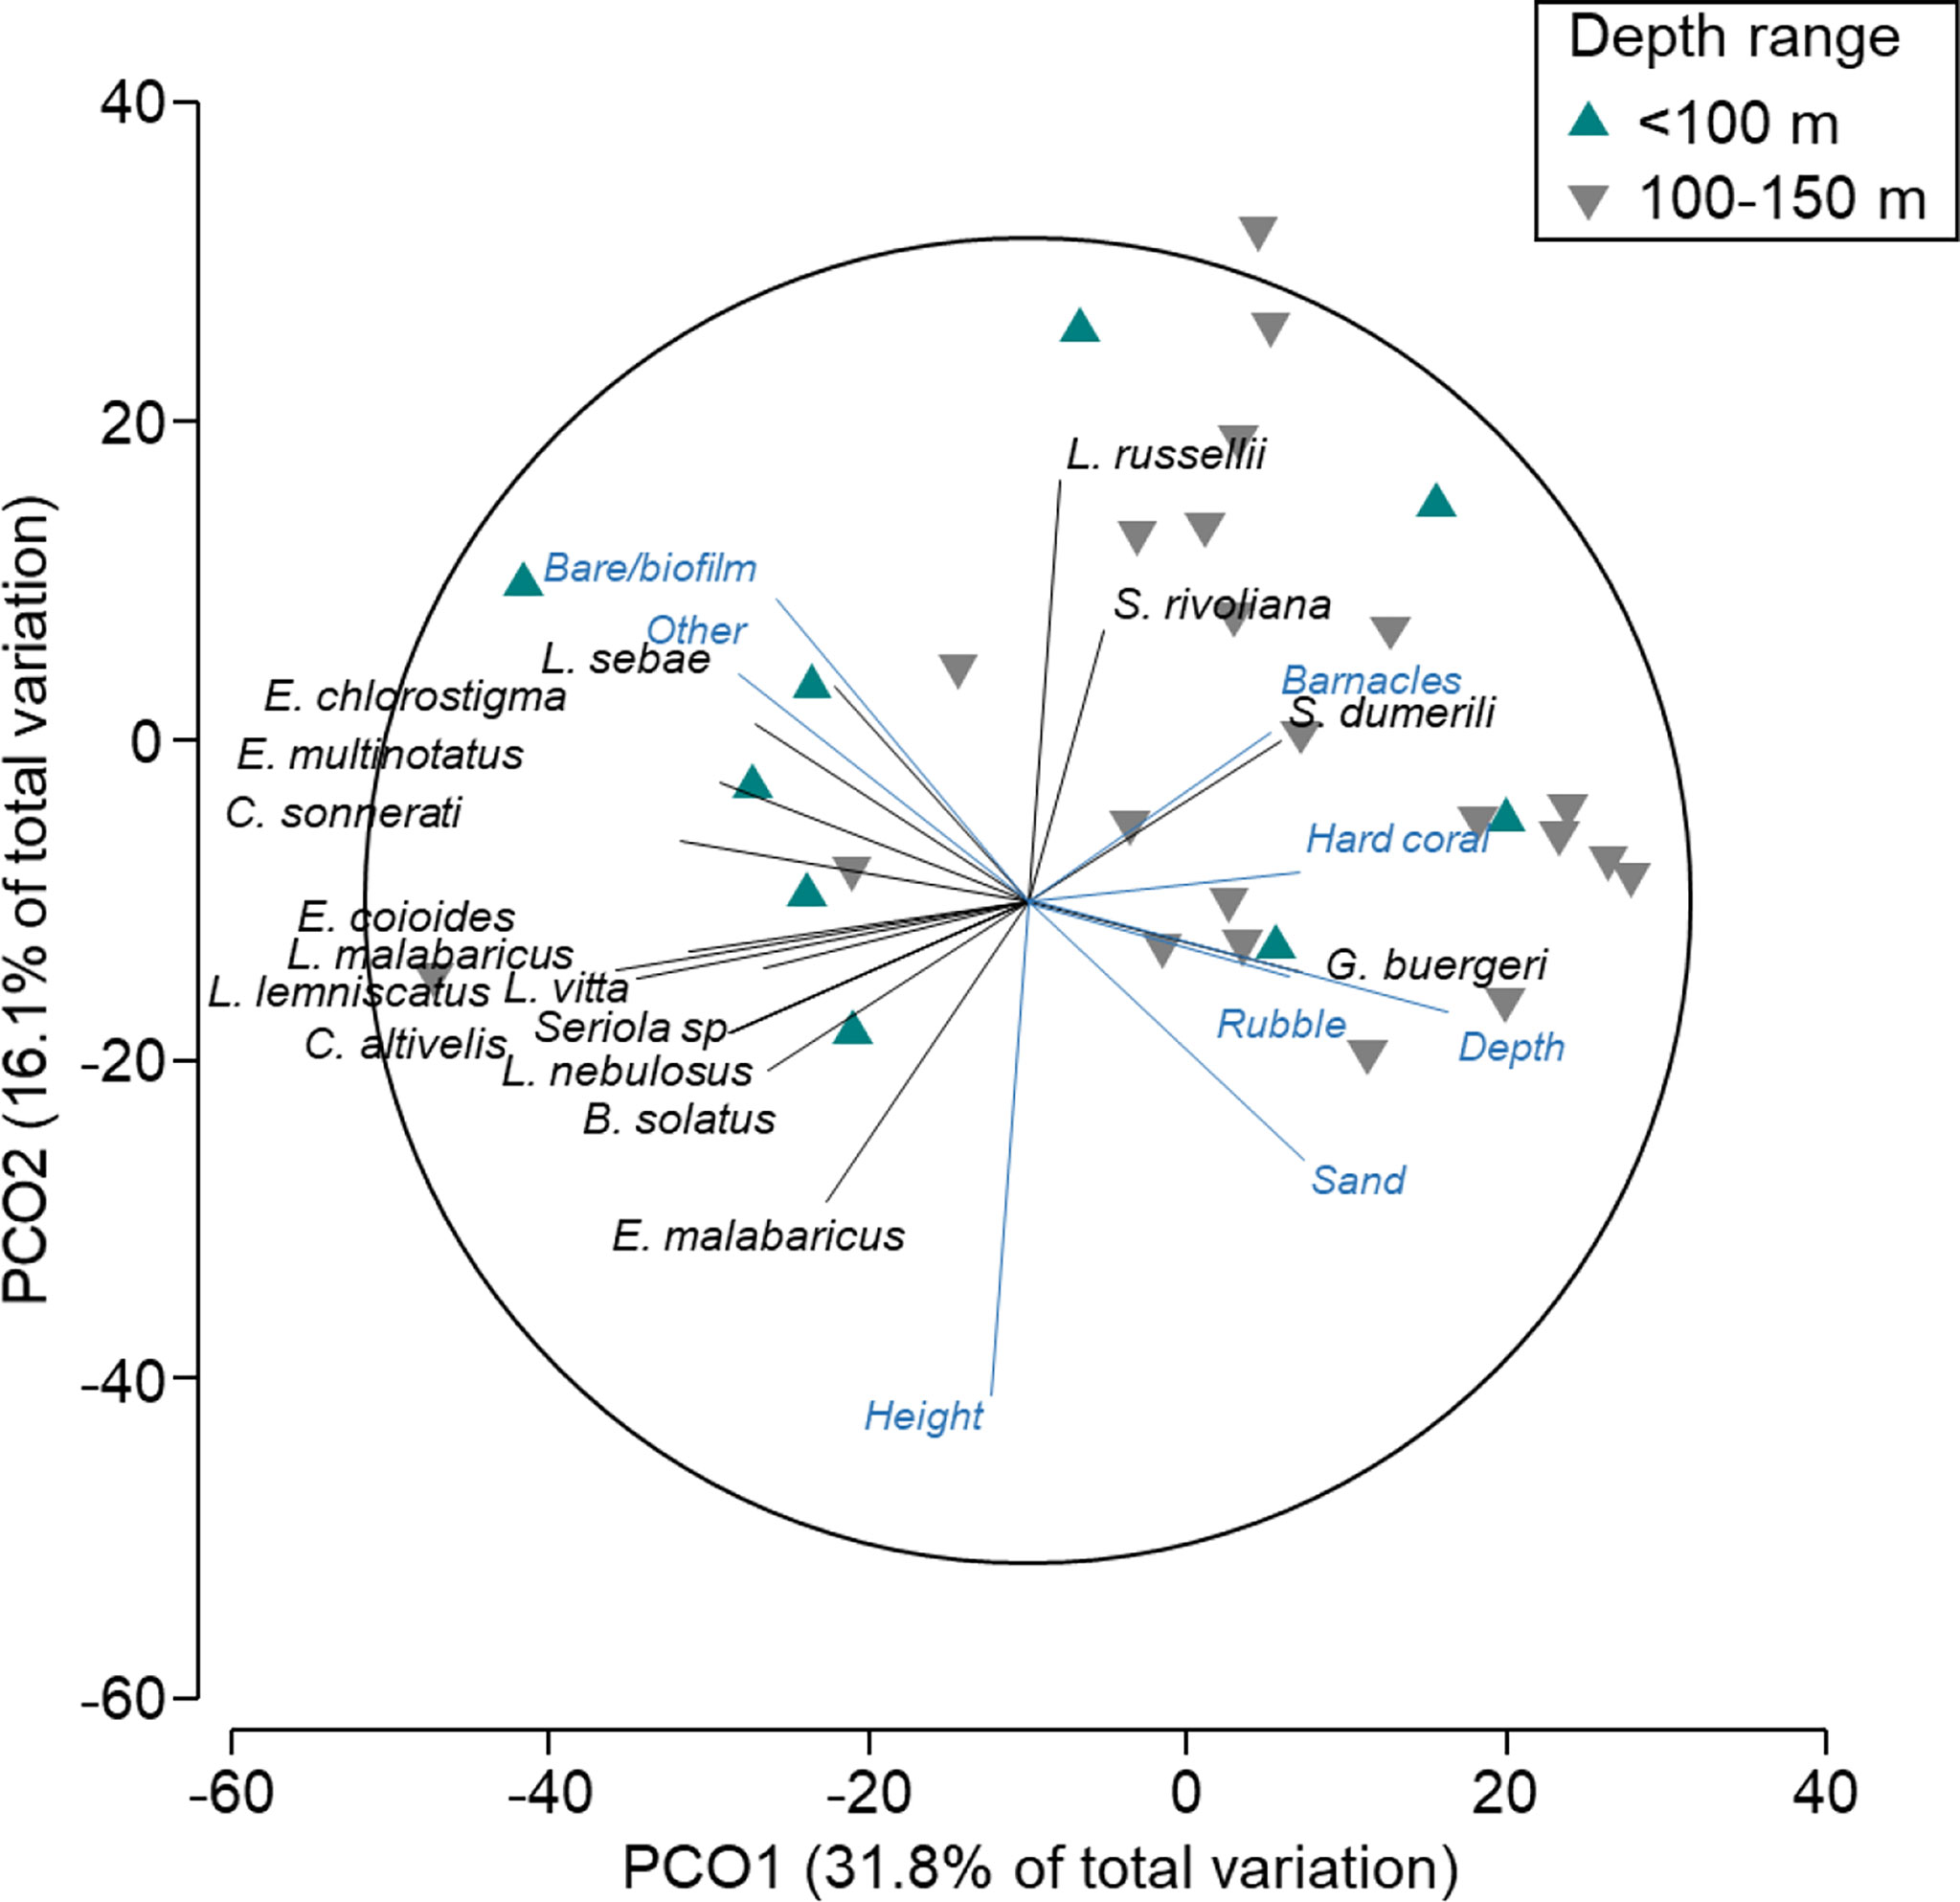
Figure 4 Principal coordinates ordination (PCO) on fishery target species only in depths <150 m (north-west wells). Vectors are displayed and show fish species and explanatory variables with Pearson’s correlations of |R|>0.3 to one or more axes. Vectors indicate the direction of the relationship, and their length indicates the strength of their effect on the assemblage of fishery target species.
Depth, well height, and the percent cover of bare structure or structure covered in a thin biofilm of unidentifiable biota were the most commonly identified important predictors (Table 4; Figure S2). Fishery target species richness increased as the percent of bare structure or cover of biofilm increased, as did the abundance of Serranidae (Figure 5); however, both relationships were weak, as indicated by relatively low R2 values (Table 4). Serranidae also increased in abundance with increasing percent cover of “other” (unidentified epibiota), while fishery target species richness was highest where barnacle coverage was lowest. The total abundance of fishery target species and the abundance of Lutjanidae and Serranidae declined with increasing depth (Figure 5). A similar relationship was evident for well height, with taller wells possessing fewer fishery target individuals and lutjanids.

Table 4 Generalised additive mixed models (GAMs) for predicting fishery target species richness, total fishery target species abundance (sum of MaxNs for all species), and the total abundance of Lutjanidae and Serranidae families observed on subsea wells in <150 m in the north-west, within 2 Akaike information criterion of the top model.
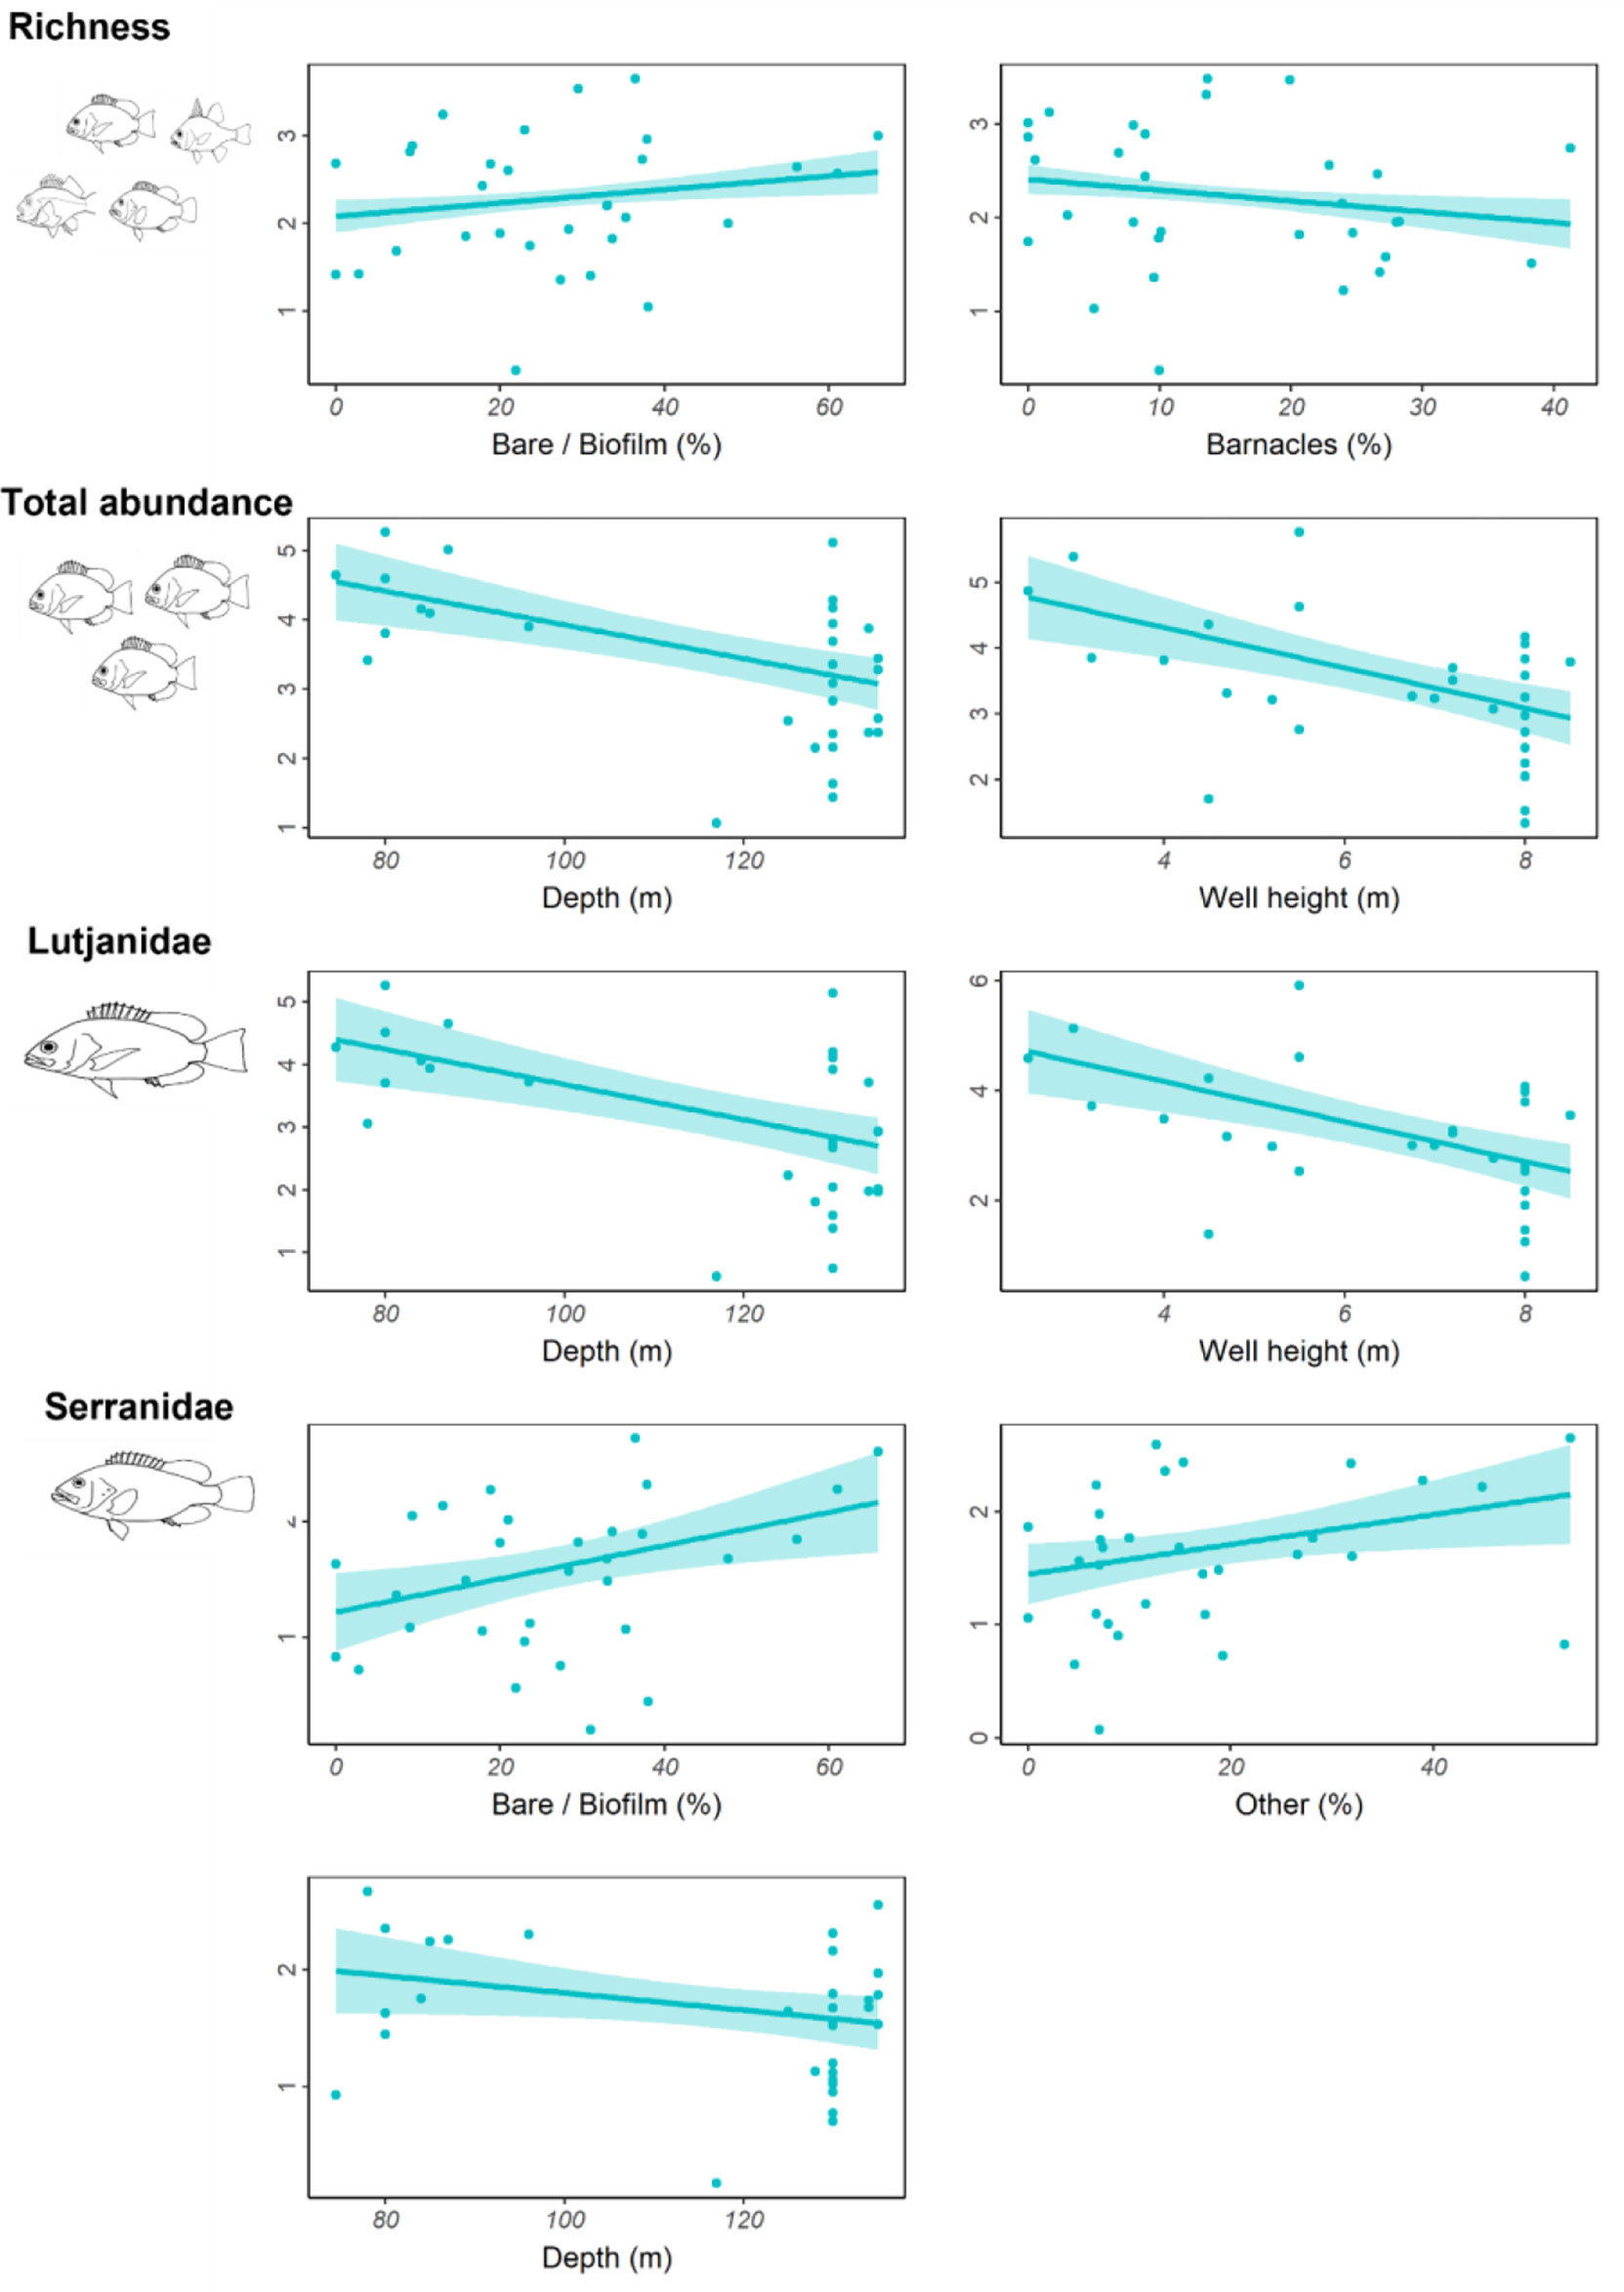
Figure 5 Total residual abundance of fishery target species, richness and residual abundance of the two most abundant fishery target families on wells in <150 m depth in the north-west. Residual abundances are plotted relative to their most important explanatory variables (Table 4; Figure S2). Models were fitted using Generalised additive models. The solid line represents the estimated smoothing curve, and dashed lines represent ±2 × south-east of the estimate.
The size structures of L. argentimaculatus and L. malabaricus were very similar on wells in the NW (Table S1) with most (93%, 98%, respectively) 40–50 cm in length (Figure 6). L. russellii were smaller, with 45% 20–30 cm and 47% 30–40 cm in length. Slightly smaller individuals were observed on pipelines (Figure 6; see Structural components of subsea pipelines that promote fishery target species abundance).
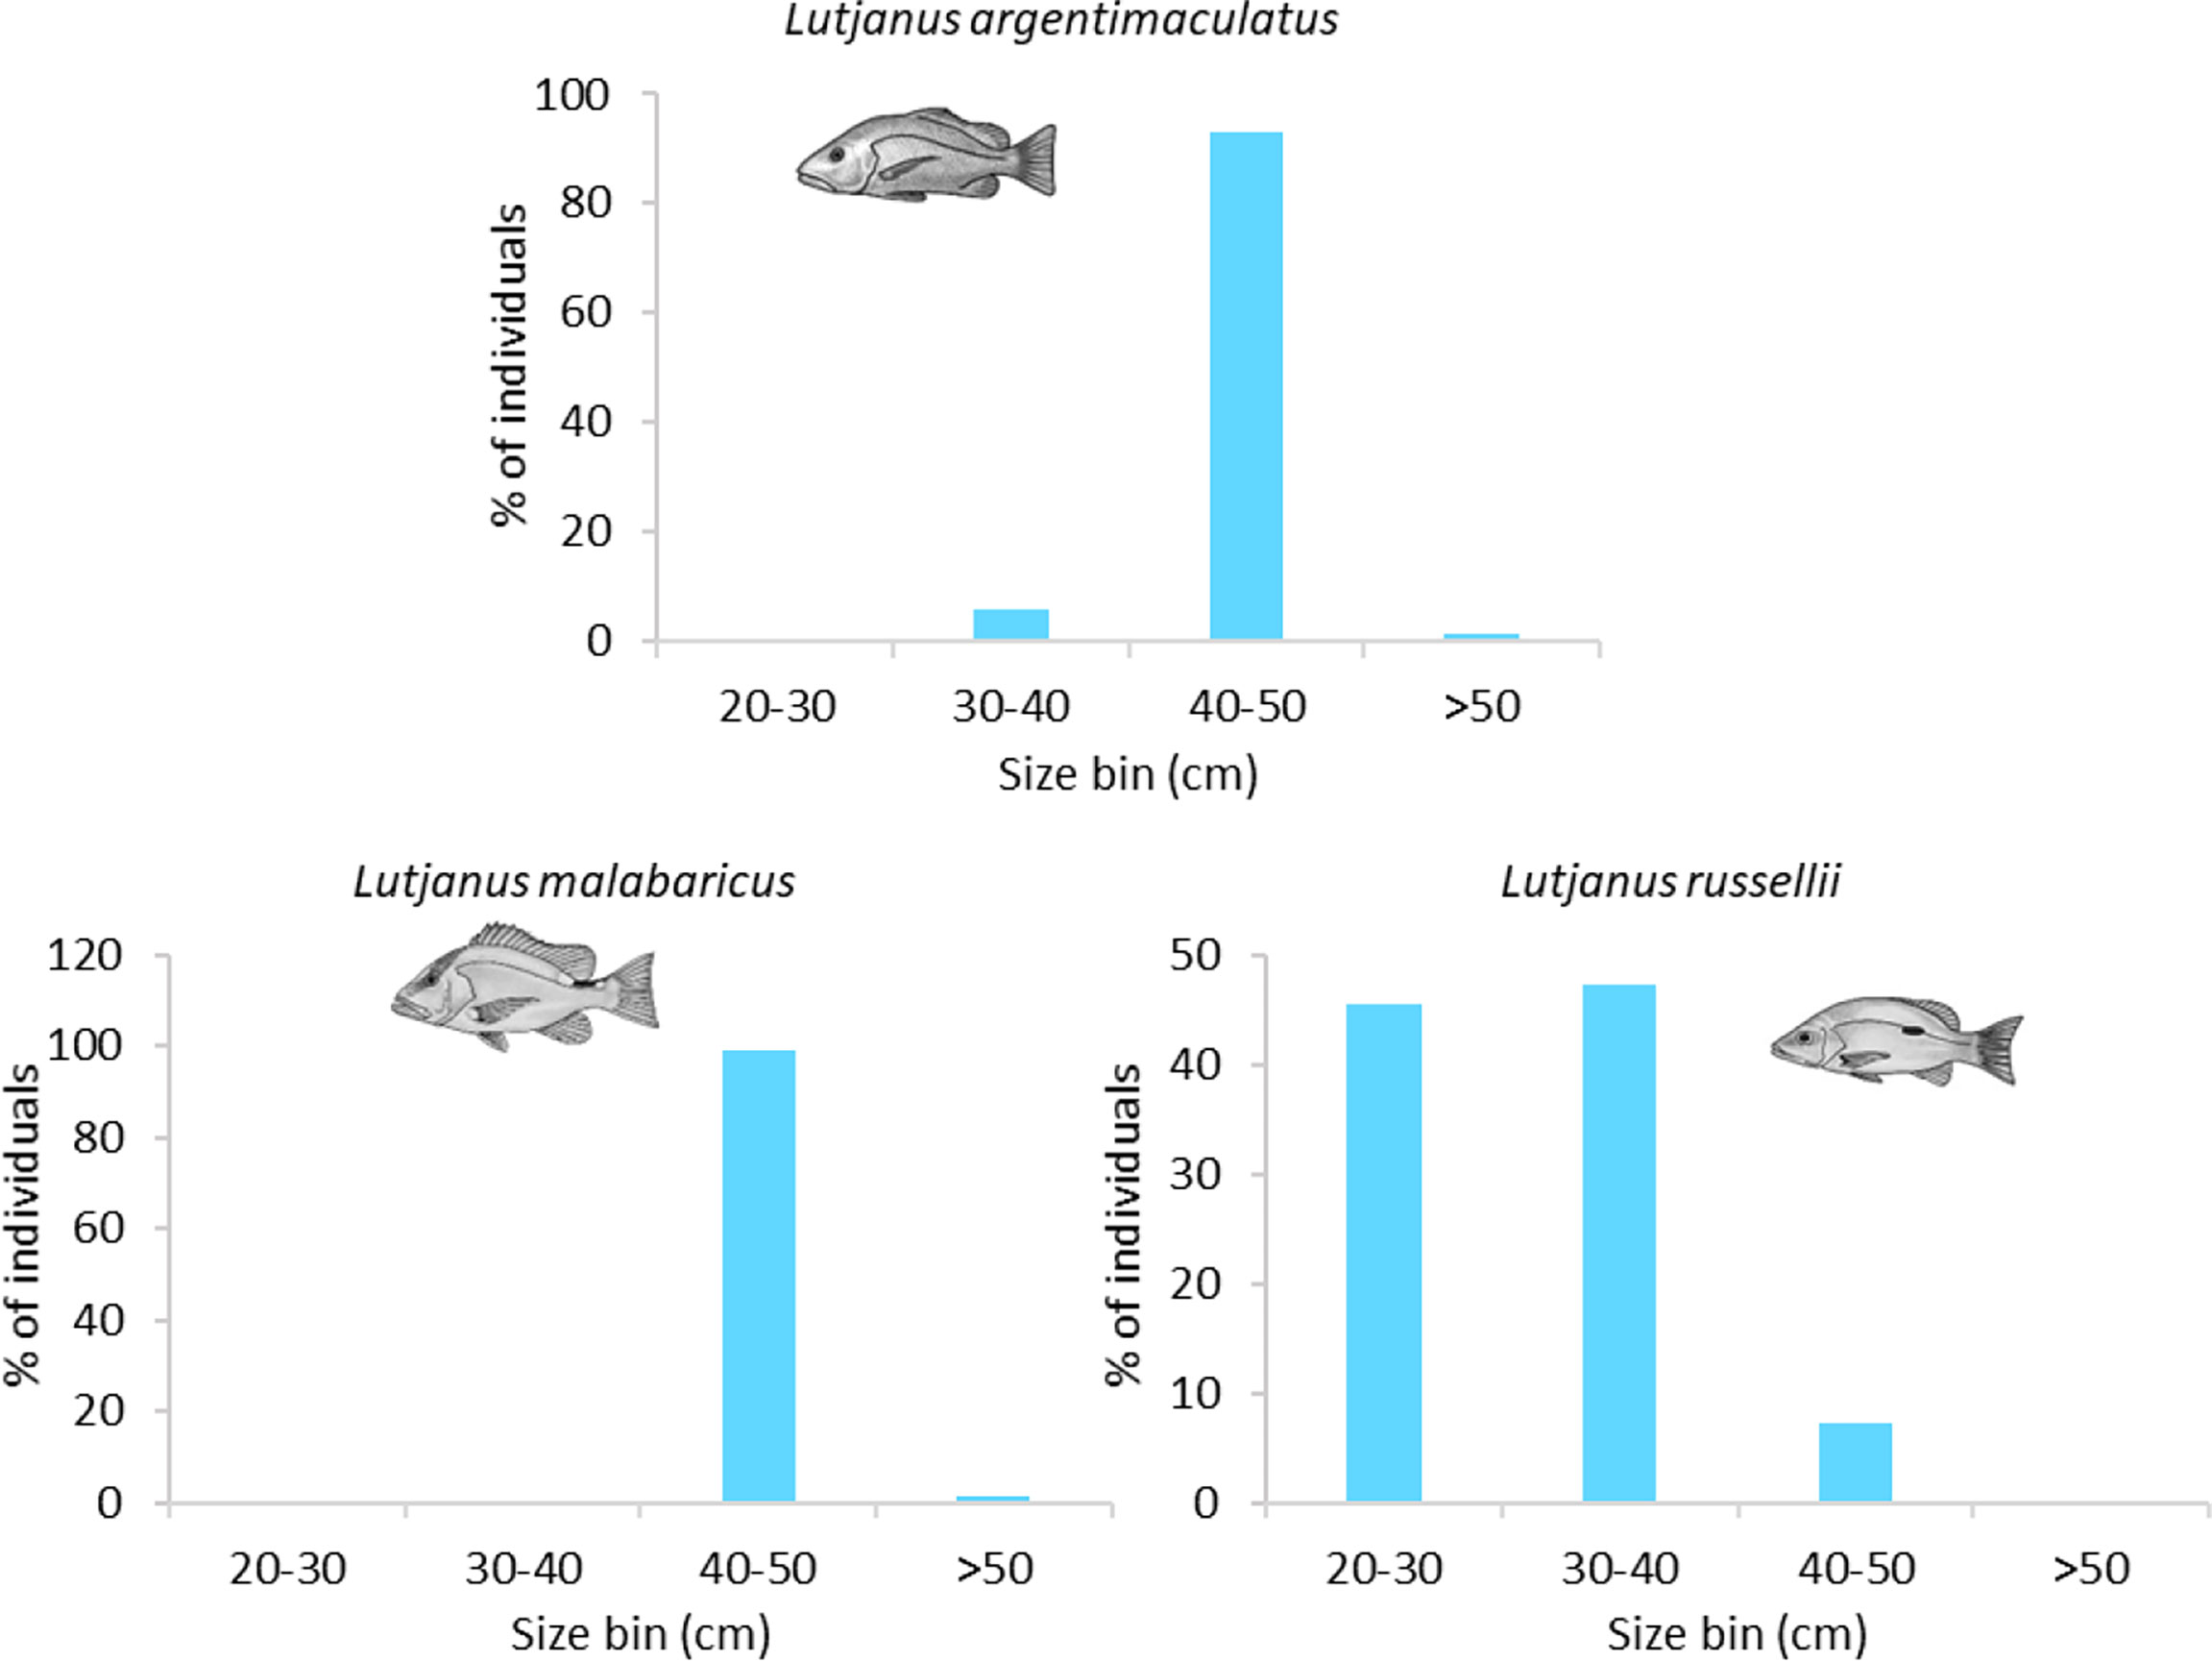
Figure 6 Size frequency of abundant fishery target species observed on subsea wells. Sizes estimated from imagery in 10-cm bins.
3.2 Fish production on wells in north-west Australia
The estimated biomass of targeted snapper species on wells in the NW was 130.06 kg for L. malabaricus (18 wells), 777 kg for L. russellii (28 wells), and 363.2 kg for L. argentimaculatus (28 wells) (Table 5). Assuming a well volume of 416 m3, this equated to an average standing stock biomass at each well of ~17.4 g m-3 for L. malabaricus, ~66.7 g m-3 for L. russellii, and ~31.2 g m-3 for L. argentimaculatus.
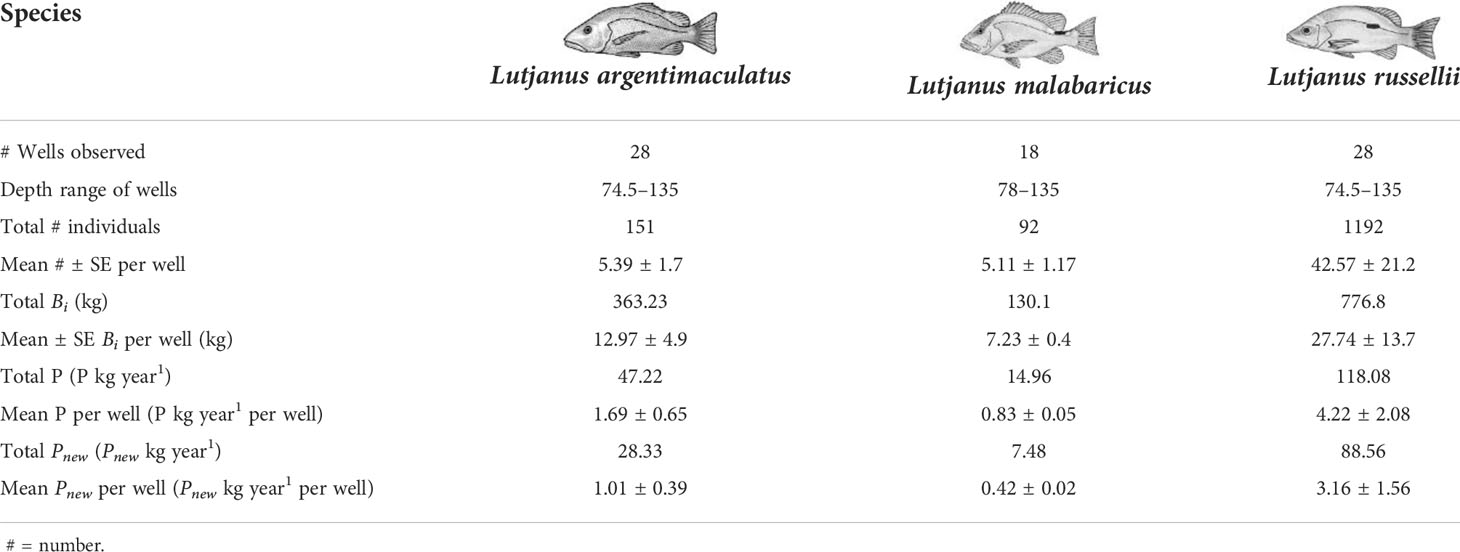
Table 5 Total and mean (±SE) abundance (from MaxN), biomass Bi), and production estimates for subsea wells on the northwest shelf, Western Australia.
Local production P at wells ranged from 0.83 ± 0.05 kg year-1 per well for L. malabaricus to 1.69 ± 0.65 kg year-1 per well for L. argentimaculatus and 4.22 ± 2.08 kg year-1 per well for L. russellii (Table 5). Considering a seabed footprint of 64 m2, this equates to “per well” estimates of 13 g m-2 year-1 for L. malabaricus, 26.3 g m-2 for L. argentimaculatus, and 66 g m-2 L. russellii with a summed per well total of 105.23 g m-2 year-1 for the three species. New production Pnew is an estimate of that which would be lost from the ecosystem (not just the specific wells) if they were to be removed (Table 5). Our estimates of tprop produced a total Pnew value of 7.48 kg year-1 for L. malabaricus, 28.33 kg year-1 for L. argentimaculatus, and 88.56 kg year-1 for L. russellii.
3.3 Structural components of subsea pipelines that promote fishery target species abundance
A total of 90 target species were recorded on subsea pipelines with 67 observed from the seven pipelines in the NW and 23 from the 10 pipelines in the SE marine regions (Table S4). The most speciose families were the same as those observed on wells; Serranidae (n = 18; rockcod/grouper/perch species), Lutjanidae (n = 14 snapper species), and Carangidae (n = 9 trevally species). Examples of fishery target species associating with subsea pipelines are shown in Figure S3. Pipelines with the highest richness of fishery target species were Jansz (36 spp.), Pluto (32 spp.), and 2TL (26 spp.) in the NW and Blackback to Mackerel (15 spp.) and MarlinA to Shore (9 spp.) in the SE (Table 6).
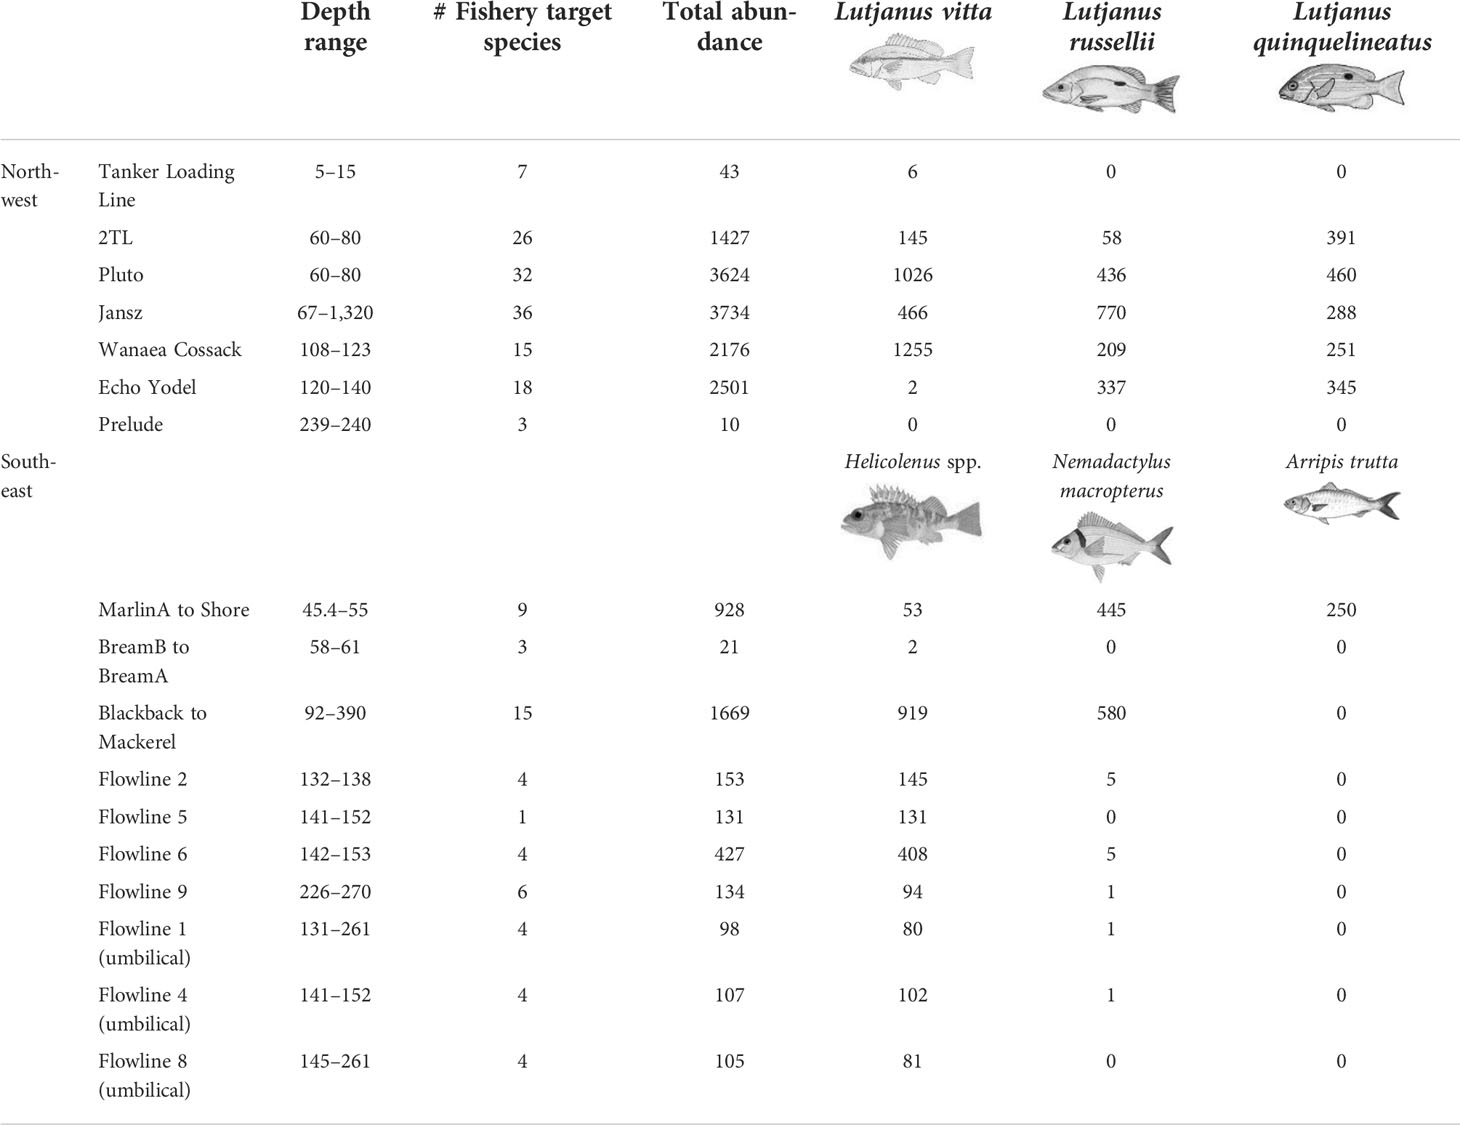
Table 6 Abundance of all fishery target species on remotely operated vehicle imagery of subsea pipelines. Ordered by region then approximately by depth.
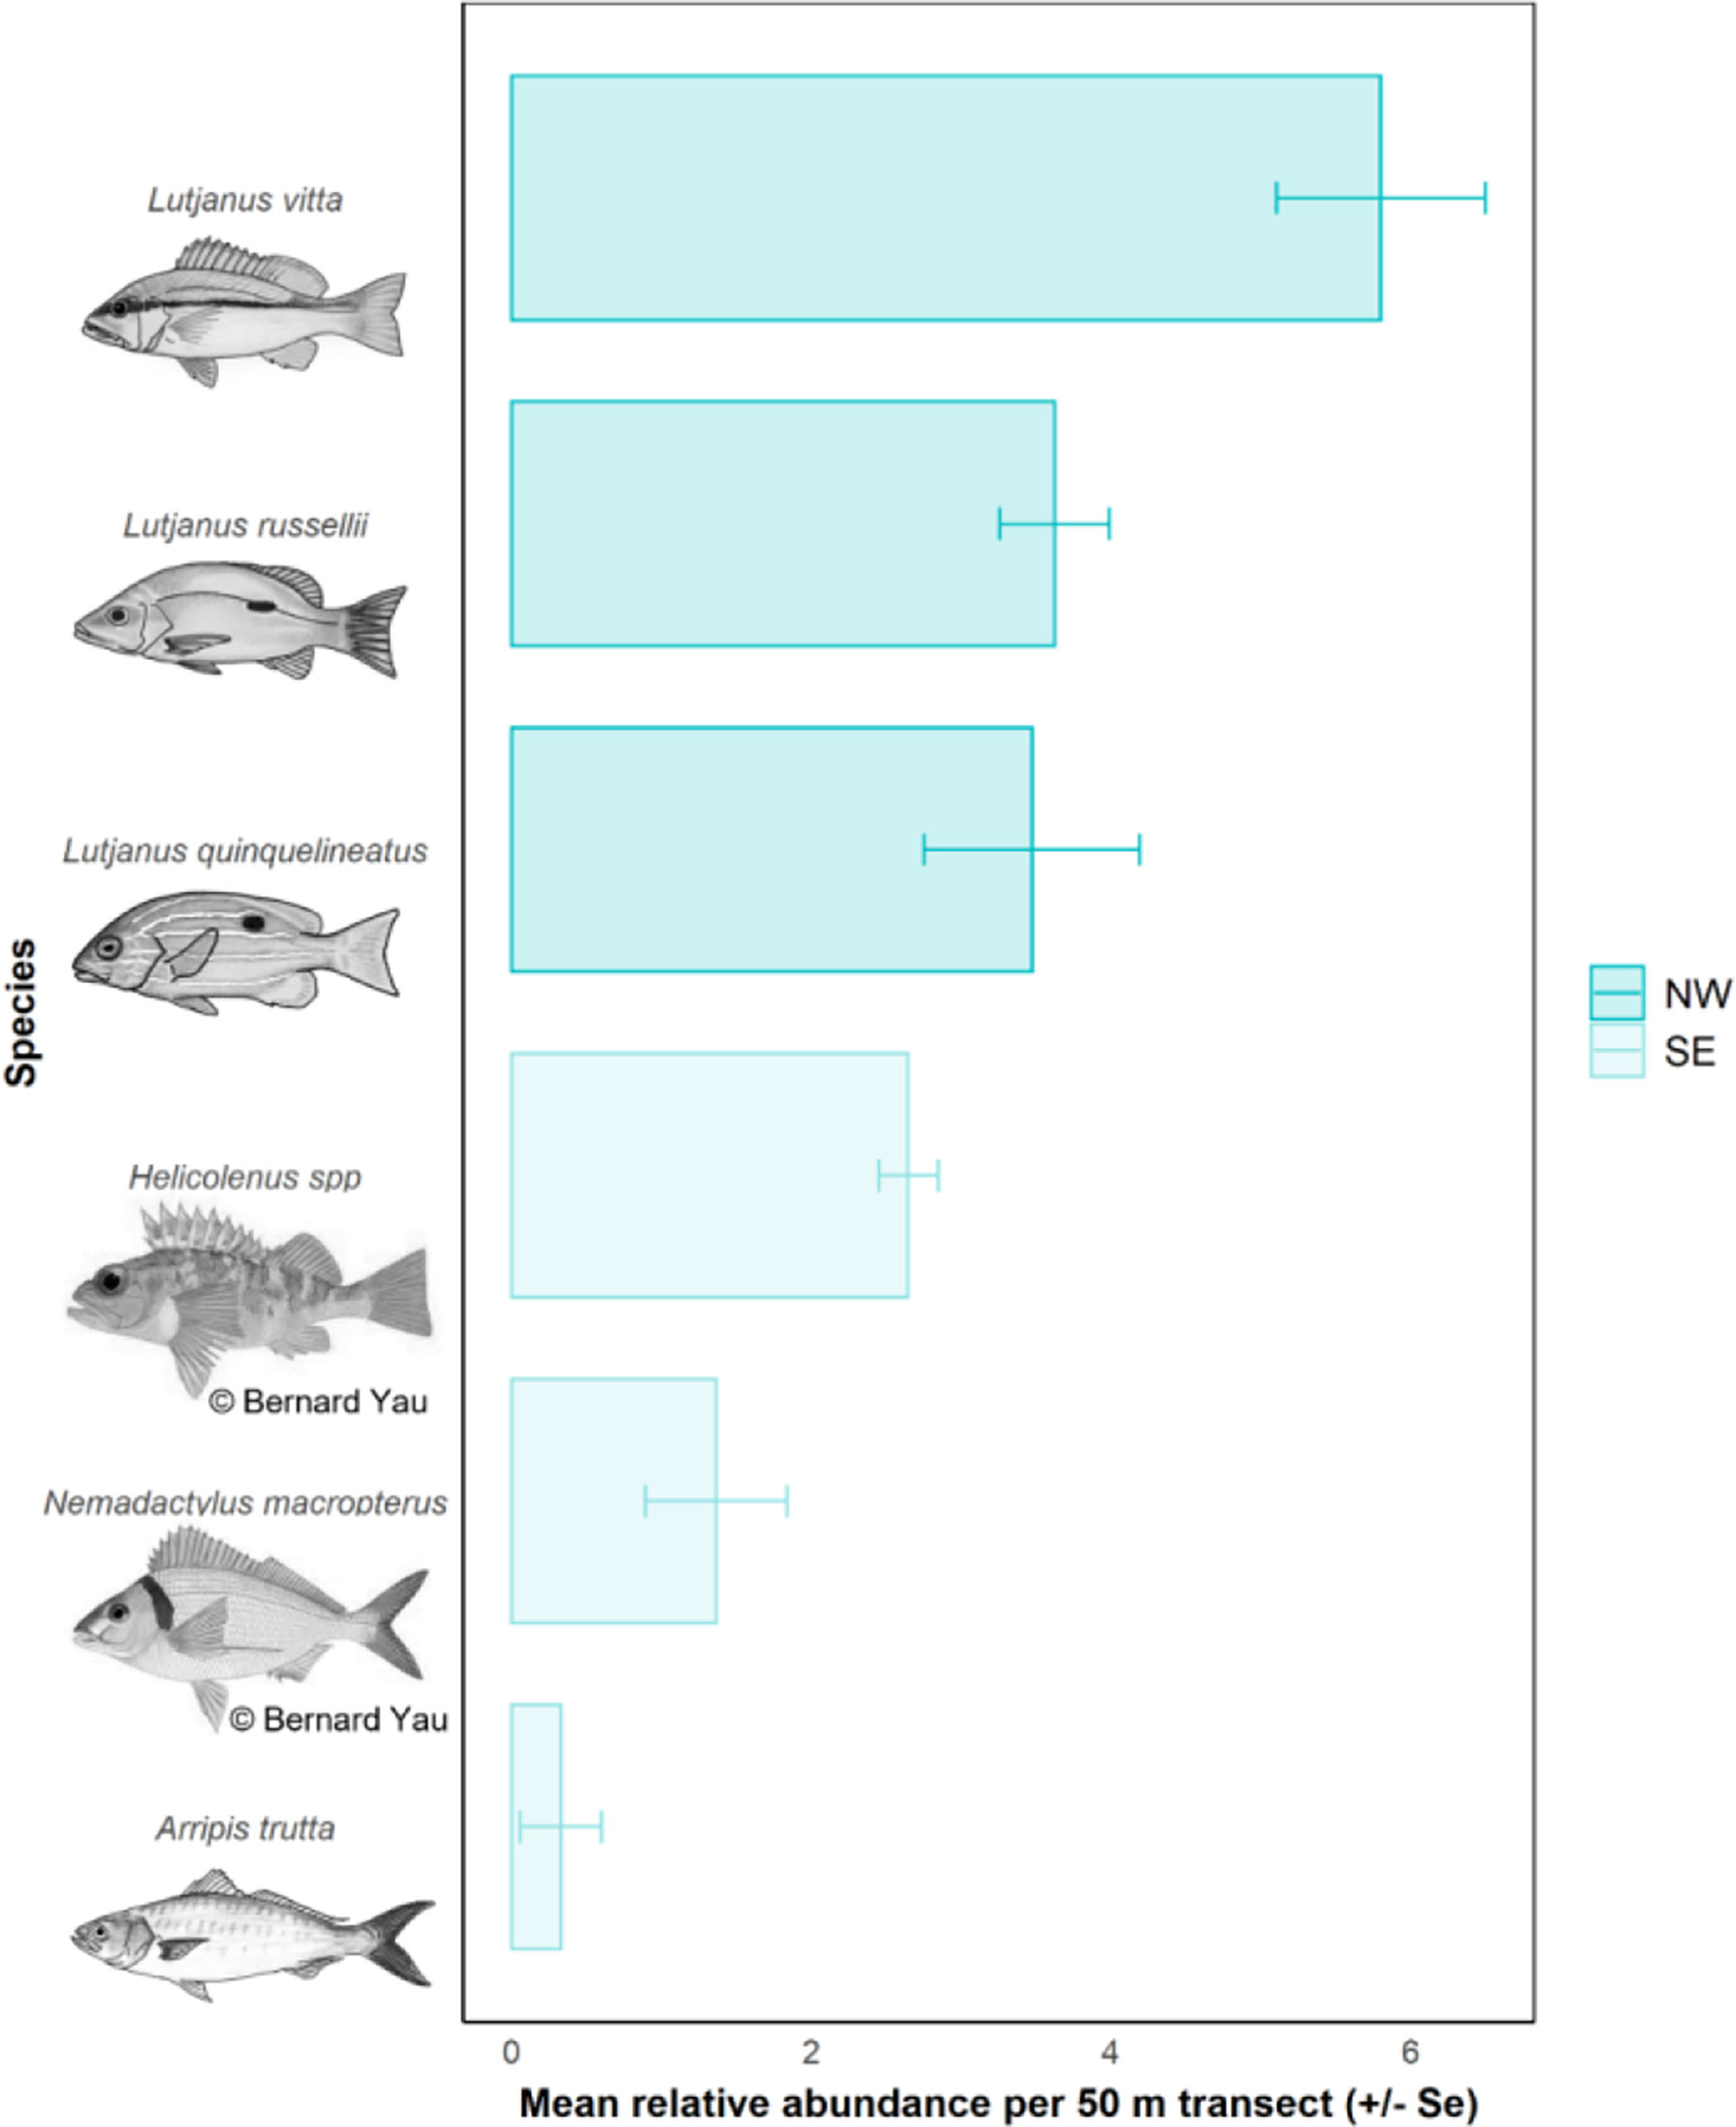
The most abundant species observed on pipelines in the NW were L. vitta (brownstripe snapper, n = 2,900), L. russellii (Moses’ snapper; n = 1,810), L. quinquelineatus (five-line snapper, n = 1,735) (Table 6, Figure 7), Glaucosoma buergeri (northern pearl perch, n = 1,540; Figure S3), and Epinephelus areolatus (areolate grouper, n = 1,160) (Table S4). In the SE, the most abundant fishery target species were Helicolenus spp. (ocean perch; n = 2,015; Table S3), N. macropterus (jackass morwong; n = 1,038; Figure S3), Arripis trutta (eastern Australian salmon, n = 250) (Table 6, Figure 7), and Centroberyx affinis (redfish, n = 119) (Table S4). The pipeline with the highest total abundance of fishery target species was Jansz (n = 3,734), followed by Pluto (n = 3,624), then Echo Yodel (n = 2,501) (Table 6), with total abundances likely linked to sampling effort (Table S2).
In the NW, pipelines in depths<100 m had a larger diameter and were longer than deeper pipelines and also had a distinct fish community that was composed of 11 species targeted by fisheries from a range of families including the Serranidae, Lutjanidae, and Labridae (Figure 8). Pipelines in depths >100 m in this region tended to have a higher percent cover of sand, sponges, and soft corals and were characterised by abundances of Pristipomoides multidens (goldband snapper) and Epinephelus latifasciatus (striped grouper) (Figure 8, Table S4). In the SE, four distinct clusters were evident, potentially reflecting differences in fish assemblages with depth, percent cover of sponges, and sampling effort (Figure 8). Helicolenus spp. were correlated with depth, with higher abundance on deep pipelines in this region.
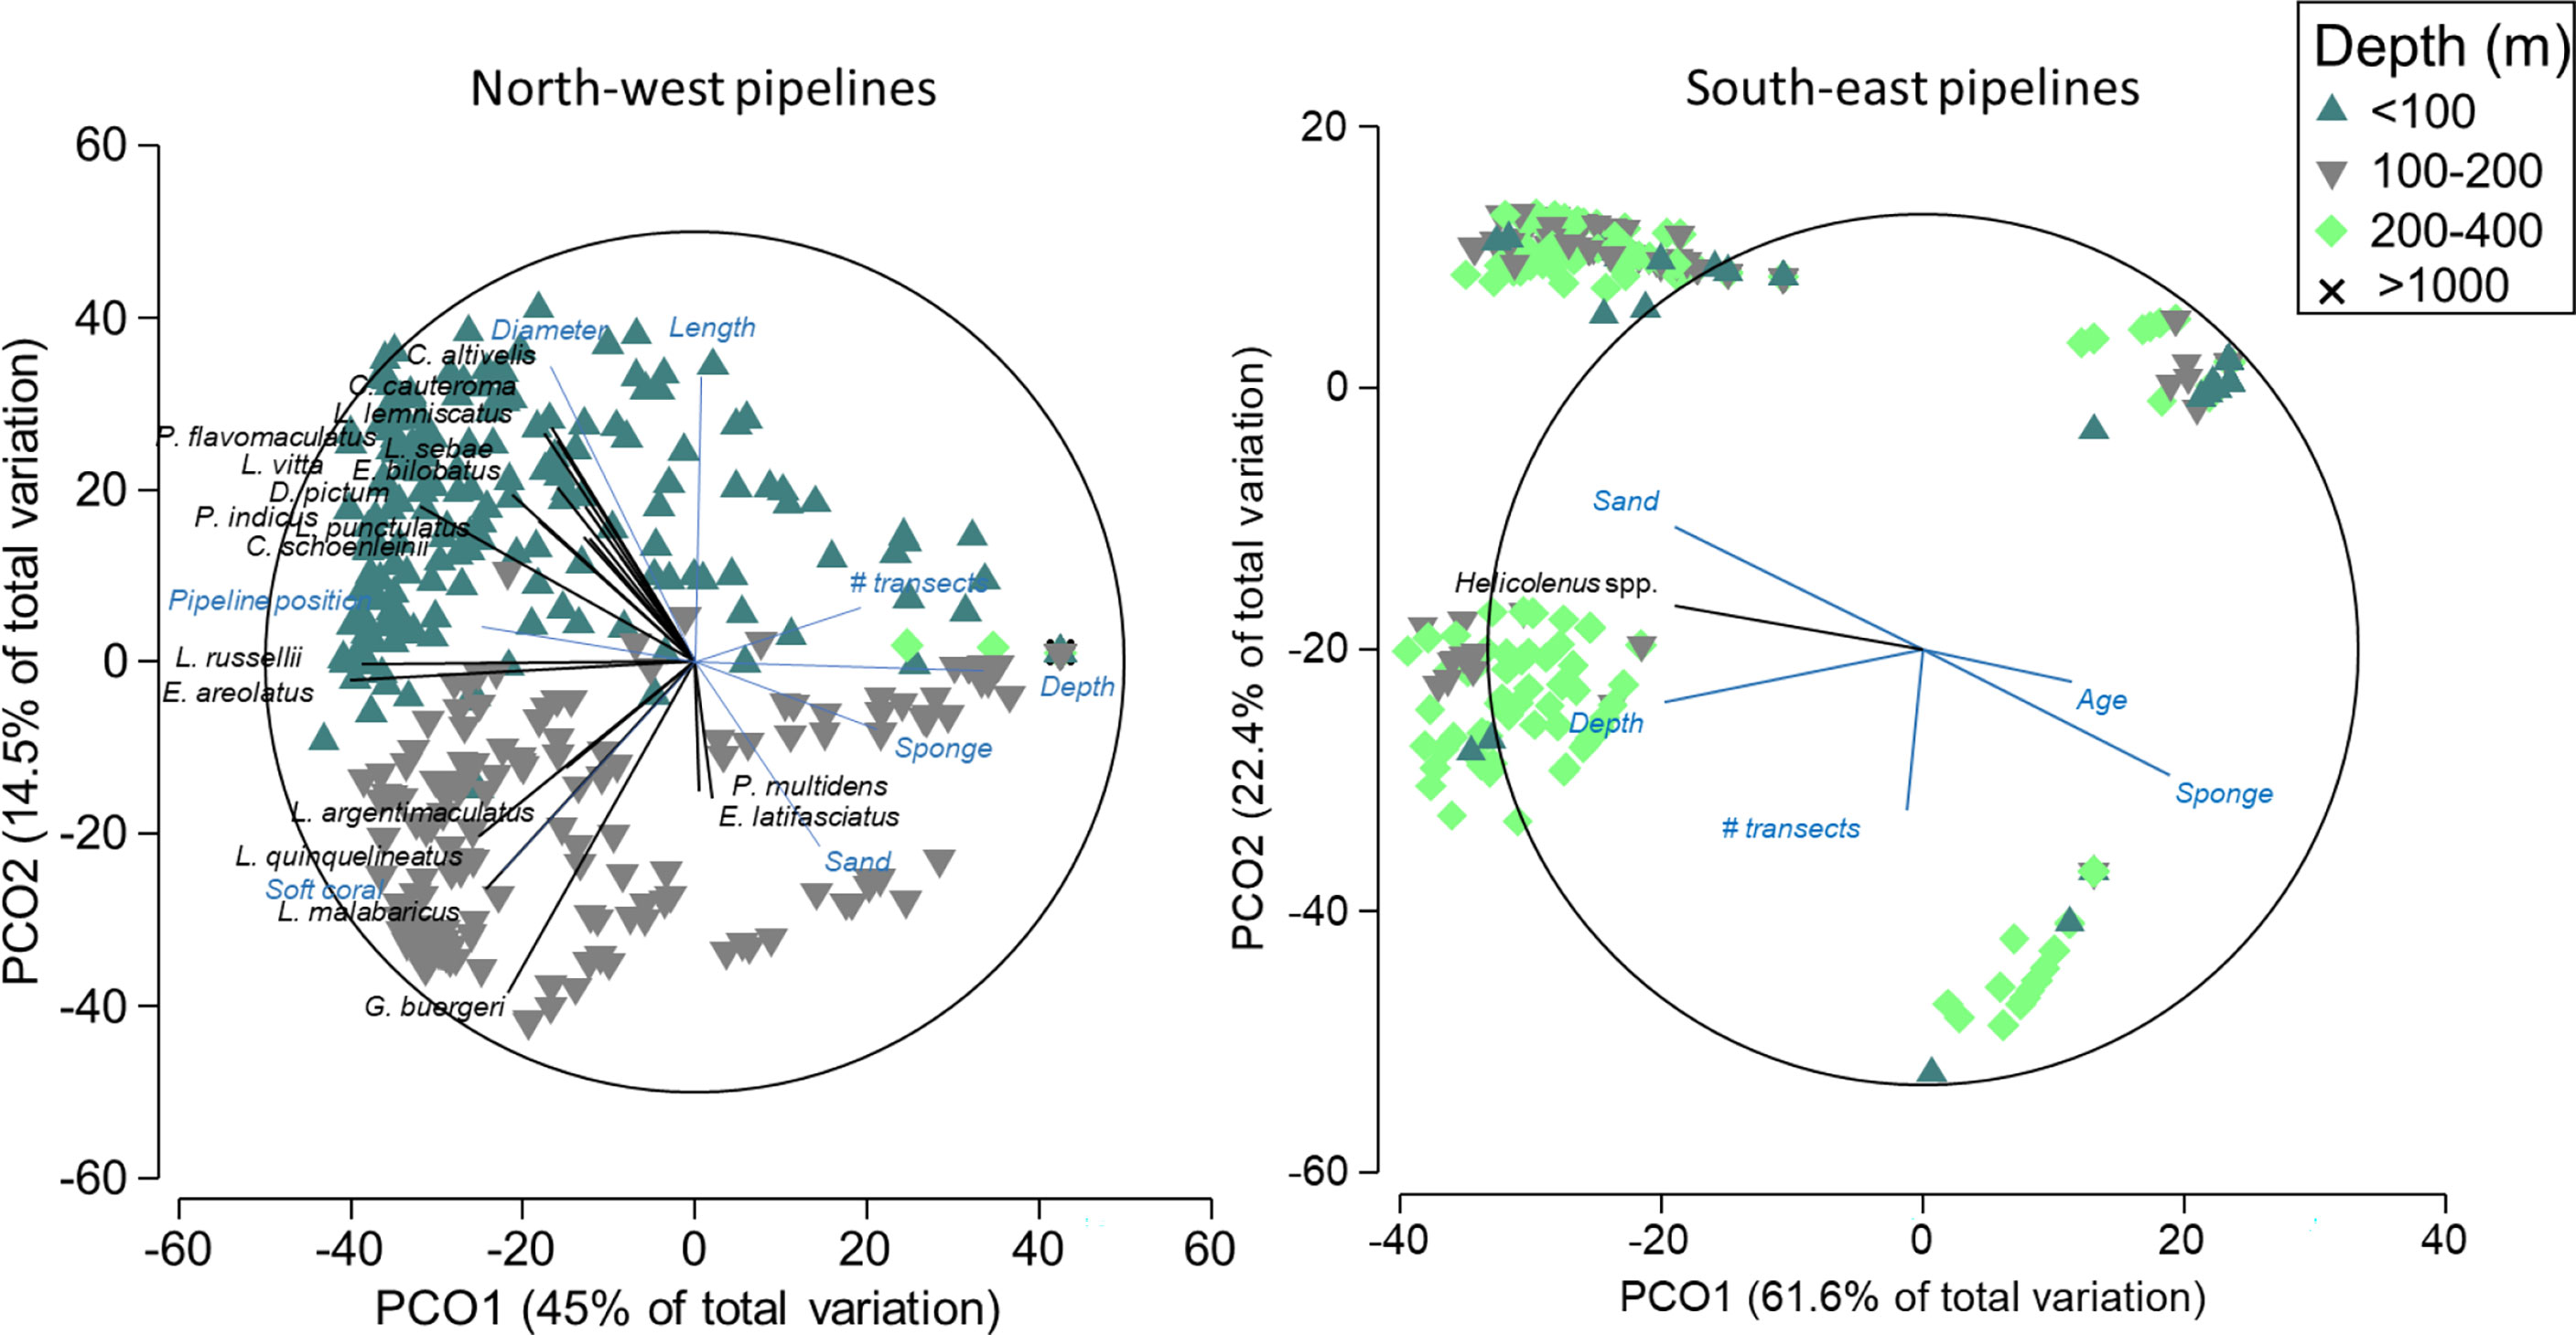
Figure 8 Principal component ordination (PCO) on fishery target species abundance on pipelines in the north-west and south-east marine regions. Vectors are displayed and show fish species and explanatory variables with Pearson’s correlations of |R|>0.3 to one or more axes. Vectors indicate the direction of the relationship, and their length indicates the strength of their effect on the assemblage of fishery target species.
Older pipelines possessed a higher number of fishery target species and high abundances of Lethrinidae (Table 7, Figure 9, Figure S2). As depth increased, the number of fishery target species declined as did the abundance of Lethrinidae, yet this latter relationship was quite weak (low R2; Table 7, Figure 9). Total abundance of fishes increased on pipelines in depths<400 m in the NW and with increased pipeline exposure (reduced burial of the pipeline by sediment) (Table 7, Figure 9, Figure S2). Although sponges were identified as a key factor by the GAM, the relationship with total fish abundance was not clear (Figure 9) and was characterised by high variability. Serranidae increased in abundance along pipelines with moderate (middle of the range) sampling effort and where the percent cover of bare pipeline or pipeline covered in a thin biofilm was greatest, this latter relationship mirroring that found on subsea wells in this region (Figure 9).

Table 7 Generalised additive models (GAMs) for predicting total fishery target species abundance, fishery target species richness, and the total abundance of Lutjanidae, Lethrinidae, and Serranidae observed on pipelines in depths <400 m in the north-west, within 2 Akaike information criterion of the top model.
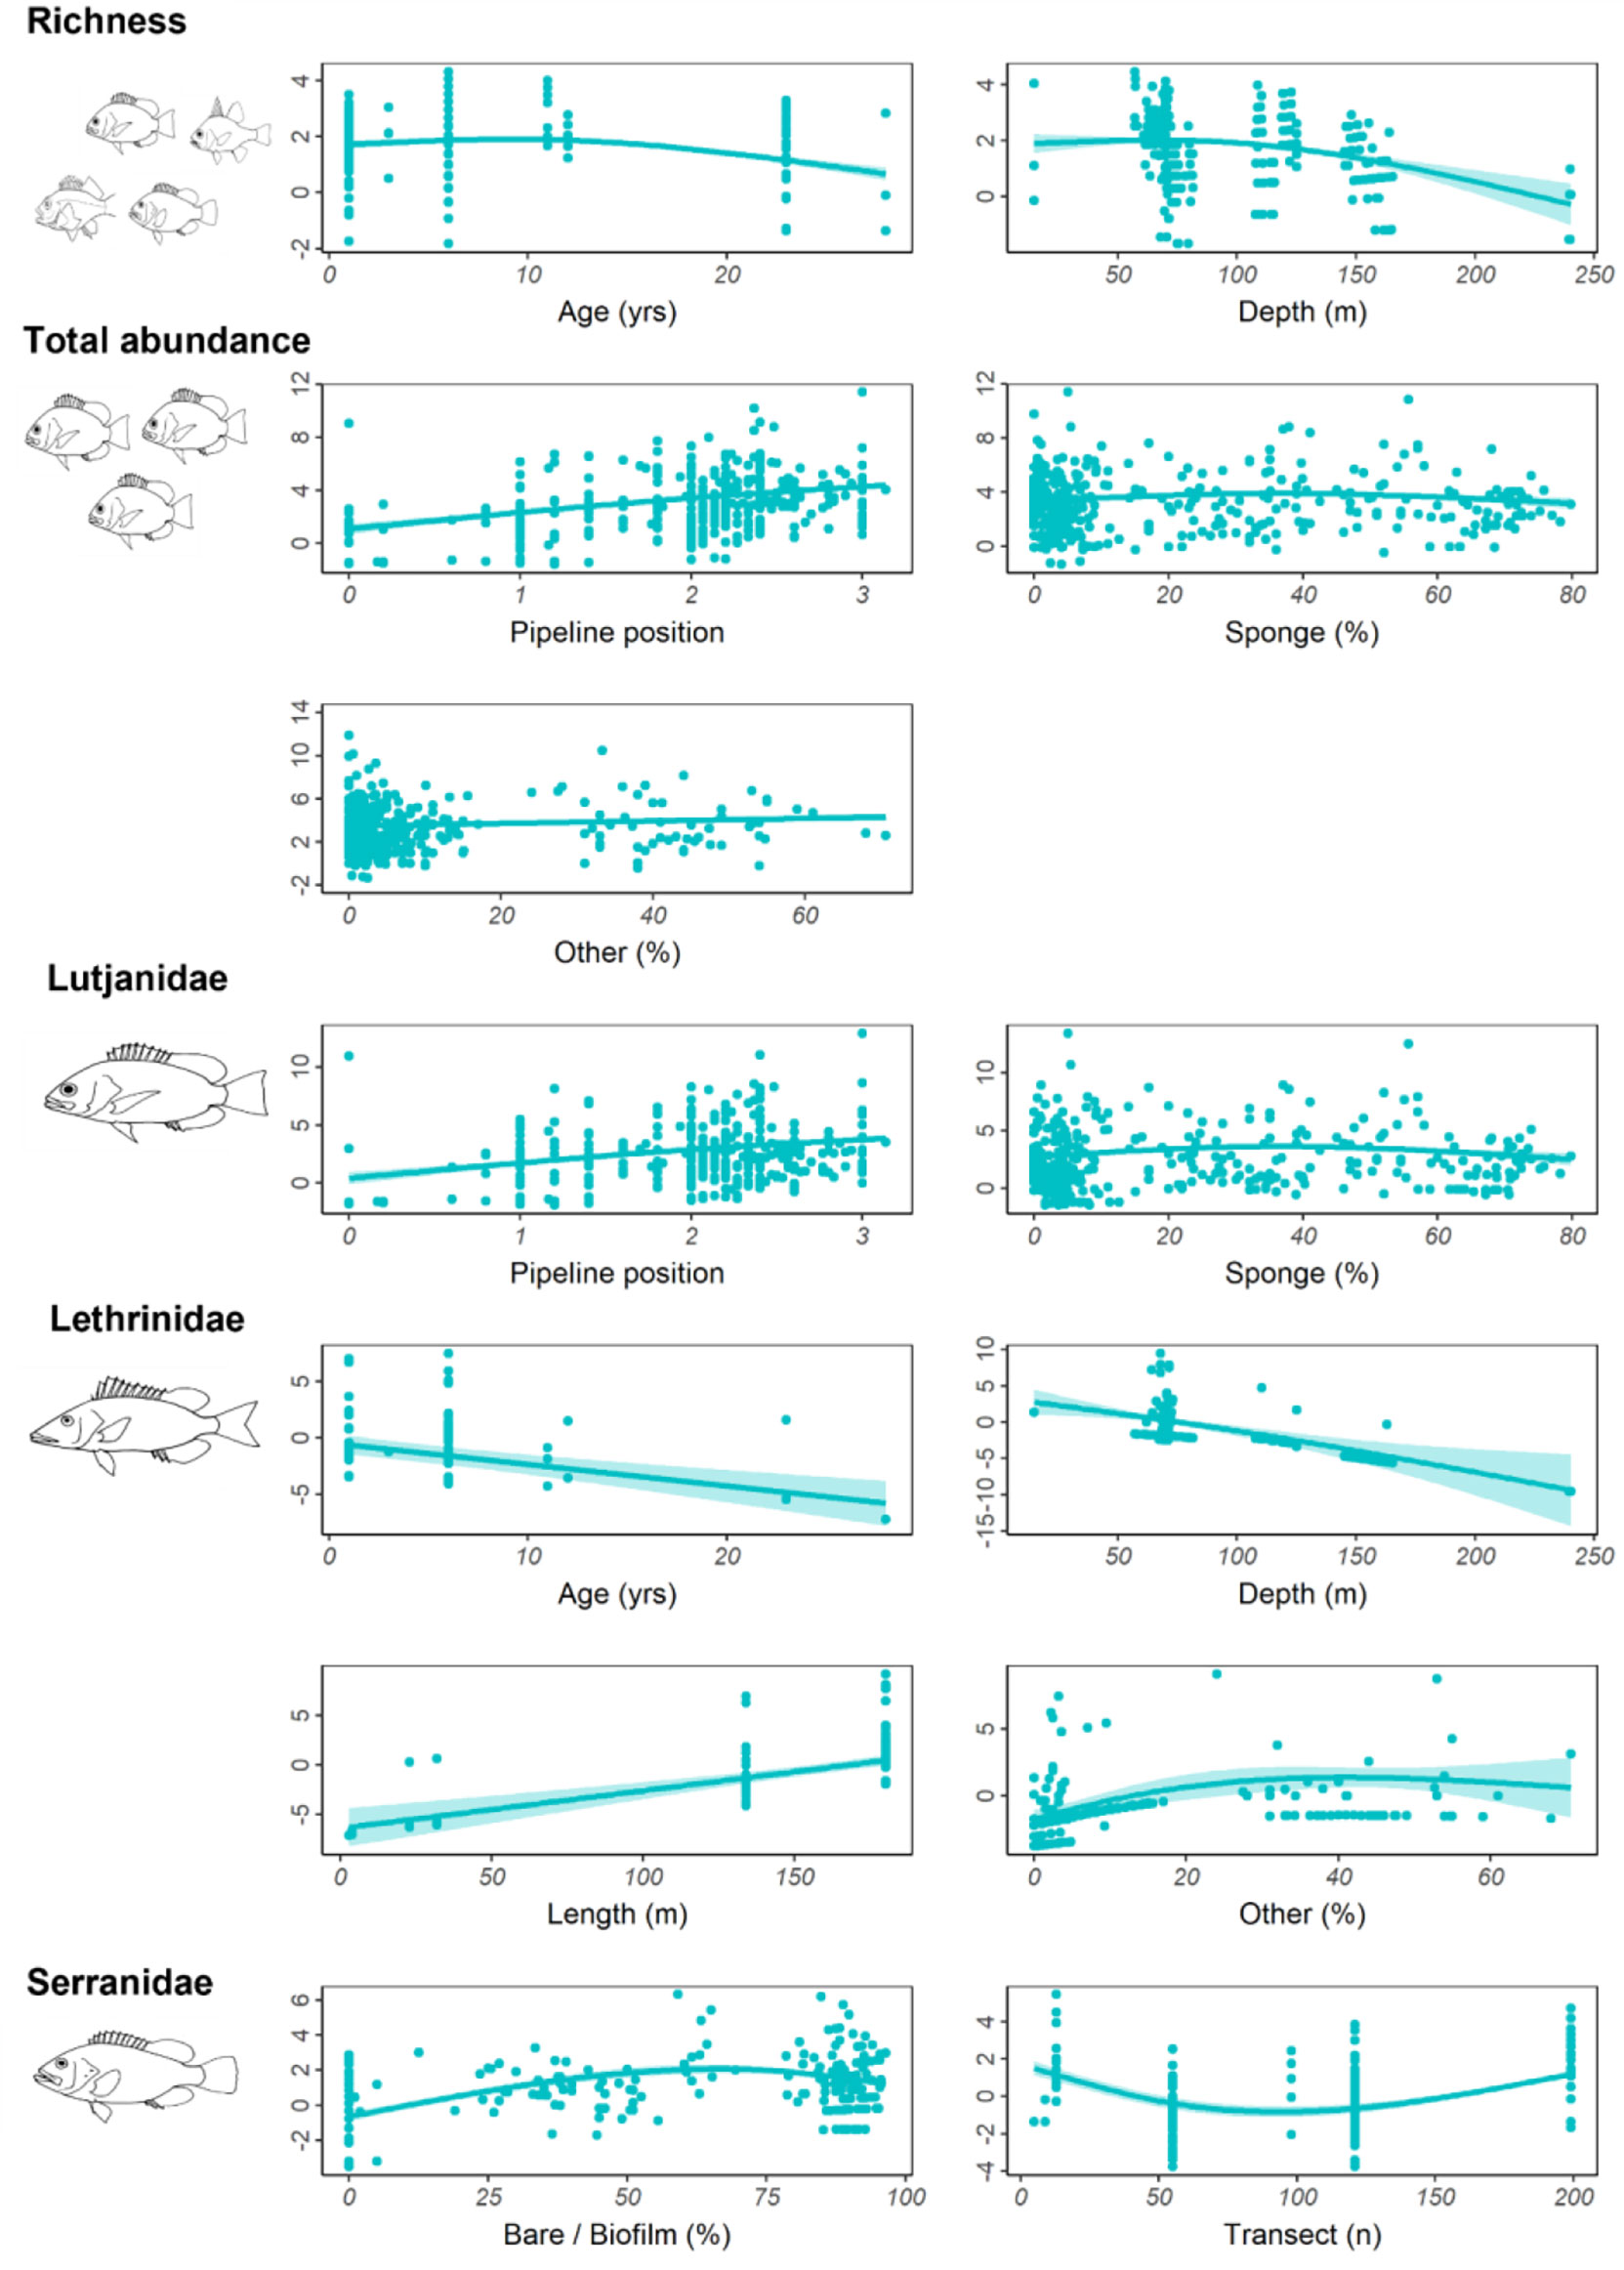
Figure 9 Total residual abundance of fishery target species, richness and residual abundance of the three most abundant fishery target families on pipelines in <400 m depth in the north-west. Residual abundances are plotted relative to their most important explanatory variables (Table 7, Figure S2). Models were fitted using Generalised additive models. The solid line represents the estimated smoothing curve, and dashed lines represent ±2 × SE of the estimate.
For pipelines in the SE, the most important predictor variables for richness and abundance of fishery target species and abundances of Helicolenus spp. and N. macropterus are shown in Table 8 and Figure S5. Fishery target species richness was highest on the smallest-diameter pipelines and increased with pipeline exposure (less buried, more spanning) (Figure 10). Total abundance of fishery target species increased with increasing depth and total pipeline length (Figure 10). Helicoloenus spp. tended to be present in slightly higher abundance where the underside of the pipeline was not touching the seafloor, yet despite this relationship with pipeline exposure was also more abundant in areas with increasing percent cover of sand (Figure 10). N. macropterus peaked in abundance on pipelines in mid-depth ranges of 200–300 m and were least abundant on shallow pipelines in depths<100 m; however, this relationship was particularly weak (Table 8). This species was also most abundant on the longest pipelines in this region (Figure 10), potentially an artefact of sampling with a higher likelihood of encountering species when a greater area is covered.

Table 8 Generalised additive models (GAMs) for predicting total fishery target species abundance, fishery target species richness, and the total abundance of Helicolenus spp. and Nemadactylus macropterus on pipelines in depths < 400 m in the south-east, within 2 Akaike information criterion of the top model.
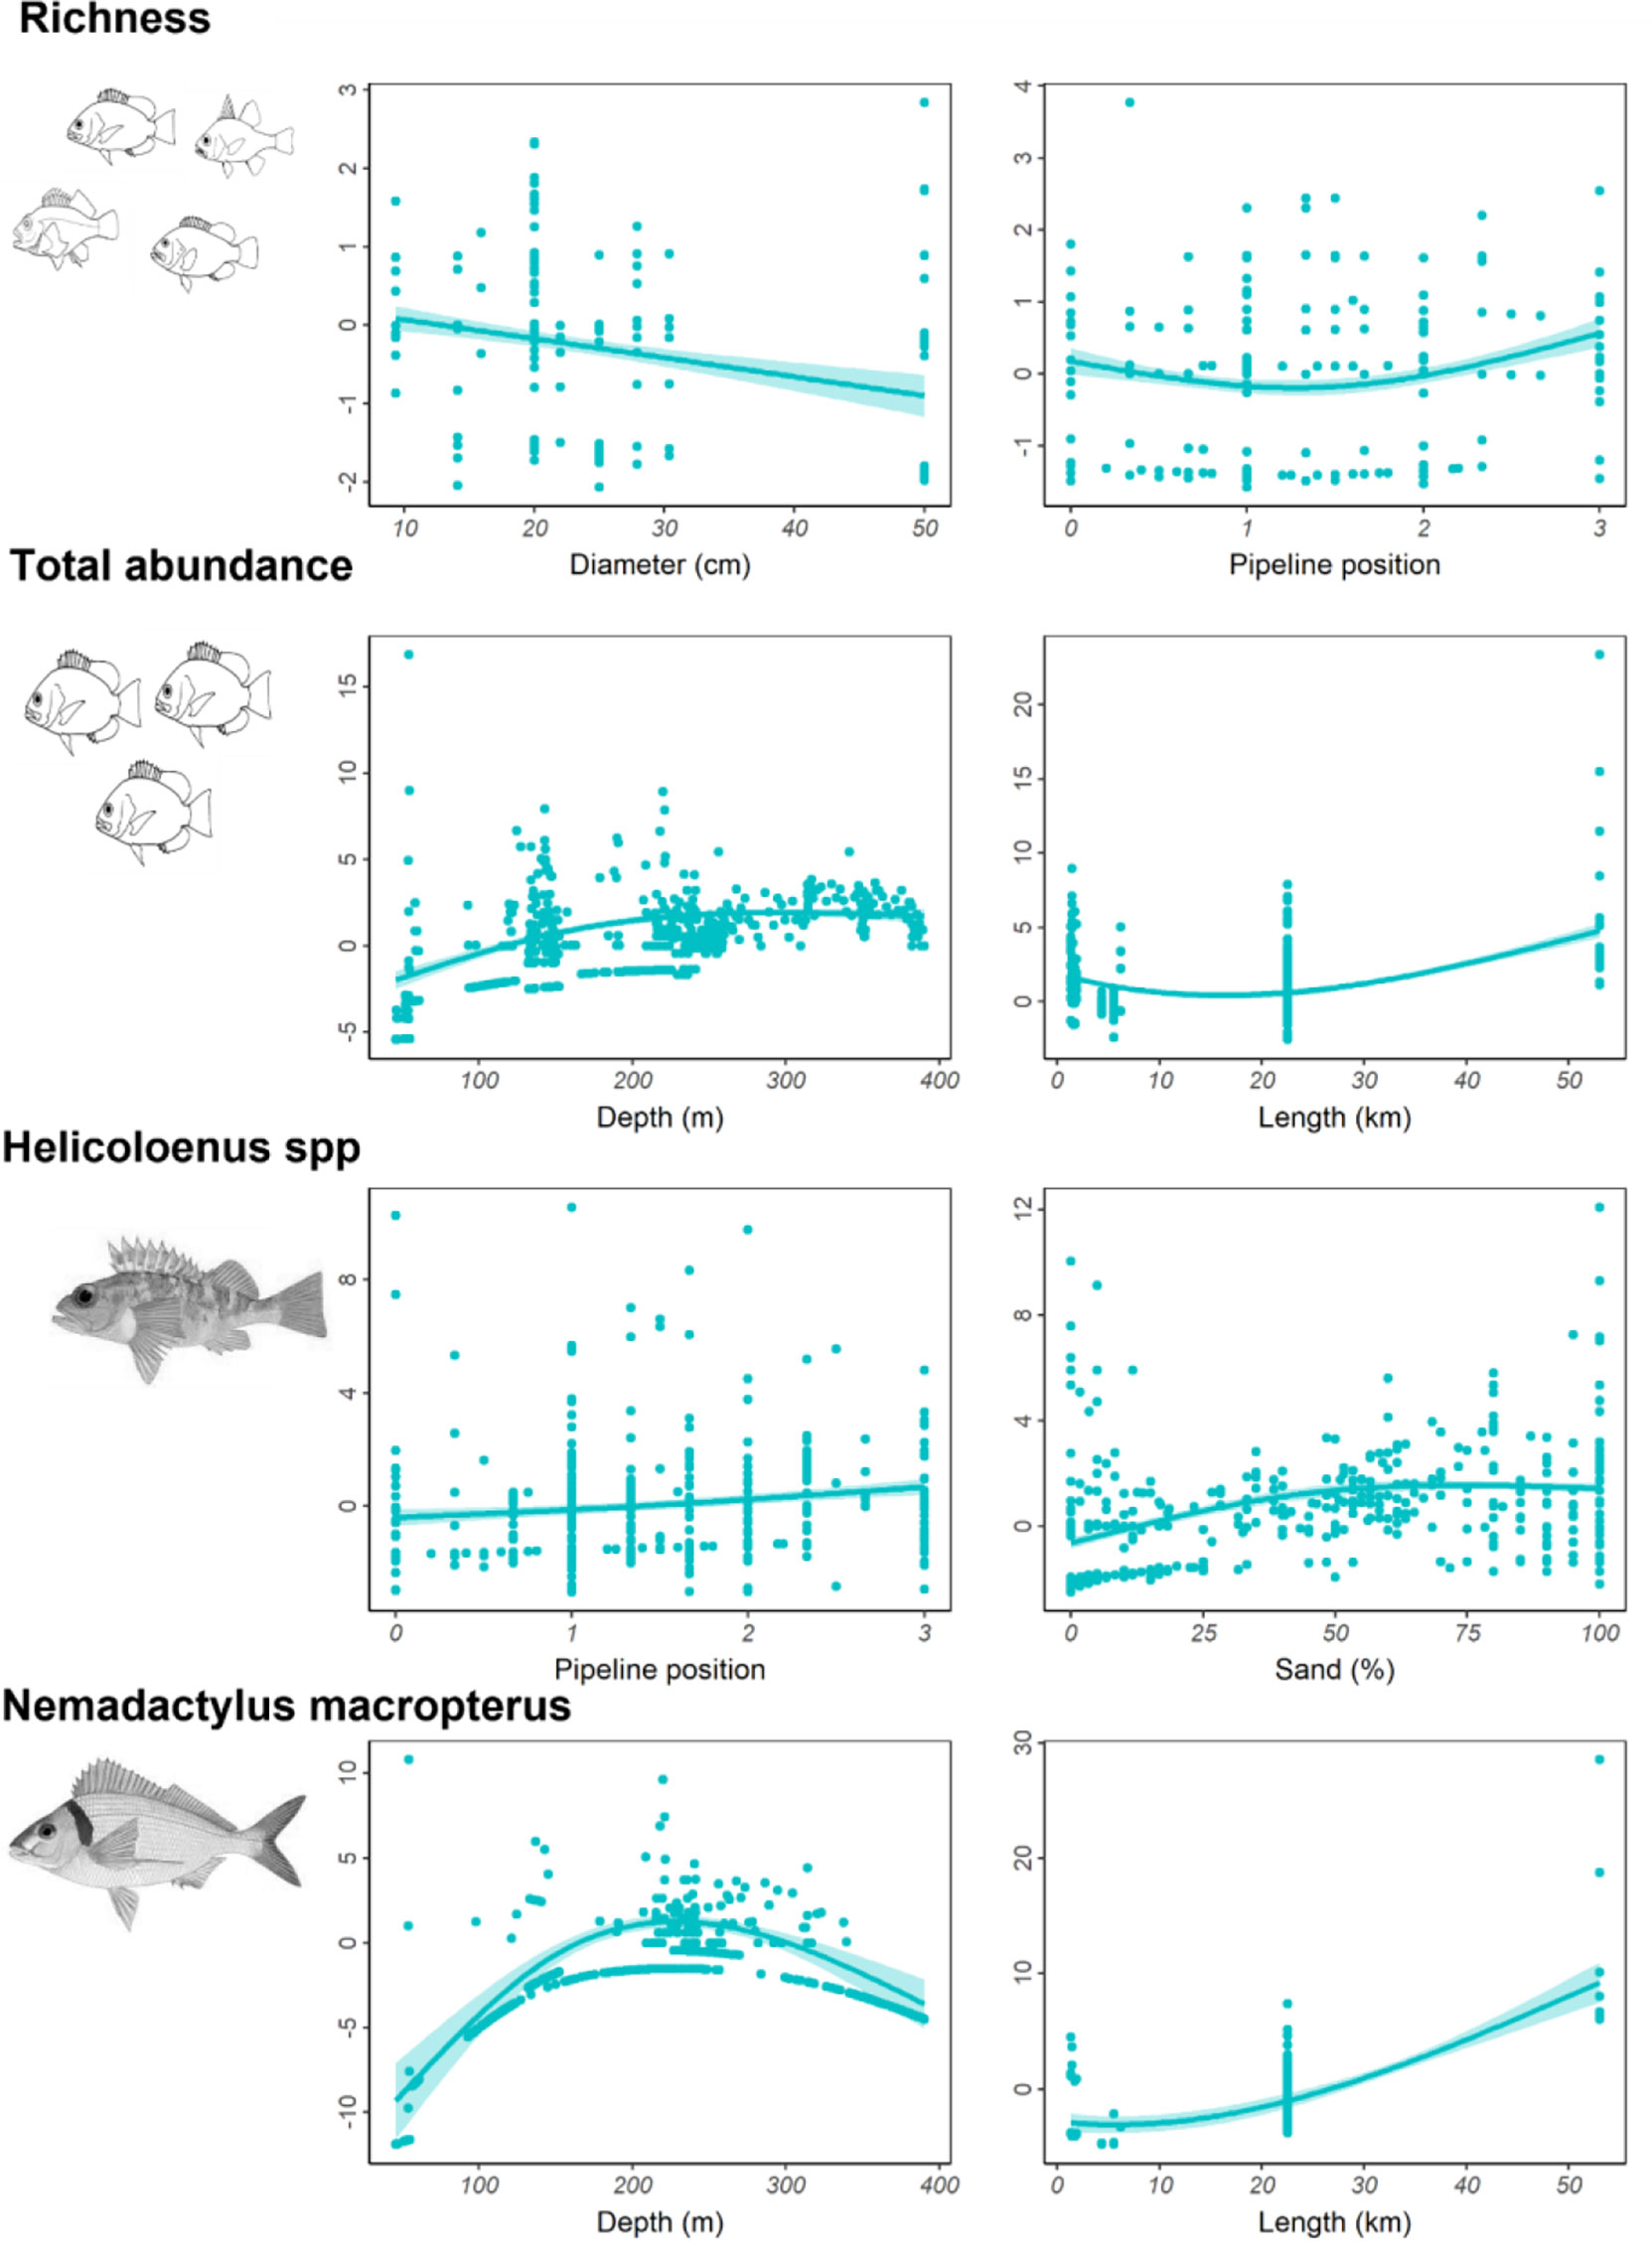
Figure 10 Total residual abundance of fishery target species, richness and residual abundance of the two most common fishery target species on pipelines in<400 m depth in the south-east. Residual abundances are plotted relative to their most important explanatory variables (Table 8, Figure S5). Models were fitted using Generalised additive models. The solid line represents the estimated smoothing curve, and dashed lines represent ±2 × south-east of the estimate.
In the NW, most L. quinquelineatus and L. russellii were estimated to be 20–30 cm in size (58%). Approximately 36% of L. quinquelinatus are smaller than this at 10–20 cm, and 29% of L. russellii are larger at 30–40 cm (Figure 11). L. vitta were smaller, with the vast majority being 10–20 cm in length. In the SE, almost all N. macropterus were 20–30 cm (95%), while Helicolenus spp. were typically small, with 42% being<10 cm and 55% being 10–20 cm in length (Figure 11). Sizes of A. trutta were not obtained from imagery.
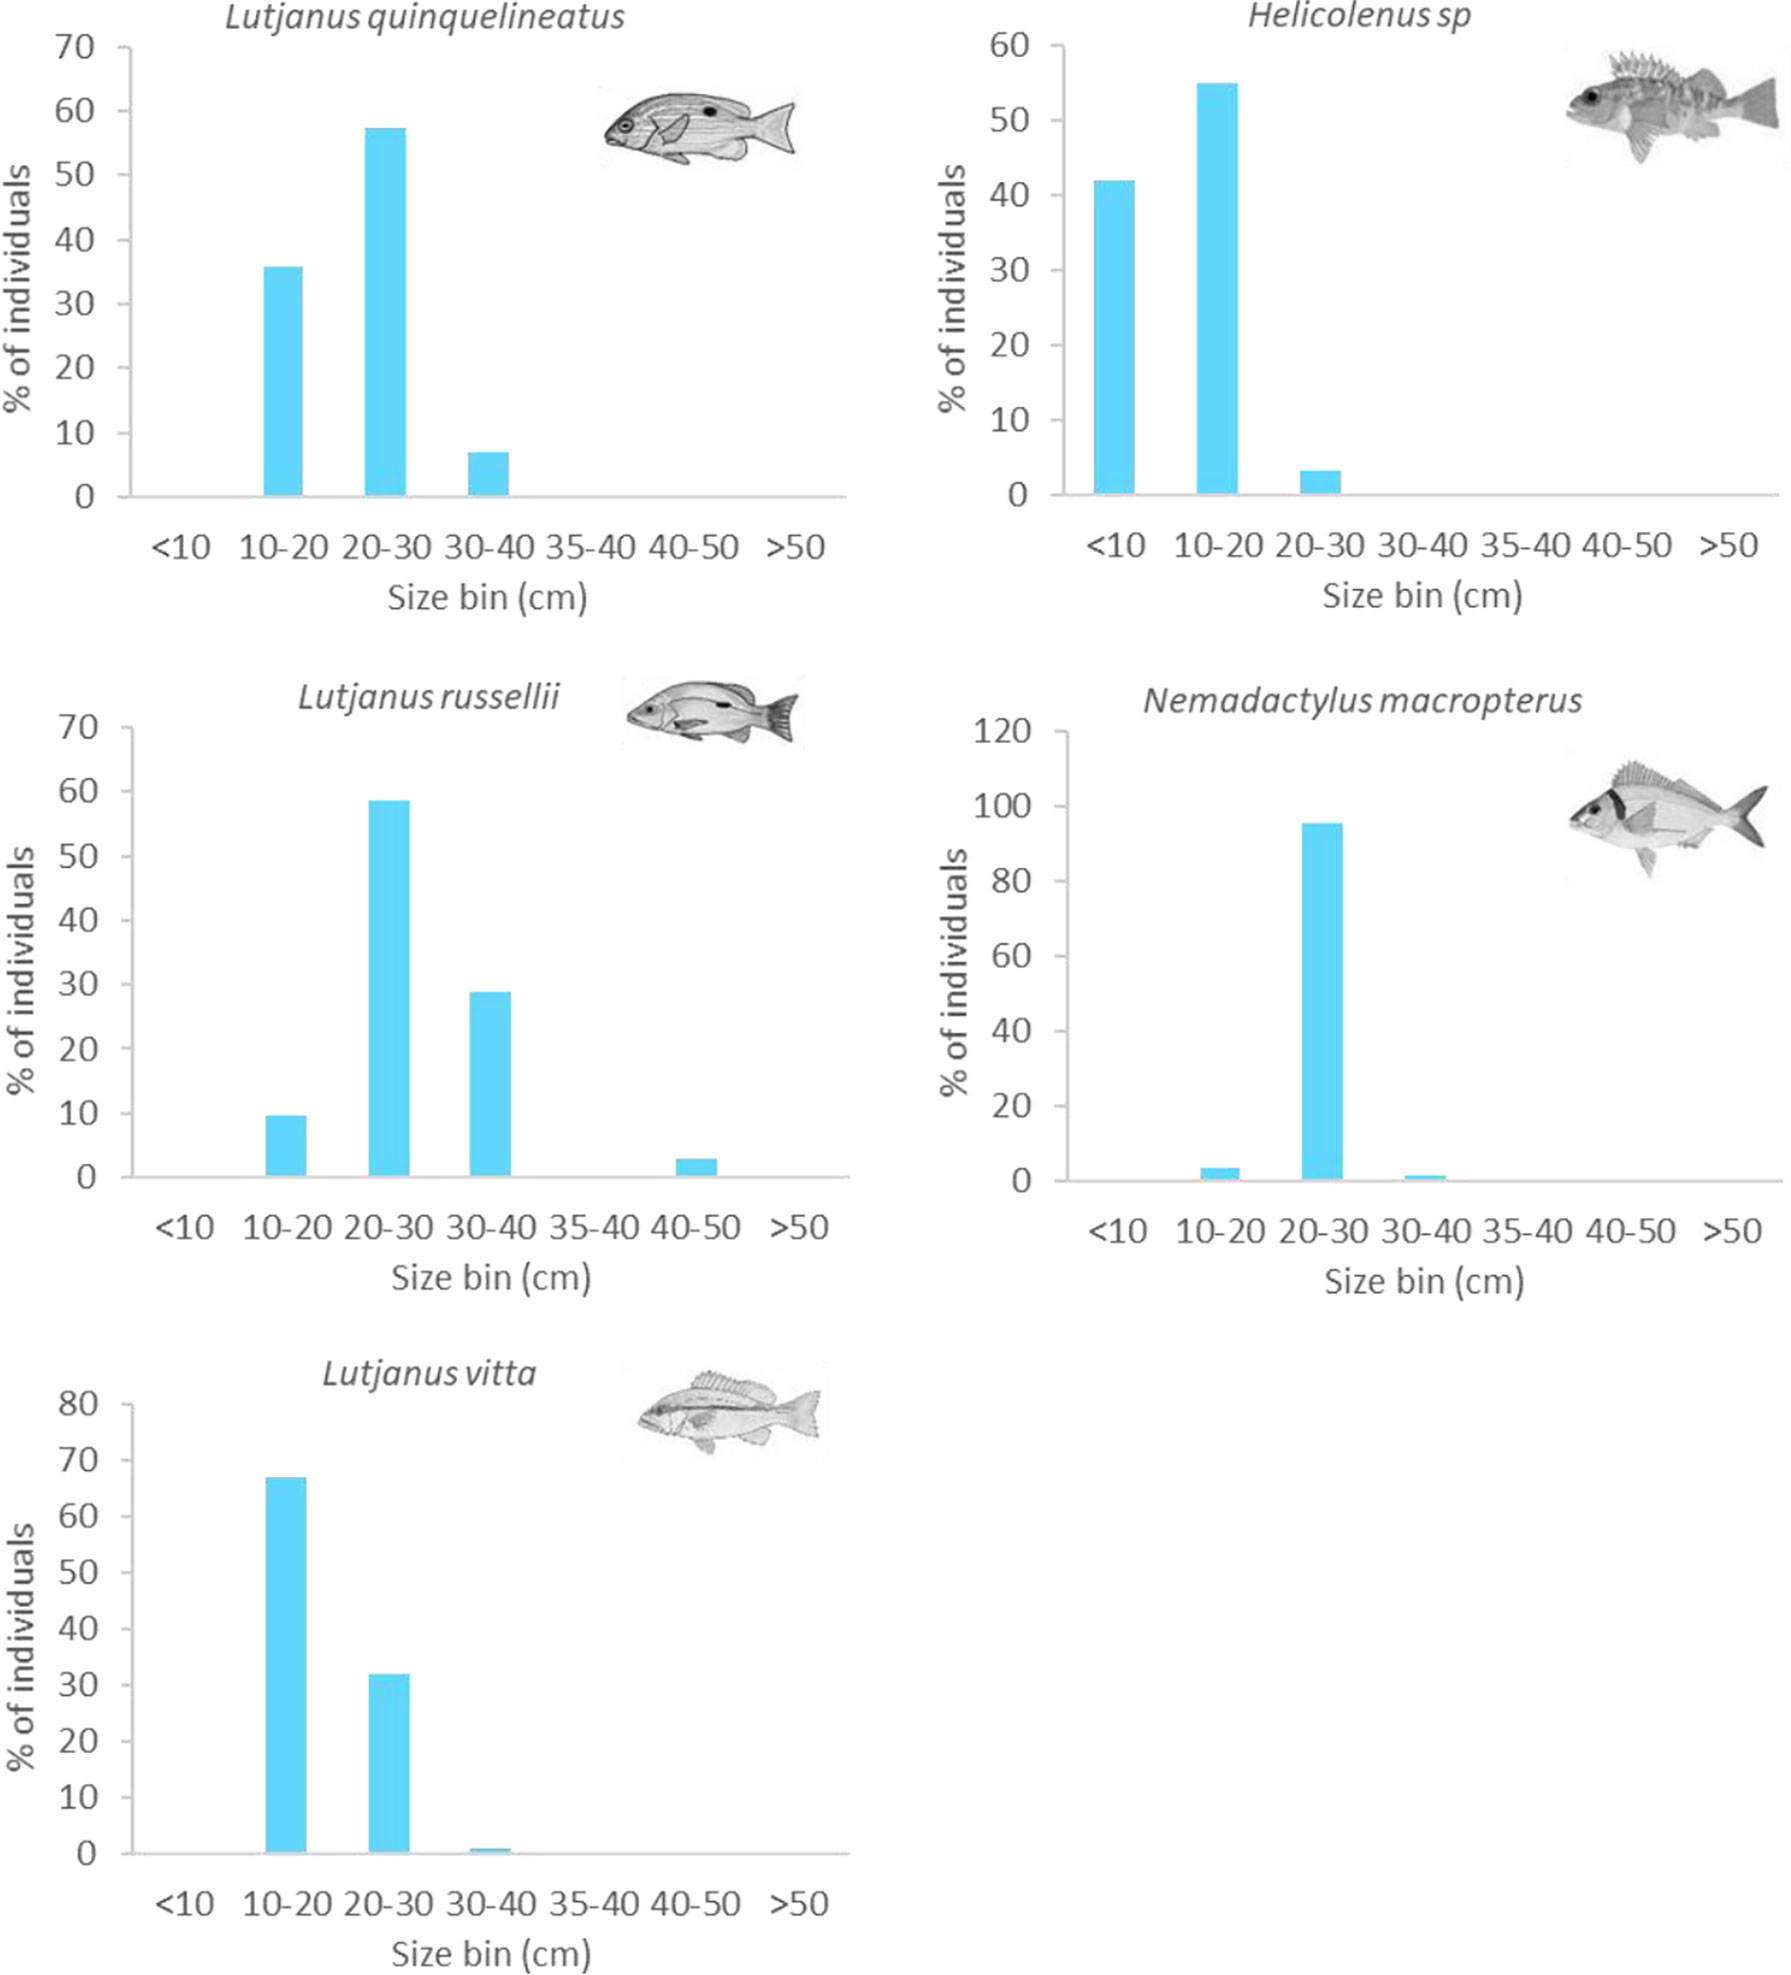
Figure 11 Size frequency of abundant fishery target species observed on subsea pipelines. Sizes estimated from imagery in 10-cm bins.
4 Discussion
4.1 Fishery target species on subsea wells in Australia
A total of 49 species that are targets of fisheries was observed in ROV video from 33 subsea wells (31 in the NW, two in the SE), with >60% of these representatives of Serranidae, Lutjanidae, and Carangidae. Only six target species were observed on video from the two wells sampled in the Bass Strait region of SE Australia. This limited sampling means that additional work will be required to understand relationships between fish communities and well infrastructure in this region (noting the slightly larger data set for wells in this region in Ierodiaconou et al., 2021). For wells in the NW, the abundance of fishery target species was greatest on the seafloor around the structure and right at the seafloor–structure interface, a phenomenon primarily driven by high abundances of demersal snappers and groupers. Such species favour habitats under ledges and overhangs (Figure S1), and as many are ambush predators (e.g., L. argentimaculatus, C. sonnerati), this position may facilitate feeding in addition to providing shelter. Absence or low abundance of pelagic species at this seafloor–structure interface does not necessarily mean that they are not found in these sections but could very well reflect their transient nature or behaviour to the ROV (Bond et al., 2022).
Wells in the shallowest depths and those that were among the shortest in height were associated with high abundances of fishery target species (Figure 5). For well height, this result seems somewhat counterintuitive, as the surface area of structures and fish abundance are typically positively related. For example, Wilhelmsson et al. (2006) reported highest fish densities with greater vertical relief of offshore wind turbines. The complexity or surface area of artificial structures has also been found to have a positive relationship with abundances of fishes and epifauna (Bohnsack et al., 1994; Mintz et al., 1994; Hackradt et al., 2011). T his abundance–well height relationship was likely driven by the particularly high abundance of fish on LN2 and LOW1, the two shallowest wells surveyed (Table S1). A potential reason for the negative relationship we found between well height and fishery target species abundance may be the overarching influence of depth. This variable was a strong predictor of abundance of target species (including lutjanids and serranids) with numbers declining as depth increased. Depth has also been shown to be a strong predictor of fish communities in natural ecosystems of this region (Abdul Wahab et al., 2018; Currey-Randall et al., 2021). In this case, shorter wells were found in the shallowest depths, which may have confounded the relationship between surface area and abundance.
Interestingly, fishery target species richness and Serranidae abundance increased with the percent cover of bare structure or wells coated in a thin “biofilm” of unidentifiable encrusting epibiota. The relationships were not strong (Figure 4) and for serranids occur in tandem with a high percent cover of “other” epibiota. Rather than suggest that wells relatively bare of epifauna promote the abundance of target species, this relationship is likely masking some other unmeasured, and therefore untested, variable that influences abundance. This might be revealed if the quality of imagery collected by ROVs was improved to allow better assessment of epibenthic communities. Furthermore, collection of such imagery could facilitate three-dimensional modelling and produce improved estimates of biofouling community weight that can be used to assist industry prepare for decommissioning.
For wells, we focused on three target snapper species that were particularly abundant and common on these structures in the NW and for which sufficient biological information existed to facilitate production modelling. Extraordinarily high abundances of L. russellii on LN2 (480) and LOW1 (448), wells that were reasonably close together (6 km), suggested that the position of these on the North West Shelf may be of significance for this species. Both wells were in a similar depth (75–87 m) and were surveyed at the same time of year (late January 2018), coinciding with a full moon. The high abundance of these species we observed may be due to the presence of spawning schools of L. russellii. Although we could find no published works documenting the spawning location and timing for this species, spawning for other species in the family Lutjanidae occurs around new and full moon periods elsewhere (e.g., Russell and McDougall, 2008, for L. argentimaculatus off the coast of northeastern Australia). As L. russellii is long-lived (~20 years) with rapid growth toward asymptotic length, the species may be vulnerable to overfishing (Newman, 2002b). Further research should seek to verify whether subsea wells are facilitating spawning of these target species in the NW, and if this proves to be the case, management measures (e.g., temporary closures) could be instigated to protect these locations. It is worth also noting that the abundances of L. russellii on these two wells were more than half the total annual catch of this species by the recreational and charter sector for WA (n = 753 in 2017/2018; Gaughan and Santoro, 2021). Of the 114 species/groups of taxa caught by commercial fisheries in WA, L. russellii is ranked 20th in terms of catch tonnage (67 tonnes in 2018/2019; Gaughan and Santoro, 2021).
The total average biomass of the three species we examined (L. russellii, L. malabaricus, L. argentimaculatus) was 47.94 kg per well or 115.24 g m-3 per well. The total biomass (1,270 kg) represents only a tiny fraction of the tonnage obtained across commercial and recreational fisheries in this region (approximately 1,170 tonnes in 2019/2020; Gaughan and Santoro, 2021). However, this value is higher than demersal species observed on a larger Sydney artificial reef (Table 2 in Smith et al., 2016). Our estimate of local production of fish per well was 105.2 g m2 year-1, and while lower than assemblage-level studies [e.g., 384 g m−2 year−1, Smith et al. (2016); 105–887 g m−2 year−1, Claisse et al. (2014)], it is still similar to some oil platforms listed in Claisse et al. (2014). A lower production value here compared to these studies is not surprising given that our estimate reflects only three species (18 in Smith et al., 2016), species that are each relatively long-lived with low mortality and quite reef-affiliated and the conservative nature of “MaxN.” Smith et al. (2016) also used a video method to sample fish, but instead of using the highest MaxN across sections of the artificial reef (as was done here), they summed each separate measure of relative abundance from the different areas of the reef. While the subsea wells surveyed here are approximately half the size of the Sydney artificial reef surveyed by Smith et al. (2016), our method would likely still have underestimated the abundances of species observed. Levels of production for each lutjanid species were within the range of those reported for demersal fish species on a shallow coral reef in Moorea (e.g., Sargocentron microstroma; Galzin, 1987) and coastal artificial reefs off southern California (e.g., Embioloca jacksoni; Johnson et al., 1994). In calculating this overall production, we averaged the total production across all wells where individuals were observed. If wells were considered on their own, production could be as little as zero where no individuals were observed or much higher, such as on LN2 where 480 L. russellii were observed, giving a total production value for this one species of 742.9 g m2 year-1 on this well. This highlights the importance and value of including multiple survey periods (e.g., long-term monitoring) in production estimates to obtain measures that more accurately encompass temporal variability in fish abundances. Without accounting for temporal variability in abundances, our production estimates reflect production for the period in which these structures were surveyed.
New production refers to the production that will be lost from the entire ecosystem (not just specific wells) if wells were to be removed. Here, our estimates of tprop resulted in a total Pnew across all wells (summed) of 124 kg year-1 (mean of 4.6 kg year-1 per well), which is ~69% of total local production. This result contrasts that of Smith et al. (2016) who found that new production was only 4% of total production per year. The result of Smith et al. (2016) was likely due to the high number of visitor species in their study compared to the comparatively more resident species surveyed here (Table 2). This result demonstrates that production measures can be higher for more resident reef-associated species, particularly when on structures in oligotrophic ecosystems where natural reef environments are lacking, such as those surveyed here. However, these results are based on a single survey period and, as stated, really need repeat surveys to better understand how resident or otherwise these species are on these structures and therefore to validate the accuracy of measures presented here.
4.2 Fishery target species on subsea pipelines in Australia
Many more target species were observed along subsea pipelines (90 spp.) than on well infrastructure (49 spp.), yet assemblages were similarly dominated by lutjanids, serranids, and carangids (total 46% species in these families). These families are known to be ubiquitous in natural reef ecosystems across the NW (McLean et al., 2016; Abdul Wahab et al., 2018; Currey-Randall et al., 2021) and, excluding tropical snappers, also in the SE marine region (Williams and Bax, 2001; Butler et al., 2002). As richness and abundance counts are intrinsically linked to sampling effort, and with disproportionate sampling effort across pipelines (Table S2), it is not possible to compare these measures across pipelines. However, we can describe the fish communities we observed and link this abundance to epibenthic communities and environmental and pipeline-specific variables, noting that (similar to wells) it is not possible to account for the likely influence of other unmeasured variables.
The most abundant taxa observed on pipelines in the SE was Helicolenus spp. (ocean perch), which is likely to include the two species that were indistinguishable in imagery (H. barathi—offshore and H. percoides—inshore). These species are targeted by the southern and eastern scalefish and shark fishery via bottom trawl and Danish seine with 189.2 tonnes landed in 2020–2021 (Patterson et al., 2021) and 304 tonnes permitted for the 2021–2022 season. Here, this species was most abundant in depths of 100–400 m, averaged 2.64 ± 0.2 individuals per 50-m transect, and was most abundant on Blackback (BKA) to Mackerel (MKA) (noting our caveat on sampling effort above). The abundance of Helicolenus spp. increased with increasing pipeline exposure and sand cover, suggesting that the species may be attracted to the pipeline as shelter in the absence of complex biota. Similar relationships between fish abundance and pipeline spans have been reported previously in the NW (McLean et al., 2017; Bond et al., 2018a; Schramm et al., 2021) and the North Sea (Redford et al., 2021). This pattern may also reflect known associations of this species with rocky habitat during the adult phase and soft habitat in the juvenile phase (Seiler et al., 2012). Here, the majority of this species were small (<20 cm; 96%) and as such are likely to be juveniles at ~5 years of age (Paul and Horn, 2009). Their observation on pipelines that were exposed but surrounded by soft sediment communities suggests both an affiliation with soft habitat and benefit derived from shelter that an exposed pipeline may offer.
The second most abundant target species observed in the SE region was N. macropterus (morwong), which, like Helicolenus spp., is a demersal fish found in continental waters of southern Australia (Jordan, 2001; Patterson et al., 2021). Targeted by the same fishery as ocean perch, 97.6 tonnes were landed in 2020–2021 (Patterson et al., 2021). Nearly all individuals we observed were estimated to be 20–30 cm in length, approximately the size at which this species attains maturity (23–29 cm; Jordan, 1998). Interestingly, 580 individuals of N. macropterus were observed on Blackback to Mackerel and 445 on MarlinA to Shore, yet none were observed on BreamB (BMB) to BreamA (BMA) pipeline and very few (0–5) on all other flowlines (Table 6). We are unsure why this might be the case, but note that it is unlikely due to imagery quality, depth, nor pipeline size, with these metrics similar to at least one other pipeline surveyed. The strongest environmental predictor for this species abundance in our models was depth, which indicated a peak around 200–300 m and therefore not too dissimilar for the depth at which peak catch rates occur in Tasmania (150–200 m) (Lyle and Ford, 1993).
The eastern Australian salmon (A. trutta) were abundant only on MarlinA to Shore (n = 250 individuals) but were observed on two transects, i.e., schools of individuals passing within view of the ROV. This species contributes significantly to the commercial fishery in SE Australia as well as being a prized recreational sportfish (Hughes, 2012; Hughes et al., 2017). After A. trutta, redfish (Centroberyx affinis), an endemic species to SE Australia, were the fourth most abundant fishery target species on pipelines in the SE, with all observations occurring in a single transect on MarlinA–Shore in<100-m depth. This species is presently classed as “overfished” by the southern and eastern scalefish and shark fishery (Patterson et al., 2021).
Lutjanids were the most abundant target species on subsea pipelines in NW Australia. Of these, L. vitta were the smallest in size and most abundant, averaging 5.8 ± 0.7 individuals per 50-m transect. This demersal reef-associated species is known to form schools (Newman et al., 2000) and is an important component of the northern demersal scalefish fishery, ranking #7 in terms of gross tonnage (Newman et al., 2020). Fetching a similar price to L. vitta ($3.93 kg), L. quinquelineatus were slightly larger and observed in similar abundances across pipelines in the NW region. This species is reported to be the most abundant lutjanid species on the Great Barrier Reef (Newman, 1995). Also particularly abundant, L. russellii are slightly larger-bodied lutjanids not known to form large schools (although see Fishery target species on subsea wells in Australia above). High abundance of lutjanids along pipelines supports previous research on pipelines in this region (Bond et al., 2018a; Bond et al., 2018b; Bond et al., 2018c; McLean et al., 2021a). The value of pipelines as habitat for lutjanids appears closely linked to the provision of shelter, with a higher abundance of these species where pipelines are less buried and span the seafloor (Figure 9).
A range of serranids and lethrinids were also abundant on subsea pipelines (Table S4), and although relationships with pipeline spanning were not evident at the level of family, some other factors relating to pipelines as structures did. A higher abundance of lethrinids on younger, shallower, longer pipelines suggests an abundance of these species on particular pipelines (or sections of pipelines), namely, Jansz and Pluto. Serranids tended to be present in higher abundance where pipelines were bare or coated in a thin biofilm of unidentified encrusting biota, a result similar to that observed to wells but suspected to be an artefact of imagery quality. There is potentially an undetected relationship with epibiotic communities for this species that requires higher-resolution imagery to resolve. There is perhaps also the potential that serranids may predate upon fauna that have a strong relationship with soft sediment communities (e.g., crabs, prawns). Examination of dietary studies of these species utilising O&G infrastructure would provide an improved understanding of the habitat value for these key fishery species.
5 Conclusion
The provision of hard surfaces configured with complexity that includes crevices and overhangs near the seafloor (e.g., near flow base of wells, under pipeline spans) appears to benefit the abundance of many demersal species that are targets of fisheries. Although industry seeks to minimise pipeline spans due to the increased prevalence of vortex vibrations and risks to pipeline integrity they can pose, this would likely reduce their value as habitat for these species. As previous research has shown, some fish may in fact maintain or even increase the size of such spans (Leckie et al., 2016). Other pipeline features such as concrete mattresses that add additional habitat complexity via increased surface area and crevices also have positive relationships with fish abundance (Rouse et al., 2019; Redford et al., 2021—North Sea) yet do not appear to be used as often in Australia perhaps due to lower incidences of trawl fishery interactions with pipelines. Although complex structure near the seabed is important for fishery target species, vertical relief that includes complexity (e.g., tree cap assembly on subsea wells) provides important habitat for non-fishery target species (McLean et al., 2021b). As many smaller-bodied non-target species are likely prey of larger (primarily predatory) fishery target species, structures that incorporate vertical height above the seafloor may provide habitat for a broader representation of species across trophic groups.
Research should build upon our first estimates of fish production for wells and assess such metrics for entire fish communities on offshore platforms, a feat that would require sampling an entire jacket structure to ensure accuracy in abundance estimates. All such analyses are based on a good understanding of the biology of species and for many species in remote regions such as the far NW and SE, such information is still to be acquired. Here, it is not possible to state whether the production and biomass of fish on subsea wells are significant relative to natural reefs or potential fishery contribution. Comparable surveys and fish production estimates across natural habitats are required in addition to temporal studies to better quantify variability in fish abundances at these structures.
In summary, our conclusions are as follows:
1. Every structure possesses a fish community seemingly shaped by a unique combination of environmental, structural, and biological relationships. As such, the impact of decommissioning on communities present and the broader ecological processes that they are a part of will need to be considered on a case-by-case basis.
2. Existing industry-held ROV imagery, while useful for documenting larger more mobile fauna and observing unique behaviours, range extensions, interactions, etc. (Macreadie et al., 2018; Todd et al., 2020), is typically not sufficient for quantifying epibenthic communities. An exception is the recent use of super High definition autonomous underwater vehicle (HD AUV) imagery (e.g., Cooper Energy flowlines, Wanaea Cossack pipeline). Imagery not fit for purpose limits our understanding of relationships between epibenthic communities and fishery species.
3. An understanding of the role that O&G structures play in marine ecosystems will require quantification of ecological phenomena such as connectivity, trophic relationships, and levels of residency (e.g., Fowler and Booth, 2012; Fowler et al., 2015). This will require dedicated and expanded sampling of offshore structures and surrounds. Until such quantitative data are obtained, studies rely heavily on estimates (e.g., residency rates here), and as such, queries or unanswered questions regarding their findings remain.
4. Before-after-control-impact studies with sufficient replication (spatially, temporally) are required to inform decommissioning. Such studies will enable not only better prediction of environmental impacts that may arise under different decommissioning options (informing comparative assessments) but also quantification of such impacts. A comparison of fish production on structures and in natural ecosystems before and after their decommissioning, in tandem with fishery spatial operations and catch per unit effort data, would improve our understanding of how this infrastructure contributes to fisheries and fish stocks generally in this region. This information is essential for decisions to be made that minimise environmental impacts and inform Australia’s decommissioning journey ahead.
Data availability statement
The original contributions presented in the study are included in the article/Supplementary Material. Further inquiries can be directed to the corresponding author.
Ethics statement
Ethical review and approval was not required for the animal study because visual in situ observations only.
Author contributions
DM led the project. DM, CS, MB, JC, MC, MS, and BV undertook detailed video and statistical analysis. DM, CS, MB produced graphics. TB, DI, SWi, MT, and SWh provided additional data that was incorporated into the study. All authors contributed to writing of the manuscript. All authors contributed to the article and approved the submitted version.
Acknowledgments
We thank the National Decommissioning Research Initiative (NDRI) for coordinating the funding for this project, in addition to managing all contributing industry partners, namely Shell Australia Pty Ltd, Esso Australia Pty Ltd, Chevron Australia Pty Ltd, BHP Petroleum Pty Ltd, Woodside Energy Ltd, Santos Ltd, Vermillion Oil and Gas Australia Ltd, Cooper Energy Ltd. We thank Andrew Taylor for his tireless efforts as the founding Director and most recently, Sam Jarvis as the new Director. We thank the NDRI science advisory board, in particular Prof Peter Macreadie and Prof Iain Suthers for their ideas and guidance along the way. We also thank industry representatives for their advice and positive engagement throughout the project. Assistance in refining the production metrics for important commercially fished species was provided by Dr Stephen Newman (Department of Primary Industries and Region Development) for which we are grateful. We acknowledge Douglas Reeves who commenced analysis of Bass Strait infrastructure for his masters, before moving on to employment. We thank Dr Mark Meekan and Dr Karen Miller for their review of our writings. AIMS acknowledges the Traditional Owners of the Country adjacent to where this research was undertaken. We recognise their ongoing spiritual and physical connection to Country and pay our respects to their Elders past, present and emerging.
Conflict of interest
The authors declare that the research was conducted in the absence of any commercial or financial relationships that could be construed as a potential conflict of interest.
Publisher’s note
All claims expressed in this article are solely those of the authors and do not necessarily represent those of their affiliated organizations, or those of the publisher, the editors and the reviewers. Any product that may be evaluated in this article, or claim that may be made by its manufacturer, is not guaranteed or endorsed by the publisher.
Supplementary material
The Supplementary Material for this article can be found online at: https://www.frontiersin.org/articles/10.3389/fmars.2022.960496/full#supplementary-material
References
Abdul Wahab M. A., Radford B., Cappo M., Colquhoun J., Stowar M., Depczynski M., et al. (2018). Biodiversity and spatial patterns of benthic habitat and associated demersal fish communities at two tropical submerged reef ecosystems. Coral Reefs 37 (2), 327–343. doi: 10.1007/s00338-017-1655-9
Althaus F., Hill N., Ferrari R., Edwards L., Przeslawski R., Schönberg C. H. L., et al. (2015). A standardised vocabulary for identifying benthic biota and substrata from underwater imagery: The CATAMI classification scheme. PloS One 10, e0141039–e0141039. doi: 10.1371/journal.pone.0141039
Anderson M. J. (2004). PERMDISP: a FORTRAN computer program for permutational analysis of multivariate dispersions (for any two-factor ANOVA design) using permutational tests (New Zealand: Department of Statistics, University of Auckland).
Anderson M., Gorley R., Clarke K. (2008). PERMANOVA+ for PRIMER: Guide to software and statistical methods (Plymouth, UK: PRIMER-E Ltd).
Bohnsack J. A., Harper D. E., McClellan D. B., Hulsbeck M. (1994). Effects of reef size on colonization and assemblage structure of fishes at artificial reefs off southeastern Florida, U.S.A. Bull. Mar. Sci. 55 (2-3), 796–823.
Bond T., Langlois T. J., Partridge J. C., Birt M. J., Malseed B. E., Smith L., et al. (2018c). Diel shifts and habitat associations of fish assemblages on a subsea pipeline. Fish. Res. 206, 220–234. doi: 10.1016/j.fishres.2018.05.011
Bond T., McLean D. L., Prince J., Taylor M. D., Partridge J. C. (2022). Baited remote underwater video sample less site attached fish species along a subsea pipeline compared to a remotely operated vehicle. Mar. Freshw. Res 73 (7), 915–930. doi: 10.1071/MF21261
Bond T., McLean D. L., Wakefield C., Partridge J., Prince J., White D., et al. (2021). Quantifying fishing activity targeted subsea pipelines by commercial trap fishers. Rev. Fish Biol. Fish. 31, 1009–1023. doi: 10.1007/s11160-021-09686-4
Bond T., Partridge J. C., Taylor M. D., Cooper T. F., McLean D. L. (2018a). The influence of depth and a subsea pipeline on fish assemblages and commercially fished species. PloS One 13, e0207703. doi: 10.1371/journal.pone.0207703
Bond T., Partridge J. C., Taylor M. D., Langlois T. J., Malseed B. E., Smith L. D., et al. (2018b). Fish associated with a subsea pipeline and adjacent seafloor of the north West shelf of Western Australia. Mar. Environ. Res. 141, 53–65. doi: 10.1016/j.marenvres.2018.08.003
Bugnot A. B., Mayer-Pinto M., Airoldi L., Heery E. C., Johnston E. L., Critchley L. P., et al. (2021). Current and projected global extent of marine built structures. Nat. Sustain. 4, 33–41. doi: 10.1038/s41893-020-00595-1
Burnham K. P., Anderson D. R. (2003). Model selection and multimodel inference: A practical information-theoretic approach (New York: Springer New York). doi: 10.1007/b97636
Butler A., Althaus F., Furlani D., Ridgway K. (2002). Assessment of the conservation values of the bass strait sponge beds area. CSIRO Mar. Res. Rep. Environ. Aust., 64.
Cappo M., Harvey E., Shortis M. (2007). “Counting and measuring fish with baited video techniques – an overview,” in Proceedings of the 2006 Australian society of fish biology conference and workshop cutting edge technologies in fish and fisheries science. Eds. Lyle J. M., Furlani D. M., Buxton C. D. (Hobart: ASFB, Hobart).
Christensen V., Pauly D. (1992). ECOPATH II–a software for balancing steady-state ecosystem models and calculating network characteristics. Ecol. Model. 61, 169–185. doi: 10.1016/0304-3800(92)90016-8
Claisse J. T., Pondella D. J. II, Love M., Zahn L. A., Williams C. M., Bull A. S. (2015). Impacts from partial removal of decommissioned oil and gas platforms on fish biomass and production on the remaining platform structure and surrounding shell mounds. PloS One 10, e0135812. doi: 10.1371/journal.pone.0135812
Claisse J. T., Pondella D. J., Love M., Zahn L. A., Williams C. M., Williams J. P., et al. (2014). Oil platforms off California are among the most productive marine fish habitats globally. Proc. Natl. Acad. Sci. 111, 15462–15467. doi: 10.1073/pnas.1411477111
CODA (2021). “A baseline assessment of australia’s offshore oil and gas decommissioning liability,” in Summary of an advisian study commissioned by the centre of decommissioning Australia (CODA).
Cowan J. H., Rose K. A. (2016). “O&G platforms in the gulf of Mexico: their relationship to fish and fisheries. chapter 5,” in Fisheries and aquaculture in the modern world. Ed. Mikkola H. (London: IntechOpen).
Currey-Randall L. M., Galaiduk R., Stowar M., Vaughan B. I., Miller K. J. (2021). Mesophotic fish communities of the ancient coastline in Western Australia. PloS One 16 (4), e0250427. doi: 10.1371/journal.pone.0250427
Dempster T., Taquet M. (2004). Fish aggregation device (FAD) research: gaps in current knowledge and future directions for ecological studies. Rev. Fish Biol. Fish. 14, 21–42. doi: 10.1007/s11160-004-3151-x
Dickie L. (1972). Food chains and fish production. Int. Comm. Northwest Atl. Fish. Spec. Publ. 8, 201–219.
Fisher R., Wilson S. K., Sin T. M., Lee A. C., Langlois T. J. (2018). A simple function for full-subsets multiple regression in ecology with r. Ecol. Evol. 8, 6104–6113. doi: 10.1002/ece3.4134
Fowler A. M., Booth D. J. (2012). Evidence of sustained populations of a small reef fish on artificial structures. does depth affect production on artificial reefs? J. Fish Biol. 80, 613–629. doi: 10.1111/j.1095-8649.2011.03201.x
Fowler A. M., Macreadie P. I., Bishop D. P., Booth D. J. (2015). Using otolith microchemistry and shape to assess the habitat value of oil structures for reef fish. Mar. Environ. Res. 106, 103–113. doi: 10.1016/j.marenvres.2015.03.007
Franks J. S. (2000). A review: pelagic fishes at petroleum platforms in the northern gulf of mexico; diversity, interrelationships, and perspectives. Pêche Thonière Dispositifs Concentration 21oisons Caribbean-Martinique, 502–515.
Fujii T. (2015). Temporal variation in environmental conditions and the structure of fish assemblages around an offshore oil platform in the north Sea. Mar. Environ. Res. 108, 69–82. doi: 10.1016/j.marenvres.2015.03.013
Gallaway B. J., Szedlmayer S. T., Gazey W. J. (2009). A life history review for red snapper in the gulf of Mexico with an evaluation of the importance of offshore petroleum platforms and other artificial reefs. Rev. Fish. Sci. 17, 48–67. doi: 10.1080/10641260802160717
Galzin R. (1987). Potential fisheries yield of a moorea fringing reef (French Polynesia) by the analysis of three dominant fishes. Atoll Res. Bull. 305, 1–21. doi: 10.5479/si.00775630.305.1
Gaughan D. J., Santoro K. (2021). Status reports of the fisheries and aquatic resources of Western Australia 2019/20: The state of the fisheries (Western Australia: Department of Primary Industries and Regional Development).
Gourvenec S., Sturt F., Reid E., Trigos F. (2022). Global assessment of historical, current and forecast ocean energy infrastructure: Implications for marine space planning, sustainable design and end-of-engineered-life management. Renewable Sustain. Energy Rev. 154, 111794. doi: 10.1016/j.rser.2021.111794
Hackradt C. W., Félix-Hackradt F. C., García-Charton J. A. (2011). Influence of habitat structure on fish assemblage on an artificial reef in southern Brazil. Mar. Environ. Res. 72 (5), 235–247. doi: 10.1016/j.marenvres.2011.09.006
Hall A. E., Kingsford M. J. (2021). Habitat type and complexity drive fish assemblages in a tropical seascape. J. Fish Biol. 99 (4), 1364–1379. doi: 10.1111/jfb.14843
Hastie T., Tibshirani R. (1986). Generalized additive models. Stat. Sci. 1, 297–310. doi: 10.1214/ss/1177013604
Hauser A., Attrill M., Cotton P. A. (2006). Effects of habitat complexity on the diversity and abundance of macrofauna colonising artificial kelp holdfasts. Mar. Ecol. Prog. Ser. 325, 93–100. doi: 10.3354/meps325093
Hughes J. M. (2012). The biology and population structure of eastern Australian salmon (Arripis trutta) in south-eastern Australia (The University of New South Wales).
Hughes J. M., Stewart J., Lyle J. M., McAllister J., Stocks J. R., Suthers I. M. (2017). Influence of latitudinal variation in environmental gradients and population structure on the demography of a widespread pelagic fish, Arripis trutta (Forster 1801). Environ. Biol. Fish 11, 121–135. doi: 10.1007/s10641-016-0565-y
Ierodiaconou D., McLean D., Birt M., Bond T., Whitmarsh S., Wines S., et al. (2021). Industry remotely operated video imagery for assessing marine communities associated with subsea oil and gas infrastructure in south-east Australia.
Johnson T. D., Barnett A. M., DeMartini E. E., Craft L. L., Ambrose R. F., Purcell L. J. (1994). Fish production and habitat utilization on a southern California artificial reef. Bull. Mar. Sci. 55 (2-3), 709–723.
Jordan A. R. (1998) The life -history ecology of platycephalus bassensis and nemadactylus macropterus. Available at: https://eprints.utas.edu.au/16414/2/jordon_whole.pdf.
Jordan A. R. (2001). Spatial and temporal variations in abundance and distribution of juvenile and adult jackass morwong, Nemadactylus macropterus, in south-eastern Tasmania. Mar. Freshw. Res. 52 (4), 661–670. doi: 10.1071/MF99156
Jorgensen D. (2009). An oasis in a watery desert? discourses on an industrial ecosystem in the gulf of Mexico rigs-to-Reefs program. Hist Technol. 25 (4), 343–364. doi: 10.1080/07341510903313030
Kaiser M. J. (2006). The Louisiana artificial reef program. Mar. Policy 30, 605–623. doi: 10.1016/j.marpol.2005.04.005
Kovalenko K. E., Thomaz S. M., Warfe D. M. (2012). Habitat complexity: Approaches and future directions. Hydrobiologia 685 (1), 1–17. doi: 10.1007/s10750-011-0974-z
Leckie S., Mohr H., Draper S., McLean D., White D., Cheng L. (2016). Sedimentation-induced burial of subsea pipelines: observations from field data and laboratory experiments. Coast. Eng. 114, 137–158. doi: 10.1016/j.coastaleng.2016.04.017
Levene H. (1960). “Robust tests for equality of variances,” in Contributions to probability and statistics: Essays in honor of Harold hotelling. Eds. Olkin I., Hotelling H., et al (Palo Alto, CA: Stanford University Press), 278–292.
Love M. S., Kui L., Claisse J. (2019). The role of jacket complexity in structuring fish assemblages in the midwaters of two California oil and gas platforms. Bull. Mar. Sci. 95 (4), 597–615. doi: 10.5343/bms.2017.1131
Love M. S., Schroeder D. M., Nishimoto M. M. (2003). “The ecological role of O&G production platforms and natural outcrops on fishes in southern and central California: a synthesis of information,” U. S. Department of the Interior, United States Geological Survey, Biological Resources Division, Seattle, Washington, 98104, OCS Study MMS 2003-032.
Love M. S., York A. (2005). A comparison of the fish assemblages associated with an oil/gas pipeline and adjacent seafloor in the Santa Barbara channel, southern California bight. Bull. Mar. Sci. 77, 101–118.
Lyle J. M., Ford W. B. (1993). Review of trawl research 1979-1987: With summaries of biological information for the major species (Tasmania. Division of Sea: Department of Primary Industry and Fisheries).
Macreadie P. I., McLean D. L., Thomson P. G., Partridge J. C., Jones D. O. B., Gates A. R., et al. (2018). Eyes in the sea: Unlocking the mysteries of the ocean using industrial, remotely operated vehicles (ROVs). Sci. Total Environ. 634, 1077–1091. doi: 10.1016/j.scitotenv.2018.04.049
Martin-Smith K. M. (1993). Abundance of mobile epifauna: The role of habitat complexity and predation by fishes. J. Exp. Mar. Biol. Ecol. 174 (2), 243–260. doi: 10.1016/0022-0981(93)90020-O
McLean D. L., Birt M., Speed C., Case M., Colquhoun J., Galaiduk R., et al. (2021b). Marine communities of australia’s oil and gas infrastructure. Draft Rep. Rev. A Natl. Decommissioning Res. Initiat. RP1:Pro1., 133.
McLean D., Cure K., Abdul Wahab M. A., Galaiduk R., Birt M., Vaughan B., et al. (2021a). A comparison of marine communities along a subsea pipeline with those in surrounding seabed areas. Cont. Shelf Res. 219, 104394. doi: 10.1016/j.csr.2021.104394
McLean D., Langlois T. J., Bond T., Birt M. J., Bornt K. R., Collins D. L., et al. (2016). Distribution, abundance, diversity and habitat associations of fishes across a dynamic bioregion experiencing rapid coastal development. Estuar. Coast. Shelf Sci. 178, 36–47. doi: 10.1016/j.ecss.2016.05.026
McLean D. L., Partridge T. J. C., Bond T., Birt M. J., Bornt K. R., Langlois T. J. (2017). Using industry ROV videos to assess fish associations with subsea pipelines. Cont. Shelf Res. 141, 76–97. doi: 10.1016/j.csr.2017.05.006
McLean D. L., Taylor M. D., Giraldo Ospina A., Partridge J. C. (2019). An assessment of fish and marine growth associated with an oil and gas platform jacket using an augmented remotely operated vehicle. Cont. Shelf Res. 179, 66–84. doi: 10.1016/j.csr.2019.04.006
McLean D. L., Taylor M. D., Partridge J. C., Gibbons B., Langlois T. J., Malseed B. E., et al. (2018). Fish and habitats on wellhead infrastructure on the north west shelf of Western Australia. Cont. Shelf Res. 164, 10–27. doi: 10.1016/j.csr.2018.05.007
McLean D. L., Vaughan B. I., Malseed B. E., Taylor M. D. (2020). Fish-habitat associations on a subsea pipeline within an Australian marine park. Mar. Environ. Res. 153, 104813. doi: 10.1016/j.marenvres.2019.104813
Menge B. A., Sutherland J. P. (1976). Species diversity gradients: synthesis of the roles of predation, competition, and temporal heterogeneit. Am. Nat. 110 (973), 351–369. doi: 10.1086/283073
Mertz G., Myers R. A. (1998). A simplified formulation for fish production. Canadian Journal of Fisheries and Aquatic Sciences 55, 478–484.
Mintz J. D., Lipcius R. N., Eggleston D. B., Seebo M. S. (1994). Survival of juvenile Caribbean spiny lobster: effects of shelter size, geographic location and conspecific abundance. Mar. Ecol. Prog. Ser. 112, 255–266. doi: 10.3354/meps112255
Munnelly R. T., Reeves D. B., Chesney E. J., Baltz D. M. (2021). Spatial and temporal influences of nearshore hydrography on fish assemblages associated with energy platforms in the northern Gulf of Mexico. Estuaries and Coasts 44, 269–285.
Newman S. J. (1995). Spatial variability in the distribution, abundance, growth, mortality and age structures of tropical snappers (Pisces: Lutjanidae) in the central great barrier reef, Australia (Townsville: James Cook University of North Queensland), 325.
Newman S. J., Cappo M., Williams D. M. B. (2000). Age, growthand mortality of the stripey, Lutjanus carponotatus (Richardson), and the brown-stripe snapper, L. vitta (Quoy andGaimard), from the central Great Barrier Reef, Australia. Fish. Res. 48, 263–275. doi: 10.1016/S0165-7836(00)00184-3
Newman S. J. (2002a). Growth rate, age determination, natural mortality and production potential of the scarlet seaperch, lutjanus malabaricus Schneider 1801, off the pilbara coast of north-Western Australia. Fish. Res. 58, 215–225. doi: 10.1016/S0165-7836(01)00367-8
Newman S. J. (2002b). Growth, age estimating and preliminary estimates of longevity and mortality in the Moses perch, Lutjanus russellii (Indian ocean form), from continental shelf waters off north-Western Australia. Asian Fish. Sci. 15, 283–294. doi: 10.33997/j.afs.2002.15.3.009
Newman S., Wakefield C., Skepper C., Boddington D., Steele A. (2020). “North coast demersal resource status report 2020,” in Status reports of the fisheries and aquatic resources of Western Australia 2019/20: The state of the fisheries. Eds. Gaughan D. J., Santoro K. (Western Australia: Department of Primary Industries and Regional Development), 156–165.
O’Hara R. B., Kotze D. J. (2010). Do not log-transform count data. Methods Ecol. Evol. 1, 118–122. doi: 10.1111/j.2041-210X.2010.00021.x
Oil and Gas UK (2016) Decommissioning insight report. Available at: https://cld.bz/bookdata/jb05Hxr/basic-html/page-4.html.
Patterson H., Bromhead D., Galeano D., Larcombe J., Woodhams J., Curtotti R. (2021). Fishery status reports 2021, Australian bureau of agricultural and resource economics and sciences, Canberra. doi: 10.25814/vahf-ng93
Paul L. J., Horn P. L. (2009). Age and growth of sea perch (Helicolenus percoides) from two adjacent areas off the east coast of south island, new Zealand. Fish. Res. 95, 169–180. doi: 10.1016/J.FISHRES.2008.08.011
Pember M. B., Newman S. J., Hesp S. A., Young G. C., Skepper C. L., Hall N. G., et al. (2005). “Biological parameters for managing the fisheries for blue and king threadfins, estuary rockcod, malabar grouper and mangrove jack in north-western Australia,” in Final report to the fisheries research and development corporation (Murdoch, Western Australia, Australia: Centre for Fish and Fisheries Research, Murdoch University), PIddic172.
Piddocke T. P., Butler G. L., Butcher P. A., Stewart J., Bucher D. J., Christidis L. (2015). Age and growth of mangrove red snapper Lutjanus argentimaculatus at its cool-water-range limits. J. Fish Biol. 86, 1587–1600. doi: 10.1111/jfb.12665
Pradella N., Fowler A. M., Booth D. J., Macreadie P. I. (2014). Fish assemblages associated with oil industry structures on the continental shelf of north-western Australia. J. Fish Biol. 84, 247–255. doi: 10.1111/jfb.12274
R Development Core Team (2019). R: A Language and Environment for Statistical Computing. R Foundation for Statistical Computing, Vienna, Austria.
Randall R. G., Minns C. K. (2000). Use of fish production per unit biomass ratios for measuring the productive capacity of fish habitats. Can. J. Fish. Aquat. Sci. 57, 1657–1667. doi: 10.1139/f00-103
Redford M., Rouse S., Hayes P., Wilding T. A. (2021). Benthic and fish interactions with pipeline protective structures in the north Sea. Front. Mar. Sci. 8, 417. doi: 10.3389/fmars.2021.652630
Rouse S., Hayes P., Wilding T. A. (2020). Commercial fisheries losses arising from interactions with offshore pipelines and other oil and gas infrastructure and activities. ICES J. Mar. Sci. 77 (3), 1148–1156. doi: 10.1093/icesjms/fsy116
Rouse S., Kafas A., Hayes P., Wilding T. A. (2018). Offshore pipeline decommissioning: scale and context. Mar. pollut. Bull. 129, 241–244. doi: 10.1016/j.marpolbul.2018.02.041
Rouse S., Lacey N. C., Hayes P., Wilding T. A. (2019). Benthic conservation features and species associated with subsea pipelines: considerations for decommissioning. Front. Mar. Sci. 6. doi: 10.3389/fmars.2019.00200
Russell D. J., McDougall A. J. (2008). Reproductive biology of mangrove jack (Lutjanus argentimaculatus) in northeastern Queensland, Australia. New Z. Mar. Freshw. Res. 42, 219–232. doi: 10.1080/00288330809509950
Schramm K. D., Marnane M. J., Elsdon T. S., Jones C. M., Saunders B. J., Newman S. J., et al. (2021). Fish associations with shallow water subsea pipelines compared to surrounding reef and soft sediment habitats. Sci. Rep. 11, 6238. doi: 10.1038/s41598-021-85396-y
SeaGIS (2020a). TransectMeasure (Bacchus Marsh: SeaGIS Pty Ltd). Available at: http://www.seaGIS.com.au.
SeaGIS (2020b). EventMeasure (Stereo) (version 5.22) (Bacchus Marsh: SeaGIS Pty Ltd). Available at: http://www.seaGIS.com.au.
Seiler J., Williams A., Barrett N. (2012). Assessing size, abundance and habitat preferences of the ocean perch Helicolenus percoides using an AUV-borne stereo camera system. Fish. Res. 129, 64–72. doi: 10.1016/j.fishres.2012.06.011
Simonsen K. A. (2013). Reef fish demographics on Louisiana artificial reefs: the effects of reef size on biomass distribution and foraging dynamics (Louisiana State University: Dissertation).
Smith J. A., Lowr M. B., Champion C., Suthers I. M. (2016). A designed artificial reef is among the most productive marine fish habitats: new metrics to address ‘production versus attraction’. Mar. Biol. 163, 188. doi: 10.1007/s00227-016-2967-y
Szedlmayer S. T., Shipp R. L. (1994). Movement and growth of red snapper, Lutjanus campechanus, from an artificial reef area in the northeastern gulf of Mexico. Bull. Mar. Sci. 55, 887–896.
Symonds M. R. E., Moussalli A.. (2011). A brief guide to model selection, multimodel inference and model averaging in behavioural ecology using Akaike’s information criterion. Behavioral Ecology and Sociobiology 65 (1), 13–21. doi: 10.1007/s00265-010-1037-6
Todd V. L. G., Lazar L., Williamson L. D., Peters I. T., Hoover A. L., Cox S. E., et al. (2020). Underwater visual records of marine megafauna around offshore anthropogenic structures. Front. Mar. Sci. 7, 230. doi: 10.3389/fmars.2020.00230
Tweedie M. (1984). “An index which distinguishes between some important exponential families,” in In ‘Statistics: Applications and new directions: Proc. Indian statistical institute golden jubilee international conference’, pp. 579–604.
Wickham H. (2016). ggplot2: Elegant graphics for data analysis (New York, NY, Springer). doi: 10.1007/978-0-387-98141-3
Wilhelmsson D., Malm T., Öhman M. C. (2006). The influence of offshore windpower on demersal fish. ICES J. Mar. Sci. 63, 775–784. doi: 10.1016/j.icesjms.2006.02.001
Williams A., Bax N. (2001). Delineating fish-habitat associations for spatially-based management: an example from the south-eastern Australian continental shelf. Mar. Freshw. Res. Mar. Freshw. Res. 52 (4), 513–536. doi: 10.1071/MF00017
Keywords: fisheries, oil and gas infrastructure, fish production, subsea pipeline, subsea well, decommissioning
Citation: McLean D, Speed CW, Birt MJ, Colquhoun J, Case M, Stowar M, Bond T, Ierodiaconou D, Whitmarsh SK, Taylor MD, Wines S, Booth DJ, Fowler AM and Vaughan BI (2022) Habitat value of subsea wells and pipelines for fishery target species in Australia. Front. Mar. Sci. 9:960496. doi: 10.3389/fmars.2022.960496
Received: 03 June 2022; Accepted: 26 July 2022;
Published: 26 August 2022.
Edited by:
Andrew James Guerin, McMaster University, CanadaReviewed by:
Ilana Rosental Zalmon, State University of the North Fluminense Darcy Ribeiro, BrazilJames Smith, University of California, Santa Cruz, United States
Copyright © 2022 McLean, Speed, Birt, Colquhoun, Case, Stowar, Bond, Ierodiaconou, Whitmarsh, Taylor, Wines, Booth, Fowler and Vaughan. This is an open-access article distributed under the terms of the Creative Commons Attribution License (CC BY). The use, distribution or reproduction in other forums is permitted, provided the original author(s) and the copyright owner(s) are credited and that the original publication in this journal is cited, in accordance with accepted academic practice. No use, distribution or reproduction is permitted which does not comply with these terms.
*Correspondence: Dianne McLean, ZC5tY2xlYW5AYWltcy5nb3YuYXU=
 Dianne McLean
 Conrad W. Speed
 Matthew Jon Birt
 Jamie Colquhoun1
 Marcus Stowar
 Todd Bond
 Daniel Ierodiaconou
 Sasha K. Whitmarsh
 Michael D. Taylor
 Sam Wines
 David John Booth
 Ashley M. Fowler