 Philippe Gaspar
 Tony Candela
 George L. Shillinger
94% of researchers rate our articles as excellent or good
Learn more about the work of our research integrity team to safeguard the quality of each article we publish.
Find out more
ORIGINAL RESEARCH article
Front. Mar. Sci., 18 October 2022
Sec. Marine Megafauna
Volume 9 - 2022 | https://doi.org/10.3389/fmars.2022.959366
The Northwest Atlantic (NWA) leatherback turtle (Dermochelys coriacea) subpopulation was recently classified as endangered. It nests in the Wider Caribbean Region and includes five genetic stocks, all declining, albeit at different rates. The causes of decline are multiple and difficult to identify based on annual nest counts which integrate the effects of multiple stressors over the entire life history. Demographic models, however, show that survival during the juvenile pelagic stage is the main factor modulating population trends, but this life stage remains largely unobserved. This paper presents a suite of numerical simulations where juveniles from the five NWA stocks disperse under the combined effects of ocean currents and habitat-driven swimming movements. Simulations reveal when and where NWA juveniles likely disperse and, thus, the environmental conditions and anthropogenic threats they may encounter. Simulated individuals initially disperse following either the “Caribbean route,” inside the Caribbean Sea and the Gulf of Mexico (GoM), or the “Atlantic route” east of the Antilles Islands Arc. The percentage of individuals following one or the other route varies markedly with the stock of origin. Late dispersal in the eastern Atlantic Ocean and the Mediterranean Sea is similar in all stocks. Juveniles following the Caribbean route are rapidly entrained northwards by the Gulf Stream and incur a high risk of cold-induced mortality. This mostly affects the Florida stock and the Western Caribbean (WCA) stock nesting in Costa Rica, Panama, and Colombia. The Atlantic route is less lethal as individuals progress more slowly toward higher latitudes. Simulations also show that the percentage of WCA juveniles visiting the GoM is larger than for any other stock. The learned migration goal (LMG) hypothesis, which posits that adult sea turtles tend to exploit foraging areas previously identified at the juvenile stage, may thus explain why WCA adults are overrepresented in the GoM. Finally, our results suggest that the recently observed increase in the percentage of WCA adults migrating into the GoM could be linked to bycatch reduction measures implemented in 2003–2004, combined with an increase in the frequency of Loop Current intrusion and eddy-shedding events that started around the year 2000.
To effectively manage and protect a species, knowledge of its spatial distribution through all life stages is essential. Key habitats and areas where anthropogenic threats are most likely must be identified to allow the development of adequate conservation strategies. Acquiring such knowledge for highly migratory marine species is a major challenge (Block, 2005) as observations are especially difficult to obtain in the open ocean. The advent of satellite telemetry has recently transformed the field and provided invaluable information on the migration routes and foraging habitats of large marine vertebrates in general (Block et al., 2011) and of sea turtles in particular (Godley et al., 2008). However, the use of this technology is limited to relatively large individuals, so data concerning juvenile life stages remain scarce (Hazen et al., 2012).
In sea turtles, observation efforts are widespread on nesting beaches to count and monitor nesting females and nests, from egg laying until hatching (Schroeder and Murphy, 1999), but hatchlings become enigmatic from the moment they crawl into the sea until they reappear, several years later, as large juveniles in neritic foraging areas or as adults on nesting beaches. These larger individuals are then more easily satellite-tracked and data concerning the later life stages are more abundant (Godley et al., 2008). The lack of information concerning the sea turtles’ juvenile pelagic phase seriously impedes the development of properly targeted management and conservation measures and effective population monitoring tools. Determining where juveniles disperse and what environmental conditions they encounter is required not only to define where protection measures must be established but also to help understand population variations. These variations are essentially derived from annual nest counts, a major but tricky abundance index (National Research Council U.S. et al., 2010; Piacenza et al., 2019). Nest counts reflect the population size modulated by several factors, including clutch frequency, remigration interval, sex ratio, and age at sexual maturity. These factors themselves largely depend on oceanic conditions, particularly ocean temperature and productivity (Hays, 2000; Heppell et al., 2003; Saba et al., 2008). In addition, problems affecting hatchling or juvenile survival have a delayed effect on nest counts, the delay being itself modulated by variations of the age at sexual maturity. Although indispensable, monitoring of nesting activity alone is thus insufficient for diagnosing sea turtle population health. It must be accompanied by complementary efforts to understand and estimate how environmental conditions and anthropogenic pressures concertedly impact demographic parameters at all life stages (National Research Council (U.S.) et al., 2010), with survival during the pelagic juvenile stage being particularly important (Spotila et al., 1996; Mazaris et al., 2006). As noted, the pelagic juvenile stage is the least observed and, hence, the least understood, which is part of sea turtle life history. This is especially true for leatherback turtles (Dermochelys coriacea) whose juveniles are especially cryptic and whose offspring are very difficult to rear in captivity, to sizes that allow for satellite tracking (Jones et al., 2000).
In an attempt to reduce this knowledge gap, we embark here on an investigation of the open ocean dispersal of hatchlings and then juveniles of the emblematic Northwest Atlantic (NWA) leatherback turtle subpopulation. Less than 10 years ago, this subpopulation was still considered robust and healthy, accordingly classified as “Least Concern” in the IUCN Red List of Threatened Species (Tiwari et al., 2013). A re-examination of previous abundance estimates during 2018 revealed that its annual nest count had decreased by 60% in three generations (Northwest Atlantic Leatherback Working Group, 2018). These findings led to the reclassification of this subpopulation as “Endangered” (Northwest Atlantic Leatherback Working Group, 2019). Shortly after, the NWA leatherback subpopulation was declared at high risk of extinction, with an expected 50% reduction in nester abundance in less than one generation (National Marine Fisheries Service and U.S. Fish and Wildlife Service, 2020).
This subpopulation includes five distinct genetic stocks (Dutton et al., 2013). All of them nest in the Wider Caribbean Region (WCR), along the coasts of Guianas (GUI stock); in Trinidad and Tobago (TRI stock); throughout coastal Honduras, Costa Rica, Panama, and Colombia in the southwestern Caribbean Sea (WCA stock); in Saint Croix, Puerto Rico, and neighboring islands along the northeastern edge of the Caribbean Sea (NCA stock); and in Florida (FLA stock) (Figure 1). Demographic data show that the decline of the entire subpopulation has been primarily driven by the decline of the GUI stock, once one of the world’s largest. This decline itself is largely attributable to the collapse of the Awala-Yalimapo nesting site (from above 28,000 nests/year in the late 1980s down to less than 600 nests/year between 2013 and 2017) (Northwest Atlantic Leatherback Working Group, 2019). With over 22,000 nests/year, the TRI stock is now the largest remaining in the NWA, followed by the WCA stock (about 6,000 nests per year). These two stocks are also declining, although more slowly. The smaller NCA and FLA stocks, both close to 1,000 nests/year, have been stable (NCA) or increasing (FLA), but both are now declining (Northwest Atlantic Leatherback Working Group, 2018; National Marine Fisheries Service and U.S. Fish and Wildlife Service, 2020). Recent population variations are thus negative in all five stocks, although the magnitude and timing of the decrease differ between stocks.
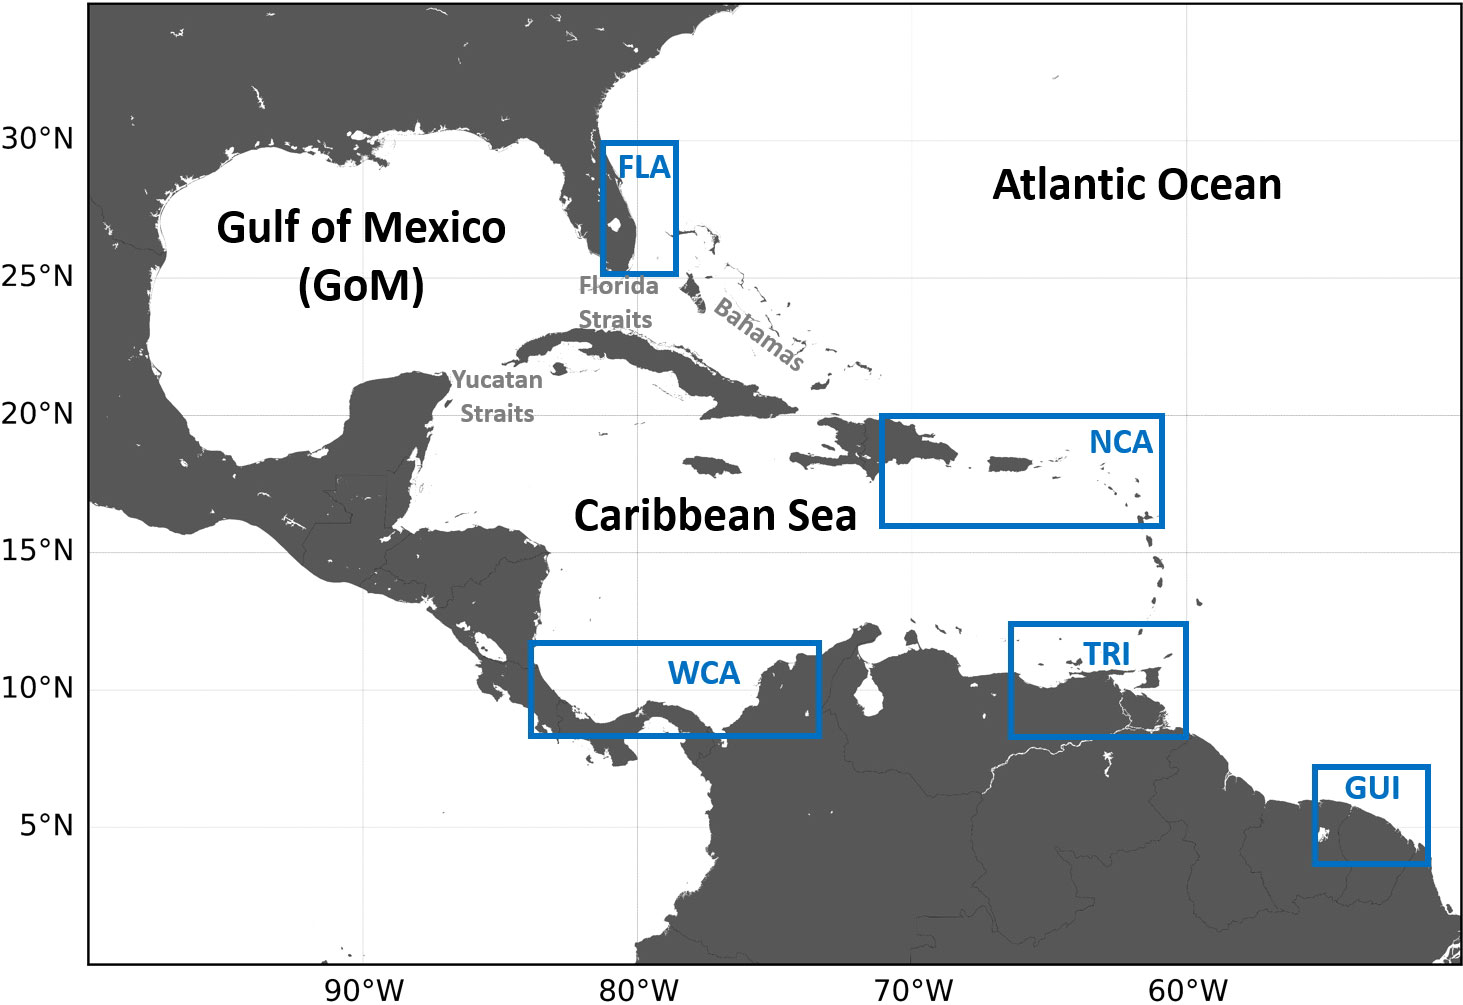
Figure 1 Map of the Wider Caribbean Region (WCR) showing the nesting areas (blue rectangles) of the five genetic stocks of the NWA leatherback subpopulation.
As with other leatherback populations, direct observations of NWA juveniles are largely missing. In the absence of such data, the most detailed information so far concerning the life history and spatial dispersal of juvenile NWA leatherbacks is derived from the numerical modeling work of Lalire and Gaspar (2019) who studied the dispersal of GUI juveniles using the Sea Turtle Active Movement Model (STAMM), an individual-based model simulating the active dispersal of juvenile sea turtles under the combined effects of oceanic currents and habitat-driven swimming movements (Gaspar and Lalire, 2017). Although the validation of such dispersal simulations remains difficult given the scarcity of juvenile sea turtle observations at sea, Lalire and Gaspar (2019) were able to show that the active dispersal scenario they simulated for GUI juveniles was spatially and temporally consistent with juvenile leatherback bycatch and stranding data, gathered along the Atlantic and Mediterranean coasts of Europe and North Africa.
The work of Lalire and Gaspar (2019) is continued here as we extend the investigation to all five NWA stocks. Through STAMM, we investigate how the departure of hatchlings from different nesting areas affects their dispersal patterns which in turn subject juveniles to different environmental conditions and thus different survival likelihoods.
We also explore ways to further validate model results using the now widely accepted learned migration goal (LMG) hypothesis (Hays et al., 2010; Gaspar et al., 2012; Scott et al., 2014). This hypothesis states that adult sea turtles tend to exploit favorable foraging areas that they discovered during their juvenile stages. The comparison of simulated juvenile dispersal patterns with observed adult migration areas can thus provide additional confidence in model results. Such comparisons however must be done with great care as juvenile dispersal is not the only factor influencing adult distribution. In this paper, we provide a mathematical formalization of the LMG hypothesis and use it to show that juvenile dispersal patterns simulated by STAMM can, to a large extent, explain a) why adults of the different NWA stocks are present in widely different proportions in the Gulf of Mexico (GoM) (Stewart et al., 2016) and b) why the fraction of adults migrating from the WCA nesting beaches into the GoM has been increasing during the last decade (Evans et al., 2021). The GoM is a region where the risk of interactions with human activities is especially high (e.g., Valverde and Holzwart, 2017). An improved understanding of juvenile and adult leatherback distribution within this region will inform the management and conservation of the NWA subpopulation.
STAMM (Gaspar and Lalire, 2017) is an individual-based model simulating the active dispersal of juvenile sea turtles under the combined effects of oceanic currents and habitat-driven swimming movements triggered by the need to find food and suitable water temperatures. Habitat suitability is thus defined in this model as the product of a thermal habitat index and a feeding habitat index. The first one depends on the thermal preferendum of the simulated individuals and the second one is proportional to the local prey density (or a proxy of it) divided by the individual rate of food consumption. Both the thermal preferendum and the rate of food consumption are a function of the age and species of the simulated individuals. Habitat-driven swimming movements are then modeled using the simple biased random-walk model of Faugeras and Maury (2007). Modeled movements have the following characteristics:
1. In the absence of any clear gradient of the habitat suitability index, the simulated movement is close to a random walk.
2. The movement becomes more directed as the habitat gradient increases and leads individuals toward more favorable habitats.
3. The movement speed is a function of the size of the simulated individual and decreases with habitat suitability so that individuals move rapidly through poor habitats and slow down in favorable areas.
The generic formulation of STAMM, usable with any sea turtle species, was developed by Gaspar and Lalire (2017). These authors also proposed a first specific version of this model specifically calibrated for leatherback turtles. They used it to simulate the dispersal of juveniles from the western Pacific subpopulation. Lalire and Gaspar (2019) then slightly adapted this model version for use with juvenile NWA leatherbacks. The exact same model version is used here. The reader will find a complete description of both the generic version of STAMM and its specific leatherback version in Gaspar and Lalire (2017) and the details of its calibration for NWA leatherbacks in Lalire and Gaspar (2019).
STAMM also provides a diagnosis for cold-induced mortality (Gaspar and Lalire, 2017). It is simulated to occur when an individual remains for a period of P days or more in water temperatures below the critical value T1. In the case of leatherbacks, this critical temperature is given by:
where M is the turtle mass (in kg) and Tb is the minimum suitable body temperature. Following Gaspar and Lalire (2017), Tb is taken to be 24°C, P = 10 days, and M is computed as a function of the age of the simulated individual using the growth curve and mass–size relationship of Jones et al. (2011). Small individuals thus require relatively warm waters (close to 24°C), while larger individuals can tolerate temperatures of only a few degrees Celsius, as observed (James and Mrosovsky, 2004).
We use exactly the same model implementation as Lalire and Gaspar (2019) including parameter values, model integration procedure with a daily time step, integration period (18 years), and oceanic forcing (ocean currents, temperatures, and net primary production). Surface currents and temperatures are obtained from the GLORYS-1 reanalysis of the global ocean circulation (Ferry et al., 2010). This reanalysis has a horizontal resolution of 0.25° and covers a 7-year period (01 January 2002 to 31 December 2008). It assimilates satellite-derived sea level anomalies, sea surface temperatures, in-situ temperatures, and salinity measurements. It provides a close-to-reality estimation of the ocean circulation (R. B. Scott et al., 2012). The net primary production (NPP) for the modeled period is obtained from the Ocean Productivity website (http://sites.science.oregonstate.edu/ocean.productivity/) using the VGPM algorithm (Behrenfeld and Falkowski, 1997). Following Saba et al. (2008), NPP is used as a proxy for food abundance to compute the habitat suitability index. As the forcing data set only covers a 7-year-long period, the forcing fields are looped until the last released turtle reaches the age of 18. Simulations thus produce a series of 18-year-long trajectories, likely covering the entire juvenile life stage (Avens et al., 2020).
Each dispersal experiment involves 5,000 hatchlings released during a given year from a given nesting beach. As usual in this type of simulation (Hays et al., 2010; Putman et al., 2020), the effect of the swimming frenzy is simulated by releasing hatchlings some distance offshore of their nesting beach. Here, we follow the release procedure of Lalire and Gaspar (2019): hatchlings are uniformly distributed in a 0.25° × 0.25° square centered about 40 km off the corresponding nesting beach. The release period occurs 2 months (the incubation period) after the nesting period of each nesting beach. The number of releases per day follows a truncated normal distribution peaking in the middle of the emergence period.
Hatchlings born in the WCR first circulate in generally warm and sufficiently rich waters (given their initially modest food requirements). They thus display little habitat-driven swimming activity and drift, nearly passively, with ocean currents (Lalire and Gaspar, 2019). The WCR is situated on the western flank of the Atlantic subtropical gyre where currents flow broadly northwards (Figure 2) and progressively lead hatchlings, and then juveniles, toward higher latitudes. This progression can happen in two markedly different ways: either inside or outside the Caribbean Sea and the GoM (Lalire and Gaspar, 2019). We will refer to these two main pathways as the Caribbean and Atlantic routes, respectively (Figure 3).
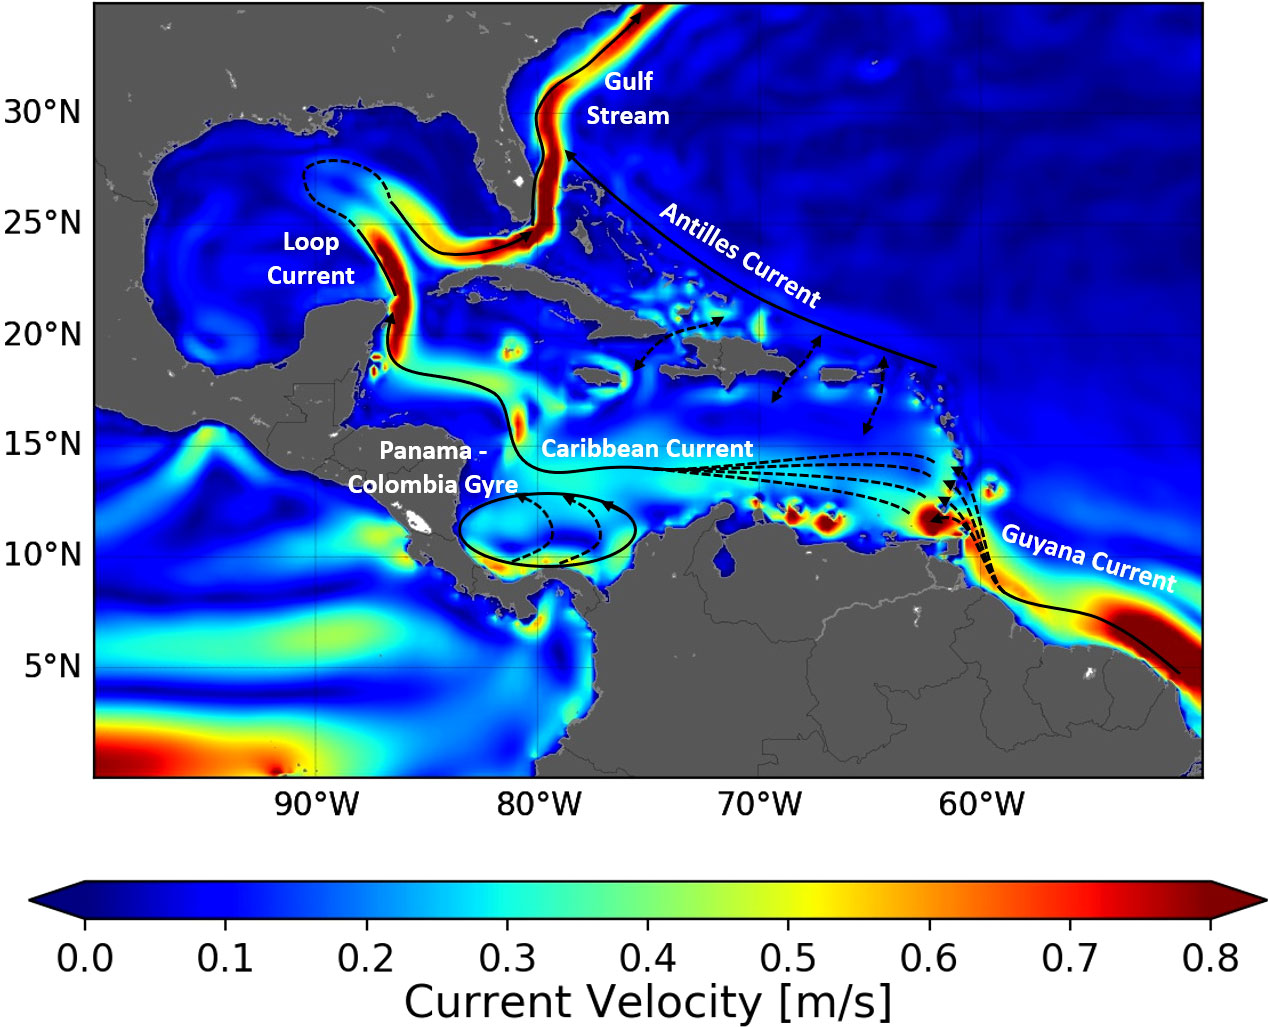
Figure 2 Schematic map of the surface circulation in the WCR. The colored background represents the current speed averaged over the whole GLORYS-1 ocean reanalysis period.
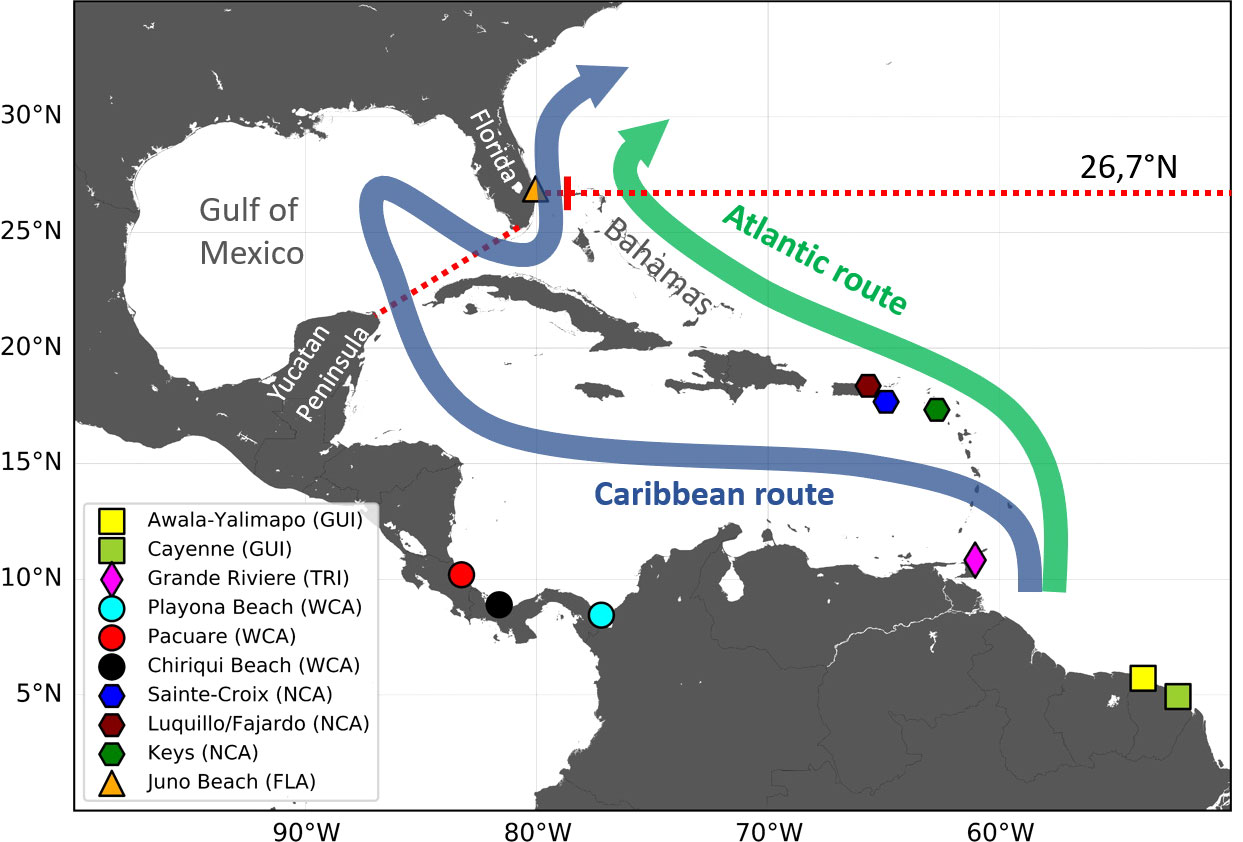
Figure 3 Schematic map of the Atlantic and Caribbean routes featuring all nesting beaches from which juvenile dispersal is simulated. The two dotted red lines are the 26.7°N parallel (used as the finish line of the Caribbean and Atlantic routes) and the Yucatan-to-Florida straight line [used to determine entrance into the Gulf of Mexico (GoM)].
Juveniles following the Atlantic route remain east of the Antilles Islands Arc and the Bahamas. They circulate northwards within the Antilles current or slightly inside the subtropical gyre. They then pass east of the Bahamas and keep circulating clockwise around the subtropical gyre, progressively veering east to initiate their crossing of the Atlantic Ocean toward Europe.
Juveniles following the Caribbean route circulate west of the Antilles Islands Arc. They enter the Caribbean Sea with the Caribbean current which they follow northwestwards toward the GoM. They then transit through the GoM with the Loop Current, entering through the Yucatan Straits and exiting through the Florida straits. They finally pass between Florida and the Bahamas where they are rapidly entrained further north by the Gulf Stream, after which they follow this mighty current, progressively veering east and then crossing the North Atlantic Ocean.
This simple two-pathway scheme is not as straightforward as it appears. The Antilles Islands Arc and the Bahamas form a porous border between the Caribbean Sea and the Atlantic Ocean. Multiple passages between islands allow turtles to switch between the Atlantic and the Caribbean route, although surface currents dictate the direction in which route changes are possible. Surface waters from the Atlantic enter the Caribbean Sea through the southernmost passages of the Leeward Islands (i.e., between Trinidad and Dominica Islands) and together form the Caribbean current (Stalcup and Metcalf, 1972) (Figure 2). Juvenile turtles can easily enter the Caribbean Sea through these passages but are likely challenged to exit it. Currents are weaker between the Windward Islands (i.e., between Dominica and Cuba) and can flow in or out of the Caribbean Sea. Two-way exchanges are thus possible between these islands. They are also possible through the Bahamas.
Another conspicuous circulation feature of the Caribbean Sea is the Panama–Colombia gyre (Figure 2). Circulation around this gyre is anticlockwise and of variable intensity (Torres and Tsimplis, 2012). It can create retention along the Caribbean route, as individuals entering this gyre can circulate multiple times around it, just like surface drifters do (Richardson, 2005).
The nesting areas of the five studied stocks are widely separated and exposed to different oceanic currents. Dispersal from the GUI, TRI, and FLA nesting areas is governed by strong permanent currents: the Guyana coastal current, the Caribbean current, and the Gulf Stream, respectively (Figure 2). Hatchlings emerging from these nesting areas disperse in a single direction: that of the locally dominant current. A single simulation from one representative nesting beach thus suffices to reveal the typical dispersal scenario associated with each of these three stocks. TRI hatchlings are released from the main nesting beach of Grande Rivière and FLA hatchlings from Juno beach (Figure 3). GUI hatchlings are simultaneously released from the Cayenne (n = 2,500) and Awala-Yalimapo (n = 2,500) as the Lalire and Gaspar (2019) model configuration is reused to minimize software adaptation work.
Currents influencing dispersal from the WCA and NCA nesting beaches are more variable and can induce a wider range of dispersal patterns. The WCA nesting beaches are under the direct influence of the Panama–Colombia gyre which is particularly variable in its eastern extent (Richardson, 2005). To evaluate the impact of this variability, we simulated the dispersal from three nesting beaches (Pacuare, Chiriqui, and Playona) situated along, respectively, the western, central, and eastern parts of the gyre (Figure 3). Currents between the northern Caribbean islands also display marked spatial and temporal variability. We therefore simulated the dispersal from three nesting beaches situated on different islands and with differing orientations, facing either East (the Atlantic Ocean) or West (the Caribbean Sea). All selected nesting sites are shown in Figure 3 and their characteristics are detailed in Table 1.
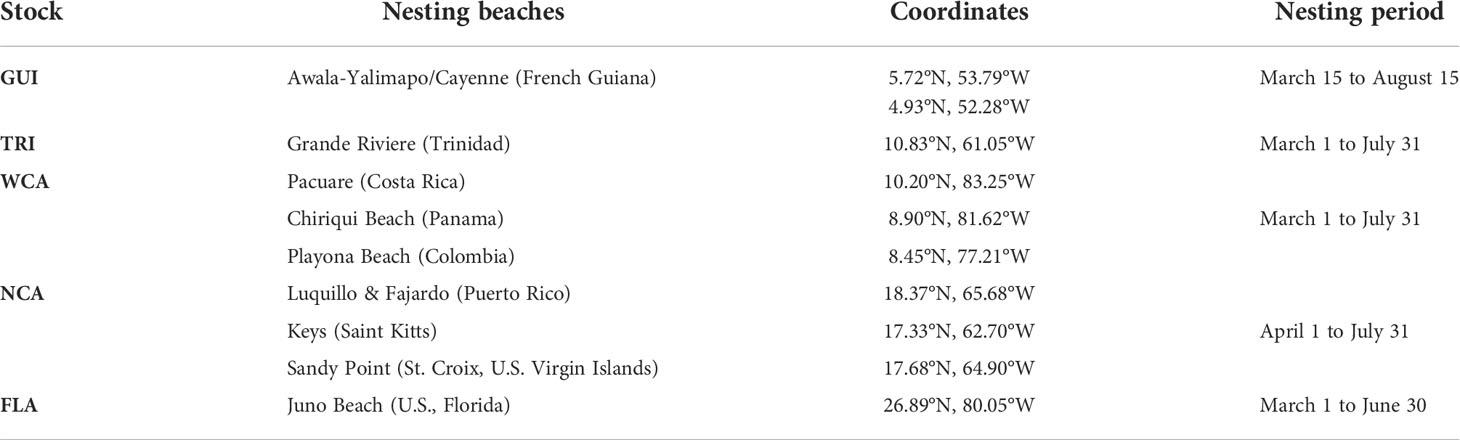
Table 1 Nesting sites used for dispersal simulations.
To ensure that the results are not specific to a single departure year, we performed five dispersal experiments for each nesting site, releasing hatchlings successively in 2002, 2003, 2004, 2005, and 2006. Each of these simulations covers 18 years but starts on a different year allowing dispersal to be affected by different initial oceanic conditions. A total of 45 dispersal experiments (5 departure years × 9 release sites) were performed.
Usage of either the Atlantic or the Caribbean route has major implications on life history, spatial dispersal, and ultimately the survival of the juveniles. The percentage of individuals following a particular route largely depends on the location of the natal area and, therefore, the stock of origin. However, quantifying these percentages for each stock is not obvious. Indeed, individuals from different stocks emerge at different points along the Atlantic or Caribbean route and can switch their routes through various passages between the Caribbean Islands. Under such circumstances, a simple and useful way to estimate these percentages is to count individuals “on the finish line,” that is just before the Caribbean and Atlantic routes converge, north of the Bahamas. We set the finish line along the 26.7°N parallel, which runs through the West End (at the western tip of Grand Bahama) and West Palm Beach (Florida) (Figure 3). An individual is counted in the “main Caribbean group” if it crosses this parallel between Florida and Grand Bahama and in the “main Atlantic group” if it crosses this same parallel anywhere east of Grand Bahama. As the release area of the FLA hatchlings straddles the 26.7°N parallel between Florida and Grand Bahama, all FLA hatchlings are counted as part of the main Caribbean group.
Interestingly, this count reveals that a few simulated individuals never cross the 26.7°N parallel east of Florida. These individuals belong to two secondary dispersal groups: one linked to the main Caribbean group and the other to the main Atlantic group. The first group is comprised of individuals that initially follow the Caribbean route into the GoM but then remain there until the end of the simulation (or until they suffer cold-induced mortality). The second group is comprised of individuals that follow the Atlantic route but along unusual trajectories that keep them at low latitudes (<26.7°N). All simulated juveniles are thus classified into four groups in accordance with their initial dispersal pathway: two Caribbean dispersal groups (the main one and the GoM group) and two Atlantic dispersal groups (the main one and the low-latitude group).
Simulated dispersal patterns are commonly visualized by plotting the daily positions of all individuals from their release date until the end of the simulation or, the case being, until cold-induced mortality occurs. Dispersal patterns of the different stocks are compared here using a normalized version of such maps in which we plot the same fixed number (n = 5 million) of randomly selected simulated positions. This is done to avoid visual differences in plotted position densities between stocks for which markedly different numbers of simulated daily positions were available due to variations in cold-induced mortality and/or variations in the number of simulated nesting beaches (from 1 to 3 according to the stock).
Simulated large-scale dispersal patterns of the different stocks (Figure 4) are strikingly similar in the western Atlantic basin (east of 40°W) and the Mediterranean Sea but differ markedly in the WCR. For example, nearly all simulated WCA juveniles initially disperse within the Caribbean Sea and the GoM, while most NCA juveniles disperse into the Atlantic.
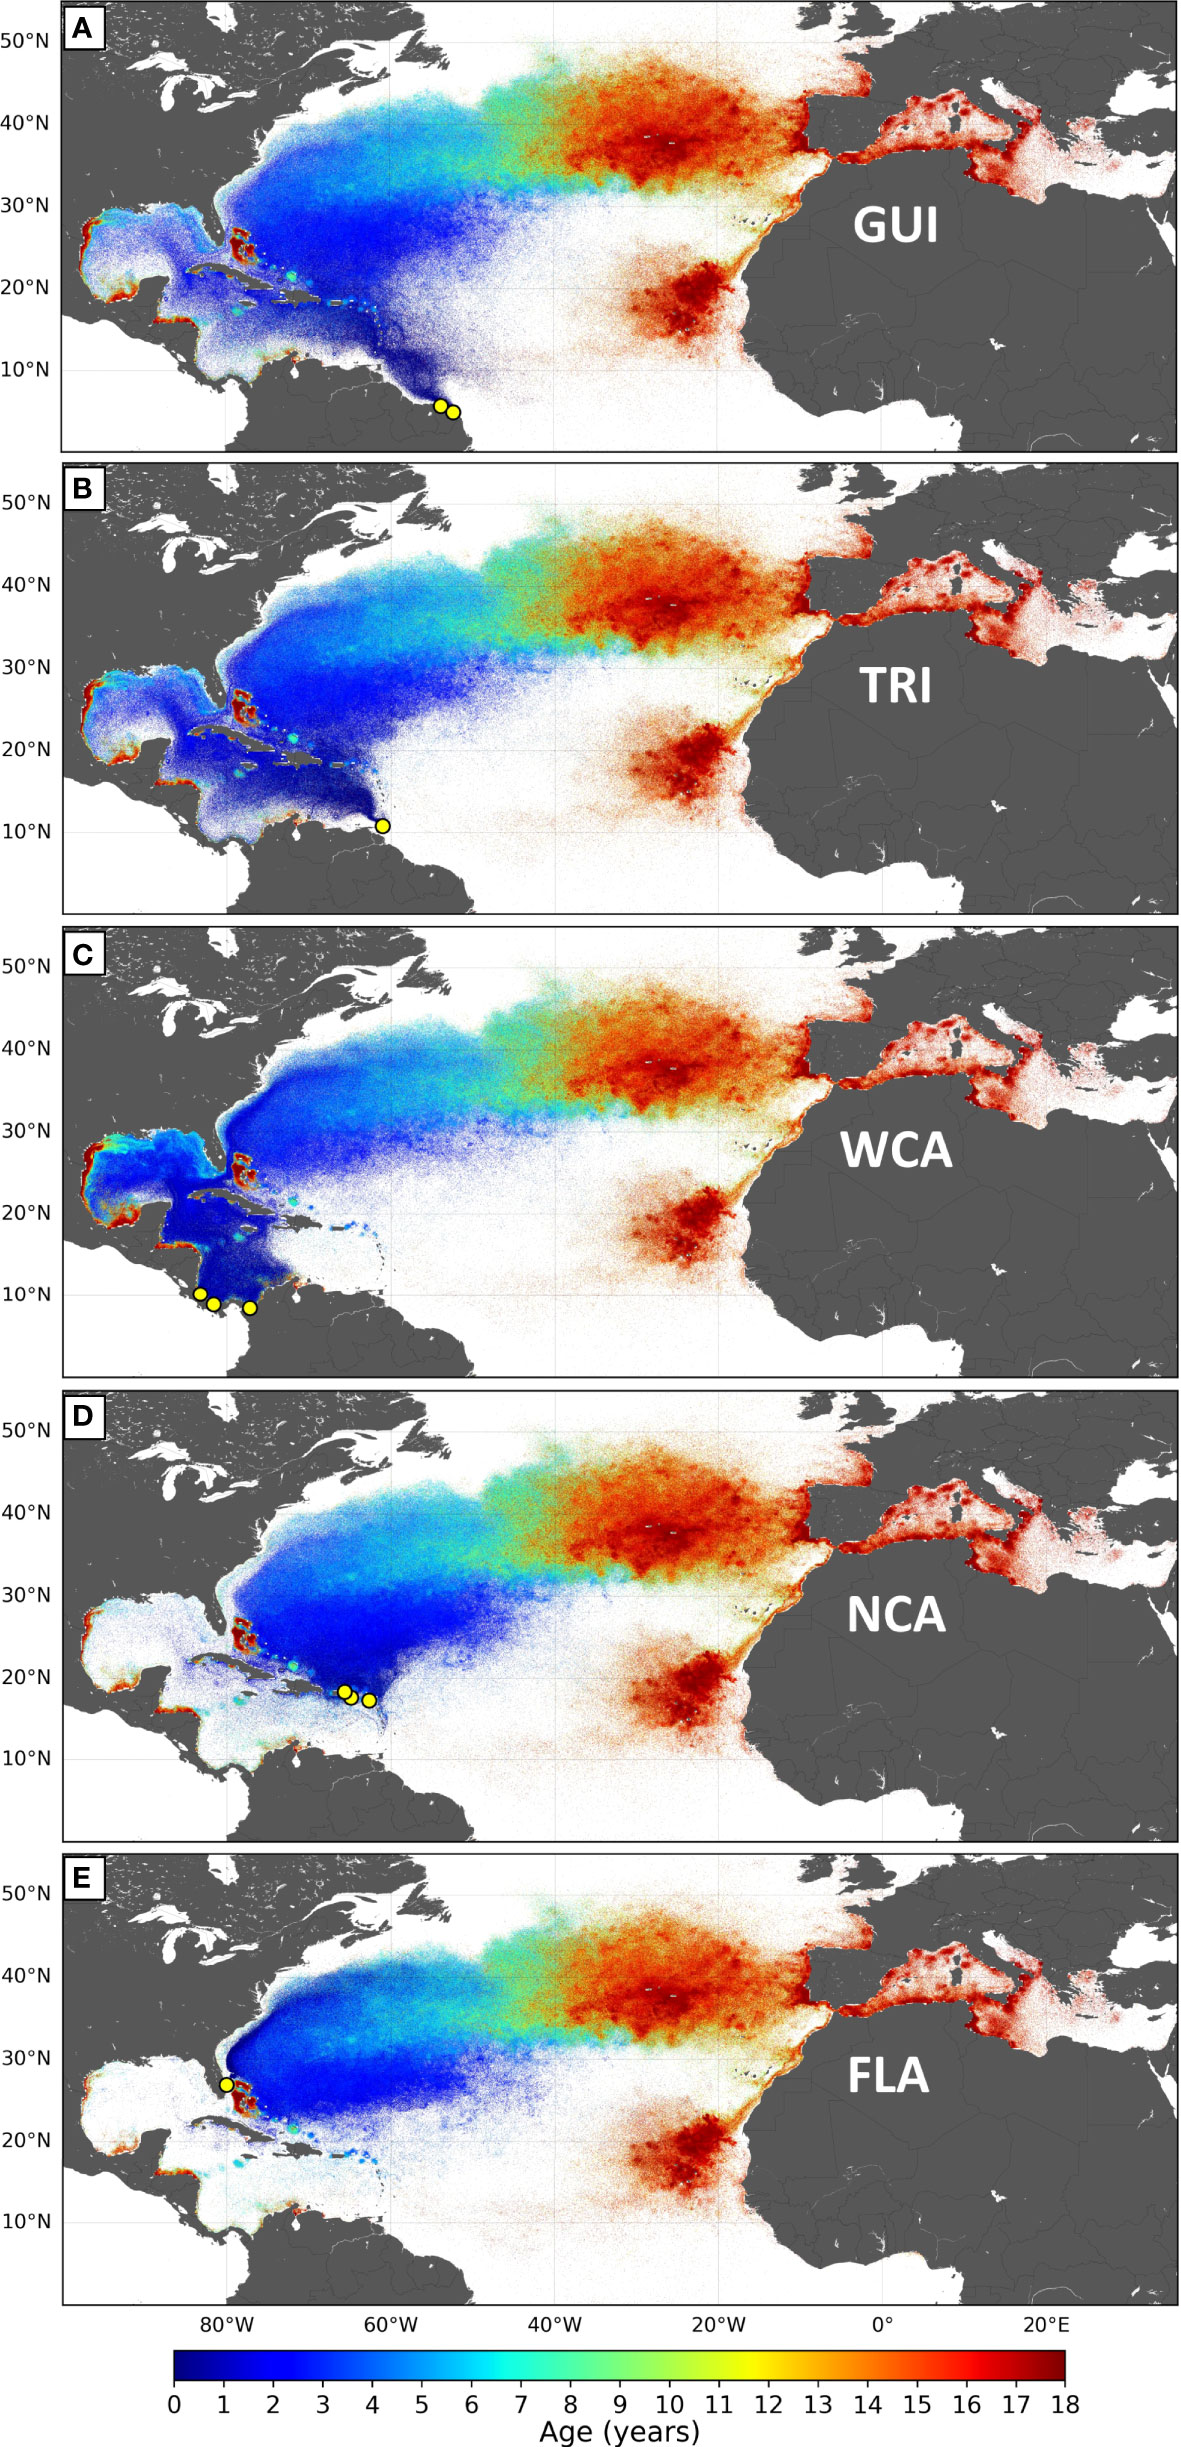
Figure 4 (A–E) Normalized maps of the dispersal patterns simulated for the five stocks of the NWA leatherback subpopulation. Each map contains 5 million positions, the color of which varies with the age of the simulated individuals.
In accordance with the initial dispersal patterns, the percentage of individuals belonging to each of the four dispersal groups varies markedly as a function of the stock of origin (Table 2). All the FLA hatchlings and most (>95%) of the WCA individuals belong to the main Caribbean or the GoM dispersal groups. Most (>92%) of the NCA individuals belong to the Atlantic dispersal groups. Individuals from the GUI and TRI stocks make a more balanced use of the Atlantic and Caribbean dispersal schemes. In all stocks, the two secondary dispersal patterns are much less used than the two main ones.
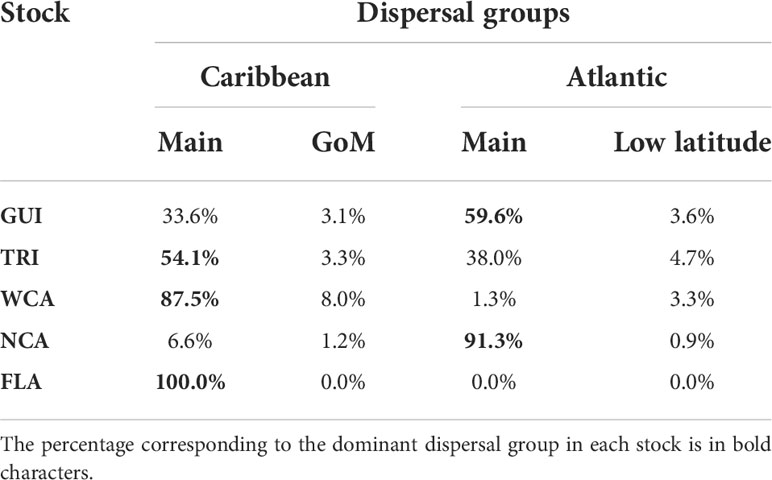
Table 2 Distribution of the simulated individuals in the four dispersal groups as a function of the stock of origin.
The percentages featured in Table 2 are computed using all simulations performed for each stock (e.g., all simulated departure years and all simulated nesting beaches), but the percentages were also computed separately for each simulated nesting beach and departure year. On a given year, percentages appear to vary little (<5%) between the different simulated nesting beaches of the WCA and NCA stocks. This indicates that large-scale dispersal patterns are only weakly affected by small-scale current variability in the immediate vicinity of these nesting beaches. Interannual variations are similarly weak for all stocks but TRI. In this stock, the percentage of individuals following either the Caribbean or the Atlantic route varies by up to 20% from one departure year to the other.
Simulated individuals are diagnosed to enter, and then exit, the GoM when they cross the line joining the northeastern tip of the Yucatan Peninsula to the southwestern tip of Florida (Figure 3). The simulated median residence time in the GoM is rather short (close to 20 days) for all stocks. The distribution of the residence times is, however, long-tailed as some individuals (those of the GoM dispersal group) remain in the GoM until the end of the simulation.
Unlike the residence time, the percentages of individuals entering the GoM vary widely as a function of the stock of origin (Table 3). As expected, these percentages are very close (within 1%) to the summed percentages of individuals belonging to the two Caribbean dispersal groups (Table 2), with the obvious exception of the FLA stock.
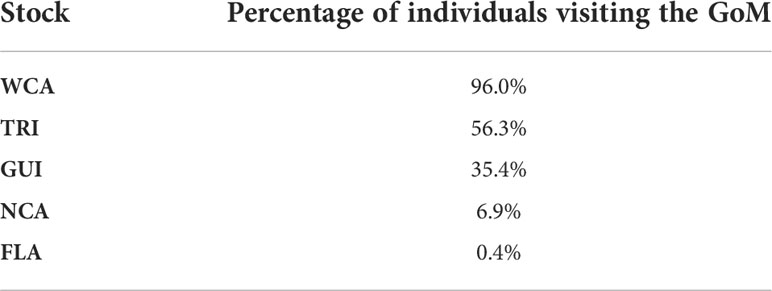
Table 3 Percentages of individuals visiting the GoM in each stock.
Cold-induced mortality (Figure 5) is diagnosed to occur mostly during the first winter at sea in the FLA and WCA stocks. At the end of that winter, the cumulated cold-induced mortality rate reaches as much as 81.6% in the FLA stock and 45% in the WCA stock. In the three other stocks, cold-induced mortality is essentially observed during the second winter at sea. It becomes very small in all stocks following the second winter.
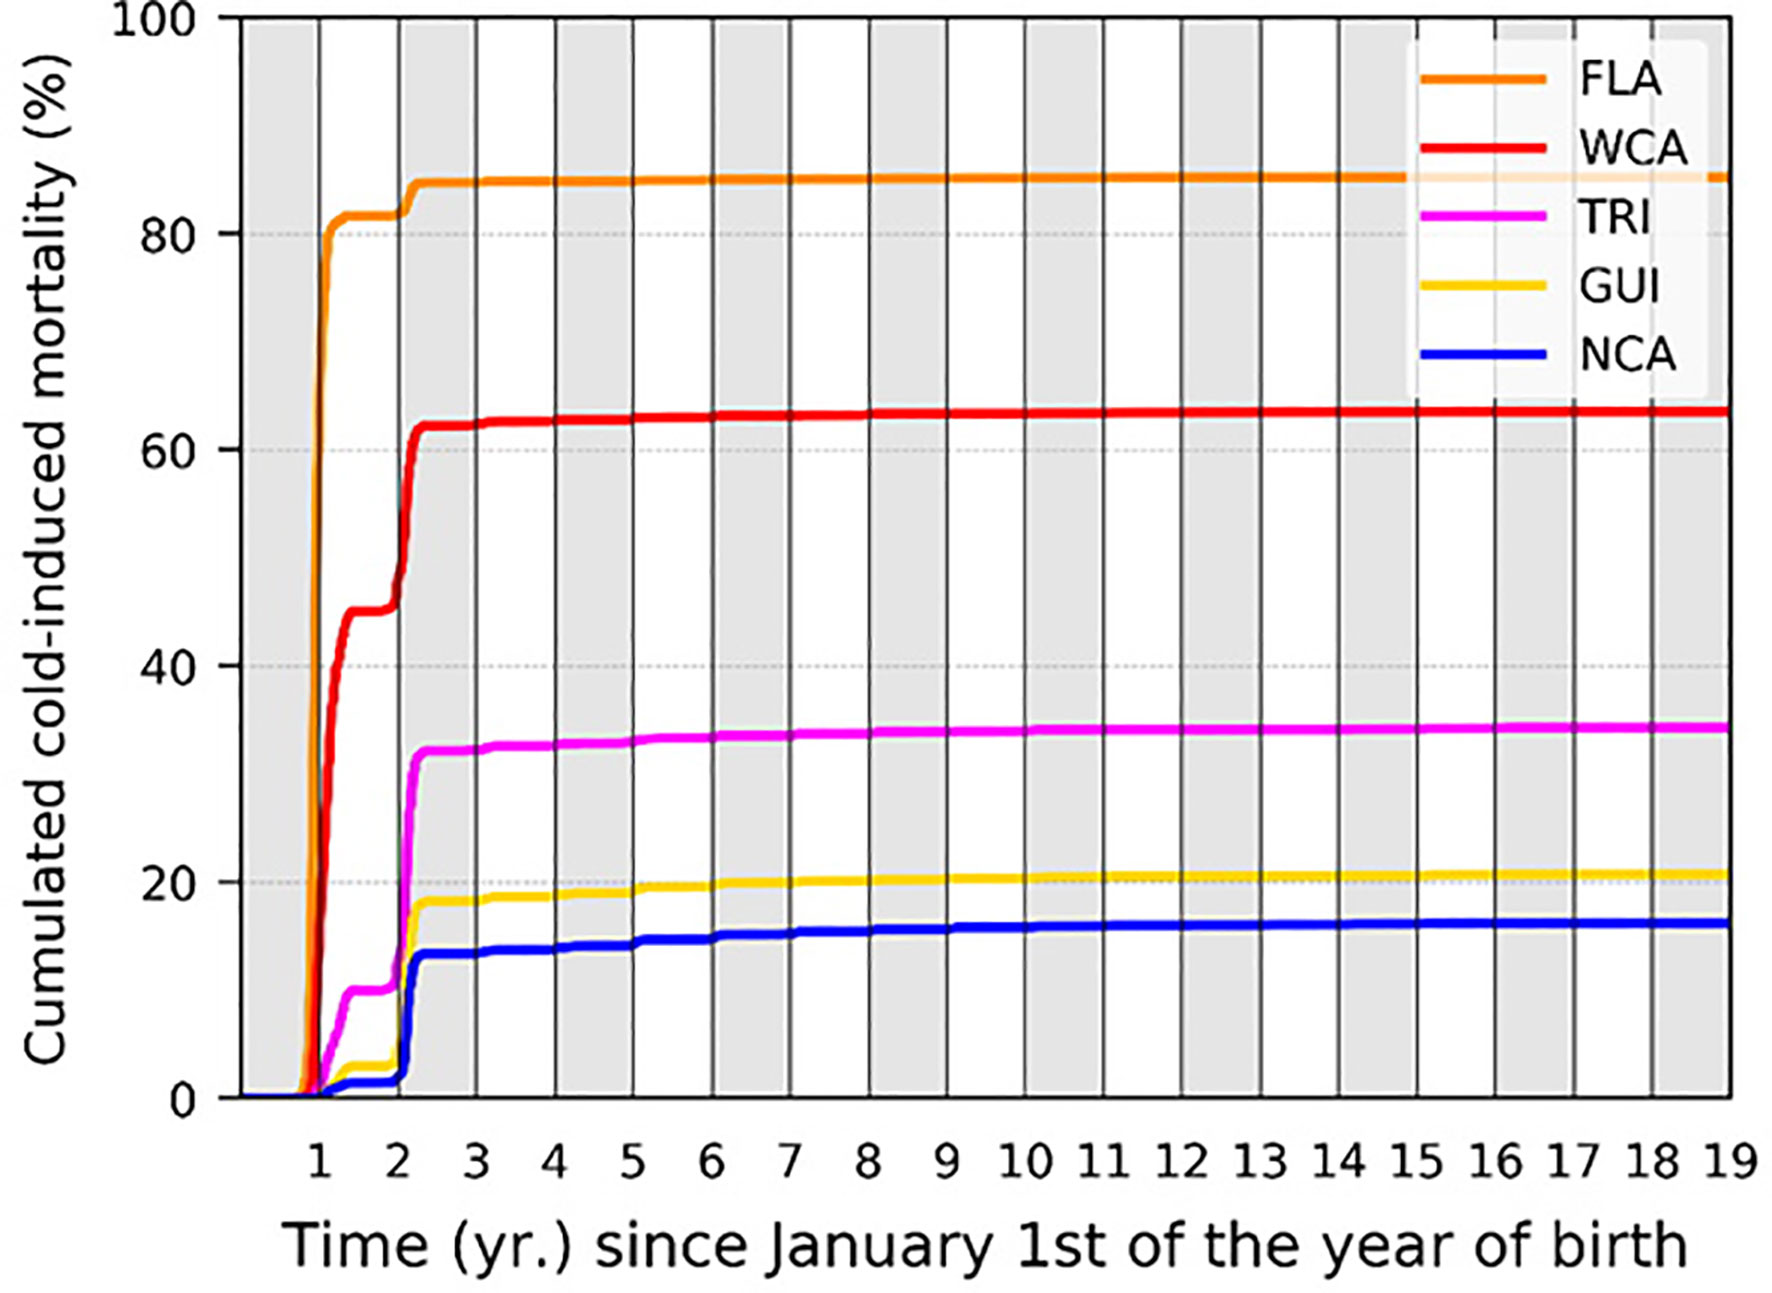
Figure 5 Cumulated cold-induced mortality in each of the five stocks.
Inside the same stock, cold-induced mortality varies considerably as a function of the dispersal group, with the main Caribbean group being, by far, the most lethal one (Table 4).
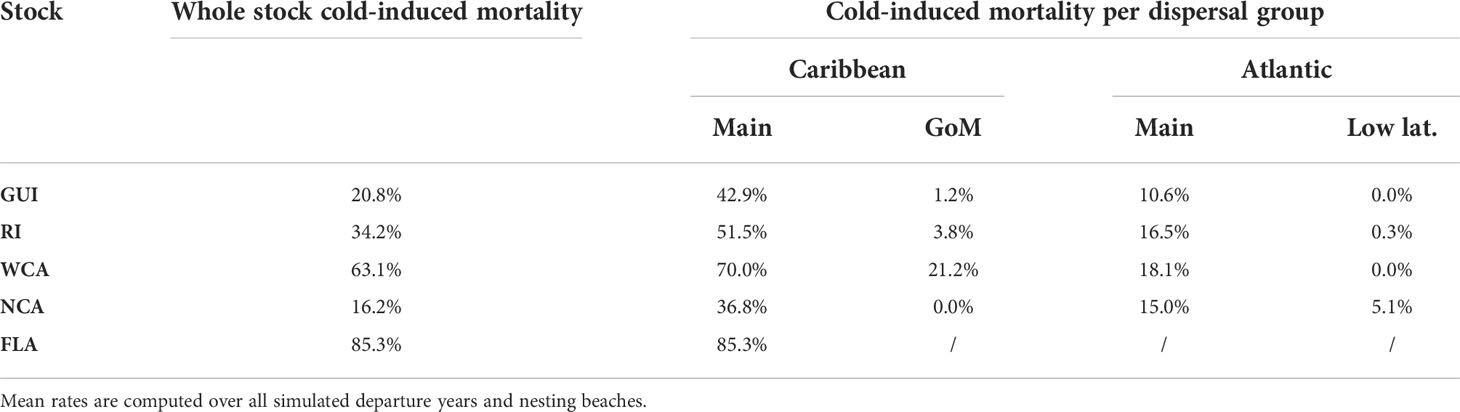
Table 4 Cumulated cold-induced mortality rates (at the end of the simulation) in the different dispersal groups of each stock.
The GUI stock occupies the southernmost nesting beaches of the NWA leatherback subpopulation (Figure 2). Hatchlings emerging from these beaches are immediately entrained northwestward by the Guiana current (Figure 4A) and arrive off Trinidad a few months later. From there, about one-third of them, mostly those circulating closer to the coastline, enter the Caribbean Sea with the Caribbean current and then follow the Caribbean route. The others follow the Atlantic route.
TRI hatchlings are first entrained into the Caribbean Sea (Figure 4B) by the Caribbean current, but over 40% of them (Table 2) switch to the Atlantic route as they disperse out of the Caribbean Sea, mostly through the Windward Islands (Figure 4B). The percentage of individuals doing this displays significant interannual variability ( ± 20%) due to subtle variations in the generally weak currents that flow in or out of the Caribbean Sea between the Windward Islands.
All WCA hatchlings leaving the nesting beaches of Pacuare, Chiriqui, or Playona first circulate counterclockwise around the Panama–Colombia cyclonic gyre (Figure 4C). Many of them loop several times around this gyre and can remain several months in this area. As soon as they exit this gyre, juveniles are entrained northwestwards by the Caribbean current. Most of them (>95%) then follow the Caribbean route. The others manage to exit the Caribbean Sea through the westmost Windward Islands (mostly between Cuba and Haiti) and then follow the Atlantic route.
Hatchlings simulated to emerge from different nesting beaches of the NCA stock initially display circuitous trajectories moving around islands, in and out of the Caribbean Sea, with the generally weak and variable currents that prevail in their natal area (Figure 4D). Less than 8% of them penetrate deep enough into the Caribbean Sea to be entrained along the Caribbean route (Table 2). The others follow the Atlantic route.
Hatchlings emerging from the Florida nesting beaches are immediately swept into the North Atlantic Ocean by the Gulf Stream (Figure 4E). Their early dispersal pattern within the western Atlantic basin looks quite like that of the NCA stock with the subtle, but very important, difference that these individuals first circulate west of the Bahamas, directly within the Gulf Stream, while the NCA individuals circulate essentially inside the subtropical gyre, east of the Bahamas. As discussed below, this has a marked impact on cold-induced mortality.
Our simulations demonstrate that significant spatial segregation exists between stocks during their early juvenile dispersal phase. The NCA and FLA juveniles essentially disperse within the western Atlantic basin, east of the Antilles Islands Arc. WCA juveniles are found in the western part of the Caribbean Sea and the GoM. The GUI and TRI juveniles initially make a more balanced use of the western Atlantic basin, the Caribbean Sea, and the GoM. Environmental changes or anthropogenic threats occurring in these different areas will thus have different impacts on the different stocks. The GUI and TRI stocks, which initially exploit a wider range of habitats, are likely more resilient to perturbations, a possible explanation for why these two stocks have historically been the largest in the NWA.
In all stocks, most juveniles finally move north of the Bahamas and progressively veer east to cross the Atlantic, always circulating clockwise around the subtropical gyre. Those having followed the Caribbean route initially circulate within the Gulf Stream along the northern border of the gyre. Individuals having followed the Atlantic route circulate more inside the gyre. The two groups progressively mix as they both undertake seasonal north–south migrations that take them to the same latitudes at the same periods of the year. From there (roughly north of 30°N and east of 40°W), dispersal patterns become strikingly similar for all stocks (Figure 4), following the dispersal scenario previously described by Lalire and Gaspar (2019) for the GUI stock. Juveniles progressively cross the north Atlantic basin while performing seasonal north–south migrations (typically between 30 and 50°N). After 4 to 9 years, they arrive along the coast of Europe or North Africa and disperse in the productive waters of the Bay of Biscay, along the Portuguese or the Moroccan coast. Some of them enter the western Mediterranean basin. Upon reaching the Moroccan coast, many of the turtles are pushed southward by the Canary current and finally reach the rich Mauritanian upwelling area. This is an important result indicating that, during their late dispersal phase, juveniles from all stocks encounter the same environmental conditions and the same threats (fisheries, pollution) at about the same age. Therefore, if differences exist between the survival rates of the juveniles from the different stocks, these differences are unlikely to originate from their late pelagic dispersal phase within the eastern part of the North Atlantic basin or the Mediterranean Sea.
The wide variations observed in the percentages of juveniles visiting the GoM (Table 3) directly reflect how ocean currents channel juveniles from their nesting sites into this area. Ocean circulation makes it very difficult for NCA juveniles to access the GoM and almost impossible for FLA juveniles (they can do so only after having circled around the subtropical gyre). On the contrary, the GUI, TRI, and WCA nesting sites lie upstream of the GoM so that ocean currents naturally lead a significant fraction of their juveniles into this area. The GUI nesting beaches are the furthest away and have direct access to the Atlantic Ocean. GUI juveniles can thus use multiple dispersal pathways avoiding the GoM. Slightly over one-third of them enter this area. TRI juveniles have fewer opportunities to stray from the Caribbean route, and most of them (56%) follow it into the GoM. The Caribbean current leaves even fewer opportunities for WCA juveniles to enter the Atlantic Ocean through the Antilles Islands Arc. Almost all of them (96%) enter the GoM. Out of all stocks, the WCA is, by far, the most closely linked to the GoM.
With cold-induced mortality rates between 36.8% and 85.3%, the main Caribbean dispersal group is the most lethal dispersal group in all stocks. Mortality in the three other dispersal groups is considerably smaller (generally below 20%, Table 4). Consequently, mortality at the stock level is essentially governed by a) the percentage of individuals belonging to the main Caribbean dispersal group and b) the mortality rate in that group. This mortality rate is directly related to the age at which individuals of the group reach mid-latitudes and encounter colder waters. This is clearly shown in Table 5 where one observes that cold-induced mortality in the main Caribbean group increases monotonically as the median age of individuals reaching 26.7°N decreases (Spearman’s rank correlation ρ = −1). Less expectedly, an inverse rank correlation (ρ = −1) also exists between the percentage of individuals in the main Caribbean dispersal group and the median age at 26.7°N in this group. In other words, the stocks with the largest percentages of individuals in the main Caribbean dispersal group are also the stocks in which these individuals most rapidly reach 26.7°N. The age and stock percentage effects thus systematically reinforce each other to create the large cold-induced mortality variations observed between the different stocks. The FLA stock, with the lowest median age at 26.7°N and the largest percentage of individuals in the main Caribbean dispersal group, incurs the highest mortality rate (85.3%), immediately followed by the WCA stock (63.1%). In these two stocks, most mortality events happen during the first winter at sea, while the second winter is more lethal in the three other stocks (Figure 5). The NCA stock with the largest median age at 26.7°N and the smallest percentage of individuals in the main Caribbean dispersal group has the smallest mortality rate (16.2%).
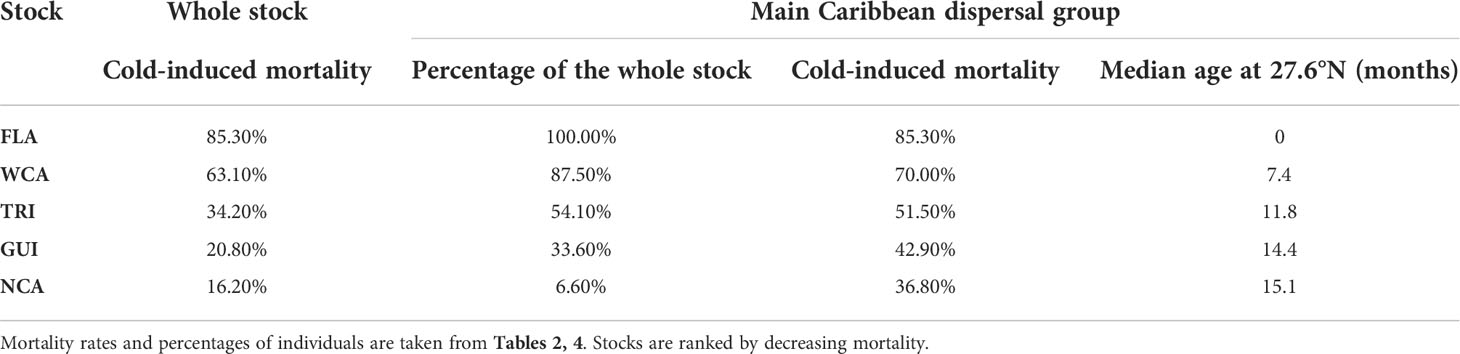
Table 5 Cumulated cold-induced mortality rates (at the end of the simulation) in the different stocks together with the correlated parameters of the main Caribbean dispersal group (percentage of individuals and cold-induced mortality in that group, median age of these individuals when reaching 26.7°N).
Based on data from various sources and various leatherback populations, Spotila et al. (1996) estimated that 75% was a reasonable estimate of first-year mortality rate (after escaping the near-shore predator zone) and that such a mortality level can lead to population maintenance given reasonable mortality estimates for the other life stages. The simulated first-year cold-induced mortality rate for the FLA stock reaches 81.6%. This value is already above the 75% mark and does not include other major sources of mortality such as natural predation, interactions with fisheries (e.g., Lewison et al., 2004), or plastic ingestion (e.g., Mrosovsky et al., 2009). This clearly suggests that the simulated cold-induced mortality rate is overestimated, at least in the FLA stock. The possible reasons for this overestimation are investigated below.
The STAMM cold-induced mortality diagnosis only involves two parameters: P, the time period during which turtles can survive in below-critical water temperatures, and Tb, the minimum suitable body temperature. Increasing P will obviously lower the estimated cold-induced mortality rate. Even if 10 days, the presently used value of P, seems to be a long survival period in below-critical water temperatures, larger values can easily be tested using existing simulation results. With P = 20 days, the simulated cold-induced mortality rate is reduced by less than 7% in all stocks. The selected value of P thus only has a modest effect on the simulated cold-induced mortality rate and is unlikely to be the main factor causing its overestimation.
Decreasing Tb shall also lower the simulated cold-induced mortality rate. Following Gaspar and Lalire (2017), simulations were performed with Tb = 24°C. These authors cautioned that a value of Tb below 23°C should not be used as the coagulation efficiency of leatherback’s blood decreases dramatically around this temperature (Soslau et al., 2004), thereby indicating that such a low body temperature is not normally experienced. More recently, however, Jeanette Wyneken (2021, pers. com.) successfully raised leatherback hatchlings for several weeks in water temperatures occasionally going down to 21°C–22°C. She observed that, at such temperatures, hatchlings were active, feeding, and growing albeit at a slower rate than in water temperatures around 23°C–24°C. A value of Tb slightly below 23°C might thus be acceptable. Unlike modifying P, changing Tb requires performing simulations anew as this change modifies the thermal habitat suitability index which in turn affects the simulated swimming speed. To rapidly evaluate the impact of such a change, we performed a single simulation per stock with Tb = 22°C. Departures were simulated for a single year (2002) and only one nesting area per stock. Chiriqui (Panama) and Sandy Point (St. Croix, USVI) were selected for the WCA and NCA stocks, respectively. The cumulated mortality rates obtained in these five simulations are shown in Figure 6. The impact of such a reduced Tb is important in various regards. In the FLA and WCA stocks, simulated cold-induced mortality rates are reduced to 61.2% and 39.2%, respectively, a drop of over 20% in both cases. Most mortality events still occur during the first winter at sea, but mortality during the second winter becomes negligible. In the three other stocks, cold-induced mortality becomes quite small (<10%). In all stocks, cold-induced mortality disappears in the GoM and low-latitude dispersal groups. It becomes negligible (<2%) in the main Atlantic dispersal group. This reinforces the idea that mostly (and may be only) the individuals belonging to the main Caribbean dispersal group are exposed to a significant cold-induced mortality risk.
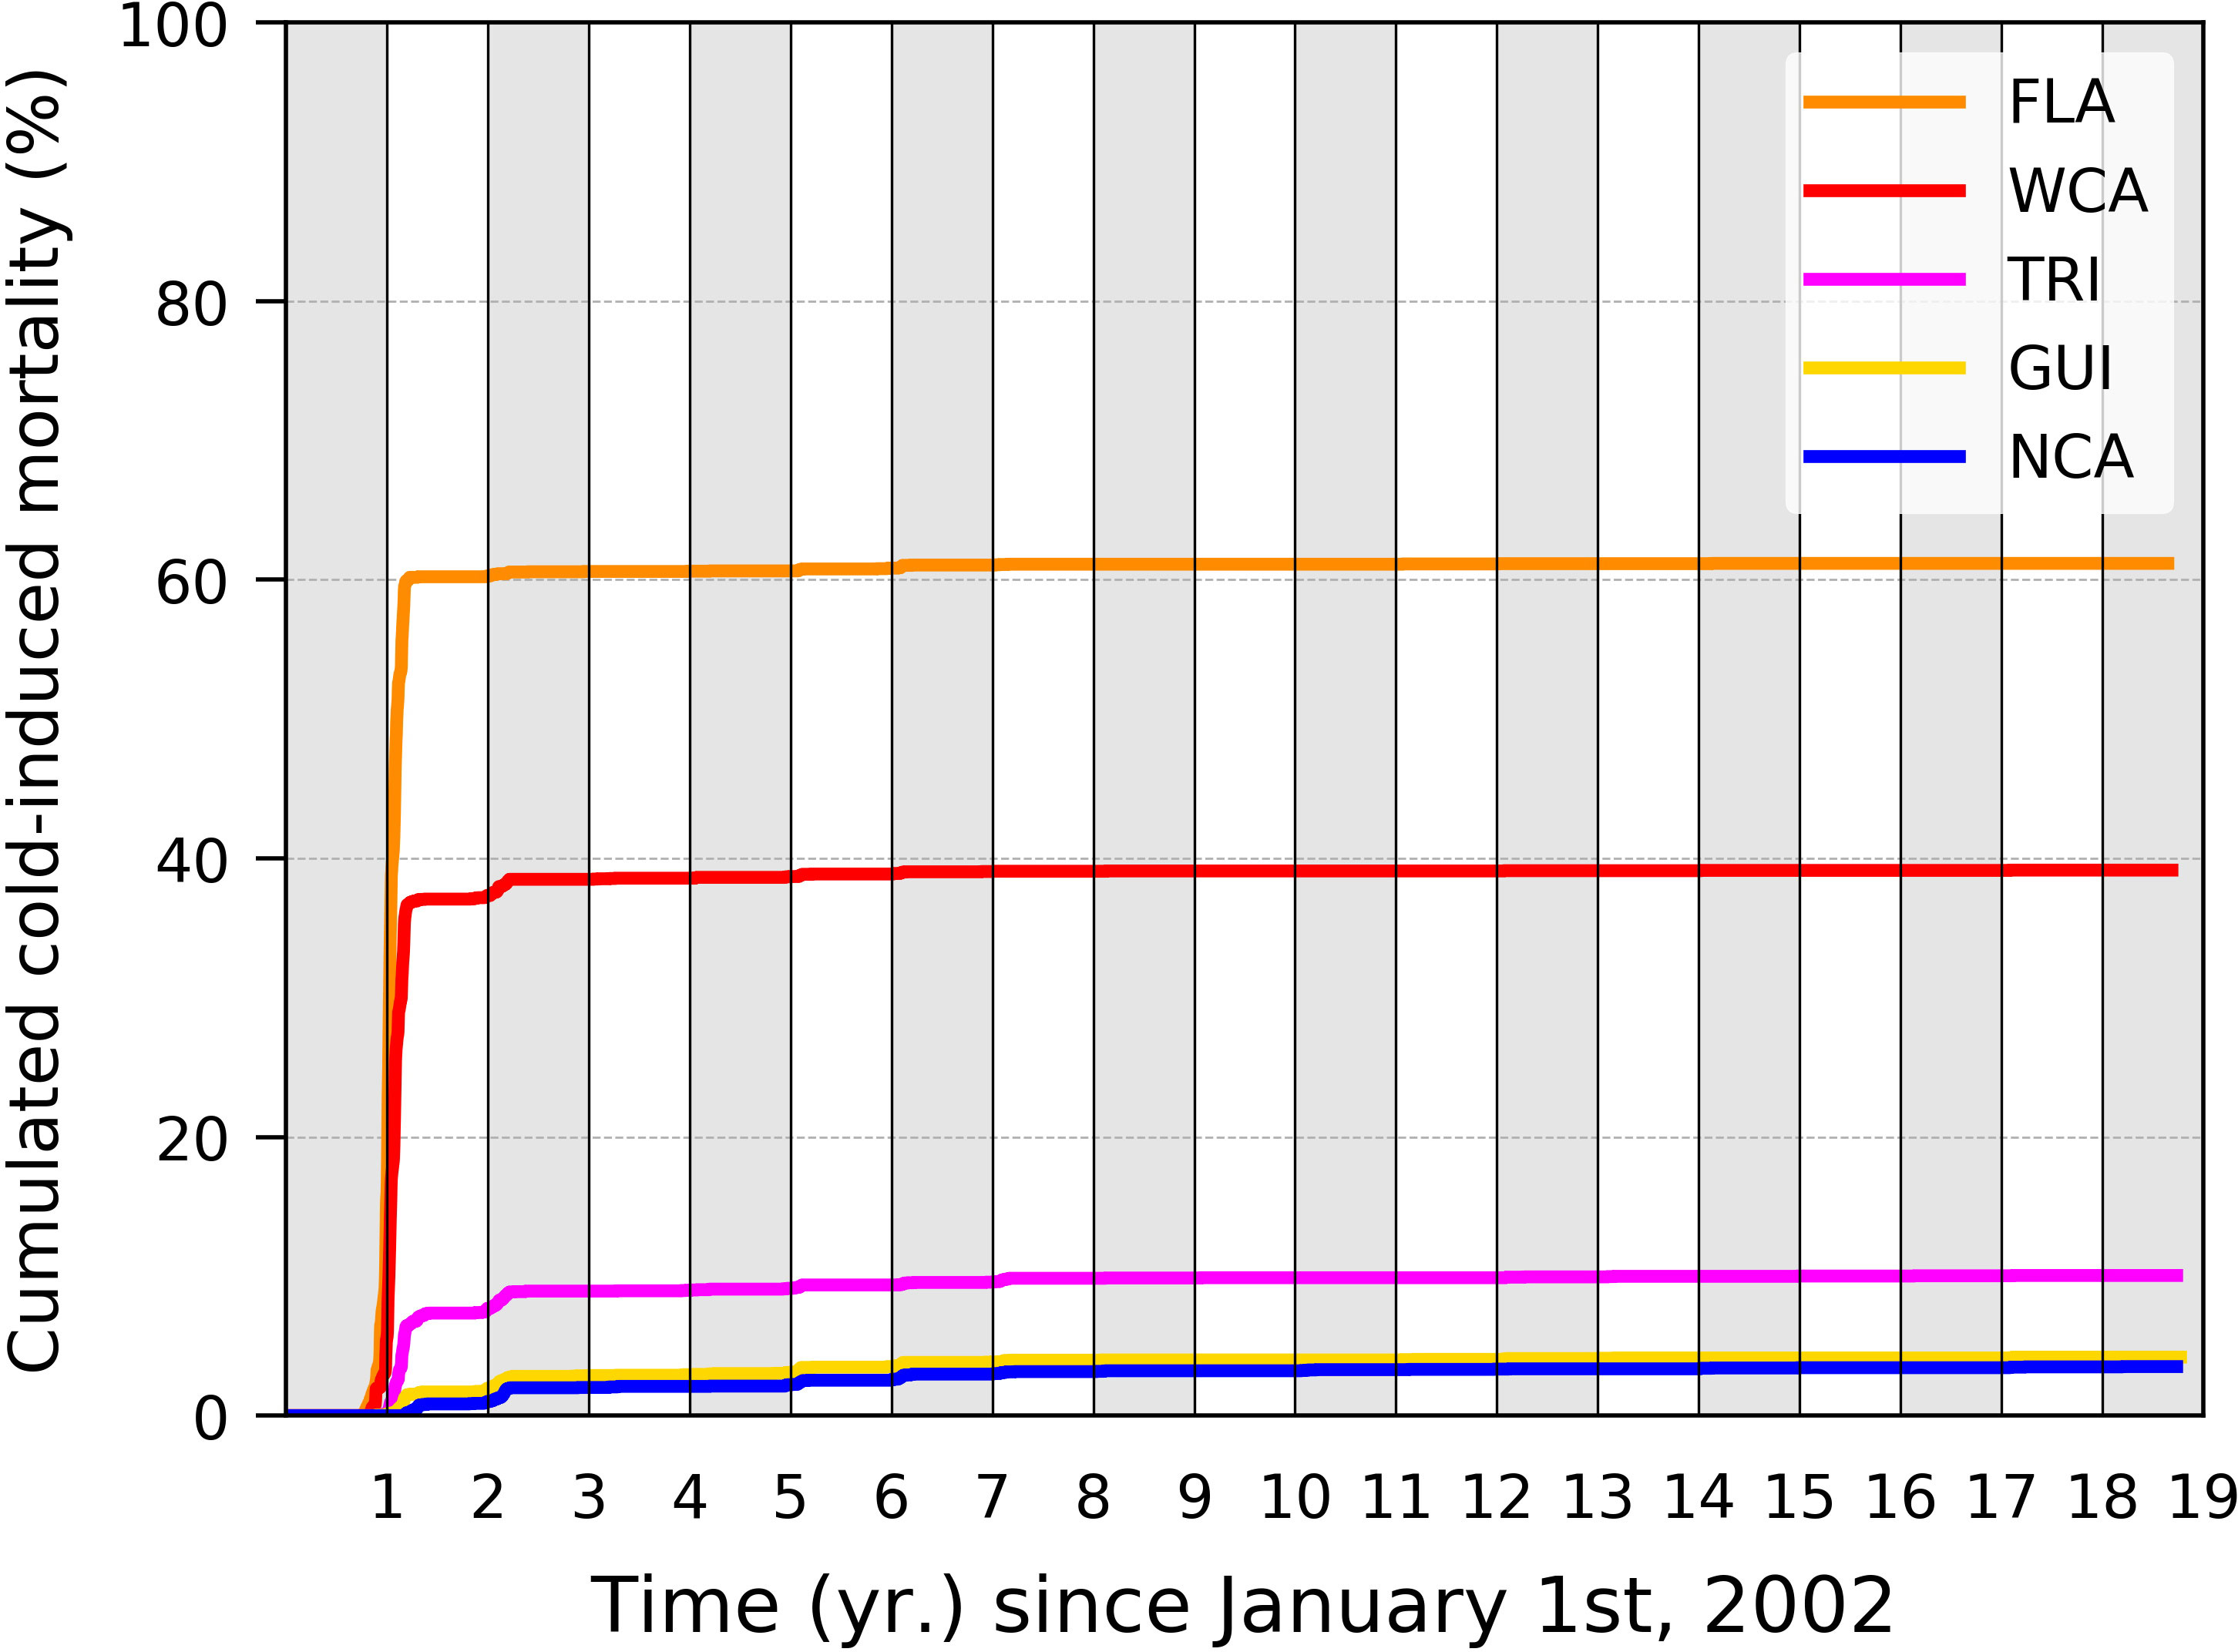
Figure 6 Cumulated cold-induced mortality in each of the five stocks obtained with Tb = 22°C. Only one departure year (2002) and one nesting beach per stock were simulated.
It is also worth noting that simulated dispersal patterns obtained with Tb = 22°C are similar (spatially and temporally) to those previously obtained with Tb = 24°C. As an example, the dispersal pattern of GUI juveniles obtained with Tb = 22°C is shown in Figure 7. The most noticeable change is that the Bay of Biscay and the southern part of the British Isles are more frequently visited by late juveniles, in agreement with observations (Witt et al., 2007; Dell’Amico, 2021).
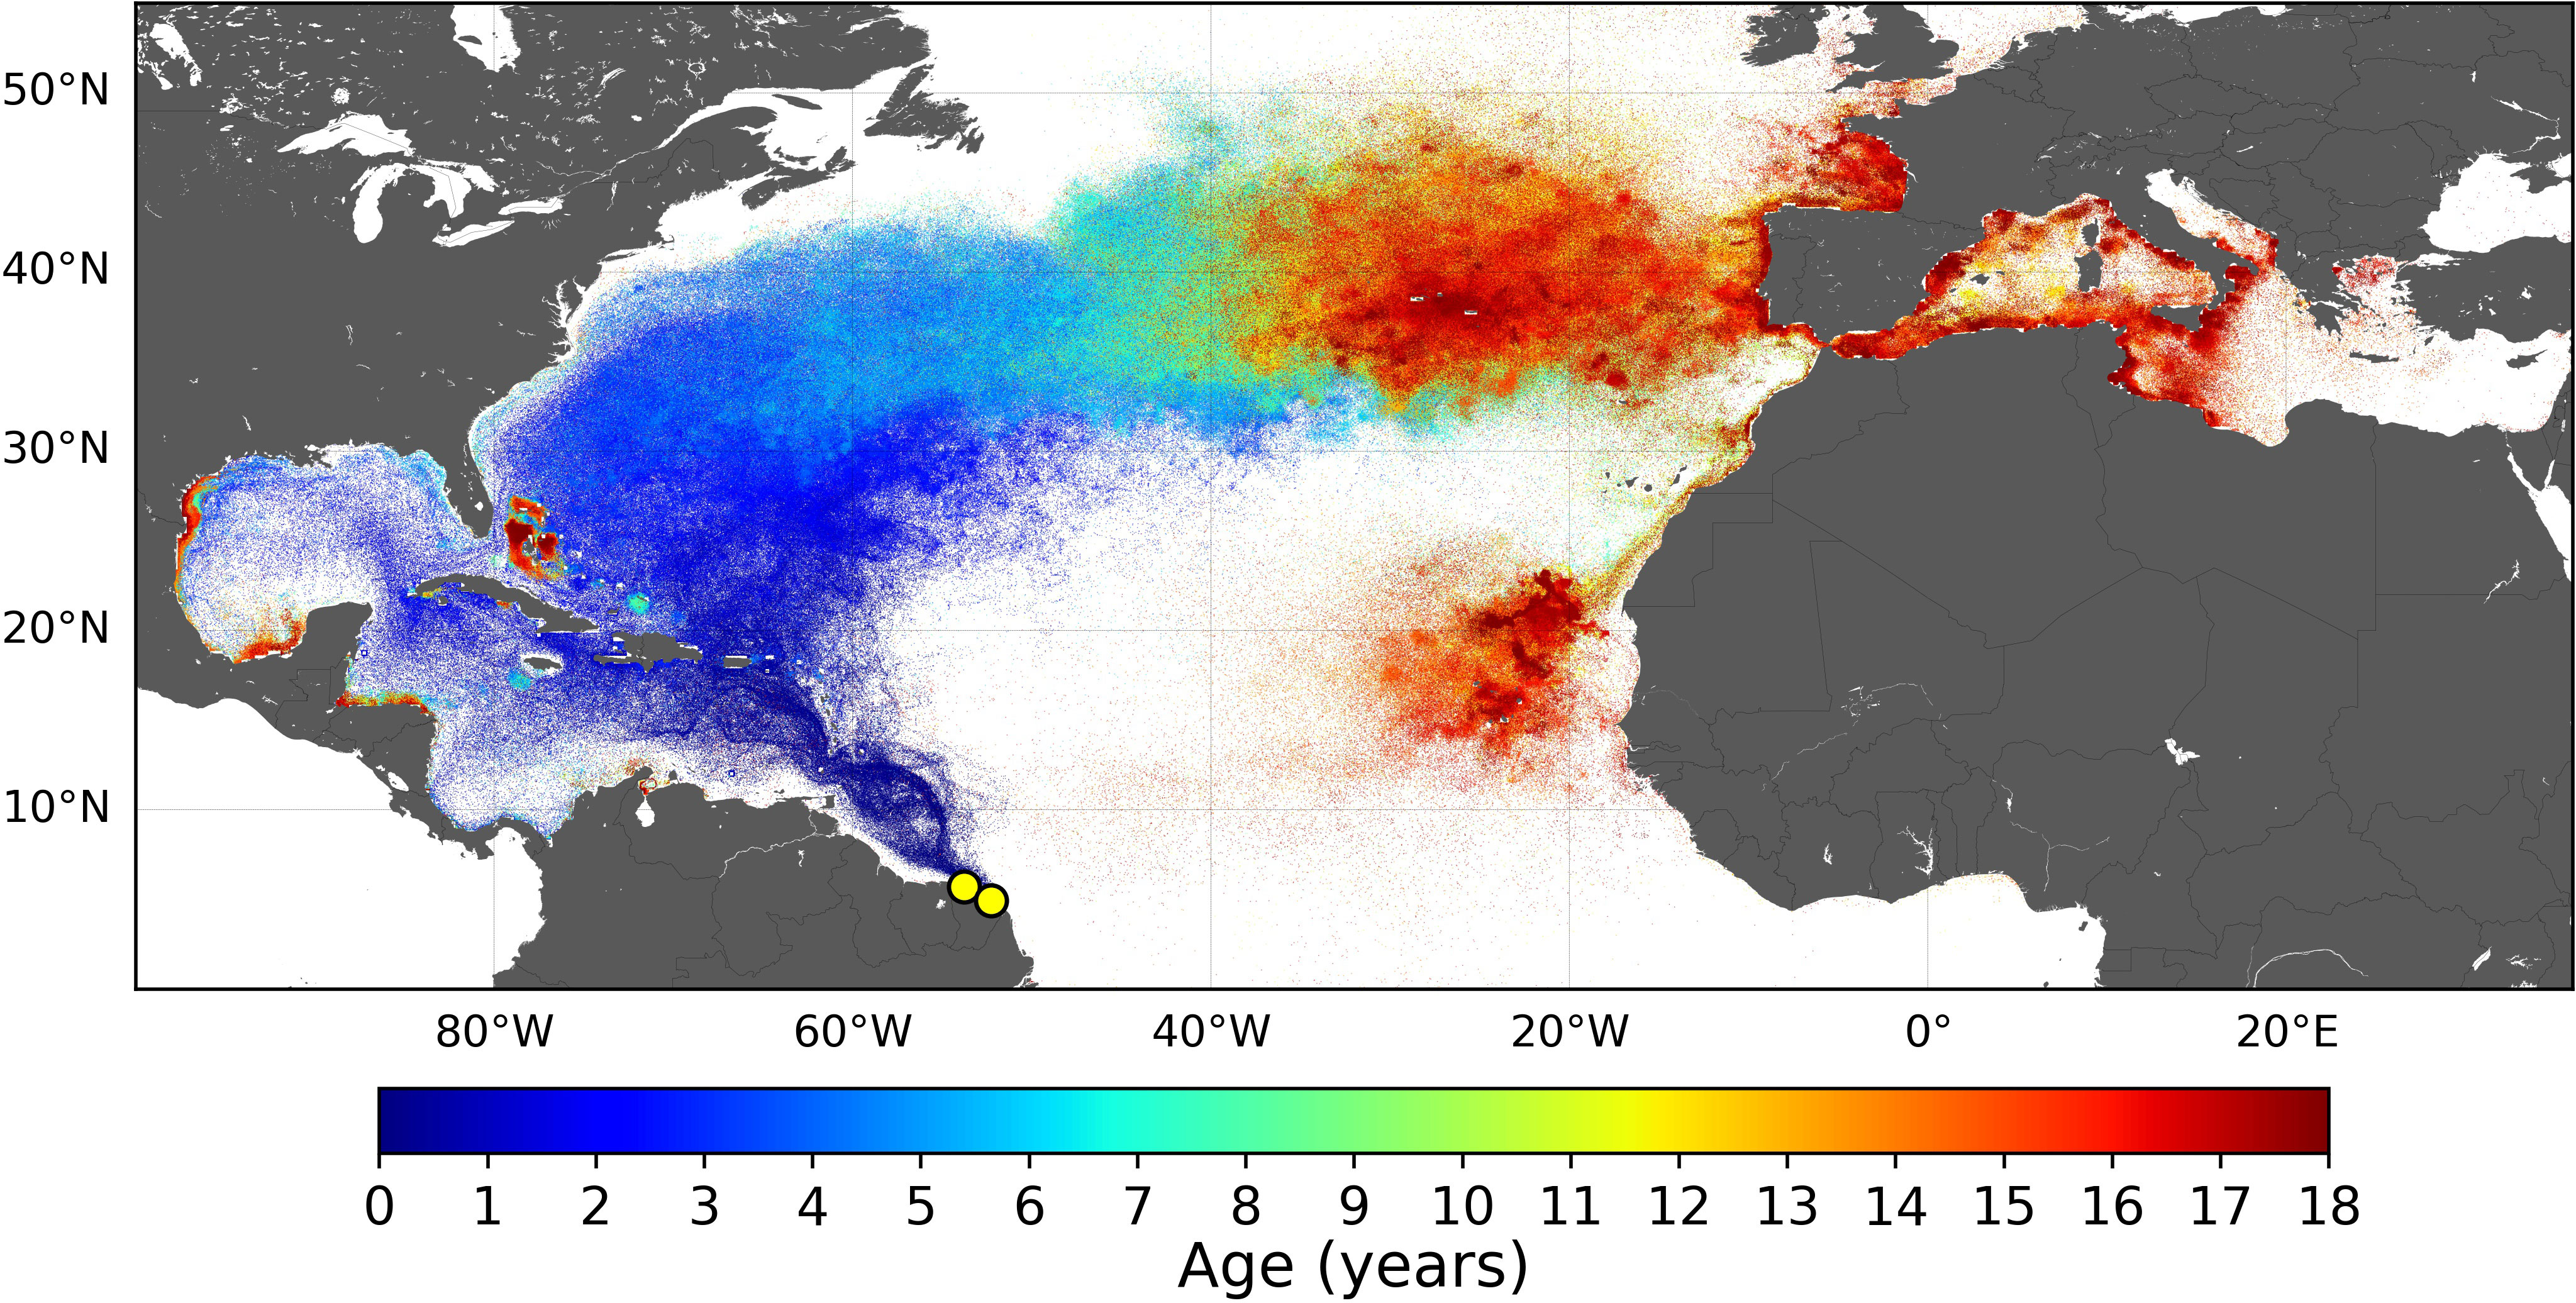
Figure 7 Normalized dispersal map for the Guiana stock obtained with Tb = 22°C. Only one departure year (2002) was simulated.
Simulations obtained with Tb = 22°C thus appear to produce slightly more realistic dispersal patterns and yield more reasonable cold-induced mortality rates, likely allowing population maintenance, at least in the GUI, TRI, and NCA stocks. Although reduced, the simulated cold-induced mortality rates for the FLA and WCA stocks remain in the range of 40% to 60%. This might still be incompatible with population maintenance when combined with other mortality causes. While parameters of the cold-induced mortality model can hardly be further tuned, it might be that simulated cold-induced mortality rates remain too high in the FLA and WCA stocks because our dispersal model leads WCA and FLA juveniles too rapidly into the cold mid-latitude waters of the North Atlantic Ocean. This hypothesis is investigated in the next section.
The time needed by FLA juveniles to reach mid-latitudes can hardly be shorter than in the present simulations. Hatchlings are indeed released around 40 km offshore Juno beach and immediately entrained northwards by the Gulf Stream. Although 40 km is a likely distance swum by hatchlings during their frenzy (Gaspar et al., 2012), it might be that, at least part of, the FLA hatchlings do not swim that far into the current’s core. Some might remain west of the Gulf Stream pathway and circulate more slowly along the Florida shelf where complex small-scale circulation patterns can induce retention or even southward movements (Archer et al., 2015; Soloviev et al., 2017). Remaining in coastal waters west of the Gulf Stream could be an option that would minimize cold-induced mortality, probably at the cost of increased predation. Given the especially high cold-induced mortality risk incurred by FLA hatchlings, this might still be a beneficial option. An indirect corroboration of this is provided by the observation that adult females tracked from Florida nesting beaches spend an unusually large fraction of their time on the north American continental shelf as noted by Eckert et al. (2006) and confirmed by recent tracking results (Florida Leatherbacks Inc., https://www.trackturtles.com/index.html). Based on the LMG hypothesis, this behavior might be inherited from the juvenile stage. To test if a reduced swimming frenzy can indeed lead FLA hatchlings into suitable retention areas onshore of the Gulf Stream would require using a higher resolution ocean model in which small-scale current features are better represented. It would also require modifying STAMM to allow hatchlings to be released directly from their nesting beach and to initially disperse under the effect of coastal currents plus a specified frenzied swimming velocity. This is part of our future work plan.
The situation is very different for WCA juveniles whose median arrival time at 27.6°N is close to 7 months (Table 5). Regardless of the exact distance swum during their frenzy, all WCA hatchlings must enter and circulate around the Panama–Colombia gyre (Figure 2). The median residence time in this gyre is close to 2 months, and 10% of the simulated juveniles remain there for over 8 months. The Panama–Colombia gyre is thus an important retention area that helps reduce cold-induced mortality in WCA juveniles. It may explain why the main leatherback nesting beaches found in the western Caribbean basin are situated along this gyre (K. L. Eckert and Eckert, 2019).
After leaving the Panama–Colombia gyre, WCA juveniles follow the Caribbean and then the Loop Current into the GoM. The median residence time in the GoM is rather short (close to 20 days), but some individuals (those of the GoM dispersal group) can remain there until the end of the simulation, incurring a much lower risk of cold-induced mortality than individuals of the main Caribbean dispersal group (21.2% instead of 70%, Table 4). Retention in the GoM is thus clearly beneficial for the WCA stock. Since Lagrangian retention times are sensitive to model resolution (e.g., van Sebille et al., 2018), simulations performed with a higher resolution model might yield somewhat longer retention times in both the Panama–Colombia gyre and the GoM. This would in turn lower the cold-induced mortality rate simulated in the WCA stock, as probably needed. This is an additional reason for planning future runs of STAMM with a higher resolution ocean circulation model.
It has long been known that adult and subadult leatherback turtles are frequent visitors in the GoM (Leary, 1957) and that, at least, some of them are coming from the GUI stock (Pritchard, 1976). Recent genetic analyses revealed that, out of 100 adult leatherbacks bycaught in the GoM, 43 belonged to the WCA stock, another 43 to the TRI stock, only 11 to the GUI stock, 2 to the NCA stock, and none to the FLA stock (Stewart et al., 2016). Given the relatively small size (by then) of the WCA stock compared to the TRI and GUI stocks, the authors concluded that WCA adults were markedly overrepresented in this area. The high use of the GoM by WCA leatherbacks is also confirmed by satellite tracking: out of 33 female leatherbacks tracked from WCA nesting beaches, 18 (55%) migrated, and foraged, into the GoM, while the others directed their post-nesting migrations toward the north Atlantic Ocean. Both Stewart et al. (2016) and Evans et al. (2021) questioned whether the high use of the GoM by WCA leatherbacks is linked to juvenile dispersal following the LMG hypothesis. Given our simulation results, one is tempted to immediately answer “yes” as the percentage of WCA juveniles visiting the GoM (96%) is much larger than in any other stock (Table 3). However, such a claim requires more cautious analysis and mathematical formalism will help.
Let us denote FA (s,z) the fraction of adults of any stock s, migrating into an oceanic zone z, and FJ (s,z) the fraction of juveniles from that stock visiting this same zone. The LMG hypothesis does not merely state that adult turtles return to areas that they visited when juvenile, or FA (s,z) = FJ (s,z). It more precisely states that adult sea turtles tend to exploit favorable foraging areas that they previously discovered at the juvenile stage. Simply visiting an area is a necessary, but not sufficient, condition to identify it as a favorable foraging zone. The LMG hypothesis is thus better stated under the form:
where p is the probability that juveniles, from stock s and visiting zone z, identify z as a favorable foraging area. Juvenile mortality can also play a role in modifying the ratio between FAand FJ, but this will be neglected for now.
For any stock which juveniles visit the GoM, Eq. (2) can be rewritten:
Estimates of FJ (s,GoM) are readily available from Table 3, but p(s,GoM) is more difficult to evaluate. An examination of simulated turtle trajectories inside the GoM provides some clues. As previously mentioned, half of the simulated juveniles entering the GOM leave it within 20 days. These fast-transiting juveniles barely penetrate the GoM. They follow the usual retracted “entry to exit” pathway of the Loop Current (Weisberg and Liu, 2017) that carries them quite directly from the Yucatan Strait to the Straits of Florida (Figure 8A). This short pathway through the GoM is not associated with especially rich habitats so that individuals following it are unlikely to record the GoM as a favorable foraging area. They shall later find more favorable foraging areas in the North Atlantic Ocean and return there at the adult stage.
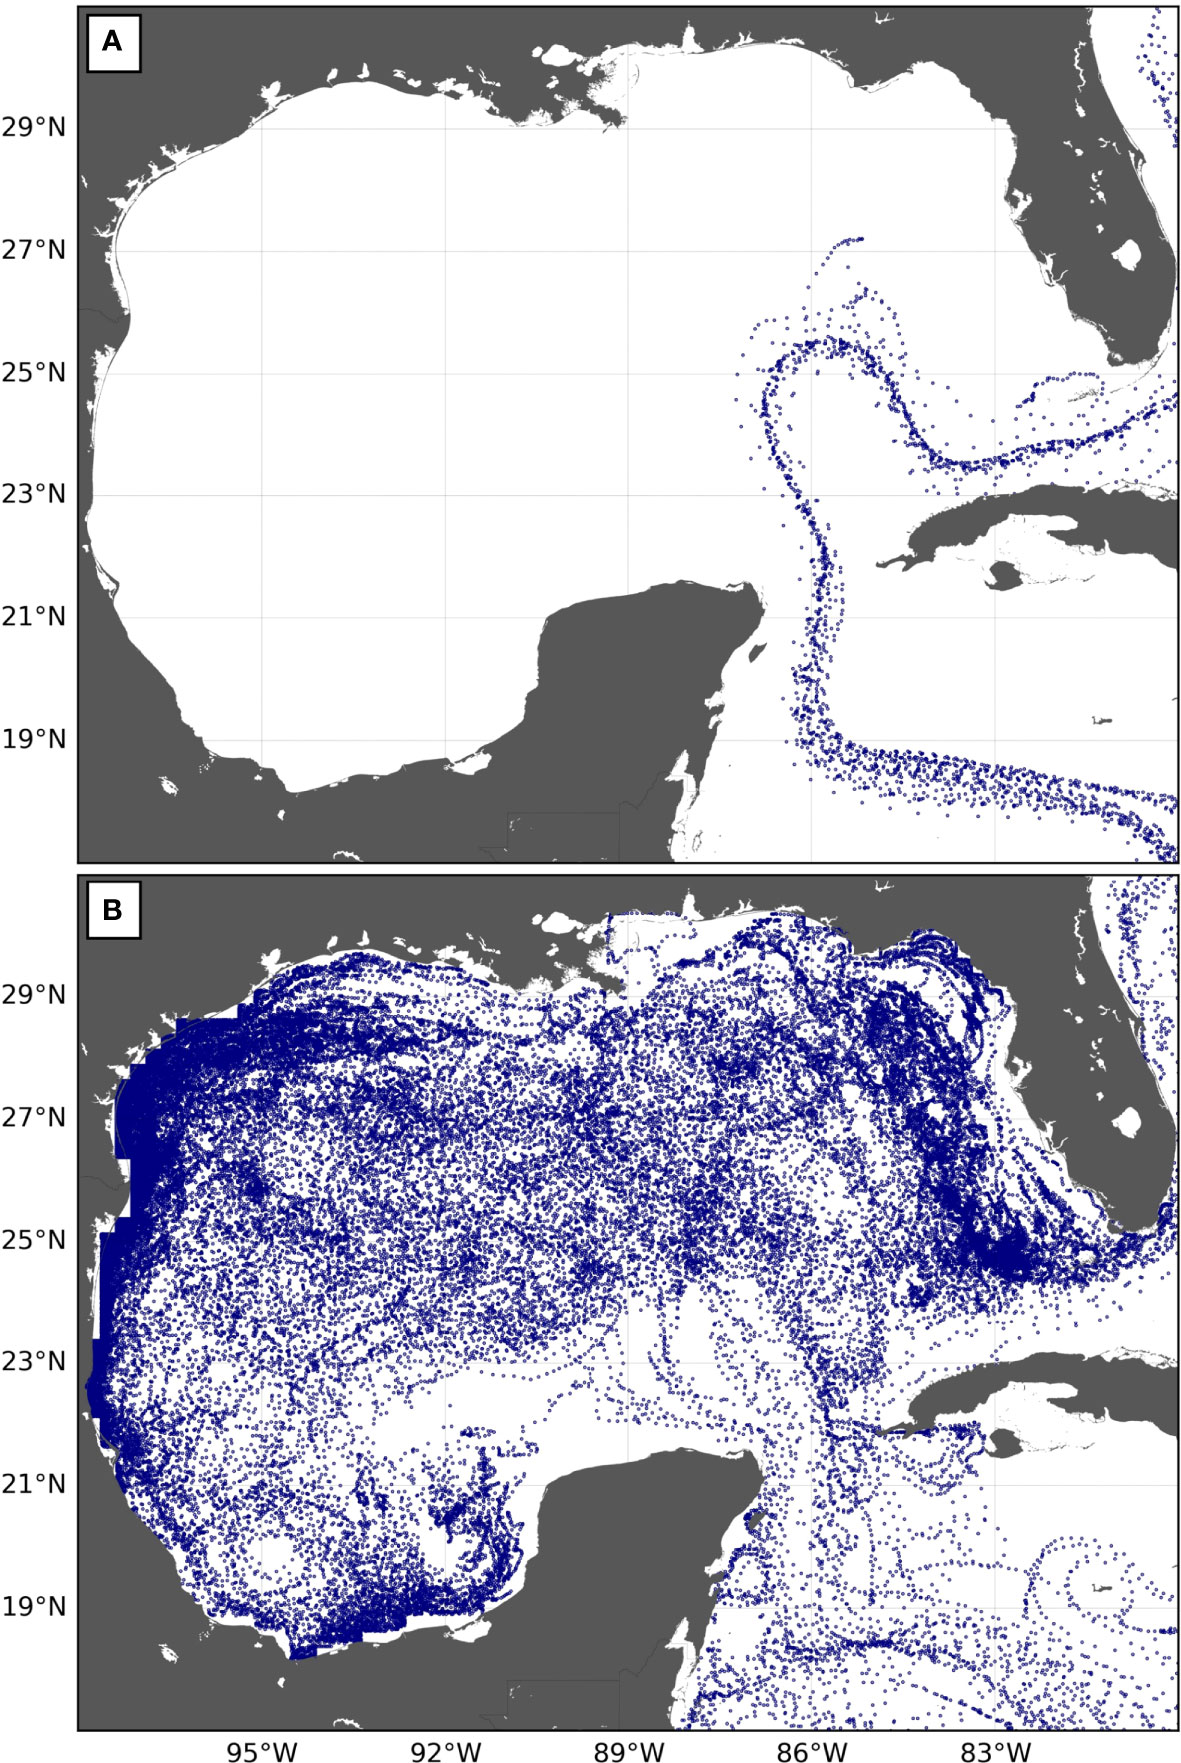
Figure 8 Trajectories in the GoM of 50 simulated WCA juvenile leatherbacks released off Chiriqui Beach in 2005 and entering the GoM (A) between 1 and 12 August 2005, at a time when the Loop Current follows its retracted “entry to exit” pathway, and (B) between 7 and 18 February 2006, when the Loop Current is shedding an eddy.
Other juveniles will enter the GoM at times when the Loop Current intrudes more deeply into the GoM, sometimes as far north as the Mississippi River Delta. Such intrusions progressively develop over several months and are generally followed by the shedding of an anticyclonic eddy as the Loop Current retreats back to its retracted pathway (e.g., Weisberg and Liu, 2017). These intrusion and eddy-shedding events are observed at irregular intervals. The period between two eddy separation events typically ranges between 5 and 19 months (Vukovich, 2007). Juveniles entering the Loop Current during intrusion events will obviously circulate further and longer into the GoM (Figure 8B). They will have opportunities to visit more productive areas found deeper in the northern part of the GoM, in the shelf waters of southwest Florida or in the Campeche Bay, where adult leatherbacks are observed to forage (Aleksa et al., 2018; Evans et al., 2021; Sasso et al., 2021). Some of them will also become trapped in eddies shed by the Loop Current. These provide favorable developmental habitats as they are associated with enhanced primary productivity (Damien et al., 2021). These juveniles are thus more likely to identify the GoM as a favorable foraging area and to return at the adult stage.
This discussion of the Loop Current variability and its impact on juveniles visiting the GoM tells us two important things about p(s,GoM). The first one is that this probability shall be rather small, probably below 0.5, as at least half of the simulated juveniles cross the GoM too briefly to encounter favorable foraging zones. This partly explains why the fraction of adult WCA leatherbacks observed to migrate into the GoM (55% according to Evans et al., 2021) is well smaller than the fraction of WCA juveniles simulated to visit the GoM (96%).
The second one is that p(s,GoM) essentially depends on ocean dynamics inside the GoM, not on the juveniles’ stock of origin. The value of p(s,GoM) should thus be nearly the same for all stocks. In that case, Eq. (3) implies:
where s1 and s2 are any two stocks of the NWA leatherback subpopulation. This shows that the probability of identifying the GoM as a favorable foraging area plays little or no role in explaining why adults from one stock are overrepresented in the GoM compared to adults from another stock: the overrepresentation factor is essentially determined by the percentages of juveniles visiting the GoM. Based on the simulated values of these percentages (Table 3), one deduces that FLA adults shall be almost absent from the GoM and that the percentage of NCA adults present in the GoM should be much smaller than that of the GUI, TRI, and WCA stocks, as observed by Stewart et al. (2016). Our simulation results also indicate that the fraction of WCA juveniles simulated to visit the GoM is 1.7 times larger than that of TRI juveniles and 2.7 times larger than that of GUI juveniles, not far from the global overrepresentation factor of 2.9 (43/15) quoted for WCA adults by Stewart et al. (2016). This leads us to conclude that the use of the GoM by adults from the different stocks of the NWA leatherback subpopulation, as inferred from genetics and satellite-tracking data, is broadly consistent with the LMG hypothesis and the results of our juvenile dispersal simulations.
During their study period (2004 to 2018), Evans et al. (2021) noted an increase in the fraction of WCA females observed to migrate into the GoM. This fraction went up from one-third for the period 2004–2009 to two-thirds for the period 2010–2018. These authors suggest that this might be due to a climate-change-related decline in North Atlantic foraging habitat suitability leading adult leatherbacks to shift their migration destination from the North Atlantic to the GoM. Based on the LMG hypothesis, this change in adult migration goal might also be due to an increased percentage of WCA juveniles identifying the GoM as a favorable foraging area and then migrating there when reaching the adult stage. If this was the case, the change observed around 2010 in the migrations of adults should have been initiated at least a decade earlier in juveniles since the age at maturity of leatherbacks typically ranges between 7 and 16 years (Jones et al., 2011).
As formalized earlier (Eq. 3), an increase in the fraction of WCA adult migration into the GoM can be triggered by an increase in FJ (WCA, GoM) or in p(WCA, GoM). The fraction of WCA juveniles visiting the GoM is governed by ocean currents channeling juveniles inside the Caribbean Sea, from their natal beaches toward the entrance of the GoM. Oceanic circulation inside the Caribbean Sea has not undergone marked changes over the last few decades so that a significant variation in FJ (WCA, GoM) is unlikely. On the contrary, ocean dynamics inside the GoM became more variable around the turn of the century. In particular, the frequency of the Loop Current’s eddy shedding events increased markedly over the last 20 years. Between 1981 and 2000, the rate of eddy shedding was stable at 11 per decade, but 16 eddies separated from the Loop Current between 2001 and 2010 (Vukovich, 2012), and 15 eddy detachments were observed between 2011 and 2020 (https://www.horizonmarine.com/loop-current-eddies). As previously discussed, the probability of identifying the GoM as a favorable foraging area is high for individuals entering the GoM during the course of the Loop Current intrusion and eddy-shedding events. The multiplication of such events has thus likely increased the mean value of p(WCA, GoM) from the year 2000 onwards. This is the first factor linking juvenile dispersal to the increased percentage of WCA adults migrating into the GoM.
Another important factor that probably contributed to this increase is the fact that important bycatch reduction measures were implemented in U.S. waters in 2003 and 2004. The shrimp trawl fishery, which is especially active in the GoM, began using turtle excluder devices (TEDs) in the late 1980s, but it was only in 2003 that this fishery was mandated to use TEDs with larger openings allowing larger individuals, including leatherbacks, to escape (https://www.fisheries.noaa.gov/southeast/bycatch/history-turtle-excluder-devices). In addition, this bycatch reduction measure was followed by a sharp decrease of the shrimping effort in the GoM (Gallaway et al., 2020). In 2004, various measures aimed at reducing sea turtle bycatch (zone closures, change of hooks and bait types) were also implemented in the U.S. pelagic longline fishery (Evans et al., 2021). As most leatherback bycatch in the GoM was due to longlines and shrimp trawls (Finkbeiner et al., 2011), the implementation of these bycatch mitigation measures, together with the decrease of the shrimping effort, benefited leatherbacks in the GoM more than anywhere else in the U.S. Atlantic waters. However, this bycatch reduction probably had (and still has) little impact on the youngest individuals present in the GoM. Indeed, the smallest leatherbacks recorded to interact with fisheries have a straight carapace length near 70 cm and are thus about 3 years old (Jones et al., 2011). This means that leatherbacks born in 2000–2001, and still present in the GoM 3 years later, were the first to fully benefit from reduced fisheries-induced mortality. Concurrently, these cohorts were also the first to benefit from more frequent Loop Current intrusion and eddy-shedding events. WCA leatherbacks born after 2000 thus likely had more opportunities for long-term retention and better chances of survival in the GoM than individuals from the previous cohorts. The combination of these two factors might well explain why the percentage of adult WCA leatherbacks tracked into the GoM started to increase after 2010, when these juveniles progressively became adults.
Analysis of the simulated dispersal patterns, and cold-induced-mortality, of juvenile leatherbacks originating from the five NWA stocks provided a wealth of information that can be summarized as follows:
1) Juveniles from all stocks initially disperse northwards following either the Caribbean route inside the Caribbean Sea and the GoM, or the Atlantic route east of the Antilles Islands Arc and the Bahamas.
2) The percentage of individuals initially following either the Atlantic or the Caribbean route varies enormously between stocks. Individuals from the GUI and TRI stocks make a rather balanced use of both routes. WCA and FLA individuals almost exclusively follow the Caribbean route, and NCA individuals the Atlantic route.
3) Late dispersal is very similar in all stocks, suggesting that, if differences exist between the juvenile survival rates of the different stocks, these differences are unlikely to originate from their late dispersal phase within the eastern part of the North Atlantic basin or the Mediterranean Sea.
4) Cold-induced mortality mostly impacts individuals having followed the Caribbean route as they are rapidly advected toward higher latitudes by the Gulf stream. The Atlantic route is much less lethal.
5) Simulated mortality rates in the FLA and WCA stocks appear to be too large to allow maintenance of these two populations. Sensitivity tests show that significantly reduced mortality rates are obtained lowering Tb the minimum suitable body temperature, from 24°C to 22°C. This parameter change also slightly improves the simulated dispersal patterns allowing more late juveniles/subadults to visit the Bay of Biscay and the southern part of the British Isles, in agreement with observations.
6) Even with such a lowered Tb, cold-induced mortality rates are still close to 40% in the WCA stock and 60% in the FLA stock. Lower, and probably more realistic, values could be obtained if the arrival of WCA and FLA juveniles in mid-latitudes was somehow delayed by extended stays in oceanic retention areas.
7) The first major oceanic retention area crossed by WCA juveniles is the Panama–Colombia gyre. Retention in this area is probably the prime reason why the main nesting beaches of the western Caribbean basin are situated along this gyre. The GoM is a second important retention area for WCA juveniles. Retention in both areas would be better simulated, and likely somewhat increased, using a higher-resolution ocean model.
8) FLA juveniles’ progression toward higher latitudes could only be slowed down by retention inside the shelf waters west of the Gulf Stream axis. Interestingly, adults tracked from Florida nesting beaches appear to heavily exploit these shelf waters. Based on the LMG hypothesis, this might well be an inherited behavior from their juvenile stage. Simulating such a coastal retention scenario would also require the use of a higher resolution ocean model.
9) In agreement with the LMG hypothesis, the percentage of juveniles from the different NWA stocks simulated to visit the GoM is consistent with the relative abundance of adults as inferred from genetic fingerprinting of individuals bycaught in the GoM (Stewart et al., 2016).
10) Always in agreement with the LMG hypothesis, the increase in the percentage of WCA adults migrating into the GoM which was observed during the last decade (Evans et al., 2021) can, at least partly, be explained by the combined effects of:
(a) an increase in the frequency of Loop Current and eddy-shedding events that started around 2000 and likely increased the probability that juveniles identify the GoM as a favorable foraging area and
(b) a decrease in the mortality of large (over 3-year-old) juveniles linked to the sea turtle bycatch reduction measures that were implemented in the U.S. waters in 2003–2004 and specially benefited individuals visiting the GoM.
These findings are, of course, far from filling all information gaps concerning the pelagic juvenile life stage of NWA leatherbacks, but they contribute to it. This does encourage us to pursue developing and improving active dispersal models. In parallel, we strongly recommend that satellite tagging efforts should be continued and as much as possible extended to juveniles. This will not only reduce the large knowledge gaps that still exist on the spatial ecology of this life stage. It will also help improve and validate dispersal models which will likely become important tools supporting the definition and implementation of effective conservation and management measures.
The raw data supporting the conclusions of this article will be made available by the authors, without undue reservation.
PG and GS conceived this study. TC ran all model simulations and produced all figures. All authors contributed to the article and approved the submitted version.
This study was funded by Mercator Ocean International and Upwell. The support from CNES, under contract SALP-ST-MER-EA-17440-CN, is also gratefully acknowledged.
We thank Maxime Lalire and Philippine Chambault for their useful comments and discussions on early versions of this paper. We also thank Jeanette Wyneken for providing the much needed information concerning the tolerance of leatherback hatchlings to low water temperatures.
The authors declare that the research was conducted in the absence of any commercial or financial relationships that could be construed as a potential conflict of interest.
All claims expressed in this article are solely those of the authors and do not necessarily represent those of their affiliated organizations, or those of the publisher, the editors and the reviewers. Any product that may be evaluated in this article, or claim that may be made by its manufacturer, is not guaranteed or endorsed by the publisher.
Aleksa K. T., Sasso C. R., Nero R. W., Evans D. R. (2018). Movements of leatherback turtles (Dermochelys coriacea) in the gulf of Mexico. Mar. Biol. 165 (10), 158. doi: 10.1007/s00227-018-3417-9
Archer M. R., Shay L. K., Jaimes B., Martinez-Pedraja J. (2015). “Observing frontal instabilities of the Florida current using high frequency radar,” in Coastal ocean observing systems. (Amsterdam, Netherlands: Elsevier). 179–208. doi: 10.1016/B978-0-12-802022-7.00011-0
Avens L., Goshe L. R., Zug G. R., Balazs G. H., Benson S. R., Harris H. (2020). Regional comparison of leatherback sea turtle maturation attributes and reproductive longevity. Mar. Biol. 167 (1), 4. doi: 10.1007/s00227-019-3617-y
Behrenfeld M. J., Falkowski P. G. (1997). Photosynthetic rates derived from satellite-based chlorophyll concentration. Limnol. Oceanography 42 (1), 1–20. doi: 10.4319/lo.1997.42.1.0001
Block B. A. (2005). Physiological ecology in the 21st century: Advancements in biologging science. Integr. Comp. Biol. 45 (2), 305–320. doi: 10.1093/icb/45.2.305
Block B. A., Jonsen I. D., Jorgensen S. J., Winship A. J., Shaffer S. A., Bograd S. J., et al. (2011). Tracking apex marine predator movements in a dynamic ocean. Nature 475 (7354), 86–90. doi: 10.1038/nature10082
Damien P., Sheinbaum J., Pasqueron de Fommervault O., Jouanno J., Linacre L., Duteil O. (2021). Do loop current eddies stimulate productivity in the gulf of mexico Biogeophysics: Phys. - Biol. Coupling 18 (14), 4281–4303. doi: 10.5194/bg-2020-490
Dell’Amico F. (2021). Signalements de tortues marines et de poissons-lunes en 2020 sur la façade manche-atlantique (Dermochelyidae, chenoniidae & molidae) Ann. Soc. Sci. nat. Charente-Maritime 11 (2), 141–53.
Dutton P. H., Roden S. E., Stewart K. R., LaCasella E., Tiwari M., Formia A., et al. (2013). Population stock structure of leatherback turtles (Dermochelys coriacea) in the Atlantic revealed using mtDNA and microsatellite markers. Conserv. Genet. 14 (3), 625–636. doi: 10.1007/s10592-013-0456-0
Eckert S. A., Bagley D., Kubis S., Ehrhart L., Johnson C., Stewart K., et al. (2006). Internesting and postnesting movements and foraging habitats of leatherback Sea turtles (Dermochelys coriacea) nesting in Florida. Chelonian Conserv. Biol. 5 (2), 239–248. doi: 10.2744/1071-8443(2006)5[239:IAPMAF]2.0.CO;2
Eckert K. L., Eckert A. E. (2019). An Atlas of Sea Turtle Nesting Habitat for the Wider Caribbean Region. Revised Edition. Godfrey, Illinois: WIDECAST Technical Report No. 19, 232.
Evans D. R., Valverde R. A., Ordoñez C., Carthy R. R. (2021). Identification of the gulf of Mexico as an important high-use habitat for leatherback turtles from central America. Ecosphere 12 (8), 14. doi: 10.1002/ecs2.3722
Faugeras B., Maury O. (2007). Modeling fish population movements: From an individual-based representation to an advection–diffusion equation. J. Theor. Biol. 247 (4), 837–848. doi: 10.1016/j.jtbi.2007.04.012
Ferry N., Parent L., Garric G., Barnier B., Jourdain N. C., Mercator Ocean Team (2010). Mercator Global eddy permitting ocean reanalysis GLORYS1V1: Description and results. Mercator Ocean Q. Newslett. 36, 15–27.
Finkbeiner E. M., Wallace B. P., Moore J. E., Lewison R. L., Crowder L. B., Read A. J. (2011). Cumulative estimates of sea turtle bycatch and mortality in USA fisheries between 1990 and 2007. Biol. Conserv. 144 (11), 2719–2727. doi: 10.1016/j.biocon.2011.07.033
Gallaway B. J., Raborn S. W., Picariello L., Putman N. F. (2020). Changes in shrimping effort in the gulf of Mexico and the impacts to red snapper. IScience 23 (5), 101111. doi: 10.1016/j.isci.2020.101111
Gaspar P., Benson S., Dutton P., Réveillère A., Jacob G., Meetoo C., et al. (2012). Oceanic dispersal of juvenile leatherback turtles: Going beyond passive drift modeling. Mar. Ecol. Prog. Ser. 457, 265–284. doi: 10.3354/meps09689
Gaspar P., Lalire M. (2017). A model for simulating the active dispersal of juvenile sea turtles with a case study on western pacific leatherback turtles. PLos One 12 (7), e0181595. doi: 10.1371/journal.pone.0181595
Godley B., Blumenthal J., Broderick A., Coyne M., Godfrey M., Hawkes L., et al. (2008). Satellite tracking of sea turtles: Where have we been and where do we go next? Endangered Species Res. 4, 3–22. doi: 10.3354/esr00060
Hays G. C. (2000). The implications of variable remigration intervals for the assessment of population size in marine turtles. J. Theor. Biol. 206 (2), 221–227. doi: 10.1006/jtbi.2000.2116
Hays G. C., Fossette S., Katselidis K. A., Mariani P., Schofield G. (2010). Ontogenetic development of migration: Lagrangian drift trajectories suggest a new paradigm for sea turtles. J. R. Soc. Interface 7 (50), 1319–1327. doi: 10.1098/rsif.2010.0009
Hazen E., Maxwell S., Bailey H., Bograd S., Hamann M., Gaspar P., et al. (2012). Ontogeny in marine tagging and tracking science: Technologies and data gaps. Mar. Ecol. Prog. Ser. 457, 221–240. doi: 10.3354/meps09857
Heppell S. S., Snover M. L., Crowder L. B. (2003). “Sea Turtle population ecology,” in Biology of Sea turtles: Vol. II. Eds. Lutz P., Wyneken J., Musick. J. A. (Boca Raton, FL, USA: CRC Press). 275–306.
James M. C., Mrosovsky N. (2004). Body temperatures of leatherback turtles ( Dermochelys coriacea ) in temperate waters off Nova Scotia, Canada. Can. J. Zoology 82 (8), 1302–1306. doi: 10.1139/z04-110
Jones T. T., Hastings M. D., Bostrom B. L., Pauly D., Jones D. R. (2011). Growth of captive leatherback turtles, dermochelys coriacea, with inferences on growth in the wild: Implications for population decline and recovery. J. Exp. Mar. Biol. Ecol. 399 (1), 84–92. doi: 10.1016/j.jembe.2011.01.007
Jones T. T., Salmon M., Wyneken J., Johnson C. (2000). Rearing leatherback hatchlings: Protocols, growth and survival. Mar. Turtle Newslett. 90, 3–6.
Lalire M., Gaspar P. (2019). Modeling the active dispersal of juvenile leatherback turtles in the north Atlantic ocean. Movement Ecol. 7 (1), 7. doi: 10.1186/s40462-019-0149-5
Leary T. R. (1957). A schooling of leatherback turtles, dermochelys coriacea coriacea, on the Texas coast. Copeia 1957 (3), 232. doi: 10.2307/1439367
Lewison R. L., Freeman S. A., Crowder L. B. (2004). Quantifying the effects of fisheries on threatened species: The impact of pelagic longlines on loggerhead and leatherback sea turtles: Fisheries effects on sea turtles. Ecol. Lett. 7 (3), 221–231. doi: 10.1111/j.1461-0248.2004.00573.x
Mazaris A. D., Broder B., Matsinos Y. G. (2006). An individual based model of a sea turtle population to analyze effects of age dependent mortality. Ecol. Model. 198 (1–2), 174–182. doi: 10.1016/j.ecolmodel.2006.04.012
Mrosovsky N., Ryan G. D., James M. C. (2009). Leatherback turtles: The menace of plastic. Mar. pollut. Bull. 58 (2), 287–289. doi: 10.1016/j.marpolbul.2008.10.018
National Marine Fisheries Service, U.S. Fish and Wildlife Service (2020). Endangered Species Act status review of the leatherback turtle (Dermochelys coriacea,). Report to the National Marine Fisheries Service Office of Protected Resources and U.S. Fish and Wildlife Service.
National Research Council (U.S.), Committee on the Review of Sea-Turtle Population Assessment Methods, National Academy of Sciences (U.S.), United States, National Oceanic and Atmospheric Administration (2010). Assessment of Sea-turtle status and trends: Integrating demography and abundance. (Washington, D.C., USA: National Academies Press). Available at: http://public.eblib.com/choice/publicfullrecord.aspx?p=3378665.
Northwest Atlantic Leatherback Working Group (2018). Northwest Atlantic Leatherback turtle (Dermochelys coriacea) status assessment, Wallace B., Eckert K.. Conservation Science Partners and the Wider Caribbean Sea Turtle Conservation Network (WIDECAST). Godfrey, Illinois: WIDECAST Technical Report No. 16. 36
Northwest Atlantic Leatherback Working Group (2019). “Dermochelys coriacea (Northwest Atlantic ocean subpopulation),” in The IUCN red list of threatened species 2019 (International Union for Conservation of Nature), 16. doi: 10.2305/IUCN.UK.2019-2.RLTS.T46967827A83327767.en
Piacenza S. E., Richards P. M., Heppell S. S. (2019). Fathoming sea turtles: Monitoring strategy evaluation to improve conservation status assessments. Ecol. Appl 29 (6), 1300–1315. doi: 10.1002/eap.1942
Pritchard P. C. H. (1976). Post-nesting movements of marine turtles (Cheloniidae and dermochelyidae) tagged in the guianas. Copeia 1976 (4), 749. doi: 10.2307/1443458
Putman N. F., Seney E. E., Verley P., Shaver D. J., López-Castro M. C., Cook M., et al. (2020). Predicted distributions and abundances of the sea turtle ‘lost years’ in the western north Atlantic ocean. Ecography 43 (4), 506–517. doi: 10.1111/ecog.04929
Richardson P. L. (2005). Caribbean Current and eddies as observed by surface drifters. Deep Sea Res. Part II: Topical Stud. Oceanography 52 (3–4), 429–463. doi: 10.1016/j.dsr2.2004.11.001
Saba V. S., Spotila J. R., Chavez F. P., Musick J. A. (2008). Bottom-up and climatic forcing on the worldwide population of leatherback turtles. Ecology 89 (5), 1414–1427. doi: 10.1890/07-0364.1
Sasso C. R., Richards P. M., Benson S. R., Judge M., Putman N. F., Snodgrass D., et al. (2021). Leatherback turtles in the Eastern gulf of Mexico: Foraging and migration behavior during the autumn and winter. Front. Mar. Sci. 8. doi: 10.3389/fmars.2021.660798
Schroeder B., Murphy S. (1999). Population surveys (ground and aerial) on nesting beaches. Research and management techniques for the conservation of Sea turtles. IUCN/SSC Mar. Turtle Specialist Group 4, 45–55.
Scott R. B., Ferry N., Drévillon M., Barron C. N., Jourdain N. C., Lellouche J.-M., et al. (2012). Estimates of surface drifter trajectories in the equatorial Atlantic: A multi-model ensemble approach. Ocean Dynamics 62 (7), 1091–1109. doi: 10.1007/s10236-012-0548-2
Scott R., Marsh R., Hays G. (2014). Ontogeny of long distance migration. Ecology 95 (10), 2840–2850. doi: 10.1890/13-2164.1
Soloviev A. V., Hirons A., Maingot C., Dean C. W., Dodge R. E., Yankovsky A. E., et al. (2017). Southward flow on the western flank of the Florida current. Deep Sea Res. Part I: Oceanographic Res. Papers 125, 94–105. doi: 10.1016/j.dsr.2017.05.002
Soslau G., Wallace B., Vicente C., Goldenberg S. J., Tupis T., Spotila J., et al. (2004). Comparison of functional aspects of the coagulation cascade in human and sea turtle plasmas. Comp. Biochem. Physiol. Part B: Biochem. Mol. Biol. 138 (4), 399–406. doi: 10.1016/j.cbpc.2004.05.004
Spotila J. R., Dunham A. E., Leslie A. J., Steyermark A. C., Plotkin P. T., Paladino F. V. (1996). Worldwide population decline of dermochelys coriacea: Are leatherback turtles going extinct? Chelonian Conserv. Biol. 2 (2), 209–222.
Stalcup M. C., Metcalf W. G. (1972). Current measurements in the passages of the lesser antilles. J. Geophysical Res. 77 (6), 1032–1049. doi: 10.1029/JC077i006p01032
Stewart K. R., LaCasella E. L., Roden S. E., Jensen M. P., Stokes L. W., Epperly S. P., et al. (2016). Nesting population origins of leatherback turtles caught as bycatch in the US pelagic longline fishery. Ecosphere 7 (3), 18. doi: 10.1002/ecs2.1272/full
Tiwari M., Wallace B. P., Girondot M. (2013). “Dermochelys coriacea (Northwest Atlantic ocean subpopulation),” in The IUCN red list of threatened species 2013. (Cambridge, U.K.: International Union for Conservation of Nature). doi: 10.2305/IUCN.UK.2013-2.RLTS.T46967827A46967830.en
Torres R. R., Tsimplis M. N. (2012). Seasonal sea level cycle in the Caribbean Sea: SEASONAL CYCLE IN THE CARIBBEAN SEA. J. Geophysical Research: Oceans 117 (C7), 18. doi: 10.1029/2012JC008159
Valverde R. A., Holzwart K. R. (2017). Sea Turtles of the Gulf of Mexico. In Ward C. (Ed.), Habitats and Biota of the Gulf of Mexico: Before the Deepwater Horizon Oil Spill 1189–1351. (New York: Springer). doi: 10.1007/978-1-4939-3456-0_3
van Sebille E., Griffies S. M., Abernathey R., Adams T. P., Berloff P., Biastoch A., et al. (2018). Lagrangian Ocean analysis: Fundamentals and practices. Ocean Model. 121, 49–75. doi: 10.1016/j.ocemod.2017.11.008
Vukovich F. M. (2007). Climatology of ocean features in the gulf of Mexico using satellite remote sensing data. J. Phys. Oceanography 37 (3), 689–707. doi: 10.1175/JPO2989.1
Vukovich F. M. (2012). Changes in the loop current’s eddy shedding in the period 2001–2010. Int. J. Oceanography 2012, 1–18. doi: 10.1155/2012/439042
Weisberg R. H., Liu Y. (2017). On the loop current penetration into the gulf of Mexico. J. Geophysical Research: Oceans 122 (12), 9679–9694. doi: 10.1002/2017JC013330
Keywords: leatherback turtle, juvenile, dispersal, migration, individual-based-model, North Atlantic Ocean, Caribbean Sea, Gulf of Mexico
Citation: Gaspar P, Candela T and Shillinger GL (2022) Dispersal of juvenile leatherback turtles from different Caribbean nesting beaches: A model study. Front. Mar. Sci. 9:959366. doi: 10.3389/fmars.2022.959366
Received: 01 June 2022; Accepted: 27 September 2022;
Published: 18 October 2022.
Edited by:
Guillermo Luna-Jorquera, Universidad Católica del Norte, ChileReviewed by:
Gail Schofield, Queen Mary University of London, United KingdomCopyright © 2022 Gaspar, Candela and Shillinger. This is an open-access article distributed under the terms of the Creative Commons Attribution License (CC BY). The use, distribution or reproduction in other forums is permitted, provided the original author(s) and the copyright owner(s) are credited and that the original publication in this journal is cited, in accordance with accepted academic practice. No use, distribution or reproduction is permitted which does not comply with these terms.
*Correspondence: Philippe Gaspar, cGdhc3BhckBtZXJjYXRvci1vY2Vhbi5mcg==
Disclaimer: All claims expressed in this article are solely those of the authors and do not necessarily represent those of their affiliated organizations, or those of the publisher, the editors and the reviewers. Any product that may be evaluated in this article or claim that may be made by its manufacturer is not guaranteed or endorsed by the publisher.
Research integrity at Frontiers
Learn more about the work of our research integrity team to safeguard the quality of each article we publish.