 Xin Wang
 Mengjiao Qin1,2
 Zhe Zhang
 Yuanyuan Wang
 Zhenhong Du
- 1School of Earth Sciences, Zhejiang University, Hangzhou, China
- 2Zhejiang Provincial Key Laboratory of Geographic Information Science, School of Earth Sciences, Zhejiang University, Hangzhou, China
- 3Ocean Academy, Zhejiang University, Zhoushan, China
- 4College of Science and Technology, Ningbo University, Ningbo, China
- 5Ningbo Bay Area Development Research Base, Ningbo, China
Typhoons threaten individuals’ lives and property. The accurate prediction of typhoon activity is crucial for reducing those threats and for risk assessment. Satellite images are widely used in typhoon research because of their wide coverage, timeliness, and relatively convenient acquisition. They are also important data sources for typhoon cloud image prediction. Studies on typhoon cloud image prediction have rarely used multi-scale features, which cause significant information loss and lead to fuzzy predictions with insufficient detail. Therefore, we developed an enhanced multi-scale deep neural network (EMSN) to predict a 3-hour-advance typhoon cloud image, which has two parts: a feature enhancement module and a feature encode-decode module. The inputs of the EMSN were eight consecutive images, and a feature enhancement module was applied to extract features from the historical inputs. To consider that the images of different time steps had different contributions to the output result, we used channel attention in this module to enhance important features. Because of the spatially correlated and spatially heterogeneous information at different scales, the feature encode-decode module used ConvLSTMs to capture spatiotemporal features at different scales. In addition, to reduce information loss during downsampling, skip connections were implemented to maintain more low-level information. To verify the effectiveness and applicability of our proposed EMSN, we compared various algorithms and explored the strengths and limitations of the model. The experimental results demonstrated that the EMSN efficiently and accurately predicted typhoon cloud images with higher quality than in the literature.
1 Introduction
Typhoons are synoptic-scale storms that originate in the tropical oceans. They absorb large amounts of water vapor from warm tropical oceans that condense at high altitudes and form a low-pressure center (Anduaga, 2019). As the pressure changes and the earth moves, the incoming air swirls, resulting in a tropical cyclone that can eventually evolve into a typhoon if the sea temperature is sufficiently high. Typhoons are one of the most destructive weather events in coastal areas (Defu et al., 2009) and can cause direct disasters, such as gales, rainstorms, and storm surges, as well as secondary disasters, such as floods, landslides, and mudslides, all of which seriously threaten the safety of individuals and property (Zhang and Chen, 2019; Yu et al., 2020; Jia et al., 2020). During 1970–2010, there were 637 landfalling typhoons worldwide, 195 of which reached major intensity (Weinkle et al., 2012). The average number of typhoons in individual countries is 46 per year, and many typhoons affect multiple countries (Shultz et al., 2005). In addition, the intensity of typhoons is likely to increase (Hoque et al., 2017). Therefore, typhoon research is essential to reducing the damage from typhoon disasters. In addition to developing and establishing typhoon engineering works and reinforcing defenses, accurately predicting typhoon activity is the most fundamental measure.
Typhoons are large-scale meteorological systems that require the observation of vast geographical areas. They also demand real-time responsiveness to minimize damage. Based on these considerations, satellite data are highly suitable for typhoon research owing to their wide coverage, timeliness, and relatively convenient acquisition. Satellite-based techniques have been an effective means of typhoon research because the movement and density of typhoons can be determined based on cloud patterns. Specifically, the outer bands of cumulonimbus clouds indicate the direction of movement, and the cloud pattern surrounding the typhoon eye reflects the location and intensity of the typhoon (Kovordányi and Chandan, 2009). Meteorologists use satellite images to analyze and predict various aspects of typhoons. Zhang et al. (2005) located typhoons using a rotational location method by finding feature points. Jaiswal et al. (Neeru and Kishtawal, 2010) used the helix fitting method to determine typhoon centers based on the special structure of mature typhoons. In addition to traditional morphological methods, deep learning technologies have been used for typhoon detection and location. Wang et al. (Wang et al., 2021) detected typhoon centers using a fast R-CNN. Because typhoons can be located using satellite images, typhoon tracks can also be calculated using imaging sequences. Hong et al. (2017) predicted the typhoon position from a single satellite image and then calculated the typhoon track based on subsequent consecutive images. Thus, future typhoon behavior can be predicted using continuous satellite images.
With the development of artificial intelligence, image prediction technology has significantly improved. For example, convolutional neural networks are a widely used deep learning method for extracting spatial features and are extensively used in image research (Khan et al., 2020). Sequence-learning problems are often solved using recurrent neural networks (RNNs) (Salehinejad et al., 2017). Based on RNNs, Ranzato et al. (2014) presented a recurrent convolutional neural network architecture that connects convolutional layers at the beginning and end of an RNN. Shi et al. (Xingjian et al., 2015) proposed a convolutional LSTM (ConvLSTM) architecture and combined convolutional and recurrent layers to extract dynamic temporal and spatial information. They later proposed a new model, trajectory GRU (TrajGRU), which dynamically learns the location-variant structure of recurrent connections (Shi et al., 2017). Based on ConvLSTM, Wang et al. (2017) proposed a new structure called spatiotemporal LSTM (ST-LSTM), in which spatial and temporal information can be stored simultaneously. Autoencoders (Tschannen et al., 2018) and generative adversarial networks (GANs) (Zhaoqing et al., 2019) are also widely used for image and video prediction. However, because of the absence of high-quality processed satellite datasets and the complex evolution of satellite images (Moskolaï et al., 2021), predicting satellite data remains difficult, and simply applying the image prediction models to this problem cannot yield satisfactory results.
For example, Xu et al. (2019) combined WGAN and LSTM to predict satellite images, but their evaluation method only evaluates the shape of clouds, not their density. Hong et al. suggested an autoencoder model that uses convolutional and ConvLSTM layers to extract features and generate future satellite images. Their study also explored the application of LSTM and ConvLSTM in the model and found that the former was unsuitable for feature extraction from images, which also called into question the efficacy of the model of (Xu et al., 2019) in overcoming the satellite image prediction problem. However, the spatial resolution of the satellite data used in their research was too low to observe clouds. Lee et al. (2019) referred to (Hong et al., 2017b) and proposed an advanced model with better image prediction than those in (Xu et al., 2019) and (Hong et al., 2017b), but it was insufficient. Typhoon research involves large-scale problems that require downsampling operations to mitigate calculation costs. However, repeated downsampling of data results in the loss of detail and the production of poor-quality predicted images. Notably, satellite image prediction models rarely consider this factor.
To solve this problem, we constructed an enhanced multi-scale deep neural network (EMSN) with a feature enhancement method and a multi-scale feature fusion strategy to discover the relationships between historical and future images and predict clearer typhoon cloud images than in the literature. Through the channel attention mechanism, the network extract features from the input images and focuses on important features. Next, the encode-decode module captures the spatiotemporal relationships of the enhanced features at different scales. Additionally, to further improve the quality of the predicted images, we used skip connections between the encoder and decoder to account for information loss caused by downsampling.
A summary of the contributions of this study is as follows:
(1) Input images from different time steps have different contributions to the model. Hence, we designed a feature enhancement module that uses a channel attention module to extract useful characteristics to enhance important features and suppress useless features.
(2) To consider the variability of typhoon motion and the complexity of feature maps, we designed a symmetrical encode-decode module to capture spatiotemporal rules. A multi-scale feature fusion strategy was implemented to reduce information loss during downsampling and fully use the features of different scales.
(3) Based on the steps, we propose a novel EMSN to predict typhoon cloud images. Extensive experiments based on the Himawari 8 dataset demonstrate the effectiveness of the proposed model.
The remainder of this paper is organized as follows: Section 2 describes the problem and introduces the dataset and the proposed network for typhoon cloud image prediction. Section 3 describes the experiments conducted to demonstrate the effectiveness of the proposed model and discusses the results, and Section 4 presents the conclusions.
2 Methodology
In this section, we describe the data and network structure used in this study. Specifically, we model the typhoon cloud image prediction problem, introduce the study data, area, and our proposed network, and describe the experimental environment.
2.1 Statement of the problem
Typhoon cloud image prediction can be regarded as a video prediction problem for forecasting subsequent frames based on previously observed frames. Our observation area was an M × N grid, and we used the vector I ∈ RM × N to represent the satellite image. We recorded j observed satellite images as X = {It − j + 1,…,It − 1} and used Y = {It + 1,…,It + k} to represent the next k frames generated by the prediction model; represents the corresponding ground truth frames.
Therefore, our prediction problem was modeled as a pixel-to-pixel regression problem from X to Y , which aimed to minimize the error between Y and as follows:
2.2 Dataset and study area
Our research was based on satellite images from Japan’s eighth geostationary meteorological satellite, Himawari 8, which generates images with spatial resolutions of 2 km (6,001 × 6,001) and 5km (2,401 × 2,401) every 10 min. The Advanced Himawari Imager on Himawari 8 has 16 bands: three visible bands, three near-infrared bands, and 10 infrared bands (Bessho et al., 2016).
In general, according to the wavelength range, satellite cloud images can be divided into visible light, water vapor, and infrared images (Figure 1). Visible images have the clearest cloud texture, but visible bands can only be measured during the daytime. Water vapor images only reflect water vapor information in the upper-middle troposphere. Infrared bands most effectively detect clouds of various layers at any time of day and are suitable for our research. Our work focuses more on building a model for typhoon cloud image prediction than exploring the differences between infrared bands. To conduct calculations efficiently, we used band 13 as the source of experimental data.
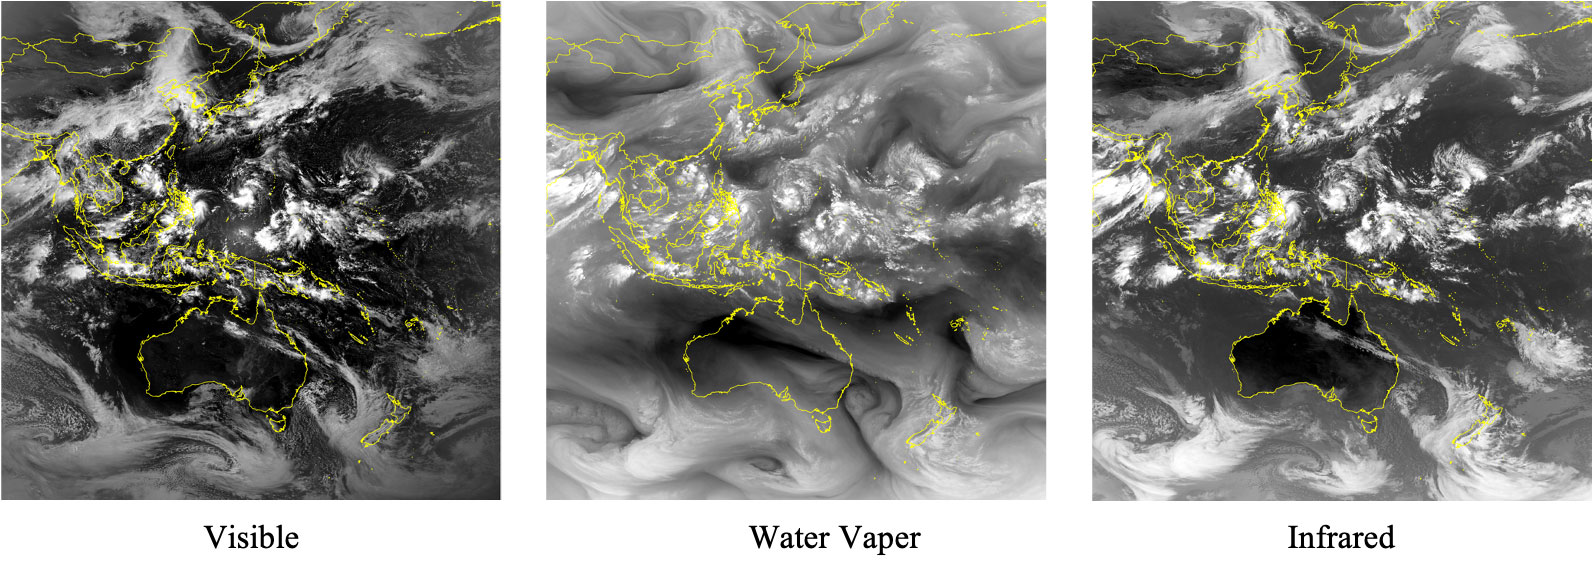
Figure 1 Satellite images of H8: left, a visible image; middle, a water vapor image; and right, an infrared image. The country borders in yellow show the spatial scale of the satellite data.
Our study aimed to predict future satellite images and observe typhoon activity. Hence, we used only satellite images of typhoon clouds. Data were collected between July 2015 and October 2021, and they comprised 145 typhoons (Japan Meteorological Agency (JMA), 2018). At each location, observations were made at 6-hour intervals. However, because typhoons occurred between these observations, we filtered typhoon-related satellite images at 1-hour intervals. The geographical range of an H8 image is between 60°S–60°N latitude and 80°E–160°W longitude and includes many areas where typhoons have never occurred. Thus, we used part of the Northwest Pacific to collect observations (15°S–50°N, 100°E–165°E) because strong typhoons frequently occur in this area (Figure 2).
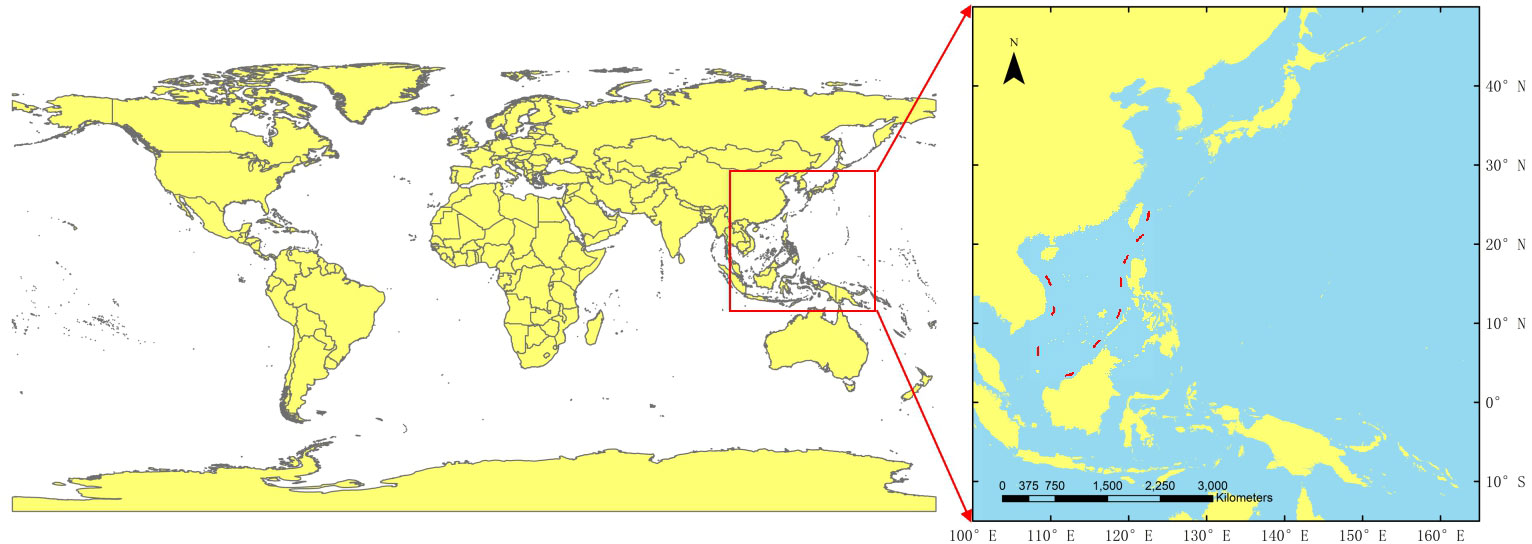
Figure 2 Research area map. Part of the Northwest Pacific (15°S–50°N, 100°E–165°E).
2.3 Data processing
Satellite images inevitably have some missing data; thus, we filtered the abnormal data. After sorting by time, the sliding window method was used to create the dataset. A time interval of 3 h (Xu et al., 2019) was used to build sequences. We used this interval because it contained more variation between two adjacent satellite images than the 1-hour interval did (Hong et al., 2017b) and used less training time for the model than the 6-hour interval did (Rüttgers et al., 2019). To determine the hyperparameter of the historical frames (denoted by m ), we trained and tested cases with m = 4 (Rüttgers et al., 2019), 6 (Hong et al., 2017b), 8 (Xu et al., 2019), and 10. For each case, we used an ( m + 1 )-frame wide sliding window and an (m/2) -frame sliding step to create the sequences. Ultimately, m = 8 produced the best results. In the cases of m = 4 and 6, the movement of typhoons was not sufficiently captured; for m = 10, model performance worsened owing to the reduced size of the training dataset. Therefore, we used a 9-frame wide sliding window and a 4-frame sliding step to create the sequences. The resulting dataset contained 5,160 sequences, each comprising eight input frames and one ground truth. These sequences were then divided into training, validation, and test datasets at a ratio of 6:2:2 (i.e., 3,096 for training, 1,032 for validation, and 1,032 for testing).
The original pixel size of H8 satellite images would have caused memory limitations; thus, we resized the images to 481 × 481 pixels and selected patches of 260 × 260 pixels that corresponded to the research area (15°S–50°N, 100°E–165°E). To facilitate multiple downsamplings in the experiments, we cropped the data to 256 × 256 pixels from the upper left corner before normalizing the training, validation, and test datasets by setting to accelerate model convergence.
2.4 Network structure
2.4.1 Overview
We used several lightweight modules to build the model, considering its effectiveness in practical applications. As shown in Figure 3, the proposed EMSN used eight observed satellite images (i.e., t1,t2,…,t8 ) as inputs and predicted the subsequent image (i.e., t9 ) as output. EMSN consists of mainly of feature enhancements and encode–decode modules.
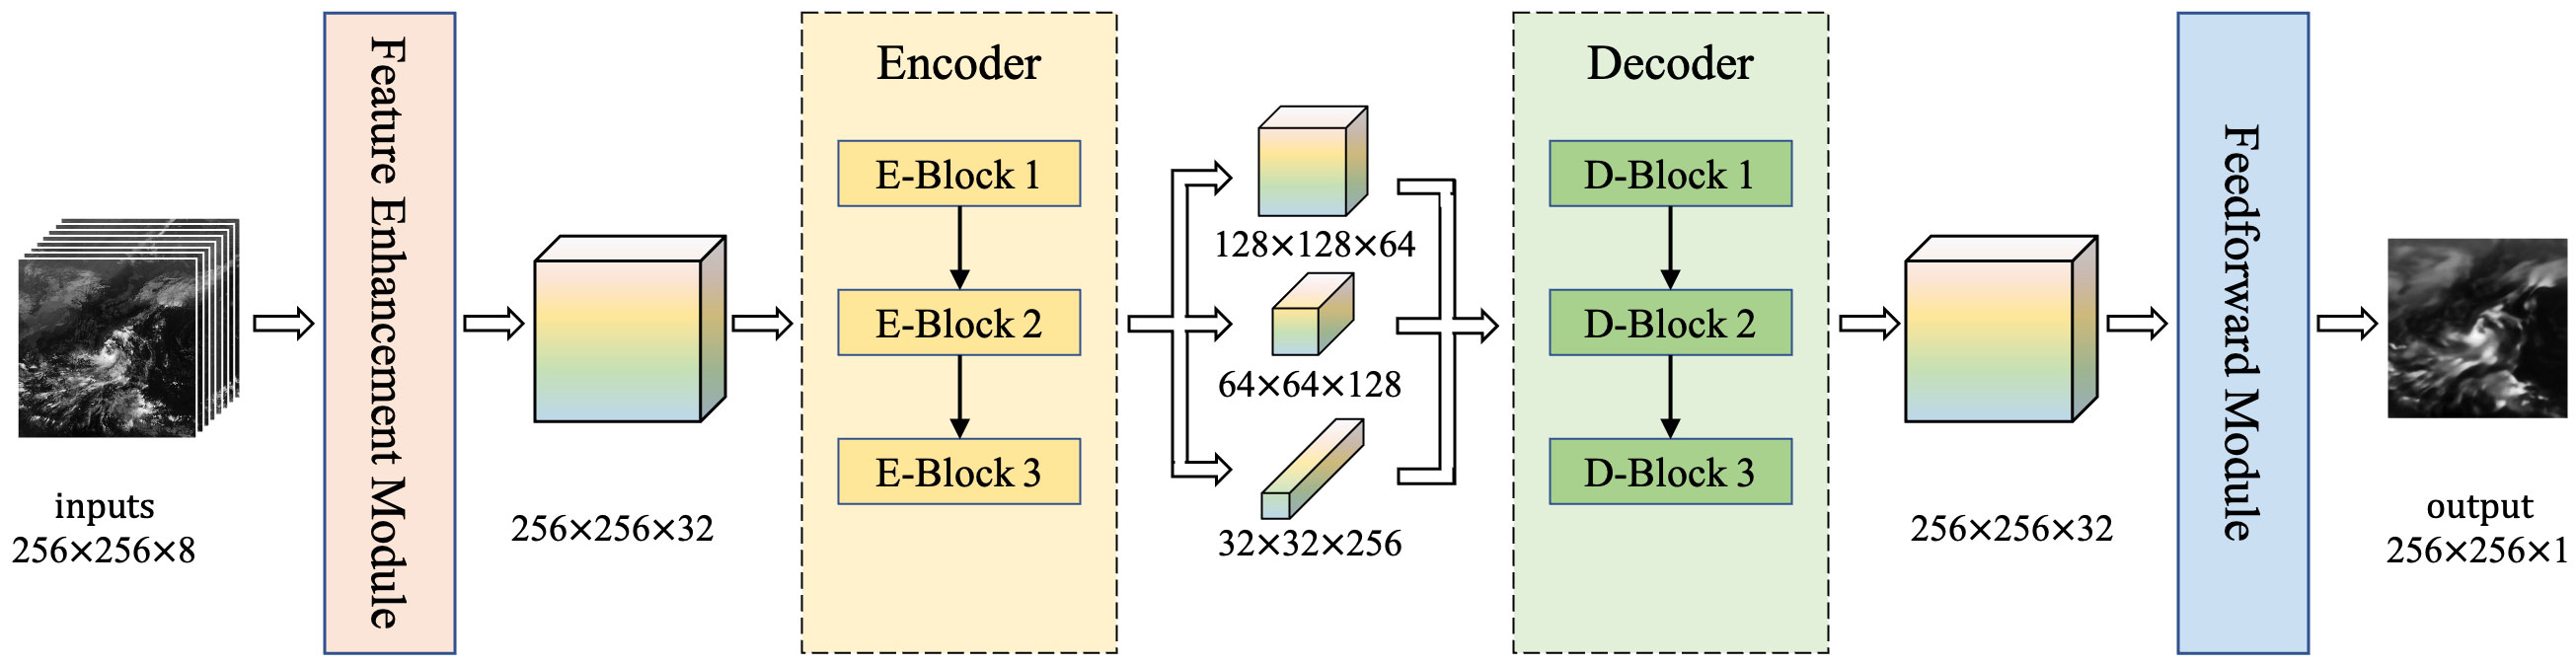
Figure 3 Overview of EMSN. EMSN consists of a feature enhancement module, encode–decode module, and feedforward module.
The feature enhancement module is a preprocessing module that receives inputs and obtains a set of enhanced feature maps. Subsequently, the encode–decode module captures the spatiotemporal relationships of the feature maps and encodes them into hidden states, which are decoded into the output image. The detailed structure of the proposed network is listed in Table 1.
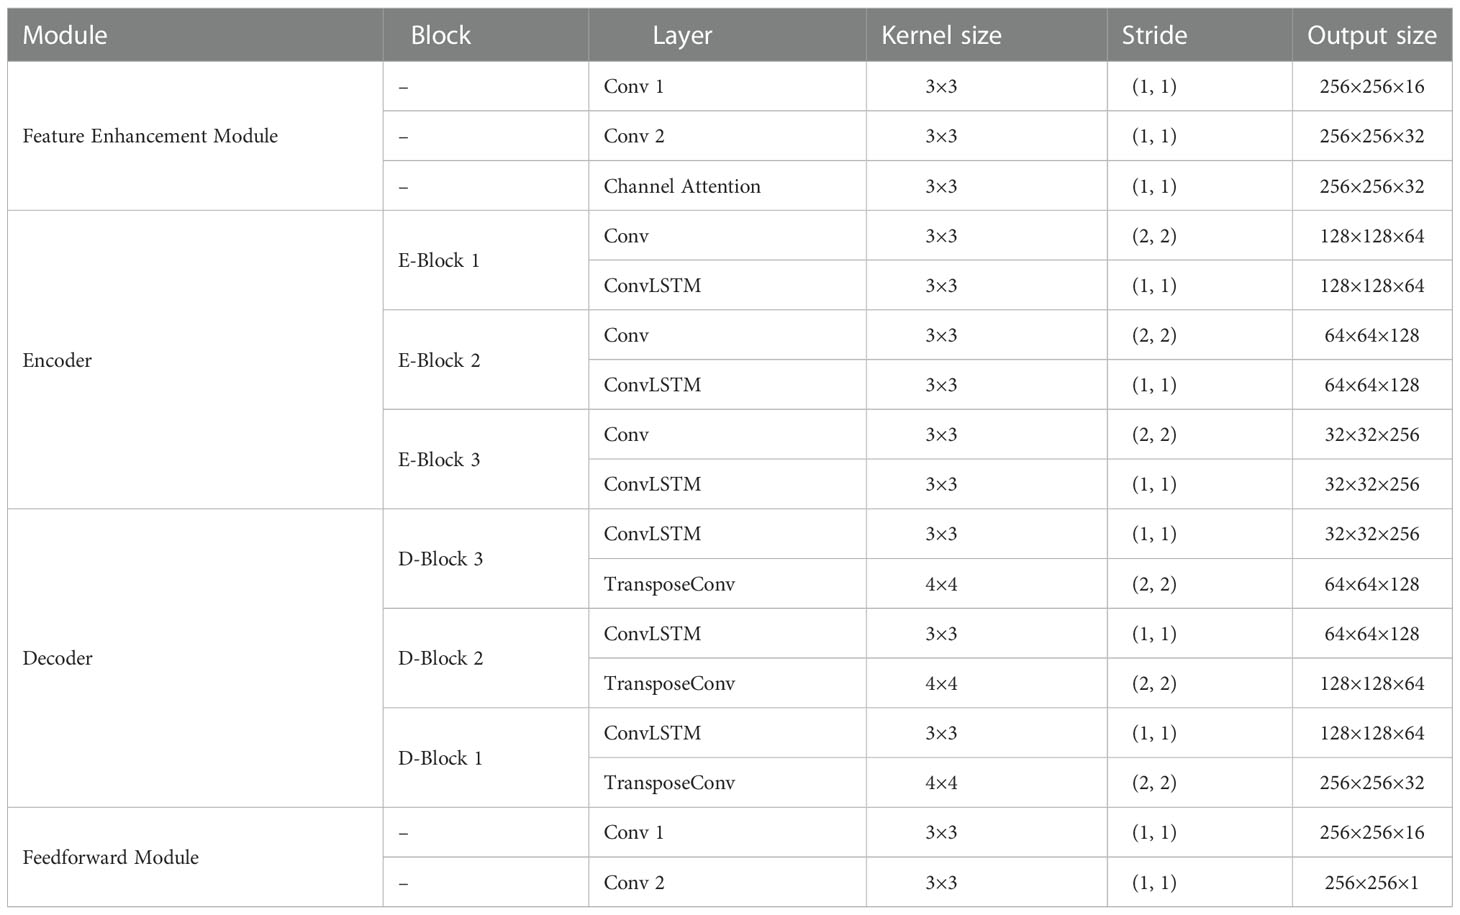
Table 1 Architecture of EMSN.
2.4.2 Feature enhancement module
The feature enhancement module is the preprocessing module of the EMSN, which comprises two convolutional layers and a channel attention module. Figure 4 shows the module structure. First, the convolutional layers extract scale-invariant features from the input images. These feature maps have multiple channels, some of which are not useful. A channel attention module was implemented after the convolutional layers to enhance important features and suppress useless features. As shown in Figure 4, the channel attention we used was a squeeze-and-excitation network (Hu et al., 2018) that automatically determined the relevance of each channel and then assigned appropriate weights.
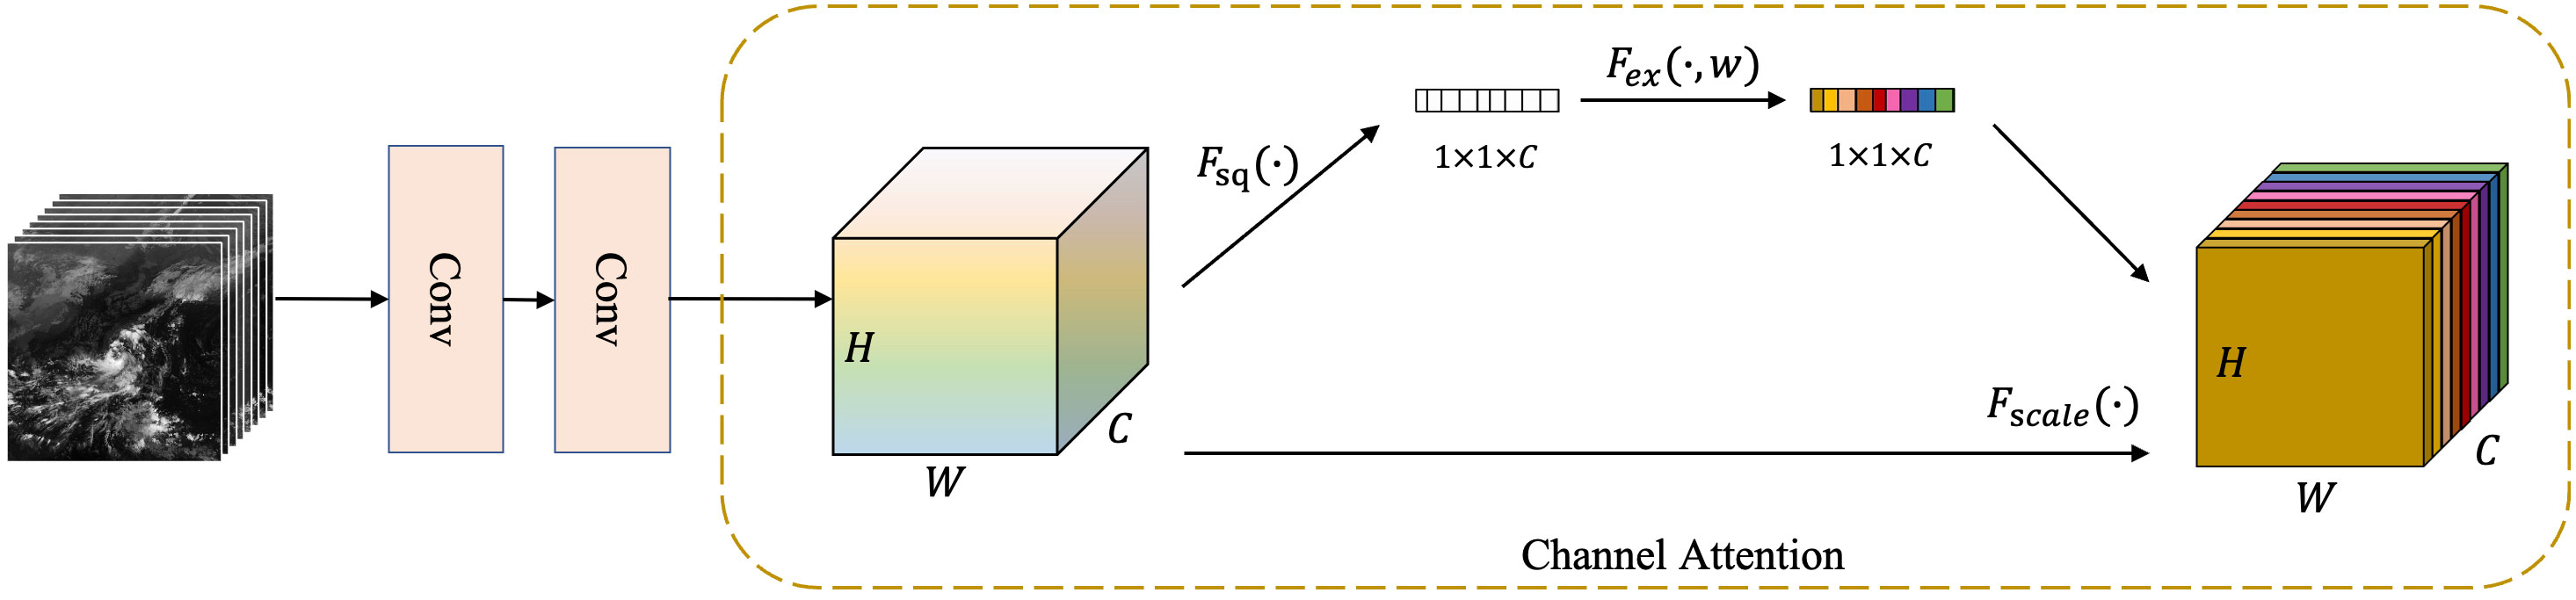
Figure 4 Feature enhancement module: two simple convolutional layers and a channel attention module.
2.4.3 Encode–decode module
The encode–decode module is the core of the EMSN and has two parts: the basic model and the multi-scale feature fusion module. The basic model is a symmetrical autoencoder. A multi-scale feature fusion module was applied between the encoder and decoder to pass the information on (Figure 5).
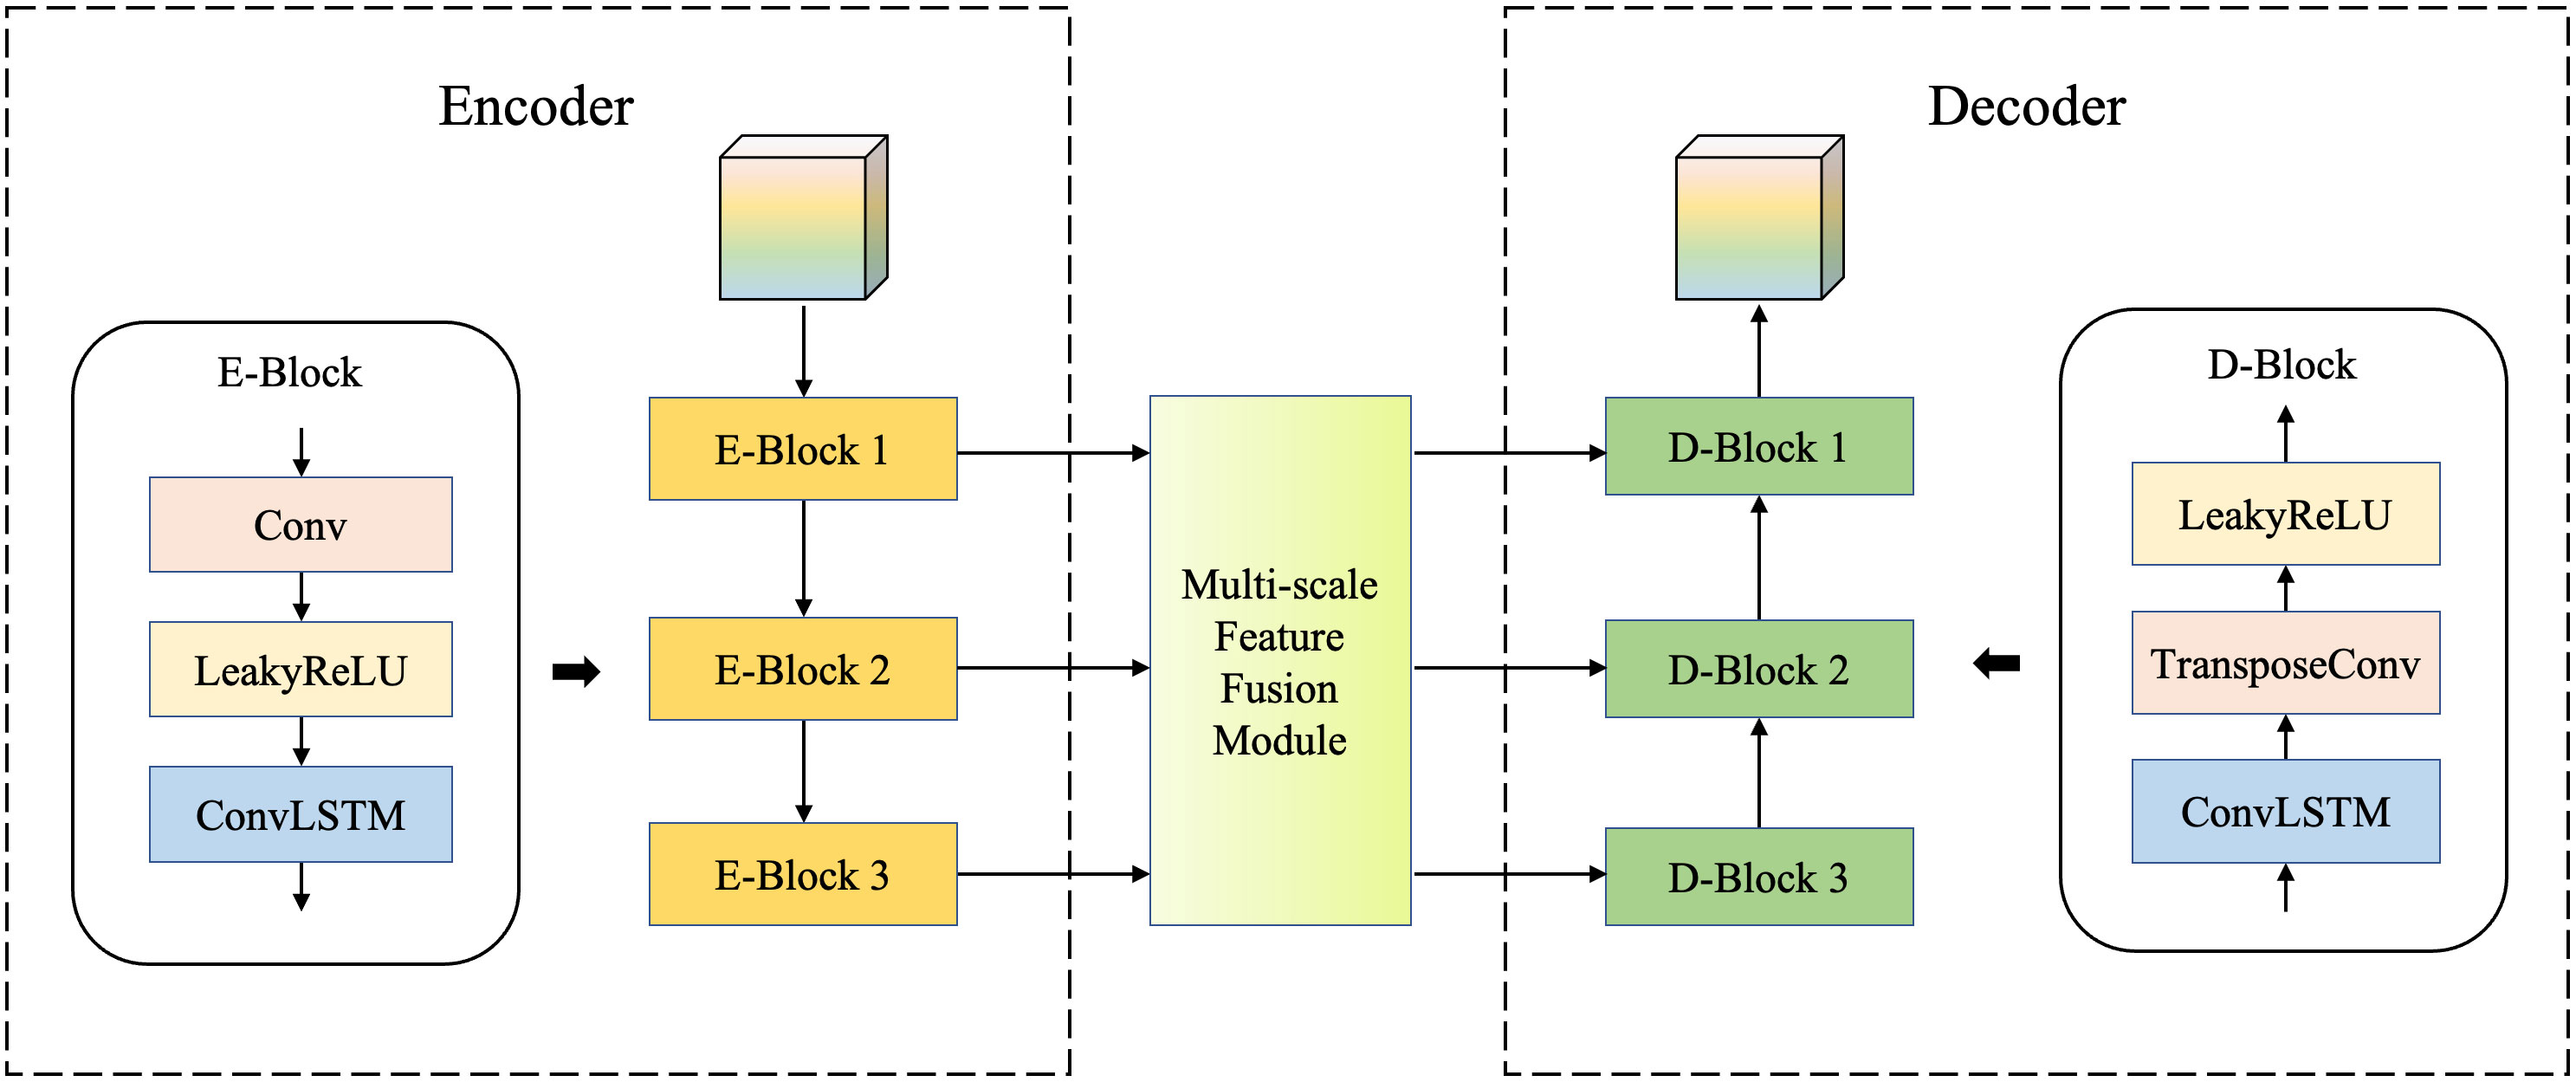
Figure 5 Encode–decode module. The symmetric basic model comprises convolutional layers and ConvLSTM layers. A multi-scale feature fusion module is added between the encoder and the decoder.
Both the encoder and decoder of the basic model consisted of three blocks, each of which had three layers: the convolutional layer (or transposed convolutional layer) for changing feature map sizes, the activation function layer for adding nonlinear factors, and the ConvLSTM layer to capture spatiotemporal relationships.
Owing to the large observation area and complex evolutionary rules of the typhoon cloud image sequences mentioned in Section 1, we used the multi-scale feature fusion module to acquire additional details. The inner structure of the module is shown in Figure 6.
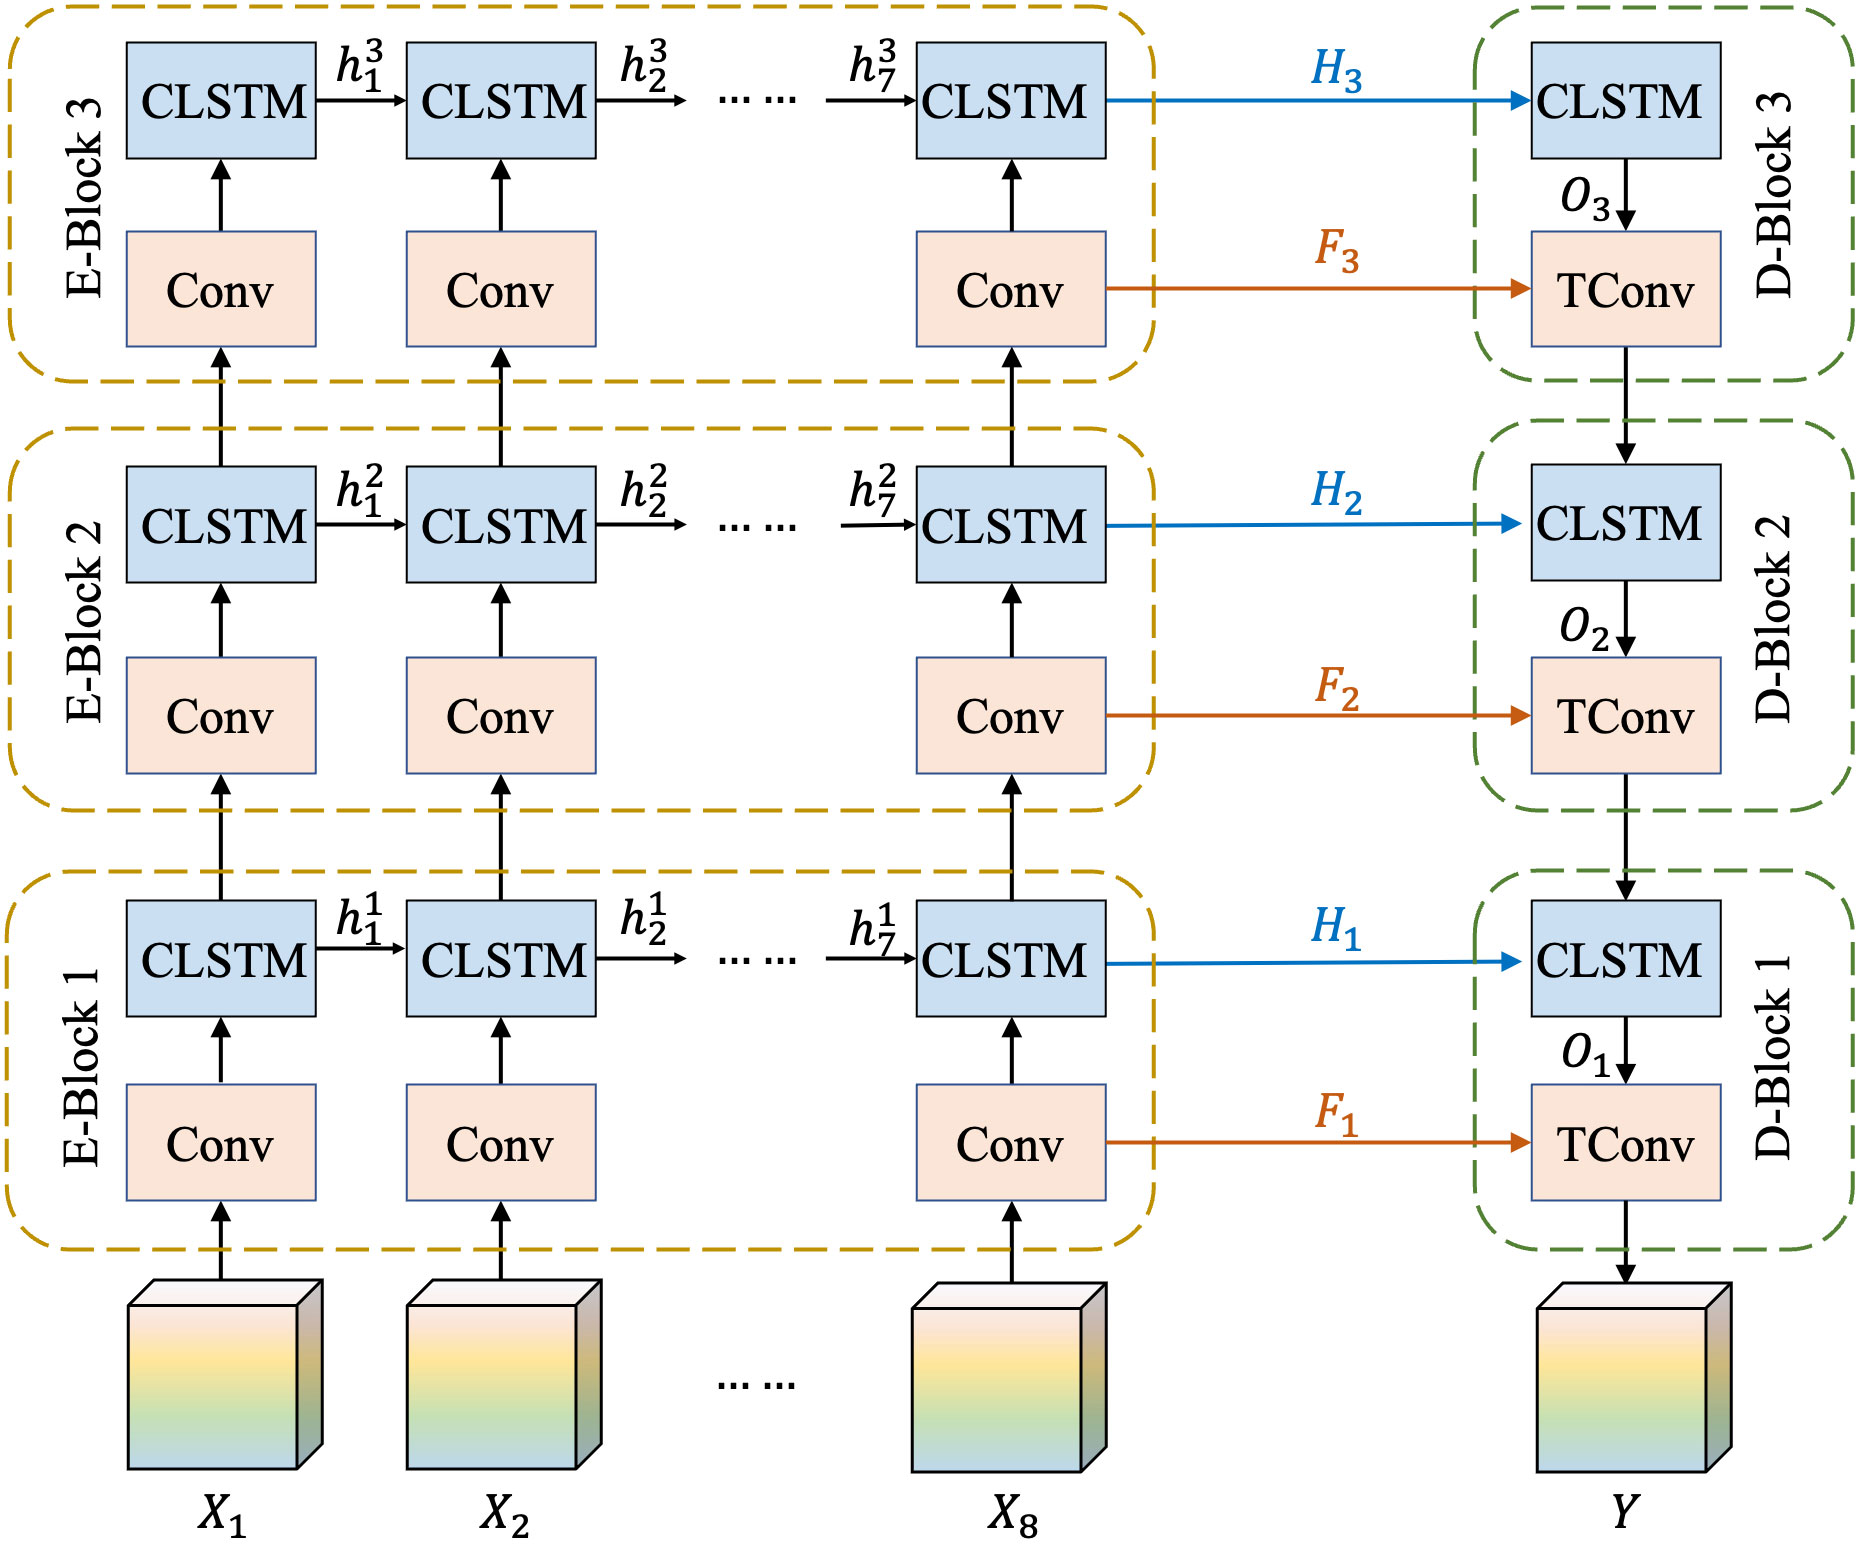
Figure 6 Inner structure of feature fusion module, including multi-scale spatiotemporal feature capturing and same-stage feature reusing.
As shown in Figure 6, the multi-scale feature fusion module has two parts: multi-scale spatiotemporal feature capturing and same-stage feature reuse. The encode–decode module uses {X1,X2,…,X8} as inputs, where Xi is the enhanced feature of the ith (i=1, 2,…, 8) observed image. Each time the data passed through the convolutional layer; the feature sizes were reduced by half. Thus, the resized features of the three different scales were obtained through the three blocks. These feature maps of different scales contain information at different granularities. As shown in Figure 6, these resized feature maps were passed through the ConvLSTM layers to learn spatiotemporal rules. In Figure 6, is the hidden state of the ith (i=1,2,…,7) input frame at the nth (n=1,2,3) ConvLSTM layer, which was used in the encoder to pass spatiotemporal information from the previous frame to the subsequent frame.
Downsampling of the encoder by convolutional layers results in the loss of information on typhoon clouds, and the feature maps obtained by multiple blocks are highly abstract. Therefore, we implemented the same-stage feature reuse strategy to use other low-level features in the decoder. In Figure 6, Hn is the hidden state of the last memory unit in the nth ConvLSTM layer (i.e., ), which is used as the input of the corresponding ConvLSTM unit in the decoder. Furthermore, Fn is the feature map of the last input frame at the nth convolution layer, and On is the output of the ConvLSTM layer in the nth block of the decoder . These values are then summed to acquire the new input of the convolution layers in the nth block of the decoder. Through the encode–decode module, both detailed information and global information were conserved, and the model generated a clear prediction frame.
2.5 Implementation details
We implemented all the models based on Python 3.8 with an NVIDIA GeForce RTX 3090 GPU card. We chose the Adam optimizer for gradient optimization, with a batch size of 16 and L1 loss. The initial learning rate was set to 1e−3, and the learning rate was reduced by half when the valid loss did not decrease over 10 epochs. The total training epoch was set to 500, with an early stopping strategy of 75 epochs.
3 Experiments and results
3.1 Evaluation metrics
The mean squared error (MSE), peak signal-to-noise ratio (PSNR), and structural similarity index (SSIM) were used to evaluate the performance of the models. We use and to denote prediction and ground truth, respectively. The criteria are expressed as follows:
where W and H are the width and height of the image, respectively; MAX is the maximum pixel value in the image; μp and μg are the average pixel values of p and g respectively; σp and σg are the variances of p and g , respectively; and σpg is the covariance of p and g . In addition, c1=(k1L)2 and c2=(k2L)2 both of which are constants used to maintain stability; L is the dynamic range of pixel values; and k1=0.01 and k2=0.03 .
MSE and PSNR are the most widely used image quality assessment algorithms and reflect the difference in pixel values. SSIM evaluates the structural similarity between two images. Small values of MSE or large values of PSNR and SSIM indicate that the predicted images are similar to the ground-truth images.
3.2 Experiments on the proposed network
In this section, we introduce the process of finding the best model structure and hyperparameters for our proposed EMSN. All models were trained using the same hyperparameters.
3.2.1 Exploration of the basic model
Because of the state-of-the-art performance achieved by using convolutional and ConvLSTM-based models (Lee et al., 2019), we analyzed various model structures and network hyperparameter settings of the convolutional and ConvLSTM networks. Table 2 lists the experimental results of the basic model under various settings.
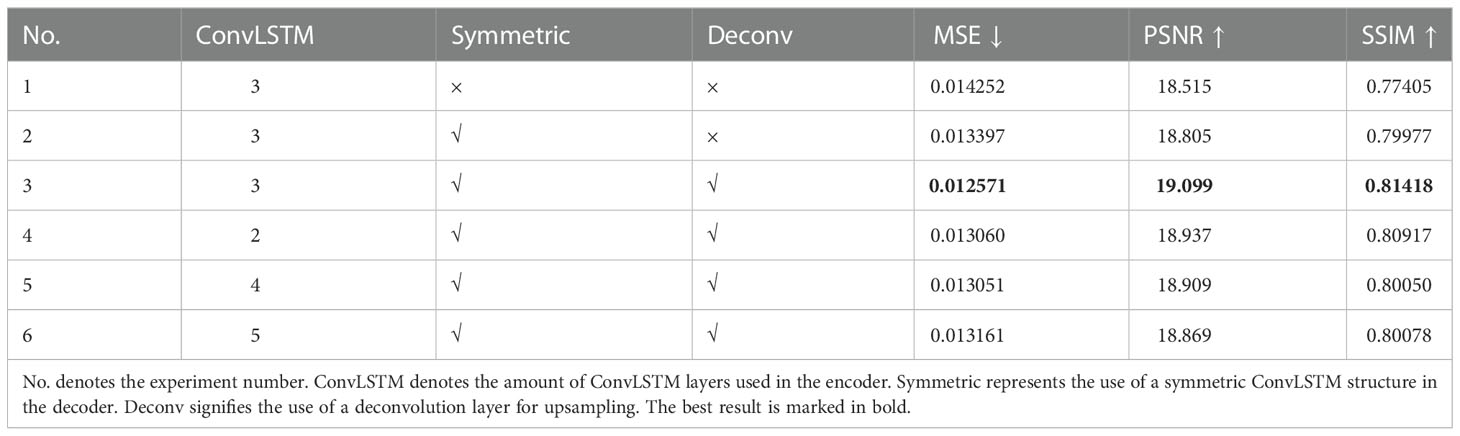
Table 2 Experimental results of basic model with various settings.
First, we reproduced the model proposed in (Lee et al., 2019), and experiment 1 used the structure of MCSIP’s satellite image predictor. Next, we gradually modified the model settings in MCSIP. As mentioned in Section 2.4.3, MCSIP is a feedforward neural network with a structure that results in inevitable information loss. In experiment 2, we applied the U-Net (Siddique et al., 2021) structure to the model. A symmetric three-layer ConvLSTM structure was added before upsampling, and the three hidden states of the encoder ConvLSTM layers were used as inputs to the decoder ConvLSTM layers. The results demonstrated that the hidden states of each ConvLSTM layer benefited the network, and their use in the decoder improved model performance. The MCSIP used nearest neighbor sampling to enlarge the image sizes but, experiment 3 used deconvolution layers. The results showed that deconvolution was superior to nearest neighbor interpolation in our model, possibly because the deconvolution layers dynamically learn the resizing parameters. We then compared the impacts of stacking different numbers of ConvLSTM layers on model performance. The results of experiments 3–6 revealed that the three-layer ConvLSTM module most effectively captured the spatiotemporal relationships among satellite images. As the number of ConvLSTM layers increased, model performance first improved before worsening after this optimum. This initial improvement in performance may have been due to increasing ConvLSTM layers, deepening the network, and—thus—strengthening its ability for nonlinear fitting. The later deterioration of performance may have been due to limited quantities of data and overfitting resulting from too many layers.
Based on our results, we applied the symmetric autoencoder as the basic structure of our model, in which the encoder uses five convolutional layers to downsample and three ConvLSTM layers to capture spatiotemporal relationships. The decoder uses three additional ConvLSTM layers and five deconvolution layers for upsampling.
3.2.2 Ablation experiments on multi-scale components
Typhoon cloud image prediction is a large-scale problem. Features of different scales that contain different information are obtained through convolution layers. Using features computed at multiple scales facilitates detailed predictions. Therefore, to fuse these features, we attempted to add several components to the basic model, the experimental results of which are listed in Table 3.
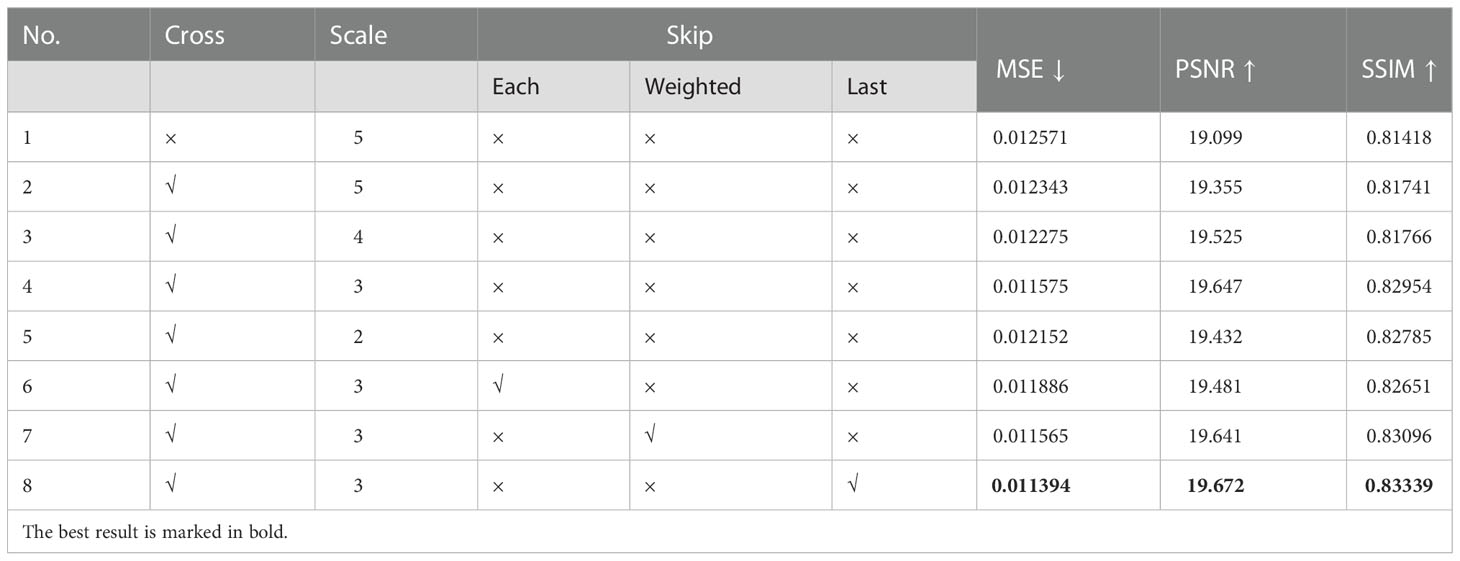
Table 3 Experimental results of adding multi-scale components.
The models in Section 3.2.1 followed the structure of MCSIP, which downsampled images with several convolution layers before capturing spatiotemporal relationships with ConvLSTM layers. In this structure, models only learn the spatiotemporal rules of the most abstract features because the ConvLSTM layers assess feature maps at the smallest scale. To enable our model to use detailed geometric information, we attempted to capture spatiotemporal relationships at large scales using convolutional layers and ConvLSTM layers in a staggered arrangement. The results of experiments 1 and 2 illustrate that interleaving convolutional layers and ConvLSTM layers helped the model learn more details and improve performance.
In addition, to explore the most suitable feature extraction scale for the typhoon cloud image prediction problem, we conducted experiments on four downsampling scales based on a cross-arranged network. In each iteration, we maintained the total number of convolution layers (i.e., five) but changed the number of convolution layers that halved the feature sizes. According to the results of experiments 2–5, as the scale of the downsampling decreased, the model performance first improved and then worsened after an optimum of 3 as the best downsampling scale.
Furthermore, images inevitably lose information during downsampling, and reusing these large-scale features during the upsampling process can enrich the details of the final output. Therefore, we implemented a skip connection module at the same stage. After considering computational complexity, we chose the add operation (He et al., 2016) rather than the concatenation operation (Huang et al., 2017). Because the input and output of the encode–decode module had different dimensions (i.e., the input shape was 8 × 256 × 256 and the output shape was 256 × 256), we attempted three additive methods: only adding the last frame of inputs, separately adding each frame of inputs with the same weights, and separately adding each frame of inputs with learnable weights. Based on the results of experiments 6–8, skipping connections was an effective strategy, and only adding the last frame of inputs was the best additive method.
To illustrate the effectiveness of the feature fusion module more intuitively than in the prior experiment, we considered Typhoon Yutu (October 2018) and visualized the predicted images of the experiments in Table 3 (Figure 7). Our proposed model predicted future typhoon satellite images in the Northwest Pacific and performed well in terms of cloud shape and texture. Figure 7A shows the predicted image of our basic model without the feature fusion module (i.e., experiment 1). Although the basic model effectively captured the overall distribution of clouds, details were missing. Figure 7B shows the predicted image of the model with multi-scale spatiotemporal feature capturing (i.e., experiment 4) and is substantially clearer than that in Figure 7A. Figure 7C shows the predicted image of the model with both multi-scale spatiotemporal feature capturing and same-stage feature reuse (i.e., experiment 8), which performs better than the model in Figure 7B in cloud shape prediction. From Figures 7A-C, the image quality gradually improved, particularly within the red box. Specifically, as shown in Figure 7A, the spiral cloud bands around the center of the typhoon were fragmented rather than coherent and complete. In Figures 7B, C, the spiral characteristics of the typhoon clouds are more obvious than those in Figure 7A. We compared Figures 7B, C, and the spiral cloud bands of the latter are smoother than those of the former and better show the typhoon movement trend than the former does.

Figure 7 Visual results of adding multi-scale components. First-row images are the inputs. Second-row images are outputs of different networks. (A) is the basic model; (B) is the model with multi-scale spatiotemporal feature capturing; (C) is the model with both multi-scale spatiotemporal feature capturing and same-stage feature reuse; and (D) is the ground truth.
Therefore, the multi-scale feature capturing strategy and the same-stage feature reuse method excelled in typhoon cloud image prediction.
3.2.3 Ablation experiments on channel attention
The input to our model was a sequence of consecutive satellite images, and the closer an image is to the present time, the greater its impact on the predicted image. After feature extraction by convolution layers, we obtained multiple feature maps with different representations; however, only some of these feature maps benefited our model. Therefore, the dependency of the output on each channel of the input differed; to refine the intermediate features and assign relative importance to each channel, we implemented a channel attention module before the multi-scale feature capturing module. In this section, we review several experiments on the impact of channel attention (Table 4).
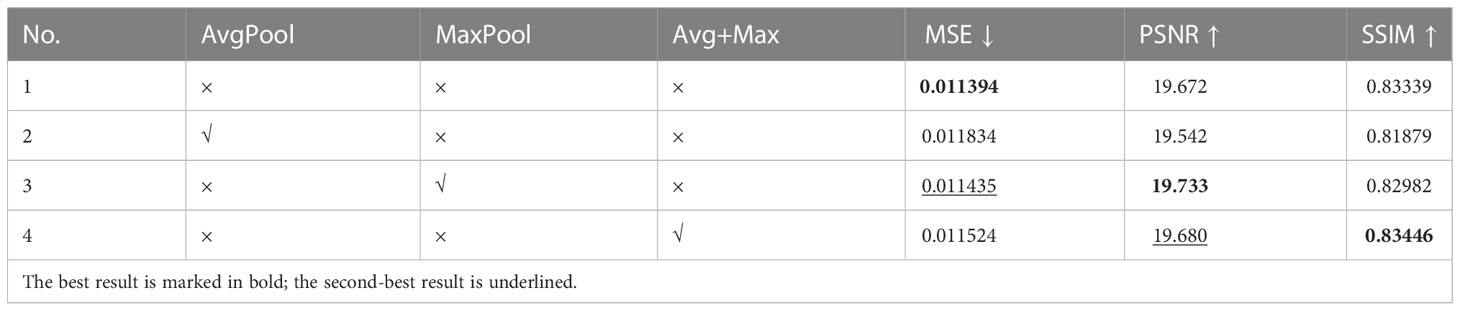
Table 4 Experimental results of adding the channel attention module with different pooling methods.
SENet is a classic channel attention module with a squeeze-and-excitation structure. The original SENet (Hu et al., 2018) adopted global average pooling to encode the entire spatial feature of a channel as a global feature. It was proposed by (Woo et al., 2018) that average pooling and maximum pooling have different representation effects; thus, we used maximum pooling alone and combined with average pooling in experiments 3 and 4, respectively. Based on these results, the best values of PSNR and SSIM belonged to models with channel attention, demonstrating that it increased model performance. Because the changes in the three indicators were inconsistent, we further evaluated them through visualization and used Typhoon Krosa (August 2019) as an example to increase the robustness of our conclusions (Figure 8).

Figure 8 Visual results of adding the channel attention module with different pooling methods; the second row displays the outputs. (A) without channel attention; (B) using average pooling; (C) using maximum pooling; (D) combining average pooling and maximum pooling; and (E) ground truth.
Figure 8 shows the visualized results of models with different attentions. The cloud texture can be easily distinguished in Figures 8B–D (i.e., models with channel attention), which are clearer than those in Figure 8A (i.e., models without channel attention). Moreover, Figure 8C (i.e., the model with channel attention using maximum pooling) exhibits the highest performance. The red box highlights the differences between the predicted images. In Figure 8C, the details of the typhoon clouds are most evident. The typhoon cloud marked by the red box in Figure 8E (i.e., the ground truth) has a clear eye and ring-shaped eyewall, which is also predicted only in Figure 8C.
Therefore, combining the experimental and visualization results illustrates that channel attention improves model performance and that using maximum pooling to squeeze can result in the best performance.
3.2.4 Comparison of spatiotemporal capture units
As mentioned in Section 1, convolutional GRU (Wang et al., 2018; Tian et al., 2019) (ConvGRU), trajectory GRU (Shi, 2018; Gan and Hui, 2020) (TrajGRU), spatiotemporal LSTM (Feng, 2019; Wang et al., 2021) (ST-LSTM), and convolutional LSTM (Mukherjee et al., 2019; Lin et al., 2020) (ConvLSTM) are widely used in video prediction. To prove that our proposed structure applies to all spatiotemporal capture units and to determine the best one for typhoon cloud image prediction, we compared the variations in the RNN with the EMSN. The experimental results are listed in Table 5.
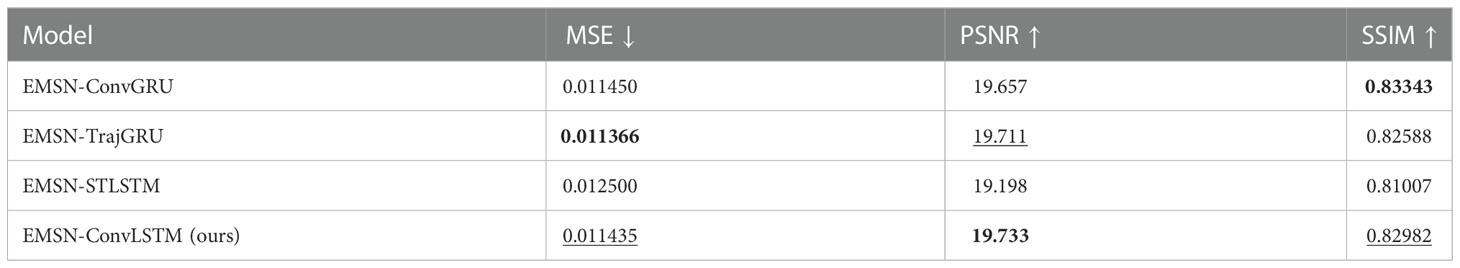
Table 5 Results of EMSN with different RNN variations. The best result is marked in bold; the second-best result is underlined.
The model using ConvLSTM had the best performance, with one best result and two second-best results according to the evaluation metrics. The model using ST-LSTM had the worst performance, with the worst results in all three metrics. The predictions were visualized (Figure 9). Each image is similar to that in Figure 9E (i.e., the ground truth), which verifies the effectiveness of the EMSN. However, in the comparison of Figures 9A–D, the latter (i.e., ConvLSTM) shows greater detail and clearer spiral cloud bands than the former. Mature Typhoon Saola (October 2017) is marked with a red box. According to Figure 9E, there is an obvious typhoon eye in the center of the cloud, and the comma-shaped eye area points approximately in the north-south direction. Except for Figure 9D, the images did not predict eye structure well.
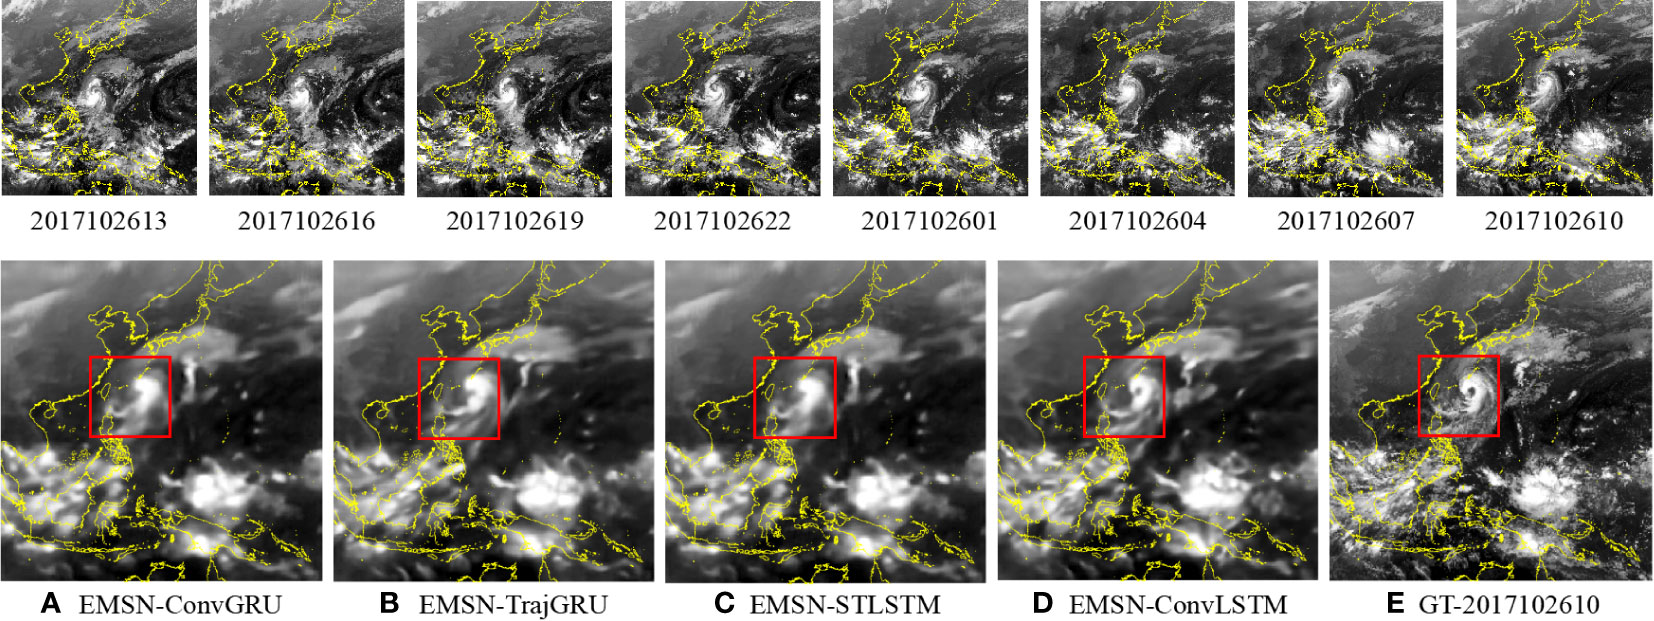
Figure 9 Visual results of the EMSN with different RNN structures; second-row images are the outputs. (A) EMSN-ConvGRU; (B) EMSN-TrajGRU; (C) EMSN-STLSTM; (D) EMSN-ConvLSTM; and (E) ground truth.
Furthermore, we generated different images between the ground-truth satellite images and predicted satellite images (Figure 10). In these images, the brighter the color, the larger the pixel difference, and vice versa. The white box in Figure 10 and the red box in Figure 9 mark the same area (i.e., the typhoon eye area). Figure 10D (i.e., ConvLSTM) is much darker than the other images; thus, ConvLSTM outperforms other RNN variations in the EMSN.
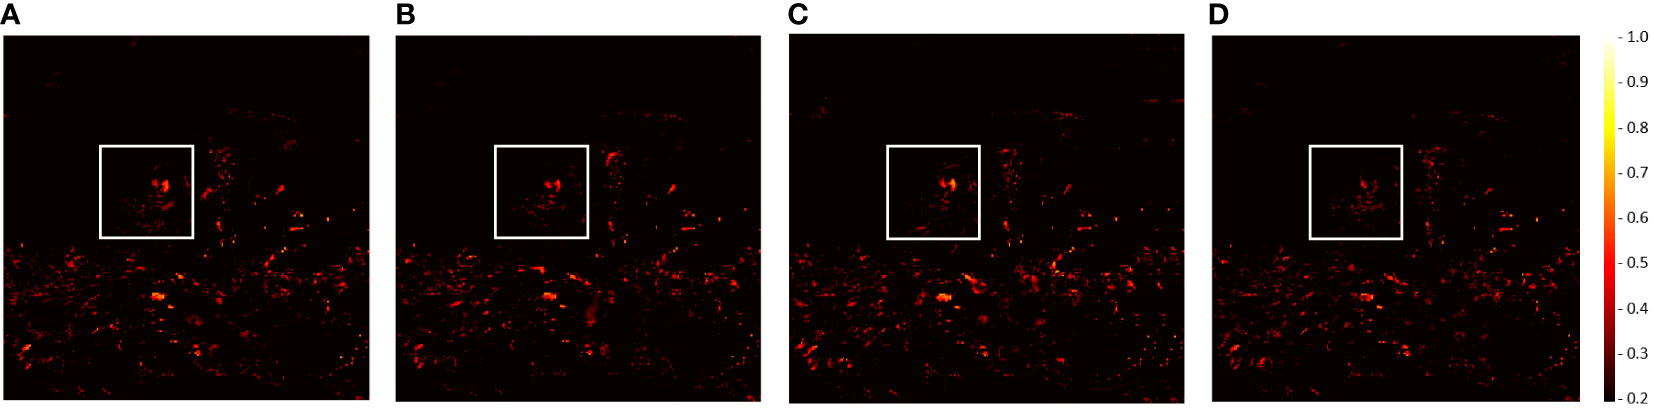
Figure 10 Difference images between the ground truth and the predicted results of the EMSN; the ground truth and predicted results are shown in Figure 9. (A) EMSN-ConvGRU; (B) EMSN-TrajGRU; (C) EMSN-STLSTM; and (D) EMSN-ConvLSTM.
Based on the experimental results, visualization results, and difference images, the proposed EMSN accurately predicts typhoon cloud images, and ConvLSTM is the best spatiotemporal capture unit for the EMSN.
4 Conclusion
In this study, an EMSN was developed for typhoon cloud image prediction. To improve the extraction of useful information from multiple input images, we designed a feature enhancement module to focus on meaningful features and remove worthless features. Additionally, to utilize both high-level semantic features and low-level detail features to generate clearer predicted images than in the literature, we designed a symmetric structure to fuse features at different scales, which used a multi-scale feature capturing strategy and a same stage feature reusing method. Based on a typhoon cloud image dataset collected from Himawari 8, extensive experiments were conducted to demonstrate the effectiveness of EMSN. The experimental results showed that EMSN efficiently and accurately predicted typhoon cloud images with higher quality than in the literature.
Although this study succeeded in predicting clear, accurate typhoon cloud images, we did not consider meteorological factors. This limited the model to only learning typhoon movement rules from satellite images. In further research, we intend to add meteorological data such as SST and MSL as model inputs to expand the learnable information and enable the model to learn how the surrounding environment affects typhoons. We also plan to further explore the prediction of typhoon position and intensity based on the predicted cloud images.
Data availability statement
Publicly available datasets were analyzed in this study. This data can be found here: https://www.eorc.jaxa.jp/ptree/.
Author contributions
XW: Conceptualization, investigation, methodology, and writing—original draft. MQ: Methodology, validation, and writing—review and editing. ZZ: Software and data curation. YW: Resources, funding acquisition, and writing—review and editing. ZD: Resources, funding acquisition, and writing—review and editing. NW: Resources and funding acquisition. All authors listed have made a substantial, direct, and intellectual contribution to the work and approved it for publication.
Funding
This work was supported in part by the National Natural Science Foundation of China under Grants 41922043, 41871287, and 42050103, and in part by the Key project of Soft Science Research of Zhejiang Province in the year 2022 under Grant 2022C25021.
Conflict of interest
The authors declare that the research was conducted in the absence of any commercial or financial relationships that could be construed as a potential conflict of interest.
Publisher’s note
All claims expressed in this article are solely those of the authors and do not necessarily represent those of their affiliated organizations, or those of the publisher, the editors and the reviewers. Any product that may be evaluated in this article, or claim that may be made by its manufacturer, is not guaranteed or endorsed by the publisher.
References
Anduaga A. (2019). “History of typhoon science,” in Oxford Research encyclopedia of climate science. (Oxford University Press). Available at: https://oxfordre.com/climatescience/display/10.1093/acrefore/9780190228620.001.0001/acrefore-9780190228620-e-721;jsessionid=0C3989FA53A5FCBB227A714BB2E2D2C2.
Bessho K., Date K., Hayashi M., Ikeda A., Imai T., Inoue H., et al. (2016). An introduction to Himawari-8/9–japan’s new-generation geostationary meteorological satellites. J. Meteorological Soc. Japan Ser. II 94 (2), 151–183. doi: 10.2151/jmsj.2016-009
Defu L., Pang L., Xie B. (2009). Typhoon disaster in China: prediction, prevention, and mitigation. Natural Hazards 49 (3), 421–436. doi: 10.1007/s11069-008-9262-2
Feng H. (2019). The application of recurrent neural network in nowcasting. Geophysical Res. Abstracts 21.
Gan J., Hui Qi (2020). “Research on weather radar nowcasting extrapolation,” in 2020 International Conference on Computer Vision, Image and Deep Learning (CVIDL). Available at: https://ieeexplore.ieee.org/abstract/document/9270491.
He K., Zhang X., Ren S., Sun J. (2016). “Deep residual learning for image recognition,” in Proceedings of the IEEE Conference on Computer Vision and Pattern Recognition (CVPR). Available at: https://openaccess.thecvf.com/content_cvpr_2016/html/He_Deep_Residual_Learning_CVPR_2016_paper.html.
Hong S., Kim S., Joh M., Song S.-K. (2017a). Globenet: Convolutional neural networks for typhoon eye tracking from remote sensing imagery. arXiv preprint arXiv:1708.03417.
Hong S., Kim S., Joh M., Song S.-K. (2017b). Psique: Next sequence prediction of satellite images using a convolutional sequence-to-sequence network. arXiv preprint arXiv:1711.10644.
Hoque M. A.-A., Phinn S., Roelfsema C., Childs I. (2017). Tropical cyclone disaster management using remote sensing and spatial analysis: A review. Int. J. disaster Risk reduction 22, 345–3545. doi: 10.1016/j.ijdrr.2017.02.008
Huang G., Liu Z., van der Maaten L., Weinberger K. Q. (2017). Densely connected convolutional networks. Proc. IEEE Conf. Comput. Vision Pattern Recognit. doi: 10.1109/CVPR.2017.243
Hu J., Shen Li, Sun G. (2018). “Squeeze-and-excitation networks,” in Proceedings of the IEEE Conference on Computer Vision and Pattern Recognition (CVPR). Available at: https://openaccess.thecvf.com/content_cvpr_2018/html/Hu_Squeeze-and-Excitation_Networks_CVPR_2018_paper.html.
Jia S., Yansong D., Wenbin J., Jinmei L., Xianzhong L., Wen N., et al. (2020). Study on evolution process of landslides triggered by typhoon rainstorm. J. Eng. geol. 28 (6), 1323–1332. doi: 10.13544/j.cnki.jeg.2019-540
Khan A., Sohail A., Zahoora U., Qureshi A. S. (2020). A survey of the recent architectures of deep convolutional neural networks. Artif. Intell. Rev. 53 (8), 5455–5516. doi: 10.1007/s10462-020-09825-6
Kovordányi R., Chandan R. (2009). Cyclone track forecasting based on satellite images using artificial neural networks. ISPRS J. Photogrammetry Remote Sens. 64 (6), 513–521. doi: 10.1016/j.isprsjprs.2009.03.002
Lee J.-H., Lee SS, Kim HG, Song S-K, Kim S, Ro YM (2019). Mcsip net: Multichannel satellite image prediction via deep neural network. IEEE Trans. Geosci. Remote Sens. 58 (3), 2212–2224. doi: 10.1109/TGRS.2019.2955538
Lin Z., Li M., Zheng Z., Cheng Y., Yuan C. (2020). “Self-attention convlstm for spatiotemporal prediction,” in Proceedings of the AAAI Conference on Artificial Intelligence, Vol. 34. Available at: https://ojs.aaai.org/index.php/AAAI/article/view/6819.
Moskolaï W. R., Abdou W., Dipanda A. (2021). Application of deep learning architectures for satellite image time series prediction: A review. Remote Sens. 13 (23), 4822. doi: 10.3390/rs13234822
Mukherjee S., Ghosh S., Ghosh S., Kumar P., Roy P. P. (2019). “Predicting video-frames using encoder-convlstm combination,” in 2019 IEEE International Conference on Acoustics, Speech and Signal Processing (ICASSP). Available at: https://ieeexplore.ieee.org/abstract/document/8682158.
Neeru J., Kishtawal C. M. (2010). Automatic determination of center of tropical cyclone in satellite-generated IR images. IEEE Geosci. Remote Sens. Lett. 8 (3), 460–463. doi: 10.1109/LGRS.2010.2085418
Ranzato M., Szlam A., Bruna J., Mathieu M., Collobert R., Chopra S. (2014). Video (language) modeling: a baseline for generative models of natural videos. arXiv preprint arXiv:1412.6604.
Rüttgers M., Lee S., Jeon S., You D. (2019). Prediction of a typhoon track using a generative adversarial network and satellite images. Sci. Rep. 9 (1), 1–15. doi: 10.1038/s41598-019-42339-y
Salehinejad H., Sankar S., Barfett J., Colak E., Valaee S. (2017). Recent advances in recurrent neural networks. arXiv preprint arXiv:1801.01078.
Shi X. (2018). Exploring deep learning architectures for spatiotemporal sequence forecasting. Diss. doi: 10.14711/thesis-991012671057603412
Shi X., Gao Z., Lausen L., Wang H., Yeung D.-Y., Wong W.-K., et al. (2017). Deep learning for precipitation nowcasting: A benchmark and a new model. arXiv preprint arXiv:1706.03458.
Shultz J. M., Jill R., Espinel Z. (2005). Epidemiology of tropical cyclones: the dynamics of disaster, disease, and development. Epidemiologic Rev. 27 (1), 21–35. doi: 10.1093/epirev/mxi011
Siddique N., Paheding S., Elkin C. P., Devabhaktuni V. (2021). U-Net and its variants for medical image segmentation: A review of theory and applications. IEEE Access. doi: 10.1109/ACCESS.2021.3086020
Tian L., Li X., Ye Y., Xie P., Li Y. (2019). A generative adversarial gated recurrent unit model for precipitation nowcasting. IEEE Geosci. Remote Sens. Lett. 17 (4), 601–605. doi: 10.1109/LGRS.2019.2926776
Tschannen M., Bachem O., Lucic M. (2018). Recent advances in autoencoder-based representation learning. arXiv preprint arXiv:1812.05069.
Wang Y., Long M., Wang J., Gao Z., Yu P. S. (2017). “Predrnn: Recurrent neural networks for predictive learning using spatiotemporal lstms,” in Advances in Neural Information Processing Systems 30 (NIPS 2017). Available at: https://proceedings.neurips.cc/paper/2017/hash/e5f6ad6ce374177eef023bf5d0c018b6-Abstract.html.
Wang E. Ke, Wang F., Kumari S., Yeh J.-H., Chen C.-M. (2021). Intelligent monitor for typhoon in IoT system of smart city. J. Supercomputing 77 (3), 3024–3043. doi: 10.1007/s11227-020-03381-0
Wang Y., Wu H., Zhang J., Gao Z., Wang J., Yu P., et al. (2021). PredRNN: A recurrent neural network for spatiotemporal predictive learning. arXiv preprint arXiv:2103.09504. doi: 10.1109/TPAMI.2022.3165153
Wang X., Weixin X., Jiayi S. (2018). “Learning spatiotemporal features with 3DCNN and ConvGRU for video anomaly detection,” in 2018 14th IEEE International Conference on Signal Processing (ICSP). Available at: https://ieeexplore.ieee.org/abstract/document/8652354.
Weinkle J., Maue R., Pielke Jr. R. (2012). Historical global tropical cyclone landfalls. J. Climate 25 (13), 4729–4735. doi: 10.1175/JCLI-D-11-00719.1
Woo S., Park J., Lee J.-Y., Kweon I. S. (2018). “Cbam: Convolutional block attention module,” in Proceedings of the European Conference on Computer Vision (ECCV). Available at: https://openaccess.thecvf.com/content_ECCV_2018/html/Sanghyun_Woo_Convolutional_Block_Attention_ECCV_2018_paper.html.
Xingjian S. H. I, Chen Z., Wang H., Yeung D.-Y., Wong W.-K., Wang-chun W. O. O. (2015). Convolutional LSTM network: A machine learning approach for precipitation nowcasting. Adv. Neural Inf. Process. systems.
Xu Z., Du J., Wang J., Jiang C., Ren Y. (2019). “Satellite image prediction relying on gan and lstm neural networks,” in 2019 IEEE International Conference on Communications (ICC). Available at: https://ieeexplore.ieee.org/abstract/document/8761462.
Yu J., Gao S., Zhang L., Shen X., Guo L. (2020). Analysis of a remote rainstorm in the Yangtze river delta region caused by typhoon mangkhut (2018). J. Mar. Sci. Eng. 8 (5), 345. doi: 10.3390/jmse8050345
Zhang J., Chen Y. (2019). Risk assessment of flood disaster induced by typhoon rainstorms in guangdong province, China. Sustainability 11 (10), 2738. doi: 10.3390/su11102738
Zhang Q. P., Lai L. L., Sun W. C. (2005). “Intelligent location of tropical cyclone center,” in 2005 International Conference on Machine Learning and Cybernetics, Vol. 1. Available at: https://ieeexplore.ieee.org/abstract/document/1526984.
Keywords: typhoon, Himawari 8, satellite image prediction, multi-scale feature fusion, deep learning
Citation: Wang X, Qin M, Zhang Z, Wang Y, Du Z and Wang N (2023) Typhoon cloud image prediction based on enhanced multi-scale deep neural network. Front. Mar. Sci. 9:956813. doi: 10.3389/fmars.2022.956813
Received: 30 May 2022; Accepted: 15 December 2022;
Published: 11 January 2023.
Edited by:
Dongxiao Zhang, University of Washington and NOAA/Pacific Marine Environmental Laboratory, United StatesReviewed by:
Di Wang, Tianjin University, ChinaMilad Janalipour, Ministry of Science, Research, and Technology, Iran
Copyright © 2023 Wang, Qin, Zhang, Wang, Du and Wang. This is an open-access article distributed under the terms of the Creative Commons Attribution License (CC BY). The use, distribution or reproduction in other forums is permitted, provided the original author(s) and the copyright owner(s) are credited and that the original publication in this journal is cited, in accordance with accepted academic practice. No use, distribution or reproduction is permitted which does not comply with these terms.
*Correspondence: Yuanyuan Wang, d2FuZ3l1YW55dWFueHlAemp1LmVkdS5jbg==