
95% of researchers rate our articles as excellent or good
Learn more about the work of our research integrity team to safeguard the quality of each article we publish.
Find out more
ORIGINAL RESEARCH article
Front. Mar. Sci. , 09 August 2022
Sec. Physical Oceanography
Volume 9 - 2022 | https://doi.org/10.3389/fmars.2022.952406
 Zhao Li1,3,4
 Shuiqing Li1,2,4*
 Po Hu1,2,4Dongxue Mo1,2,4Jian Li5Mei Du6Jie Yan7Yijun Hou1,2,3,4
 Baoshu Yin1,2,3,4*
Storm surge inundation can induce great disasters in coastal regions, and Laizhou Bay (LZB), located in the Bohai Sea, is a bay that frequently experiences coastal storm flooding. In this study, we perform a numerical study of the effects of wind and waves on the storm surge-induced coastal inundation in the LZB using the coupled model ADCIRC+SWAN. Two historical typhoons (No. 9216 Typhoon Polly (TY9216) and No. 1909 Typhoon Lekima (TY1909)) are considered, wave effects in terms of wind-wave-induced surface stress and radiation stress are included, and two widely used wind data sources (CFS and ERA5) are used. The results indicate that the total inundation area and average inundation depth in the LZB during TY1909 are 10.70%-19.16% larger than during TY9216, and the CFS wind field reproduces a 14.31%-23.05% more intense inundation simulation than does the ERA5 wind field. The wave-induced surface stress plays the primary role in increasing the inundation area and average depth by up to 11.42%-18.50% and 5.82%-8.75%, respectively, and the wave-induced radiation stress also increases the inundation area and average depth by 3.80%-6.60% and 3.70%-4.57%, respectively. The results highlight the importance of considering wave effects in storm surge-induced coastal inundation simulations, and we demonstrate that the wave effects on the inundation area can be quite sensitive to the choice of wind field source.
Laizhou Bay (LZB) is a semi-enclosed shallow bay in the Bohai Sea located in the northwestern Shandong Peninsula, which is vulnerable to typhoon-induced storm inundation (Figure 1). It possesses approximately 320 km of shoreline from the Qimu Cape to the Yellow River Estuary, and its area range is approximately 6000 km2 (Wang et al., 2016; Xu et al., 2021). According to historical records, many typhoons, such as No. 9216 Typhoon Polly (TY9216) and No. 1909 Typhoon Lekima (TY1909), caused severe disasters and serious storm surge flooding in the coastal area of the LZB (Ministry of Natural Resources of the People’s Republic of China, 1989-2021; Li et al., 2019). TY9216 passed through Taiwan Island and made landfall again in Changle (Fujian Province) at 6:00 (UTC+8) on August 31, 1992, then, it moved north, which resulted in direct economic losses of approximately 1.5 billion yuan along the coastal region of the Bohai Sea, and the storm surge inundation area only in Dongying (Shandong Province) reached 960 km2 (Li et al., 2019). TY1909 was formed at 14:00 (UTC+8) on August 4, 2019, making landfall in Wenling (Zhejiang Province) at 1:45 (UTC+8) on August 10, 2019, then landing again in Qingdao (Shandong Province) and moving north into the Bohai Sea, which induced severe inundation along the LZB coast and caused 2.163 billion yuan in direct economic loss in Shandong Province alone (Fu et al., 2021; Ministry of Natural Resources of the People’s Republic of China, 1989-2021).
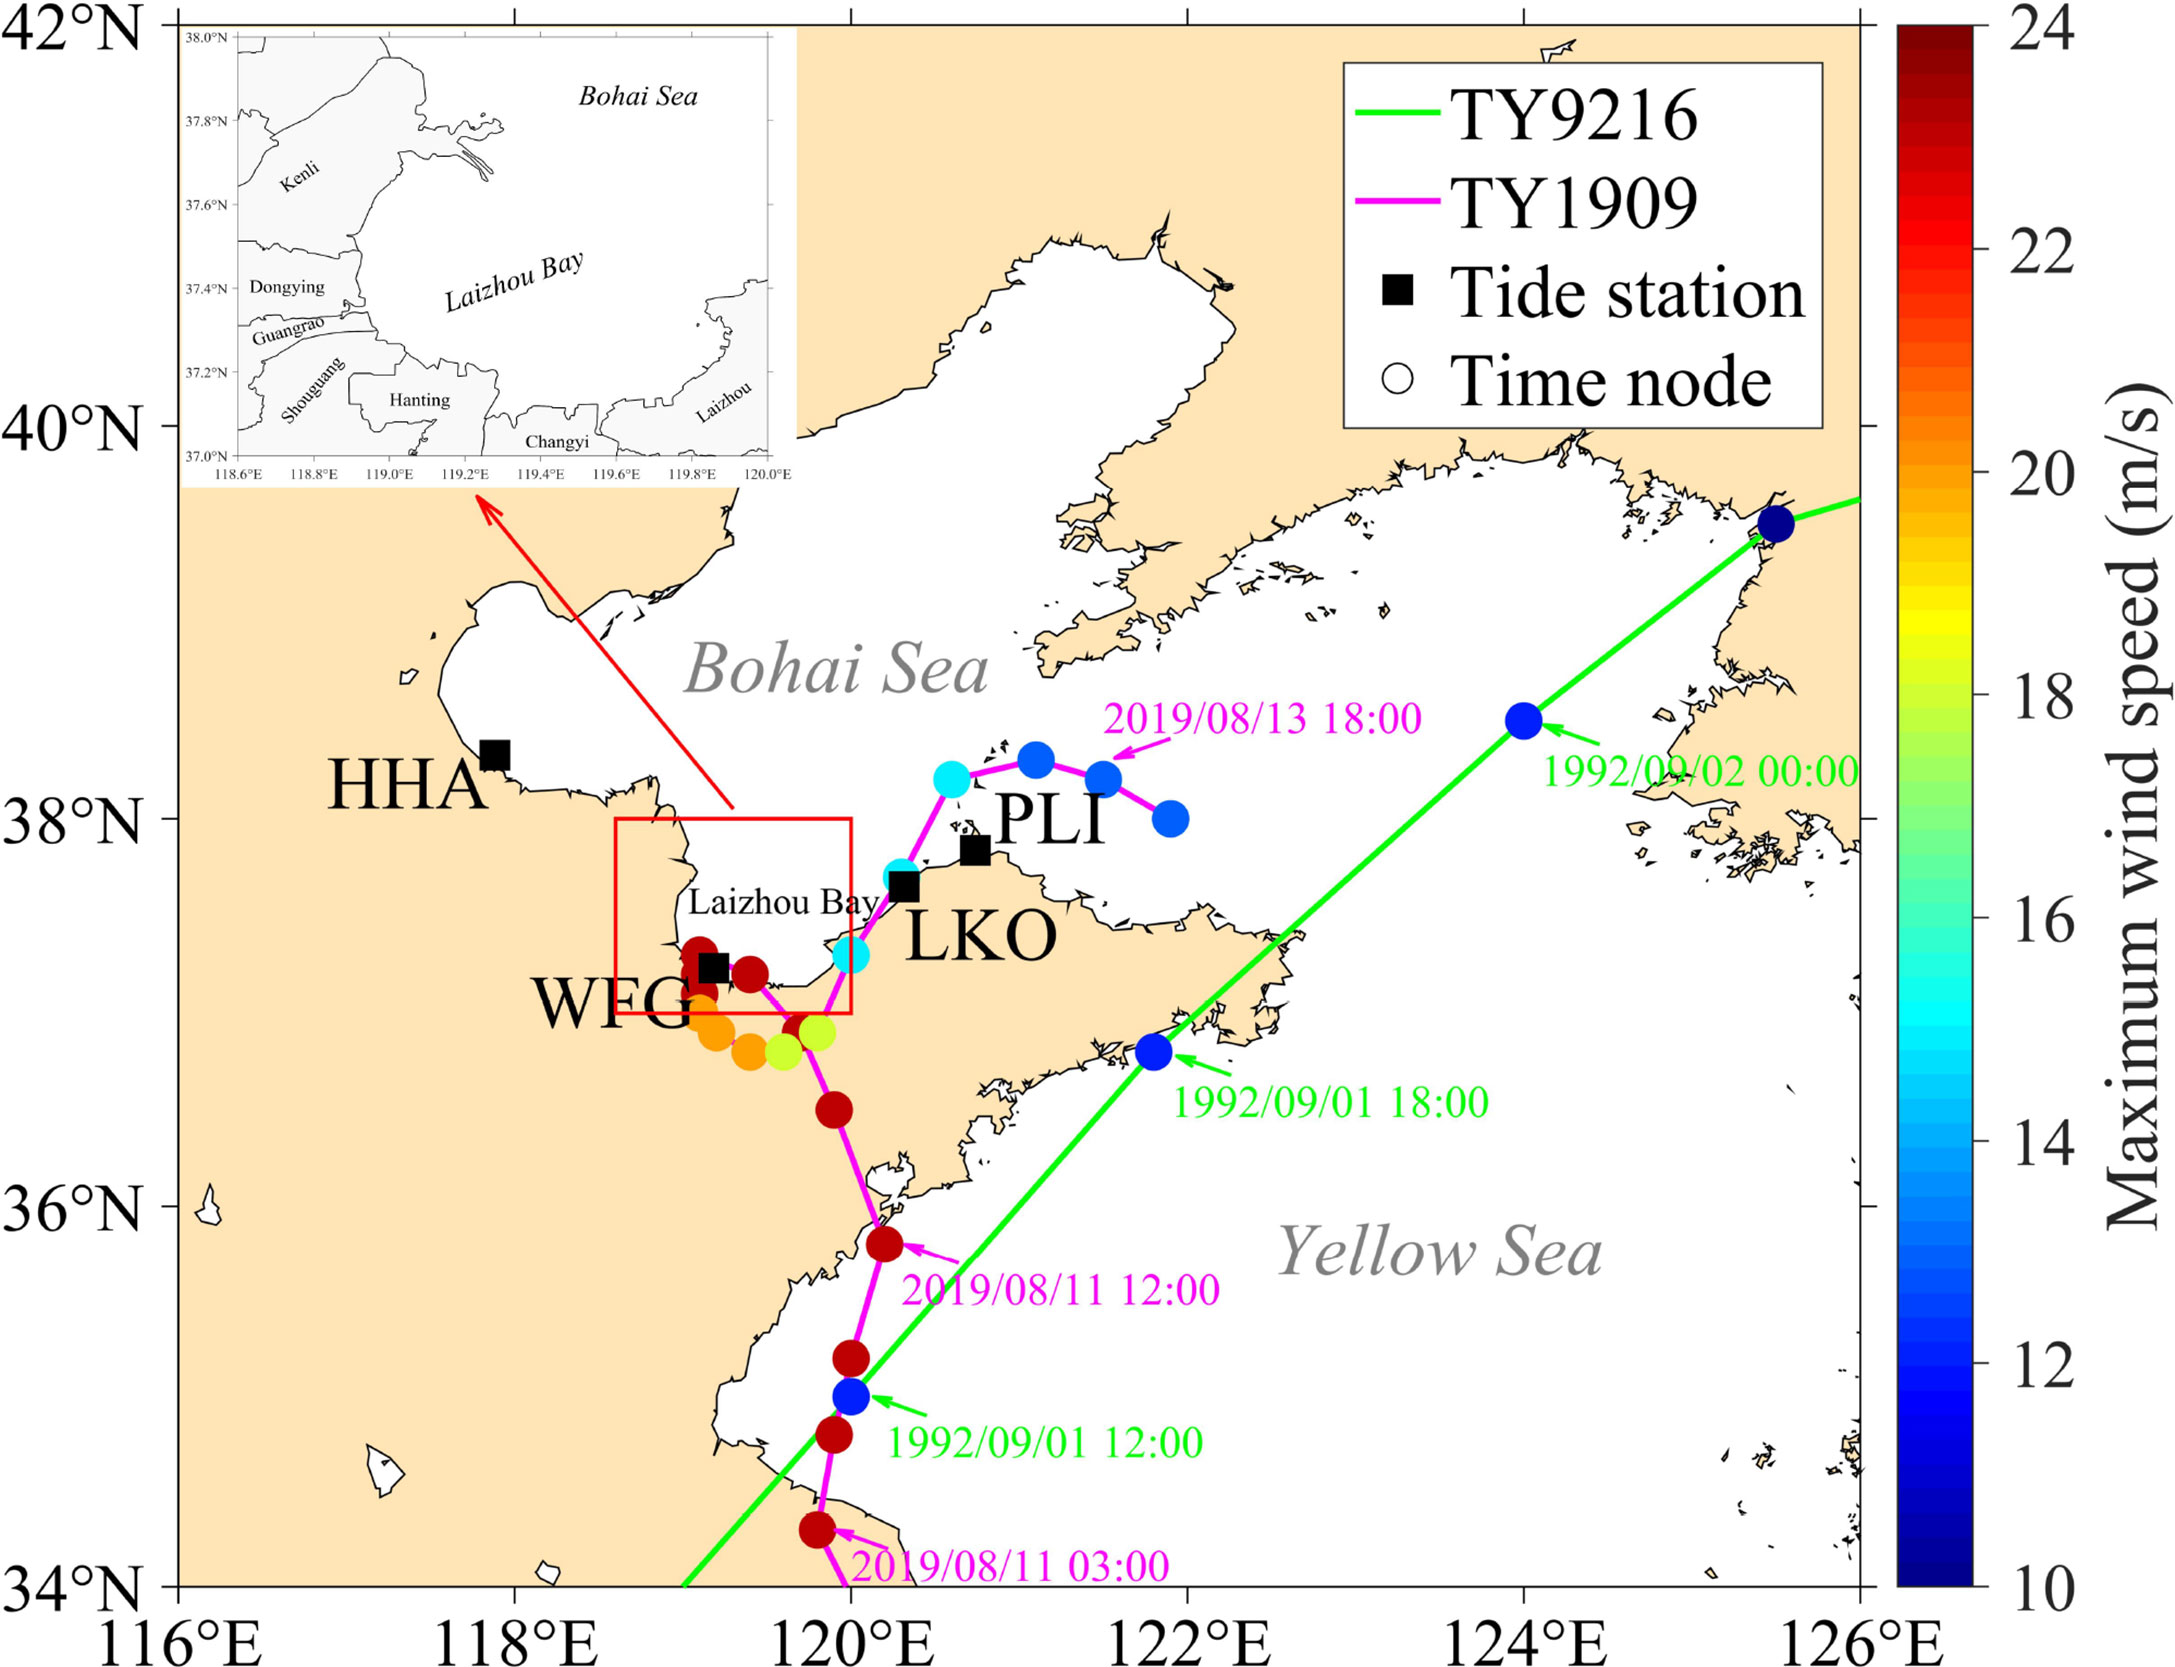
Figure 1 Track information of TY9216 and TY1909, the four tide station locations, the LZB location and the cities along the LZB.
Numerical models are commonly used in studying coastal storm inundation (Hubbert and Mclnnes, 1999; Peng et al., 2004; Wang et al., 2014; Yin et al., 2016; Yang et al., 2019; Du et al., 2020a), such as some surge models, including the Finite-Volume Coastal Ocean Model (FVCOM, Rego and Li, 2009; Wang et al., 2017), Semi-implicit Eulerian–Lagrangian Finite-Element (SELFE, Wang et al., 2014; Chen and Liu, 2016), Regional Ocean Modeling System (ROMS, Li et al., 2016), Princeton Ocean Model (POM, Xie et al., 2004; Xia et al., 2008), and Advanced Circulation (ADCIRC, Gayathri et al., 2016; Shi et al., 2021), and some surge-wave coupled model, including the Delft3D (Veeramony et al., 2017; Kumbier et al., 2018), Simulating Waves Nearshore (SWAN) + POM (Xie et al., 2008), Curvilinear-grid Hydrodynamics in 3D Storm Surge Modeling System (CH3D-SSMS, Sheng et al., 2010), Semi-implicit Cross-scale Hydroscience Integrated System Model Wind Wave Model version III (SCHISM-WWMIII, Yang et al., 2019), ADCIRC+SWAN (Murty et al., 2020; Wang et al., 2020). These models make it convenient for researchers to study storm inundation. Moreover, studies on storm inundation have always been popular research topics in recent years. Many factors contributing to storm inundation, such as storm surge barrier installation (Shim et al., 2013), resolution of unstructured mesh (Kress et al., 2016), wave setup (Krien et al., 2017; Murty et al., 2020), storm incident angles (Sahoo and Bhaskaran, 2018; Wu et al., 2018), typhoon translation speed (Sahoo and Bhaskaran, 2018; Wu et al., 2018; Du et al., 2020b), typhoon path (Peng et al., 2006; Du et al., 2020b), typhoon intensity (Shi et al., 2020), radius of maximum winds (Rego and Li, 2009), sea level rise (Zhang et al., 2013; Pan and Liu, 2019; Miller and Shirzaei, 2021), storm surge temporal variability (Höffken et al., 2020) and subsidence (Miller and Shirzaei, 2021), have been explored.
The wind field plays a significant role in simulating storm surge and coastal inundation (Wang et al., 2017). Many studies have compared the characteristics of storm surge simulations using different wind sources (Afshar-Kaveh et al., 2017; Akbar et al., 2017; Mao and Xia, 2017; Chu et al., 2019; Hsiao et al., 2019; Musinguzi et al., 2019), but the best wind source varies with simulated regions and typhoon cases. The wave-stress effects on storm surge and storm inundation, including wave-induced radiation stress, wave-induced surface stress and wave-induced bottom stress, are also important. Sheng et al. (2010) and Bertin et al. (2015) discussed the impacts of these three wave stresses on storm surge, and their results showed that wave-induced surface stress and radiation stress obtained more significant improvement in storm surge. In addition, the effects of these three wave stresses on storm inundation area have also been investigated (e.g., Xie et al., 2008; Wang et al., 2020), in which the wave-induced surface stress shows the most significant effect, followed by the wave-induced radiation stress.
The storm inundation research in the LZB is quite rare and only a few researchers (Liu et al., 2018; Li et al., 2022a) focus on the risk assessment of storm inundation in this region. For example, Liu et al. (2018) used the inundation data simulated by numerical model to make the risk assessment of extratropical storm surge in Weifang (Shandong Province) along the LZB; Li et al. (2022a) created the risk assessment framework in the LZB based on storm inundation data simulated by MIKE21 model. ADCIRC+SWAN model has been widely used in the literature, for example, using ADCIRC+SWAN model, Bilskie et al. (2016) studied the storm inundation in the northern Gulf of Mexico, Deb and Ferreira (2017) studied the coastal inundation in Bangladesh, Suh and Kim (2018) simulated the coastal inundation in Busan of Korea, Du et al. (2020b) analyzed the storm inundation in the Pearl River Estuary; Murty et al. (2020) explored the storm inundation in the east coast of India, Wang et al. (2020) studied the storm inundation in the southwestern Hangzhou Bay, and Wang et al. (2021) assessed the coastal inundation in Huizhou (Guangdong Province).
In previous studies that consider the wave effects, the studied regions are mainly located in relatively open water, such as the Charleston Harbor (Xie et al., 2008), the Outer Banks and Chesapeake Bay (Sheng et al., 2010), the east coast of India (Murty et al., 2020), and the southwestern Hangzhou Bay (Wang et al., 2020). LZB is an inner shallow bay that is located in a semi-enclosed Bohai Sea, so it can communicate some advances in the understanding of the wave effects on the storm inundation in regions of this kind. Meanwhile, previous studies investigate the wind and wave effects on storm inundation separately, while their combined effects are not well addressed. This study mainly considers flooding scenarios in the coastal regions of the LZB, and a numerical study is performed by considering two dominant wave effects and two commonly used wind fields to investigate their influence on coastal inundation in the LZB. This manuscript is organized as follows: Section “Materials and methods” describes the data used, model information and numerical simulation validation. Section “Inundation results” provides the simulated results of storm inundation. Section “Discussions” presents the discussion and Section “Conclusions” presents the specific conclusions.
The National Centers for Environmental Prediction (NCEP) and European Centre for Medium-Range Weather Forecasts (ECMWF) are two popular meteorological agencies that provide many meteorological products (Li et al., 2022b). This paper uses hourly meteorological data from the NCEP Climate Forecast System (CFS) and the ECMWF ERA5, and they possess different constituent models, assimilation schemes and grid resolutions (Stopa and Cheung, 2014). The CFS consists of Climate Forecast System Reanalysis (CFSR) data and CFS Version 2 (CFSv2) reanalysis data, which depends on the coupled atmosphere-ocean-sea ice-land system using the three-dimensional variational data assimilation (3D-Var) scheme, including the NCEP Global Forecast System (GFS), the Noah land surface model, the global ocean data assimilation system (GODAS) and the Geophysical Fluid Dynamics Laboratory (GFDL) Modular Ocean Model (MOM) version 4 (Saha et al., 2010a; Saha et al., 2014; Gramcianinov et al., 2020). The CFSR provides wind data with a resolution of 0.312° × 0.312° and a temporal range of 1979-2010 (Saha et al., 2010b; https://rda.ucar.edu/datasets/ds093.1/); CFSv2 data begins in 2011 and has 0.205°×0.204° resolution in wind products (Saha et al., 2011; https://rda.ucar.edu/datasets/ds094.1/). ERA5 reanalysis data are the fifth-generation ECMWF reanalysis products, which depends on the Integrated Forecasting System (IFS) Cy41r2 version in 2016 using the four-dimensional variational data assimilation (4D-Var) scheme (Hersbach et al., 2020; Gramcianinov et al., 2020), providing wind products with a resolution of 0.25° × 0.25° (Hersbach et al., 2018; https://cds.climate.copernicus.eu/cdsapp#!/home). In previous study (Li et al., 2022b), we have compared the wind speed, wind direction and simulated wave height of the two reanalysis data sets during Typhoons Lekima and Muifa, and they match the buoy data well, which shows that CFS and ERA5 wind fields are reliable in simulating typhoon process.
We plot the spatial distribution of wind speed and direction during the intense typhoon wind forcing periods of TY9216 and TY1909 inside the LZB in Figures 2, 3 respectively. As seen, the CFS winds are generally higher inside the intense wind forcing regions, while the situation does not persist in the outer regions, such as in the Yellow Sea, because the ERA5 winds can be higher. So there do not exist systematic differences between the two wind products, but the CFS did predict systematically higher wind speeds within the intense wind forcing regions during these two typhoon cases.
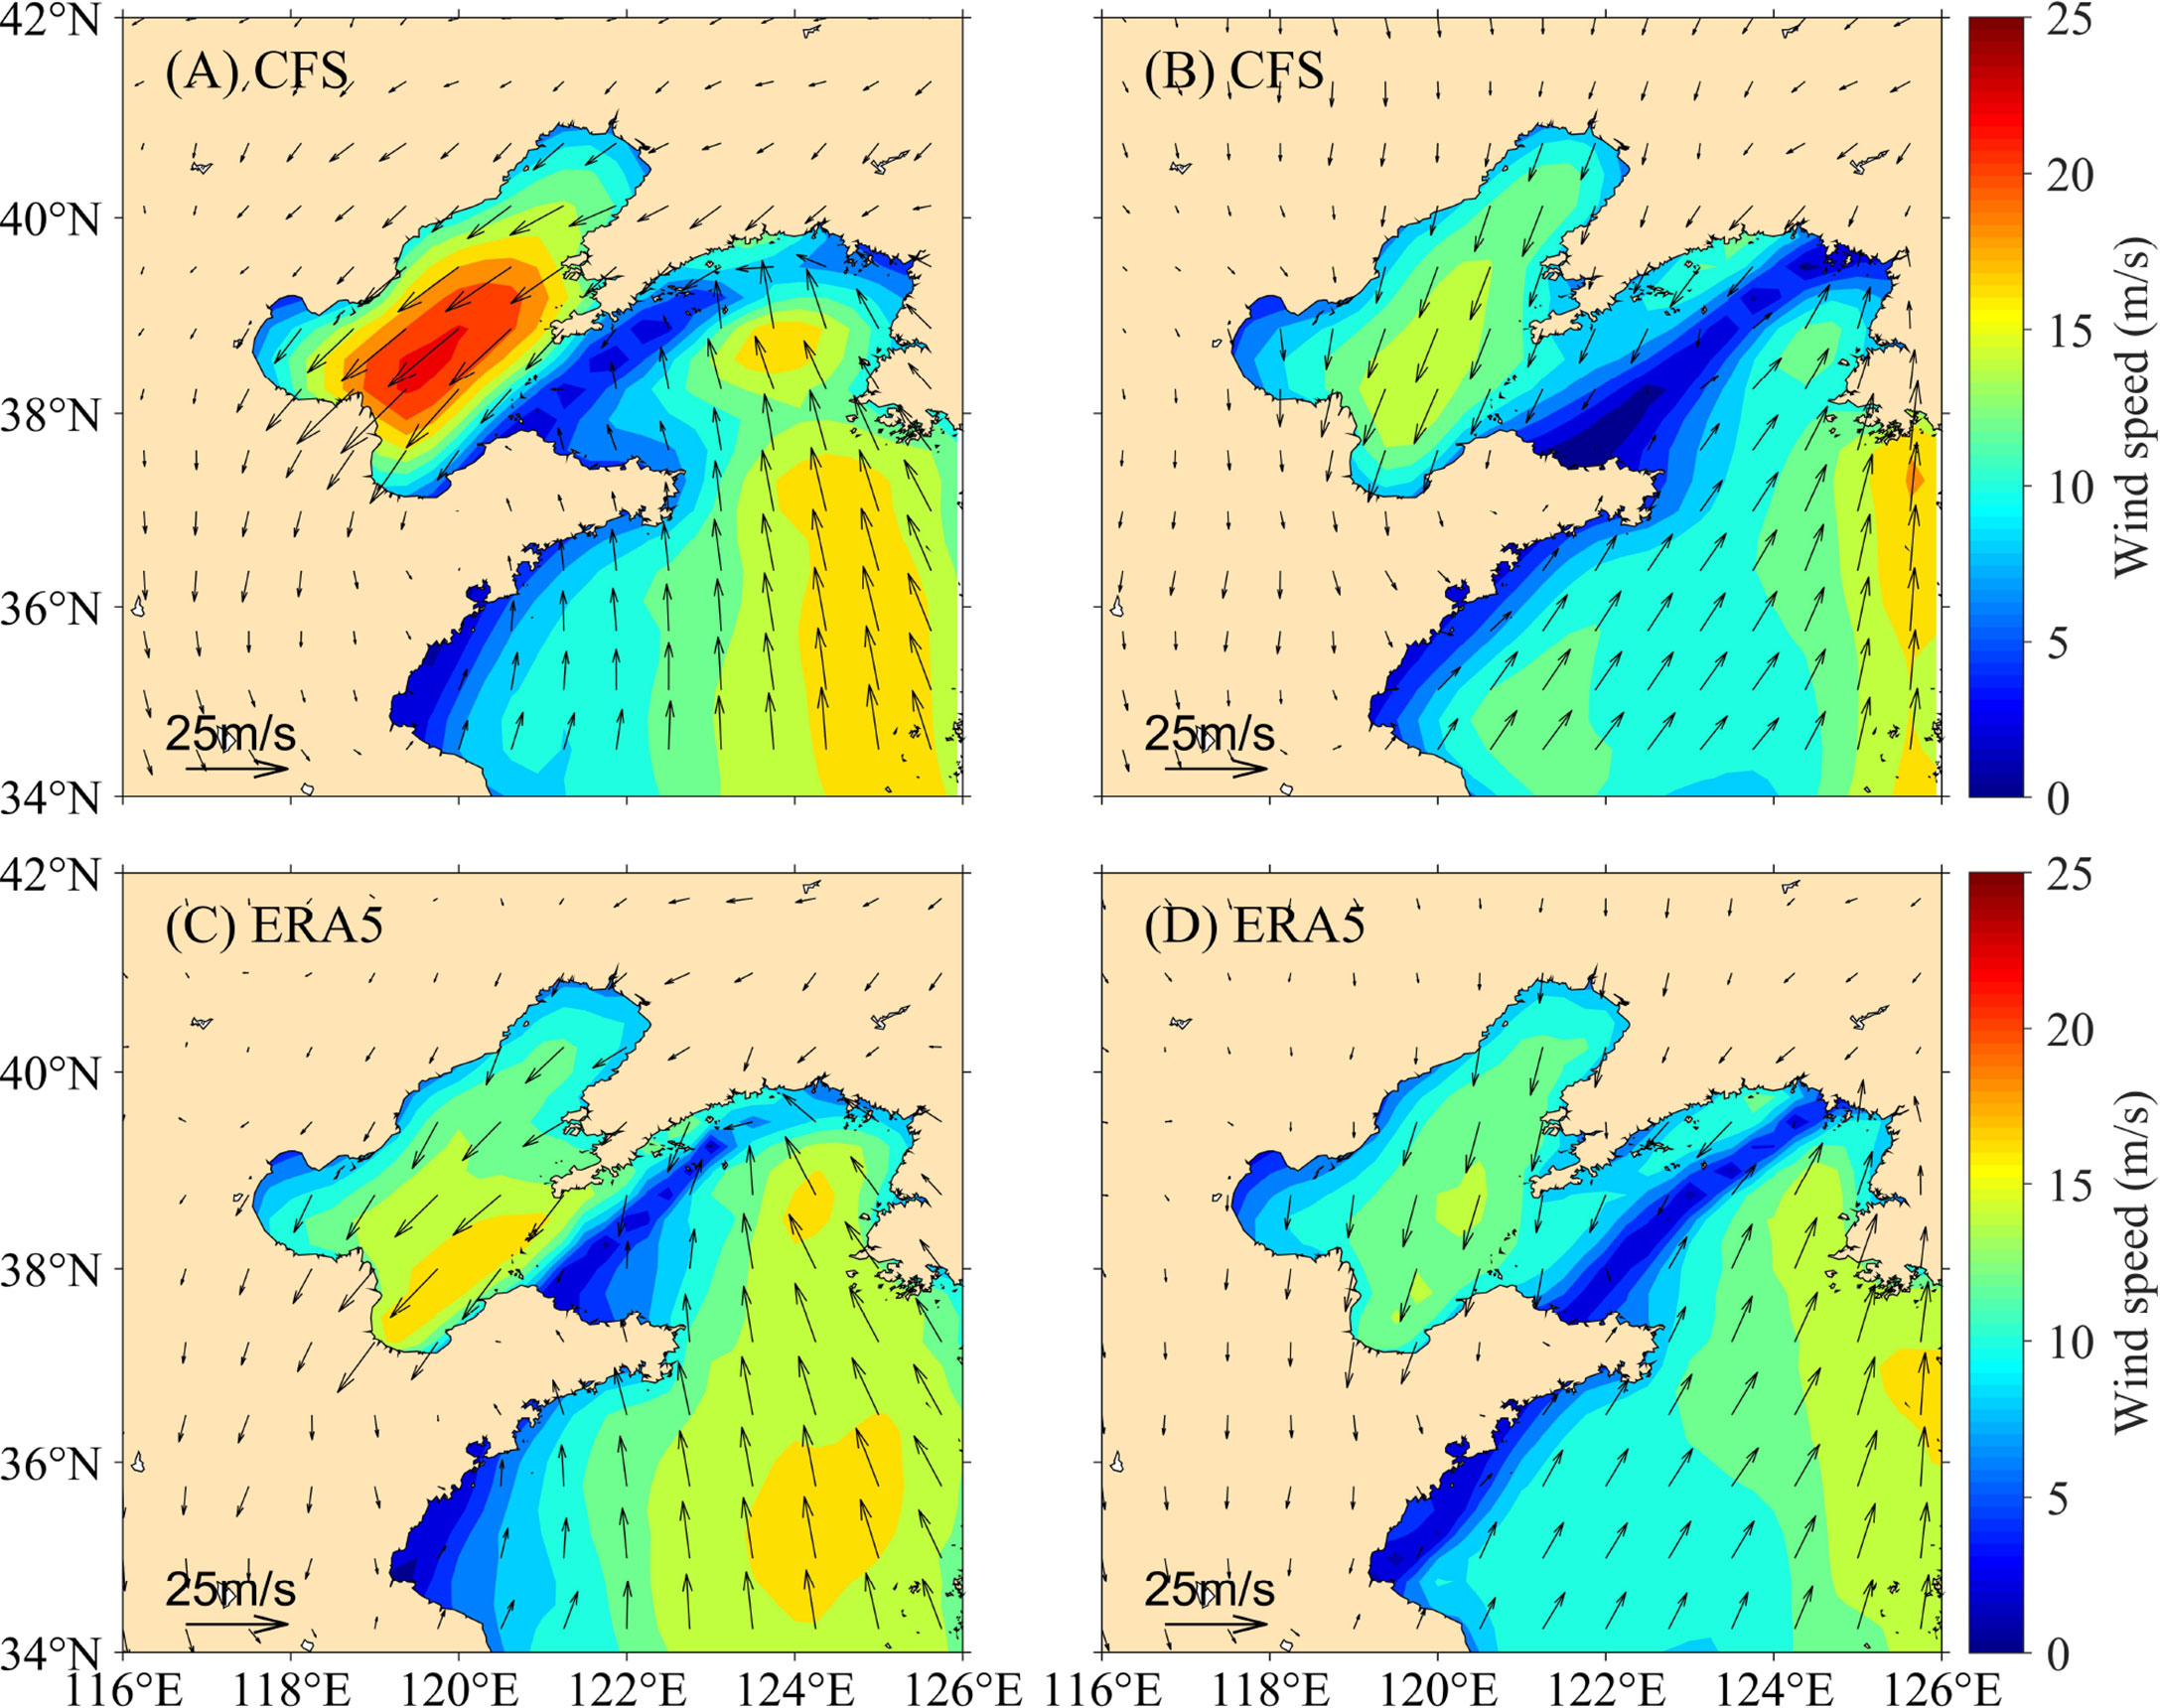
Figure 2 Comparisons of wind field snapshots between CFS and ERA5 at 12:00 (UTC) on September 1, 1992 (A, C) and at 18:00 (UTC) on September 1, 1992 (B, D) during TY9216.
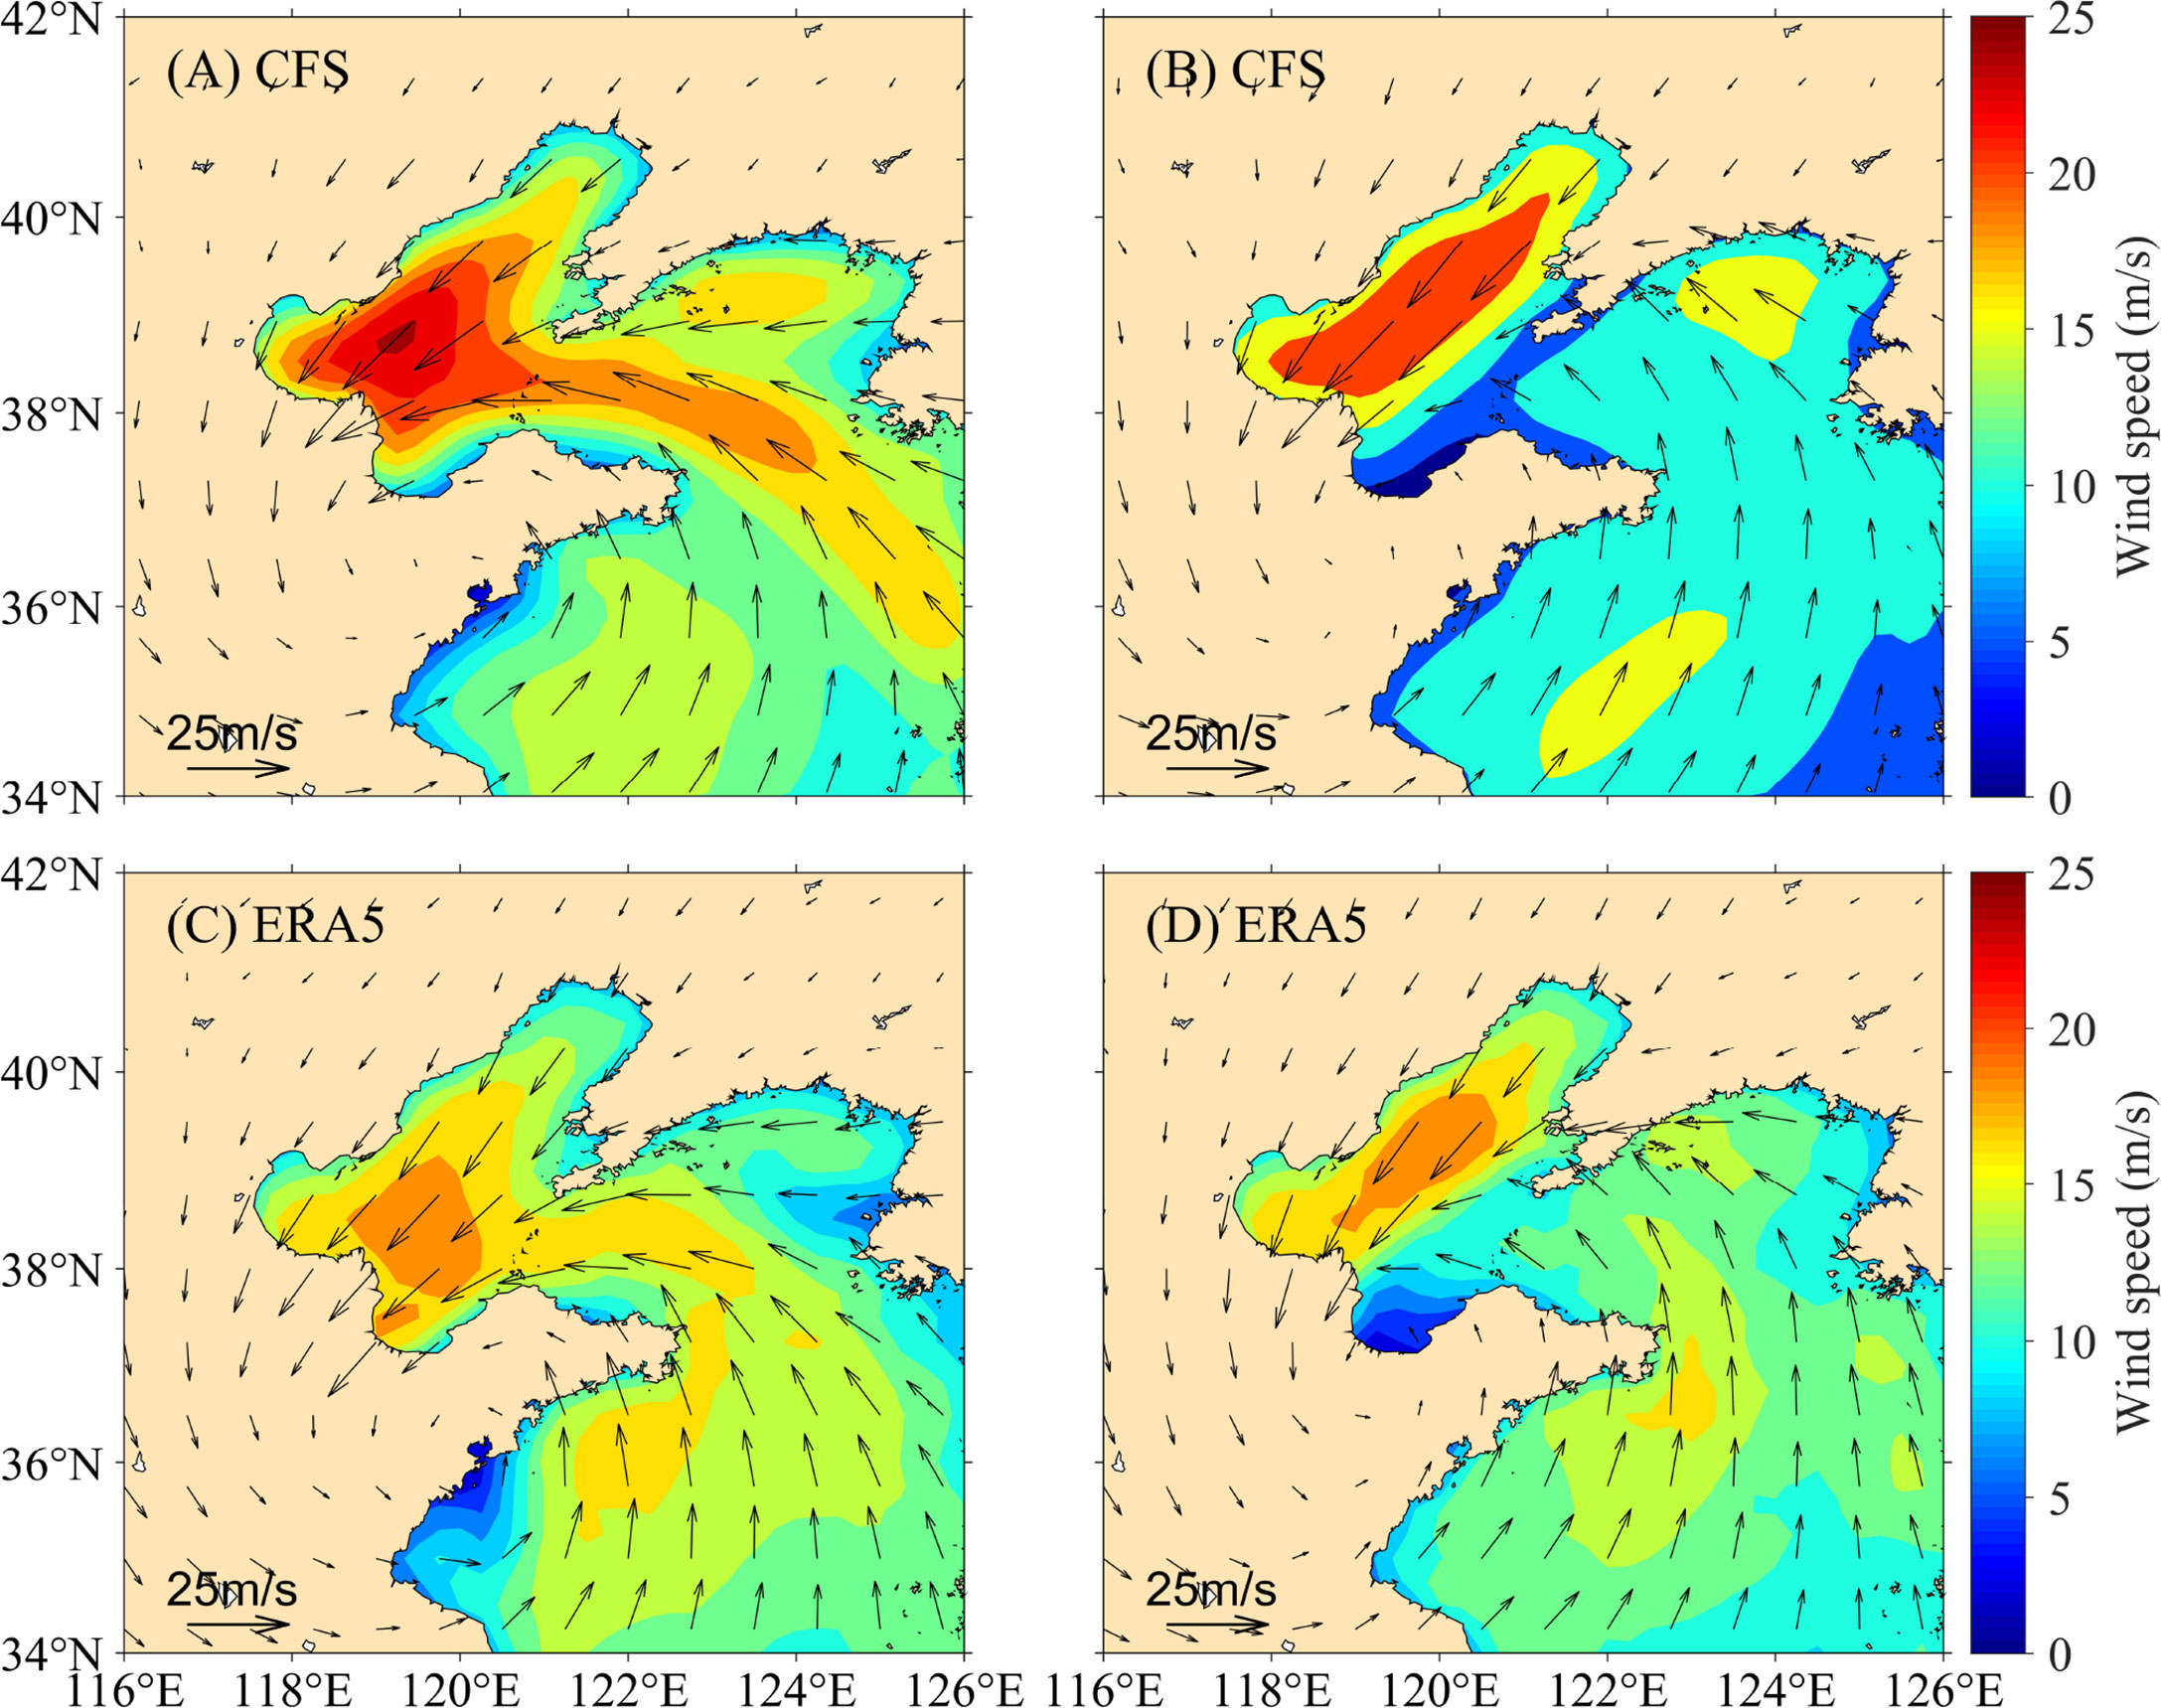
Figure 3 Comparisons of wind field snapshots between CFS and ERA5 at 12:00 (UTC) on August 11, 2019 (A, C) and at 18:00 (UTC) on August 11, 2019 (B, D) during TY1909.
The bathymetry data used in the LZB is a compound of electronic navigation charts whose spatial resolution is variable and the land elevation data using Digital Elevation Model (DEM, 1:50000) from Department of Natural Resources of Shangdong Province (http://dnr.shandong.gov.cn/). For other regions, we use the General Bathymetric Chart of the Oceans (GEBCO, https://www.gebco.net/) data whose resolution is 15 arc-seconds. The typhoon track information is provided by the China Meteorological Administration (CMA, Ying et al., 2014; Lu et al., 2021; http://tcdata.typhoon.org.cn/).
Figure 1 shows the typhoon tracks and central maximum wind speed information of TY9216 and TY1909; the locations of four tide stations, including HHA, WFG, LKO and PLI, in the Bohai Sea and information on the coastal cities of the LZB are also illustrated. Figure 4 provides a high-resolution inundation mesh which is created by Surface Water Modeling System (SMS) software and the distribution of water depth.
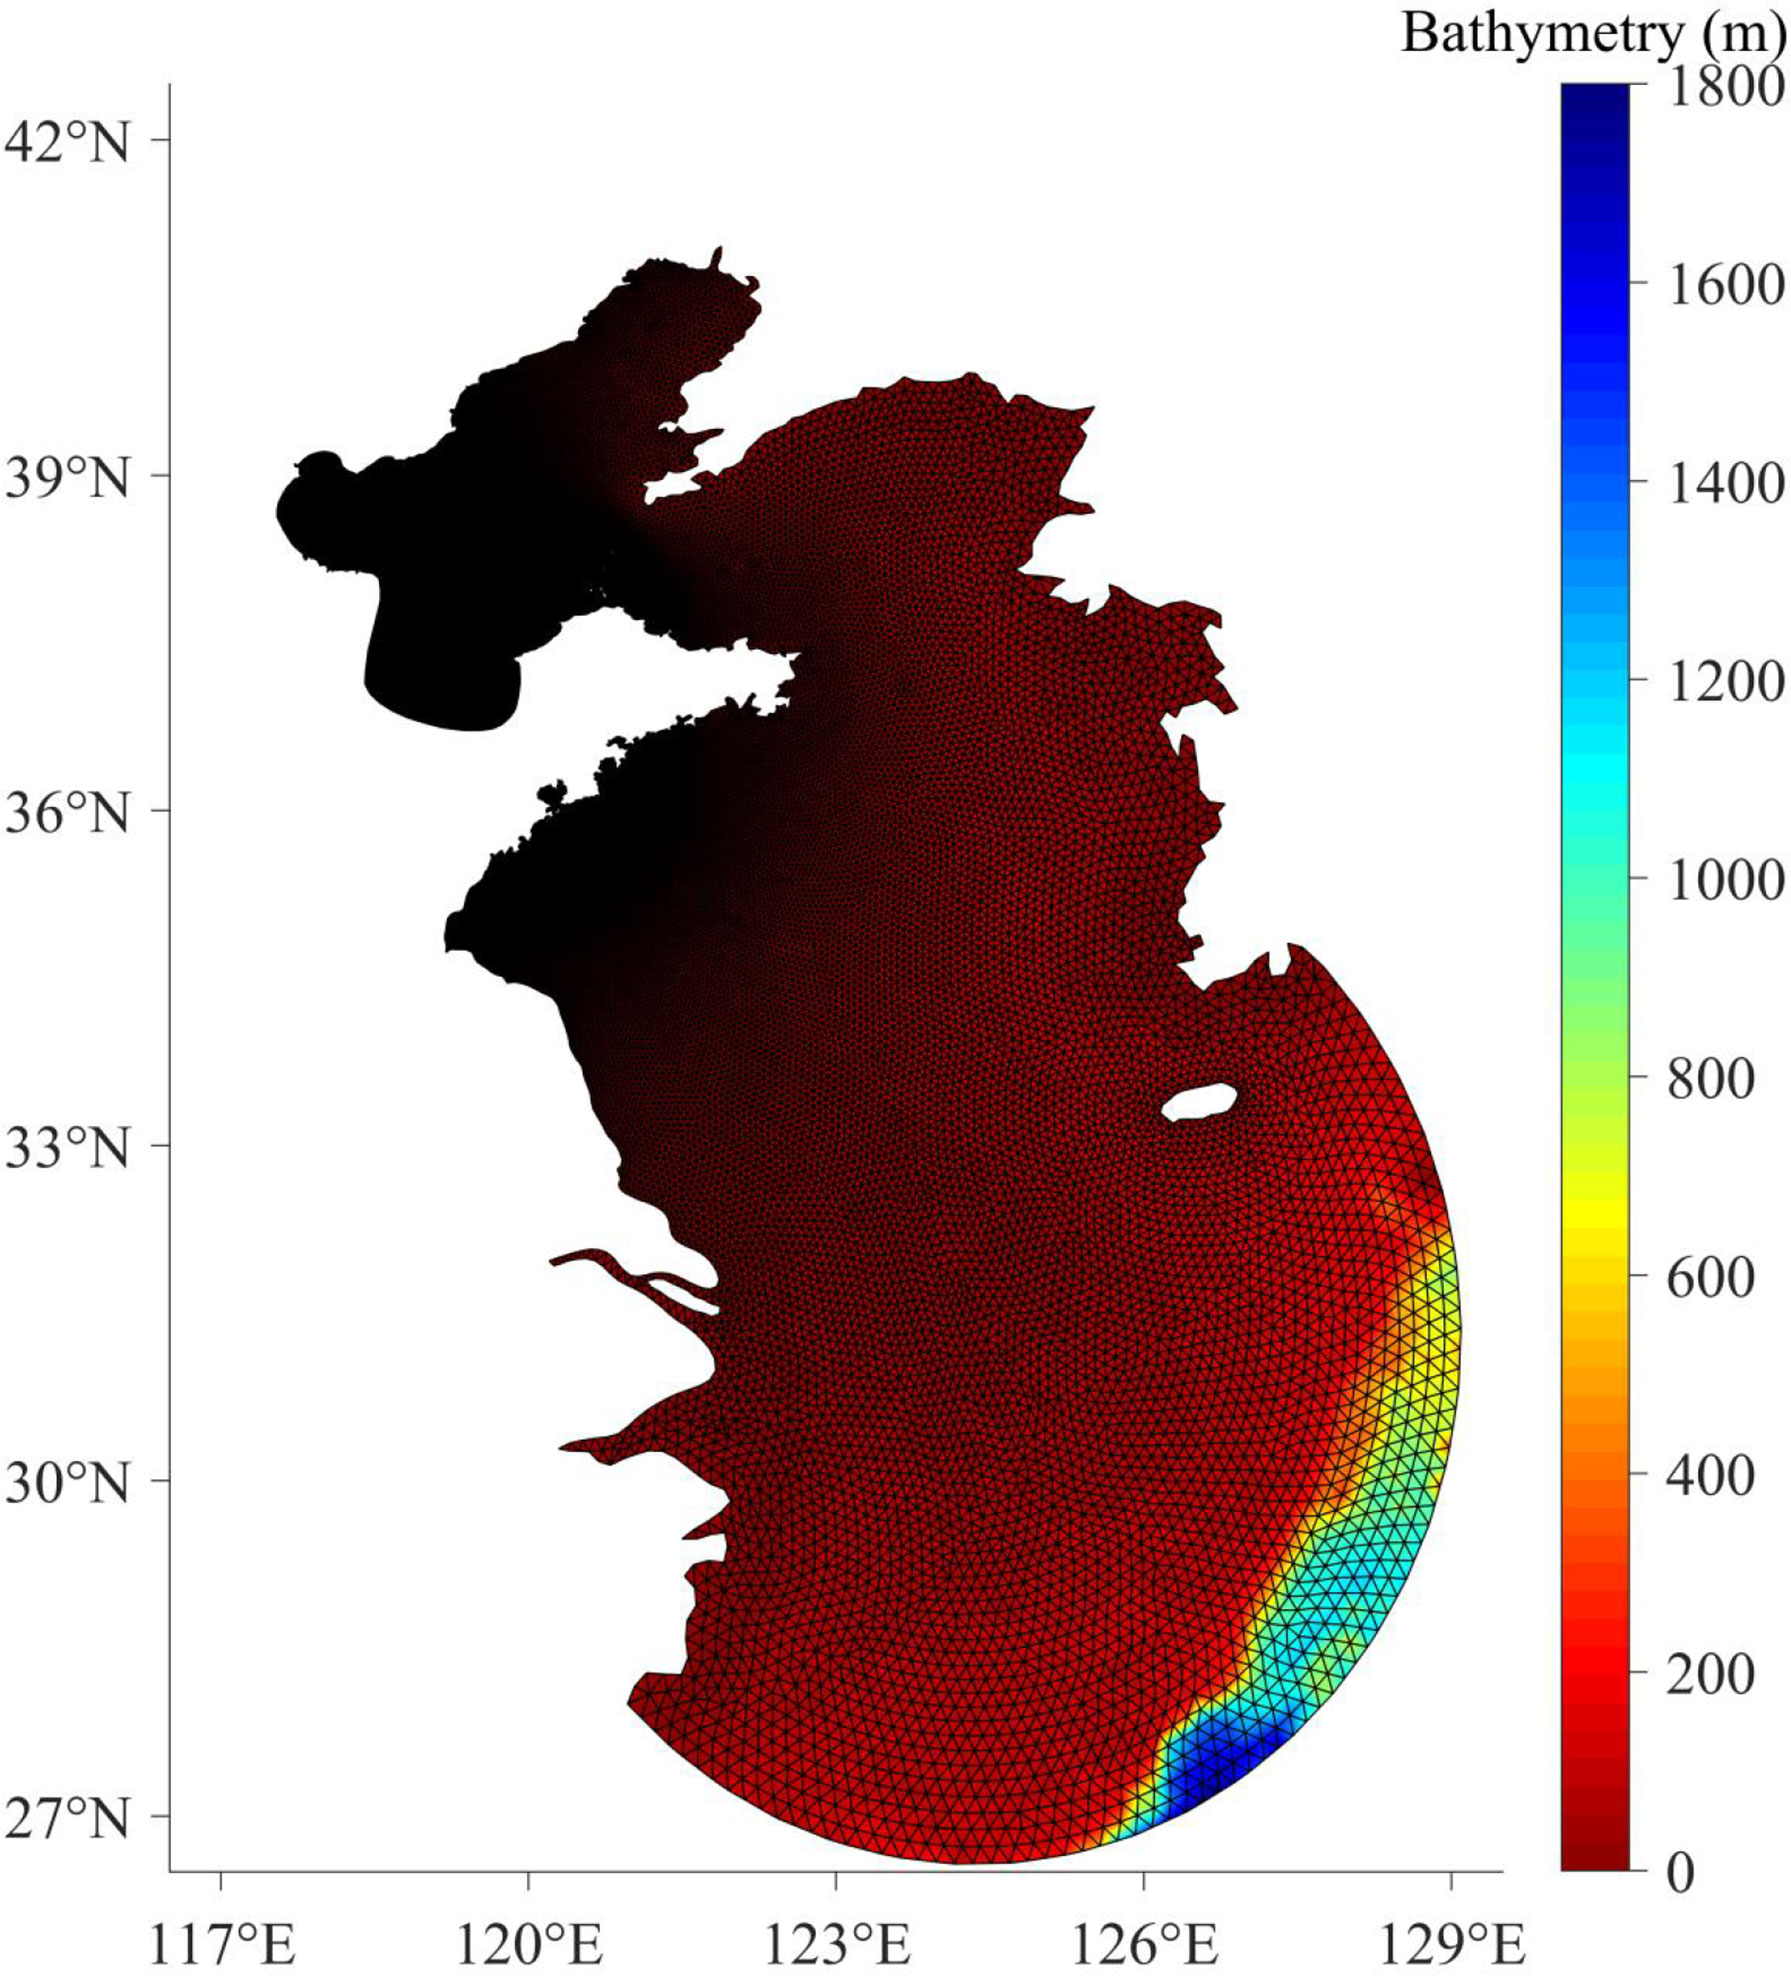
Figure 4 The bathymetry distribution and the total mesh including 109436 nodes and 215189 triangular elements, which possesses a resolution varying from 100 m to 20 km along the inland coastline to the open boundary; the mesh near Laizhou Bay has a resolution from 100 m to 1 km.
The model in this study applies the widely used coupled Advanced Circulation (ADCIRC) and Simulating Waves Nearshore (SWAN) model (Du et al., 2020b; Wang et al., 2020; Shi et al., 2021; Wang et al., 2021). The ADCIRC model is an advanced hydrodynamic model (Luettich et al., 1992), that obtains water level data and current data depending on the Generalized Wave Continuity Equation (GWCE) and the vertically integrated momentum equations. The SWAN model is a third-generation wave model for shallow water (Booij et al., 1999) that describes wave characteristics through the wave action density spectrum. Their main governing equations can be found in Dietrich et al. (2011). The coupling process includes the following steps: in our inundation mesh, ADCIRC gains a wind speed, simulated water level and current field that are passed to SWAN; simultaneously, SWAN translates the wave-induced radiation stress and wave parameters to ADCIRC, and some wave parameters (e.g., wave height, wave length) are involved in the calculation of the surface wind stress in ADCIRC, namely, the wave-induced surface stress.
The wave radiation stress (Sxx, Sxy, and Syy, Longuet-Higgins and Stewart, 1964; Dietrich et al., 2011) in the coupled model is denoted as:
in which ρ0 is the reference water density, g is the gravitational acceleration, N is the wave action density spectrum, θ is the wave propagating direction, σ represents the relative frequency, and n stands for the ratio of wave group speed to wave phase speed.
The surface wind stress (τs) in this coupled model is described by the bulk formula:
where ρa is the air density, Cd is the drag coefficient, and u10 stands for the wind speed at a height of 10 m above the Earth’s surface.
The default drag coefficient Cd1 in the model is calculated as follows (Garratt, 1977):
We modify the the default drag coefficient in the coupled model. The new drag coefficient Cd2 considering wave-induced surface stress uses wave steepness, and it is expressed as (Takagaki et al., 2012; Li et al., 2020):
where Hs represents the significant wave height and Lp represents the dominant wavelength.
In SWAN, we set the third-generation mode (GEN3) using Komen scheme; and we consider wind input, depth-induced breaking, whitecapping, triad wave-wave interactions, quadrant wave-wave interactions, and bottom friction dissipation, in which they are applied with the default settings, such as whitecapping effect using Komen scheme and bottom friction dissipation using JONSWAP scheme. In ADCIRC, we use eight tide constituents (K2, N2, Q1, M2, S2, O1, K1, and P1) from Oregon State University Tidal Prediction Software (OTPS). The time step of ADCIRC is one second and that of SWAN is one hour. The outputs of ADCIRC and SWAN are both at an interval of one hour. The inundation model begins the simulation with a cold start. The physical parameters of the numerical models are the same in following numerical simulations. The simulation times of the two typhoons are both 9 days. TY9216 lasted from 0:00 (UTC) on August 26, 1992, to 00:00 (UTC) on September 4, 1992, and TY1909 lasted from 0:00 (UTC) on August 5, 2019, to 00:00 (UTC) on August 14, 2019.
As listed in Table 1, six experiments are used to simulate storm inundation processes during TY9216 and TY1909.
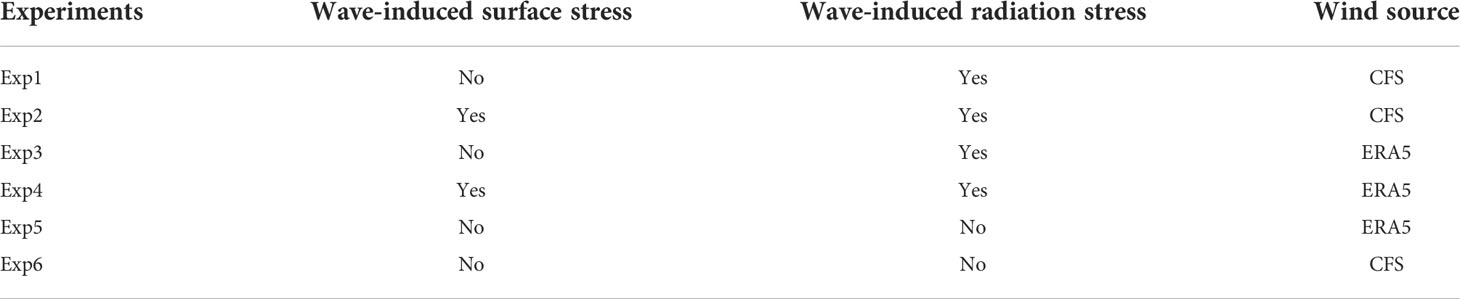
Table 1 Design of simulation experiments.
Error metrics, including root mean square error (RMSE), maximum error (MAXE) and relative error of the maximum (REM) are employed to evaluate the simulated storm water level at the tide gauge stations.
where Sim is the simulation, and Obs is the observation.
As illustrated in Figure 5 and Table 2, the CFS and ERA5 wind fields both reproduced the dynamic variations in storm surge levels at the tide gauge stations well. The Exp1 results indicated that CFS wind data underestimated the peak surge level except at the HHA and LKO stations during TY1909, and the Exp3 results indicated that ERA5 wind data underestimated the peak surge level during the two typhoons; however, the CFS peak surge was higher than the ERA5 peak surge. The wave-induced radiation stress effect (Exp5 and Exp6) only slightly changed the peak surge, but the wave-induced surface stress effect (Exp2 and Exp4) significantly enhanced the peak surge and resulted in a better peak simulation.
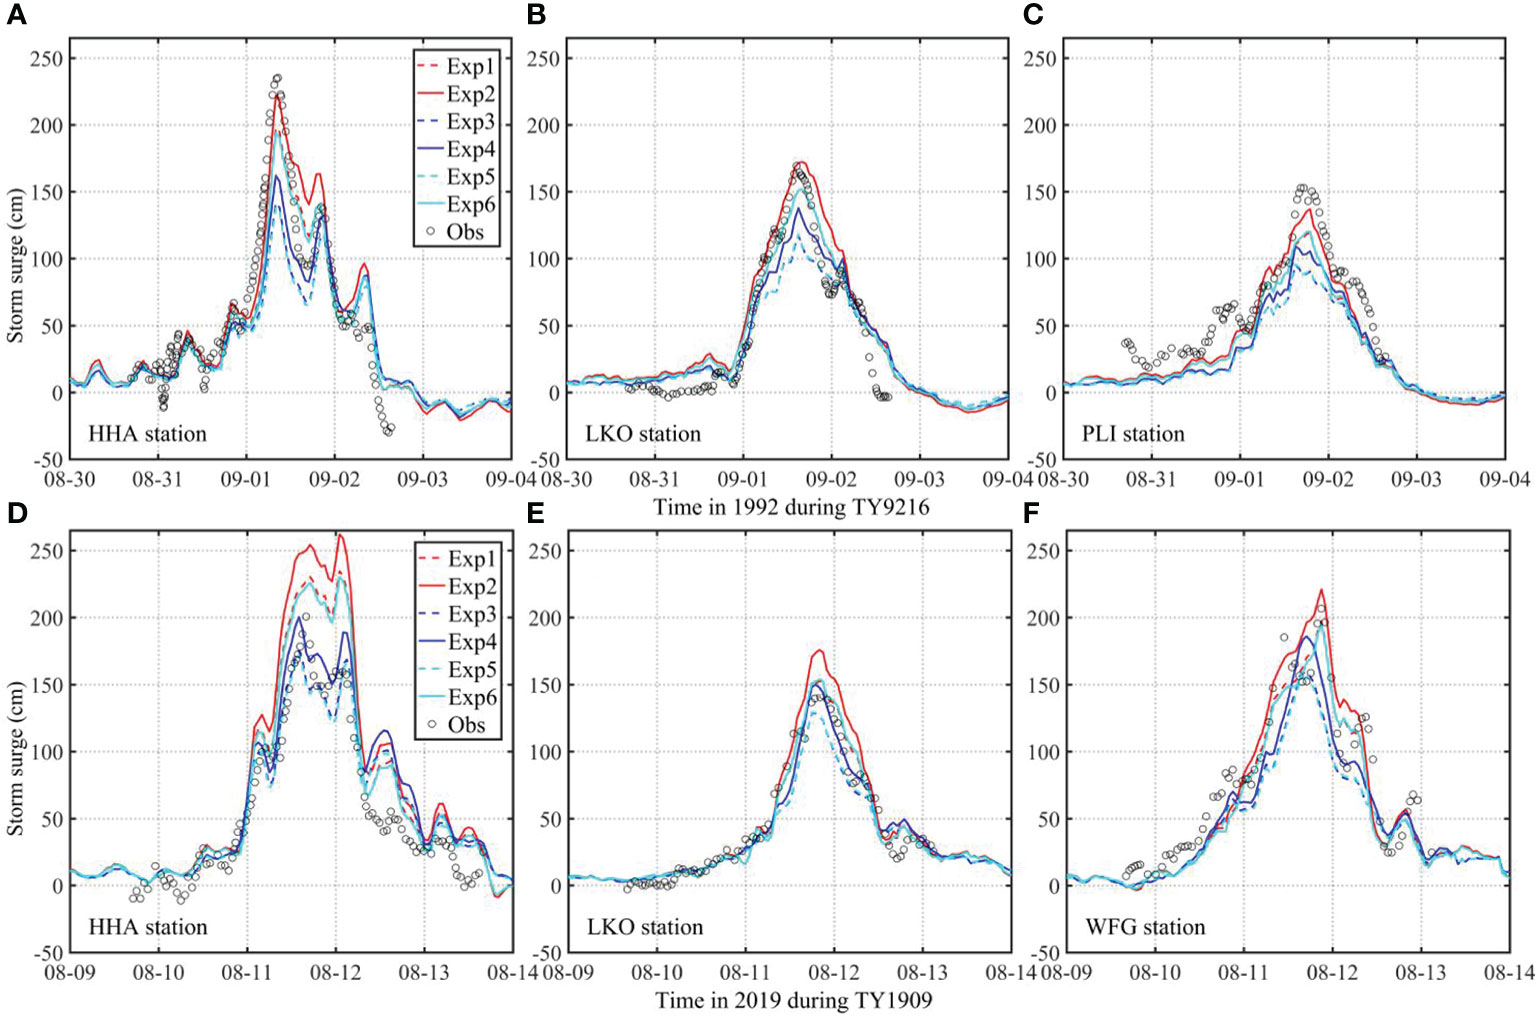
Figure 5 Storm surge verification at the tide gauge stations, including HHA station (A), LKO station (B) and PLI station (C) during TY9216, and HHA station (D), LKO station (E) and WFG station (F) during TY1909.
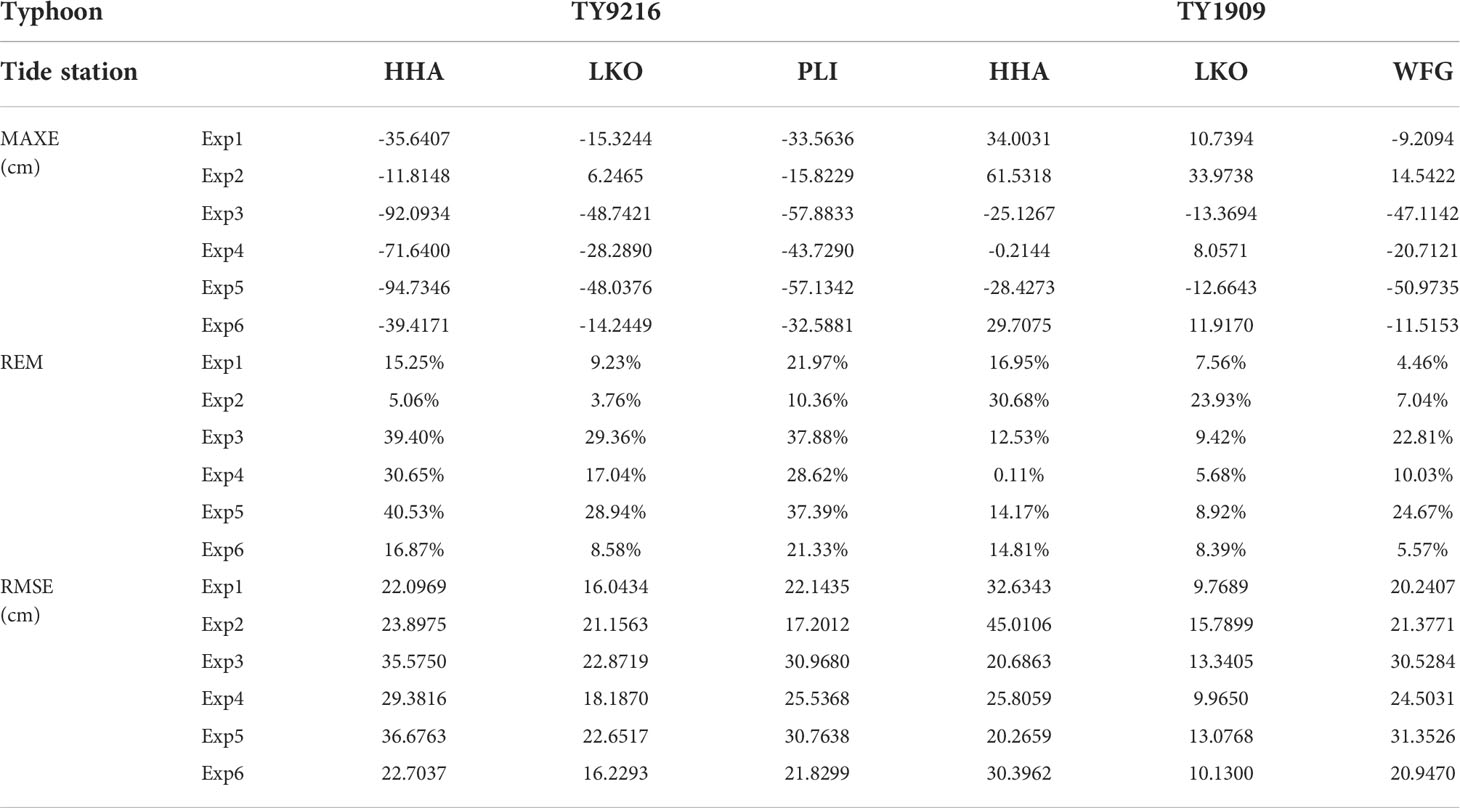
Table 2 Error metrics of storm surge.
In summary, both ERA5 and CFS data can reproduce hydrodynamic processes well during TY9216 and TY1909, but the CFS produces a stronger peak water level, and no consensus can be gained on which wind field source is the best choice, as CFS produces a better simulation in the case of TY9216, while the ERA5 simulations are better in the case of TY1909; wave-induced surface stress significantly enhances the peak storm surge level, and the effects of wave-induced radiation stress are comparably small.
The storm inundation distributions are illustrated in Figures 6, 7 during TY9216 and TY1909, respectively, in which the difference between Exp2 and Exp1 represented the effect of wave-induced surface stress on storm inundation using CFS wind data, and the corresponding CFS increasing rate was this difference divided by Exp1. The difference between Exp4 and Exp3 indicated the effect of wave-induced surface stress on storm inundation using ERA5 wind data, and the corresponding ERA5 increasing rate was this difference divided by Exp3. The difference between Exp1 and Exp6 represented the effect of wave-induced radiation stress on storm inundation using CFS wind data, and the corresponding CFS increasing rate was this difference divided by Exp6. The difference between Exp3 and Exp5 indicated the effect of wave-induced radiation stress on storm inundation using ERA5 wind data, and the corresponding ERA5 increasing rate was this difference divided by Exp5. When quantitatively analyzing inundation depth, for avoiding abnormal values, we took the average value of inundation depth in this region for research, namely, average inundation depth. In addition, Laizhou City in the LZB was not included in the inundation area and average inundation depth.
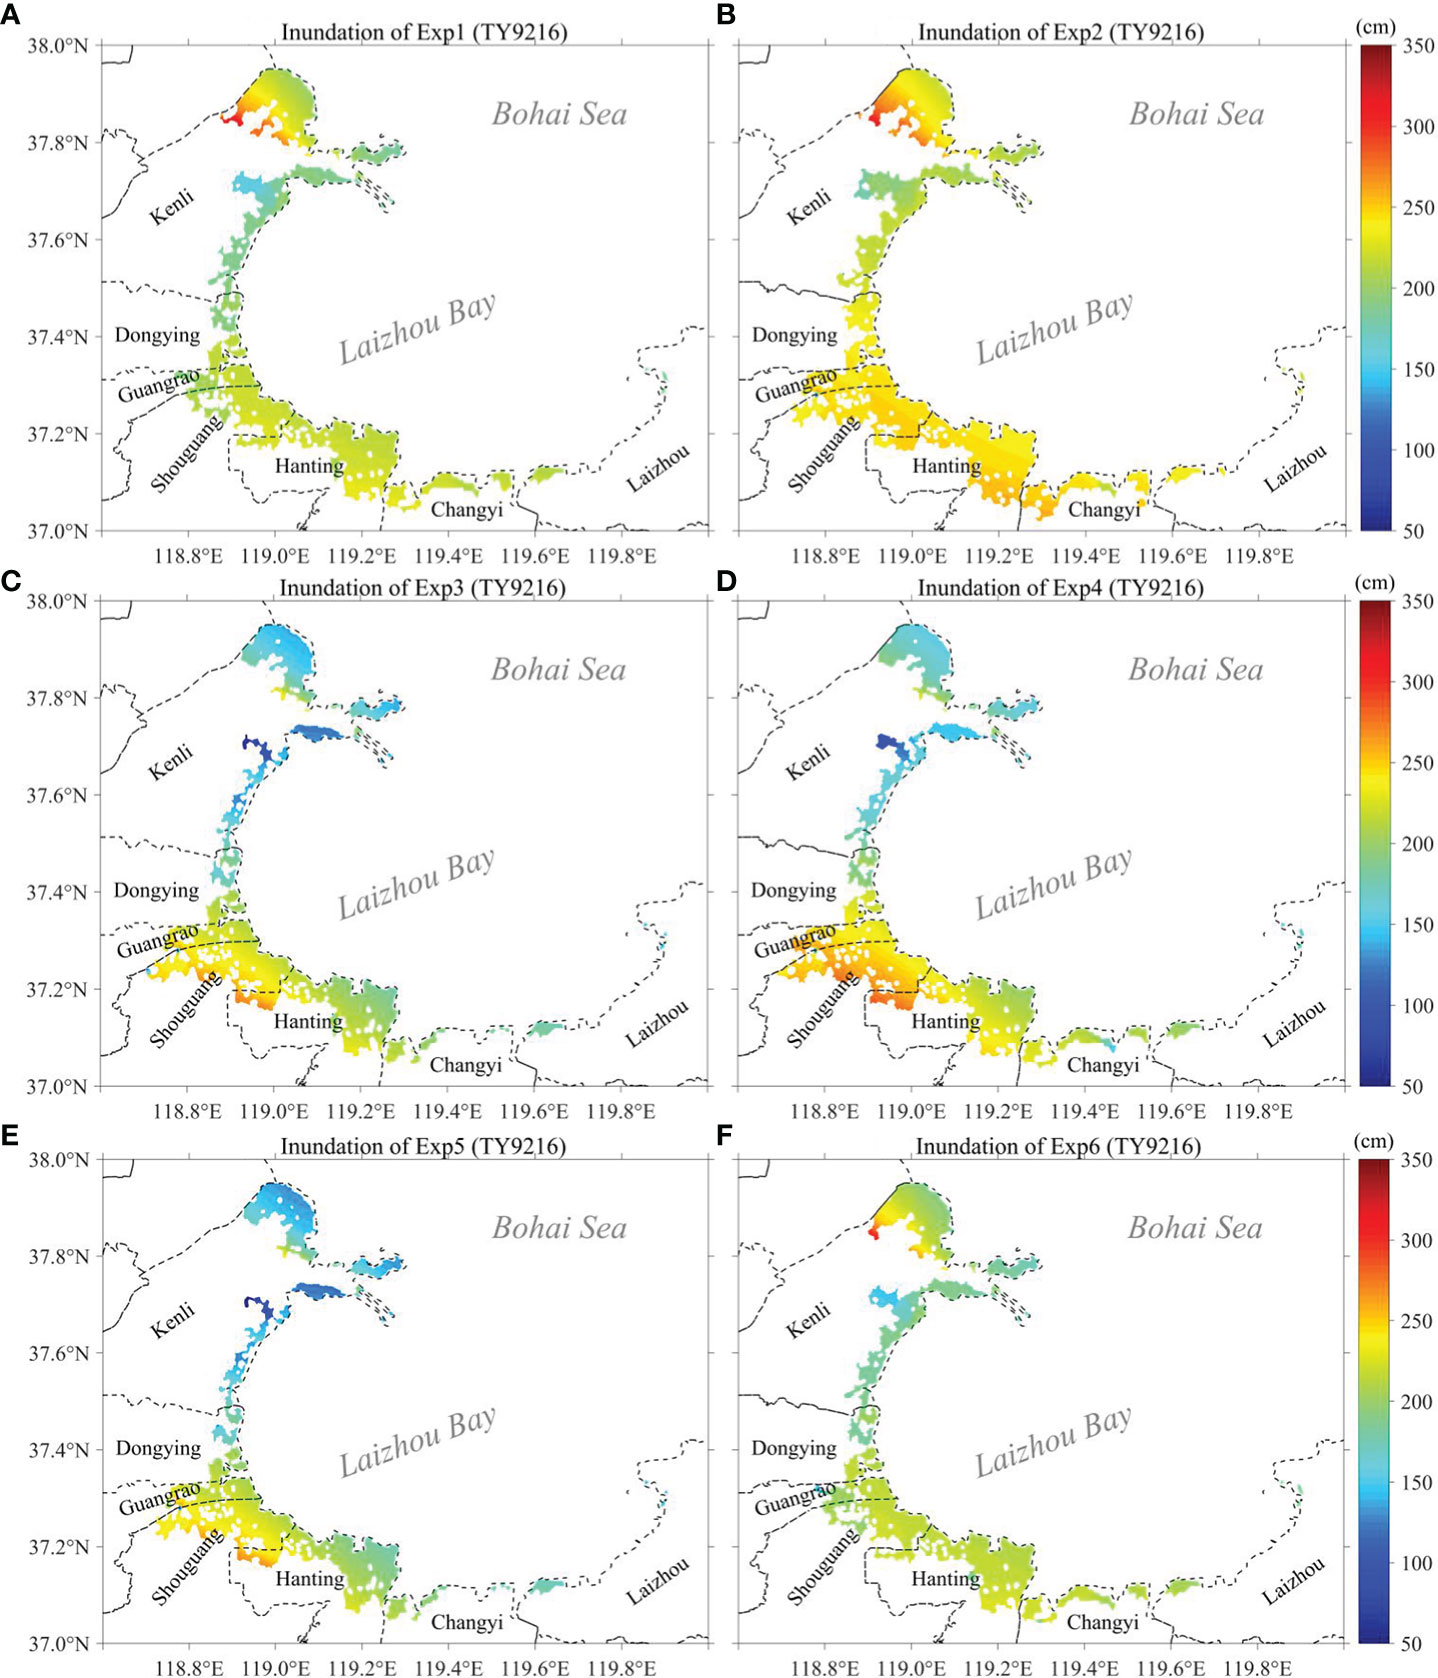
Figure 6 Inundation distributions and inundation depth (unit: cm) of TY9216 under Exp1 (A), Exp2 (B), Exp3 (C), Exp4 (D), Exp5 (E), and Exp6 (F) along the LZB.
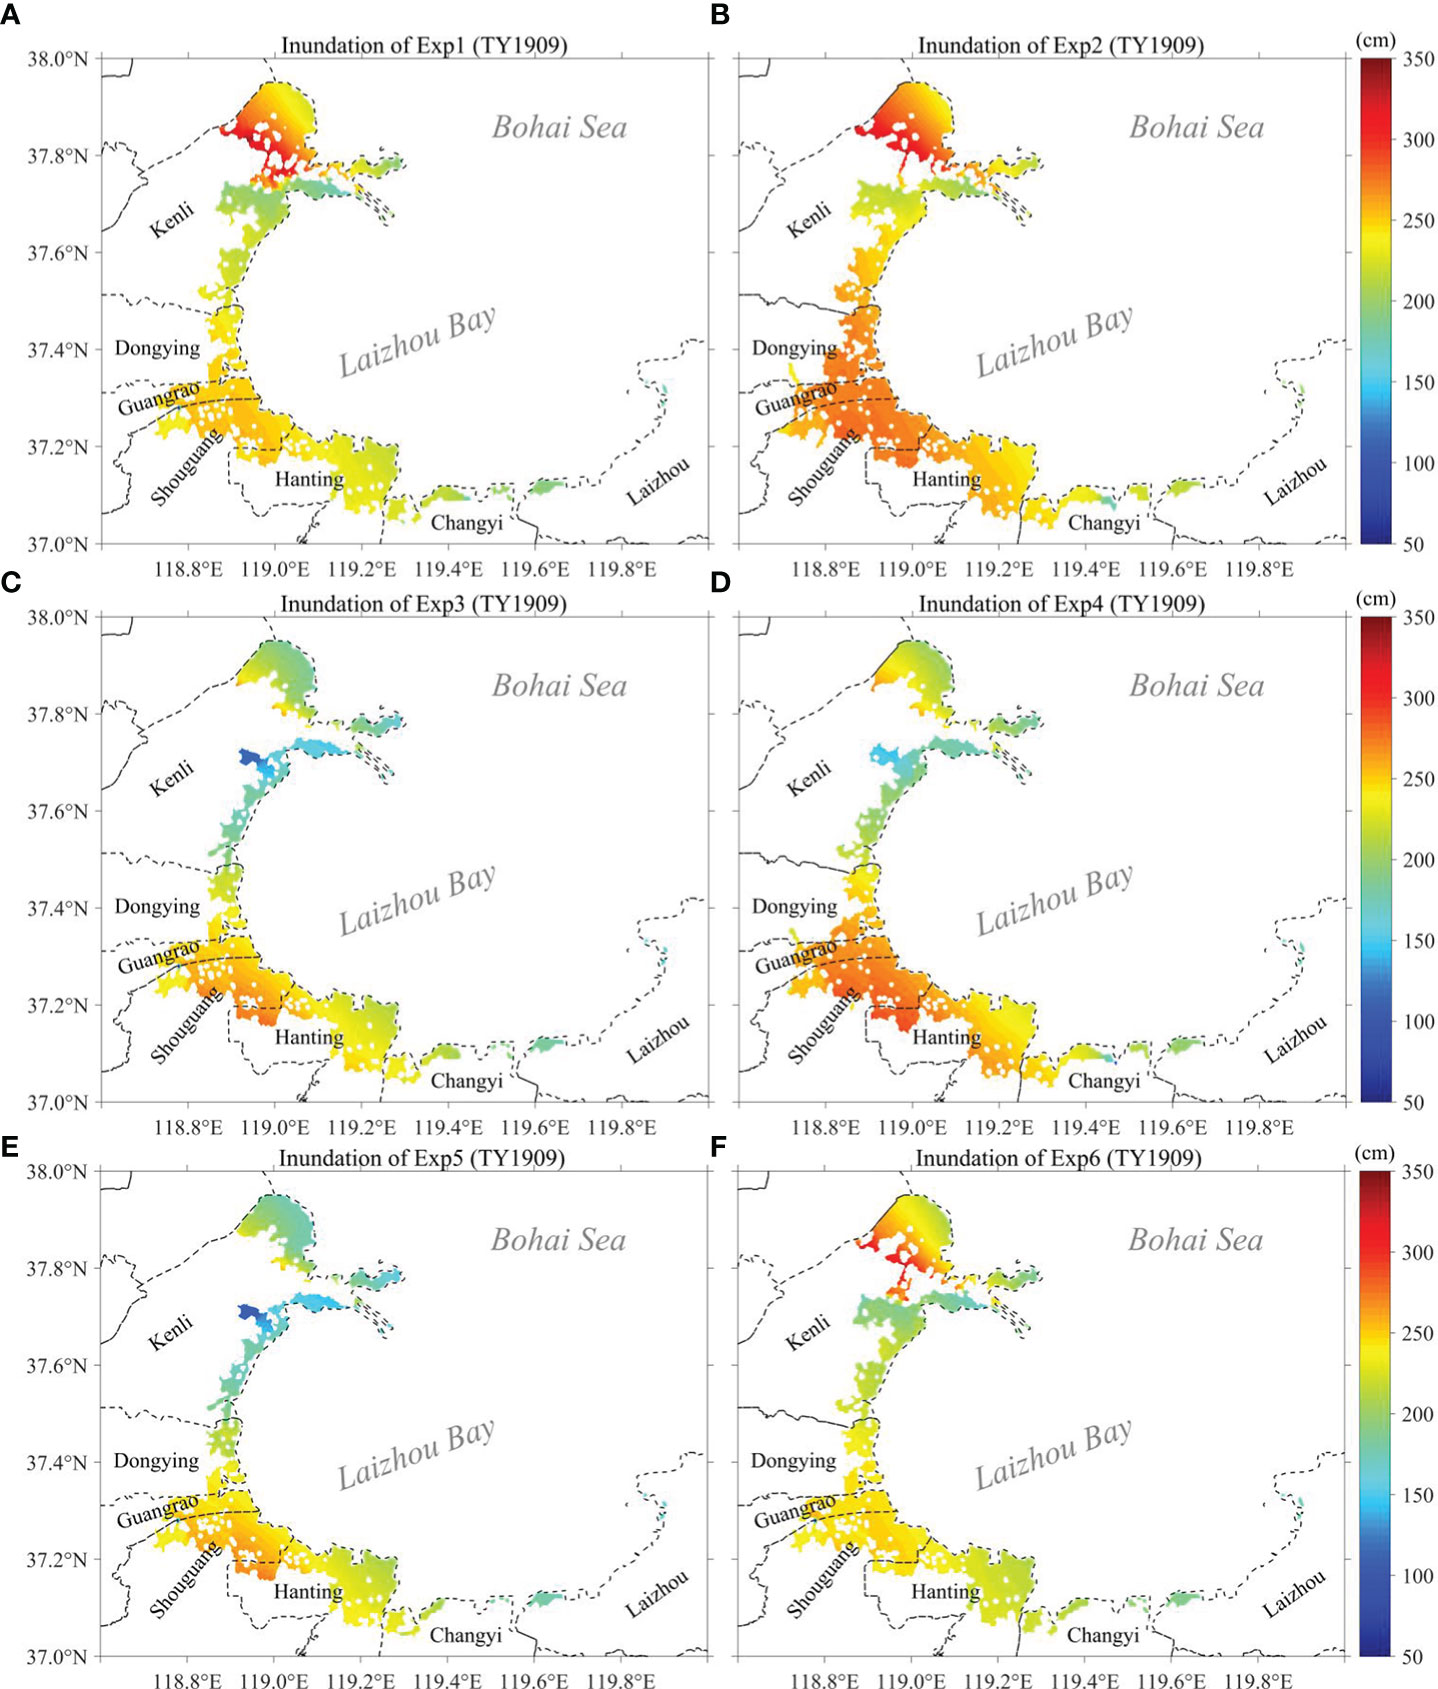
Figure 7 Inundation distributions and inundation depth (unit: cm) of TY1909 under Exp1 (A), Exp2 (B), Exp3 (C), Exp4 (D), Exp5 (E), and Exp6 (F) along the LZB.
As shown in Figures 6, 7, the two typhoons both caused extensive inundation along the LZB. The inundation extent was not consistent from west to east along the coastline of LZB, as larger coastal inundation mainly occurred in the northwest top and southwest bottom of LZB. The inundation area of the Kenli District was the largest among the LZB cities during the two typhoons, which might be attributed to the lower elevation and the longer coast. In addition, the overall characteristics of inundation distributions along the LZB between the two typhoons were similar, and this seemed to indicate that the inundation distribution in the LZB were mainly affected by the topography, followed by the typhoon characteristics.
As described in Table 3, the TY9216 inundation area could reach 1279.2121 km2 by using CFS data and 1105.5596 km2 by using ERA5 data, and those of TY1909 are larger, which could reach 1469.3708 km2 by using CFS data and 1259.7890 km2 by using ERA5 data. Namely, the TY1909 inundation area was 14.87% and 13.95% greater than that of TY9216 using CFS data and ERA5 data, respectively. Systematical variation in the inundation area is resulted from the different wind sources, as the CFS simulation was larger than that of the ERA5 simulation during the two typhoons, by 15.71% during TY9216 and by 16.64% during TY1909.
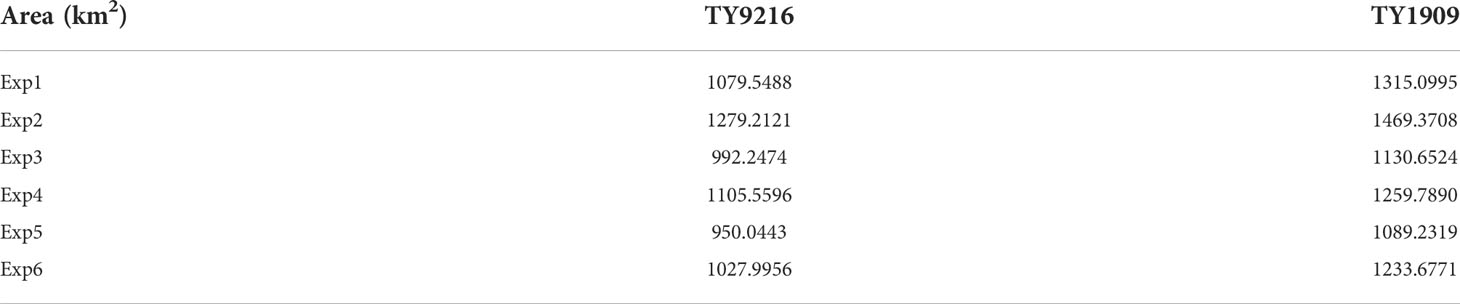
Table 3 The total inundation areas (unit: km2) along the LZB during TY9216 and TY1909.
Table 4 shows the wave-induced inundation area differences during the two typhoons. The wave-induced surface stress and wave-induced radiation stress both enhanced the inundation area. The enhancement of the inundation area caused by wave-induced surface stress reached 18.50% by using CFS data and 11.42% by using ERA5 data during TY9216; it reached 11.73% using CFS data and 11.42% using ERA5 data during TY1909. The enhancement of the inundation area caused by wave-induced radiation stress was up to 5.01% under the CFS simulation and 4.44% under the ERA5 simulation during TY9216, and up to 6.60% under the CFS simulation and 3.80% under the ERA5 simulation during TY1909. The contribution of wave-induced surface stress is more significant than that of wave-induced radiation stress, which has also been numerically reported in previous studies (e.g., Xie et al., 2008; Wang et al., 2020), and its relative contribution shows the sensitivity on the choice of wind drag coefficient.
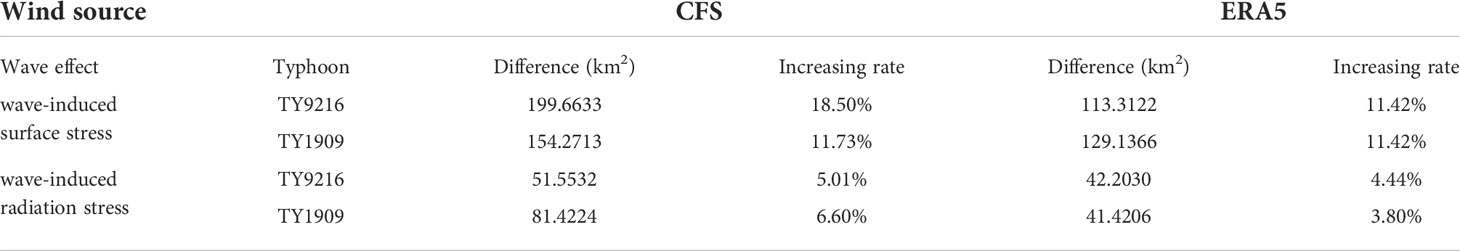
Table 4 The differences in the total inundation areas along the LZB during TY9216 and TY1909.
Figures 6, 7 also show the spatial patterns of inundation depth during TY9216 and TY1909, respectively, and Table 5 provides the specific values of the average inundation depth. The average inundation depth could reach 234.6368 cm (forced by CFS) and 190.6881 cm (forced by ERA5) during TY9216 and 259.7421 cm (forced by CFS) and 227.2172 cm (forced by ERA5) during TY1909. Similar to the characteristics of the inundation area, the average inundation depth in the CFS simulation was larger than that in the ERA5 simulation, where the depths in the CFS simulations were 23.05% and 14.31% greater than those in the ERA5 simulations during TY9216 and TY1909, respectively. The average inundation depth of TY1909 was higher than that of TY9216, where the depth during TY1909 was 10.70% higher than that during TY9216 using CFS and 19.16% higher than that during TY9216 using ERA5.
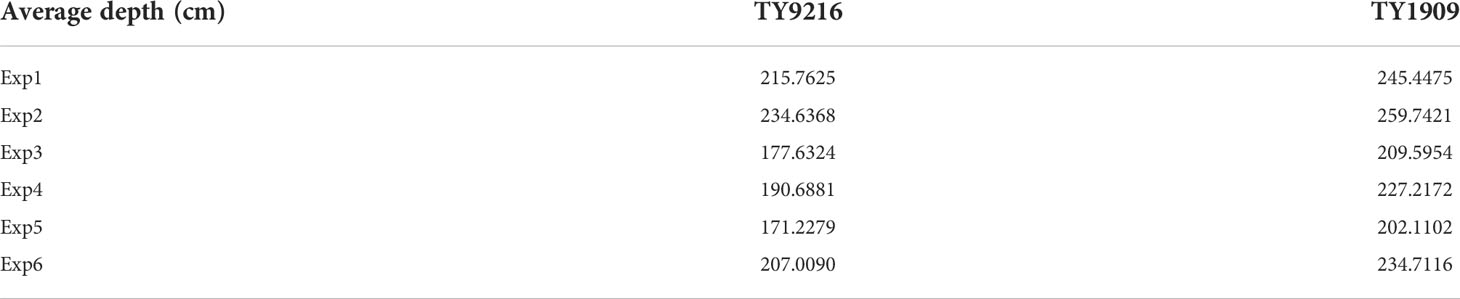
Table 5 The average inundation depth (unit: cm) along the LZB during TY9216 and TY1909.
The difference in the average inundation depth induced by the wave effects is given in Table 6. The two wave-stress effects also enhanced the inundation depth. Wave-induced surface stress enhanced the average inundation depth by 8.75% using CFS and 7.35% using ERA5 during TY9216, and it reached 5.82% using CFS and 8.41% using ERA5 during TY1909. Wave-induced radiation stress enhanced the average inundation depth by 4.23% using CFS and 3.74% using ERA5 during TY9216, and it reached 4.57% using CFS and 3.70% using ERA5 during TY1909. Again, the enhancement in the average inundation depth caused by wave-induced surface stress was more significant than that caused by wave-induced radiation stress, and the sensitivity was shown for different wind sources.
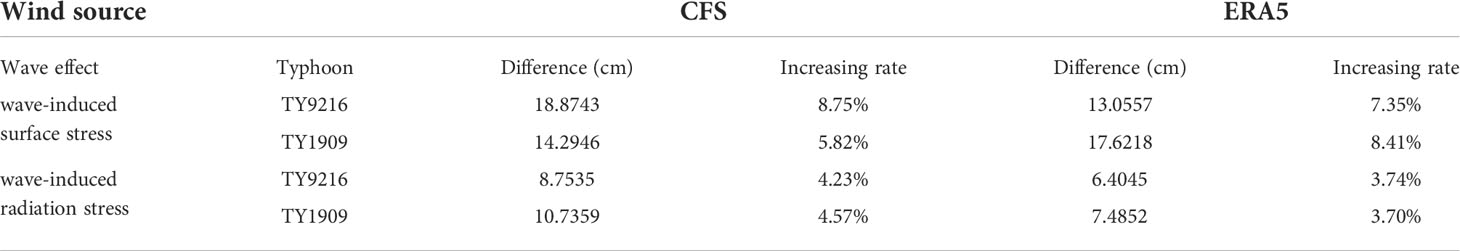
Table 6 The difference in the average inundation depth along the LZB during TY9216 and TY1909.
Figure 8 and Table 7 illustrate the inundation difference between the two wind fields. Obviously, CFS induced severer storm inundation in Kenli District than ERA5 did during the two typhoons, and the difference in other regions was weak, which indicated that the impact of wind sources on coastal inundation in the bottom regions of LZB was slighter than in other regions. Besides, some regions also showed that the ERA5 data produced a greater inundation depth and inundation area, such as Guangrao County and Shouguang City during TY9216 and Hanting District during TY1909. Therefore, the performance of these two wind field sources in certain regions is uncertain; thus, when studying coastal storm inundation, reanalysis datasets should be selected appropriately.
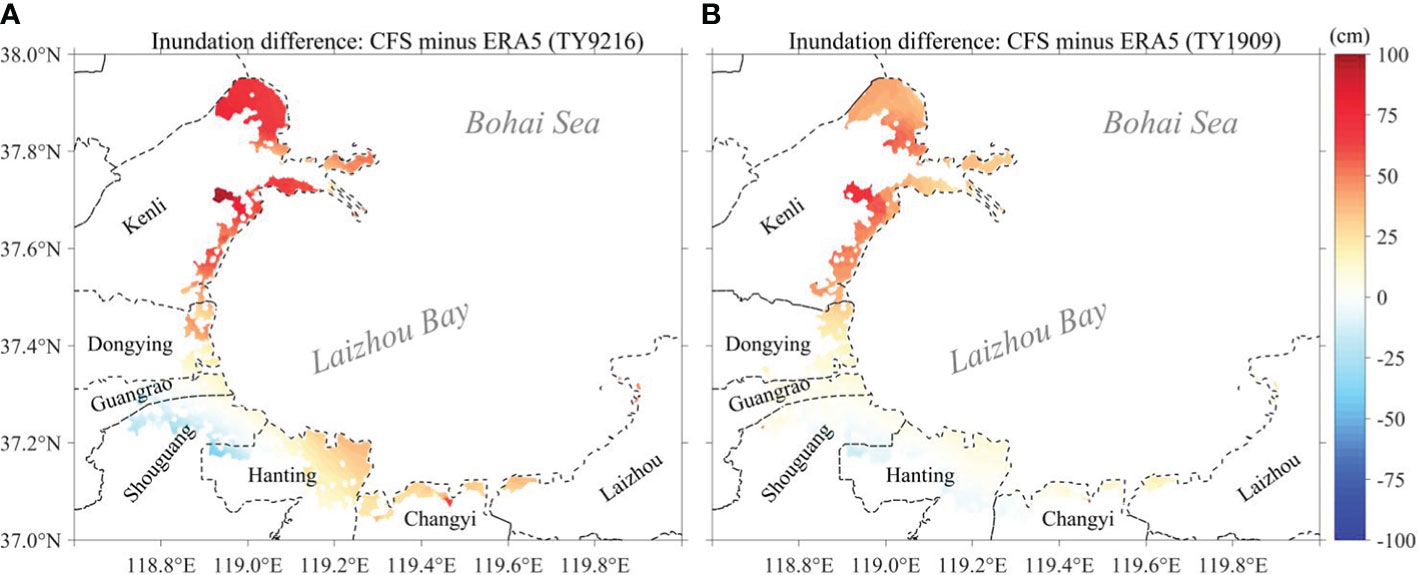
Figure 8 The inundation depth difference (cm) distributions between CFS- (Exp2) and ERA5-based (Exp4) simulations along the LZB during TY9216 (A) and TY1909 (B).
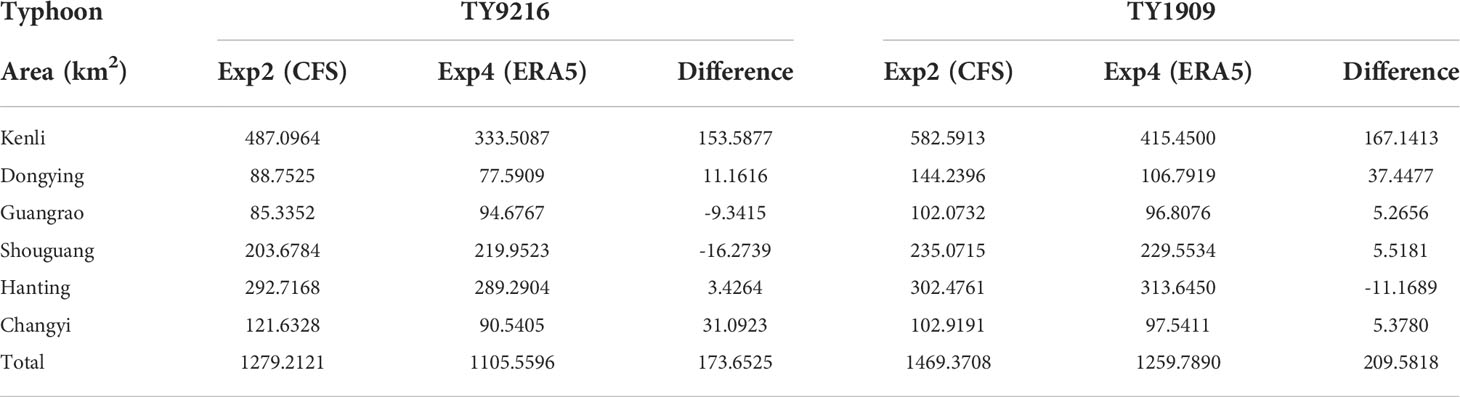
Table 7 The inundation areas and their differences between CFS- (Exp2) and ERA5-based (Exp4) simulations along the LZB during TY9216 and TY1909.
In summary, all the effects considered in this study are shown to have unnegligible contributions to the storm inundation in terms of the inundation area and average inundation depth in the LZB. For the two wind sources, the inundation area and average inundation depth were greater in the CFS simulation than in the ERA5 simulation, with a 15.71%-16.64% larger inundation area and a 14.31%-23.05% greater average inundation depth. For the two wave effects, the wave-induced surface stress effect induced more inundation than the wave-induced radiation stress effect, as the former increased the inundation area by 11.73%-18.50% (using CFS) and 11.42% (using ERA5) and increased the average inundation depth by 5.82%-8.75% (using CFS) and 7.35%-8.41% (using ERA5). The wave-induced radiation stress effect increased the inundation area by 5.01%-6.60% (using CFS) and 3.80%-4.44% (using ERA5) and increased the average inundation depth by 4.23%-4.57% (using CFS) and 3.70%-3.74% (using ERA5). In addition, considerable differences are shown between the two typhoon cases, as the storm inundation during TY1909 is much stronger than TY9216, with a 13.95%-14.87% larger inundation area and a 10.70%-19.16% higher average inundation depth.
The impact of wind source on the storm surge and waves has been frequently documented in previous studies (Chu et al., 2019; Hsiao et al., 2019; Li et al., 2022b). The generally stronger inundation (greater inundation area and average inundation depth) is not surprised because the CFS simulation predicts a larger peak surge at the tide gauge stations in comparison with the ERA5 simulation, which is attributed to that the higher wind speed of the CFS data. In recent years, many studies have suggested that the CFS data have a tendency to show more intense wind speeds and wave simulations (Stopa and Cheung, 2014; Hsiao et al., 2019; Li et al., 2022b), cyclones (Gramcianinov et al., 2020) and storm surge simulations (Chu et al., 2019). Although it is expected an overall more significant inundation using CFS wind data, as seen in Figure 8 and Table 7, conclusions should be made with caution in specific regions, which is not so sensitive to the storm intensity but may be related to small-scale wind structure.
The great contribution of surface wind wave to the storm surge has been well realized because the storm surge level simulations can be considerably improved using a wave-surge coupled model (e.g., Xie et al., 2003; Sheng et al., 2010; Bertin et al., 2015; Pineau-Guillou et al., 2020). In this study, the two wave effects, i.e. the wave-induced surface stress effect and wave-induced radiation stress effect, both show an increasing effect on coastal inundation along the LZB; wave-induced surface stress induces more inundation area by strengthening the wind forcing, accounting for more than 10%, than that of wave-induced radiation stress (~5%). This may be attributed to the fact that the waves in the LZB are less developed due to the limited fetch of that region compared to that of the open sea. Some differences in the wave-stress contribution are demonstrated between the two typhoon cases and the usage of the two wind data, while the differences appear to be quite small (Tables 4, 6), indicating that wave effects on coastal inundation are not so sensitive to typhoon characteristics including the track, landfall location, intensity and translation speed, it appears to be largely related to the local topography conditions. Of course, more typhoon cases are needed to verify this finding in a further study.
These results also indicate that noticeable differences in the coastal inundation between the two typhoon cases, as the inundation area and depth induced by TY1909 are greater than those induced by TY9216. The differences may be attributed to the typhoon characteristics, as shown in Figure 1, the TY9216 track passed through the Shandong Peninsula from the right side of the LZB, but the TY1909 track passed directly through the LZB, as a result, the storm inundation are more directly forced during TY1909. Similar results on the effects of different moving paths (Peng et al., 2006; Xia et al., 2008; Du et al., 2020b) and different landfall locations (Peng et al., 2006) on storm inundation have been documented. In addition, the storm intensity and translation speed further contribute to the difference, when the two typhoons passed through the Shandong Peninsula, TY9216 showed a weaker central maximum wind speed but a faster translation speed than TY1909 (Figure 1), and the stronger typhoon intensity (Rego and Li, 2009; Shi et al., 2020; Du et al., 2020b) and slower typhoon translation speed (Peng et al., 2006; Rego and Li, 2009; Sahoo and Bhaskaran, 2018) have been suggested to cause more severe coastal inundation.
Using the numerical model ADCIRC+SWAN, the storm inundation processes of TY9216 and TY1909 in Laizhou Bay are simulated, and the effects of two wind fields (CFS and ERA5) and two wave stresses (surface stress and radiation stress) on storm inundation during the two typhoons are explored. It is found that TY1909 produces a larger inundation area and a greater average inundation depth than TY9216 does; although the CFS inundation simulation is larger than the ERA5 inundation simulation, the two wind field sources both reproduce the hydrodynamic process of storm inundation well, but they show clear differences in magnitude. In addition, the enhancing effects of wave stress on coastal inundation cannot be neglected, and the enhancing effects of wave-induced surface stress on inundation area and average inundation depth are stronger than those under wave-induced radiation stress.
The simulation results clearly show the influences of different typhoons, different wind field sources and different wave-stress effects on coastal inundation in Laizhou Bay, which are believed to obtain some common sense on studying the storm surge-induced inundation in the coastal region. Although these two typhoons are representative, more typhoon cases would be useful to further evaluate the wave effect and the influence of the wind field. In addition, the effect of coastal levee is not included in this study, inundation validation is also not considered because the measured data and satellite images cannot be available during the storm events. Meanwhile, this study ignores the wave-induced bottom stress effect, and the interaction effects of these three wave stresses and coastal levee on inundation should be fully considered in the future.
The original contributions presented in the study are included in the article/supplementary material. Further inquiries can be directed to the corresponding authors.
ZL designed and wrote the manuscript. SL contributed to the designed test and revision of the manuscript. YH and BY were responsible for supervising manuscripts. PH and DM provided some ideas and JL gave some supporting data. MD and JY participated in the revision of the manuscript. All authors read and agreed the manuscript.
This research was sponsored by the Strategic Priority Research Program of the Chinese Academy of Sciences(XDA19060202), the National Natural Science Foundation of China (41976010, U1706216, U1806227). And the Open Fund Project of Key Laboratory of Marine Environmental Information Technology and Oceanographic Data Center, Institute of Oceanography, Chinese Academy of Sciences (IOCAS) supported this research.
We would like to acknowledge the ADCIRC+SWAN coupled model developed by the ADCIRC development team. We thanked the the data support provided by ECMWF ERA5, NCEP CFS, GEBCO, and CMA. We appreciated the technical support given by and the High Performance Computing Center, IOCAS and the data service provided by the Oceanographic Data Center, Chinese Academy of Sciences (CASODC) (http://msdc.qdio.ac.cn).
The authors declare that the research was conducted in the absence of any commercial or financial relationships that could be construed as a potential conflict of interest.
All claims expressed in this article are solely those of the authors and do not necessarily represent those of their affiliated organizations, or those of the publisher, the editors and the reviewers. Any product that may be evaluated in this article, or claim that may be made by its manufacturer, is not guaranteed or endorsed by the publisher.
Afshar-Kaveh N., Ghaheri A., Chegini V., Etemad-Shahidi A., Nazarali M. (2017). Evaluation of different wind fields for storm surge modeling in the Persian gulf. J. Coast. Res. 33 (3), 596–606. doi: 10.2112/JCOASTRES-D-15-00202.1
Akbar M. K., Kanjanda S., Musinguzi A. (2017). Effect of bottom friction, wind drag coefficient, and meteorological forcing in hindcast of hurricane Rita storm surge using SWAN+ ADCIRC model. J. Mar. Sci. Eng. 5 (3), 38. doi: 10.3390/jmse5030038
Bertin X., Li K., Roland A., Bidlot J. R. (2015). The contribution of short-waves in storm surges: Two case studies in the bay of Biscay. Continent. Shelf. Res. 96, 1–15. doi: 10.1016/j.csr.2015.01.005
Bilskie M. V., Hagen S. C., Alizad K., Medeiros S. C., Passeri D. L., Needham H. F., et al. (2016). Dynamic simulation and numerical analysis of hurricane storm surge under sea level rise with geomorphologic changes along the northern gulf of Mexico. Earth. Future 4 (5), 177–193. doi: 10.1002/2015EF000347
Booij N. R. R. C., Ris R. C., Holthuijsen L. H. (1999). A third-generation wave model for coastal regions: 1. model description and validation. J. Geophys. Res.: Ocean. 104 (C4), 7649–7666. doi: 10.1029/98jc02622
Chen W. B., Liu W. C. (2016). Assessment of storm surge inundation and potential hazard maps for the southern coast of Taiwan. Natural Hazard. 82 (1), 591–616. doi: 10.1007/s11069-016-2199-y
Chu D., Zhang J., Wu Y., Jiao X., Qian S. (2019). Sensitivities of modelling storm surge to bottom friction, wind drag coefficient, and meteorological product in the East China Sea. Estuar. Coast. Shelf. Sci. 231, 106460. doi: 10.1016/j.ecss.2019.106460
Deb M., Ferreira C. M. (2017). Potential impacts of the sunderban mangrove degradation on future coastal flooding in Bangladesh. J. Hydro-Environ. Res. 17, 30–46. doi: 10.1016/j.jher.2016.11.005
Dietrich J. C., Zijlema M., Westerink J. J., Holthuijsen L. H., Dawson C., Luettich R. A. Jr., et al. (2011). Modeling hurricane waves and storm surge using integrally-coupled, scalable computations. Coast. Eng. 58 (1), 45–65. doi: 10.1016/j.coastaleng.2010.08.001
Du M., Hou Y., Guo Y., Wang K. (2020a). Numerical simulation and risk analysis of coastal inundation in land reclamation areas: A case study of the pearl river estuary. J. Ocean. Univ. China 19 (6), 1221–1234. doi: 10.1007/s11802-020-4426-0
Du M., Hou Y., Hu P., Wang K. (2020b). Effects of typhoon paths on storm surge and coastal inundation in the pearl river estuary, China. Remote Sens. 12 (11), 1851. doi: 10.3390/rs12111851
Fu C., Li T., Liu S., Gao Y., Dong J. (2021). Characteristics of the storm surge and UAV disaster investigation caused by the typhoon lekima (No.1909) in the bohai bay. Mar. Forecast. 38 (5), 17–23. doi: 10.11737/j.issn.1003-0239.2021.05.003
Garratt J. R. (1977). Review of drag coefficients over oceans and continents. Month. Weath. Rev. 105 (7), 915–929. doi: 10.1175/1520-0493(1977)105<0915:RODCOO>2.0.CO;2
Gayathri R., Murty P. L. N., Bhaskaran P. K., Srinivasa Kumar T. (2016). A numerical study of hypothetical storm surge and coastal inundation for AILA cyclone in the bay of Bengal. Environ. Flui. Mechan. 16 (2), 429–452. doi: 10.1007/s10652-015-9434-z
Gramcianinov C. B., Campos R. M., de Camargo R., Hodges K. I., Soares C. G., da Silva Dias P. L. (2020). Analysis of Atlantic extratropical storm tracks characteristics in 41 years of ERA5 and CFSR/CFSv2 databases. Ocean. Eng. 216, 108111. doi: 10.1016/j.oceaneng.2020.108111
Hersbach H., Bell B., Berrisford P., Biavati G., Horányi A., Muñoz Sabater J., et al. (2018)ERA5 hourly data on single levels from 1959 to present. In: Copernicus Climate change service (C3S) climate data store (CDS) (Accessed 07-09-2021).
Hersbach H., Bell B., Berrisford P., Hirahara S., Horányi A., Muñoz-Sabater J., et al. (2020). The ERA5 global reanalysis. Q. J. R. Meteorol. Soc. 146 (730), 1999–2049. doi: 10.1002/qj.3803
Höffken J., Vafeidis A. T., MacPherson L. R., Dangendorf S. (2020). Effects of the temporal variability of storm surges on coastal flooding. Front. Mar. Sci. 7, 98. doi: 10.3389/fmars.2020.00098
Hsiao S. C., Chen H., Chen W. B., Chang C. H., Lin L. Y. (2019). Quantifying the contribution of nonlinear interactions to storm tide simulations during a super typhoon event. Ocean. Eng. 194, 106661. doi: 10.1016/j.oceaneng.2019.106661
Hubbert G. D., Mclnnes K. L. (1999). A storm surge inundation model for coastal planning and impact studies. J. Coast. Res. 15 (1), 168–185. doi: 10.2307/4298925
Kress M. E., Benimoff A. I., Fritz W. J., Thatcher C. A., Blanton B. O., Dzedzits E. (2016). Modeling and simulation of storm surge on Staten island to understand inundation mitigation strategies. J. Coast. Res. 76 (10076), 149–161. doi: 10.2112/si76-013
Krien Y., Testut L., Islam A. K. M. S., Bertin X., Durand F., Mayet C., et al. (2017). Towards improved storm surge models in the northern bay of Bengal. Continent. Shelf. Res. 135, 58–73. doi: 10.1016/j.csr.2017.01.014
Kumbier K., Carvalho R. C., Vafeidis A. T., Woodroffe C. D. (2018). Investigating compound flooding in an estuary using hydrodynamic modelling: a case study from the shoalhaven river, Australia. Natural Hazard. Earth Syst Sci. 18 (2), 463–477. doi: 10.5194/nhess-18-463-2018
Li P., Cao C., Ruan C., Gao S., Li J., Liu G., et al. (2019). Storm surge and disaster in bohai Sea (Beingjing: China Ocean Press (in Chinese).
Li Z., Li S., Hou Y., Mo D., Li J., Yin B. (2022b). Typhoon-induced wind waves in the northern East China Sea during two typhoon events: the impact of wind field and wave-current interaction. J. Oceanol. Limnol. 40 (3), 934–49. doi: 10.1007/s00343-021-1089-7
Li J., Mo D., Li R., Hou Y., Liu Q. (2022a). Establishing a risk assessment framework for marine assets and assessing typhoon lekima storm surge for the laizhou bay coastal area of the bohai Sea, China. J. Mar. Sci. Eng. 10 (2), 298. doi: 10.3390/jmse10020298
Li Y., Tian L., Pei Y., Wang F., Wang H. (2016). Numerical simulation of storm surge inundation in the west zone of bohai bay. Geol. Bull. China 35 (10), 1638–1645.
Liu Q., Ruan C., Zhong S., Li J., Yin Z., Lian X. (2018). Risk assessment of storm surge disaster based on numerical models and remote sensing. Int. J. Appl. Earth Observat. Geoinform. 68, 20–30. doi: 10.1016/j.jag.2018.01.016
Li S., Zou Z., Zhao D., Hou Y. (2020). On the wave state dependence of the sea surface roughness at moderate wind speeds under mixed wave conditions. J. Phys. Oceanogr. 50 (11), 3295–3307. doi: 10.1175/JPO-D-20-0102.1
Longuet-Higgins M. S., Stewart R. W. (1964). Radiation stresses in water waves; a physical discussion, with applications. Deep. Sea. Res. Oceanogr. Abstr. 11 (4), 529–562. doi: 10.1016/0011-7471(64)90001-4
Luettich R. A., Westerink J. J., Scheffner N. W. (1992). “ADCIRC: An advanced three-dimensional circulation model for shelves, coasts, and estuaries,” in Report 1, theory and methodology of ADCIRC-2DDI and ADCIRC-3DL, technical report DRP-92-6 (Vicksburg, MS: US Army Engineer Waterways Experiment Station).
Lu X., Yu H., Ying M., Zhao B., Zhang S., Lin L., et al. (2021). Western North pacific tropical cyclone database created by the china meteorological administration. Adv. Atmos. Sci. 38 (4), 690–699. doi: 10.1007/s00376-020-0211-7
Mao M., Xia M. (2017). Dynamics of wave–current–surge interactions in lake Michigan: A model comparison. Ocean. Model. 110, 1–20. doi: 10.1016/j.ocemod.2016.12.007
Miller M. M., Shirzaei M. (2021). Assessment of future flood hazards for southeastern Texas: Synthesizing subsidence, sea-level rise, and storm surge scenarios. Geophys. Res. Lett. 48 (8), e2021GL092544. doi: 10.1029/2021GL092544
Ministry of Natural Resources of the People’s Republic of China. (1989-2021) bulletin of China marine disaster. Available at: http://www.mnr.gov.cn/sj/sjfw/hy/gbgg/zghyzhgb/index.html (Accessed 10 January 2022).
Murty P. L. N., Rao A. D., Srinivas K. S., Rao E., Bhaskaran P. K. (2020). Effect of wave radiation stress in storm surge-induced inundation: a case study for the East coast of India. Pure. Appl. Geophys. 177 (6), 2993–3012. doi: 10.1007/s00024-019-02379-x
Musinguzi A., Akbar M. K., Fleming J. G., Hargrove S. K. (2019). Understanding hurricane storm surge generation and propagation using a forecasting model, forecast advisories and best track in a wind model, and observed data–case study hurricane Rita. J. Mar. Sci. Eng. 7 (3), 77. doi: 10.3390/jmse7030077
Pan Z. H., Liu H. (2019). Extreme storm surge induced coastal inundation in Yangtze estuary regions. J. Hydrodyn. 31 (6), 1127–1138. doi: 10.1007/s42241-019-0086-1
Peng M., Xie L., Pietrafesa L. J. (2004). A numerical study of storm surge and inundation in the croatan–Albemarle–Pamlico estuary system. Estuar. Coast. Shelf. Sci. 59 (1), 121–137. doi: 10.1016/j.ecss.2003.07.010
Peng M., Xie L., Pietrafesa L. J. (2006). A numerical study on hurricane-induced storm surge and inundation in Charleston harbor, south Carolina. J. Geophys. Res.: Ocean. 111, C08017. doi: 10.1029/2004jc002755
Pineau-Guillou L., Bouin M. N., Ardhuin F., Lyard F., Bidlot J. R., Chapron B. (2020). Impact of wave-dependent stress on storm surge simulations in the north Sea: Ocean model evaluation against in situ and satellite observations. Ocean. Model. 154, 101694. doi: 10.1016/j.ocemod.2020.101694
Rego J. L., Li C. (2009). On the importance of the forward speed of hurricanes in storm surge forecasting: A numerical study. Geophys. Res. Lett. 36, L07609. doi: 10.1029/2008GL036953
Saha S., Moorthi S., Pan H., Wu X., Wang J., Nadiga S., et al. (2010a). The NCEP climate forecast system reanalysis. Bull. Am. Meteorol. Soc. 91, 1015–1058. doi: 10.1175/2010BAMS3001.1
Saha S., Moorthi S., Pan H., Wu X., Wang J., Nadiga S., et al. (2010b) NCEP climate forecast system reanalysis (CFSR) selected hourly time-series products, January 1979 to December 2010 (Research Data Archive at the National Center for Atmospheric Research, Computational and Information Systems Laboratory) (Accessed 17 September 2021).
Saha S., Moorthi S., Wu X., Wang J., Nadiga S., Tripp P., et al. (2011) NCEP climate forecast system version 2 (CFSv2) selected hourly time-series products (Research Data Archive at the National Center for Atmospheric Research, Computational and Information Systems Laboratory) (Accessed 17 September 2021).
Saha S., Moorthi S., Wu X., Wang J., Nadiga S., Tripp P., et al. (2014). The NCEP climate forecast system version 2. J. Climat. 27, 2185–2208. doi: 10.1175/JCLI-D-12-00823.1
Sahoo B., Bhaskaran P. K. (2018). A comprehensive data set for tropical cyclone storm surge-induced inundation for the east coast of India. Int. J. Climatol. 38 (1), 403–419. doi: 10.1002/joc.5184
Sheng Y. P., Alymov V., Paramygin V. A. (2010). Simulation of storm surge, wave, currents, and inundation in the outer banks and Chesapeake bay during hurricane Isabel in 2003: The importance of waves. J. Geophys. Res.: Ocean. 115, C04008. doi: 10.1029/2009jc005402
Shi X., Chen B., Liang Y., Zhang B., Ye T. (2021). Inundation simulation of different return periods of storm surge based on a numerical model and observational data. Stochast. Environ. Res. Risk Assess. 35 (10), 2093–2103. doi: 10.1007/s00477-021-02010-3
Shim J. S., Kim J., Kim D. C., Heo K., Do K., Park S. J. (2013). Storm surge inundation simulations comparing three-dimensional with two-dimensional models based on typhoon maemi over masan bay of south Korea. J. Coast. Res. 65 (10065), 392–397. doi: 10.2112/si65-067.1
Shi X., Yu P., Guo Z., Sun Z., Chen F., Wu X., et al. (2020). Simulation of storm surge inundation under different typhoon intensity scenarios: case study of pingyang county, China. Natural Hazard. Earth Syst Sci. 20 (10), 2777–2790. doi: 10.5194/nhess-20-2777-2020
Stopa J. E., Cheung K. F. (2014). Intercomparison of wind and wave data from the ECMWF reanalysis interim and the NCEP climate forecast system reanalysis. Ocean. Model. 75, 65–83. doi: 10.1016/j.ocemod.2013.12.006
Suh S. W., Kim H. J. (2018). Simulation of wave overtopping and inundation over a dike caused by typhoon chaba at marine city, busan, Korea. J. Coast. Res. 85 (10085), 711–715. doi: 10.2112/SI85-143.1
Takagaki N., Komori S., Suzuki N., Iwano K., Kuramoto T., Shimada S., et al. (2012). Strong correlation between the drag coefficient and the shape of the wind sea spectrum over a broad range of wind speeds. Geophys. Res. Lett. 39, L23604. doi: 10.1029/2012gl053988
Veeramony J., Condon A., van Ormondt M. (2017). Forecasting storm surge and inundation: model validation. Weath. Forecast. 32 (6), 2045–2063. doi: 10.1175/WAF-D-17-0015.1
Wang Y., Gao T., Han Z., Liu Q. (2017). Impacts of wind-field correction on the numerical simulation of storm-surge inundation during typhoon “Rammasun”. Estuar. Coast. Shelf. Sci. 196, 198–206. doi: 10.1016/j.ecss.2017.07.006
Wang K., Hou Y., Li S., Du M., Li R. (2020). Numerical study of storm surge inundation in the southwestern hangzhou bay region during typhoon chan-hom in 2015. J. Ocean. Univ. China 19 (2), 263–271. doi: 10.1007/s11802-020-4258-y
Wang X., Li H., Luo X., Jiao J., Qu W., Wang C. (2016). Using 224Ra to estimate eddy diffusivity and submarine groundwater discharge in laizhou bay, China. J. Radioanalytic. Nucl. Chem. 308 (2), 403–411. doi: 10.1007/s10967-015-4495-5
Wang H. V., Loftis J. D., Liu Z., Forrest D., Zhang J. (2014). The storm surge and sub-grid inundation modeling in new York city during hurricane sandy. J. Mar. Sci. Eng. 2 (1), 226–246. doi: 10.3390/jmse2010226
Wang S., Mu L., Yao Z., Gao J., Zhao E., Wang L. (2021). Assessing and zoning of typhoon storm surge risk with a geographic information system (GIS) technique: a case study of the coastal area of huizhou. Natural Hazard. Earth Syst Sci. 21 (1), 439–462. doi: 10.5194/nhess-21-439-2021
Wu G., Shi F., Kirby J. T., Liang B., Shi J. (2018). Modeling wave effects on storm surge and coastal inundation. Coast. Eng. 140, 371–382. doi: 10.1016/j.coastaleng.2018.08.011
Xia M., Xie L., Pietrafesa L. J., Peng M. (2008). A numerical study of storm surge in the cape fear river estuary and adjacent coast. J. Coast. Res. 24 (10024), 159–167. doi: 10.2112/06-0795.1
Xie L., Liu H., Peng M. (2008). The effect of wave–current interactions on the storm surge and inundation in Charleston harbor during hurricane Hugo 1989. Ocean. Model. 20 (3), 252–269. doi: 10.1016/j.ocemod.2007.10.001
Xie L., Pietrafesa L. J., Peng M. (2004). Incorporation of a mass-conserving inundation scheme into a three dimensional storm surge model. J. Coast. Res. 20 (4), 1209–1223. doi: 10.2112/03-0084R.1
Xie L., Pietrafesa L. J., Wu K. (2003). A numerical study of wave-current interaction through surface and bottom stresses: Coastal ocean response to hurricane Fran of 1996. J. Geophys. Res.: Ocean. 108 (C2), 3049. doi: 10.1029/2001JC001078
Xu Y., Gao H., Wei X., Zhu J. (2021). The effects of reclamation activity and yellow river runoff on coastline and area of the laizhou bay, China. J. Ocean. Univ. China 20 (3), 729–739. doi: 10.1007/s11802-021-4746-8
Yang J., Li L., Zhao K., Wang P., Wang D., Sou I. M., et al. (2019). A comparative study of typhoon hato, (2017) and typhoon mangkhut, (2018)–their impacts on coastal inundation in Macau. J. Geophys. Res.: Ocean. 124 (12), 9590–9619. doi: 10.1029/2019jc015249
Ying M., Zhang W., Yu H., Lu X., Feng J., Fan Y., et al. (2014). An overview of the China meteorological administration tropical cyclone database. J. Atmos. Ocean. Technol. 31 (2), 287–301. doi: 10.1175/jtech-d-12-00119.1
Yin J., Lin N., Yu D. (2016). Coupled modeling of storm surge and coastal inundation: A case study in new York city during hurricane sandy. Water Resour. Res. 52 (11), 8685–8699. doi: 10.1002/2016WR019102
Keywords: storm surge, inundation, wind field, wave-induced radiation stress, wave-induced surface stress, Laizhou Bay
Citation: Li Z, Li S, Hu P, Mo D, Li J, Du M, Yan J, Hou Y and Yin B (2022) Numerical study of storm surge-induced coastal inundation in Laizhou Bay, China. Front. Mar. Sci. 9:952406. doi: 10.3389/fmars.2022.952406
Received: 25 May 2022; Accepted: 11 July 2022;
Published: 09 August 2022.
Edited by:
Xiaohui Xie, Ministry of Natural Resources, ChinaReviewed by:
Peng Cheng, Xiamen University, ChinaCopyright © 2022 Li, Li, Hu, Mo, Li, Du, Yan, Hou and Yin. This is an open-access article distributed under the terms of the Creative Commons Attribution License (CC BY). The use, distribution or reproduction in other forums is permitted, provided the original author(s) and the copyright owner(s) are credited and that the original publication in this journal is cited, in accordance with accepted academic practice. No use, distribution or reproduction is permitted which does not comply with these terms.
*Correspondence: Shuiqing Li, bGlzaHVpcWluZ0BxZGlvLmFjLmNu; Baoshu Yin, YnN5aW5AcWRpby5hYy5jbg==
Disclaimer: All claims expressed in this article are solely those of the authors and do not necessarily represent those of their affiliated organizations, or those of the publisher, the editors and the reviewers. Any product that may be evaluated in this article or claim that may be made by its manufacturer is not guaranteed or endorsed by the publisher.
Research integrity at Frontiers
Learn more about the work of our research integrity team to safeguard the quality of each article we publish.